storli - a brief presentation
TRANSCRIPT

Key figures/Financial ratios
Storli - A brief presentation
Highlights
The Board of Directors' Report
Profit and Loss Statement
Balance Sheet
Cash Flow Statement
Accounting Principles
Auditor's Report
Analytical Information
Shareholder Information
Corporate Structure
Operating Philosophy and Safety
World Wide Services
The Chemical Tanker Market
Tank Terminals
Fleet Overview
Glossary
Addresses
2335
111214152223242628303234373839
CONTENTS
FINANCIAL CALENDAR
25 April 1996 Annual General Meeting13 June 1996 Report for the first four months of 199618 October 1996 Report for the first eight months of 1996Mid February 1997 Preliminary results of 1996
The Annual General Meeting will be held at the company'soffice, Conrad Mohrs veg 29, 5032 Minde, Norway onThursday 25 April 1996, at 3.00 p.m. Shareholders wishingto attend the Annual General Meeting should notify the company by Wednesday 17 April 1996, according to § 4 inthe Articles of Association.

2
KEY FIGURES/FINANCIAL RATIOS
Baytank (Houston) Inc. was not consolidated in 1989. Historical figures per share is adjusted for bonus issue 1:1 in 1994.* - Figures prior to 1991: Book equity plus 72% of equity with deferred tax liability.1. Net profit before taxes less minority interest divided by number of shares per 31.12.1995.2. Net profit before taxes less minority interest less profit from sale of assets divided by number of shares per 31.12.1995.3. Net profit before taxes plus depreciation less minority interest divided by number of shares per 31.12.1995.4. Net profit before taxes plus depreciation less minority interest less profit from sale of assets divided by number of shares per 31.12.1995.5. Net profit before taxes plus financial expenses divided by average balance of total assets.6. Net profit before taxes divided by average book equity and minority interest.7. Net profit before taxes plus depreciation less minority interest.8. Net profit before taxes plus depreciation less minority interest less profit from sale of assets.9. Interest-bearing debt less bank deposits and securities, divided by net cash flow (8).10. Current assets divided by current liabilities.11. Book equity plus minority interest divided by total assets.
STORLI GROUP Amount in 1995 1994 1993 1992 1991 1990 1989
From Profit and Loss Statement
Operating result NOK mill. 465 259 91 88 321 336 237
Depreciation NOK mill. - 205 -284 -283 -274 -247 -230 -149
Profits from sale of assets NOK mill. 0 0 0 0 56 121 119
Net financial items NOK mill. - 71 -37 -140 -28 -96 -148 -105
Net profit before taxes NOK mill. 394 221 -49 60 225 188 131
From Balance Sheet
Current assets NOK mill. 1 434 1 245 1 181 1 187 951 894 754
Vessels and other fixed assets NOK mill. 3 599 3 162 3 157 3 028 2 824 2 704 1 967
Total assets NOK mill. 5 033 4 407 4 337 4 215 3 774 3 597 2 722
Current liabilities NOK mill. 321 210 225 191 175 240 230
Long term liabilities NOK mill. 3 157 2 893 2 943 2 782 2 385 2 439 1 481
Shareholders' equity * NOK mill. 1 555 1 304 1 169 1 242 1 214 918 1 011
Total liabilities and shareholders' equity NOK mill. 5 033 4 407 4 337 4 215 3 774 3 597 2 722
Profitability
Earnings per share incl. profit from sale of assets (1) NOK 17.94 10.03 -2.34 2.66 10.18 8.25 6.01
Earnings per share excl. profit from sale of assets (2) NOK 17.94 10.03 -2.34 2.66 7.60 2.70 0.56
Cash flow per share incl. profit from sale of assets (3) NOK 27.31 23.03 10.63 15.19 21.49 18.76 12.85
Cash flow per share excl. profit from sale of assets (4) NOK 27.31 23.03 10.63 15.19 18.91 13.21 7.40
Return on total assets (5) % 12.4% 8.0% 2.6% 5.3% 11.1% 12.9% 11.3%
Return on equity (6) % 27.6% 17.9% -4.1% 4.9% 18.1% 17.2% 13.6%
Financial Ratios
Average number of shares mill. 21.85 18.32 10.92 10.92 10.92 10.92 9.59
Net cash flow incl. profit from sale of assets (7) NOK mill. 597 503 232 332 470 410 281
Net cash flow excl. profit from sale of assets (8) NOK mill. 597 503 232 332 413 289 162
Interest-bearing debt NOK mill. 2 734 2 564 2 673 2 499 1 947 1 797 1 375
Bank deposits and securities NOK mill. 1 275 1 066 1 237 1 153 891 794 638
Debt repayment capability (9) 2.5 3.0 6.2 4.1 2.6 3.5 4.6
Current ratio (10) 4.5 6.0 5.3 6.2 5.5 3.7 3.3
Equity ratio (11) % 31% 30% 27% 29% 32% 26% 37%

3
Storli is a major world-wide carrier of all typesof chemicals. Storli’s strategy is focused on ownership and management of chemical tan-kers and chemical tank terminals.
Storli is a fully integrated shipping company,handling all related functions, such as shipmanagement, operation and chartering. Thecompany is one of the four leading players inthe world-wide parcel tanker trade. Throughits wholly owned subsidiary, Odfjell Tankers,the company operates a fleet of 47 chemicaltankers, aggregating approx. 1.5 million dwt.Storli is the owner of 28 of these vessels. Thefleet operates in world-wide trade, and is com-mitted to the long-term shipping require-ments of the petrochemical industry throughContracts of Affreightment with many of theworld's chemical giants.
Storli’s tank terminal Baytank in Houston andthe newly established terminals at Ningbo andDalian in the People’s Republic of China, hasincreasingly become an integrated part ofStorli’s operations.
Storli’s in-house Ship Management depart-ment is dedicated to meeting the customers’stringent requirements as to quality. The ves-sels are operated by Norwegian senior officerswith foreign crew.
Storli, founded in 1916 as a family business,went public in 1985 and obtained a listing onthe Oslo Stock Exchange the following year.Since the company was founded, operationshave been governed by high standards as toquality and safety, often in excess of what hasbeen required by national and internationalregulations.
STORLI - A BRIEF PRESENTATION
HIGHLIGHTS
Improvements in the rates and volumesthroughout the year.
Net pre-tax profit of NOK 394.4 mill. Netcashflow of NOK 596.7 mill.
Earnings before tax per share of NOK 17.94and cashflow before tax per share of NOK27.31.
Delivery of M/T “BOW CLIPPER” from KværnerGovan, Scotland and M/T “BOW FAGUS” fromKværner Florø, Norway.
Ordering of two advanced chemical tankers,each of 37,250 dwt. at Kværner Florø for de-livery in 1998 with an option for two furthervessels for delivery in 1999.
Increased tank terminal activities throughapproved expansions at Baytank, USA andNingbo, China as well as construction of anew terminal in Dalian, China.
0
100
200
300
400
500
600
0
20
40
60
80
100
120
95949392919089
NOK mill.
USD mill.
-50
0
50
100
150
200
250
300
350
400
-10
0
10
20
30
40
50
60
70
80
95949392919089
NOK mill.
USD mill.
Net profit
Net cash flow


5
1995 was a good year for Storli. Earnings were sub-stantially up following a continuation of last year'spositive trend in the chemical tanker market.Whereas the profit increase in 1994 primarily wasbased on volume, the 1995 improvements are basedon higher rates as well.
1995 has been a special yearin that our fleet increasedby six ships, five of whichare newbuildings. At year-end Storli operated a fleetof approx. 1.5 mill. dwt.This is a 17 per cent increa-se over the same period lastyear. Consequently, we alsoincreased our market shareduring 1995.
In 1995 we strengthenedour involvement in tankterminals through the ex-
pansion of Baytank and Ningbo, China, facilities.Furthermore, we will participate in the constructionof a new terminal in Dalian, North China.
Storli's group pre-tax profit came to NOK 394.4 mill.compared to NOK 221.5 mill. in 1994. The extensi-on of the depreciation period for ships has improvedthe profit by NOK 99.6 mill. The operating profitincreased to NOK 465.4 mill from NOK 258.8mill. in 1994. T/C earnings rose by 22 per cent
compared with the previousyear. Storli's cash position isfavourable. Cash and liquidinstruments amount to atotal of NOK 1,207.8 mill.,which corresponds to 47per cent of the outstandinginterest-bearing debt. Bookequity at year end amoun-ted to NOK 1,555 mill, re-presenting an increase ofNOK 250.8 mill. over theprevious year. Storli appearsto be favourably positionedfor the years to come.
WORLD ECONOMY AND THE CHEMICAL MARKET
The OECD countries experienced a somewhat slo-wer growth in 1995 than the year before. Thegrowth was 2.4 per cent compared with 2.9 per centin 1994. This is slightly be-low the average growth forthe last 10 years. Industrialproduction was up by 3.7 percent compared to 3.4 per centin 1994.
Economic growth of the new-ly industrialised countries inthe Far East, and China inparticular, has become impor-tant to the shipping industry,and perhaps particularly so tothe chemical tanker industry.In these countries, GNPgrowth was between 6 and 10per cent in 1995, which is approximately the same levelas the year before. Growth inindustrial production in 1995also remained at last year's level of approx. 7 per cent.
As 1996 commenced, the economies within theOECD countries, as well as those of the newly in-dustrialised Far East countries, were characterisedby steady growth, which in turn should have a posi-tive effect on demand for maritime freight services.
In terms of physical volume, the increase in worldseaborne trade for 1995 is estimated at 3.8 per cent,which is identical to the 1994 level.
CHEMICAL TANKER MARKET
The chemical tanker trade is becoming increasinglyglobal. The large American and European producersare establishing themselves internationally, while atthe same time increasing their domestic productioncapacity. Demand for transportation of chemicals islargely determined by the stage of development ofnational economies. The growth in both GNP andindustrial production has caused an increase in do-
THE BOARD OF DIRECTORS' REPORT
The two new spherical tanks at Baytank, Houston, USA.
0
1
2
3
4
5
6
7
8
959493929190898887868584
Growth of real GNP
Dynamic Asian EconomicsOECD Area
Source: OECD0
100
200
300
400
500
95949392919089
Operating Result
0
500
1000
1500
2000
95949392919089
Shareholders’ EquityNOKmill.
NOKmill.

6
mestic consumption as well as in the transport ofchemicals, and, consequently, both volumes and rates were up in 1995.
Storli's vessels are engaged in world-wide trade, andthe upswing in activity in 1995 is reflected in all geographical areas. The greatest increase in volumewas in exports from the main production areas ofthe US, Europe and the Middle East to countries inthe Far East.
The fleet of dedicated chemical tankers over 10,000dwt increased by 4 per cent in 1995. Scrapping wasinsignificant, and additional tonnage was ordered,amounting to 1,085,000 dwt at year-end. However,the lead time for delivery of chemical tankers islong, and the fleet additions will therefore be spreadevenly over the next few years. Assuming ships arescrapped when they are 25 years old, the annual netadditions will amount to 4 per cent over the nextthree years.
A number of advanced product tankers for easy che-micals have also been ordered. These are expected tohave a limited effect on our market.
The structure of the chemical tanker market is basi-cally unchanged since 1994, with the four largestoperators controlling about 70 per cent of the fleet(above 10.000 dwt in size). Storli is satisfactorily es-tablished within the industry, with an approximatemarket share of 22 per cent. All of our main compe-titors are based abroad.
OPERATIONS
At year-end 1995, Storli operated a fleet of 47 ships.During the year we increased our average capacityby 15 per cent. We transported a total of 9.9 mill.tons of cargo, spread over 4,500 parcels and servi-ced more than 400 customers with over 450 diffe-rent types of cargo. Furthermore, we made 2,275port calls, and passed through the Suez and Panamacanals a total of 204 times.
Our industry is becoming increasingly complex,with rising requirements from customers and autho-rities. Our results are determined by our own effici-ency and fleet utilisation as well as by volumes andrates. T/C earnings are therefore composed of rates,volumes, logistics, and efficiency.
Bunker prices were high throughout 1995, varyingbetween USD 76 and USD 113.5 per ton. The ave-rage price was approx. USD 96 per ton.
We currently operate 11 ships for NationalChemical Carriers (NCC), our pool partner. Storliis entrusted with the marketing, operation, techni-cal upkeep and staffing of these ships. NCC willcontribute one further newbuilding in 1996. Theships are operated in individual pools, consisting ofsimilar ship types. Each ship receives its relative sha-re of pool earnings, based on the actual number ofdays on hire.
During the year, Storli acquired 50 per cent of theproperty at Conrad Mohrs veg 29 from BergensSkillingsbank. These premises are the company'sheadquarters, and Storli is now the sole owner.
0
30
60
90
120
150
95 94 93 92 91 90 89 88 87 86 85 84 83 82 81 80 79 78 77
Freight Rates - 3000 tons easy grade chemicals
0
30
60
90
120
150
95 94 93 92 91 90 89 88 87 86
Freight Rates - 1000 tons stainless steel grade chemicals
Source: Quincannon
Houston/Rotterdam
Houston/Far East
USD/Tons
USD/Tons

7
FLEET
Two newbuildings were delivered to Storli in 1995("BOW CLIPPER" 7/95 and "BOW FAGUS"11/95), and two further ships were delivered toNCC ("NCC RIYAD" 1/95 and "NCC MEKKA"5/95). The vessels have performed excellently andhave helped to strengthen our position in a growingmarket. All ships are of 37,250 dwt and have cargotanks of homogenous, acid-resistant steel, with a total of 52 segregations each.
In December 1995 we ordered two further sister-vessels from Kværner Florøfor delivery in May andNovember 1998. At thesame time we secured anoption on two additionalsister-vessels for delivery in1999.
The series of sister-vessels has now reached a total of11. The remaining Kværner Florø programme consists of the following deliveries:
Yard no. Owner Est. delivery132 Storli April 1996133 NCC November 1996134 Storli May 1997135 Storli November 1997136 Storli May 1998137 Storli November 1998
During 1995 we bought "BOW EXPLORER"(31,500/75), which was previously time chartered.She underwent extensive repairs and upgrading in1995, and consequently increased the number of off-hire days. The vessel now operates to a high standard.
We time chartered the newly built "BOW TRIBU-TE", a coated chemical tanker of 40,000 dwt., deli-vered from Japan in December 1995. In addition,we time chartered the 31,500 dwt. "LADY INA",built in 1975, which we had also time charteredpreviously. Throughout the year a small number ofvessels were chartered on a voyage basis. The two16,000 dwt. chemical tankers currently being builtfor Blue Flag Navigation have been further delayed.The ships will probably be delivered to Storli fortime charter during 1997.
During the year we docked 12 ships, which is 2more than average. The extent to which ships aredocked is largely dictated by the authorities andcustomers' increasing demands for higher quality.Altogether, the fleet was offhire 517 days in 1995,compared to 496 days in 1994.
TANK TERMINAL ACTIVITIES
For a large and global business there are synergiesbetween the operation of ships and the operation ofterminals. This is particularly the case in newly in-dustrialised countries where the infrastructure is of-ten inadequate. Investment in tank terminals in the-se areas provides an opportunity to enter the marketat an early point. In addition, such investments willproduce increased transport volumes, which in turnwill have an impact on the utilisation and profitabi-lity of the vessels. Customers will also experience aconsiderable synergy.
Baytank - Houston, USAThe upswing of recent years continued in 1995, re-sulting in a profit of USD 2.9 mill., compared toUSD 1.3 mill. in 1994. The profit increase in 1995is primarily due to better utilisation of tank capaci-ty. Moreover, terminal earnings were boosted by thestart-up of two specially constructed spherical tanksfor storing acetaldehyde. The tanks have been leasedon a 10-year contract basis to PMI Trading Ltd.,which is a subsidiary of the Mexican state oil com-pany PEMEX.
Baytank has a total capacity of 171.000 cbm. Thiswill increase by approx. 27,000 cbm in 1996 as a re-sult of the building of six new tanks. The additionalcapacity will be operative in the autumn of 1996.
VOTTN - Ningbo, China1995 was the first full year of operation, and thecompany already has largely succeeded in establish-ing itself as a terminal of high standards. Ningbo isdeveloping into an important chemicals transitpoint for the Shanghai area with total imports ofapprox. 420,000 tons in 1995.
Storli's share of the profit for 1995 was a satisfyingUSD 330,000. The positive result was achieved onaccount of extensive demand for storage capacity.However, the demand subsided somewhat towardsthe end of the year. It has been decided that the
Fleet distribution
Storli-owned vessels60%
Vessels on pool-basis21%
Chartered vessels19%
8
terminal capacity should be increased from 24,400cbm to 65,450 cbm. Completion of this expansionis planned for 1997. In 1995 Storli increased its stake in the terminal from 10 to 12.5 per cent.
DMTTC - Dalian, ChinaIn order to participate in the anticipated growth inChina, the company decided to invest in yet anot-her Chinese terminal - at Dalian in the northernpart of the country. In the future, Dalian will beco-me an important point of consolidation for ourshipping activities in the Far East.
The Chinese authorities have selected Dalian as oneof four main harbours to benefit from considerableinvestment in the infrastructure. Its favourable geo-graphical location means the terminal will be a ser-vice centre for distribution in northern and mid-China, as well as an important point of transit in agrowing Intra Far East market.
In its first stage the terminal will have a capacity ofapprox. 60,000 cbm in 35 tanks. The terminal willbe named Dalian Marine Tank Terminal Company.Total investments for the first stage of constructionwill be around USD 30 mill.
The terminal will be built in compliance with strictquality and environmental requirements with dueregard to safety and efficiency. With our 44 per centstake, Storli is the main shareholder, and will be re-sponsible for the terminal's development, technolo-gy and operation. In addition to Storli, the otherparticipants in this project will be Dalian PortAuthority, Mitsui & Co. Ltd. and Van Ommeren.
It is planned that the terminal will start operating in1997.
OPERATIONS/SAFETY/ENVIRONMENT
Storli wishes to maintain a stable long-term policyof operations. Our objective is to offer high qualityservice at all stages so that we may satisfy our custo-mers' need for the safe and efficient transport ofchemicals. In addition, we have to comply with in-creasingly stricter national and international regula-tions. This requires high standards within the areasof manning, technology and organisational admi-nistration.
Our maintenance policy is based on a regular long-term preventative maintenance programme. Ourvessels are normally docked every 30 months, andmaintenance work is also carried out continuouslywhile at sea.
In order to further develop our overall quality, wehave established a quality programme which inclu-des organisational matters. In February 1994 we ob-tained accreditation of quality from Det norskeVeritas. This process was continued in 1995 and inthe course of 1996 all our ships will be certified.The quality programme covers SEP (Safety andEnvironmental Protection) as well as compliancewith ISO 9002. The handling of nonconformists isa central element in the programme. Through SAFIR(Safety and Improvement Reporting) we identify thenonconformists, determine the cause, and imple-ment corrective measures. The Quality programmeis an excellent device which contributes to the im-provement and further development of our overallefficiency and profitability.
In November 1993, following increased internatio-nal focus on safety at sea, a new international quali-ty standard was formulated through IMO. Thestandard was called "The ISM Code - InternationalSafety Management Code" and was incorporated inSOLAS (Safety of Life at Sea), chapter 9. All vesselsabove 500 grt are required to meet the new standardby 1 July 1998. Storli already complies with thisstandard.
Storli is keenly aware of environmental issues, andthe prevention and containment of pollution at seais a major concern. There were no accidents havingany significant environmental impact this year.
Storli is in favour of increased quality control bothby customers and government authorities. Our cus-tomers regularly carry out extensive inspections ofour ships, routines and systems. We believe thatover time this will give us a competitive edge.
ORGANISATION
Storli attaches great importance to a personnel poli-cy which ensures that we have qualified staff ashoreas well as aboard our ships at all times. The ships arechiefly manned with Norwegian officers with longexperience in operating chemical tankers. When hi-

9
ring our Philippine crews, we put great emphasis oncontinuity and experience.
We have a long-term mariner staffing policy, andbecause we consider recruiting to be essential weoperate an extensive training program for trainee of-ficers and cadets. Furthermore, we attach great im-portance to on-board training and the running ofrelevant courses.
At year end Group employees totalled 1550 individuals.
FINANCES
ResultIn 1995 the group achieved a pre-tax profit ofNOK 394.4 mill, compared to a profit of NOK221.5 mill. in 1994. This result includes foreigncurrency net gains amounting to NOK 30.5 mill.,compared with NOK 39.4 mill in 1994.
The level of rates achieved as expressed in USD, isapprox. 22 per cent higher than the previous year.Operating expenses expressed in NOK for compara-ble tonnage increased by 3 per cent compared with1994. A total of 12 ships were docked during the year.
Accounting standardsIn accordance with international accounting stan-dards and the principles stipulated in the proposednew Norwegian Accounting Act, the company hasdecided to enter the first year's instalments underlong-term debt, and to use the current exchangerate for all foreign currency amounts. Comparedwith the accounting standard used in 1994 thesechanges represent a NOK 54 mill. increase in for-eign currency gains.
In view of the expected useful life of the company'sspecialised chemical tankers, and in line with thestandard practice within the industry, the period ofdepreciation has been changed from 20 years to 25years. This increased the 1995 profit by NOK 99.6mill.
Foreign currencyThe profit and loss accounts and balance sheet areinfluenced by the USD/NOK exchange rate. In1995 the average exchange rate was NOK 6.34,which is approx. 10 per cent down from 7.05 in
1994. This negatively impacted the operating profitby about NOK 97 mill.
The company's current assets and debt are expres-sed in USD. In 1995 the USD exchange rate fellfrom NOK 6.76 to NOK 6.32 at year-end. Thischange gave rise to foreign currency gains of NOK87.5 mill. on the company's long-term debt. Forthe same reason, a foreign currency loss of NOK57.5 mill. arose on the company's net current assets.Additionally, currency gains of NOK 0.5 mill. wererealised on forward contracts entered into in orderto secure the company's operating expenses.
All of Storli's revenues are in USD. Ship values aresimilarly stipulated in USD. Consequently, it isStorli's policy to use the USD as its principal curren-cy, and to reduce all other foreign currency exposure.
LiquidityThe company's liquid reserves have increased fur-ther in 1995, amounting to NOK 1,207.8 mill. atyear-end. This improvement is due to a positive netcash flow from operations, reduced partly by a lo-wer USD exchange rate at year-end. Payments rela-ted to investments amounted to NOK 627.8 mill.in 1995. Total outstanding debt has increased byNOK 375.3 mill., of which NOK 98.2 mill. is at-tributable to deferred taxes.
FinancingIn June 1995 the company took over a convertibleloan of NOK 25 mill. from company directors andexecutives. With a right of conversion in April1998, April 1999, and April 2000, at the rate ofNOK 125, NOK 130 and NOK 135 respectively.There were a total of 31 lenders.
Equity baseAt year-end the company had a total book equity ofNOK 1,555.0 mill. Because our fleet is made up ofspecialised ships with only a limited second-handmarket, we have adhered to our previous practice ofmaking no value adjustments of equity. However,the Board is of the opinion that the market value ofthe fleet significantly exceeds the book value.
Profit for the yearGroup pre-tax profit came to NOK 394.4 mill.After estimated deferred tax of NOK 105.1 mill. for
Completion of yard no. 132at Kværner Florø, Norway.
1995, the profit for the year amounted to NOK289.3 mill. The portion of profits attributable tominority interests was NOK 2.5 mill.
In 1995 the parent company had a profit of NOK258.1 mill, and a further NOK 1.5 mill. will comein the form of Group contributions. In line withthe company's shareholder policy, the Board propo-ses a dividend of NOK 2.- per share for approval atthe General Meeting, or the equivalent of NOK43.7 mill, compared to NOK 32.8 mill. the previ-ous year. The Board further recommends an alloca-tion of NOK 172.6 mill. towards free reserves andNOK 43.3 mill. towards statutory reserves.
MISCELLANEOUS
At year-end the company had 1,703 shareholders.The Chairman of the Board, along with companiesunder his control, owns 7,600,885 shares. No othershareholders own 20 per cent of the company ormore. Board members Terje Storeng, Jørgen Fayeand Per Gjærum own 3,168, 300 and 60 shares re-spectively. The Managing Director, along with acompany under his control, owns 29,800 shares.The Auditor owns no shares in the company.
Total remuneration to the Board of Directorsamounted to NOK 375,000 for 1994. TheManaging Director's 1995 salary was NOK1,426,979. The Auditor's fee for 1995 amounted toNOK 830,000, of which NOK 140,000 was for ad-visory services.
PROSPECTS
Storli's strategy is firmly based on world-leadershipin the transportation of chemicals.
1995 witnessed encouraging developments in themarket for chemical tankers, resulting in an impro-vement in the underlying balance of supply and de-mand, despite the fact that only an insignificantamount of tonnage was scrapped.
The positive demand in 1995 is expected to continuein 1996. The demand curve in the Far East appearssteeper than elsewhere.
The number of chemical tankers on order has incre-ased and now constitutes 16 per cent of the existingfleet. Newbuilding deliveries will be spread evenlyover the next few years. Provided scrapping is main-tained at a moderate level, we expect the equationbetween supply and demand to remain virtuallyunchanged in 1996. In the long term, this balancewill depend on the extent to which tonnage isscrapped and demand is maintained. Stricter qualityrequirements from customers and government aut-horities may also have a greater impact in this re-spect.
Storli's newbuilding programme is well adapted tomarket developments, and both the portfolio andcharacter of our fleet, as well as the quality of ourpersonnel are satisfactory.
The Board expects a favourable result also in 1996.
10
Bjarte Kvåle
Bergen 31 December 199523 February 1996
Terje Storeng
Per Ivar Gjærum
Jørgen FayeB.D. Odfjell jr.Chairman of the Board
Bjørn SjaastadManaging Director
The Board of Directors ofSkibsaksjeselskapet Storli
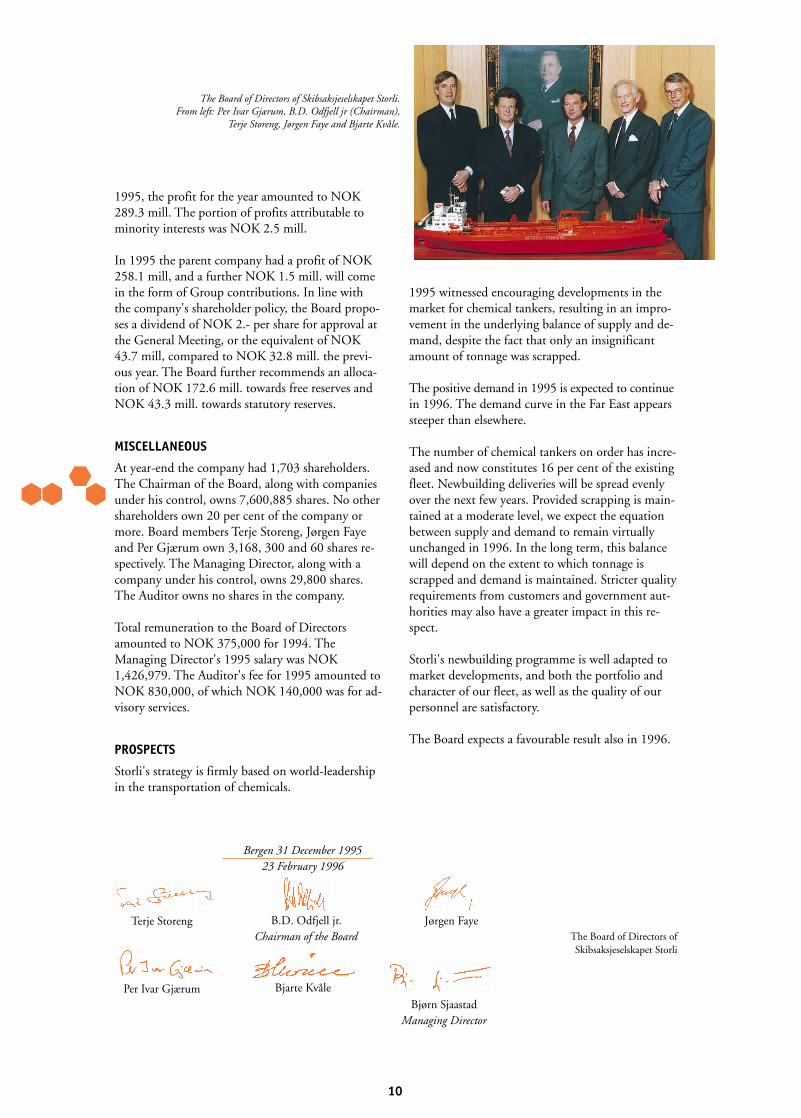
The Board of Directors of Skibsaksjeselskapet Storli.From left: Per Ivar Gjærum, B.D. Odfjell jr (Chairman),
Terje Storeng, Jørgen Faye and Bjarte Kvåle.

11
Storli GroupStorliNOK 1 000
Note 1995 1994 1995 1994
Operating Income (Cost):
Gross freight revenue 2 981 811) 2 564 102) 3 011 930) 2 590 002)
Voyage cost (916 556) (833 547) (874 142) (798 203)
Freight income time-charter basis 2 065 255) 1 730 555) 2 137 788) 1 791 799)
Distributed to participating owners (507 741) (396 335) (525 058) (410 702)
Result on a time-charter basis 2 1 557 514) 1 334 220) 1 612 730) 1 381 097)
Operating cost 3 (646 612) (564 226) (625 021) (562 919)
Time-charter cost 4 (231 258) (218 416) (233 594) (220 622)
Net Result from Vessels' Operation 679 644) 551 578) 734 115) 597 556)
Other income 5 23 434) 19 665) 180 053) 167 612)
Other cost 5 -) -) (129 888) (125 337)
General and administrative cost 3 (110 250) (93 879) (114 110) (96 947)
Depreciation 10 (183 284) (262 411) (204 787) (284 108)
Operating Result 409 544) 214 953) 465 383) 258 776)
Financial Income (Cost):
Interest received 78 440) 59 794) 72 389) 61 341)
Interest and fees paid (175 495) (101 894) (190 553) (126 836)
Other financial income (cost) 16 741) (11 195) 16 767) (11 195)
Currency gain (loss) 6 30 155) 40 324) 30 461) 39 378)
Net financial income (cost) (50 159) (12 971) (70 936) (37 312)
Net Result before Taxes 359 385) 201 982) 394 447) 221 464)
Taxes 19 (101 244) (58 189) (105 110) (59 432)
Net Result for the Year 258 141) 143 793) 289 337) 162 032)
Revaluation and Adjustments:
Dividend allocation (43 697) (32 773) (43 697) (32 773)
Contribution from subsidiaries 1 467) 815) -) -)
Legal reserve 16 (43 326) (35 435) (43 326) (35 446)
General reserve 16 (172 585) (76 400) (199 774) (91 467)
Minority interest, portion of result 14 -) -) (2 540) (2 346)
Total (258 141) (143 793) (289 337) (162 032)
PROFIT AND LOSS STATEMENT

12
BALANCE SHEET
ASSETS
Storli GroupStorliNOK 1 000
Note 1995 1994 1995 1994
Current Assets:
Cash and bank deposits 7,23 854 816 813 546 892 523 852 352
Bonds etc. 23 315 233 173 411 315 233 173 411
Shares 8 9 258 9 258 9 275 9 275
Bunkers etc. 23 35 794 31 879 36 079 32 134
Short term receivables 23 152 611 156 059 181 208 177 979
Total Current Assets 1 367 712 1 184 153 1 434 318 1 245 151
Fixed Assets:
Bank deposits 9,23 58 144 31 095 58 144 31 095
Shares in subsidiaries 8 8 800 8 694 - -
Other shares 8 4 565 3 718 4 565 3 720
Loans to subsidiaries 9 242 101 239 034 - -
Other long term receivables 9,23 46 694 43 782 65 819 44 793
Deferred tax benefit 20 - 2 769 - 2 769
Vessels 10,11 2 880 509 2 170 550 2 880 509 2 170 550
Newbuildings 10,11 41 209 390 365 41 209 390 365
Tank terminal 10,11 - - 482 399 483 961
Office equipment and cars 10,11 7 350 4 337 8 906 6 260
Real estate 10,11 50 782 21 754 57 352 28 550
Total Fixed Assets 3 340 154 2 916 098 3 598 903 3 162 063
Total Assets 4 707 866 4 100 251 5 033 221 4 407 214
Bjarte Kvåle
B.D. Odfjell jr.Chairman of the Board
Bergen 31 December 199523 February 1996
Bjørn SjaastadManaging Director
Terje Storeng
Per Ivar Gjærum
Jørgen Faye
The Board of Directors ofSkibsaksjeselskapet Storli

13
LIABILITIES AND SHAREHOLDERS’ EQUITY
NOK 1 000 Storli GroupStorli
Note 1995 1994 1995 1994
Current Liabilities:
Dividend allocation 43 697 32 773 43 697 32 773
Taxes payable 1 - 12 632 603
Employee taxes etc. 23 23 500 20 319 24 324 30 854
Other short term liabilities 23 206 399 137 672 239 820 144 954
Due to subsidiaries 6 18 278 5 923 - -
Total Current Liabilities 291 875 196 687 320 473 209 184
Long Term Liabilities:
Deferred tax liabilities 20 415 773 317 299 415 773 317 619
Other long term liabilities 22 - 8 653 2 176 10 772
Convertible loan 25 000 - 25000 -
Mortgage debt 13 2 347 188 2 165 491 2 713 748 2 564 331
Total Long Term Liabilities 2 787 961 2 491 443 3 156 697 2 892 722
Total Liabilities 3 079 836 2 688 130 3 477 170 3 101 906
Minority interests 14 - - 1 013 1 027
Shareholders' Equity:
Share capital 15, 16 218 485 218 485 218 485 218 485
Legal reserve 16 86 691 43 365 87 097 45 614
Temporary restricted reserve 16 30 037 60 074 30 050 60 083
Total Undistributable Reserve 335 213 321 924 335 632 324 182
Distributable Reserve (General Reserve) 16 1 292 817 1 090 197 1 219 406 980 099
Total Shareholders' Equity 16 1 628 030 1 412 121 1 555 038 1 304 281
Total Liabilities and Shareholders' Equity 4 707 866 4 100 251 5 033 221 4 407 214
Secured liabilities 17 2 406 724 2 218 059 2 776 444 2 616 899
Guarantees 18 445 594 476 137 68 233 68 160

14
CASH FLOW STATEMENT
Storli GroupStorliNOK 1 000
1995 1994 1995 1994
Cash from/used in operations:
Net result for the year 258 141) 143 793) 289 337) 162 032)
Profit/loss from sale of fixed assets (150) -) (150) (310)
Depreciation 183 284) 262 411) 204 787) 284 108)
Currency (gain) loss (30 155) (40 324) (30 461) (39 378)
Changes in deferred tax liability 101 243) 58 189) 105 110) 58 406)
Minority interests’ portion of income -) -) (2 540) (2 346)
Cash generated by operations 512 363) 424 069) 566 083) 462 512)
Changes in current assets/liabilities 75 144) (110 493) 84 595) (113 056)
Net current cash developments from operations A 587 507) 313 576) 650 678) 349 456)
Cash from/used on investments:
Investment in fixed assets (577 138) (436 478) (627 838) (476 074)
Sale of fixed assets 1 311) -) 1 315 ) 969)
Reduction (increase) long term receivables (33 981) (25 980) (48 920) 130 305)
Net change from investments B (609 808) (462 458) (675 443) (344 800)
Cash from/used on financing activities:
New loans 1 978 478) 1 005 178) 1 978 478) 1 038 978)
Debt repayments (1 660 813) (763 300) (1 667 133) (932 300)
Currency adjustments (80 966) (115 062) (71 814) (111 601)
Dividend allocation (32 773) (16 386) (32 773) (16 386)
Contribution from subsidiaries 1 467) 815) -) -)
Net change from financing activities C 205 393) 111 245) 206 758) (21 309)
Net changes in funds (A+B+C) 183 092) (37 637) 181 993) (16 653)
Cash position 1 January 986 957) 1 024 594) 1 025 763) 1 042 416)
Cash position 31 December 1 170 049) 986 957) 1 207 756) 1 025 763)

15
1 ACCOUNTING PRINCIPLESAll items in the financial statement have been repor-ted, valued and accounted for in accordance with theCompanies Act and Generally Accepted AccountingPrinciples in Norway. During the last years materialchanges in Norwegian GAAP have been implemen-ted which have brought Norwegian GAAP in linewith the International Accounting Standards (IAS).
a. Consolidation
The consolidated accounts consist ofSkibsaksjeselskapet Storli and subsidiaries referred toin note 8. Common accounting principles is appliedto all companies in the Storli Group. Intra-Grouptransactions (receivables, liabilities etc.) have beeneliminated.
Foreign subsidiaries have been converted to NOKbased on the rate of exchange prevailing at 31December, both with respect to the profit and lossaccount and the balance sheet. Convertion differen-ces are recorded directly to the equity.
b. Current assets
Current assets are valued at the lower of historicalcost and current cost.
c. Fixed assets - depreciation
Fixed assets are depreciated based upon the straightline method. From 1995 the depreciation period forvessels has been changed from 20 years to 25 years.The effect on the profit and loss account is shown innote no. 10.
d. Newbuilding contracts
Newbuildings include payments made under thecontracts together with other costs directly associatedwith the newbuilding program. In 1995 interests du-ring the construction period has been expensed. Theeffect on our profit and loss account is shown in noteno. 10
e. Shares
Shares in public companies are classified as currentassets and valued at the lower of historical and cur-rent cost.
f. Limited partnerships etc.
Storli has only majority owned limited partnershipsincluded in the accounts, and two wholly ownedIsle of Man companies. These companies have beenreported on a gross basis. Deferred tax and tax paya-ble is treated as a part of Storlis tax and deferred tax
and tax payable in the balance report. The followingcompanies are included in Storli:
Odfjell Tankers KSMinde Chartering KS Slaney Shipping Company LimitedWest Coast Maritime Limited
g. Pension and accrued pension liability
Storli's pension obligations are mainly coveredthrough life insurance companies. The present valueof the liabilities have been calculated based on actua-rial principles. The difference between present valueof the calculated liabilities and the pension premiumfund is included under long term assets or long termliabilities. In addition we have made separate pensi-on arrangements with some former employees.Uncovered pension liabilites are calculated and inclu-ded in the above calculation. Change in net pensionliability is expensed in the profit and loss account.
h. Taxes and deferred tax liabilities
Taxes are calculated based on the company financialresult in the profit and loss statement and consists oftaxes payable and deferred taxes. The calculation ofdeferred taxes are based on the temporary differensesbetween the result in the profit and loss statementand the tax statement. Deferred taxes are listed aslong term liability.
i. Foreign currency
All revenues are denominated in USD. Most of thecosts are in foreign currencies. Assets and liabilitiesare valued at year end exchange rate. From 1995long term assets and liabilities are valued at year endexchange rate. The effect on our accounts is shownin note no. 6.
j. Periodical costs
Storlis vessels are normally drydocked every 30month. All related costs are expensed in the periodthey occur.
k. Long term mortgage debt
From 1995 mortgage debt due next year is includedunder long term debt. The balance sheet for 1994has been rearranged accordingly.
ACCOUNTING PRINCIPLES

16
2 RESULT ON A TIME-CHARTER BASIS:
Gross freight revenue represents freight earned for all vessels operated by Odfjell Tankers KS. Voyagecosts are the related costs for the same vessels. Distributing to participating owners represents netearning paid to external participating owners. Result on a time-charter basis represents net earningfor the Storli owned and time-chartered vessels.
3 OPERATING COST: (NOK 1 000)
Operating cost are related to the operation of the vessels and represents wages, repair, maintenance,insurance etc. for vessels owned by Storli. General and administrative cost for Storli is reported sepe-rately. Included are the following; salaries, wages, social and pension costs:
1995 1994Storli 288 576 263 461Subsidiaries 60 626 58 310Storli Group 349 202 321 771
4 TIME-CHARTER COST:
Time-charter cost represents hire paid for vessels hired by Odfjell Tankers KS according to the fleetlist on page 37.
5 OTHER INCOME AND OTHER COST:
Other income for the parent company represents management fee and rental income from real esta-te. For the Storli Group other income also include external income from foreign subsidiaries. Othercost represents operating, general and administrative cost for the foreign subsidiaries.
6 CURRENCY GAIN (LOSS): (NOK 1 000)
The accounting policies related to balance sheet items in foreign currencies is stated in note no. 1.Storli Storli Group
1995 1994 1995 1994Repayment of debt 17 412) (14 921) 17 412) (11 732)Forex contracts 466) 5 496) 466) 5 496)Mortgage debt - long term receivables 56 128) 155 386) 56 128) 150 979)Result of changes in the accounting principles per 1 January 13 912) -) 13 912) -)Cash and bank deposits (50 489) (98 694) (50 489) (98 486) Other current assets - liabilities (7 274) (6 943) (6 968) (6 879) Currency gain (loss) 30 155) 40 324) 30 461) 39 378)
Changes in accounting principles in 1995 has resulted in currency gain of NOK 54 mill. compared to principlesused previously.
7 CASH AND BANK DEPOSITS:
Included in this item is approx. NOK 6.7 mill. of tax withheld from employees.

17
8 SHARES: (NOK 1 000)
Share Our No. of Nominal Market Cost Book valueCompany name capital share shares value value 1995 1994Shares (current):Nomadic Shipping AS 104 750 9.76% 1 022 000 10 220 13 082 9 258 9 258 9 258 Total shares (current) 13 082 9 258 9 258 9 258
Shares in subsidiaries:Odfjell Tankers AS 1 000 100% 1 000 1 000 970 970 970 Minde Chartering AS 100 100% 100 100 567 567 567 Jacob Christensens Assuranceforrtning AS 50 100% 50 50 100 100 - Odfjell Tankers (USA) Inc., Houston USD 10 100% 1 000 USD 10 3 3 3 Odfjell Tankers BV, Rotterdam NLG 60 100% 60 NLG 60 6 581 6 581 6 582 Odfjell Tankers (S) Pte Ltd., Singapore SGD 100 100% 100 000 SGD 100 83 83 83 Odfjell Tankers (Japan) Ltd., Tokyo JPY 10 000 100% 200 JPY 10 000 489 489 489 Slaney Shipping Company Ltd. GBP 0.1 100% 100 GBP 0.1 1 - - West Coast Maritime Ltd. GBP 0.1 100% 100 GBP 0.1 1 - - Chemical Tankers (Delaware) Inc. USD 1 100% 1 USD 1 7 7 - Total shares in subsidiaries - 8 802 8 800 8 694
Wholly owned companies indirectly owned through subsidiaries: Odfjell Tankers (Brasil) Representacoes Ltda., Sao Paulo, Odfjell Tankers Guaranty Company
and Baytank (Houston) Inc., Houston.
9 LONG TERM RECEIVABLES: (NOK 1 000) Storli
Bank deposits: 1995 1994The deposits serve as security for mortgage debtrelated to Baytank (Houston) Inc. USD 9 200 58 144 31 095 Loans to subsidiaries:Odfjell Tankers (Japan) Ltd., Tokyo JPY 45 695 2 787 3 107 Baytank (Houston) Inc., Houston USD 37 866 239 314 235 927 Total Storli 242 101 239 034
Other long term receivables:Onshore and seagoing personnel 1 027 1 798 Storli’s share of long term receivables in limited partnerships 10 771 11 314 Accured pension funds 7 945 -Other 26 951 30 670 Total Storli 46 694 43 782
Share Our No. of Nominal Market Cost Book valueOther shares capital share shares value value 1995 1994V.O.Tank Terminal Ningbo Co. Ltd., China CNY 29 000 12.5% 36 250 CNY 3 625 4 565 4 565) 3 540)Asian Chemical Tankers Pte Ltd., Singapore SGD 50% - - 178)Total other shares 4 565 4 565) 3 718)
Total 22 625 22 623) 21 670)Eliminated in the consolidated accounts (8 783) (8 677) Group 13 840) 12 993)

18
11 INVESTMENT AND SALE OF FIXED ASSETS: (NOK 1 000)
1991 1992 1993 1994 1995Storli: I S I S I S I S I SVessels and newbuildings 358 384 80 758 405 465 - 265 614 - 435 724 - 542 326 -Office equipment and cars 4 324 163 1 857 478 2 880 788 622 - 4 074 1 161Real estate 166 - - - 1 220 - 132 - 29 726 -Total Storli 362 874 80 921 407 322 478 269 714 788 436 478 - 576 126 1 161Subsidiaries:Vessels and newbuildings - - - 2 876 - - - - - -Tank terminal 16 570 - 24 024 80 46 686 - 38 410 939 50 307 -Office equipment and cars 478 - 790 302 227 - 1 186 30 358 4Real estate - - - - - - - - 35 -Total subsidiaries 17 048 - 24 814 3 258 46 913 - 39 596 969 50 700 4Storli Group:Vessels and newbuildings 358 384 80 758 405 465 2 876 265 614 - 435 724 - 542 326 -Tank terminal 16 570 - 24 024 80 46 686 - 38 410 939 50 307 -Office equipment and cars 4 802 163 2 647 780 3 107 788 1 808 30 4 432 1 165Real estate 166 - - - 1 220 - 132 - 29 761 -Total Storli Group 379 922 80 921 432 136 3 736 316 627 788 476 074 969 626 826 1 165
12 CONVERTIBLE LOAN:
The convertible loan of NOK 25 mill. from the Board of Directors and management can be converted to shares per 30 April 1998, 30 April 1999 and 28 April 2000 at the rate of NOK 125, NOK 130 and NOK 135 per share respectively.
10 FIXED ASSETS: (NOK 1 000)
Cost Invested Accumulated Deprecation Book1 Jan. (Sale) depreciation this year value
Storli: book value prior years 31 Dec.Vessels and newbuildings 4 360 257 542 326 (1 799 342) (181 523) 2 921 718Office equipment and cars 18 926 4 075 (14 588) (1 063) 7 350Real estate 27 691 29 726 (5 937) (698) 50 782Total Storli 4 406 874 576 127 (1 819 867) (183 284) 2 979 850
Subsidiaries:Tankterminal 807 310 18 959 (323 349) (20 521) 482 399Office equipment and cars 7 415 354 (5 492) (721) 1 556Real estate 9 758 35 (2 962) (261) 6 570Total subsidiaries 824 483 19 348 (331 803) (21 503) 490 525
Storli Group:Vessels and newbuildings 4 360 257 542 326 (1 799 342) (181 523) 2 921 718Tankterminal 807 310 18 959 (323 349) (20 521) 482 399Office equipment and cars 26 341 4 429 (20 080) (1 784) 8 906Real estate 37 449 29 761 (8 899) (959) 57 352Storli Group 5 231 357 595 475 (2 151 670) (204 787) 3 470 375
In 1995 the company extended its depreciation period for vessels from 20 to 25 years. The ordinary depreciation is the-refore reduced from 5 to 4 percent p.a.. The effect of this change is a reduction in depreciation of NOK 99.5 mill. for1995.In 1995 the company has expenced interest and other financial cost related to the newbuilding program of NOK 24.9mill.

19
16 CHANGES IN SHAREHOLDERS' EQUITY: (NOK 1 000)
Storli Storli Group
Share capital 1995 1994 1995 1994Per 1 January 218 485) 109 243) 218 485) 109 243)Bonus issue -) 109 242) -) 109 242)Per 31 December 218 485) 218 485) 218 485) 218 485)Legal reservePer 1 January 43 365) 7 930) 45 614) 9 235)Added(used) this year 43 326) 35 435) 41 483) 36 379)Per 31 December 86 691) 43 365) 87 097) 45 614)Temporary restricted reservePer 1 January 60 074) 90 111) 60 083) 90 125)Transferred to distributable reserve (20%) (30 037) (30 037) (30 033) (30 042)Per 31 December 30 037) 60 074) 30 050) 60 083)Distributable reserve (general reserve)Per 1 January 1 090 197) 1 093 002) 980 099) 960 055)From temporary restricted reserve 30 037) 30 037) 30 033) 30 042)From (to) profit and loss account 172 585) 76 400) 199 774) 91 467)Bonus issue -) (109 242) -) (109 242)Adjustment (2) -) 9 500) 7 777)Per 31 December 1 292 817) 1 090 197) 1 219 406) 980 099)Total shareholders’ equity 1 628 030) 1 412 121) 1 555 038) 1 304 281)
14 MINORITY INTERESTS:
Managing Director has minority interest i Minde Chartering KS, with a 2% ownership.
15 SHARE CAPITAL: (NOK 1 000) Storli
1995 1994
A-shares 14 873 760 each NOK 10 148 738 148 738 B-shares 6 974 752 each NOK 10 69 747 69 747 Total Share Capital 218 485 218 485 The B-shares are identical to the A-shares, except that the B-shares do not carry voting rights.
17 SECURED LIABILITIES: (NOK 1 000)Storli Storli Group
1995 1994 1995 1994Collateralized debt 2 347 188 2 153 163 2 716 908 2 552 003 Collateralized guarantees 59 536 64 896 59 536 64 896Total secured liabilities 2 406 724 2 218 059 2 776 444 2 616 899 Book value - assets pledged as collateral 2 550 879 2 358 464 3 034 840 2 841 427
18 GUARANTEES ON BEHALF OF: (NOK 1 000)Storli Storli Group
1995 1994 1995 1994Baytank (Houston) Inc., Houston 369 720 398 840 - - Other subsidiaries 8 150 9 648 - - Uncalled committed capital in limited partnerships 47 292 47 292 47 802 47 802 Other guarantees 20 431 20 357 20 431 20 357 Total guarantees 445 594 476 137 68 233 68 159
13 MORTGAGE DEBT: (NOK 1 000)Storli Storli Group
Total mortgage debt 2 347 188 2 713 748Repayment schedule of total mortgage debt:1996 196 183 199 3431997 196 183 199 3431998 and following years 1 954 822 2 315 062

20
20 DEFERRED TAX LIABILITY: (NOK 1 000)Storli Storli Group
Deferred Tax: 1995 1994 1995 1994Debt reserve -) 131 881) -) 133 213)Loss on bonds etc. -) (24 397) -) (24 397)Interest swap 21 061) -) 21 061) -)Total short term items 21 061) 107 484) 21 061) 108 816)
Fixed assets 1 183 378) 938 381) 1 183 378) 938 381)Vessels Classification Fund -) 138 901) -) 138 901)Profit and loss account 165 353) 206 692) 165 353) 206 692)Accured Pension Fund 9 063) -) 9 063) -)Other long term temporary differences 106 050) 21 657) 106 050) 21 657)Total long term items 1 463 844) 1 305 631) 1 463 844) 1 305 631)Total temporary differences 1 484 905) 1 413 115) 1 484 905) 1 414 447)
Loss carried forward for tax purposes -) (279 905) -) (280 232) Basis for calculation of temporary differences and loss carried forward 1 484 905) 1 133 210) 1 484 905) 1 134 215)Tax rate 28% 28% 28% 28%Deferred tax liability 415 773) 317 299) 415 773) 317 619)
Deferred tax benefit:Accrued pension liability -) 9 891) -) 9 891)Tax rate 28% 28% 28% 28% Deferred tax benefit -) 2 769) -) 2 769)
Storli Storli Group
1995 1994 1995 1994Net result before taxes 359 385) 201 982) 394 447) 221 464)Contribution from subsidiaries 1 467) 815) -) -)Permanent differences 1 048) 5 021) 1 063) (4 923) Changes in temporary differences (81 991) (5 608) (81 381) (5 999) Utilisation of loss carried forward (279 904) (202 210) (280 007) (201 978)Basis for tax calculation 5) 0) 34 122) 8 564)
Taxes payable:Norway (1) -) (18) (4)Abroad -) -) (3 849) (1 195) Total taxes payable (1) -) (3 867) (1 199)
Deferred taxes:Norway (101 243) (58 189) (101 243) (58 233) Abroad -) -) -) -)Total deferred taxes (101 243) (58 189) (101 243) (58 233)Taxes (101 244) (58 189) (105 110) (59 432)
19 TAXES: (NOK 1 000)
Deferred taxes is calculated based on the temporary differences between book value and tax value including thetax loss carried forward (see spesification below).
In accordance with the accounting standard for tax treatment, positive and negative temporary differenceswhich are reversed or can be reversed within a given period is eliminated and recorded at net value. Deferred taxis calculated based on the temporary differences and tax losses carried forward.
In accordance with the accounting standard for tax treatment in relation to negative temporary differenceswhich can not be settled must be classified as deferred taxes in the balance sheet.
Below is a spesification of the differences between the profit and loss statement before taxes and the basis for thetax calculation.

21
21 LOSS CARRIED FORWARD: (NOK 1 000)
Storli Storli Group
1995 1994 1995 1994Loss carried forward - 279 905 - 279 905
22 PENSION COST AND ACCRUED PENSION LIABILITY: (NOK 1 000)Storli
Pension cost: 1995 1994Present value current year service cost 4 250) 4 009)Interest cost on pension liabilities prior years 4 155) 3 874)Return on pension plan assets (4 660) (4 005)Net periodic pension cost 3 745) 3 878)Employees social expenses 528) 88)Total periodic pension cost 4 273) 3 966)
Accrued pension liability:Actuarial present value of benefit obligation (75 977) (71 056) Actuarial value of pension premium fund 80 884) 62 403)Unrecognized gain -(loss) 3 037) )Accrued pension funds -(liability) 7 944) (8 653) Accrued employers social cost 1 120) 1 237)
The above calculation is based on thefollowing assumptions:Discount rate 6.00% 6.00%Asset return 7.00% 7.00%Inflation 2.50% 2.50%Salary progression 2.50% 2.50%Pension indexation 2.50% 2.50%
23 USD EXPOSURE FOR BANK DEPOSITS, RECEIVABLES AND DEBT: (NOK 1 000)
Storli Group
1995 1994Cash and bank deposits USD 140 561) 888 350) 761 885)Bonds etc USD 49 879) 315 233) 173 441)Short term receivables USD 24 849) 157 046) 145 449)Long term bank deposits USD 9 200) 58 144) 31 096)Other long term receivables USD 4 362) 27 568) 11 519)Total receivables USD 228 851) 1 446 341) 1 123 390)Employee taxes etc. USD (1 621) (10 245) (13 662) Other short term liabilities USD (21 176) (133 837) (58 343) Mortgage debt USD (427 722) (2 703 205) (2 252 183) Total liability USD (450 519) (2 847 287) (2 324 188)Net liability USD (221 668) (1 400 946) (1 200 798)
24 OFF - BALANCE SHEET ITEMS:
At year end the company had currency exchange contracts for sale of USD 5 mill. with maturity in 1996.
The company had per 31 December no interest rate contract with maturity after 1996.

22
AUDITOR’S REPORT
We have audited the annual financial statements of Skibsaksjeselskapet Storli for 1995, showing anet income for the year of NOK 258 141 000 for the parent company and a consolidated net incomefor the year of NOK 289 337 000. The annual financial statements, which comprise the Board ofDirectors’ report, the profit and loss accounts, the balance sheet, cash flow statement, notes to theaccounts and consolidated accounts, are presented by the company’s Board of Directors and itsManaging Director.
Our responibility is to examine the company’s annual financial statements, its accounting recordsand other related matters.
We have conducted our audit in accordance with relevant laws, regulations and Norwegian generallyaccepted auditing standards. We have performed those audit procedures which we have considerednecessary to confirm that the annual financial statements are free of material misstatements. We haveexamined selected parts of the evidence supporting the accounts and assessed the accounting princi-ples applied, the estimates made by management and the content and presentation of the annual financial statements. To the extent required by Norwegian generally accepted auditing standards, wehave reviewed the company’s internal control and the management of its financial affairs.
The Board of Director’s proposal for the allocation of the net income and transfers between equityaccounts complies with the provisions of the Norwegian Joint-Stock Companies Act.
In our opinion, the annual financial statements have been prepared in accordance with the require-ments of the Norwegian Joint-Stock Companies Act and present fairly the financial position of thecompany and group as of December 31st 1995 and the result of its operations for the financial year,in confirmity with Norwegian generally accepted accounting principles.
Bergen, March 8th 1996ERNST & YOUNG-BERGEN AS
Karl Erik SvanevikState Authorized Public Accountant (Norway)
Note: The translation into English has been prepared for purpose of information only.

23
Freight ratesStorli's results are influenced by the freight rates. Achange of USD 1,000 per day will, on an annualbasis, affect the results by approx. NOK 83 mill.
Rates of exchangeStorli is a USD based company. All revenues are de-nominated in USD and ship values are also expres-sed in USD. Storli therefore has as policy to main-tain USD as its principal currency, and to reduce allother currency risks. The different items of the pro-fit and loss statement will be influenced by the ex-change rate between USD and NOK. An increaseof NOK 0.10 in the average exchange rate will im-prove net result before tax by approx. NOK 14mill.
On the other hand, a stronger USD exchange ratecompared to NOK translates into a currency losson the USD denominated mortgage loans and cur-rency gain on the Group's current assets. Overall,
due to a net debt position, this has a negative ac-counting effect. On the other hand a stronger USDexchange rate influences both the results as well asthe real equity positively.
InterestThe Storli Group's outstanding mortgage debt andliquidity reserves are USD based. The debt is fixedfor short term periods through interest rate agree-ments. Changes in the floating LIBOR rates of 1%will influence net financial items in 1996 by ap-prox. NOK 11 mill., at a constant debt level.
BunkersBunkering costs represented about 36% of the voya-ge expenses in 1995. A variation in bunker prices ofUSD 1 per ton annually will lead to approx. NOK2.5 mill. change in voyage expenses for the vesselswhere Storli has a direct economic interest.
FinancingThe company finances it’s vessels with loans fromsome of the world’s leading commercial banks, tra-ditionally with a mortgage as security. Some of thevessels are unencumbered. The average repaymentprofile of the mortgage debt related to the existingvessels (excl. newbuildings) is approx. 7 years withan even repayment profile. The newbuilding pro-gram is financed on a long term basis with an avera-ge repayment profile of approx. 15 years.
ANALYTICAL INFORMATION
30
60
90
120
150
95 94 93 92 91 90 89
Bunker prices (380 cst Rotterdam)
2
4
6
8
10
12
95 94 93 92 91 90 89
USD Libor (6 months)
5
6
7
8
95 94 93 92 91 90 89
Exchange Rate (USD/NOK)
%
USD/ton

24
Shareholder policyStorli's objective is to give along-term competitive yieldto it’s shareholders. The com-pany emphasises a friendly di-vidend policy for it’s sharehol-ders, based upon the compa-ny's performance, current in-vestment programs as well asthe tax situation. Return oncapital will primarily be reali-sed through share price deve-lopments.
Reporting of resultsStorli attaches great importan-ce to ensuring that essentialinformation concerning thecompany's development is re-leased without delay to ourshareholders and the stockmarket. Storli issues interimreports of accounts on a four-month basis. The financial ca-lendar for the next year is out-lined on the inside of the cover.
Share price developmentAt the close of 1995, the priceof Storli's A-shares was NOK95.00, compared to the cor-responding figure for 1994 ofNOK 118.00. The drop inprice was 19.5 per cent. B-share prices were NOK 94.00and NOK 114.00 respective-ly, which was a decrease of17.5 per cent. During the
same period the shipping-index on the Oslo StockExchange rose by 2.5 per cent. In 1995 the turnovertotalled 11,700,513 shares, constituting 7,423,258A-shares and 4,277,255 B-shares. Compared to theprevious year, this represented an increase of approx.28%. During 1995 the Storli A-share was traded atthe Oslo Stock Exchange 246 out of 251 tradingdays. In addition to being listed on the Oslo StockExchange, the Storli shares were traded on SEAQInternational, which is a trading system for foreignshares on the London Stock Exchange. In 1994 anADR-program for the Storli share was established inthe USA, which enables the shares to be traded in USD.
RISK-regulationFor the Storli-share the following RISK-regulationhas been established:Per 1 January 1996 negative NOK 2.00 per share*Per 1 January 1995 negative NOK 1.50 per sharePer 1 January 1994 negative NOK 2.49 per sharePer 1 January 1993 NOK 0.00 per share* calculated
ShareholdersAt the end of 1995 there were 1,262 holders ofStorli A-shares, and 723 holders of Storli B-shares.Adjusted for shareholders owning both categories,the total number of shareholders was 1,703.
Foreign quotaForeign investors are entitled to own up to one-third of the total number of A-shares and all of theB-shares in the company. At the close of 1995, 10.8per cent of the A-shares and 23.7 per cent of the B-shares were owned by foreign investors, which isequivalent to 14.9 per cent of the total share capital.At the end of 1994 14.0 per cent of the shares wereheld by foreign investors.
SHAREHOLDER INFORMATION
0
5
10
15
20
25
30
95949392919089
Cash flow per share (NOK)
ex. profit sale of assetsincl. profit from sale of assets
-5
0
5
10
15
20
95949392919089
Earnings per share (NOK)
ex. profit sale of assetsincl. profit from sale of assets
0
10
20
30
40
50
95949392919089
Dividend (NOK mill.)
0
30000
60000
90000
120000
150000
0
30
60
90
120
150Share price and volume development
93 94 95 96
A-shareNOK
Volume

Shareholder structure A+B-sharesper 31 December 1995
B.D. Odfjell jr. & Companies
34,79%
Avanse5,37%
Folketrygd-fondet5,13%
Foreigninvestors14,91%
Other39,80%
25
THE 20 LARGEST SHAREHOLDERS AS PER 31 DECEMBER 1995Percent Percent
Name A-shares B-shares Total of votes of shares1 B.D. Odfjell jr. & controlled companies 7 357 591 243 294 7 600 885 49,47% 34,79%2 Avanse-fondene 582 300 591 800 1 174 100 3,91% 5,37%3 Folketrygdfondet 531 100 589 000 1 120 100 3,57% 5,13%4 Gjensidige 458 104 367 500 825 604 3,08% 3,78%5 Uni Storebrand 312 204 504 500 816 704 2,10% 3,74%6 Kommunal Landspensjonskasse 236 400 366 200 602 600 1,59% 2,76%7 Svenska Handelsbanken 207 300 224 100 431 400 1,39% 1,97%8 Norsk Hydros Pensjonskasse 0 418 800 418 800 0,00% 1,92%9 Odfjell Shipping (Bermuda) Ltd. 23 680 282 500 306 180 0,16% 1,40%10 Odin-fondene 107 700 190 600 298 300 0,72% 1,37%11 Vital Forsikring 262 140 35 920 298 060 1,76% 1,36%12 ABN AMRO Bank 123 800 170 900 294 700 0,83% 1,35%13 Skandinaviske Enskilda Banken 32 600 258 200 290 800 0,22% 1,33%14 Morgan Guaranty Trust 191 936 51 300 243 236 1,29% 1,11%15 Orkla 38 000 201 000 239 000 0,26% 1,09%16 Ingeborg Berger, London 73 920 153 770 227 690 0,50% 1,04%17 Alfa Livsforsikring 213 000 14 000 227 000 1,43% 1,04%18 DnB Investor-fondene 114 214 101 804 216 018 0,77% 0,99%19 Chase Manhattan Bank 192 732 0 192 732 1,30% 0,88%20 DnB Investeringsselskap 56 000 130 000 186 000 0,38% 0,85%Total 20 largest shareholders 11 114 721 4 895 188 16 009 909 74,73% 73,28%Other shareholders 3 759 039 2 079 664 5 838 703 25,27% 26,72%Total 14 873 760 6 974 852 21 848 612 100,00% 100,00%
Foreign shareholders 1 605 004 1 652 456 3 257 460 10,79% 14,91%
SHARE CAPITAL HISTORY - SKIBSAKSJESELSKAPET STORLIAmount Share capital
Year Event NOK after event, NOK1916 Established 517 500 517 5001969 Capitalisation bonus issue 382 500 900 0001969 Merger with A/S Oljetransport 900 000 1 800 0001981 Capitalisation bonus issue 1 800 000 3 600 0001984 Capitalisation bonus issue 3 600 000 7 200 0001985 Merger with
Skibsaksjeselskapet Selje 3 320 000 10 520 0001985 Merger with Odfjell Tankers
& Terminals A/S 2 000 000 12 520 0001985 Capitalisation bonus issue 6 260 000 18 780 0001985 Public offering 9 390 000 28 170 0001986 Capitalisation bonus issue 2 817 000 30 987 0001988 Capitalisation bonus issue 6 197 400 37 184 4001989 Capitalisation bonus issue 7 436 880 44 621 2801989 International private placement 10 000 000 54 621 2801990 Capitalisation bonus issue 54 621 280 109 242 5601994 Capitalisation bonus issue 109 242 560 218 485 120
DISTRIBUTION A-sharesShareholders Shares
Number of shares Number Percent Number Percent1 - 1.000 909 67,3% 327 180 2,2%1.001 - 5.000 274 20,3% 712 511 4,8%5.001 - 50.000 138 10,2% 2 134 941 14,4%50.001 - 100.000 11 0,8% 737 855 5,0%100.001 - 18 1,3% 10 961 273 73,7%Total 1 350 100,0% 14 873 760 100,0%
B-shares1 - 1.000 577 73,0% 134 200 1,9%1.001 - 5.000 106 13,4% 264 590 3,8%5.001 - 50.000 84 10,6% 1 572 054 22,5%50.001 - 100.000 6 0,8% 401 644 5,8%100.001 - 17 2,2% 4 602 264 66,0%Total 790 100,0% 6 974 752 100,0%
Shareholder structure A-sharesper 31 December 1995
B.D. Odfjell jr. & Companies49,47%Avanse
3,91%
Folketrygd-fondet3,57%
Foreigninvestors10,79%
Other32,26%

Storli is a fully integrated shipping company, hand-ling all related functions, such as ship management,operation and chartering. The company is one ofthe four leading players in the world-wide parceltanker trade. Through its wholly owned subsidiary,Odfjell Tankers, the company operates a fleet of 47chemical tankers, aggregating approx. 1.5 milliondwt. Storli is the owner of 28 of these vessels. Thefleet operates in world-wide trade, and is committedto the long-term shipping requirements of the pe-trochemical industry through Contracts ofAffreightment with many of the world's chemicalgiants.
Odfjell Chartering (formerly Minde Chartering) isresponsible for the world-wide marketing and char-tering of the Odfjell Tankers fleet of chemical tan-kers. The company has developed overseas represen-tation since 1975 and gradually established marke-ting and chartering offices in 13 major market are-as.
Odfjell Tankers is responsible for the operation ofall vessels employed by the Group. The fleet is com-
prised of Storli's own vessels, pool-operated vesselsowned by third parties, and chartered-in tonnage.Odfjell Tankers is the contractual partner with ourcustomers as well as with most of the time-chartertonnage. Operations and chartering evaluate the to-tal utilisation of the fleet and then plan and imple-ment the routing of the vessels. The tasks of OdfjellTankers include loading and discharging of the ves-sels, coordination with the ships’ masters and ourown operation teams in key areas as well as coopera-tion with local agents. Cargo related rules and regu-lations are monitored by Odfjell Tankers togetherwith freight and demurrage processing.
The Ship Management department is responsiblefor all functions regarding the technical operation ofStorli's own vessels, as well as the eleven vessels ow-ned by our pool partner, National ChemicalCarriers Ltd., Saudi Arabia. This includes crewing,technical operation and maintenance, purchasingand insurance. At year-end 1995 the ship manage-ment division was responsible for the operation ofthirtyone vessels.
CORPORATE STRUCTURE
Jan PedersenOlav Tangerås
Bjørn Sjaastad Åke H. Gregertsen
Gudmund Valen
Hans Lund Atle Knutsen

27
Number of employees as of 31 December 1995
Head office 149
Branch offices 61
Baytank 113
Vessel crew members:
Norwegian 452
Foreign 775
Total 1,550
Management
Bjørn Sjaastad Managing Director
Atle Knutsen Director, Chartering
Olav Tangerås Director, Operations
Hans Lund Director, Ship Management
Åke H. Gregertsen Director, Finance & Accounts
Gudmund Valen Director, Baytank
Jan Pedersen Director
The Board of Directors
B.D. Odfjell jr. Chairman
Jørgen Faye
Per Ivar Gjærum
Bjarte Kvåle
Terje Storeng
FinanceÅke H.
Gregertsen
Tank Terminal(Baytank)
Gudmund Valen
ShipManagementHans Lund
ManagingDirector
Bjørn Sjaastad
PersonnelProject/NewbuildingQuality Assurance
Operations(OdfjellTankers)
Olav Tangerås
Chartering(Odfjell Chartering)
Atle Knutsen
BOARDOF
DIRECTORS


29
The operation of chemical parcel tankers imposesan exceptional demand for effort and expertise onShip Management as well as on the crew, thus greatimportance is attached to this part of the organisati-on. Most of our vessels are registered with theNorwegian International Ship Register (NIS). Thevessels are manned by Norwegian officers andPhilippine crew. All our officers and crew possessthe necessary practical experience needed for wor-king on chemical tankers.
RecruitmentStorli emphasises the need to ensure that both qua-lified officers and crews are recruited. For manyyears the company has had its own system for recru-iting and training of junior officers. This program isexpanded as the size of our fleet has increased.
In addition we also established in 1991 a number ofprobationary and cadet positions to secure ampleresources. During 1995 a total of 102 persons wereincluded in the program, of them 18 cadets.
Technical OperationThe vessels maintenance programs are based onhigh standards of quality and a long life span. Theprogram is certified by the classification societies asPlanned Maintenance System. Corrosion protectionand maintenance of the inner structure of the ballasttanks and void space are planned based on thoroughevaluations and carried out normally at the dry-doc-kings every 30th month. Vessels which have beenthrough Condition Assessment Program (CAP) according to DnV have achieved four points on ascale where five points are maximum.
SafetyCurrently certification of the vessels operating sys-tems are carried out according to ISO 9002 andDnV’s Safety and Environmental Protection (SEP).We expect this program, which involve all our ves-sels, to be finished in the middle of 1996. This cer-tification meets the standards of the IMO/SolasISM Code which will have to be implemented onall vessels above 500 grt. by 1 July 1998.
We have established a system of formal reports (SA-FIR reports) from the vessels. This system is integra-ted in our Total Quality System and facilitate trans-
fer of experience related to critical situations, acci-dents, variances, and possible improvements. TheSAFIR system has been an important tool in ensu-ring continuous high levels of safety and quality atsea.
CommunicationMost communication between the vessels and landbased organisation is done through E-mail.
InspectionsDuring 1995 a total of 21 vessels have been inspectedby 8 of our most important customers. In addition,12 vessels have been inspected according toChemical Distribution Institute (CDI) standard.The CDI inspections are carried out by approvedinspectors which adhere to common standards ap-proved by the customers. These inspections will inthe future gradually replace the inspections our cus-tomers today carry out themselves.
OPERATING PHILOSOPHY AND SAFETY
Storli’s strategy is to operate as a fully integrated shipowning company, incorporatingall the functions required to ensure the efficient provision of our transportation services,at a high level of quality. By conducting the functions for Chartering, Ship Managementand Operations ourselves, in addition to ownership, we ensure effective liaisons andcommon priorities throughout the scope of our activities.

WORLD WIDE SERVICES
Houston
Rotterdam
Bergen
Riyadh
Dubai
New Delhi
Bombay
Tokyo
Sydney
Durban
Sao Paulo
Buenos Aires
Santiago
Head office
Marketing offices
Main trade lanes
Singapore
30 31


32
The parcel tanker market is mainly catering to the transport of organic and inorganicchemicals. The annual trade volume is estimated at about 55 million tons world-wide.In addition to that, the chemical tanker fleet serves the vegetable oil industry as well aslubricating oils, alcohol’s and the increasing MTBE industry. The main tradelanes are tothe Far East, Middle East and South America from both the US and Europe as well asthe Transatlantic route.
HistoryThe chemical trade dates back to the late 50’s andthe early 60’s, and started off with smaller purpose-built tankers and larger converted tankers. Sincethen, the industry has increased tremendously andis today a mature and well regulated industry. Vesselsizes have increased from ships in the 4.000 dwt.class up to 40.000 dwt. capacity, and the degree ofsophistication has improved considerably. At thesame time the production areas have developedfrom being mainly a US industry into a global in-dustry. Production takes place in the US, Europe,the Middle East and the Far East, which also meansthat there is a substantial level of cross trading.
The marketsThe main building blocks for chemicals are coal, gasand crude oil. The main production areas are loca-ted in the US, Europe, the Middle East and the FarEast. The areas where we experience the strongestincreases in production are in the Middle East andthe Far East, whilst we see the strongest growth indemand for chemicals in the Far East area. It is esti-mated that this area will have an average annualgrowth of 8% in GNP for the period up to year2000. In developing countries, the growth in che-mical demand is normally superseding the GNPgrowth by a factor of 2,5, which indicates verystrong demand for both imported as well as regionalproduction of chemicals.
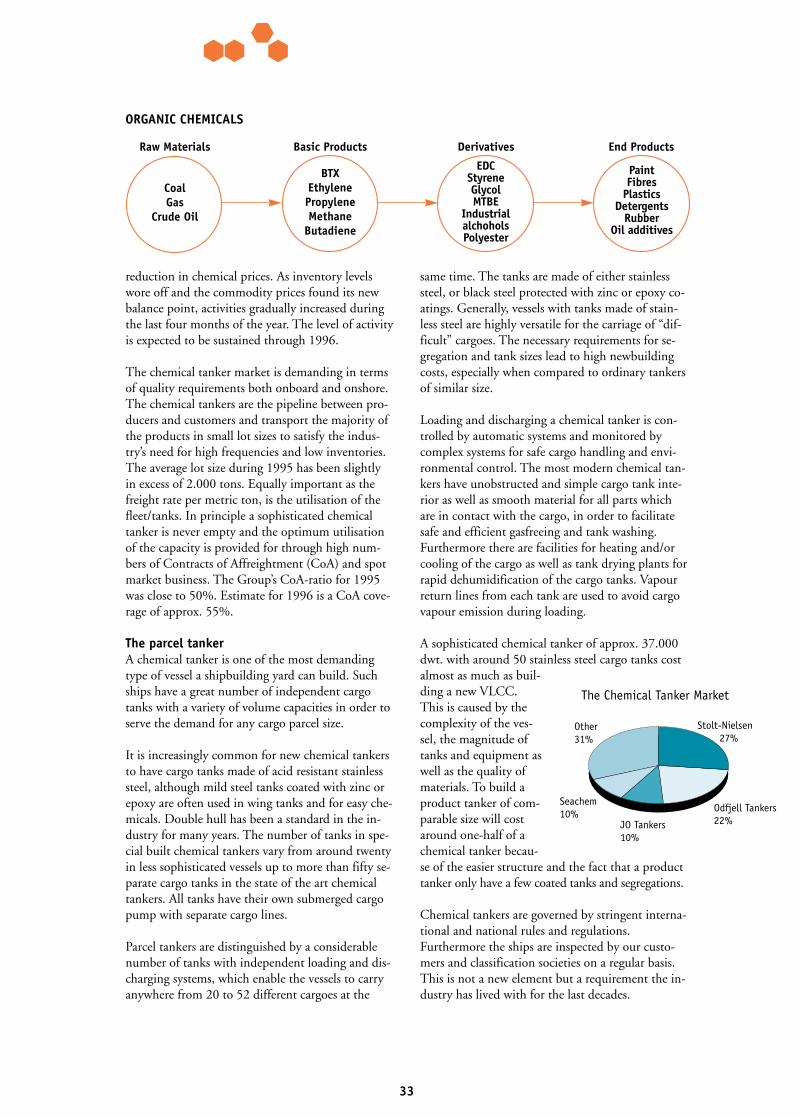
In the pure chemical carrier segment of the parcelbusiness there are four major operators representingabout 70% of the capacity. Storli, through OdfjellTankers, has about 22% of the total market capacityand ranks as number two in this market segment.The Storli group is serving the chemical industryglobally being one of only two groups providingworld-wide services.
The company has expanded its total annual capacityby 5,5 vessels through 1995, which capacity hasbeen added by way of newbuildings. Over the nextthree years, the new contracted tonnage into this
segment represents about 16% of the existing fleet.Storli and its pool partner NCC have six more new-buildings coming through 1998, which represents15% of the present fleet capacity.
The state of the chemical tanker market is a balancebetween supply and demand. It is normally the sup-ply side which impacts the markets at the negativeend. As we have seen an average growth in transpor-tation of chemicals exceeding 5% annually over thepast 15 years, we have seen the earnings being seve-rely impacted by an oversupply of tonnage in thisperiod. The size of the chemical tanker fleet doub-led from 1981 to 1986; from about 3 million dwt.to 6 million dwt., counting vessels from 8.000 dwt.up to 40.000 dwt., a fact that took the chemicaltanker market through the worst times of this in-dustry. Over the past 10 years there has been a slo-wer increase in tonnage, though the recent years’newbuilding programmes are now starting to im-pact the supply side. The comparable fleet is now atabout 8 million dwt. As we are entering the end ofthe 1990’s, the activity on the scrapping side will beequally important as the new additions to balancethe growth. We do, however, not foresee any dis-tinct growth in scrapping as long as the freight mar-ket maintains its present level.
In 1995 the Storli Group transported close to 10million tons of cargo consisting of about 4.500 par-cels and 400 different products, mainly within thecategories of organic and inorganic chemicals aswell as vegetable oils and clean petroleum products.Odfjell Tankers/Storli operates a fleet of 47 vesselswith an aggregated dead-weight of approx. 1,5 mil-lion dwt. The average age is 12,5 years.
The activity level through the year has been some-what unstable with the best activity during the firstfour months. The very strong trade that broughtboth products prices and freight levels to a high le-vel during the last four months of 1994 and the firstfour months of 1995, faded off during the middleof the year. The reason being full inventories and a
THE CHEMICAL TANKER MARKET
33
reduction in chemical prices. As inventory levelswore off and the commodity prices found its newbalance point, activities gradually increased duringthe last four months of the year. The level of activityis expected to be sustained through 1996.
The chemical tanker market is demanding in termsof quality requirements both onboard and onshore.The chemical tankers are the pipeline between pro-ducers and customers and transport the majority ofthe products in small lot sizes to satisfy the indus-try’s need for high frequencies and low inventories.The average lot size during 1995 has been slightlyin excess of 2.000 tons. Equally important as thefreight rate per metric ton, is the utilisation of thefleet/tanks. In principle a sophisticated chemicaltanker is never empty and the optimum utilisationof the capacity is provided for through high num-bers of Contracts of Affreightment (CoA) and spotmarket business. The Group’s CoA-ratio for 1995was close to 50%. Estimate for 1996 is a CoA cove-rage of approx. 55%.
The parcel tankerA chemical tanker is one of the most demandingtype of vessel a shipbuilding yard can build. Suchships have a great number of independent cargotanks with a variety of volume capacities in order toserve the demand for any cargo parcel size.
It is increasingly common for new chemical tankersto have cargo tanks made of acid resistant stainlesssteel, although mild steel tanks coated with zinc orepoxy are often used in wing tanks and for easy che-micals. Double hull has been a standard in the in-dustry for many years. The number of tanks in spe-cial built chemical tankers vary from around twentyin less sophisticated vessels up to more than fifty se-parate cargo tanks in the state of the art chemicaltankers. All tanks have their own submerged cargopump with separate cargo lines.
Parcel tankers are distinguished by a considerablenumber of tanks with independent loading and dis-charging systems, which enable the vessels to carryanywhere from 20 to 52 different cargoes at the
same time. The tanks are made of either stainlesssteel, or black steel protected with zinc or epoxy co-atings. Generally, vessels with tanks made of stain-less steel are highly versatile for the carriage of “dif-ficult” cargoes. The necessary requirements for se-gregation and tank sizes lead to high newbuildingcosts, especially when compared to ordinary tankersof similar size.
Loading and discharging a chemical tanker is con-trolled by automatic systems and monitored bycomplex systems for safe cargo handling and envi-ronmental control. The most modern chemical tan-kers have unobstructed and simple cargo tank inte-rior as well as smooth material for all parts whichare in contact with the cargo, in order to facilitatesafe and efficient gasfreeing and tank washing.Furthermore there are facilities for heating and/orcooling of the cargo as well as tank drying plants forrapid dehumidification of the cargo tanks. Vapourreturn lines from each tank are used to avoid cargovapour emission during loading.
A sophisticated chemical tanker of approx. 37.000dwt. with around 50 stainless steel cargo tanks costalmost as much as buil-ding a new VLCC.This is caused by thecomplexity of the ves-sel, the magnitude oftanks and equipment aswell as the quality ofmaterials. To build aproduct tanker of com-parable size will costaround one-half of achemical tanker becau-se of the easier structure and the fact that a producttanker only have a few coated tanks and segregations.
Chemical tankers are governed by stringent interna-tional and national rules and regulations.Furthermore the ships are inspected by our custo-mers and classification societies on a regular basis.This is not a new element but a requirement the in-dustry has lived with for the last decades.
Paint Fibres
PlasticsDetergents
RubberOil additives
EDCStyreneGlycolMTBE
IndustrialalchoholsPolyester
BTXEthylenePropyleneMethane
Butadiene
CoalGas
Crude Oil
Raw Materials
ORGANIC CHEMICALS
Basic Products Derivatives End Products
The Chemical Tanker Market
Stolt-Nielsen27%
Odfjell Tankers22%JO Tankers
10%
Seachem10%
Other31%

34
Baytank - Houston, USABaytank is a tank terminal for the distribution andstorage of bulk chemicals, strategically located at theentrance to the Houston ship channel, one of themajor hubs of the world for the production and ex-port of chemicals.
Baytank services both vessels, barges, rail-cars andtrucks and is a state-of-the-art terminal designed inaccordance with the highest standards of safety,quality and flexibility. Baytank is particularly uni-que with respect to its pressurised tanks, the nitro-gen compensation system as well as an advanced va-pour-return system. Baytank has permission tohandle and store more than 600 different chemicals.The terminal is highly flexible with its deepwaterdocks with continuous concrete aprons. Baytankalso has bunkering facilities.
The terminal consists of 65 tanks ranging in sizefrom 350 cbm to 9,000 cbm, and has a total capaci-ty aggregating 171,000 cbm. The tanks are made ofstainless steel, or black steel protected with zinc orepoxy coatings. So far the total investment amounts
to more than USD 120 million. Unused land, andthe considerable investment already made in theBaytank terminal infrastructure, provide good opp-ortunities for further expansion. Within the existingarea Baytank has the potential storage capacity ofabout 350,000 cbm.
The American petrochemical industry experienced ahealthy 1995. Improvement in the World economyresulted in an increase in export of chemicals out ofthe Houston area. Import of chemicals also increasedand we expect this tendency to continue as a conse-quence of further regional specialisation globally.
Baytank made a profit of USD 2.9 mill., comparedto USD 1.3 mill. in 1994.
The terminal had high level of activity with close to100 per cent occupancy rate throughout the year.Throughput traffic from railcars to vessel increasedin 1995 as compared to previous years. The numberof vessels and barges handled was higher in 1995than in 1994. Traffic from railcars was at the samelevel as the year before while the number of tank-
TANK TERMINALS
For a large and global business there are synergies between the operation of ships and theoperation of terminals. This is particularly the case in newly industrialised countrieswhere the infrastructure is often inadequate. Investment in tank terminals in these areasprovides an opportunity to enter the market at an early point. In addition, such invest-ments will produce increased transport volumes, which in turn will have an impact onthe utilisation and profitability of the vessels. Customers will also experience a considera-ble synergy.
Work in progress to complete Bay 14 at Baytank.

35
trucks increased substantially. Total volume whichwent through the terminal was up 16 per cent ascompared to 1994.
Two new stainless-steel pressurised tanks came online in May 1995. These tanks are build based on along term contract with PMI, Mexico. A new rail-car scale as well as 1,800 foot of new rail tracks hasbeen built in connection with this expansion.During the spring of 1995 we decided to completeBay 14 with the construction of 6 new tanks. Theconstruction started in the summer of 1995 and isexpected to be operational in September 1996. Thisexpansion together with the two PMI tanks repre-sent an increase in capacity of approx. 22.5 percent. The expansion is based on Baytank’s philo-sophy to be concerned with safety and environmen-tal issues.
In addition to performing general terminal services,Baytank has an important function in our cargoconsolidation programme to reduce vessel laytimein port. This increases vessel turnaround in port,which in turn enhances the productivity of ourships. Baytank also functions as a "home base" forOdfjell Tankers in the US Gulf area. This synergyconcept was confirmed through several joint trans-portation-/terminal projects during 1995.
The development of Baytank’s organisation as wellas improved cost control had high priority during1995. The organisation has during the last years de-veloped it’s own Total Quality Management systemand was awarded the ISO 9002 certification fromDnV in September 1995.
Baytank achieved the following result in 1995,compared with the last two years:
(USD MILL.) 1995 1994 1993Revenue 23.2 20.3 19.1Expenses (13.6) (12.4) (11.5)Depreciation (3.2) (3.0) (2.9)Operation result 6.4 4.9 4.7Net interest (3.5) (3.6) (3.5)Result 2.9 1.3 1.2
VOTTN - Ningbo, China1995 was the first full year of operation, and thecompany already has largely succeeded in establis-hing itself as a terminal of high standards. Ningbo isdeveloping into an important chemicals transitpoint for the Shanghai area with total imports ofapprox. 420,000 tons in 1995.
Storli's share of the profit for 1995 was a satisfyingUSD 330,000. The positive result was achieved onaccount of extensive demand for storage capacity.However, the demand subsided somewhat towardsthe end of the year. It has been decided that the ter-minal capacity should be increased from 24,400cbm plus to 65,450 cbm. Completion of this expan-sion is planned for 1997. In 1995 Storli increased itsstake in the terminal from 10 to 12.5 per cent.
DMTTC - Dalian, ChinaIn order to participate in the anticipated growth inChina, the company decided to invest in yet anotherChinese terminal - at Dalian in the northern part ofthe country. In the future, Dalian will become animportant point of consolidation for our shippingactivities in the Far East.
The Chinese authorities have selected Dalian as oneof four main harbours to benefit from considerableinvestment in the infrastructure. Its favourable geo-graphical location means the terminal will be a ser-vice centre for distribution in northern and mid-China, as well as an important point of transit in agrowing Intra Far East market.
In its first stage the terminal will have a capacity ofapprox. 60,000 cbm in 35 tanks. The terminal willbe named Dalian Marine Tank Terminal Company.Total investments for the first stage of constructionwill be around USD 30 mill.
The terminal will be built in compliance with strictquality and environmental requirements with dueregard to safety and efficiency. With our 44 per centstake, Storli is the main shareholder, and will be re-sponsible for the terminal's development, technolo-gy and operation. In addition to Storli, the otherparticipants in this project will be Dalian PortAuthority, Mitsui & Co. Ltd. and Van Ommeren.
It is planned that the terminal will start operating in1997.


37
FLEET OVERVIEW - ODFJELL TANKERS
STAINLESS NUMBERSTORLI'S VESSELS YEAR BUILT DWT CBM STEEL CBM OF TANKSBow Clipper 1995 37 250 41 200 34 100 52Bow Fagus 1995 37 250 41 200 34 100 52Bow Flower 1994 37 250 41 200 34 100 52Bow Fortune 1975 28 060 34 756 21 136 43Bow Sea 1978 28 060 34 756 21 136 43Bow Sky 1977 28 060 34 756 21 136 43Bow Spring 1976 28 060 34 756 21 136 43Bow Star 1976 28 060 34 756 21 136 43Bow Sun 1977 28 060 34 756 21 136 43Bow Lady 1978 32 300 41 354 3 077 42Bow Princess 1976 32 300 42 278 1 400 42Bow Queen 1975 32 300 41 887 816 42Bow Fighter 1982 35 100 41 193 6 353 34Bow Heron 1979 35 100 42 107 5 884 31Bow Lancer 1980 35 100 42 476 6 253 34Bow Leopard 1988 40 263 47 593 - 29Bow Lion 1988 40 263 47 593 - 29Bow Panther 1986 40 263 47 593 - 29Bow Eagle 1988 24 700 32 458 19 663 25Bow Hunter 1983 23 077 25 002 21 009 28Bow Pioneer 1982 23 077 25 002 21 009 28Bow Mariner 1982 39 800 47 965 - 28Bow Petros 1984 39 800 47 965 - 28Bow Transporter 1983 39 800 47 965 - 28Bow Saphir 1982 18 657 22 929 10 849 31Bow Viking 1981 33 695 40 593 21 745 36Bow Explorer 1975 31 500 36 683 - 34Owl Trader 1982 12 450 14 482 8 070 22Number of vessels: 28 889 655
TIME-CHARTERED VESSELSBow Gerd 1975 31 500 36 683 - 34Lady Ina 1975 31 500 36 683 - 34Bow Trader 1969 21 723 22 972 17 842 26Bow Tribute 1995 41 330 48 746 - 20Bow Trident 1992 41 330 48 746 - 20Bow Trigger 1993 41 330 48 746 - 20Bow Triumph 1992 41 330 48 746 - 20Chuy 1983 24 083 28 765 14 244 27Number of vessels: 8 274 126
VESSELS ON MANAGEMENT/POOL-BASISNCC Riyad 1995 37 250 41 200 34 100 52NCC Mekka 1995 37 250 41 200 34 100 52NCC Jizan 1976 28 060 34 756 21 136 43NCC Jouf 1976 28 060 34 756 21 136 43NCC Madinah 1976 28 060 34 756 21 136 43NCC Najran 1976 28 060 34 756 21 136 43NCC Tihamah 1977 28 060 34 756 21 136 43NCC Yamamah 1977 28 060 34 756 21 136 43NCC Baha 1988 24 700 28 291 19 663 21NCC Arar 1982 23 077 25 002 21 009 28NCC Asir 1983 23 077 25 002 21 009 28Number of vessels: 11 313 714Total number of vessels: 47 1 477 495
NEWBUILDINGS YARD OWNER DWT DELIVERYYard no. 132 Florø Storli 37 250 4/1996Yard no. 133 Florø NCC 37 250 11/1996Yard no. 134 Florø Storli 37 250 5/1997Yard no. 135 Florø Storli 37 250 11/1997Yard no. 136 Florø Storli 37 250 5/1998Yard no. 137 Florø Storli 37 250 11/1998Option Florø Storli 37 250 5/1999Option Florø Storli 37 250 11/1999

38
ADR: American Depository Receipt - an exchange system for foreign sha-res in the USA.
BALLAST: A voyage with no cargo on board to get a ship in position fornext loading port or dry docking.
BALLAST TANK: A tank that is filled with sea water when a vessel sails inballast, or in order to provide stability.
BARGING: Transfer of cargo to/from a ship from/to a barge.
BROKER: An independent intermediary who negotiates freight contractsbetween owners and charterers as well as the sale and purchase of vessels.
BUNKERS/BUNKERING: Fuel, to power a ship's engine. Bunkering isto take on board bunkers.
CAP: Condition Assessment Program, Det norske Veritas' voluntary ra-ting system for vessels describing and quantifying the standard of a vessel.
CHARTER PARTY (C/P): Agreement between a shipowner and a charte-rer, outlining terms and conditions governing the transportation. Theagreement may be for one or several voyages, or for a certain period oftime.
CHARTERER: The party paying for the transportation. It may be thecargo owner, supplier or receiver of the cargo.
CLASSIFICATION SOCIETY: An independent international organisati-on, e.g. Det norske Veritas, controlling and verifying that the technicalcondition, the safety and quality of a vessel complies with its own rules, aswell as those of national authorities.
COATING: Paint protecting the inside of a vessel's tanks. Usually epoxyor zinc based paints.
COFR: Certificate of Financial Responsibility. Certificate required by USCoast Guard for tonnage transporting oil products in the US economiczone (due to OPA 90). The certificate confirms that the owner can coverthe full financial responsibility up to a specified maximum amount for anypollution caused by the owner’s ships in US waters.
CONTRACT OF AFFREIGHTMENT (COA): An agreement betweenan owner and a charterer to transport given quantities of cargo during agiven period of time. The owner is basically free to decide whichever vesselhe will use.
DAILY COSTS: Expenses for crew as well as all other expenses directlyconnected with the running of the vessel, including insurance.
DEMURRAGE: Compensation paid by the charterer, supplier or receiverof the cargo for each day or pro rata for time spent in port during loa-ding/discharging, in excess of the laytime stipulated in the Charter Party.
DOUBLE HULL: The ship has an inner and an outer hull. The distancebetween these two can be up to 2 meters. Such construction increases thesafety during a possible grounding or collision. In this way leakage can beavoided. The double hull is also used for ballast.
DRY DOCK: Putting a vessel into a dry dock for inspection and repairs ofunderwater parts, and painting of vessels bottom. Done on a regular basis.
FREIGHT RATE: Agreed transportation cost, stipulated either per metricton of cargo, cubic meter of cargo or as a lump sum for the total cargo.
GATT: General Agreement on Tariffs and Trade. International free-tradeagreement.
IMO: International Maritime Organisation. The international UN adviso-ry body on transport by sea.
INORGANIC CHEMICALS: Chemicals which molecular structure con-tain no carbon atoms (other than as part of a carbonate-group), and arederived from sources other than hydrocarbons, such as sulphuric acid,phosphoric acid and caustic soda.
ISMC: International Safety Management Code. The first formalised initi-ative by IMO to provide a universal standard for the safety managementsystems of ships. Planned to be implemented by all countries by June1998.
KNOT: A measure of the speed of the vessel. 1 knot= 1 nautical mile perhour, that is 1,85 km/h.
MARPOL: The International Conventions governing Marine PollutionPrevention. It is a part of IMO.
M/T: Motor Tanker.
NAFTA: North American Free Trade Agreement. Free trade commonmarket consisting of Canada, the USA, Mexico and Chile.
NET REVENUE FROM SHIP OPERATION: Gross freight revenuesminus voyage costs. Usually expressed in USD per day.
OECD: Organization for Economic Cooperation and Development, aninformation-gathering body. The 24 members are mainly industrialisedcountries in Western Europe, North America and the Asia/Pacific region.
OFF-HIRE: The time a vessel according to the charter party is not gain-fully employed and not generating an income for its owner (e.g. time usedfor repairs).
OPA-90: The US Oil Pollution Act of 1990. An American federal law thatimposes far reaching requirements on shipping companies, vessels andcrews when trading in US waters.
OPERATOR: A person in a shipping company whose duties amongst ot-her things is to take care of the contact between the ship and the charterer,give instructions to the ship and the port agents concerning loading anddischarging of cargo, and arranging purchase of bunkers etc.
ORGANIC CHEMICALS: Chemicals containing carbon, and normallyderived from hydrocarbon sources, usually either crude oil, natural gas orcoal. Often referred to as petrochemicals. Can be further divided into aro-matic hydrocarbons, alcohols and glycols, monomers and esters, phenols,halogenated compounds, ketones, and saturated hydrocarbons.
PARCEL TANKER: Tanker designed for the transportation of several dif-ferent cargoes simultaneously.
POOL: A co-operation between owners putting their vessels into a jointoperation where net revenues are divided between the partners accordingto a predetermined key.
SEAQ: Stock Exchange Automated Quotation. System for purchase andsale of foreign shares, operated by the London Stock Exchange.
SEGREGATION: The division of a ship's cargo space into individualtanks.
SEP: Safety and Environmental Protection, classification system used byDet norske Veritas.
SHIP MANAGEMENT: The administration of a vessel, including servi-ces like technical operation, maintenance, crewing and insurance.
SPOT RATE: Freight rate for a voyage agreed on the basis of current mar-ket level.
TIME CHARTER (T/C): The ship owner hires out a vessel completewith the crew for a fee, payable as a specific sum per day or a specific sumper dwt per month. The party that hires the vessel pays for bunkers, portand canal charges and any other voyage related costs.
TON: A gross registered ton is a volume of 100 cubic feet (2,83 cubic me-ters). Gross registered tonnage is basically the volume of the ship's closedareas, excluding the bridge, the galley and a few other rooms. Net registe-red tonnage is the gross tonnage less volumes needed for the operation ofthe ship (deck storage room, engine room etc.), i.e. the volume availablefor cargo. A deadweight ton (dwt) is a measure of the weight carrying ca-pacity of the ship, and the total dwt is the weight of the cargo the ship cancarry plus bunkers, fresh water, spare parts etc.
TRADE: The geographical area where a ship mainly trades.
TRADING DAYS: The number of days a ship is not off-hire.
VOYAGE CHARTER: The transportation of cargo from the port(s) of lo-ading to the port(s) of discharge. Payment is normally per ton of cargo,and the ship owner pays for bunkers, port and canal charges and othervoyage related costs.
VOYAGE COSTS: Expenses directly related to the voyage, such as bun-kers, port charges, canal dues, etc.
GLOSSARY

39
BERGEN, NORWAYSkibsaksjeselskapet StorliConrad Mohrs veg 295032 Minde, NorwayTel: (47) 55 27 00 00Fax: (47) 55 28 47 41Tlx: 42060 odshp n
Odfjell Tankers KSConrad Mohrs veg 295032 Minde, NorwayTel: (47) 55 27 00 00Fax: (47) 55 28 84 20Tlx: 42060 odshp n
Odfjell Chartering KSConrad Mohrs veg 295032 Minde, NorwayTel: (47) 55 27 10 00Fax: (47) 55 28 25 65Tlx: 42666 minde n
HOUSTON, USABaytank (Houston) Inc.12211 Port RoadSeabrook, TX 77586, USATel: (713) 474 4181Fax: (713) 474 9725Tlx: 791202
Odfjell Tankers (USA) Inc.12211 Port RoadSeabrook, TX 77586, USATel: (713) 474 9300Fax: (713) 474 9107Tlx: 3750234 ot hou
LONDON, ENGLANDOdfjell Tankers - UK representativeFlat 502, Carrington House6 Hertford StreetLondon W1Y 7TP, EnglandTel: (44171) 409 7813Fax: (44171) 493 7041
ROTTERDAM, THE NETHERLANDSOdfjell Tankers B.V.Puntweg 6, P.O. Box 1403200 A.C. Spijkenisse, The NetherlandsTel: (31181) 619 444Fax: (31181) 620 281Tlx: 29547
TOKYO, JAPANOdfjell Tankers (Japan) Ltd.Ogawa Bldg. 8F2-2 Uchikanda 1-ChomeChiyoda-ku, Tokyo 101, JapanTel: (813) 3259 8555Fax: (813) 3259 8558Tlx: 2226883 odfjt j
SINGAPOREOdfjell Tankers (S) Pte. Ltd.70 Shenton Way# 18-02/03 Marina HouseSingapore 079188Tel: (65) 225 1466Fax: (65) 224 2285Tlx: 33787
SYDNEY, AUSTRALIAOdfjell Tankers Australasiac/o P & O AustraliaGPO Box 3988Sydney NSW 2001, AustraliaTel: (612) 364 8980Fax: (612) 364 8998Tlx: 25813
DURBAN, SOUTH AFRICAOdfjell TankersSuite 1100 Victoria Maine71 Victoria EmbankmentP.O. Box 690Durban 4001, South AfricaTel: (2731) 304 4676Fax: (2731) 304 4318Tlx: 621982 odfjl sa
BUENOS AIRES, ARGENTINAAgencia Maritima Tagsa S.A.25 de Mayo 555 - 22nd Floor1002 Buenos Aires, ArgentinaTel: (541) 313 7837Fax: (541) 313 4619Tlx: 27015 tagma ar
SAO PAULO, BRAZILOdfjell Tankers (Brasil) Ltda.Av. Paulista 460 - 18 andarCEP 01310-904 Sao Paulo SP,BrazilTel: (5511) 251 2534Fax: (5511) 287 8747Tlx: 1131220
SAN ANTONIO, CHILETerquim S.A.Molo Sur s/nCasilla 148San Antonio, ChileTel: (5635) 211 050Fax: (5635) 211 161Tlx: 338002
RIYADH, SAUDI ARABIANational Chemical Carriers Ltd.Room 301, 3rd Floor, Akariyah Bldg No 1Sitteen Street, Malaz AreaP.O. Box 8931Riyadh 11492, Saudi ArabiaTel: (9661) 477 3934Fax: (9661) 476 4328Tlx: 405627 nachca sj
DUBAI, UNITED ARAB EMIRATESSharaf Shipping AgencySharaf BuildingAl Mankhool RoadP.O. Box 576, Dubai, UAETel: (9714) 520 555Fax: (9714) 520 531Tlx: 46608 sharaf em
NEW DELHI, INDIAOdfjell Tankers IndiaB-364 Chittaranjan ParkNew Delhi 110019, IndiaTel: (9111) 643 4621Fax: (9111) 642 5204Tlx: 31-70005 otd in
BOMBAY, INDIAOdfjell Tankers India16/C-2 Poonam Vihar - BPoonam Nagar, Andheri (East)Bombay 400093, IndiaTel: (9122) 821 6811Fax: (9122) 821 3984Tlx: 11-79037 ostb in
ADDRESSES
Phot
o: A
rne
Sv. To
klum

Cons
ulti
ng &
des
ign
by G
eelm
uyde
n.Ki
ese,
Osl
o

Table of ContentsOverviewSummary 1995Key figuresReport of the Board of DirectorsIncome StatementBalance SheetCash Flow AnalysisNotesShareholders Policy
••••••••••
••••••••••
SKIBSAKSJESELSKAPET
ANNUAL REPORT
95
STORLI
1995
STORLISTORLI