storm clouds gathering - world bankdocuments.worldbank.org/curated/en/...figure 1.31: trade...
TRANSCRIPT

The economy facing strong headwindswith a special focus on Public Participation
June 2015 | Edition No. 12
Storm Clouds Gathering
Pub
lic D
iscl
osur
e A
utho
rized
Pub
lic D
iscl
osur
e A
utho
rized
Pub
lic D
iscl
osur
e A
utho
rized
Pub
lic D
iscl
osur
e A
utho
rized


Storm Clouds GatheringThe economy facing strong headwinds
with a special focus on Public Participation


TABLE OF CONTENTS
ABBREVIATIONS AND ACRONYMS .................................................................................................................... i
FOREWORD ......................................................................................................................................................... ii
ACKNOWLEDGEMENTS ..................................................................................................................................... iii
MAIN MESSAGES AND KEY RECOMMENDATIONS ............................................................................................ iv
EXECUTIVE SUMMARY ...................................................................................................................................... v
THE STATE OF KENYA’S ECONOMY ..................................................................................................................... 11. Economic Performance in 2014 ....................................................................................................................... 2
1.1 Growth remained solid .............................................................................................................................. 21.2 Fiscal expansion continued ........................................................................................................................ 61.3 The Central Bank of Kenya responded to pressure from the real and external sectors by raising its benchmark rate .......................................................................................................................................... 111.4 The external sector remains vulnerable ..................................................................................................... 14
2. Growth Outlook for 2015–17 .......................................................................................................................... 192.1 Kenya’s growth prospects continue to be favorable ................................................................................. 202.2 Lack of security is taking a toll on Kenya’s economy ................................................................................. 212.3 The transmission of lower global oil prices in 2014/15 to the domestic economy was poor ................... 222.4 Risks to growth remain significant in the near term ................................................................................. 232.5 Several policy issues need addressing in the medium term ...................................................................... 26
3. Special Focus: Enabling the Voices of Citizens ................................................................................................ 293.1 Devolution to the counties has the potential to improve service delivery ................................................ 303.2 Social accountability is critical to making devolution work ...................................................................... 313.3 What has been the experience of counties in implementing public participation? .................................. 383.4 How can public participation be enhanced? .............................................................................................. 47
REFERENCES ........................................................................................................................................................ 51
ANNEXES ............................................................................................................................................................. 53
LIST OF FIGURESFigure 1: The number of tourists has declined, reducing travel credits in the balance of payments ........ viiFigure 2: A large percentage share of the budget goes to security ........................................................... viiiFigure 3: Citizens believe that devolution provides more opportunities than risks ................................... ixFigure 1.1: Growth slowed in 2014 but remained solid ................................................................................ 2Figure 1.2: Average growth in Kenya was above the average for Sub-Saharan Africa and lower-middle- income countries in 2011–14 ..................................................................................................... 3Figure 1.3: All sectors contributed to growth in 2014 .................................................................................. 3Figure 1.4: Production of tea—Kenya’s main export—grew, but earnings from exports declined................ 4Figure 1.5: Electricity generation increased in 2014, despite a significant decline in hydropower generation 4Figure 1.6: Services grew significantly, despite the deep decline in the accommodations and restaurant subsector .................................................................................................................................... 5Figure 1.7: The volume and value of mobile payments continued to exceed expectations ......................... 5Figure 1.8: Investment recovered in 2014 .................................................................................................... 5Figure 1.9: Inflation remained below the central bank target ...................................................................... 6
Figure 1.10: Food price rises have been a major driver of overall inflation ....................................................... 6Figure 1.11: Kenya’s fiscal position is expected to continue to weaken ............................................................. 7Figure 1.12: The central government remains the main driver of public expenditure ...................................... 7Figure 1.13: Kenya’s public borrowing has not compromised its debt stock targets ......................................... 8Figure 1.14: Revenues declined in 2014/15 ....................................................................................................... 9Figure 1.15: Infrastructure sector accounted for a larger share of the budget, but executed almost a half ..... 9Figure 1.16: Overall implementation was pulled back by energy sector ........................................................... 9Figure 1.17: More emphasis was put on priority sectors in 2014/15 ................................................................ 10Figure 1.18: Despite significant improvement, execution of the development budget remained low .............. 11Figure 1.19: The interbank market has been volatile, albeit less than in 2011 ................................................. 11Figure 1.20: The central bank rate continues to coordinate short-term rates, despite volatility in the money market ............................................................................................................................................ 12Figure 1.21: Long-term interest rates declined in response to the Central Bank’s monetary policy stance, albeit very slowly ........................................................................................................................... 12Figure 1.22: Monetary operations slowed the growth of monetary aggregates ............................................... 13Figure 1.23: Credit to the agriculture and manufacturing sectors increased, while credit to services declined 13Figure 1.24: Loans are concentrated in three nonproductive sectors ............................................................... 13Figure 1.25: The volume of nonperforming loans increased in most sectors .................................................... 14Figure 1.26: The banking sector continued to experience strong growth .......................................................... 14Figure 1.27: Lower growth prospects and depreciation risk reduced the attractiveness of the Nairobi Securities ....................................................................................................................................... 14Figure 1.28: The current account deficit remained very high ............................................................................ 15Figure 1.29: Exports continued to underperform, and imports remained high ................................................. 15Figure 1.30: Exports continued to stagnate against imports .............................................................................. 15Figure 1.31: Trade indicators have been weakening .......................................................................................... 16Figure 1.32: The Eurobond proceeds enhanced official flows in 2014, but short-term flows still dominate ..... 16Figure 1.33: Foreign exchange reserves have grown, cushioning Kenya from short-term shocks ..................... 16Figure 1.34: Remittances are the single most important source of foreign exchange inflows in Kenya ............ 17Figure 1.35: The foreign exchange market has been volatile, albeit not as volatile as in 2011 ......................... 17Figure 1.36: Despite recent volatility, the real exchange rate continued to appreciate ..................................... 18Figure 2.1: The outlook for economic growth in Kenya is robust .................................................................... 19Figure 2.2: The number of tourists declined,reducing travel credits in the balance of payments .................. 20Figure 2.3: National security is one of the largest sectors in the 2015/16 budget .......................................... 21Figure 2.4: The volume of oil imports volume remained roughly constant between 2009 and 2013, but the value soared ............................................................................................................................ 22Figure 2.5: Kenya has a high current account deficit and a high fiscal deficit ................................................. 25Figure 2.6: Growth has been high during years of fiscal expansion linked to increases in public debt ........... 25Figure 2.7: Economic stimulus, elections, and devolution increased Kenya’s fiscal deficit ............................. 26Figure 2.8: Big fiscal programs have reduced fiscal space and increased debt ratios and vulnerability ......... 26Figure 3.1: Accountability needs to be both upward and downward ............................................................. 30Figure 3.2: Kenyans expect devolution to provide more opportunities than risks .......................................... 34Figure 3.3: Before devolution, Kenyans’ satisfaction with service provision was low ..................................... 34Figure 3.4: Most Kenyans now have a high or medium understanding of county responsibilities ................. 35Figure 3.5: Kenyans care most about roads and health services ..................................................................... 35Figure 3.6: Most Kenyans perceive that conditions under devolution have improved ................................... 37Figure 3.7: Open budget index scores vary widely across counties ................................................................ 39Figure 3.8: Citizen awareness and attendance at county government meetings has risen ............................. 42

LIST OF TABLESTable 1.1: Budget summary for 2015/16 budget ........................................................................................ 8Table 1.2: County governments’ budget framework, 2013/14–2014/15 ................................................... 10Table 2.1: Actual spending by ministries, departments, and agencies in the security sector ..................... 20Table 3.1: Governance indicators in selected countries in East Africa ........................................................ 32Table 3.2: Kenyans’ expectations of devolution .......................................................................................... 34Table 3.3: Frameworks to facilitate public communication and access to information .............................. 38Table 3.4: Types of county documents available online .............................................................................. 38Table 3.5: Number of countries surveyed providing adequate budget information ................................... 39Table 3.6: Structures established to facilitate citizen participation ............................................................. 41
LIST OF BOXESBox 1.1: Impact of China’s Slowdown in Kenya – A preliminary assessment ........................................... 24Box 3.1: What is social accountability? .................................................................................................... 29Box 3.2: Social accountability improved spending in several countries ................................................... 31Box 3.3: Maji Voice has increased accountability and customer satisfaction .......................................... 40Box 3.4: Nakuru County has launched various initiatives to improve civic education ............................. 43Box 3.5: Citizens in Baringo County achieved a more equitable distribution of resources ...................... 44


June 2015 | Edition No. 12 i
ABBREVIATIONS AND ACRONYMS
BOP Balance of PaymentsCBEF County Budget and Economic ForumsCBK Central Bank of KenyaCBR Central Bank RateCCTV Closed-Circuit Television CDF Constituency Development FundCIC Commission for the Implementation of the ConstitutionCPI Corruption Perception IndexCPIA Country Policy and Institutional AssessmentCSO Civil Society OrganizationDANIDA Danish International Development AgencyDRoPPs Drivers of Public ParticipationFDI Foreign Direct InvestmentsFOB Free on BoardFY Fiscal YearGDP Gross Domestic ProductICPAK Institute of Certified Public Accountants of KenyaICT Information Communication TechnologyIFC International Finance CorporationIFMIS Integrated Financial Management Information SystemIMF International Monetary FundKENGEN Kenya Electricity Generating CompanyKEU Kenya Economic UpdateKNBS Kenya National Bureau of StatisticsLATF Local Authority Transfer Fund MDA Ministries and State Department AgenciesMLAs Members of Local AssemblyNGO Non-Governmental OrganizationNSE Nairobi Securities ExchangeNSWSC Nairobi City Water and Sewerage CompanyPAYE Pay As You EarnPFM Public Financial ManagementSMS Short Message ServiceUS Unites StatesUSSD Unstructured Supplementary Service DataVAT Value Added Tax

June 2015 | Edition No. 12ii
It is my pleasure to present the 12th Edition of the Kenya Economic Update. The economic environment in 2015 which begun on a favorable footing is turning out to be challenging. With the Fed at the cusp of
changing its monetary stance, there is uncertainty in global financial markets. This has weakened global currencies and capital flows to emerging markets are being affected. These global developments are also being felt in Kenya. In the past, Kenya has managed economic shocks well. If Kenya succeeds in overcoming its ongoing economic challenges, including the crisis emanating from China, the government will be in a position to begin delivering the promise of a more prosperous future. Already, Kenya’s economy is expected to be among the best performers in Sub-Sahara Africa and low middle income countries.
This Economic Update (KEU edition 12) has four main messages. First, Kenya’s economic performance remains solid, underpinned by strong infrastructure spending and consumer demand. Growth in 2015 is estimated at 5.4 percent, a 0.6 percent downward revision from its estimate in December 2014. The revision reflects the strong headwinds the economy is facing in the foreign exchange market and the monetary policy response to calm those fears.
Second, the current expansionary fiscal path is not sustainable and presents a risk to growth. Although heavy infrastructural spending is a boon for Kenya’s production space and future growth, the short - to medium-term macro-fiscal framework is vulnerable to macroeconomic shock as fiscal space has been wiped out. The overall fiscal deficit of 8.3 percent in 2014/15 and a budgeted 8.7 percent in 2015/16 is high by any standard.
Third, county governments, with support from central authorities have made considerable progress towards implementing constitutional and legal provisions for transparency, accountability and participation. In the early stages, they prioritized the setting up of structures and systems to facilitate public participation. Counties have built communication frameworks, and established participatory forums as per legislative requirements. Beyond meeting the legislative requirements counties have adopted innovative initiatives to engage citizens. Much still needs to be done to ensure that proper and adequate mechanisms are put in place.
Lastly, the high cost of participation, the lack of administrative capacity and trained staff to implement participatory processes and tokenistic forms of participation continue to hinder effective citizen engagement. While most counties have taken steps to put in place communication systems, most county budgets are still not readily available to the public despite requirements of the PFM Act.
As in the past, we are proud to have worked with many Kenyan stakeholders during the preparation of this Kenya Economic Update. We hope that it will contribute to their discussions of policy issues that will contribute to helping Kenya grow, permanently reduce poverty, and bring shared prosperity to all Kenyans.
Diariétou GayeCountry Director for Kenya
World Bank
FOREWORD

June 2015 | Edition No. 12 iii
ACKNOWLEDGEMENTS
This Twelfth edition of the Kenya Economic Update was prepared by a team led by John Randa and Christopher Finch supervised by Apurva Sanghi. The core team consisted of Annette Omolo, Angélique
Umutesi, Christine Owuor, Barbara Karni, Angelina Musera. The team acknowledges contributions from Linda Odhiambo and Robert Waiharo.
The report benefitted from the insights of several peer reviewers including Thomas O’Brien, Apurva Sanghi, Kevin Carey, Simon Carl O’Meally, Paula Andrea Rossiasco, Leanne Michelle Bayer, Joseph Mansilla, Fulbert Tchana Tchana, and Prof. Terry Ryan.
The team also received overall guidance from Albert Zeufack (Practice Manager, Macroeconomic and Fiscal Management), Kevin Carey (Lead Economist, Macroeconomic and Fiscal Management), Thomas O’ Brien (Country Program Coordinator for Kenya, Rwanda, Uganda and Eritrea) and Diarietou Gaye (Country Director for Kenya, Rwanda, Uganda and Eritrea).
Partnership with key Kenyan policy makers was instrumental in the production of this report. On June 30, 2015, a draft of the report was presented at the 18th Quarterly Economic Roundtable. The meeting was attended by senior officials from the National Treasury, the Ministry of Devolution and Planning, the Central Bank of Kenya, the Kenya Revenue Authority, the Kenya Vision 2030, the Kenya Institute of Public Policy Research and Analysis, the International Monetary Fund, the Kenya National Bureau of Statistics, the National Economic and Social Council, the Office of the Controller of Budget, the Council of Governors, the Commission for the Implementation of the Constitution, the Kenya School of Government, and the Centre for Parliamentary Studies and Training.
MAIN MESSAGES AND KEY RECOMMENDATIONS
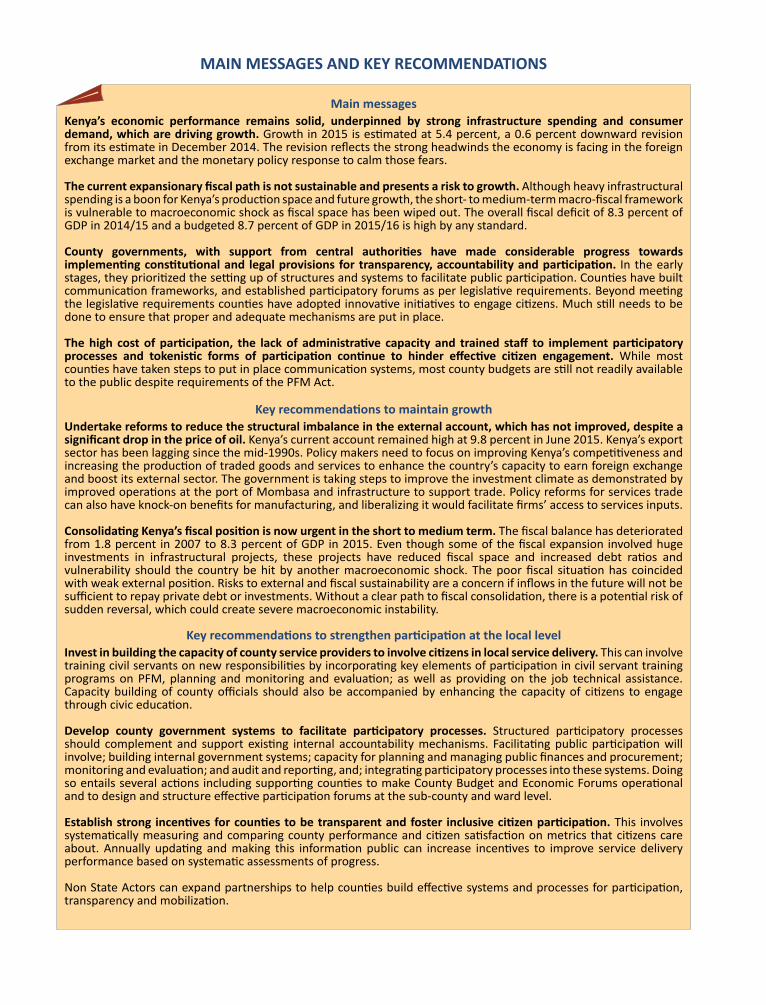
Main messagesKenya’s economic performance remains solid, underpinned by strong infrastructure spending and consumer demand, which are driving growth. Growth in 2015 is estimated at 5.4 percent, a 0.6 percent downward revision from its estimate in December 2014. The revision reflects the strong headwinds the economy is facing in the foreign exchange market and the monetary policy response to calm those fears.
The current expansionary fiscal path is not sustainable and presents a risk to growth. Although heavy infrastructural spending is a boon for Kenya’s production space and future growth, the short- to medium-term macro-fiscal framework is vulnerable to macroeconomic shock as fiscal space has been wiped out. The overall fiscal deficit of 8.3 percent of GDP in 2014/15 and a budgeted 8.7 percent of GDP in 2015/16 is high by any standard.
County governments, with support from central authorities have made considerable progress towards implementing constitutional and legal provisions for transparency, accountability and participation. In the early stages, they prioritized the setting up of structures and systems to facilitate public participation. Counties have built communication frameworks, and established participatory forums as per legislative requirements. Beyond meeting the legislative requirements counties have adopted innovative initiatives to engage citizens. Much still needs to be done to ensure that proper and adequate mechanisms are put in place.
The high cost of participation, the lack of administrative capacity and trained staff to implement participatory processes and tokenistic forms of participation continue to hinder effective citizen engagement. While most counties have taken steps to put in place communication systems, most county budgets are still not readily available to the public despite requirements of the PFM Act.
Key recommendations to maintain growthUndertake reforms to reduce the structural imbalance in the external account, which has not improved, despite a significant drop in the price of oil. Kenya’s current account remained high at 9.8 percent in June 2015. Kenya’s export sector has been lagging since the mid-1990s. Policy makers need to focus on improving Kenya’s competitiveness and increasing the production of traded goods and services to enhance the country’s capacity to earn foreign exchange and boost its external sector. The government is taking steps to improve the investment climate as demonstrated by improved operations at the port of Mombasa and infrastructure to support trade. Policy reforms for services trade can also have knock-on benefits for manufacturing, and liberalizing it would facilitate firms’ access to services inputs.
Consolidating Kenya’s fiscal position is now urgent in the short to medium term. The fiscal balance has deteriorated from 1.8 percent in 2007 to 8.3 percent of GDP in 2015. Even though some of the fiscal expansion involved huge investments in infrastructural projects, these projects have reduced fiscal space and increased debt ratios and vulnerability should the country be hit by another macroeconomic shock. The poor fiscal situation has coincided with weak external position. Risks to external and fiscal sustainability are a concern if inflows in the future will not be sufficient to repay private debt or investments. Without a clear path to fiscal consolidation, there is a potential risk of sudden reversal, which could create severe macroeconomic instability.
Key recommendations to strengthen participation at the local levelInvest in building the capacity of county service providers to involve citizens in local service delivery. This can involve training civil servants on new responsibilities by incorporating key elements of participation in civil servant training programs on PFM, planning and monitoring and evaluation; as well as providing on the job technical assistance. Capacity building of county officials should also be accompanied by enhancing the capacity of citizens to engage through civic education. Develop county government systems to facilitate participatory processes. Structured participatory processes should complement and support existing internal accountability mechanisms. Facilitating public participation will involve; building internal government systems; capacity for planning and managing public finances and procurement; monitoring and evaluation; and audit and reporting, and; integrating participatory processes into these systems. Doing so entails several actions including supporting counties to make County Budget and Economic Forums operational and to design and structure effective participation forums at the sub-county and ward level.
Establish strong incentives for counties to be transparent and foster inclusive citizen participation. This involves systematically measuring and comparing county performance and citizen satisfaction on metrics that citizens care about. Annually updating and making this information public can increase incentives to improve service delivery performance based on systematic assessments of progress.
Non State Actors can expand partnerships to help counties build effective systems and processes for participation, transparency and mobilization.

June 2015 | Edition No. 12 v
EXECUTIVE SUMMARY
Kenya’s economic performance remains solid, underpinned by strong infrastructure spending and consumer demand, which are driving growth. On the production side, growth from services,
electricity generation and a rebound in agriculture will drive growth in 2015. The World Bank estimates that growth will be 5.4 percent in 2015, a 0.6 percent downward revision of its estimate in December 2014. The revision reflects the strong headwinds the economy is facing in the foreign exchange market, the monetary policy response to calm those fears, and the fact that the effect of lower global oil prices on the wider economy was muted because of the depreciation of the shilling in 2015 and weak transmission into the wider economy. The revised figure is still higher than the average for both lower-middle-income countries and Sub-Saharan Africa. The risks to growth remain the same as in previous Updates except for Chinese devaluation which has heightened global risks. The external sector remains vulnerable to further shocks from weak global export demand exacerbated by weak doing business environment, the continued strengthening of the U.S. dollar, and the authorities’ response to those external risks. Preliminary analysis shows that the direct transmission from events in China to Kenya are minimal as the renminbi closely tracks the US dollar. While the fiscal deficit of 8.7 percent of GDP has raised concerns at the national level, it is the quality and transparency of spending that is paramount in the devolved system of government. Functional and political devolution to counties also seems beneficial for efficiency, as it provides incentives for county governments to deliver locally preferred services more efficiently, as the burden and benefits of public service delivery accrue in communities. Even though the benefits of devolution have not all been achieved and counties still going through a steep learning curve, a majority of Kenyans still support the devolved system of government despite the challenges being experienced in its implementation. Increasing public participation in budget information can help county governments become more efficient and targeted in the spending and reflect the voices of the people in their spending decisions.
Kenya’s economic growth continues to be robust. Strong consumption and investment demand
powered growth, as the economy grew 5.3 percent in 2014. Strong macroeconomic management kept overall and core inflation within the targeted level, while the foreign exchange market remained relatively stable. Lower oil prices spurred domestic consumption, which increased real incomes and aggregate demand. Ongoing infrastructure projects are having a catalytic impact on economic activities and increasing aggregate demand.
Investment spending rebounded. After having taken a wait and see attitude in 2013, investors were back in business in 2014. Real investment spending rebounded, driven by higher development spending on major infrastructural activities, such as the standard gauge railway, roads, and geothermal power generation. In the private sector, investors
built up inventories and made new investment in capital equipment to take advantage of declining interest rates.
Economic growth was broad based. Despite significant challenges at the start of the year, all productive sectors (agriculture, manufacturing, other industry, and service) contributed to overall growth in 2014. Agriculture, which is still critical to Kenya’s economic growth prospects, performed well. Inadequate rainfall led to higher food and electricity prices, but agriculture grew, albeit at a slower rate by growing at 3.5 percent. Despite higher electricity prices and continuing challenges in the business climate for investors, the manufacturing sector also grew by 3.4 percent. Other industry registered faster growth in 2014, driven by construction and electricity generation and growing by 11.0 percent. The services sector registered higher than

June 2015 | Edition No. 12vi
expected growth at 5.7 percent, despite significant declines in the accommodation and restaurant subsector in 2014, thanks to good performance in real estate, wholesale and retail, and information and communications technology (ICT). The mobile revolution is still ongoing, with mobile payment continuing to spur economic activity in terms of both employment and the volume of transactions.
Public debt remains sustainable. According to the latest IMF/World Bank debt sustainability analysis done in 2015, Kenya is at low risk of debt distress, with overall debt remaining sustainable in the medium term. Kenya’s external and total public debt are below the IMF/World Bank threshold over a 20-year horizon. The reorientation of public debt toward external debt is consistent with Kenya’s 2015 medium-term debt strategy, which aims to slow domestic debt growth in order to stabilize liquidity and reduce interest rates in domestic financial markets. Despite weakness in merchandise exports, exports of services and remittances are now more important to the economy. Services exports represent 53 percent of total exports of goods and services, with exports of nonfactor services playing a key role. Remittances are now the single most important source of foreign exchange inflows in Kenya, bringing in more than official development assistance. Kenya received $1.5 billion in remittances, equivalent to 2.4 percent of GDP, for the 12 months ending in June 2015. Remittances boost household consumption and investment. The property boom in Kenya and activity in the stock market has been attributed to remittances.
Reserves are sufficient to absorb short term shocks. Kenya has accumulated sufficient international reserves to cushion against short-term shocks. Reserves stood at US$7.2 billion in June 2015, equivalent to 4.6 months of import cover.
The economy faces headwinds in the near term, but the fundamentals for growth in the medium term are strong
The World Bank projects that Kenya will grow 5.4 percent in 2015 and 5.7 percent in 2016. These
estimates are 0.6 percent lower than projections made in the December 2014 Update. The revisions reflect the reassessment of risks associated with macroeconomic instability resulting from exchange rate volatility, inflationary threats associated with concerns about currency depreciation and delayed fiscal consolidation, balance of payment pressures, and the poor transmission of the effects of low oil prices. Growth is expected to pick up to 5.7 percent in 2016, supported by positive externalities from infrastructural projects currently being undertaken in the railways, roads, and energy subsectors.
Macroeconomic instability emanating from foreign exchange market volatility and fiscal policy concerns threaten to destabilize domestic prices, building inflationary pressure and slowing growth. The monetary policy decisions made in June and
July aimed primarily at containing inflation expectations and calming the markets. Yields on government securities and lending rates are expected to increase, raising returns on shilling-denominated assets. However, the policy rate increase may reduce aggregate consumption by households and firms and dampen aggregate demand. Should interest rate rise steeply, the impact on investment demand may be higher, slowing
overall growth. When this done, investment spending will also dampen thus the revision.
The current expansionary fiscal path is not sustainable and presents a risk to growth. The overall fiscal deficit rose from 4.5 percent of GDP in 2011/12 to 8.3 percent in 2014/15 and a budgeted 8.7 percent in 2015/16. Devolution is putting added pressure on the fiscal position, but it is the lack of rationalization of spending after
The mobile revolution is still ongoing, with
mobile payment continuing to spur economic activity in terms of both
employment and the volume of transactions
Executive Summary

June 2015 | Edition No. 12 vii
devolution, the duplication of functions at the national and county level, and the strong appetite for spending at both levels of government that have worsened Kenya’s fiscal position. Although heavy infrastructural spending is a boon for Kenya’s production space and future growth, the short- to medium-term macro-fiscal framework is vulnerable to a macroeconomic shock. Fiscal space has been wiped out, with public debt to GDP passing the 50 percent threshold in FY2015/16. The lack of fiscal consolidation is raising jitters in the market over whether Kenya has a twin deficit problem.
Volatility in the foreign exchange market has exposed Kenya’s vulnerability to the winding down of the U.S. monetary stimulus. Kenya’s economy has benefited immensely from the U.S. Federal Reserve’s stimulus, in terms of both short- and long-term capital flows. The volatility Kenya is experiencing has already forced the Central Bank of Kenya (CBK) to increase its benchmark rate to shore up the shilling. Yields on shilling-denominated assets have been high, outstripping the depreciation risks and large interest rate differentials, making Kenya a more attractive destination for world capital than many other emerging economies in Africa as a whole. With the ending of the Fed’s monetary stimulus, the flow of cheap capital that has been funding the current account could dry up, as investors build up their dollar-denominated assets, creating volatility in the foreign exchange market. The CBK’s action to raise interest rates could choke growth if investment demand declines. The strong dollar in 2015 has already partly offset the benefits of low international oil prices.
The devaluation of the renminbi/yuan in August created heighten uncertainty in the global financial markets but the transmission to Kenya remains weak. China's biggest currency intervention in August, 2015 jolted the world financial and equity markets. However, preliminary analysis of the Chinese slowdown show that the impact on Kenya is minimal as the Kenya Shilling has depreciated significantly against both the renminbi yuan and the US dollar. Against the US dollar and the Chinese
renminbi, Kenya shilling has depreciated 20 and 17 percent respectively. Trade transactions between China and Kenya (and wider EAC) is undertaken in US dollar, however, renminbi transactions are rare but available. Since the yuan loosely tracks the dollar, it has been dragged higher with the dollar. This implies Chinese goods in the region have become expensive as the regional currencies weakened against the US dollar and Chinese yuan. In nominal terms imports from China are 17-20 percent more expensive in local currency terms as the shilling has lost 17-20 percent of its value. Despite these developments Kenya’s imports from china are growing at about 40 percent.
The ongoing economic turbulence triggered by insecurity and market volatility in the foreign exchange market pose threats to Kenya’s prospects in the near term. Recurrent security threats have adversely affected the tourism sector and country risk assessments. Security concerns following terrorist attacks from al Shabaab have hit the tourism sector, a major foreign exchange earner and significant source of employment in Kenya. Multiple issuances of travel advisories by major tourist destinations significantly reduced the number of tourists in the first half of 2015, which declined 38 percent from a peak of 1.3 million in 2011 to 0.8 million in the year ending June 2015 (Figure 1). The travel advisories have since been lifted, but the change came too late for the peak season in the summer of 2015.
0
200
400
600
800
1,000
1,200
1,400
0
0.5
1.0
1.5
2.0
2.5
2009 2010 2011 2012 2013 2014 2015
Tour
ism
arr
ival
s (in
thou
sand
s)
Perc
ent o
f GDP
Travel credit, percent of GDP Tourism arrival
Figure 1: The number of tourists has declined, reducing travel credits in the balance of payments
Source: Central Bank of Kenya and Kenya National Bureau of Statistics.
Executive Summary

June 2015 | Edition No. 12viii
The negative impact of insecurity is not limited to the tourism sector; it also reduces confidence in the economy and country risk assessment by foreign investors, which may adversely affect foreign direct investment (FDI) and portfolio flows into the country.
The government has ramped up spending on security to address insecurity threat. The allocation to the security sector is among the largest in the budget, after energy, infrastructure and ICT, and education (Figure 2). Nominal allocations to national security (including internal security) has doubled since 2011/12 fiscal year. The increase aims to enable the government to strengthen security at its borders and throughout the country by investing in security infrastructure such as security installations and equipment, developing standards and guidelines for installation of integrated closed-circuit television (CCTV) systems in all urban buildings, undertaking a comprehensive training program on modern personnel management and policing, and investing in a modern and functional command and control.
Urgent structural reforms are needed
The external account balance has not improved, despite a significant drop in the value of oil
imports. Kenya’s current account stood at 10 percent of GDP at the end of 2014 and remained high (9.8 percent) in June 2015. The high current account deficit is driven mainly by imports of machinery and transport equipment to meet the demands of
the infrastructure sector. Significant import demand is for goods that could be produced domestically, however. Against the belief that the external account could decline with lower global oil prices, the structural imbalance problems still exists. Structural reform is urgently needed to improve Kenya’s external balance, as discussed in previous Updates. The export sector has been lagging since the mid-1990s (the last tea and coffee boom). As a result, Kenya relies too heavily on short-term capital flows to service its current account. In order to service and reduce external indebtedness, policy makers need to focus on increasing the production of traded goods to enhance the capacity to generate foreign exchange. The government is working tirelessly to streamline operations at the port of Mombasa and improve infrastructure to support trade. Kenya would still benefit from an export master plan, which might help shift resources toward the export sector.
Both the fiscal deficit and the current account deficit are high. Kenya’s current account deficit increased from less than 1 percent of GDP in 2007 to 9.8 percent in 2015; the fiscal deficit increased from 1.8 percent to 6.3 percent of GDP during the same period. This fiscal expansion involved huge investments in infrastructural projects. It coincided with capital inflows (both short and long term) into the economy in the form of both fixed-income securities and equities and official and private flows. Portfolio and other capital inflows have allowed
Education26%
National security (plus Ministry of Interior)
19%
Energy and infrastructure
15%
Public administration
11%
Health8%
Governance6%
Environmentprotection
5%
Agriculture4%
Social protection
a. Actual expenditure, 2011/12 b. Budget allocation, 2015/16
4% Economic and commercial
affairs2%
Energy and infrastructure
27%
Education22%
Public administration 16%
National security (plus Ministry of Interior)
16%
Agriculture5%
Environment protection4%
Health4%
Governance2%
Social protection2% Economic and
commercial affairs
2%
Figure 2: A large percentage share of the budget goes to security
Sources: Office of the Controller of Budget (National Government Budget Implementation Review Report, Fiscal Year 2011/12 and Third Quarter FY 2014/15) and National Treasury (Highlight of the 2015/16 Budget, June 2015).
Executive Summary

June 2015 | Edition No. 12 ix
Kenya to consume more foreign goods than the economy can pay for. This situation needs careful management, with structural adjustments made over time. Larger twin deficits are unavoidable given the infrastructure investment drive, and they are not worrisome in themselves if they translate into higher productivity. Risks to external and fiscal sustainability are a concern if inflows in the future will not be sufficient to repay private debt or investments (in the form of dividends) and primary balance deficits decline. Without a clear path to fiscal consolidation, there is a potential risk of sudden reversal, which could create macroeconomic instability.
Greater public participation could improve efficiency at the county level
Public participation, transparency, and accountability in decision-making processes are
key to public service delivery and efficiency. Kenya’s constitution and legal framework on devolution place strong emphasis on public participation, transparency, and accountability as means of improving the efficiency, equity, and inclusiveness of government and service delivery. Multiple studies document how governance weaknesses limit Kenya’s economic and social development and impede its progress toward national goals for economic growth, job creation, social inclusion, equity, and poverty reduction. Devolution creates a new opportunity, as well as new challenges, for addressing governance challenges that limit the efficiency and equity of service delivery. Evidence is mounting that strengthening public participation is critical for effective service delivery. But devolution alone does not necessarily improve the accountability and responsiveness of service delivery. Multiple factors must be in place, including the capacity to disseminate government information in user-friendly formats, structure efficient and representative consultations with the public, and provide recourse mechanisms when laws and policies are not followed. Similarly, public participation itself is not a magic bullet. Effective public participation requires coordinated action by government as well as citizens, including user-friendly information and structured engagement with representative groups of citizens.
As they simultaneously deliver services and build new institutions, counties are seeking to establish effective means to engage the public, with varied success. A key focus of the national and county governments, as well as civil society actors, has been to operationalize the strong policy and legal framework on transparency, accountability, and public participation into practical and effective mechanisms that engage citizens. The devolution process has generated hope and high expectations among citizens on how quickly devolved government will change the lives of ordinary citizens, provide more opportunities than risks, and improve service delivery (Figure 3). The challenge is for county governments to convert raised citizen expectations for better service delivery into action while helping ensure that citizens have a realistic understanding of the constraints and challenges counties face. There have been a number of noteworthy interventions at both the national and subnational levels, but more needs to be done to realize the promise of devolution for better development outcomes and improved service delivery.
In the first year of devolution, both national and county governments focused on setting up effective structures, systems, and an enabling environment for implementing participation. National-level actors, including the National Treasury, the Ministry of Devolution and Planning, and constitutional bodies, such as the Commission
65
67
64
14
18
22
9
7
7
11
8
6
0 20 40 60 80 100
January 2013
August 2013
July2014
Percentage of respondentsMore opportunities than risks
More risks than opportunities
No effect Don't Know
Figure 3: Citizens believe that devolution provides more opportunities than risks
Source: National Democratic Institute 2014.
Executive Summary

June 2015 | Edition No. 12x
The State of Kenya’s Economyon Revenue Allocation, prioritized the development of guidelines and regulations to provide counties with basic standards for implementing participation in public financial management (PFM), planning, and other county processes. There has also been a focus on the capacity building of county government officials, through the development of PFM training material and the rolling out of training courses that integrate principles of transparency, accountability, and public participation. The central government also improved national budget transparency, with significant improvement in the narrative sections of the program based budget.
Counties have made significant strides toward improving citizen engagement. Many counties have operationalized legal provisions, put in place websites, established basic citizen forums and county communication frameworks, and piloted innovative initiatives. Few counties have made their updated plans and budgets readily available, however, as required under the Public Financial Management Act; adopted county legislation on participation; or operationalized county budget and economic forums to facilitate the structured engagement of citizens. Key challenges include the cost of participation, the lack of capacity, and tokenistic forms of participation that hinder meaningful engagement of citizens, as discussed in detail in this special focus. Quantity of participation does not equal quality of participation. Building the capacity of government and establishing structured processes for consulting the public and focusing on services they care about will be key drivers for achieving meaningful citizen engagement. Structured engagement is likely to ensure representation of broad segments of society and the inclusion of marginalized groups.
The national and county governments could take various priority actions to enhance participation:
• Build the capacity of county officials to involve citizens in local service delivery. Doing so will require making investments to ensure that participation processes are adequately resourced and staffed and county staff trained on new responsibilities.
• Equip counties to disseminate reliable, updated county information and manage structured consultation processes on county laws, plans, budgets, and monitoring of service delivery.
• Establish strong incentives for county and other subnational service providers to be transparent and foster inclusive citizen participation by systematically measuring and comparing local government performance and citizen satisfaction
on metrics that citizens care about. An index measuring citizen participation could be developed as a subset of other county performance indicators.
Civil society could build partnerships with counties to establish
participatory processes. They could use networks and coalitions to identify, advocate for, and monitor minimum standards for social accountability and use common methodologies and platforms to monitor county performance. Development partners could support government–civil society partnerships focused on designing and rolling out participatory county systems. Donors could consider prioritizing longer-term initiatives by civil society networks and coalitions that advocate for minimum standards on social accountability and enhance grant-making criteria that reinforce accountability of civil society to constituents.
Quantity of participation does not equal quality
of participation
Executive Summary

June 2015 | Edition No. 12 1
The State of Kenya’s Economy
June 2015 | Edition No. 122
Growth in 2014 was solid and broad based as the economy performed well while absorbing two major government programs: devolution and infrastructure scale-up. The economy grew 5.3
percent, driven by stronger than expected growth in services and other industry. Consumption demand remained the main source of growth. Investment demand rebounded, as investors dropped their wait and see stance. Net exports remained a drag on the economy, as the growth in imports outstripped growth in exports. The fiscal policy continued on the expansionary path to ease the cost of doing business and push out Kenya’s production frontier. The monetary policy stance kept inflation within CBK targets. The current account remained high as a share of GDP, despite falling oil prices, signaling Kenya’s vulnerability in the external sector.
1. Economic performance in 2014
1.1 Growth remained solid
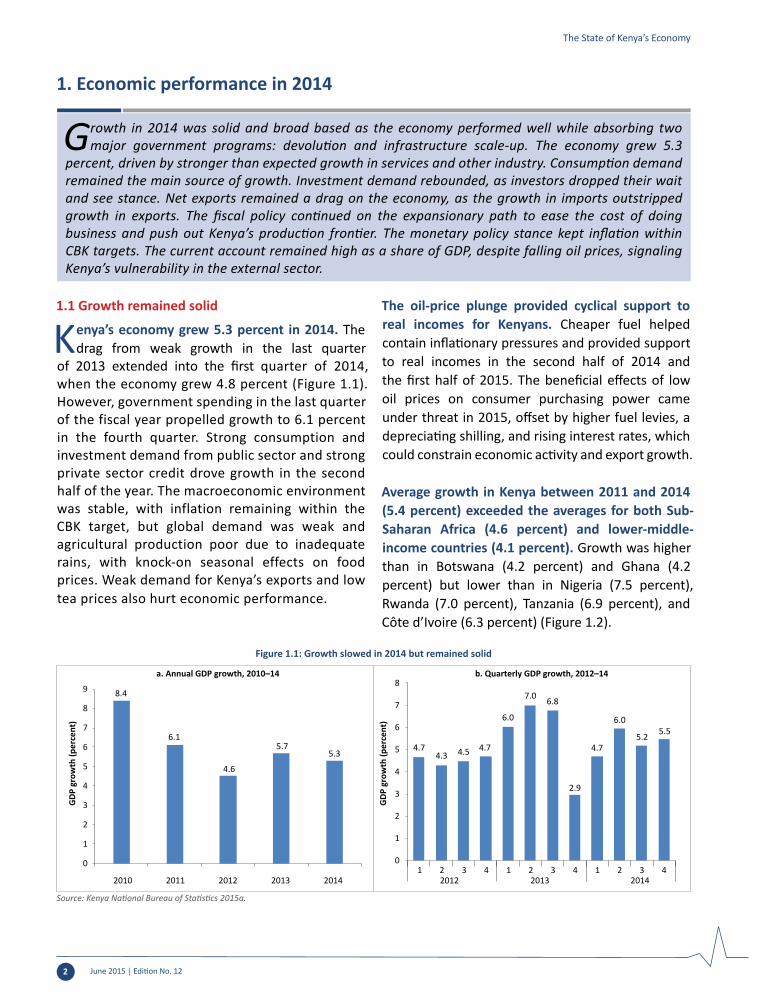
Kenya’s economy grew 5.3 percent in 2014. The drag from weak growth in the last quarter
of 2013 extended into the first quarter of 2014, when the economy grew 4.8 percent (Figure 1.1). However, government spending in the last quarter of the fiscal year propelled growth to 6.1 percent in the fourth quarter. Strong consumption and investment demand from public sector and strong private sector credit drove growth in the second half of the year. The macroeconomic environment was stable, with inflation remaining within the CBK target, but global demand was weak and agricultural production poor due to inadequate rains, with knock-on seasonal effects on food prices. Weak demand for Kenya’s exports and low tea prices also hurt economic performance.
The oil-price plunge provided cyclical support to real incomes for Kenyans. Cheaper fuel helped contain inflationary pressures and provided support to real incomes in the second half of 2014 and the first half of 2015. The beneficial effects of low oil prices on consumer purchasing power came under threat in 2015, offset by higher fuel levies, a depreciating shilling, and rising interest rates, which could constrain economic activity and export growth.
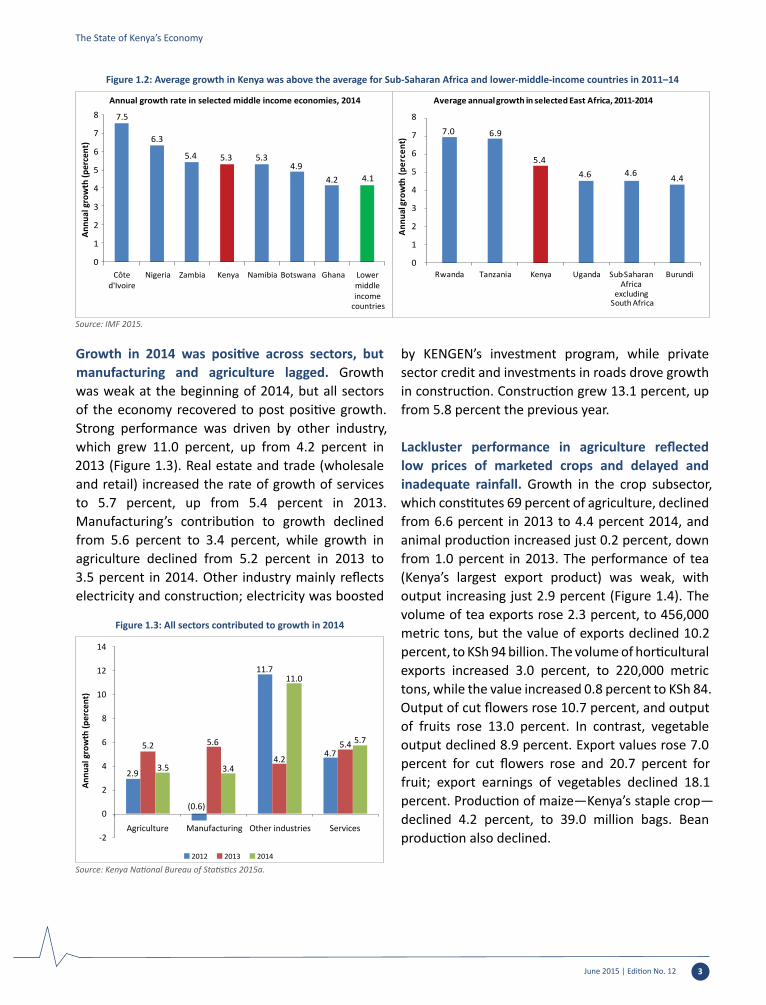
Average growth in Kenya between 2011 and 2014 (5.4 percent) exceeded the averages for both Sub-Saharan Africa (4.6 percent) and lower-middle-income countries (4.1 percent). Growth was higher than in Botswana (4.2 percent) and Ghana (4.2 percent) but lower than in Nigeria (7.5 percent), Rwanda (7.0 percent), Tanzania (6.9 percent), and Côte d’Ivoire (6.3 percent) (Figure 1.2).
The State of Kenya’s Economy
8.4
a. Annual GDP growth, 2010–14 b. Quarterly GDP growth, 2012–14
6.1
4.6
5.75.3
0
1
2
3
4
5
6
7
8
9
2010 2011 2012 2013 2014
GDP
gro
wth
(per
cent
)
4.7 4.3 4.5 4.7
6.0
7.0 6.8
2.9
4.7
6.0
5.2 5.5
0
1
2
3
4
5
6
7
8
1 2 3 4 1 2 3 4 1 2 3 42012 2013 2014
GDP
gro
wth
(per
cent
)
Figure 1.1: Growth slowed in 2014 but remained solid
Source: Kenya National Bureau of Statistics 2015a.
June 2015 | Edition No. 12 3
Growth in 2014 was positive across sectors, but manufacturing and agriculture lagged. Growth was weak at the beginning of 2014, but all sectors of the economy recovered to post positive growth. Strong performance was driven by other industry, which grew 11.0 percent, up from 4.2 percent in 2013 (Figure 1.3). Real estate and trade (wholesale and retail) increased the rate of growth of services to 5.7 percent, up from 5.4 percent in 2013. Manufacturing’s contribution to growth declined from 5.6 percent to 3.4 percent, while growth in agriculture declined from 5.2 percent in 2013 to 3.5 percent in 2014. Other industry mainly reflects electricity and construction; electricity was boosted
by KENGEN’s investment program, while private sector credit and investments in roads drove growth in construction. Construction grew 13.1 percent, up from 5.8 percent the previous year.
Lackluster performance in agriculture reflected low prices of marketed crops and delayed and inadequate rainfall. Growth in the crop subsector, which constitutes 69 percent of agriculture, declined from 6.6 percent in 2013 to 4.4 percent 2014, and animal production increased just 0.2 percent, down from 1.0 percent in 2013. The performance of tea (Kenya’s largest export product) was weak, with output increasing just 2.9 percent (Figure 1.4). The volume of tea exports rose 2.3 percent, to 456,000 metric tons, but the value of exports declined 10.2 percent, to KSh 94 billion. The volume of horticultural exports increased 3.0 percent, to 220,000 metric tons, while the value increased 0.8 percent to KSh 84. Output of cut flowers rose 10.7 percent, and output of fruits rose 13.0 percent. In contrast, vegetable output declined 8.9 percent. Export values rose 7.0 percent for cut flowers rose and 20.7 percent for fruit; export earnings of vegetables declined 18.1 percent. Production of maize—Kenya’s staple crop—declined 4.2 percent, to 39.0 million bags. Bean production also declined.
2.9
(0.6)
11.7
4.7 5.2 5.6
4.2
5.4
3.5 3.4
11.0
5.7
-2
0
2
4
6
8
10
12
14
Agriculture Manufacturing Other industries Services
Annu
al g
row
th (p
erce
nt)
2012 2013 2014
Figure 1.3: All sectors contributed to growth in 2014
Source: Kenya National Bureau of Statistics 2015a.
The State of Kenya’s Economy
7.5
6.3
5.4 5.3 5.34.9
4.2 4.1
0
1
2
3
4
5
6
7
8
Côte d'Ivoire
Nigeria Zambia Kenya Namibia Botswana Ghana Lower middle income
countries
Annu
al g
row
th (p
erce
nt)
Annual growth rate in selected middle income economies, 2014
7.0 6.9
5.44.6 4.6 4.4
0
1
2
3
4
5
6
7
8
Rwanda Tanzania Kenya Uganda Sub-Saharan Africa
excluding South Africa
Burundi
Annu
al gr
owth
(per
cent
)
Average annual growth in selected East Africa, 2011-2014
Figure 1.2: Average growth in Kenya was above the average for Sub-Saharan Africa and lower-middle-income countries in 2011–14
Source: IMF 2015.

June 2015 | Edition No. 124
Weak manufacturing growth was attributed to declining demand for Kenyan goods in neighboring countries as a result of competition from China and India. The manufacturing sector grew just 3.4 percent in real terms in 2014, down from 5.6 percent in 2013. Growth in food, beverages, and tobacco, which together constitute 38 percent of total manufacturing, declined from 10.5 percent in 2013 to 4.0 percent in 2014. Growth of other manufacturing, repair, and installation, which together constitute 62 percent of manufacturing, increased from 2.8 percent to 3.1 percent. The volume of total manufactured goods increased 4.5 percent in 2014, a drop from 7.0 percent growth in 2013. However, growth in the volume of total food products declined, from 9.3 percent in 2013 to 3.9
percent in 2014. Output of beverage and tobacco products declined for the second year in a row, but at a less rapid pace.
The scale-up of geothermal power continues to support growth. Electricity generation expanded 5.7 percent in real terms, down from 6.6 percent in 2013. Total power generation increased 8.2 percent (to 8,888 megawatts), despite a 22.2 percent decline in hydropower generation (caused by below-average rain) to 3,411 megawatts. The drop was compensated for by a 63 percent increase in geothermal generation (to 2,917 megawatts) and a 25.3 percent increase in thermal power generation (to 2,556 megawatts) (Figure 1.5).
80
130
180
230
280
330
380
430
2013 2014 2015
Loca
l ele
ctric
ity g
ener
ation
, mill
ion
of K
Wh Domestic electricity generation, 2013-2015
Hydro Geo-thermal Thermal
Figure 1.5: Electricity generation increased in 2014, despite a significant decline in hydropower generation
Source: Kenya National Bureau of Statistics 2015b.
The State of Kenya’s Economy
25
30
35
40
45
50
Tea
prod
uctio
n in
met
ric to
nnes
, tho
usan
ds
Tea production, 2013-2014
2013 2014
150
180
210
240
270
300
Pric
e in
KSh
per
kilo
Tea auction prices, 2013-2014
2013 2014
Figure 1.4: Production of tea—Kenya’s main export—grew, but earnings from exports declined
Source: Kenya National Bureau of Statistics 2015b.

June 2015 | Edition No. 12 5
The services sector grew more rapidly than expected. Despite significant declines in the accommodation and restaurant subsector, services grew 5.7 percent, driven by good performance in real estate, wholesale and retail trade, transport and storage, education, finance, insurance, and information and communications services (Figure 1.6). The information and communications subsector maintained double digit growth (13.4 percent), with this and other strong performers offsetting weakness in the accommodation and restaurant subsector which declined 17.2 percent in 2014. The poor performance reflected fear created by increased terrorist activity in parts of the country.
Rapid growth in mobile payment transactions shows the deepening of this innovation. The money transfer business has revolutionized the way Kenya does business, making it a world leader in mobile payments. The number of agents employed to transact mobile payments increased 9.3 percent, to 123,703 in 2014, rising to 131,761 in June 2015. The average monthly number of customers using mobile payments increased 10.1 percent, to 25.9 million in 2014. The annual number of mobile transactions increased 24.4 percent, to 911 million, while the value of the transaction increased 24.7 percent, to KSh 2.4 trillion (Figure 1.7).
Although consumption spending slowed, it continued to drive growth. Lower fuel prices contributed to lower inflation, boosting consumers’ purchasing power. Real growth of weighted consumption spending dropped from 6.9 percent in 2013 to 4.7 percent in 2014 (Figure 1.8) but accounted for most growth. Weighted real growth of government spending declined from 5.0 in 2013 to 2.7 percent, while private consumption declined from 8.2 percent to 5.5 percent. The drop in real consumption spending reflected lower recurrent government spending, higher electricity prices, and the poor performance of the agricultural sector.
-20 -15 -10 -5 0 5 10 15
Wholesale and retail trade
Accomodation and restaurant
Transport and storage
Information and communication
Financial and insurance
Public administration
Professional, administration and support services
Real estate
Education
Health
Other services
FISIM
Annual growth (percent)
2014 2013
Figure 1.6: Services grew significantly, despite the deep decline in the accommodations and restaurant subsector
Source: Kenya National Bureau of Statistics 2015a.
0
50
100
150
200
250
Jan
Feb
Mar Ap
May Jun Jul
Aug
Sep
Oct
Nov De
cJa
nFe
bM
ar ApM
ay Jun Jul
Aug
Sep
Oct
Nov De
cJa
nFe
bM
ar ApM
ay Jun Jul
Aug
Sep
Oct
Nov De
cJa
nFe
bM
ar ApM
ay Jun
2012 2013 2014 2015
Num
ber o
f tra
nsac
tions
and
num
ber o
f age
nts
Number of customers (millions)Transactions (millions)
Value of transactions (billions of KSh)Agents (thousands)
Figure 1.7: The volume and value of mobile payments continued to exceed expectations
Source: Central Bank of Kenya.
8.4
6.1
4.6
5.7 5.3
4
2
0
2
4
6
8
10
2010 2011 2012 2013 2014
Perc
enta
ge p
oint
s
Consumption Net investment Net exports GDP
Figure 1.8: Investment recovered in 2014
Source: Kenya National Bureau of Statistics 2015a.
The State of Kenya’s Economy

June 2015 | Edition No. 126
Investment spending rebounded. After having taken a wait and see attitude in 2013, investors were back in business in 2014. Investment spending grew at a weighted real rate of 1.5 percent, after declining 0.2 percent in 2013. Higher development spending on major infrastructural activities, such as the standard gauge railway and public roads, drove the rebound. In the private sector, investors built up inventories and made new investment in capital equipment to take advantage of declining interest rates. Investment in various types of fixed assets grew 11.2 percent in 2014, after growing just 1.6 percent in 2013, primarily thanks to a Kenya Airlines purchase and a 21.1 increase in investment in structures.
Net exports continued to be a drag on economic growth. Exports of goods and services, which declined 0.6 percent in 2013, grew 2.3 percent in 2014. Spending on imports of goods and services recovered in 2014, increasing 9.7 percent in real terms, after growing just 0.3 percent in 2013. Net exports reduced real GDP expenditure-side growth by 2.6 percentage points.
Overall Inflation remained below the upper target of 7.5 percent set by the CBK, but concerns about depreciation triggered a strong policy response to contain inflation expectations. Average overall inflation increased from 5.7 percent in 2013 to 6.9 percent in 2014, as a result of higher food prices (Figures 1.9 and 1.10). Average overall inflation in
the first half of 2015 stood at 6.4 percent, below the CBK’s upper target. Core inflation, which excludes food and fuel prices, remained below the CBK’s 5 percent target. After keeping the central bank rate at 8.5 percent for 25 consecutive months, in order to give commercial banks time to pass through the lower policy rate, the CBK raised its rate by 300 basis points in June and July 2015. The CBK’s monetary policy stance has kept both overall and core inflation to within targets.
1.2 Fiscal expansion continued
Despite the implementation of fiscal reforms, tax revenue fell below the growth of the overall
economy. Fiscal reforms have started to pay off. Expanded revenue allowed the government to reorient spending toward much-needed development projects in priority areas of infrastructure, energy, and ICT. Total revenue mobilized remained below expenditure needs, however, causing Kenya’s fiscal position to weaken. Government expenditure increased mainly driven by development projects in priority areas of infrastructure, energy and ICT. Given the building fiscal pressure, there is need to start fiscal consolidation.
Fiscal policy remained expansionary. With more development spending in 2014/15, growth in total expenditure (of 9.9 percent) and a deceleration in tax revenue (of 2.1 percent), Kenya’s fiscal position weakened. The fiscal deficit widened from 6.1 percent of GDP in 2013/14 to 8.3 percent in 2014/15.
-1
1
3
5
7
9
11
13
15
In�a
tion
rate
(per
cent
)
Food inflation Energy inflationCore inflation Overall inflation
Upper bound target
Figure 1.9: Inflation remained below the central bank target
Source: Kenya National Bureau of Statistics and Central Bank of Kenya.
0
20
40
60
80
100
Infla
tion
rate
(per
cent
)
Contribution of food, energy and core inflation to overall inflation rate, August 2010-June 2015
Food Energy Core
Figure 1.10: Food price rises have been a major driver of overall inflation
Source: Kenya National Bureau of Statistics and Central Bank of Kenya.
The State of Kenya’s Economy

June 2015 | Edition No. 12 7
For 2015/16, the fiscal deficit has been budgeted to increase to 8.7 percent of GDP, leaving the budget vulnerable to a shock. The primary balance (which excludes interest payments on public debt) increased to 5.2 percent of GDP, up from 3.5 percent the previous year (Figure 1.11).
Proceeds from the Eurobond issue helped finance the fiscal deficit. Both domestic and external financing were used to finance the deficit in 2014/15. External financing was buoyed by proceeds from the sovereign bond issue, and financed 46.2 percent of the deficit (equivalent to 3.8 percent of GDP). Domestic sources financed 53.8 percent (equivalent to 4.4 percent of GDP). However, domestic borrowing remained the main source of fiscal deficit financing, it rose to 4.4 percent of GDP, down from 4.0 percent in 2013/14.
Infrastructural development is driving fiscal expansion
The government’s emphasis on infrastructure development is increasingly driving the fiscal
expansion (Figure 1.12). The 2014/15 budget outturn showed a larger proportion of development spending by the central government. Total spending by the central government grew despite the fact that some of its functions were devolved. Allocations for subnational governments increased 0.2 percentage points, while central government expenditure rose 2.4 percentage points. National
development spending rose to 11.3 percent of GDP, 4.3 percentage points higher than the previous year. National recurrent expenditure, which had stagnated after devolution at 17.5 percent of GDP in both 2012/13 and 2013/14, rose 0.3 percentage points to stand at 18.4 percent of GDP. The allocation of expenditure toward productive spending is a welcome achievement, but its sustainability requires continued growth in revenue.
Total government expenditures in FY2015/6 passed KSh 2 trillion (just over US$20 billion). Total expenditure in FY 2015/16 budget was equivalent to 30.7 percent of GDP, with 23.1 percent of GDP (KSh 1.5 trillion) allocated to national government and 4.1 percent (KSh 264.2 billion) going to the 47 counties (Table 1.1). The national government allocated KSh 721 billion (11.1 percent of GDP) to capital spending and 782.2 billion (12.0 percent of GDP) to recurrent spending, in an effort to continued reorienting the budget toward capital expenditure, specifically infrastructure spending. A new urgent priority is the security sector. To address the problem, the government allocated an additional KSh 27.1 billion to the security sector in 2015/16, bringing the total to KSh 223.9 billion. Other priorities include the standard gauge railway (KSh 118.2 billion), geothermal power development (KSh 13.2 billion), generation and transmission of new electricity, and continued expansion of roads.
(4.5) (5.7) (6.1)(8.3) (8.7)
-10
-5
0
5
10
15
20
25
30
2011/12 2012/13 2013/14 2014/15 2015/16
Perc
ent o
f GDP
Government revenue Government expenditureFiscal balance, after grants, cash basis Primary deficit, after grants, cash basis
Figure 1.11: Kenya’s fiscal position is expected to continue to weaken
Source: National Treasury (Quarterly Economic and Budgetary Review, August 2015) and Kenya National Bureau of Statistics.
20.9 23.1 22.3 24.0 23.5 23.7 24.6 21.9 24.3 26.6
0.2 3.8 4.0
4.1
0
5
10
15
20
25
30
35
Perc
ent o
f GDP
National Transfer to county governments
Figure 1.12: The central government remains the main driver of public expenditure
Sources: National Treasury (Quarterly Economic and Budgetary Review, August 2015); Office of the Controller of Budget; and Kenya National Bureau of Statistics.
The State of Kenya’s Economy

June 2015 | Edition No. 128
Public debt remained sustainable
Kenya’s public debt as percentage of GDP rose marginally. (Net) total public debt increased
0.5 percentage points, to 44.5 percent of GDP in 2014/15 (Figure 1.13). Domestic debt stood at 24.8 percent of GDP, lower than the 25.5 percent in 2013/14. External debt rose, to 24.9 percent of GDP. The increase was consistent with the 2015 medium-term debt strategy, which aims to slow domestic debt growth in order to stabilize liquidity and reduce interest rates in domestic financial markets. Debt remained sustainable in the medium term, as confirmed by the IMF/World Bank debt sustainability indicators undertaken in 2015, which show that Kenya’s external and total public debt are below their threshold over a 20-year horizon.
19.1 20.2 18.9 21.0 19.4 18.8 22.6 24.9
20.2 18.6 19.5 21.9 22.2 21.5 23.4 25.5 24.8
0
10
20
30
40
50
60
Perc
ent o
f GDP
External Domestic Public debt net
Figure 1.13: Kenya’s public borrowing has not compromised its debt stock targets
Sources: National Treasury (Quarterly Economic and Budgetary Review, August 2015; Medium-Term Budget Policy Statement, February 2015) and Kenya National Bureau of Statistics.
Table 1.1: Budget summary for 2015/16 budget
Item KSh billion Percent of GDP
Revenue, including grants 1,431.5 22.0
Revenue 1,358.1 20.8
Ordinary 1,254.9 19.2
Appropriation-in-aid 103.2 1.6
Grants 73.4 1.1
Expenditure 2,001.6 30.7
Ministries, departments, and agencies (MDA) 1,503.5 23.1
Recurrent 782.2 12.0
Development 721.3 11.1
County transfer (including level-5 hospital grants and DANIDA) 264.2 4.1
Interest payments 185.3 2.8
Pensions 43.4 0.7
Other consolidated fund services 3.2 0.0
Fiscal deficit, including grants (570.2) (8.7)
Fiscal deficit (including grants, excluding grants for the standard gauge railway) (426.3) (6.5)
Financing 570.2 8.7
Domestic 229.7 3.5
Foreign 340.5 5.2Source: Budget Statement for FY 2015/16.
The State of Kenya’s Economy

June 2015 | Edition No. 12 9
Budget execution improved
Revenue underperformance in 2014/15 made fiscal consolidation a challenge. Total revenue
declined 0.4 percentage points, to 18.9 percent of GDP in 2014/15 (Figure 1.14). Income tax (including pay as you earn [PAYE]) and value added tax (VAT) were the main sources of revenue, accounting for 49.8 percent and 24.6 percent, respectively. Income tax remained stagnant at 8.9 percent of GDP; VAT fell marginally, from 4.6 percent of GDP in 2013/14 to 4.5 percent in 2014/15. Import duties and excise duties as a share of GDP stood at 1.3 percent and 2.1 percent.
Despite more allocation for infrastructure, development spending execution remained low. Budget execution reached 76.1 percent in June 2015, down significantly from the 85.6 percent executed during the same period in 2014 (Figure 1.16). This was due to low spending by energy, infrastructure and ICT sector at 49.3 percent, yet this sector accounted for the larger share (30.2 percent)of the total ministerial budget (Figure 1.15). Lower execution rates undermines governments goal to turn ambitious plans into tangible deliverables.
County governments embarked on fiscal expansion
County governments are overcoming some of the challenges encountered in their first fiscal
year. The 2014/15 budget showed an expansion of both spending and revenue by county governments. Counties’ overall fiscal balance remained positive, helping improve Kenya’s overall fiscal position. Low budget execution of development expenditure at the county level undermines ambitious efforts to deliver promises.
County governments’ budgets rose significantly in 2014/15. County budgets was estimated at KSh 320.7 billion (5.6 percent of GDP) in 2014/15 from the executed spending of KSh 169.4 billion (3.6 percent of GDP) in 2013/14 (Table 1.2). The driving forces
6.9 7.8 8.3 8.9 8.9
4.8 4.4 4.1
4.6 4.5 1.4 1.3 1.3
1.3 1.3 2.6 2.0 1.9 2.0 2.0
1.6 1.6 1.7 1.3 1.2
0
2
4
6
8
10
12
14
16
18
20
2006/07-2010/11
2011/12 2012/13 2013/14 2014/15
Perc
ent o
f GDP
Income tax VAT Import Duty Excise Duty Other Revenues
Figure 1.14: Revenues declined in 2014/15
Sources: National Treasury (Quarterly Economic and Budgetary Review, August 2015) and Kenya National Bureau of Statistics.
0 100 200 300 400
General economic and commercial affairs
Social protection, culture and recreation
Health
Environment protection, waterand natural resources
Agriculture, rural and urban development
National security
Governance, justice, law and order
Public administration and international relations
Education
Energy infrastructure and ICT
Billion, KSh
Ministerial expenditure for FY 2014/15
Target Actual
Figure 1.15: Infrastructure sector accounted for a larger share of the budget, but executed almost a half
Sources: National Treasury (Quarterly Economic and Budgetary Review, August 2015).
58.1
76.2
79.6
84.7
86.7
87.9
91.1
93.4
95.7
99.9
0 20 40 60 80 100
Percent
Overall ministerial budget implementation for FY 2014/15
Energy infrastructure and ICT
Governance, justice, law and order
Health
Public administration and international relations
Agriculture, rural and urban development
Social protection, culture and recreation
Environment protection, water and natural resources
Education
General economic and commercial affairs
National security
Figure 1.16: Overall implementation was pulled back by energy sector
Sources: National Treasury (Quarterly Economic and Budgetary Review, August 2015).
The State of Kenya’s Economy

June 2015 | Edition No. 1210
behind the increase was the surge in allocations for development spending to KSh 139.2 billion (equivalent to 2.4 percent), just KSh 36.6 billion (0.7 percent of GDP) was spent on development projects in 2013/14. County government revenue rose from KSh 224.0 billion (4.4 percent of GDP) to KSh 338.1 billion (5.9 percent of GDP), KSh 226.7 billion of it in the form of the equitable share. Based on the local revenue outturn for the previous fiscal year, county governments revised local revenue collection potential downward. County revenue stood at KSh 62.5 billion (1.1 percent of GDP) for 2014/15, lower than the KSh 67.4 billion (1.3 percent of GDP) budgeted for 2013/14.
Budget operations at the county level shifted to priority sectors of service delivery. The budget allocated to general public services fell from KSh135.2 billion (2.7 percent of GDP) in 2013/4 to KSh 108.7 billion (1.9 percent of GDP) in 2014/15, equivalent to 35.9 percent of the total 2014/15 budget (down from 83.8 percent in 2013/14). The decline created room for priority sectors (Figure 1.17). The health sector budget share increased from 5.3 percent of the budget in 2013/14 to 19.4 percent in 2014/15, transport rose from 3.7 percent
of the budget to 13.3 percent, education rose from 0.8 percent to 8.3 percent, and agriculture rose from 1.8 percent to 7.7 percent.
The budget outturn for the first three quarters of 2014/15 showed significant improvement in execution, but there is still a long way to go (Figure 1.18). The average execution rate stood at 52.9 percent in March 2015—much higher than the 32.2 percent realized in March 2014. Recurrent budget utilization was 64.5 percent, while the development
-15 5 25 45 65 85
General economic affairs
Social protection
Recreation, culture and religion
Environmental protection
Other economic affairs
Housing and community amneties
Agriculture
Education
Transport
Health
General public services
Percent of total expenditure
2013/14 2014/15
Figure 1.17: More emphasis was put on priority sectors in 2014/15
Source: Kenya National Bureau of Statistics (Economic Survey, May 2015).
Table 1.2: County governments’ budget framework, 2013/14–2014/15
2013/14 2014/15
ItemBudget
(KSh billion)Actual
KSh billion)Budget
KSh billion)Actual, third quarter
(KSh billion)
Expenditure 288.6 169.4 321.6 170.0
Development 123.4 36.6 140.3 117.0
Recurrent 165.2 132.8 181.3 53.0
Revenue 280.8 224.0 338.1 203.7
National transfer 213.4 193.4 242.4 138.1
Equitable share 190.0 226.7
Conditional grants (level 5 hospital) 1.9
Conditional grants of on-going projects 13.9
Local revenue 67.4 26.3 57.2 25.2
Balance brought forward 38.1 40.5
DANIDA 0.7
Balance –7.8 54.7 17.9 33.7Sources: National Treasury (Quarterly Economic and Budgetary Review, May 2015; Medium-Term Budget Policy Statement, February 2015) and Office of the Controller of Budget.Note: Quarterly Economic and Budgetary Review for IV quarter does not separate recurrent and development expenditure.
The State of Kenya’s Economy

June 2015 | Edition No. 12 11
execution rate was 37.8 percent. The modest improvement was attributable to the increased number of staff and staff capacity building.
Citizens, the media, and the County Assembly played a growing role in budget preparation and monitoring (see Part 3). Their involvement increased pressure on county governments to deliver and may improve accountability. However, challenges continue to hinder full implementation of the budget at the county level. They include reliance on manual entry of financial transactions instead of fully adoption of the Integrated Financial Management Information & System (IFIMIS), the lack of an internal audit function, and use of local revenue at source before depositing it into county revenue funds.
1.3 The Central Bank of Kenya responded to pressure from the real and external sectors by raising its benchmark rate
The central bank rate rose 300 basis points to 11.5 percent in July 2015. The previous rate of 8.5
percent had been left unchanged for 25 consecutive months (since May 2013). The CBK faced pressure to stem volatility in the foreign exchange market and to halt inflationary pressure, which had been building. Rising inflationary pressure from both food prices and local prices of imports (emanating from the depreciation of the shilling) threatened to push
prices up and dislodge inflationary expectations that the government had managed to keep within target.
The money market has experienced significant volatility, although it has not been as volatile as it was in 2011/12. Both the interbank and the Treasury bill rate experienced volatility as the money market experienced liquidity shortages caused by the CBK’s sale of foreign exchange in domestic market to stop the shilling from sliding sharply against the U.S. dollar. In addition, the build-up of government deposits at the CBK at the start of the fiscal year mopped up liquidity in the banking system and created shortages in the wider market. These shortages caused volatility in the interbank market (Figure 1.19).
0
10
20
30
40
50
60
70
80
Actu
al e
xpen
ditu
re a
s per
cent
of g
ross
esti
mat
e(Q
uart
er th
ree,
201
4/15
)
Average county budget execution rate
Figure 1.18: Despite significant improvement, execution of the development budget remained low
Source: Office of the Controller of Budget 2015
0
10
20
30
40
50
60
Inte
rb
an
k v
ola
tili
ty
(p
erce
nt)
Figure 1.19: The interbank market has been volatile, albeit less than in 2011
Source: Central Bank of Kenya.
The State of Kenya’s Economy

June 2015 | Edition No. 1212
The central bank rate continues to coordinate money markets rates. Despite volatility, both the interbank rate and the 91-day Treasury bill rates are moving around the central bank rate (Figure 1.20). The interbank rate averaged 11.8 percent in June 2015, 490 basis points above the December average and 520 basis points above the average for June 2014. The 91-day Treasury bill also experienced volatility, but it stood at 8.3 percent, a marginal decline from the December value.
Long-term rates declined marginally, despite accommodative monetary policy. Long-term lending rates fell 90 basis points in the 12 months ending June 2015 and 50 basis points in the first half of 2015 (Figure 1.21). However, with the increase
in the central bank rate and the Kenya Bankers Reference Rate, they are set to increase in the second half of 2015. Deposit rates remained stagnant as in the 2014, at 6.6 percent. As a result, interest rate spreads (lending rates minus deposit rates) declined 100 basis points to stand at 8.8 percent in June 2015.
Monetary operations are tightening liquidity. The volatility of the shilling vis-à-vis the dollar and other major currencies forced the CBK to draw down its foreign exchange reserves by injecting dollars into the banking system. When the CBK sells dollars to commercial banks, it receives shillings in return, which is equivalent to mopping up liquidity. As a result, the growth of reserve money and monetary aggregates slowed. Reserve money growth moderated from 18.5 percent in December 2014 to 15.0 percent in May 2015. M1 and M2 growth also slowed, from 13.2 percent and 18.6 percent in December 2014 to 9.6 percent and 16.4 percent in June 2015 (Figure 1.22). On the contrary, M3, which include foreign currency deposits grew by 18.6 percent in June 2015 higher than 16.7 percent in December 2014.
Tight liquidity has slowed the growth of private sector credit. The global liquidity situation in the banking system is affecting the amount of money commercial banks allocate for credit. Banks keep excess balances in order to avoid being caught short in meeting their prudential guidelines and liquidity ratios. In the first quarter of 2015, the average liquid ratio was 39.9 percent, up from 37.7 percent in December 2014 (the minimum statutory limit is 20 percent). As a result, the growth of total private credit fell from 25.8 percent in March 2014 to 20.5 percent in June 2015. Private credit increased significantly in agriculture and manufacturing. Growth increased in only three sectors: agriculture (from 7.7 percent to 22.3 percent), manufacturing (from 17.3 percent to 21.1 percent), and building and construction (from 2.0 percent to 12.7 percent). Credit to business services dropped from 45.5 percent to 27.8 percent, real estate declined from 28.4 percent to 19.6 percent,
0
5
10
15
20
25
30
Long
-ter
m in
tere
st ra
te (p
erce
nt)
Deposit Lending Interest rate spread
Figure 1.21: Long-term interest rates declined in response to the Central Bank’s monetary policy stance, albeit very slowly
Source: Central Bank of Kenya.
The State of Kenya’s Economy
0
5
10
15
20
25
30
Inte
rest
rate
(per
cent
)
Interbank 91-day Treasury bill rate Central bank rate
Figure 1.20: The central bank rate continues to coordinate short-term rates, despite volatility in the money market
Source: Central Bank of Kenya.

June 2015 | Edition No. 12 13
0 100 200 300 400 500 600
Personal/household
Trade
Real estate
Manufacturing
Transport and communication
Energy and water
Financial secrvices
Agriculture
Building and construction
Tourism, restaurants and hotels
Mining and quarrying
KSh billion
Figure 1.24: Loans are concentrated in three nonproductive sectors
Source: Central Bank of Kenya.
The State of Kenya’s Economy
0
5
10
15
20
25
30
35
40
Annu
al g
row
th (p
erce
nt)
Monetary aggregates, February 2011-June 2015
Reserve money M0 M1 M2 M3
0
5
10
15
20
25
30
35
40
Annu
al g
row
th (p
erce
nt)
M0 M1 Private sector credit growth
Figure 1.22: Monetary operations slowed the growth of monetary aggregates
Source: Central Bank of Kenya.
trade fell from 25.2 percent to 18.8 percent, and consumer durables decreased from 22.5 percent to 12.4 percent (Figure 1.23). Private households (26 percent), trade (19 percent), and real estate (15 percent) accounted for 60 percent of the total volume of loans. The share of loans to productive sectors was low, except for manufacturing (12 percent) (Figure 1.24). There was a 3.6 percent nominal increase in the volume of loans to all sectors of the economy.
The quality of bank assets deteriorated marginally in the first half of 2015. The share of nonperforming loans to total loans increased from 4.3 percent in December 2014 to 5.6 percent in June 2015
-40 -20 0 20 40 60
Mining & quarrying
Other activities
Consumer durables
Building & construction
Trade
Real estate
Manufacturing
Agriculture
Business services
Change in volume of credit to private sector (percent)
Unweighted percentage change in private credit, by sector,March 2014-March 2015
2014 2015
-2 -1 0 1 2 3 4
Other activities
Mining & quarrying
Building & construction
Consumer durables
Agriculture
Finance and insurance
Transport & communication
Business services
Real estate
Contribution to credit growth (percentage points)
Weighted percentage change in private credit,March 2014-March 2015
2014 2015
Figure 1.23: Credit to the agriculture and manufacturing sectors increased, while credit to services declined
Source: Central Bank of Kenya.

June 2015 | Edition No. 1214
(Figure 1.25). Ten of 11 economic sectors registered increases in nonperforming loans, as the economy missed its high-growth target. The share of nonperforming loans increased 27.6 percent in building and construction and 20.5 percent in real estate in the first quarter of 2015.
The balance sheet of Kenya’s banking sector continues to grow. Net assets increased 19.5 percent to KSh 3.6 trillion in June 2015, liabilities and advances increased 20.7 percent to KSh 2.17 trillion, deposits increased 18.1 percent to KSh 2.57 trillion, and capital and reserves increased 24.3 percent to KSh 530.1 million (Figure 1.26).
The equities market rose in 2014 but is underperforming in 2015. The Nairobi Securities Exchange underperformed in 2014 (Figure 1.27). Its index rose 0.4 percent in the 12 months ending in June 2015, to stand at 4,906. Performance was weaker than some global benchmarks. Over the same period, for example, the Dow Jones Industrial average rose 4.7 percent. Security concerns; better performance on other African exchanges (such as Nigeria’s); and depreciation risk, which reduced the real return to foreign investors, made Kenya’s stock market less attractive than it had been.
1.4 The external sector remains vulnerable
The vulnerability of the external sector is highlighted by the depreciating shilling and the
current account deficit, which has remained high despite a significant drop in oil prices. The Kenya shilling lost more than 8 percent of its value in the first 6 months of 2015 as volatility in the foreign exchange market continued, forcing the monetary authorities to raise the central bank rate to calm the market. Volatility reflects a strong dollar and fears about Kenya’s current account. The oil import bill has fallen following the significant fall in oil prices. However, imports of capital and equipment increased by more than 25 percent driving the overall balance of payment to negative territory.
14,000
15,000
16,000
17,000
18,000
19,000
4,000
4,500
5,000
5,500
6,000
Dow
Jone
s Ind
ustr
ial a
vera
ge
NSE
inde
x (1
966
= 10
0)
NSE 20-share index Dow Jones Industrial average
Figure 1.27: Lower growth prospects and depreciation risk reduced the attractiveness of the Nairobi Securities Exchange
Source: Nairobi Securities Exchange.
The State of Kenya’s Economy
0 5 10 15 20 25 30 35
Trade
Personal/household
Real estate
Building and construction
Transport and communication
Manufacturing
Agriculture
Tourism, restauranta and hotels
Financial secrvices
Mining and quarrying
Energy and water
KSh billion
Figure 1.25: The volume of nonperforming loans increased in most sectors
Source: Central Bank of Kenya.
0
1,000
2,000
3,000
4,000
Assets Liabilities Deposits Capital andreserves
KSh
billi
on
Figure 1.26: The banking sector continued to experience strong growth
Source: Central Bank of Kenya.

June 2015 | Edition No. 12 15
The current account improved in 2015, but the deficit as a percentage of GDP remains high and still poses risks. The current account’s share of GDP fell marginally from 10.0 percent in December, 2014 to 9.8 percent in June 2015 (Figure 1.28). Both exports and imports declined as a percentage of GDP, with exports falling from 10.1 percent to 9.2 percent and nonfactor services falling from 5.8 percent to 5.4 percent from their December 2014 levels. Imports of goods declined from 31.0 percent to 28.8 percent of GDP.
Exports of goods and services continue to lag imports. After a 6.0 percent growth in 2014, merchandise exports decelerated by 5.4 percent in the first half of 2015 (Figures 1.29 and 1.30). Sluggish export growth was attributable to poor performances of Kenya’s
main merchandise exports. In the first quarter 2015, tea exports declined 1.1 percent, after falling 12.0 percent decline in 2014; manufactured exports declined 20.3 percent; horticulture declined 5.5; and chemical exports fell 7.9 percent. Only the exports of coffee, which rose 12.7 percent, and oil products, which grew 71.5 percent, but these increases were low by historical standards.
The growth of merchandise imports was robust, driven by demand for machinery and equipment. Kenya’s main imports registered robust growth in 2015 (Figure 1.31). The exception was oil imports, which fell 18.8 percent. Imports of machinery and equipment, which constitute 34 percent of Kenya’s total imports, grew 27.4 percent in the first half of 2015, from 33.2 percent in 2014. Import demand from
-15
-10
-5
0
5
10
15
2006 2007 2008 2009 2010 2011 2012 2013 2014 2015(June)
Perc
ent o
f GDP
Current account Short-term flows (including neterrors and ommissions)
Other flowsOverall balance
Figure 1.28: The current account deficit remained very high
Source: Central Bank of Kenya.
-40
-30
-20
-10
0
10
20
30
2006 2007 2008 2009 2010 2011 2012 2013 2014 2015(June)
Perc
ent o
f GDP
Exports (fob) Nonfactor servicesImports (non-oil) Oil imports
Balance of tradeBalance of trade (non-oil)
Figure 1.29: Exports continued to underperform, and imports remained high
Source: Central Bank of Kenya.
The State of Kenya’s Economy
0
5
10
15
20
25
2006 2007 2008 2009 2010 2011 2012 2013 2014 2015 (June)
Perc
ent o
f GDP
Exports of goods and nonfactor services, 2006-15
Exports of goodsExports of non-factor services
Exports of goods and non-factor services
20
30
40
50
60
70
80
2006 2008 2010 2012 2014
Perc
ent
Ratio of exports plus non-factor services to imports
Figure 1.30: Exports continued to stagnate against imports
Source: Central Bank of Kenya.

June 2015 | Edition No. 1216
the standard gauge railway and other infrastructural projects drove growth in machinery and transport equipment imports. Imports of chemicals rose 8.6 percent and imports of manufactured goods rose 1.6 percent in the first half of 2015.
The importance of long-term flows in financing the current account deficit increased in 2014 and remained significant in the first half of 2015, as short-term flows declined. Both short-term flows, which declined from 5.8 percent to 2.7 percent of GDP, and long-term flows, which fell to 5.0 percent from 6.5 percent of GDP, financed the current account. The increase in long-term flows in 2014 was attributed to receipts from the US$2 billion Eurobond issue (Figure 1.32).
The financial account continues to finance the current account deficit. It declined in June 2015, falling to 7.0 percent of GDP (US$4.4 billion), down from 12.2 percent (US$7.5 billion) in December 2014. Significant movements in both long-term and short-term flows accounted for the change. Official long-term flows declined from US$2.9 billion (3.8 percent of GDP) in December 2014 to US$1.6 billion (2.5 percent of GDP) in June 2015. However the level of the financial account fell short of the current account size driving the overall deficit into overall BOP deficit.
Short-term flows are still significant in the financial account, despite the decline in 2015. Short-term flows (including net errors and omissions) fell from KSh 3.5 billion (5.8 percent of GDP) in 2014 to KSh 1.7 billion in 2015. The decline reflected significant revision by the CBK of net errors and omission, which fell from KSh 0.8 billion (1.2 percent of GDP) to KSh
-1.12 billion (-1.9 percent of GDP). Short-term flows (excluding net errors and omissions) increased from $2.8 billion (4.5 percent of GDP) in December 2014 to $2.9 billion (4.6 percent of GDP) in June 2015.
International reserves are sufficient to cushion against short-term shocks. Kenya’s official reserves stood at $7.2 billion, equivalent to 4.6 months of import cover as of June 2015 (Figure 1.33). Commercial banks’ foreign exchange reserves
The State of Kenya’s Economy
-20
-10
0
10
20
30
40
50
60
2006 2007 2008 2009 2010 2011 2012 2013 2014 2015 (June)
Annu
al g
row
th (p
erce
nt)
Exports of goods and nonfactor services Imports (cif) Services
Figure 1.31: Trade indicators have been weakening
Source: Central Bank of Kenya.
-2
-1
0
1
2
3
4
5
6
7
8
2010 2011 2012 2013 2014 2015 (June)
Billi
ons o
f dol
lars
Capital account Financial accountOfficial, medium and long-term Private, medium and long-termShort term (including portfolio flows) Net errors and omissions (NEO)
Figure 1.32: The Eurobond proceeds enhanced official flows in 2014, but short-term flows still dominate
Source: Central Bank of Kenya.
2.9
3.8 4.0 4.2
5.7
6.6
7.97.2
0
1
2
3
4
5
6
0
1
2
3
4
5
6
7
8
9
2008 2009 2010 2011 2012 2013 2014 2015 (June)
Mon
ths o
f cov
er
Rese
rves
(bill
ions
of d
olla
rs)
Official reserves Months of import cover
Figure 1.33: Foreign exchange reserves have grown, cushioning Kenya from short-term shocks
Source: Central Bank of Kenya.

June 2015 | Edition No. 12 17
0
0.5
1.0
1.5
2.0
2.5
3.0
3.5
4.0
Vola
tility
of t
he sh
illin
g ag
ains
t the
dol
lar (
perc
ent)
Period of excess macroeconomic volatility
Exchange rate market stable without excess volatility
Figure 1.35: The foreign exchange market has been volatile, albeit not as volatile as in 2011
Source: Central Bank of Kenya.
The State of Kenya’s Economy
1 Proceeds from the Eurobond were sold to the CBK and the counterpart funds deposited with government accounts at the CBK.
increased by $0.4 billion to stand at $2.3 billion. The proceeds from the Eurobond issue accounted for the significant increase in reserves.1
Remittances continue to grow. Twelve-month average remittances increased 10 percent between June 2014 and June 2015, to US$124 million. Kenya received US$1.5 billion worth of remittances, equivalent to 2.4 percent of GDP, in the 12 months ending in June 2015. Remittances are now the single most important source of foreign exchange inflows in Kenya, bringing in more than official development assistance (Figure 1.34). Remittances boost household consumption and investment. They have been credited with spurring the property boom in Kenya and activity in the stock market.
The shilling is experiencing significant volatility, for a variety of reasons (Figure 1.35). The dollar is strengthening against most of the world’s currency, as a result of the Federal Reserve’s tapering of its monetary stimulus; short-term flows are slowing, as other markets in Africa become attractive; Kenya has been experiencing a structural current account deficit since 2003; and, the government has been undertaking an expansionary fiscal path.
The Kenyan shilling has performed well against regional currencies. Between the end of December 2014 and the end of June 2015, it depreciated 8.7 percent against the dollar, moving from KSh 90.71 to KSh 98.64. Against the pound, the shilling depreciated 10.2 percent, moving from KSh 140.81
0
20
40
60
80
100
120
140
0
20
40
60
80
100
120
140
160
Mill
ions
of d
olla
rs
Mill
ions
of d
olla
rs
Monthly 12-month average
0
0.5
1.0
1.5
2.0
2.5
-
200
400
600
800
1,000
1,200
1,400
1,600
Perc
ent o
f GDP
Mon
thly
(US$
Mill
ion)
12-month cumulative, million Percent of GDP
Figure 1.34: Remittances are the single most important source of foreign exchange inflows in Kenya
Source: Central Bank of Kenya.

June 2015 | Edition No. 1218
The State of Kenya’s Economy
to KSh 155.10. The shilling depreciated 0.2 percent against the euro, moving from KSh 110.13 to KSh 110.40. Regionally, the shilling appreciated 5.3 percent against the Tanzanian shilling and 8.7 percent against the Ugandan shilling. It depreciated 4.1 percent against the South African rand.
Volatility driven by the end of the Fed stimulus has hurt countries like Kenya, which have been net beneficiaries of short-term inflows. The interest rate differential that existed between shilling-denominated assets and assets denominated in dollars or euros since 2008 triggered an inflow of short-term flows into Kenya, artificially strengthening
the shilling against hard currencies. The tide is now turning, and the shilling is finding its true value.
The trade-weighted nominal and real exchange rates show that the shilling continued to appreciate against the currencies of its trading partners. In the 12 months ending in May 2015, the shilling depreciated 3.2 percent in nominal terms while it appreciated 3.1 percent in real terms (Figure 1.36). Although Kenya is not benefiting from the current depreciation of the shilling, the currencies of its trading partners are feeling the same heat against the dollar.
50
60
70
80
90
100
110
120
130
140
150
Inde
x (Ja
nuar
y 20
03 =
100
)
Index of exchange rate, November 2000-September 2014
Nominal effective exchange rate Real effective exchange rate
-25-20-15-10
-505
1015202530
Perc
enta
ge ch
ange
in e
xcha
nge
rate
Volatility of exchange rate, November 2010-September 2014
Nominal effective exchange rate Real effective exchange rate
Depreciation
Appreciation
Figure 1.36: Despite recent volatility, the real exchange rate continued to appreciate
Source: Central Bank of Kenya.

June 2015 | Edition No. 12 19
The World Bank projects 5.4 percent growth in 2015 and 5.7 percent growth in 2016. Ongoing government infrastructural spending and higher consumption will support this growth. Adequate
rains in 2015 will improve agricultural performance. Foreign exchange market volatility and expansionary fiscal policy could raise inflationary pressures, leading to higher lending rates and a slowdown in growth.
2. Growth Outlook for 2015–17
2.1 Kenya’s growth prospects continue to be favorable
The World Bank projects that Kenya will grow at 5.4 percent a year in 2015 and 5.7 percent
in 2016. These estimates, which are lower than the projections made in the December 2014 Update, take into account more recent data on exchange rate, inflation fiscal consolidation, and balance of payments pressures. The projected growth of 5.4 percent is still robust by African standards, and it is higher than the average for lower-middle-income countries. Growth is projected to pick up to 5.7 percent in 2016, supported by the positive externalities from infrastructural projects currently being undertaken in the railway, roads, and energy sectors. Growth will continue to exceed the average for both Africa and lower-middle-income countries, making Kenya one of the fastest-growing countries.
In the baseline scenario, GDP is projected to grow at 5.4 percent in 2015 and 5.7 percent in 2016, thanks to sustained aggregate demand powered by both infrastructural and consumption spending.
The continuing infrastructural spending on the standard gauge railway is having a catalytic effect on related sectors of the economy, including building and construction, heavy manufacturing, engineering services, and many more. Thanks to adequate rains in 2015, the agriculture sector expects a bumper harvest, which should increase consumption. Government recurrent spending will also power public consumption, leading to higher growth. A weaker shilling in real terms will stimulate exports, which also boosts growth.
Macroeconomic risks emanating from the foreign exchange market volatility and fiscal policy concerns could feed into inflation (and inflationary expectations). If inflation rises, the CBK could decide to raise the central bank rate again to calm the market. Yields on government securities and lending rates would like rise in tandem, increasing returns on shilling-denominated assets, making them attractive. A steep rise in interest rates would dampen aggregate demand, as both consumption and investment spending will slow down and reducing growth.
In the high-growth scenario, GDP will grow 5.8 percent in 2015 and 6.7 percent in 2016. Under this scenario, volatility in the foreign exchange market is contained, capping inflationary pressures; consumption demand is stronger than in the baseline, driven by higher private sector credit from the middle class in 2015 to 2016; and ongoing investments in public infrastructure starts to pay off in terms of lower electricity prices and crowding in private investment. Real incomes increase, spurring economic activities. Low oil prices finally translate into higher real incomes, raising aggregate demand. Growth is higher, but net exports remain a drag as imports continue to increase.
4.6
5.7
5.4
5.7
6.1
5.3
5.8
6.7
6.9
5.1
5.5
5.7
4.2
4.7
5.2
5.7
6.2
6.7
7.2
2012 2013 2014 2015 forecast
2016 forecast
2017 forecast
GDP
grow
th (p
erce
nt)
Baseline High-case scenario Low-case scenario
Figure 2.1: The outlook for economic growth in Kenya is robust
Source: World Bank estimates.
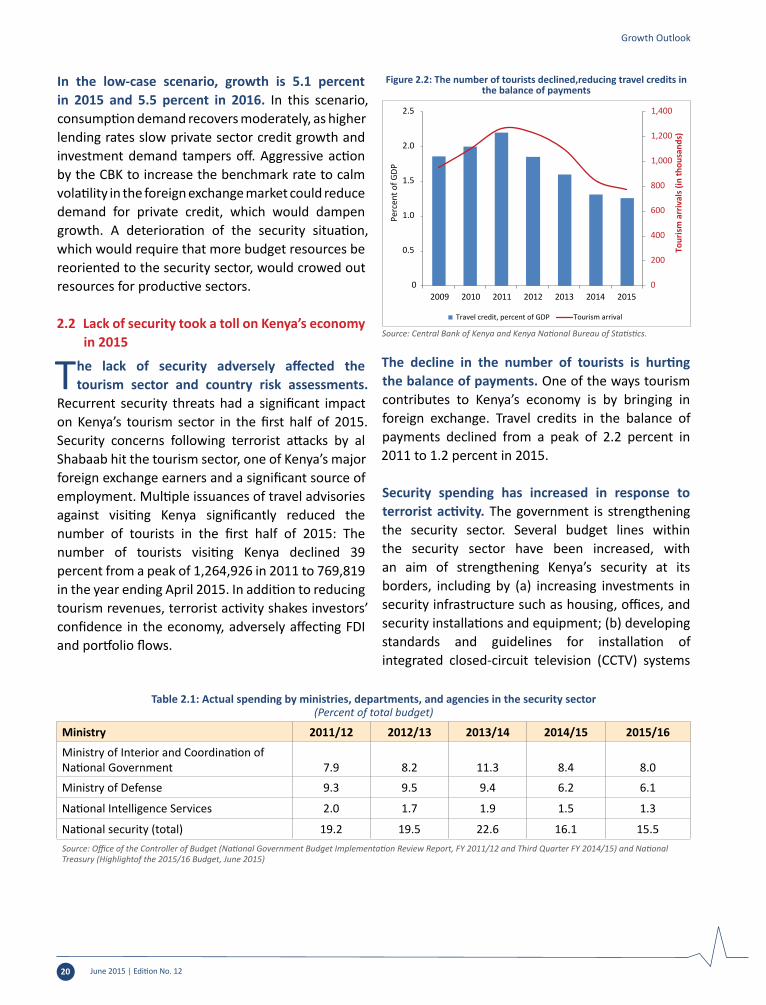
June 2015 | Edition No. 1220
In the low-case scenario, growth is 5.1 percent in 2015 and 5.5 percent in 2016. In this scenario, consumption demand recovers moderately, as higher lending rates slow private sector credit growth and investment demand tampers off. Aggressive action by the CBK to increase the benchmark rate to calm volatility in the foreign exchange market could reduce demand for private credit, which would dampen growth. A deterioration of the security situation, which would require that more budget resources be reoriented to the security sector, would crowed out resources for productive sectors.
2.2 Lack of security took a toll on Kenya’s economy in 2015
The lack of security adversely affected the tourism sector and country risk assessments.
Recurrent security threats had a significant impact on Kenya’s tourism sector in the first half of 2015. Security concerns following terrorist attacks by al Shabaab hit the tourism sector, one of Kenya’s major foreign exchange earners and a significant source of employment. Multiple issuances of travel advisories against visiting Kenya significantly reduced the number of tourists in the first half of 2015: The number of tourists visiting Kenya declined 39 percent from a peak of 1,264,926 in 2011 to 769,819 in the year ending April 2015. In addition to reducing tourism revenues, terrorist activity shakes investors’ confidence in the economy, adversely affecting FDI and portfolio flows.
The decline in the number of tourists is hurting the balance of payments. One of the ways tourism contributes to Kenya’s economy is by bringing in foreign exchange. Travel credits in the balance of payments declined from a peak of 2.2 percent in 2011 to 1.2 percent in 2015.
Security spending has increased in response to terrorist activity. The government is strengthening the security sector. Several budget lines within the security sector have been increased, with an aim of strengthening Kenya’s security at its borders, including by (a) increasing investments in security infrastructure such as housing, offices, and security installations and equipment; (b) developing standards and guidelines for installation of integrated closed-circuit television (CCTV) systems
0
200
400
600
800
1,000
1,200
1,400
0
0.5
1.0
1.5
2.0
2.5
2009 2010 2011 2012 2013 2014 2015
Tour
ism
arr
ival
s (in
thou
sand
s)
Perc
ent o
f GDP
Travel credit, percent of GDP Tourism arrival
Figure 2.2: The number of tourists declined,reducing travel credits in the balance of payments
Source: Central Bank of Kenya and Kenya National Bureau of Statistics.
Table 2.1: Actual spending by ministries, departments, and agencies in the security sector (Percent of total budget)
Ministry 2011/12 2012/13 2013/14 2014/15 2015/16
Ministry of Interior and Coordination of National Government 7.9 8.2 11.3 8.4 8.0
Ministry of Defense 9.3 9.5 9.4 6.2 6.1
National Intelligence Services 2.0 1.7 1.9 1.5 1.3
National security (total) 19.2 19.5 22.6 16.1 15.5Source: Office of the Controller of Budget (National Government Budget Implementation Review Report, FY 2011/12 and Third Quarter FY 2014/15) and National Treasury (Highlightof the 2015/16 Budget, June 2015)
Growth Outlook
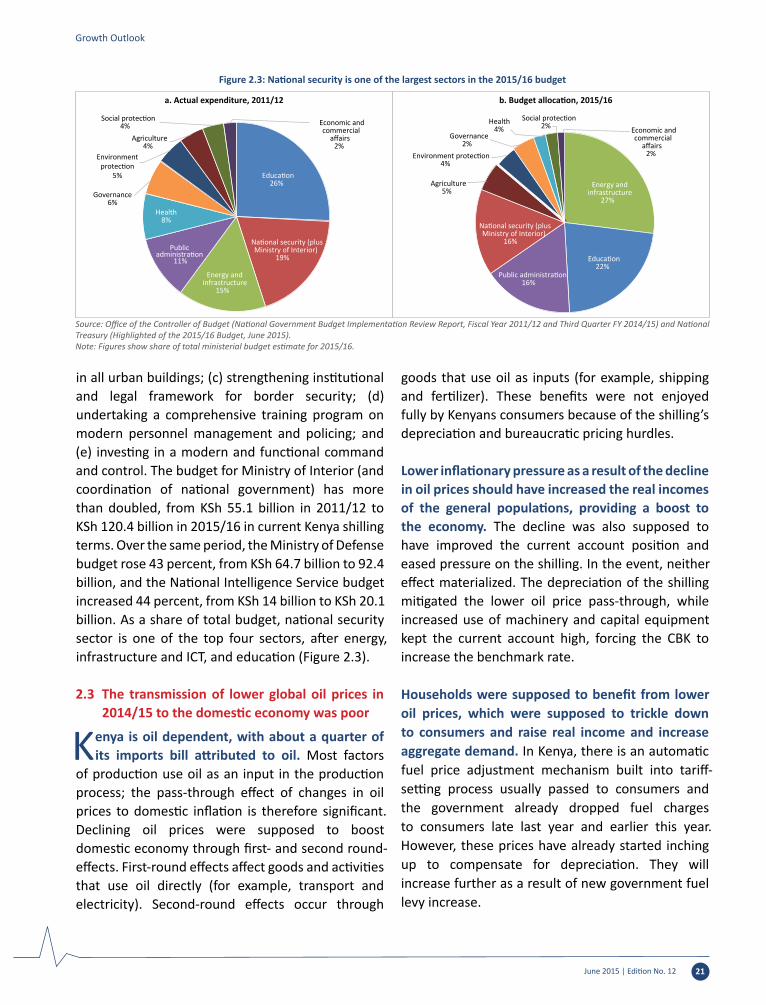
June 2015 | Edition No. 12 21
Growth Outlook
in all urban buildings; (c) strengthening institutional and legal framework for border security; (d) undertaking a comprehensive training program on modern personnel management and policing; and (e) investing in a modern and functional command and control. The budget for Ministry of Interior (and coordination of national government) has more than doubled, from KSh 55.1 billion in 2011/12 to KSh 120.4 billion in 2015/16 in current Kenya shilling terms. Over the same period, the Ministry of Defense budget rose 43 percent, from KSh 64.7 billion to 92.4 billion, and the National Intelligence Service budget increased 44 percent, from KSh 14 billion to KSh 20.1 billion. As a share of total budget, national security sector is one of the top four sectors, after energy, infrastructure and ICT, and education (Figure 2.3).
2.3 The transmission of lower global oil prices in 2014/15 to the domestic economy was poor
Kenya is oil dependent, with about a quarter of its imports bill attributed to oil. Most factors
of production use oil as an input in the production process; the pass-through effect of changes in oil prices to domestic inflation is therefore significant. Declining oil prices were supposed to boost domestic economy through first- and second round-effects. First-round effects affect goods and activities that use oil directly (for example, transport and electricity). Second-round effects occur through
goods that use oil as inputs (for example, shipping and fertilizer). These benefits were not enjoyed fully by Kenyans consumers because of the shilling’s depreciation and bureaucratic pricing hurdles.
Lower inflationary pressure as a result of the decline in oil prices should have increased the real incomes of the general populations, providing a boost to the economy. The decline was also supposed to have improved the current account position and eased pressure on the shilling. In the event, neither effect materialized. The depreciation of the shilling mitigated the lower oil price pass-through, while increased use of machinery and capital equipment kept the current account high, forcing the CBK to increase the benchmark rate.
Households were supposed to benefit from lower oil prices, which were supposed to trickle down to consumers and raise real income and increase aggregate demand. In Kenya, there is an automatic fuel price adjustment mechanism built into tariff-setting process usually passed to consumers and the government already dropped fuel charges to consumers late last year and earlier this year. However, these prices have already started inching up to compensate for depreciation. They will increase further as a result of new government fuel levy increase.
Education26%
National security (plus Ministry of Interior)
19%
Energy and infrastructure
15%
Public administration
11%
Health8%
Governance6%
Environmentprotection
5%
Agriculture4%
Social protection
a. Actual expenditure, 2011/12 b. Budget allocation, 2015/16
4% Economic and commercial
affairs2%
Energy and infrastructure
27%
Education22%
Public administration 16%
National security (plus Ministry of Interior)
16%
Agriculture5%
Environment protection4%
Health4%
Governance2%
Social protection2% Economic and
commercial affairs
2%
Figure 2.3: National security is one of the largest sectors in the 2015/16 budget
Source: Office of the Controller of Budget (National Government Budget Implementation Review Report, Fiscal Year 2011/12 and Third Quarter FY 2014/15) and National Treasury (Highlighted of the 2015/16 Budget, June 2015).Note: Figures show share of total ministerial budget estimate for 2015/16.

June 2015 | Edition No. 1222
The December Update predicted that the drop in global oil prices would lead to a decrease in the current account from 8.3 percent of GDP in 2013 to 4.7 percent in 2017 as a result of falling oil prices. Although the oil import bill has not grown as expected, the current account has not fallen as much as expected, as a result of imports of machinery and capital equipment.
Oil imports comprise predominantly petroleum products rather than crude oil, as Kenya’s only oil refinery is winding down production. The prices of light diesel oil and jet/turbo fuels are less volatile than the headline crude oil price. If the price of imported petroleum falls 25 percent, the overall cost of oil imports would decline by at least 1 percent of GDP. The decline in the dollar price of petroleum products has been partially offset by the appreciation of the dollar, whose value rose almost 8 percent between December 2014 and June 2015.
Kenya is bound to collect more tax revenues from the levy fund, which is based on volume. In June 2015 the government increased the petroleum levy by 15.4 percent, from KSh 19.5 per liter to KSh 21.5. The increase absorbs part of the benefits of lower oil prices to consumers.
The drop in oil prices has mooted exploration across Africa. Tullow Oil—the company that discovered oil in Kenya, recently stated that it would slash
investment elsewhere but continue operations in Kenya as the breakeven point is S40–$50 a barrel.
2.4 Risks to growth remain significant in the near term
The risks to Kenya’s outlook are similar to those highlighted in the December 2014 Update. On
the domestic front are the security environment and the fiscal position. On the external front are the winding down of monetary easing by the Fed. Sluggish growth in the Euro area will dampen the growth pick-up the economy expects to see in the near to long term. The risks from China as much as they affect the global markets are minimal on Kenya and are through the US dollar. Kenya’s export to China are less than one percent of the total exports while its imports from China are at 15 percent of the total. The direct transmission mechanism from events in China are very weak and through the US dollar as the renminbi tracks it.
The security situation is dampening growth prospects. Al Shabaab terrorists continue to threaten Kenya’s national security. Terrorist activities have scared away tourists and potential investors. Tourist arrivals in 2015 have declined by over 30 percent since 2011 peak. Hotel occupancy rates have also plummeted with several coastal hotels closed and majority of those remaining operating below 50 percent capacity while international conferences declined 19.4 percent in 2014 according to the economic survey. Tourism’s contribution to GDP declined by one third in 2014. However, the travel advisories have since been lifted but this might have come late for 2015 bookings. [AU: I recommend moving this material to the earlier discussion of security and tourism to avoid repetition.
Fiscal consolidation is essential to ensure macro stability. The overall fiscal deficit has doubled from 4.5 percent as share of GDP to an estimated 6.3 percent in 2014/15 to a budgeted 8.7 percent in 2015/16. Devolution added pressure to the fiscal position, but it is the lack of rationalization of spending after devolution, the duplication of functions at the national and county level, and the strong appetite
0
50
100
150
200
250
300
-
1,000
2,000
3,000
4,000
2009 2010 2011 2012 2013
Ksh
billi
on
Tonn
es (i
n th
ousa
nds)
Imports of petroleum products
Volume Value
Figure 2.4: The volume of oil imports volume remained roughly constant between 2009 and 2013, but the value soared
Source: Kenya National Bureau of Statistics.
Growth Outlook

June 2015 | Edition No. 12 23
Growth Outlook
The devaluation of the Renminbi/yuan in August created heighten uncertainty in the global financial markets. China's biggest currency intervention in August, 2015 jolted the world financial and equity markets. Against the dollar, the renminbi was devalued by 3 percent on August 11-12, the largest single move since 1994.2 This mild devaluation was seen to bolster Chinese exports and to re-invigorate economic growth in the world's second largest economy after its industrial production, investment and retail sales data for July were weaker than expected and exports dropping by 8.3 percent in July 2015. The Chinese economy faltered as it continued to experience a string of weakening output growth figures going back to last year and the authorities came under intense pressure internally to address the slowdown.
The Kenya Shilling has depreciated significantly against the renminbi yuan. Against the US dollar and the Chinese renminbi, Kenya shilling has depreciated 20 and 17 percent respectively (Figure Box 1). Trade transactions between China and Kenya (and wider EAC) is undertaken in US dollar, however, Renminbi transactions are rare but available. Since the yuan loosely tracks the dollar, it has been dragged higher – keeping its differential with the US dollar roughly the same. This implies Chinese goods in the region have become expensive as the regional currencies weakened against the US dollar and Chinese yuan. In nominal terms Figure 1.37 depicts that Renminbi tracks the US dollar and that in nominal terms, imports from China are 17-20 percent more expensive in local currency terms as the shilling has lost 17-20 percent of its value.
Box 1.1: Impact of China’s Slowdown in Kenya – A preliminary assessment
90
95
100
105
110
115
120
125
Jul-1
4
Aug-
14
Sep-
14
Oct
-14
Nov
-14
Dec-1
4
Jan-
15
Feb-
15
Mar
-15
Apr-1
5
May
-15
Jun-
15
Jul-1
5
Aug-
15
Sep-
15
Nor
mal
ized
inde
x (Ju
ly 2
014
= 10
0)
USD/KSh Chinese Yuan/KSh
Figure Box 1: The shilling as depreciated against the US dollar and Renminbi Yaun
Source: Central Bank of Kenya database
for spending at both levels of government that have worsened Kenya’s fiscal position. Although heavy infrastructural spending is a boon for Kenya’s production space and future growth, the short- to medium-term macro-fiscal framework is shaky should there be a macroeconomic shock. The lack of fiscal consolidation is raising jitters in the market on whether Kenya has a twin deficit problem.
The volatility in the foreign exchange market has exposed Kenya’s vulnerability to the winding down of the U.S. monetary stimulus. Kenya’s economy has benefited immensely from the Fed stimulus, in terms of both short- and long-term capital inflows. The volatility that Kenya is experiencing has already forced the CBK to increase its benchmark rate to shore up the shilling. Yields on shilling-denominated assets have been high, outstripping the depreciation risks and large interest rate differentials, making Kenya a more attractive destination for world capital than many other emerging economies
or Africa as a whole. With the ending of the Fed’s monetary stimulus, the flow of cheap capital that has been funding the current account could dry up, creating volatility in the foreign exchange market. Even though the CBK’s action to raise interest rates is deemed to be appropriate in attracting capital inflows, higher interest rate could dampen aggregate demand and growth prospects. In addition, the strong dollar in the fourth quarter of 2014 through 2015 has already offset part of the benefits of low international oil prices.
Deflation in the Euro area poses a risk to exports. Weak demand for Kenya’s exports will continue to drag down overall growth. Europe is one of the main destinations of Kenya’s merchandise exports. It is also a main source of tourists to Kenya, as well as the source of most equity funds. A continued or deeper slowdown in Europe would hurt Kenya’s growth prospects.
2 The Renminbi/Yuan was pegged to the US Dollar before 2015. However the Chinese’s currency reform unpegged it from a strict tie with the dollar in favor of a looser tracking policy that in theory allows the currency to move 2 percentage points in either direction.
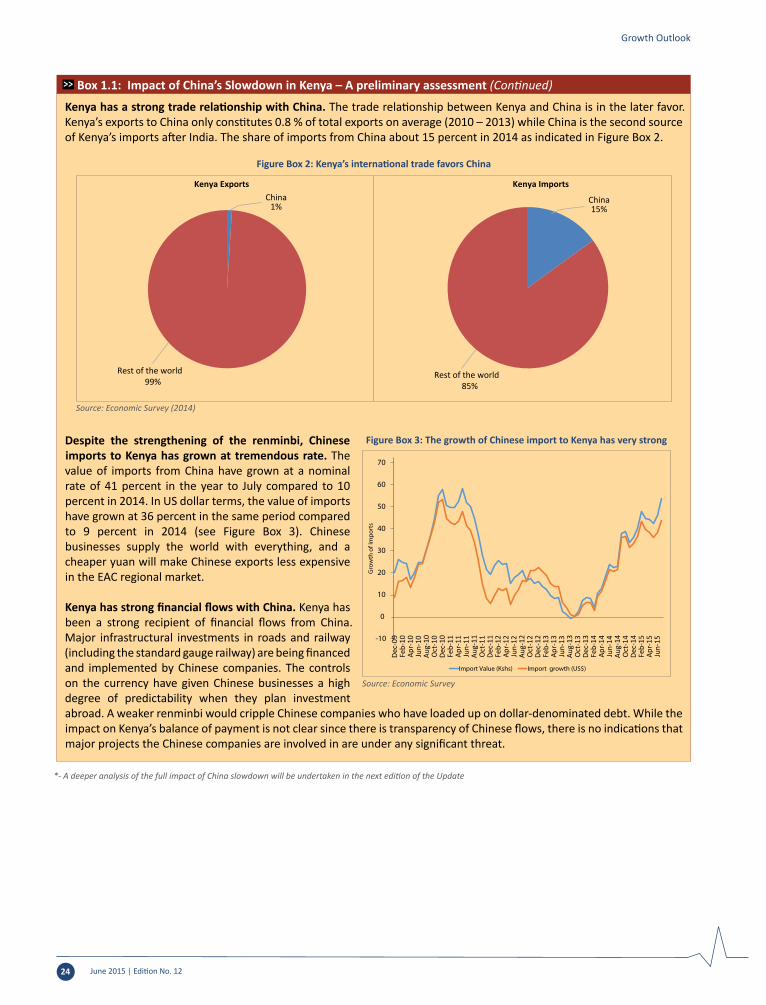
June 2015 | Edition No. 1224
Kenya has a strong trade relationship with China. The trade relationship between Kenya and China is in the later favor. Kenya’s exports to China only constitutes 0.8 % of total exports on average (2010 – 2013) while China is the second source of Kenya’s imports after India. The share of imports from China about 15 percent in 2014 as indicated in Figure Box 2.
Despite the strengthening of the renminbi, Chinese imports to Kenya has grown at tremendous rate. The value of imports from China have grown at a nominal rate of 41 percent in the year to July compared to 10 percent in 2014. In US dollar terms, the value of imports have grown at 36 percent in the same period compared to 9 percent in 2014 (see Figure Box 3). Chinese businesses supply the world with everything, and a cheaper yuan will make Chinese exports less expensive in the EAC regional market.
Kenya has strong financial flows with China. Kenya has been a strong recipient of financial flows from China. Major infrastructural investments in roads and railway (including the standard gauge railway) are being financed and implemented by Chinese companies. The controls on the currency have given Chinese businesses a high degree of predictability when they plan investment abroad. A weaker renminbi would cripple Chinese companies who have loaded up on dollar-denominated debt. While the impact on Kenya’s balance of payment is not clear since there is transparency of Chinese flows, there is no indications that major projects the Chinese companies are involved in are under any significant threat.
-10
0
10
20
30
40
50
60
70
Dec-
09Fe
b-10
Apr-
10Ju
n-10
Aug-
10O
ct-1
0De
c-10
Feb-
11Ap
r-11
Jun-
11Au
g-11
Oct
-11
Dec-
11Fe
b-12
Apr-
12Ju
n-12
Aug-
12O
ct-1
2De
c-12
Feb-
13Ap
r-13
Jun-
13Au
g-13
Oct
-13
Dec-
13Fe
b-14
Apr-
14Ju
n-14
Aug-
14O
ct-1
4De
c-14
Feb-
15Ap
r-15
Jun-
15
Gro
wth
of I
mpo
rts
Import Value (Kshs) Import growth (US$)
Figure Box 3: The growth of Chinese import to Kenya has very strong
Source: Economic Survey
Growth Outlook
*- A deeper analysis of the full impact of China slowdown will be undertaken in the next edition of the Update
China 1%
Kenya Exports
Rest of the world 99%
China 15%
Kenya Imports
Rest of the world 85%
Figure Box 2: Kenya’s international trade favors China
Source: Economic Survey (2014)
Box 1.1: Impact of China’s Slowdown in Kenya – A preliminary assessment (Continued)

June 2015 | Edition No. 12 25
Growth Outlook
2.5 Several policy issues need addressing in the medium term
Kenya needs to undertake reforms to reduce the structural imbalance in the external account,
which has not improved, despite a significant drop in the price of oil and the import bill. Kenya’s current account stood at 9.2 percent of GDP at the end of 2014 and remained high at 9.8 percent in June 2015. Kenya’s export sector has been lagging since the mid-1990s (the last tea and coffee boom). As a result, Kenya relies too heavily on short-term capital flows to service its current account. In order to service and reduce external indebtedness, policy makers need to focus on increasing the production of traded goods to enhance the capacity to generate foreign exchange. The government is working tirelessly to improve operations at the port of Mombasa and infrastructure to support trade. An export master plan that would help shift resources toward the export sector is now critical.
Kenya is running a high fiscal deficit and a high current account deficit. Kenya’s current account increased from 2.0 percent of GDP in 2007 to 8.6 percent in 2015, while the fiscal deficit increased from 1.8 percent of GDP to 6.3 percent (Figure 2.5). The fiscal expansion, which has involved huge investments in infrastructure, has coincided with capital inflows (both short and long term) into the economy both in fixed-income securities and equities and official and private flows. These
portfolio and other capital inflows have allowed Kenya to consume more foreign goods than the economy can pay for. Larger twin deficits are now unavoidable, given the infrastructure investment drive. They are not worrisome if they translate into higher productivity. However, risks to external and fiscal sustainability might arise if inflows in the future are not sufficient to repay private debt or fund dividends and declining primary balance deficits make public debt unsustainable. Unless the government starts fiscal consolidation soon, there is a potential risk of sudden reversal that could create macroeconomic instability.
Kenya’s low level of national savings and domestic investment are muting growth, putting pressure on the external account. Low levels of investment imply slower future growth, because they limit productive capacity and increase intertemporal insolvency. Kenya needs to increase its savings and investment ratios to enhance its creditworthiness in the eyes of international investors. High investment and savings provide a form of commitment to higher future output, bolstering the perception that the economy will be able to service and reduce its external debt.
Kenya’s fiscal position is not sustainable in the medium term. Fiscal spending have driven the pattern and level of growth since 2008. Various fiscal expansion measures have led to growth spurts (Figure 2.6) as well as increases in both the
-12
-10
-8
-6
-4
-2
0
2
Perc
ent o
f GDP
Fiscal deficit (fiscal year ending June)Current account deficit (12 months cumulative up to June)
Figure 2.5: Kenya has a high current account deficit and a high fiscal deficit
Source: National Treasury (Quarterly Economic and Budgetary Review, May 2015); Central Bank of Kenya; and Kenya National Bureau of Statistics.
0
5
10
15
20
25
30
35
40
45
50
-10
-8
-6
-4
-2
0
2
4
6
8
10
June 2008
June 2009
June 2010
June 2011
June 2012
June 2013
June 2014
June 2015
Perc
ent
Perc
ent
Fiscal balance, percent of GDP GDP growth, percent
Figure 2.6: Growth has been high during years of fiscal expansion linked to increases in public debt
Source: Kenya National Bureau of Statistics and National Treasury (Quarterly Economic and Budgetary Review, May 2015).
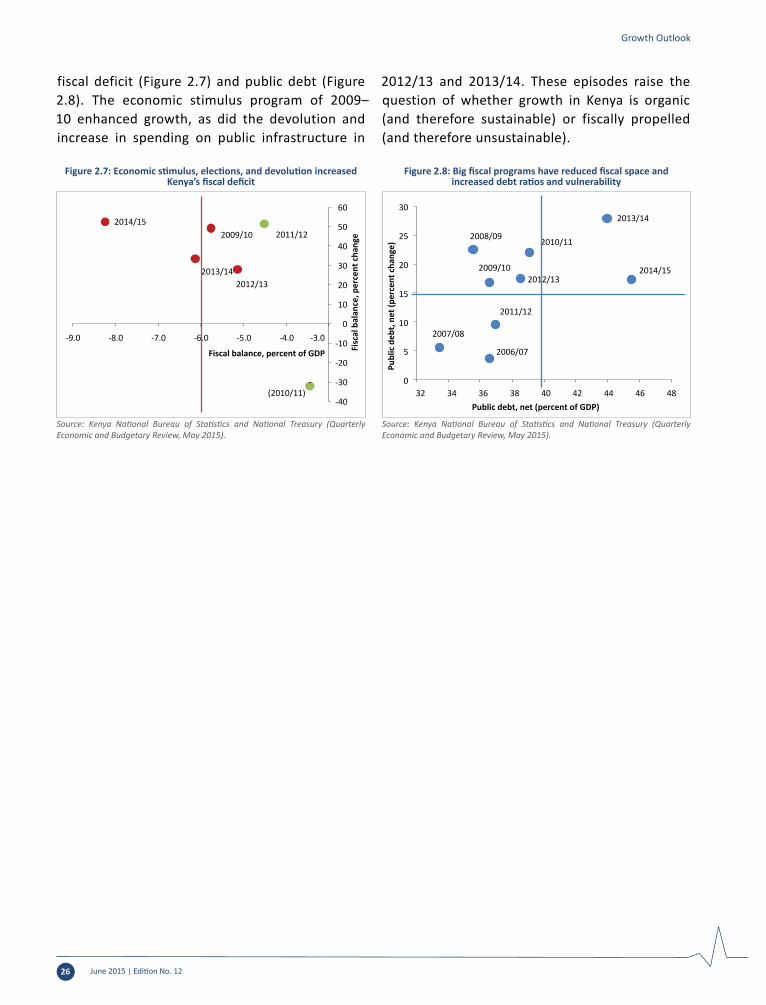
June 2015 | Edition No. 1226
Special Focus: Enabling the Voices of Citizens
2009/10
(2010/11)
2011/12
2012/13 2013/14
2014/15
-40
- -30
-20
-10
0
10
20
30
40
50
60
-9.0 -8.0 -7.0 -6.0 -5.0 -4.0 -3.0
Fisc
al b
alan
ce, p
erce
nt c
hang
eFiscal balance, percent of GDP
Figure 2.7: Economic stimulus, elections, and devolution increased Kenya’s fiscal deficit
Source: Kenya National Bureau of Statistics and National Treasury (Quarterly Economic and Budgetary Review, May 2015).
2006/07
2007/08
2008/09
2009/10
2010/11
2011/12
2012/13
2013/14
2014/15
0
5
10
15
20
25
30
32 34 36 38 40 42 44 46 48Pu
blic
deb
t, ne
t (pe
rcen
t cha
nge)
Public debt, net (percent of GDP)
Figure 2.8: Big fiscal programs have reduced fiscal space and increased debt ratios and vulnerability
Source: Kenya National Bureau of Statistics and National Treasury (Quarterly Economic and Budgetary Review, May 2015).
fiscal deficit (Figure 2.7) and public debt (Figure 2.8). The economic stimulus program of 2009–10 enhanced growth, as did the devolution and increase in spending on public infrastructure in
2012/13 and 2013/14. These episodes raise the question of whether growth in Kenya is organic (and therefore sustainable) or fiscally propelled (and therefore unsustainable).
Growth Outlook

June 2015 | Edition No. 12 27
Special Focus: Enabling the Voices of Citizens

June 2015 | Edition No. 1228
Kenya’s Constitution and legal framework on devolution place strong emphasis on public participation, transparency, and accountability as a means of improving efficiency, equity, and inclusiveness of
government and service delivery. Multiple studies have documented how governance weaknesses limit Kenya’s socioeconomic development and impede its progress toward national goals for economic growth, job creation, social inclusion, equity, and poverty reduction. Devolution creates a new opportunity, as well as new challenges, for addressing governance weaknesses. Enabling citizen voice is critical to making devolution a success. There is increasing evidence that citizen engagement can improve the rational use of public resources and curb spending leakages. Involving citizens in decision-making processes has the potential not only to improve planning and prioritization by county governments but also to increase local revenues. Devolution alone, however, does not necessarily improve the accountability and responsiveness of service delivery. Multiple factors—the capacity to disseminate government information in user-friendly formats, the efficiency of the structure, representative consultations with the public, and provision of recourse mechanisms when laws and policies are not followed—must be in place. Public participation itself is not a magic bullet. Effective participation requires coordinated action by the government as well as citizens.
3. Special Focus: Enabling the Voices of Citizens
3.1 Devolution to the counties has the potential to improve service delivery
Among the multiple institutional changes ushered in by the 2010 Constitution,
devolution is arguably the most far-reaching, with major implications for improved development and enhanced service delivery. Kenya’s highly ambitious devolution to 47 new county governments seeks to narrow long-term, deeply entrenched regional disparities; increase the responsiveness and accountability of government to citizens; and grant greater autonomy to regions and groups.
Kenya experienced a decade of relatively steady socioeconomic growth, but regional disparities in poverty levels, human development indicators, and access to services are large. Devolution seeks to remedy the unequal distribution of investments and services that has historically benefitted some regions at the expense of others, including by shifting significant resources and responsibilities to semi-autonomous and locally accountable county governments. By rebalancing power away from a historically strong and centralized presidency, devolution is intended to eliminate the allocation of resources based on subjective criteria such as regionalism, ethnicity, and political loyalty while
promoting objective principles, including economic criteria, merit, and need. The assumption is that counties are in a better position than the national government to deliver social services because they understand the local contexts and, with the support of citizens, are able to articulate and identify citizens’ needs. The creation of 47 subnational entities also provides an additional accountability mechanism, as it empowers citizens to demand better provision of services by bringing them physically closer to officials with whom they can now engage.
The March 2013 elections were the culmination of a constitutional change that created 47 new county governments, which are responsible for a significant portion of public finances and service delivery. Each county has an elected governor and assembly—a brand-new level of government that consolidates former levels of the central government, reducing the number of central ministries from more than 40 before the elections to 18, including a new Ministry of Devolution and Planning. Although, the Constitution envisaged a three-year transition and transfer of functions, most functions and funds were transferred to the new counties during the first year. The formula for allocating funds across counties shifts resources toward historically marginalized counties and regions.
Growth Outlook
June 2015 | Edition No. 12 29
The new county governments quickly assumed major responsibilities, and major funding, for delivering health, agriculture, urban services, and local infrastructure. Devolved functions include the delivery of primary health care, urban services, trade licensing, agriculture, county roads, county planning and development, management of village polytechnics, and county public works and services. The functions assigned to the national government are limited to policy, standard setting, and the provision of public goods, such as national security and macroeconomic policy.
Under the new financing arrangement, historically marginalized areas receive larger shares of resources. Financing is provided primarily through an unconditional “equitable share.” The Constitution provides that counties receive a minimum of 15 percent of national revenues of the last audited financial year. Counties were allocated KSh 190 billion (US$2.2 billion) in 2013/14 and KSh 226 billion (US$2.5 billion) in 2014/15, amounting to 3.9 percent of GDP. The equitable share is allocated across the 47 counties based on a highly progressive formula based on population (45 percent), poverty (20 percent), equal shares (25 percent), land area (8 percent), and a “fiscal discipline” component (2 percent). As a result of the formula, which applies for three years, historically privileged counties (which include most larger urban centers and the most productive agriculture areas) receive smaller per capita resource transfers, while historically marginalized areas (arid and semi-arid areas) receive larger per capita shares.
The Constitution and the new legal framework for devolution place strong emphasis on transparency, accountability, and citizen participation as a means of accelerating development and enhancing local service delivery. They contain multiple provisions requiring both central and county governments to make information publicly available and consult with citizens in planning, budgeting, and monitoring service delivery. These processes are referred to as social accountability, public participation, or citizen engagement (the terms are used interchangeably in this report) (Box 3.1).
3.2 Social accountability is critical to making devolution work
Experience from other countries indicates that devolution does not automatically bring greater
government responsiveness and accountability to the public, especially if accountability mechanisms are not quickly put in place. Governance risks that can undermine expected performance and accountability gains from decentralization include elite capture, clientelism, capacity constraints, competition over the balance of power between levels of government, and weak interregional information flows (Yilmaz and others 2009).
Rapid devolution carries major risks for disruptions in service delivery, mismatches between responsibilities of counties and their capacity, leakages of public resources, and continued regional inequality. Navigating the rapid transition to a devolved system; establishing effective county-level systems and capacities (including clear functional assignments, strong public financial management, management of human resource transitions, establishment of effective monitoring and evaluation systems); and ensuring responsiveness to citizens are major challenges, especially given the speed and magnitude of Kenya's transition.
Growth Outlook
Social accountability typically involves a process of engagement, dialogue, and negotiation between citizens and the state, with the goal of influencing the broader development agenda. It refers to processes that enable citizens to hold state institutions accountable and make them responsive to their needs. Through three key dimensions—transparency, participation, and accountability—social accountability empowers citizens by giving them a greater voice in governance and policy-making processes. Social accountability is an evolving umbrella category that cuts across citizen monitoring and oversight of public or private sector performance, user-centered public information access or dissemination systems, public complaint and grievance redress mechanisms, and citizen participation in decision making regarding resource allocation (Fox 2014; World Bank 2014).
Box 3.1: What is social accountability?

June 2015 | Edition No. 1230
Global experience highlights the need to balance the increased political, administrative, and fiscal discretion of the new county governments with greater accountability. A critical determinant of the success of devolution is how well counties develop systems that ensure they are responsive and accountable to the needs of the public. Upward accountability, in which the central government supervises county governments, can be more difficult to implement, because of county government autonomy and distance from the center (Figure 3.1). Downward accountability mechanisms, which enable citizens to hold subnational institutions accountable and make them responsive to their needs, therefore become increasingly important in devolved settings (Gaventa and Gregory 2010; Yilmaz and others 2009).
Building subnational government responsiveness and performance requires a focused effort to link county governments with the public. Several countries—including Brazil, India, and South Africa—have placed strong emphasis on building accountability of local governments to citizens as part of decentralization, with significant success.
Citizen engagement can improve development results
A growing body of evidence documents how citizen engagement, or social accountability
mechanisms, can improve development results.
Citizen engagement provides opportunities for direct interaction between government officials and service users in budgetary design and implementation, with significant impact on how resources are spent, leakages are reduced, and service delivery and living standards are improved. It has also led to significant increases in local tax revenues (Box 3.2).
Social accountability is not a magic bullet; certain conditions must prevail for success to occur. Many interventions that produced meager results were based on assumptions that turned out to be weak, such as “information is power,’’ “community participation is democratic,” and “community participation can (by itself) influence service providers.” Stand-alone civil society initiatives are often unsustainable because they are ignored or squelched. Citizen action that has the backing of government offices that are both willing and able to get involved or have forged links with other citizen counterparts to build countervailing power are more likely to have impact (Fox 2014).
Literature reviews and evaluations of public participation initiatives suggest that multipronged approaches are necessary to achieve significant results. Research (Fox 2014; Muriu 2014; O’Meally 2015; Yilmaz and others 2009) suggests the following:
• Effective implementation of decentralization reforms requires a strategy to give discretionary power to local governments and strengthen their accountability to the public.
• Effective accountability measures work simultaneously on different issues and at different levels. Public participation principles therefore need to be embedded in all stages of the policy cycle, and enforcement and action as well as information sharing and transparency need to be ensured. Information alone is rarely sufficient to improve accountability outcomes; it must match the capacity and incentives of actors to bring about change. An enabling environment needs to reduce fear of reprisals. Longer time horizons and a learning-by-doing approach need to be adopted.
Growth Outlook
Upward Accountability:- Internal and upward government accountability
Social Accountability:- Local citizens hold their county governments accountable
Central Government
County Government
Citizens
Figure 3.1: Accountability needs to be both upward and downward
Source: World Bank, 2012

June 2015 | Edition No. 12 31
• Building effective public participation depends on capacity building of government as well as citizens. Local government capacity and incentives are often key constraints to effective decentralization. Strengthening public participation requires building government systems and capacity, as well as the capacity of citizens and CSOs. An enabling environment must be created that actively encourages the voice and representation of people who would normally be excluded because of gender, age, ethnic or class bias. Such an environment may be achieved by reaching out to marginalized groups to seek their representation on boards, committees, and forums.
• Citizens should be engaged by focusing on popular services and issues they care about.
Citizen engagement can address governance and institutional weaknesses that hold back Kenya’s economic and social development
The constitutional emphasis on citizen engagement aims in part at strengthening
governance. Kenya’s track record on governance and corruption has been mixed. Although Kenya has made steady gains in strengthening its policy and institutional framework, corruption remains a significant challenge. Kenya scores well on improving the quality of its policies and institutions, receiving the highest score in Sub-Saharan Africa (3.8) after Rwanda. Kenya outperforms its peers on voice and accountability and performs fairly better in government effectiveness. It however scores below the average for lower middle-income countries and for Sub-Saharan Africa on rule of law and corruption (Table 3.1). Global corruption perception surveys also reflect weak performance, with a low Corruption Perception Index (CPI) score (25) and low global ranking. Kenya has a fairly vibrant and open media and civil society, as reflected in the strong performance in the press freedom index and voice and accountability.
Growth Outlook
In the Brazilian city of Porto Alegre, structured budget participation resulted in more pro-poor expenditures, increased access to public services, and greater local government accountability. Municipalities that favored an allocation of public expenditures that closely matched popular preferences channeled a larger fraction of their budgets to investments in sanitation and health. As a result, infant mortality rates fell. The adoption of participatory budgeting also led to a substantive increase in tax revenues, as immediate visibility of the work and services that resulted from their engagement motivated citizens to improve their taxpaying habits (Cabannes 2014; Fox 2014).
In Uganda systemic implementation of public expenditure tracking surveys established that only 13 percent of capitation grants from the central government were reaching local schools. The government responded by publicizing the funds transferred to schools in local newspapers and radio on a monthly basis. Schools were also required to maintain public notice boards displaying funds received. By 2001, 44 percent of grants reached schools (Fox 2014).
In South Africa new opportunities for participation on hospital boards led to a switch from a curative approach to one that is primary and holistic, addressing the impacts of socioeconomic issues such as unemployment and poverty on the well-being of the community (Gaventa and Gregory 2010).
Implementation of citizen report cards in Pakistan resulted in increased enrollment and learning, better-quality education as parents demanded better performance from schools, and increases in school-level investments, such as textbooks (Fiszbein and Ringold 2011).
In Gujarat, India, the training of elected representatives by a local nongovernmental organization (NGO) on budget information improved the ability of members of the local assembly to understand local budgets and track unspent amounts. It increased the time allocated to budget debates and the debate participation in the local assembles, which raised more budget-related queries (O’Meally 2015).
Box 3.2: Social accountability has improved spending in several countries
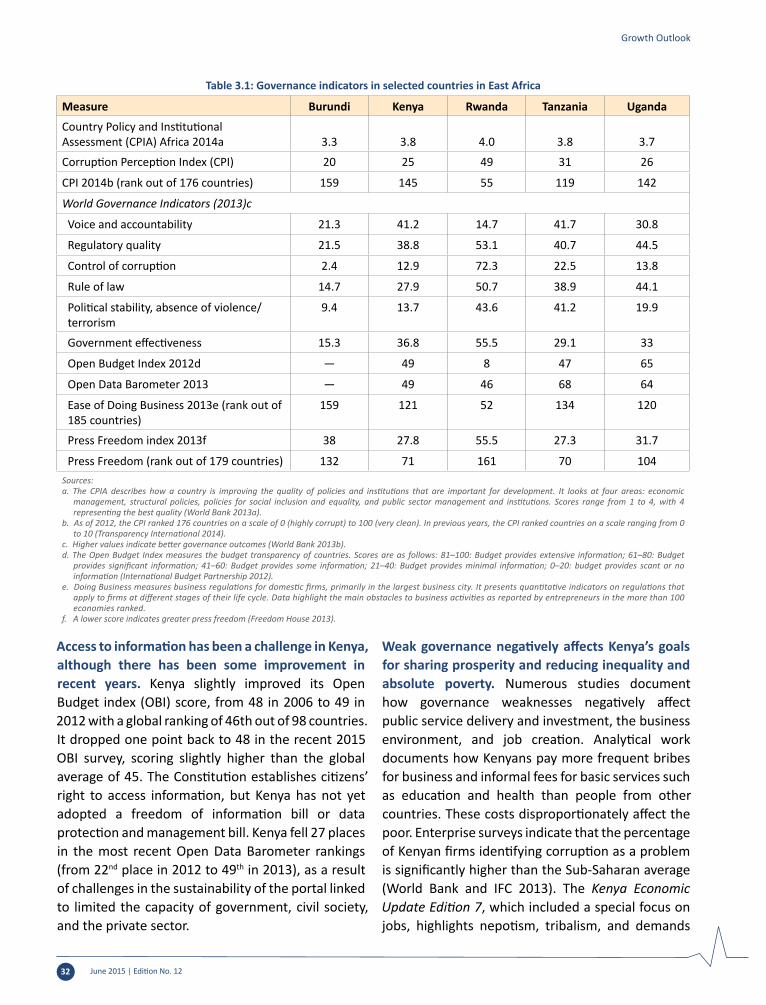
June 2015 | Edition No. 1232
Access to information has been a challenge in Kenya, although there has been some improvement in recent years. Kenya slightly improved its Open Budget index (OBI) score, from 48 in 2006 to 49 in 2012 with a global ranking of 46th out of 98 countries. It dropped one point back to 48 in the recent 2015 OBI survey, scoring slightly higher than the global average of 45. The Constitution establishes citizens’ right to access information, but Kenya has not yet adopted a freedom of information bill or data protection and management bill. Kenya fell 27 places in the most recent Open Data Barometer rankings (from 22nd place in 2012 to 49th in 2013), as a result of challenges in the sustainability of the portal linked to limited the capacity of government, civil society, and the private sector.
Weak governance negatively affects Kenya’s goals for sharing prosperity and reducing inequality and absolute poverty. Numerous studies document how governance weaknesses negatively affect public service delivery and investment, the business environment, and job creation. Analytical work documents how Kenyans pay more frequent bribes for business and informal fees for basic services such as education and health than people from other countries. These costs disproportionately affect the poor. Enterprise surveys indicate that the percentage of Kenyan firms identifying corruption as a problem is significantly higher than the Sub-Saharan average (World Bank and IFC 2013). The Kenya Economic Update Edition 7, which included a special focus on jobs, highlights nepotism, tribalism, and demands
Table 3.1: Governance indicators in selected countries in East Africa
Measure Burundi Kenya Rwanda Tanzania Uganda
Country Policy and Institutional Assessment (CPIA) Africa 2014a 3.3 3.8 4.0 3.8 3.7
Corruption Perception Index (CPI) 20 25 49 31 26
CPI 2014b (rank out of 176 countries) 159 145 55 119 142
World Governance Indicators (2013)c
Voice and accountability 21.3 41.2 14.7 41.7 30.8
Regulatory quality 21.5 38.8 53.1 40.7 44.5
Control of corruption 2.4 12.9 72.3 22.5 13.8
Rule of law 14.7 27.9 50.7 38.9 44.1
Political stability, absence of violence/terrorism
9.4 13.7 43.6 41.2 19.9
Government effectiveness 15.3 36.8 55.5 29.1 33
Open Budget Index 2012d — 49 8 47 65
Open Data Barometer 2013 — 49 46 68 64
Ease of Doing Business 2013e (rank out of 185 countries)
159 121 52 134 120
Press Freedom index 2013f 38 27.8 55.5 27.3 31.7
Press Freedom (rank out of 179 countries) 132 71 161 70 104Sources: a. The CPIA describes how a country is improving the quality of policies and institutions that are important for development. It looks at four areas: economic
management, structural policies, policies for social inclusion and equality, and public sector management and institutions. Scores range from 1 to 4, with 4 representing the best quality (World Bank 2013a).
b. As of 2012, the CPI ranked 176 countries on a scale of 0 (highly corrupt) to 100 (very clean). In previous years, the CPI ranked countries on a scale ranging from 0 to 10 (Transparency International 2014).
c. Higher values indicate better governance outcomes (World Bank 2013b).d. The Open Budget Index measures the budget transparency of countries. Scores are as follows: 81–100: Budget provides extensive information; 61–80: Budget
provides significant information; 41–60: Budget provides some information; 21–40: Budget provides minimal information; 0–20: budget provides scant or no information (International Budget Partnership 2012).
e. Doing Business measures business regulations for domestic firms, primarily in the largest business city. It presents quantitative indicators on regulations that apply to firms at different stages of their life cycle. Data highlight the main obstacles to business activities as reported by entrepreneurs in the more than 100 economies ranked.
f. A lower score indicates greater press freedom (Freedom House 2013).
Growth Outlook

June 2015 | Edition No. 12 33
for bribes as major barriers to breaking into the job market. Young people indicate that demands for bribes to get jobs are common and that the more competitive the vacancy, the larger the bribe demanded. Inactive youth are at higher risk of being recruited into criminal activity. Estimates suggest that if firms used all the money they paid in bribes to hire employees, they would be able to create 250,000 positions (World Bank 2012).
Citizen engagement is critical for promoting social cohesion, reducing resource-based and ethnic conflict, and building stronger citizen-state relations
The constitutional emphasis on participation and inclusion of marginalized communities and
vulnerable groups is in part a response to Kenya’s historical experience with political instability, which has hurt economic performance and social cohesion. Kenya witnessed a political crisis in 2008, when violence erupted following the disputed national elections held in December 2007. Among the most salient explanatory factors for continued cycles of violence around election time in Kenya are income inequality, feelings of exclusion, and regional inequities (Kenya’s Gini index of 42.5 in 2008 was higher than in neighboring countries such as Uganda [37] and Tanzania [38]). A judicial commission of inquiry established that many of the youths involved in the 2007 post-election violence were unemployed. Another dimension of inequality that can help explain violence in Kenya is horizontal inequality (inequality among culturally defined or constructed groups). This form of inequality is multidimensional and includes political, social, and economic dimensions. Since independence, Kenya has had significant levels of horizontal inequality, with the ethnic group in power benefitting politically, economically, and socially. Over the years, horizontal inequality has contributed to ethnic cleavages and conflict. Other related dynamics are the distribution of land and the political manipulation of ethnic identities and enmity over the imbalances of resources and services (World Bank 2008).
Social accountability mechanisms that enlist the public in setting development priorities and monitoring the flow and use of financial resources can reduce social and economic tensions. County governors are likely to face significant pressures from vested interests to reward constituencies that supported their candidacies; the long tradition of patronage in Kenya may not be easy to reverse. The 47 counties largely follow geographic boundaries that were drawn shortly after independence, partly based on where different ethnic groups resided. Citizens in Kenya have tended to align themselves with political parties and coalitions largely along ethnic lines. At least initially, the formation of counties with elected governors and assemblies has contributed to multiple governors operating as a bloc on some issues rather than along national party lines.
The accountability relationships established among the central government, county governments, and citizens will be a key determinant of how well services are delivered under devolved government. Inclusion of the marginalized and the poor in decision making at the local level is likely to lead to pro-poor policies. Incentives to improve development outcomes will be determined by the strength of the accountability mechanisms put in place to override traditional historical incentives. The extent to which some governors outperform others and performance systems are put in place for citizens to distinguish and provide feedback on relative performance between elections will also be a key determining factor.
Citizen engagement can help manage and meet high public expectations that devolution will improve service delivery
Kenyans remain optimistic that devolution will create more opportunities than risks (Figure
3.2). A significant percentage of citizens expect that devolution will improve service delivery and enhance their participation. A challenge will be
Growth Outlook

June 2015 | Edition No. 1234
to convert citizen expectations for better service delivery (Table 3.2) into action while helping ensure that citizens have a realistic understanding of the constraints and challenges county governments face.
These expectations reflect low levels of satisfaction with local service delivery before devolution. Large percentages of Kenyans rated local government as performing badly in local road maintenance (63 percent), cleanliness and garbage collection (60 percent), and maintenance of public health standards (55 percent) (Figure 3.3).
Surveys suggest that public understanding of new roles and responsibilities under devolved structures is improving. Before devolution, less than a third of Kenyans (29 percent) had a clear understanding of devolved structures; the majority (71 percent)
could not articulate the correct position or the roles of different office bearers (Society for International Development 2012). Public awareness appears to be improving, with more citizens now having a medium (45 percent) or high (27 percent) understanding of county roles and responsibilities (Figure 3.4).
Given high public expectations, elected governors have incentives to enhance service delivery in their counties and to ensure that county investments and activities respond to citizen priorities. In 2013 most Kenyans cited roads (45 percent), health (39 percent), and agricultural development (38 percent) as priority areas for counties to address (Figure 3.5). In 2014 even more people cited roads and health as priorities; general county level planning and development replaced agriculture as the third most important priority.
Growth Outlook
65
67
64
14
18
22
9
7
7
11
8
6
0 20 40 60 80 100
January 2013
August 2013
July2014
Percentage of respondentsMore opportunities than risks
More risks than opportunities
No effect Don't Know
Figure 3.2 Kenyans expect devolution to provide more opportunities than risks
Source: National Democratic Institute 2014.
Table 3.2: Kenyans’ expectations of devolution(Percent of respondents)
Statement Agree
Neither agree nor disagree Disagree
Don’t know
Devolution will lead to better transparency and accountability 39 24 10 27
Citizens will be able to get better public services 43 21 9 26
Devolution provides citizens with better opportunities to participate 40 22 11 27
Devolution will minimize vices such as corruption and impunity 30 26 16 28
Devolution will lead to a more cohesive and peaceful nation 34 27 12 27
Women will have better opportunities in devolved government 40 24 10 26
Minority communities will have better opportunities 37 24 11 29Source: Society for International Development 2012.
6357 55
6054
3541 41
36 33
0
10
20
30
40
50
60
70
Maintenance of local roads
Maintenance of local market
places
Maintenance of public health
standards
Cleanliness and garbage collection
Use of land
Percentage of respondentsFairly/very badly Fairly/very well
Figure 3.3: Before devolution, Kenyans’ satisfaction with service provision was low
Source: Afrobarometer study (Institute for Development Studies, University of Nairobi, and Michigan State University 2011).

June 2015 | Edition No. 12 35
Kenyans’ perceptions of devolution depend on tangible development activities. A survey conducted between December 2014 and February 2015 to ascertain citizens’ perceptions of the performance of their county governments established that 68 percent feel conditions are better than before (Figure 3.6). Sentiments about devolution were positive where infrastructural development increased, especially in the area of road networks, rehabilitation of existing health facilities and construction of new ones, and improved investments in childhood education and agricultural production. Where infrastructure, health, education, and agriculture performed comparatively poorly, county residents indicated that conditions were worse than before.
Social accountability provides county governments with tools with which to inform citizens about what they are trying to achieve and how much resources they have. It enables them to engage citizens in decision making that can improve the targeting and responsiveness of government investments and activities to citizen preferences. Understanding the amount of resources available to counties may also help citizens appreciate the limitations facing county governments as they seek to deliver services.
The Constitution and devolution create the opportunity to develop government systems and capacities that are more effective, responsive, and accountable to citizens. The Constitution calls for a reshaping of the relationship between the citizen and state. The challenge is to help national and county governments, as well as civil society, operationalize these provisions. Realizing this goal will take time and will depend on multiple factors, including the nuts and bolts of central and county government planning, financial management, monitoring systems, staff capacities, and systems and staff to make information available, hold structured public consultations to understand preferences, and gather feedback from citizens.
Growth Outlook
High (Identified correct number of counties and responsibilities for at least 7 out of 8 service sectors)
Medium (Identified correct number of counties and responsibilities for 4 out of 8 service sectors)
Low (Was unable to identify correct number of counties or their responsibilities)
28
Percent of respondents
45
27
Figure 3.4: Most Kenyans now have a high or medium understanding of county responsibilities
Source: Ipsos Synovate 2014.
55
49
26
25
22
19
45
39
27
38
12
24
0 10 20 30 40 50 60
County roads
County health services
County planning and development
Agricultural development
Pre-primary education
County transport
Percentage of respondents
August 2013 July 2014
Figure 3.5: Kenyans care most about roads and health services
Source: National Democratic Institute 2014.
Percent of respondents
Things are better than before
68%
Things are same as before 18%
Things are worsethan before
14%
Figure 3.6: Most Kenyans perceive that conditions under devolution have improved
Source: Infotrak 2015.

June 2015 | Edition No. 1236
Growth Outlook
3.3 What has been the experience of counties in implementing public participation?
“The legislative landscape in Kenya is strong, providing an array of clear, pragmatic provisions and principles….The challenge now is on implementation, especially in developing the necessary capacities, systems, and regulations at the county level, including an enabling environment from the national level.”
- Ms. Mwanamaka Mabruki, Principal Secretary, Ministry of Devolution and Planning
New county governments face immense challenges as they seek to put in place effective
systems and build institutional capacity while delivering services and making visible investments. The early months of Kenya’s devolution were characterized by intense bargaining between county and national governments, which led to an accelerated devolution timetable. The central government transferred functions much more quickly than originally planned, doing so in six months rather than three years. In addition, more than 30 percent of national revenue, rather than the 15 percent minimum set by the Constitution, was decentralized to the counties. County governors are therefore under pressure to deliver results.
County and central authorities have made considerable progress toward implementing constitutional and legal provisions for transparency, accountability, and participation. In the first year of devolution, both state and nonstate actors prioritized the setting up of structures and systems to facilitate public participation. Much still needs to be done to ensure that proper and adequate mechanisms are put in place to facilitate structured engagement with the public.
Public participation is now required at all stages of the planning and budget cycle. The County Government Act 2012, the Public Finance Management Act 2012, and the Urban Areas and Cities Act (2011) require public participation in national and county government processes,
including formulating legislation, determining planning and budget priorities, reviewing public sector performance and expenditures, and submitting grievances. County governments are required to create structures, mechanisms, and guidelines for public participation; promote access for minorities and marginalized groups; establish mechanisms for public communication and access to information using a wide variety of media; and submit annual reports on citizen participation to the county assembly (Nizam and Muriu 2015a). The Public Financial Management Act provides for citizen participation in the formulation of the budget policy statement, the preparation of the revenue bill, county allocations, and county-level planning and budgeting processes (Sections 117, 125, 128, 131, and 137). It also requires that various budget documents, including estimates, approvals, the fiscal strategy paper, audited accounts, and quarterly and annual reports, be published and publicized within certain times and in user-friendly formats (Sections 48 and 139).
At the national level, there have been multiple interventions to provide support to counties and improve engagement with citizens. The Commission on Revenue Allocation has developed guidelines on the formation of County Budget and Economic Forums (CBEFs). The guidelines clarify the establishment and administration of the CBEFs per the Public Financial Management Act and guide both counties and citizens on how to operationalize them. The Ministry of Devolution and Planning is spearheading the development of best-practice county guidelines on public participation. These guidelines aim to provide counties with a logical path to plan and implement participation, as enshrined in the Constitution and attendant laws and regulations. The Ministry of Devolution and Planning is developing a civic education framework, curricula, and content and rolling out a nationwide civic education program aimed at empowering citizens to hold national and county governments accountable. The National Treasury, with support from development partners, has developed

June 2015 | Edition No. 12 37
public financial management modules on budget preparation, execution, and financial accounting and reporting that integrate key principles of participation and accountability. Training of county officials using the modules is underway. The Commission for the Implementation of the Constitution (CIC) has put in place mechanisms to monitor progress by counties in implementing constitutional provisions, including provisions relating to public participation.
Budget transparency at the national level has improved. The shift to a program-based budget led to significant improvements in the 2014/15 budget, including substantive narratives, improved presentation of indicators and targets, and more careful review of changes over time in priorities and availability of the budget proposal (International Budget Partnership 2015). Although devolution to counties is the primary focus of this analysis, national level initiatives set a good precedent for enhancing subnational participation.
Counties have made strides to improve public participation. They have built county communication frameworks and facilitated access to information, created participatory structures, and improved the quality of citizen engagement through civic education. By the end of the first year of devolution, 40 of 47 counties had created websites, a critical avenue for disseminating information to the public; by 2015 only three counties lacked websites. Twenty-two counties had put in place a county communication framework, and 26 had established citizen forums, per the legislative requirements (Nizam and Muriu 2015b). Beyond meeting legal requirements, counties have adopted innovative initiatives to engage citizens. Some have formed collaborative engagements with CSOs to develop citizen-friendly budgets and county integrated development plans. Others have mobilized the public to participate in forums and used social media, including Facebook and Twitter, to inform citizens and solicit their feedback on projects and legislative bills under development (online conversations and feedback are usually consolidated and addressed at formal meetings). Some counties have established
community liaison offices or information desks to engage the public and civil society in exercises such as joint conduct of social audits. Counties have used drama, art, road shows, and sporting activities to convey key messages and live talk shows to break down the budget on FM radio stations and community radio. They have used opinion leaders—known as drivers of public participation (DRoPPs)—as strategic points for passing important information to community members and appointed opinion leaders from wards to represent different segments of society, including the marginalized, in budget forums.
The high cost of participation, the lack of administrative capacity and trained staff to implement participatory processes, and tokenistic forms of participation hinder effective citizen engagement. In the first fiscal year, most counties sought public views on their initial budgets and integrated development plans. They faced challenges related to compressed devolution timetables, lack of dedicated county staff and resources, and lack of frameworks or guidelines to operationalize participation. Although teething challenges are to be expected, there are risks that these initial, often ad hoc, efforts to engage citizens become the norm if processes are not structured, staffed, and resourced.
Transparency and access to information need improvement
Most counties have taken steps to put in place a communication framework, but information
is not as accessible as it is supposed to be as per the new law. Communication plays a key role in enabling county governments to share information critical for participation in county processes, such as budgeting and planning. By the end of the first year of devolution, 22 counties had in place a county communication framework, 4 had enacted county legislation on access to information, and 16 had a strategy for including minority groups (Table 3.3). What remains to be done, according to the Honorable Geoffrey Kaituko, speaker of the Turkana County Assembly, is to translate public information into local languages to expand outreach.
Growth Outlook
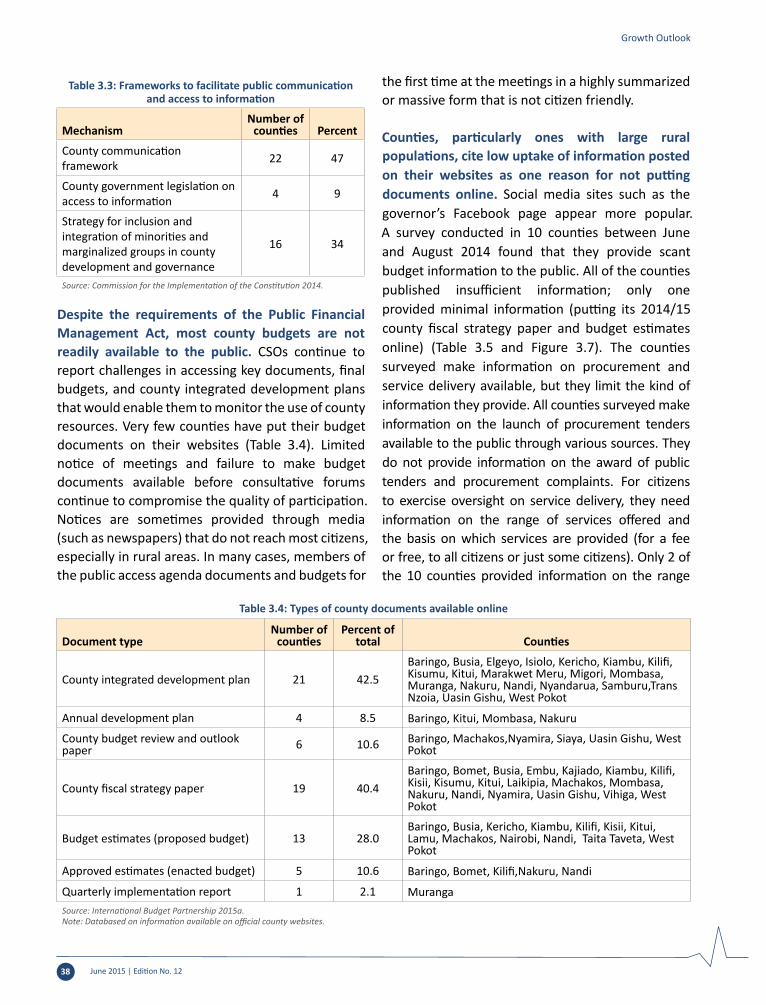
June 2015 | Edition No. 1238
Despite the requirements of the Public Financial Management Act, most county budgets are not readily available to the public. CSOs continue to report challenges in accessing key documents, final budgets, and county integrated development plans that would enable them to monitor the use of county resources. Very few counties have put their budget documents on their websites (Table 3.4). Limited notice of meetings and failure to make budget documents available before consultative forums continue to compromise the quality of participation. Notices are sometimes provided through media (such as newspapers) that do not reach most citizens, especially in rural areas. In many cases, members of the public access agenda documents and budgets for
the first time at the meetings in a highly summarized or massive form that is not citizen friendly.
Counties, particularly ones with large rural populations, cite low uptake of information posted on their websites as one reason for not putting documents online. Social media sites such as the governor’s Facebook page appear more popular. A survey conducted in 10 counties between June and August 2014 found that they provide scant budget information to the public. All of the counties published insufficient information; only one provided minimal information (putting its 2014/15 county fiscal strategy paper and budget estimates online) (Table 3.5 and Figure 3.7). The counties surveyed make information on procurement and service delivery available, but they limit the kind of information they provide. All counties surveyed make information on the launch of procurement tenders available to the public through various sources. They do not provide information on the award of public tenders and procurement complaints. For citizens to exercise oversight on service delivery, they need information on the range of services offered and the basis on which services are provided (for a fee or free, to all citizens or just some citizens). Only 2 of the 10 counties provided information on the range
Table 3.4: Types of county documents available online
Document typeNumber of
countiesPercent of
total Counties
County integrated development plan 21 42.5Baringo, Busia, Elgeyo, Isiolo, Kericho, Kiambu, Kilifi, Kisumu, Kitui, Marakwet Meru, Migori, Mombasa, Muranga, Nakuru, Nandi, Nyandarua, Samburu,Trans Nzoia, Uasin Gishu, West Pokot
Annual development plan 4 8.5 Baringo, Kitui, Mombasa, Nakuru
County budget review and outlook paper 6 10.6 Baringo, Machakos,Nyamira, Siaya, Uasin Gishu, West
Pokot
County fiscal strategy paper 19 40.4Baringo, Bomet, Busia, Embu, Kajiado, Kiambu, Kilifi, Kisii, Kisumu, Kitui, Laikipia, Machakos, Mombasa, Nakuru, Nandi, Nyamira, Uasin Gishu, Vihiga, West Pokot
Budget estimates (proposed budget) 13 28.0Baringo, Busia, Kericho, Kiambu, Kilifi, Kisii, Kitui, Lamu, Machakos, Nairobi, Nandi, Taita Taveta, West Pokot
Approved estimates (enacted budget) 5 10.6 Baringo, Bomet, Kilifi,Nakuru, Nandi
Quarterly implementation report 1 2.1 MurangaSource: International Budget Partnership 2015a.Note: Databased on information available on official county websites.
Growth Outlook
Table 3.3: Frameworks to facilitate public communication and access to information
MechanismNumber of
counties Percent
County communication framework 22 47
County government legislation on access to information 4 9
Strategy for inclusion and integration of minorities and marginalized groups in county development and governance
16 34
Source: Commission for the Implementation of the Constitution 2014.

June 2015 | Edition No. 12 39
of services offered consolidated at a single source through services charters. In the other eight counties, each responsible department or agency provides this information, making it difficult for citizens to access in one place (Institute of Economic Affairs 2015a).
Many citizens are poorly informed about their counties’ budgets. A study conducted in 16 counties in April 2015 revealed that 92 percent of respondents were unaware of the amount of funds allocated to their county (Transparency International 2015). Their ignorance partly reflects the fact that citizens cannot access budget documents. Failure to make information public is likely to impede debates and discussions of the budget; limit public understanding of budget policies, county revenues, and spending plans; and retard the ability to hold the government to account on expenditure related to service delivery.
Some counties have adopted innovative means of communicating with the public. Eldoret, Kitui, Nyeri and Nakuru use brochures, newsletters, and flyers. Embu and Nyeri rely on key opinion leaders (DRoPPS) to pass information to their communities. Bungoma shares talking points on pertinent issues with local leaders, who pass them on to the community. Homa Bay and Kakamega use roadshows, music, art,and sports. Bungoma, Embu, Nakuru, and Nyeri simplify the contents of the budget on live talk shows on community radio stations.
Counties have established varied mechanisms to receive feedback and complaints from citizens. Most counties use interactive social media platforms, including Facebook and Twitter, to get feedback from citizens on laws, policies, implementation of projects, and service delivery. Bomet and Bungoma counties have established citizen blogs on their websites. They ranked among the top-performing counties by citizens, with Bungoma placed second (with 60 percent approval) and Bomet fourth (with 59 percent) (Infotrak 2015). Counties are also using citizen score cards and customer satisfaction surveys to solicit feedback on their performance, with notable success. In Visoi Ward in Nakuru, the county government responded immediately to the results of a community score card implemented at the Lengenet Health Centre, where citizens had indicated the absence of equipment. The missing equipment was delivered shortly after the scoring process. A different approach is the Maji Voice accountability mechanism, being
Table 3.5: Number of countries surveyed providing adequate budget information
County Open Budget Index/level of information provided Number of counties
81–100: Extensive 0
61–80: Significant 0
41–60: Some 0
21–40: Minimal 1 (Nakuru)
0–20: Scant 9 (Bungoma, Garissa, Kajiado, Kisumu, Machakos, Mombasa, Nandi, Nyeri and
Taita Taveta) Source: Institute of Economic Affairs 2015a.
Growth Outlook
11.4
12.4
12.9
14.3
14.3
15.7
15.7
16.7
17.6
30.5
0 5 10 15 20 25 30 35
Kajiado
Mombasa
Garissa
Nyeri
Nandi
Bungoma
Machakos
Kisumu
Taita Taveta
Nakuru
Index
County open budget index
Figure 3.7 Open budget index scores vary widely across counties
Source: Institute of Economic Affairs 2015a.
ACCOUNTABILITY SYSTEMS INCLUDE MECHANISMS FOR CITIzEN FEEDBACK AND COMPLAINTS
Source: URAIA, 2015.

June 2015 | Edition No. 1240
Growth Outlook
MajiVoice is a web-based software that enables utility staff to receive, process, and report on complaints by customers. After a pilot in Nairobi in 2013, the Nairobi City Water and Sewerage Company (NSWSC) launched the system in 2014. It has since been extended to service providers in Mathira, Nakuru, and Nanyuki.
Customers can submit complaints using a dedicated SMS shortcode, an Unstructured Supplementary Service Data (USSD) shortcode, the Internet, or traditional channels such as a hotline number or walk-in service centers. Free hotlines and low-cost Internet and SMS submissions (which cost KSh 1) give customers multiple ways to avoid time and cost-intensive personal service center visits. For each complaint, a unique reference number is sent to the customer free of charge. It can be used to query the complaint status.
Majivoice tracks each complaint and every staff action on it, triggering alerts if set resolution ceiling are exceeded. A recent anonymous staff survey shows positive staff response, with large majorities reporting that the MajiVoice system “made it easier to deal with and follow up on specific complaints” (93 percent) and “improved the way NCWSC deals with complaints” (98percent). About a third of surveyed staff reported that MajiVoice increased their personal workload (34 percent) and increased pressure to deal with customer complaints (37 percent).In another recent survey of close to 500 customers who had used MajiVoice, more than 74 percent had a positive opinion of the reference number system and more than 50 percent had actively used it to follow up on their complaints. Customers who received MajiVoice reference numbers were significantly more likely to feel that NCWSC took their complaint seriously and reported significantly higher satisfaction with NCWSC services in general.
Box 3.3: MajiVoice has increased accountability and customer satisfaction
implemented in the water sector. In its first year of implementation by the Nairobi City Water and Sewerage Company, the number of complaints recorded rose almost tenfold, resolution rates climbed from 46 percent to 94 percent, and time to resolution fell by half (Box 3.3).
Feedback to citizens on the outcomes of their contributions remains inadequate. Although the public has been mobilized to provide input on various policy proposals, rarely has it been provided with feedback on how its contributions influenced the decisions made and the rationale supporting the final decisions. This lack of feedback often results in public participation being viewed as a mere public relations exercise with little genuine intent, which could discourage future participation.
Counties have established a variety of public participation platforms
But what constitutes public participation? If we call two elders who are my friends and sit somewhere in my office, can we call that “public participation”? Right now we are all doing this in our own ways. How can we direct this to do it properly? —Ms. Dorothy Nditi,
Deputy Governor of Embu, December, 2014
Counties have established various structures to facilitate citizen participation, in line with
the County Government Act (Section 91). They include ICT platforms, town hall meetings, budget preparation and validation forums, and stakeholder forums (Table 3.6). Public hearings are the most popular mechanism counties use to reach out to citizens (Commission for the Implementation of the Constitution 2014; ICPAK 2014). Few counties have adopted county-specific legislation on public participation. Bomet, Kajiado, Kiambu, Laikipia, Lamu, Migori, Nyeri, Tana River, and Turkana are some of the counties that have enacted public participation bills. Civil society has worked with some counties in the development of public participation legislation.
Citizens have participated in developing most of the key documents required by law, albeit through unstructured arrangements. Most counties have seen public participation in the development of county integrated development plans, county fiscal strategy papers, budget estimates, finance bills, and other key laws. However, initial participatory forums have been ad hoc and held predominantly at the county and subcounty level rather than at the ward or village level. As a result, participants have had

June 2015 | Edition No. 12 41
to travel long distances and demanded transport allowances in order to attend. This approach has locked out citizens at the ward level (Nizam and Muriu 2015b). Counties have only recently established ward administration offices manned by ward administrators who are responsible for matters relating to participation and civic education at the ward level. More counties have begun holding public meetings at ward levels, sometimes on a quarterly basis, as is the case in Turkana and Kisumu (Institute of Economic Affairs 2015b).
Two years after their creation, few counties have set up or operationalized their CBEFs. The purpose of these forums is to provide a means by which county governments can consult with other stakeholders on preparation of county plans, the county fiscal strategy paper, the budget review and outlook paper, and other PFM–related issues. But the tide appears to be turning. The Commission on Revenue Allocation, in partnership with CSOs, has begun training counties on running CBEFs using recently developed guidelines. Most counties are finally establishing the forums. Some counties realized that the first set of actors nominated to sit in the forum did not comply with the legal requirements and took steps to reconstitute them in order to make the CBEFs more diverse and representative.
One of the biggest challenges for CBEFs—and for participation at the county level more broadly—is weak organization on the part of citizen and interest groups. The CBEFs should include people nominated
by organizations representing professionals; business; labor; and women, people with disabilities, the elderly, and faith-based groups at the county level. The CBEF can work well if well-organized groups of women, businesspeople, laborers, professionals, and vulnerable groups nominate members and hold them accountable for representing their interests in the budget process. The representatives should be balanced across different groups. They should properly source inputs from the wider society and channel feedback to citizens on decisions made, in order to avoid elite capture. The CBEFs offer a structured solution as counties grapple with how to build support for rates and fees and consensus about priority development projects. For them to succeed, interests must organize at the county level in an effective way.
Another challenge for the CBEF is that some counties still have not mastered the budget process. Many are late and have not followed the budget cycle, as laid out in the Public Financial Management Act. County cabinets are struggling to understand how to coordinate to ensure that funding is directed to priority areas. Weak internal coordination processes make it difficult for the public or nonstate CBEF members to know how and when to intervene to influence the budgets in their counties. There is also a growing danger of participation fatigue if the consultation process is not well coordinated. The budget cycle runs from August 31 to June 30. On a number of documents, the public is supposed to be consulted—by the Executive in formulation
Growth Outlook
Table 3.6 Structures established to facilitate citizen participation
StructureNumber of Counties Percent
ICT-based platforms 34 72
Town Hall meetings (structured meetings) 32 68
Budget preparation and validation forums 37 79
Notice boards that announce jobs, appointments, procurement, awards, and other important announcements of public interest 40 85
Development projects sites 33 70
Avenues for participation of peoples’ representatives, including but not limited to members of the National Assembly and Senate 35 76
Establishment of citizen forums at county and decentralized units (also in section 22(1) of the Urban Areas and Cities Act 2011) 26 55
Source: Commission for the Implementation of the Constitution 2014.

June 2015 | Edition No. 1242
and by the Assembly for oversight. Over and above the budget documents, the law requires public consultation on all laws and policies that counties develop. In some cases, the County Executive and Assembly prefer to use separate frameworks; even within the Executive, each department prefers to carry its own participation processes, which may result in too many requests for participation. Ongoing training of county officials on PFM-related processes is targeted at addressing these challenges. It may be useful to consider providing nonstate representatives in the CBEF with similar PFM training to enhance their knowledge of PFM-related processes.
Citizen participation is increasing. Recent surveys and analytical assessments indicate that many citizens find it difficult to participate in county budgeting and planning or influence county decision making. This finding is not surprising, given that counties are still relatively new and participation is a process that will take time to institutionalize itself in county systems and processes. Effective participation depends on the establishment and functioning of PFM and planning systems, human resource capacity, and performance management. It tends to occur more often through representative processes than individual participation. There has, however, been a remarkable increase in the share of citizens attending public forums, from 15 percent in 2014 to 46 percent in 2015 (Transparency International 2015) (Figure 3.8). Nearly half of the respondents sampled in a survey of 16 counties indicated they had participated in public meetings to discuss development projects and budgets. This finding indicates that as counties establish their participatory systems, more citizens are engaging. People who do not attend meetings cite lack of time, illiteracy, limited knowledge of the perceived technical nature of budget and planning processes, and inadequate awareness of the procedures of opportunities and spaces for participation.
The quality of participation is more important than the quantity. Quality participation is achieved through an informed citizenry, representative spaces, and enhanced government systems for sharing information, consulting citizens, and receiving feedback.
Efforts are being undertaken at the county level to plan for and put in place frameworks, structures, and programs to facilitate sustainable civic education, in order to improve both the level and quality of citizen participation. Counties have established or are in the process of establishing civic education units. By the end of the first year of devolution, only six counties (Kirinyaga, Makueni, Meru, Trans Nzoia, West Pokot, and Vihiga) had established such units. Some counties have introduced commendable practices to improve the quality of citizen engagement. Box 3.4 highlights of some of the initiatives undertaken by Nakuru County.
Kenyans are already using the Constitution and the new legal framework to expand public participation. In April 2014, a group of businesspeople (the Matatu Owners Association, quarry owners, and Kiambu residents) filed a court petition against the Kiambu County government on the grounds that the Finance Act of 2013 violated provisions of the Constitution. The complainants argued that no proper public participation was factored into enactment of the act, which contained levies and taxes that the county was not empowered to impose. In 2014 the High Court nullified the Finance Act, ruling that its preparation had not met the thresholds for public participation. The decision set a precedent for public participation in county policy making. In rendering the verdict, the judge indicated that crucial information disseminated to the public should be clear and unambiguous; that members of
Growth Outlook
38
15
41
46
0
5
10
15
20
25
30
35
Perc
ent o
f res
pond
ents 40
45
50
Awareness of meetings Attendance of meetings
2014 2015
Figure 3.8 Citizen awareness and attendance at county government meetings has risen
Source: Transparency International 2015.

June 2015 | Edition No. 12 43
the public cannot participate meaningfully if they are not given enough time to study bills, consider their stance, and formulate representations; and that the mode of advertisement must lend itself to a proper avenue for communication in a largely illiterate and poor community. He ruled that the County Assembly should exhort its constituents to participate in the process of enacting such legislation by making use of churches, mosques, temples, barazas (local public meetings), national and vernacular (local community radio stations, and other avenues. The objective in involving the public in the law-making process is to ensure that legislators are aware of the public’s concerns. This awareness promotes the legitimacy and thus the acceptance of the legislation (Nizam and Muriu 2015b).
The Constitution provides that judicial authority is derived from the people and exercised by courts as a public trust. This notion has radically transformed the attitude and operations of the judiciary. Public engagement is a key tenet of the judicial transformation framework. The judiciary itself has opened itself up to scrutiny and engagement with the public through public vetting of judges and magistrates, judicial march weeks (during which judicial officers hold public meetings explaining how the judiciary works), service weeks (during which judicial officers meet the public and educate them about their services and procedures), the creation of a Directorate of Public Affairs and Communications, station-based open days, community outreach visits, promotion of alternative dispute-resolution mechanisms (including traditional community mechanisms), decentralization of the court of appeals, efforts to establish a High Court in every
county, and the establishment of the Office of the Judiciary Ombudsperson to receive complaints from the public (Government of Kenya 2013).
Compliance with the legal framework on participation takes place incrementally. Counties may not immediately adhere to all the provisions envisaged under the legal framework, as doing so requires not only the setting up of systems and structures but patience and a change of attitude toward public participation. The often minimalist approach to engaging the public—focusing on merely complying with the law—needs to be slowly replaced with deliberate efforts to seek and genuinely incorporate public views in key policy processes. Focus group discussions reveal that county officials are beginning to appreciate the importance of public participation as a building block for instilling ownership and sustainability of projects and programs, promoting trust and better relations with citizens, ensuring inclusive and equitable distribution of resources, improving livelihoods, reducing conflict, and achieving political mileage for reelection to office
Making this change to conduct participation for instrumental reasons requires capacity building and the allocation of sufficient resources to participatory processes. Most counties argue that participation is a costly exercise, because the public have expectations of receiving per diems or handouts for attending public forums. In fact, participation need not be expensive if organized in more structured formats at the village or ward levels, with community representatives selected to channel views upward through the CBEFs.
Growth Outlook
Nakuru County has taken various steps to improve the quality of citizen engagement in devolved processes: • It held a public service week to commemorate the first year of devolution. The goal was to heighten the community’s
awareness of what the county does in terms of delivering infrastructure and services.• Preparation of the 2014/15 finance bill entailed a structured awareness exercise in which a local radio station was
contracted to deliver messages on the content of the bill and indicate was expected from the public with regard to submission of memoranda.
• The County Executive Finance Minister held a live radio interview in which listeners were given the opportunity to ask questions about the finance bill and related issues.
• The Budget and Economic Planning Office, in partnership with an NGO, prepared popular versions of the 2014/2015 budget and the county integrated development plan.
Box 3.4: Nakuru County has launched various initiatives to improve civic education

June 2015 | Edition No. 1244
Citizens need to appreciate the long-term value of their participation. They can do so only when counties respond to their priorities and needs with visible investments. In Nakuru County the community participated in the health facility scoring process in Visoi Ward. It has begun to appreciate the linkages between its involvement in the budgeting process and the allocation of funds to services. Community contributions to budget hearings have increased, potentially influencing budget priorities. These changes among county governments and citizens can be accelerated by demonstrating the benefits of effective public participation from the experiences of others, such as the citizens of Baringo County (Box 3.5).
Kenya’s experience with participation provides counties with a good foundation to strengthen and scale up citizen engagement. Kenyan CSOs, local governments that have been absorbed by counties, and citizens have used a wide range of social accountability approaches and tools, with CSOs working hand in hand with local governments and elected officials. The approaches focus primarily on local service delivery around two development funds, the Constituency Development Fund (CDF) and the Local Authority Trust Fund (LATF). The LATF requires that local authorities conduct ward-level consultative meetings in which local communities identify capital investment projects to meet their local needs and priorities.
These participatory approaches have demonstrated results at the local level, improving the responsiveness of funds to community priorities, documenting the misuse of resources, and demonstrating structured approaches to participation. The more successful initiatives have
often involved significant upfront planning, facilitation, and financing to mobilize community leaders, train citizens and local government officials, and develop user-friendly information. Incentives have also been a primary factor influencing participation for instance, the LATF requirement that local authorities report how they achieved participation in order to access future funds appears to have increased participation (Rose and Omolo 2013).
Engaging citizens is not without challenges. Fragmentation of local development fund procedures and guidelines have made it difficult for citizens to participate and demand accountability. Each of the funds has different implementing agencies, procedures, and entry points for citizen engagement. There are significant differences between official procedures for participation and actual practice, largely as a result of limitations in government capacity. Citizens and CSOs often report difficulties obtaining basic information on local development programs, procedures, and finances. The lack of public comparative data on the performance of local funds also limits the ability of citizens to assess performance and hold service deliverers to account (Finch 2015).
CSO-led monitoring efforts face challenges of scale and sustainability. CSOs have piloted multiple methodologies for social accountability and citizen participation over the past decade, but they often proved unsustainable when funding expires. They were external to government and applied different methodologies and metrics, with results typically disseminated through small print runs or posted on CSO websites. As a result, it was difficult for citizens to see aggregated results of citizen participation that compared performance across different
Growth Outlook
After receiving training on reading and interpreting the budget, the Endorois community of Lower Mochongoi (a subcounty in Baringo) noted that the 2013/14 and 2014/15 county budget ward development project distribution had consistently been unequitable. Out of KSh 56 million spent in the ward in previous financial years, only KSh 4 million had been allocated to the lower Mochongoi area, with the rest going to Upper Mochongoi. During the budget formulation process in February, the community turned out in large numbers. Their concern led the County Executive Committee member for finance and planning to call for a halt of the meeting and the convening of a smaller forum to discuss the disparities. A community committee deliberated on the matter with the county. The outcomes of the deliberation led to a redistribution of four projects from Upper Mochongoi to Lower Mochongoi. The county planning unit also committed to upscale community consultations to ensure that community priorities and concerns are included in the budgeting process.
Box 3.5: Citizens in Baringo County achieved a more equitable distribution of resources

June 2015 | Edition No. 12 45
Constituency Development Funds (CDF) or local authorities. Funding modalities can exacerbate such challenges, because funding tends to be directed to single organizations to enhance citizen participation rather than to coalitions applying common methodologies across a larger group of local funds. Funding is also not regularly tied to how well a CSO itself is linked with citizen or to how well it builds mechanisms through which citizen engagement can be continued after initial funding ends. These lessons as well as county experiences provide useful insights for enhancing future public participation.
3.4 How can public participation be enhanced?
Enhancing participation requires sustained efforts by government and civil society to
establish structured processes that are efficient and inclusive. These structured participatory processes should complement and support existing internal accountability mechanisms. Counties need to strengthen their own internal mechanisms of accountability, including PFM systems, audit, and monitoring; participation should be an additional mechanism for reinforcing accountability. Building the capacities of county officials to engage citizens is critical, but basic capacities for service delivery and resource management should simultaneously be strengthened. If counties lack adequate funds and functionaries to deliver services, the public may question whether participation matters.
Policy makers can take several steps to help make public participation more effective. They can be achieved through an incremental and strategic approach that focuses on two or three programs or mechanisms. Efforts require specific actions from national and county governments and nonstate actors.
Actions by the national government1. Develop and disseminate clear guidelines for
citizen participation at the national and county levels, based on wide consultations with counties and civil society. The Ministry of Devolution and Planning has held meetings with both counties and civil society on draft county public participation guidelines and is consolidating the feedback into a final document. National
guidelines will help ensure that while counties prepare their own frameworks, minimum standards are observed that give all citizens equal opportunity of engaging (Finch and Omolo 2015).
Actions by county governments, with support from the national government2. Invest in building the capacity of county service
providers to involve citizens in local service delivery. Key entry points include the following: • Train civil servants on new responsibilities by
incorporating material in civil servant training programs on PFM (budgeting, accounting, reporting, procurement, and auditing); planning; and monitoring and evaluation that helps civil servants apply legal provisions for transparency, participation, and accountability. Training should be accompanied by on-the-job technical assistance or mentoring.
• Ensure that participation processes are adequately resourced and staffed. Counties need to plan, budget, and staff public participation processes as part of the overall budget formulation process. They need to designate staff with responsibility for supporting participatory processes and monitor and reward good performance.
• Conduct civic education so that citizens understand the basic roles, functions, and responsibilities of county assemblies and executives through civic education programs and handbooks that explain entry points for citizens in county budget making, planning, and performance monitoring (Finch and Omolo 2015).
3. Develop county government systems to facilitate participatory processes. Facilitating public participation will depend partly on building internal government capacity and systems for planning and managing public finances and procurement, monitoring, and aligning civil servant roles. It will also require focused efforts to integrate participatory processes into these systems, in order to create and disseminate user-friendly information (on budgets, plans, and legislation) and link it with communication
Growth Outlook

June 2015 | Edition No. 1246
plans; mobilize citizens; conduct participatory planning and budgeting processes; and put in place effective recourse mechanisms (Finch and Omolo 2015). Doing so will require the following actions: • Structure county planning, budgeting, and
monitoring processes so that they include opportunities for citizen engagement. Counties need to be supported to make CBEFs operational and to design and structure effective participation forums at the subcounty and ward level that link to the CBEF. The structures developed should provide clear mechanisms for communicating the agenda for consultations, including a timeline of when and where consultations should take place; disseminating key documents; providing clarity on what citizens are being asked to comment on, with public notices and invitations clearly providing a summary of the resource persons, proposed summary expenditures, and targeted revenues; and producing simplified feedback tools that make public submissions easy to incorporate (Omolo 2015). Citizens could help monitor service delivery through the use of citizen score cards, with a platform provided for dialogue between service delivery providers and users.
• Ensure that the CBEF incorporates mechanisms for engaging with marginalized and vulnerable groups and allowing them to select representatives who will act as links to the CBEF. Representatives should be able to provide guidance to the CBEF on the specific needs of their communities, including ideal communication and grievance mechanisms.
• Develop and monitor robust complaint-handling and recourse systems that track citizen comments and county government responses, aggregate this information, and regularly report to counties on major types of complaints and whether they were resolved. Almost all counties have some sort of system for handling complaints, but these systems fall short of the standards prescribed to handle complex complaints (such as fraud and corruption).
4. Establish strong incentives for county and other subnational service providers to be transparent and foster inclusive citizen participation. Several actions would strengthen these incentives: • Systematically measure and compare local
government performance and citizen satisfaction on metrics that citizens care about. Citizens will demand greater accountability when they have comparative data on how their counties are performing. Annually updating and making this information public can increase incentives to improve service delivery performance based on systematic assessments of progress.
• Develop and publish an index measuring participation across counties, possibly as a subset of other county performance indicators. Doing so would provide a mechanism for identifying good practices and showing where additional support is needed. Government and/or civil society will need to develop systems that regularly review and compare the quality of citizen participation processes across counties. County performance on participation could be linked to financing and other incentives (awards, recognition of good practice).
Actions by civil society and donors5. CSOs can expand partnerships to help counties
build effective systems and processes for participation, transparency, and mobilization. CSOs bring rich experience on how counties can operationalize transparency, participation, and recourse mechanisms. Individual counties are enlisting them to help them structure and carry out participation processes. Government and CSOs can reinforce and expand this collaboration. There is a need to strengthen and incentivize emerging and existing partnerships, such as the Devolution Forum, as well as county-level CSO networks (Finch and Omolo 2015).
Growth Outlook
June 2015 | Edition No. 12 47
Donors can support Kenyan CSOs in their efforts to help build responsive and accountable county institutions in a variety of ways:• Support partnerships between experienced
civil society actors and county governments to design, test, and roll out participatory planning, budgeting, and monitoring systems and participatory approaches to enhance county service delivery.
• Increase long-term support for coalitions and networks that bring together CSOs working on devolution to exchange knowledge on their interventions, use common criteria for monitoring counties, put civic education materials and data on devolution on shared platforms, and build clearinghouses.
Growth Outlook

June 2015 | Edition No. 1248

June 2015 | Edition No. 12 49
REFERENCES
• Commission for the Implementation of the Constitution. 2014. An Assessment of the Implementation of the System of Devolved Government: From Steps to Strides. Nairobi.
• Cabannes, Y. 2014. Contribution of Participatory Budgeting to Provision and Management of Basic Services: Municipal Practices and Evidence from the Field. International Institute for Environment and Development, London.
• Doing Business Indicators. Database. World Bank, Washington, DC. http://www.doingbusiness.org/data.• Finch, C. 2015. “Participation in Kenya’s Local Development Funds: Reviewing the Past to Inform the
Future.” World Bank and Kenya School of Government Working Paper Series 3, Washington, DC. • Finch, C., and A. Omolo. 2015. “Building Public Participation in Kenya’s Devolved Government.” World
Bank and Kenya School of Government Working Paper Series 1, Washington, DC.• Fiszbein, A., and D. Ringold. 2011. Social Accountability and the Delivery of Social Services. What Have We
Learned www.odi.org/sites/odi.org.uk/files/odi-assets/events-presentations/1216.pdf.• Fox, J. 2014. “Social Accountability: What Does the Evidence Really Say?” Working Paper Series 1, Global
Partnership for Social Accountability, Washington, DC. • Freedom House. 2013. "Freedom on the Net Status and Freedom of the Media." www.freedomhouse.org. • Gaventa, J., and B. Gregory. 2010. “So What Difference Does It Make? Mapping the Outcomes of Citizen
Engagement.” Working Paper 347, Institute of Development Studies, University of Sussex, Brighton, United Kingdom.
• Government of Kenya. 2013. "State of the Judiciary and Administration of Justice Report." Annual Report No. 2, Nairobi.
• ICPAK (Institute of Certified Public Accountants of Kenya). 2014. Public Finance Building Blocks for Devolution: A Baseline Survey in Devolution in Kenya with Respect to Public Financial Management Systems One Year On. Nairobi.
• Infotrak. 2015. "The County Trak Index." http://countytrak.infotrakresearch.com.• International Budget Partnership. 2012. Open Budget Survey. http://internationalbudget.org/wp-content/
uploads/OBI2012-Report-English.pdf.• ———. 2015a. "Are Counties Making Budget Documents Available to the Public?" A Review of County
Websites. Nairobi. • ———. 2015b. “Budget 2015/16: Progress toward Transparency.” Presentation. Nairobi.• IMF (International Monetary Fund). 2015. "Regional Economic Outlook 2015." Washington, DC.• Institute for Development Studies, University of Nairobi, and Michigan State University. 2011.
"Afrobarometer Survey in Kenya: Round 5 Summary of Results." http://www.afrobarometer.org/publications/kenya-round-5-summary-results-2011
• Institute of Economic Affairs. 2015a. "Sub-National Budget Transparency: Case of 10 Counties in Kenya."• ———2015b. Review of status of Public Participation and County Information Dissemination Frameworks:
A Case Study of Isiolo, Kisumu, Makueni and Turkana Counties. Nairobi.• IpsosSynovate. 2014. "Current Affairs Poll Report." http://www.ipsos.co.ke/home/index.php/downloads.• Kenya National Bureau of Statistics. 2015a. "Economic Survey 2015." Nairobi. ———. 2015b. Leading Economic Indicators, Nairobi. • Muriu, A. R. 2014. "How Does Citizen Participation Impact Decentralized Service Delivery? Lessons
from the Kenya Local Authority Service Delivery Action Plan." LASDAP 2002-2010, International Budget Partnership. www.Internationalbudget.org/wp-content/uploads/How-does-Public-Particicipation-Influence-Decentralized-Service-Delivery-Muriu-April-2014.pdf.
• National Democratic Institute. 2014. "All County Survey, July 2014." Nairobi. • National Treasury. 2014. "Quarterly Economic and Budgetary Review. Third Quarter." Nairobi

June 2015 | Edition No. 1250
———. 2015a. Medium Term Budget Policy Statement. February, Nairobi. ———. 2015b. Quarterly Economic and Budgetary Review. Fourth Quarter. Nairobi.• Nizam, R., and A. Muriu. 2015a. “Basic Requirements for Public Participation in Kenya’s Legal Framework.”
World Bank and Kenya School of Government Working Paper Series 2, Washington, DC. ———. 2015b. “One Year On: Review of Country Initiatives in Public Participation in the Roll Out of
Devolution.” World Bank and Kenya School of Government Working Paper Series 5, Washington, DC.• Office of the Controller of Budget. 2015. "County Budget Implementation Review Report." Half Year
2014/15, February. Nairobi.• O’Meally, S. C. 2015. “Social Accountability to Improve Governance and Development Outcomes in India:
Towards Lessons and Global Frontier Issues.” Presentation of initial findings from a working paper, World Bank Washington, DC. www.thegpsa.org/sa/event/bbl-citizens-governance-outcomes-India.
• Omolo, A. 2015. “Practical Approaches for County Governments to Facilitate Public Participation in the Planning and Budget Process.” World Bank and Kenya School of Government Working Paper Series 6, Washington, DC.
• Rose, J., and A. Omolo. 2013. "Six Case Studies of Local Participation in Kenya." World Bank, Washington, DC.
• Rossiasco, P., E. Alda, and P. Francis. 2008. "Crime and Violence in Poor Urban Communities in Nairobi. Kenya Case Study." World Bank, Washington, DC.
• Society for International Development. 2012. "The Status of Governance in Kenya. A Baseline Survey Report." Nairobi.
• Transparency International. 2014. "Corruption Perception Indicators. 2014." Berlin. ———. 2015. Uongozi Mashinani. A national opinion poll on devolution and governance in Kenya. Nairobi• Worldwide Governance Indicators. Database. http://info.worldbank.org/governance/wgi/.• World Bank. 2011. "Violence in the City. Understanding and Supporting Community Responses to Urban
Violence." World Bank, Washington DC. ———. 2012. "Kenya at work: Energizing the economy and creating jobs." Kenya Economic Update Edition
No. 7. Nairobi. ———. 2013a. "Country Policy and Institutional Assessment Indicators." Washington, DC. http://
datatopics.worldbank.org/cpia/. ———. 2013b. World Wide Governance Indicators. Washington, DC. ———. 2014. Republic of Burundi, Decentralization and Local Service Provision under Fiscal Constraints:
Managing Trade-Offs to Promote Sustainable Reforms. Washington, DC. ———. 2015. “Supporting Poor-Inclusive Water and Sanitation Sector Reform. Maji Voice: A
New Accountability Tool to Improve Public Service.” Policy Note, Water and Sanitation Program, Washington, DC.
• World Bank, and IFC (International Finance Corporation). 2013. "Enterprise Surveys: Kenya Country Profile." http://www.enterprisesurveys.org/data/exploreeconomies/2013/kenya.
• Yilmaz, S., G. Alam, S. Gurkan, S. Mahieu, M. Felicio, and V. Venugopal. 2009. "Local Government Discretion and Accountability: Application of a Local Governance Framework." World Bank, Washington, DC.
References

ANNEXES
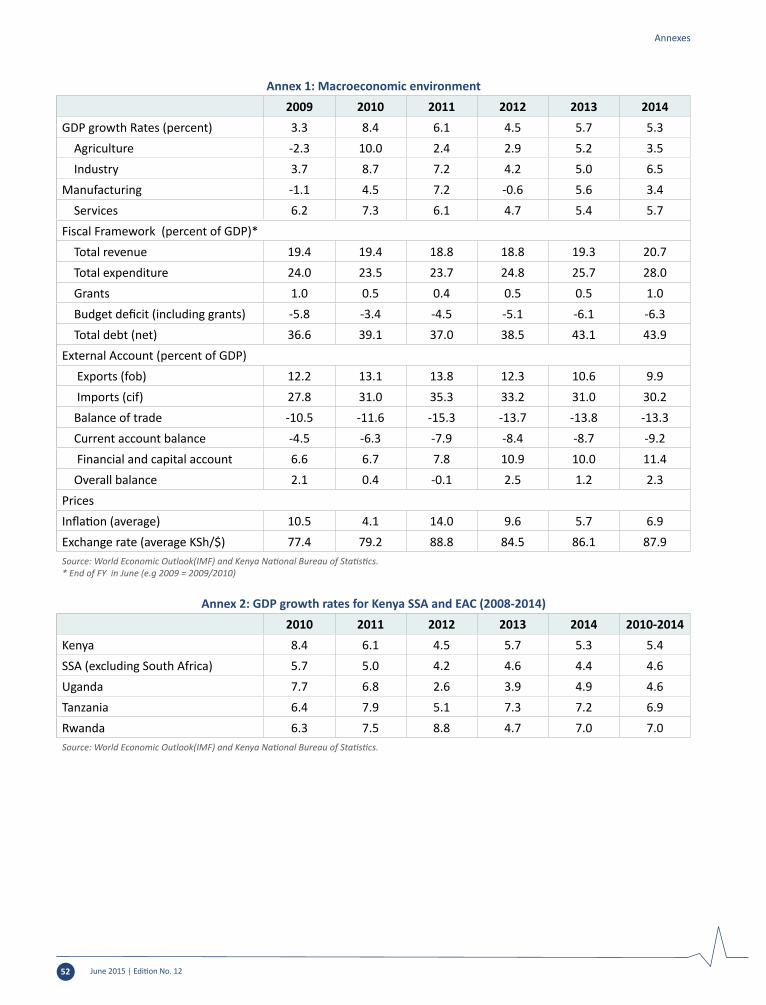
June 2015 | Edition No. 1252
Annexes
Annex 1: Macroeconomic environment2009 2010 2011 2012 2013 2014
GDP growth Rates (percent) 3.3 8.4 6.1 4.5 5.7 5.3 Agriculture -2.3 10.0 2.4 2.9 5.2 3.5 Industry 3.7 8.7 7.2 4.2 5.0 6.5Manufacturing -1.1 4.5 7.2 -0.6 5.6 3.4 Services 6.2 7.3 6.1 4.7 5.4 5.7Fiscal Framework (percent of GDP)* Total revenue 19.4 19.4 18.8 18.8 19.3 20.7 Total expenditure 24.0 23.5 23.7 24.8 25.7 28.0 Grants 1.0 0.5 0.4 0.5 0.5 1.0 Budget deficit (including grants) -5.8 -3.4 -4.5 -5.1 -6.1 -6.3 Total debt (net) 36.6 39.1 37.0 38.5 43.1 43.9External Account (percent of GDP) Exports (fob) 12.2 13.1 13.8 12.3 10.6 9.9 Imports (cif) 27.8 31.0 35.3 33.2 31.0 30.2 Balance of trade -10.5 -11.6 -15.3 -13.7 -13.8 -13.3 Current account balance -4.5 -6.3 -7.9 -8.4 -8.7 -9.2 Financial and capital account 6.6 6.7 7.8 10.9 10.0 11.4 Overall balance 2.1 0.4 -0.1 2.5 1.2 2.3PricesInflation (average) 10.5 4.1 14.0 9.6 5.7 6.9Exchange rate (average KSh/$) 77.4 79.2 88.8 84.5 86.1 87.9Source: World Economic Outlook(IMF) and Kenya National Bureau of Statistics.* End of FY in June (e.g 2009 = 2009/2010)
Annex 2: GDP growth rates for Kenya SSA and EAC (2008-2014)2010 2011 2012 2013 2014 2010-2014
Kenya 8.4 6.1 4.5 5.7 5.3 5.4SSA (excluding South Africa) 5.7 5.0 4.2 4.6 4.4 4.6Uganda 7.7 6.8 2.6 3.9 4.9 4.6Tanzania 6.4 7.9 5.1 7.3 7.2 6.9Rwanda 6.3 7.5 8.8 4.7 7.0 7.0Source: World Economic Outlook(IMF) and Kenya National Bureau of Statistics.

June 2015 | Edition No. 12 53
Annexes
Annex 4.a: Broad sectors growth (half year, percent)Year Half Agriculture Industry Services GDP
2010H1 10.1 5.5 6.5 7.1H2 10.1 11.7 8.1 9.8
2011H1 3.0 9.4 6.7 7.1H2 1.5 5.3 5.5 5.1
2012H1 2.9 3.9 4.8 4.4H2 3.1 4.5 4.6 4.6
2013H1 6.4 7.3 5.3 6.6H2 3.7 2.8 5.5 4.8
2014H1 2.1 8.7 5.6 5.4H2 5.3 4.4 5.7 5.2
Source: Kenya National Bureau of Statistics. Note: 'Agriculture = Agriculture, forestry and Fishing Industry = Mining and quarrying + Manufacturing + Electricity and gas + Water supply and sewerage + Construction Services = Wholesale and retail trade + Accomodation and restaurant + Transport and storage + Information and communication + Financial and insurance + Public administration + Professional, administrative and support services + Real estate + Education + Health + Other services + FISIM
Annex 3: Kenya annual GDPYears GDP,
current prices
GDP, 2001 constant
prices
GDP/capita, current prices
GDP growth
KShBillions
KShBillions
US$Billions
Percent
2007 2151 2766 847 6.92008 2483 2772 926 0.22009 2864 2864 930 3.32010 3169 3104 978 8.42011 3726 3294 998 6.12012 4261 3444 1167 4.52013 4731 3640 1238 5.72014 5358 3834 1338 5.3Source: Kenya National Bureau of Statistics and World Bank Development Indicators.

June 2015 | Edition No. 1254
Annexes
Anne
x 4.
b: Q
uart
ely
grow
th ra
tes (
perc
ent)
Year
sQ
uart
ers
AGRI
CULT
URE
INDU
STRY
SERV
ICES
GDP
Q/Q
-1Q
/Q-4
(Q:Q
-3)/
(Q-4
:Q-7
)Q
/Q-1
Q/Q
-4(Q
:Q-3
)/(Q
-4:Q
-7)
Q/Q
-1Q
/Q-4
(Q:Q
-3)/
(Q-4
:Q-7
)Q
/Q-1
Q/Q
-4(Q
:Q-3
)/(Q
-4:Q
-7)
2011
142
.72.
97.
9-4
.28.
09.
0-0
.47.
97.
87.
27.
68.
62
-9.4
3.2
5.9
2.4
10.8
10.5
-2.1
5.6
7.4
-3.2
6.7
8.4
3-2
2.7
3.8
5.0
1.2
4.3
8.9
6.0
5.9
7.1
-1.6
5.8
7.9
4-0
.7-0
.82.
47.
06.
37.
21.
75.
16.
12.
34.
46.
120
121
48.9
3.5
2.6
-4.6
5.8
6.7
-1.0
4.4
5.2
7.5
4.7
5.4
2-1
0.6
2.1
2.3
-1.2
2.0
4.6
-1.3
5.3
5.2
-3.6
4.3
4.8
3-2
2.7
2.0
1.9
3.8
4.6
4.7
5.2
4.5
4.8
-1.4
4.5
4.4
41.
34.
12.
96.
74.
44.
21.
94.
84.
72.
54.
74.
520
131
51.9
6.3
3.8
-0.5
8.9
5.0
-1.6
4.1
4.7
8.8
6.0
4.9
2-1
0.4
6.6
5.0
-4.1
5.7
5.9
1.0
6.5
5.0
-2.6
7.0
5.6
3-2
2.9
6.4
5.9
4.6
6.5
6.4
4.0
5.4
5.2
-1.7
6.8
6.2
4-3
.90.
95.
2-0
.4-0
.65.
02.
25.
65.
4-1
.22.
95.
720
141
53.8
2.2
4.0
7.0
6.9
4.6
-2.5
4.6
5.5
10.8
4.8
5.4
2-1
0.4
2.1
2.8
-0.9
10.5
5.8
2.8
6.5
5.5
-1.4
6.1
5.1
3-1
9.3
6.8
2.9
-1.6
4.0
5.1
3.1
5.5
5.6
-2.4
5.4
4.8
4-6
.63.
83.
50.
44.
86.
52.
66.
05.
7-1
.55.
15.
320
151
54.8
4.4
4.2
7.7
5.9
6.3
-3.1
5.1
5.8
10.1
4.9
5.4
Sour
ce: W
orld
Ban
k, b
ased
on
data
from
Ken
ya N
ation
al B
urea
u of
Sta
tistic
s.

June 2015 | Edition No. 12 55
Annexes
Annex 5: Inflation Year Month Overall
inflationFood
inflationEnergy
inflationCore
inflation
2013
January 3.7 2.4 3.9 5.2February 4.5 4.0 4.6 4.9March 4.1 2.9 5.3 4.8April 4.1 3.6 4.3 4.6May 4.1 4.3 3.5 4.1June 4.9 6.5 3.5 4.1July 6.0 8.4 4.6 4.4August 6.7 9.7 5.3 4.3September 8.3 12.6 5.7 5.4October 7.8 12.0 4.8 5.4November 7.4 10.7 5.1 5.5December 7.1 10.4 5.1 5.1
2014
January 7.2 10.1 5.5 5.4February 6.9 9.1 5.6 5.5March 6.3 8.3 4.7 5.4April 6.4 8.1 5.9 5.3May 7.3 8.9 8.1 5.6June 7.4 8.4 9.0 5.6July 7.7 9.1 9.1 5.5August 8.4 10.9 8.6 5.6September 6.6 8.4 7.2 4.4October 6.4 8.2 7.0 4.4November 6.1 7.5 6.4 4.6December 6.0 7.7 6.0 4.5
2015
January 5.5 7.7 4.5 4.1February 5.6 8.7 3.3 4.1March 6.3 11.0 2.9 3.9April 7.1 13.4 1.5 4.0May 6.9 13.2 0.3 4.2June 7.0 13.4 0.2 4.4
Source: World Bank, based on data from Kenya National Bureau of Statistics.

June 2015 | Edition No. 1256
Annexes
Annex 6: Tea production and exports
Year MonthProduction
MTPrice
KSh/KgExports
MTExports value
KSh million
2013
January 45,390 284 40,190 11,383
February 38,503 271 34,585 10,071March 33,368 241 32,534 8,619April 38,230 210 33,662 8,012May 39,600 215 40,936 9,463June 30,530 209 37,783 8,515July 26,229 212 43,761 9,911August 26,338 208 36,175 8,236September 32,800 191 34,082 7,635October 44,283 174 33,532 6,977November 35,463 187 40,054 7,834December 41,719 212 38,741 7,991
2014
January 44,970 236 38,652 8,784February 33,774 203 33,514 7,317March 33,336 187 37,642 7,938April 39,975 188 37,439 7,782May 41,186 179 36,216 7,380June 31,945 178 39,011 7,692July 30,790 200 42,393 8,468August 26,756 191 38,121 7,974September 33,321 178 35,961 7,244October 45,368 180 37,637 7,444November 38,614 182 38,275 7,595December 45,071 182 41,631 8,379
2015
January 41,653 212 40,970 8,485February 24,276 221 41,086 9,313March 15,688 250 35,700 8,796April 23,837 258 28,262 7,189May 37,523 297 27,016 7,506June 32,286 319 35,915 11,263
Source: Kenya National Bureau of Statistics.

June 2015 | Edition No. 12 57
Annexes
Annex 7: Coffee production and exports
Year MonthProduction
MTPrice
KSh/KgExports
MTExports value
KSh million
2013
January 3,938 344 2,790 1,062
February 4,825 320 3,955 1,429March 4,074 327 3,179 1,188April 6,038 279 3,986 1,362May 4,482 230 5,164 1,790June 2,307 207 5,238 1,778July 830 251 4,652 1,556August 3,411 297 4,741 1,409September 2,442 286 4,802 1,436October 1,580 239 3,899 1,303November 1,882 256 3,808 1,153December 2,133 274 2,675 862
2014
January 2,850 293 3,169 1,055February 5,382 399 3,078 1,118March 6,212 459 4,584 1,533April 6,611 393 4,858 2,013May 3,747 349 4,594 2,024June 2,860 358 4,587 2,007July 1,292 315 5,425 2,383August 3,214 381 3,313 1,474September 3,424 404 3,944 1,722October 2,801 423 3,618 1,645November 1,703 410 3,718 1,747December 2,354 414 2,551 1,192
2015
January 2,795 412 2,844 1,307February 4,837 489 2,884 1,339March 5,571 378 4,290 2,025April 3,714 310 3,948 1,901May 2,969 289 4,383 2,236June 0 0 4,220 2,068
Source: Kenya National Bureau of Statistics.

June 2015 | Edition No. 1258
Annexes
Annex 8: Horticulture exports
Year MonthExports
MTExports valueKSh million
2013
January 18,398 9,071
February 21,576 9,198March 19,814 7,061April 19,790 5,228May 17,135 5,924June 15,181 6,996July 15,193 4,971August 15,005 6,304September 17,589 5,036October 20,292 9,118November 17,689 7,290December 16,165 7,182
2014
January 18,494 8,376February 19,640 7,729March 18,834 9,741April 20,569 6,636May 19,858 7,533June 18,237 6,536July 17,114 6,138August 16,459 5,203September 18,488 5,479October 19,638 7,380November 17,089 7,815December 15,825 5,517
2015
January 18,170 6,413February 20,599 7,892March 21,279 10,510April 21,410 6,223May 19,147 7,241
Source: Kenya National Bureau of Statistics.

June 2015 | Edition No. 12 59
Annexes
Annex 9: Local electricity generation by source
Year MonthHydro
KWh millionGeo-thermalKWh million
ThermalKWh million
TotalKWh million
2013
January 377 129 169 675
February 333 113 160 606March 348 135 163 645April 345 152 140 637May 377 159 133 668June 378 162 131 671July 386 158 157 701August 377 158 182 717September 377 153 175 705October 385 151 211 746November 358 151 222 731December 347 161 198 705
2014
January 339 179 226 747February 270 145 257 674March 287 171 279 737April 308 170 240 717May 250 191 296 737June 263 221 246 730July 254 258 252 763August 294 247 224 765September 278 293 164 735October 279 339 157 775November 307 322 122 751December 282 382 94 758
2015
January 278 388 109 776February 230 352 121 703March 246 377 134 757April 264 359 121 744May 301 380 103 784June 297 362 109 769
Source: Kenya National Bureau of Statistics.

June 2015 | Edition No. 1260
Annex 10: Soft drinks, sugar, galvanized sheets and cement production
Year MonthSoft drinks
litres (thousands)Sugar
MT
Galvanized sheets
MTCement
MT
2013
January 32,756 49,046 25,528 393,921
February 36,014 50,036 22,874 380,032March 42,499 43,647 26,297 367,673April 27,450 39,151 26,010 365,579May 27,851 36,529 23,866 414,161June 31,362 49,512 26,147 422,519July 28,909 61,802 25,007 454,288August 28,143 58,687 27,398 432,938September 36,474 50,303 25,051 453,542October 35,258 52,751 27,588 487,594November 36,777 54,752 26,421 464,834December 43,534 53,994 22,965 422,048
2014
January 39,007 64,298 22,090 454,960February 39,146 60,044 18,573 442,636March 40,320 63,365 21,267 478,416April 37,885 47,279 25,989 468,022May 40,430 44,094 27,433 464,695June 28,706 42,866 24,465 464,929July 33,790 55,912 21,779 503,428August 33,404 50,140 25,733 492,801September 35,899 47,915 26,126 499,479October 41,601 42,197 26,732 553,186November 40,134 34,455 25,763 545,041December 49,142 64,298 18,539 492,944
2015
January 45,282 63,127 33,543 511,298February 40,021 57,917 17,261 465,471March 50,388 63,389 19,299 533,294April 39,120 46,280 20,074 519,821May 40,112 44,081 19,829 504,819June 503,271
Source: Kenya National Bureau of Statistics.
Annexes

June 2015 | Edition No. 12 61
Annex 11: Tourism arrivals Year Month JKIA MIA TOTAL
2013
January 85,538 26,446 111,984
February 48,970 24,031 73,001 March 52,103 17,850 69,953 April 61,685 6,739 68,424 May 69,751 4,772 74,523 June 91,083 6,692 97,775 July 112,332 11,460 123,792 August 33,749 23,334 57,083 September 83,986 11,721 95,707 October 89,045 12,352 101,397 November 81,242 19,068 100,310 December 103,514 25,159 128,673
2014
January 75,906 19,853 95,759 February 50,270 18,334 68,604 March 76,561 15,041 91,602 April 59,357 7,293 66,650 May 54,334 3,967 58,301 June 42,549 4,758 47,307 July 78,902 7,764 86,666 August 82,465 10,962 93,427 September 53,743 6,778 60,521 October 52,606 6,323 58,929 November 51,480 7,153 58,633 December 65,427 9,570 74,997
2015
January 40,846 10,107 50,952 February 45,141 7,882 53,053 March 66,121 6,958 73,079 April 49,933 4,020 53,953 May 50,764 2,511 53,275 June 59,867 3,218 63,146
Source: Kenya National Bureau of Statistics.
Annexes
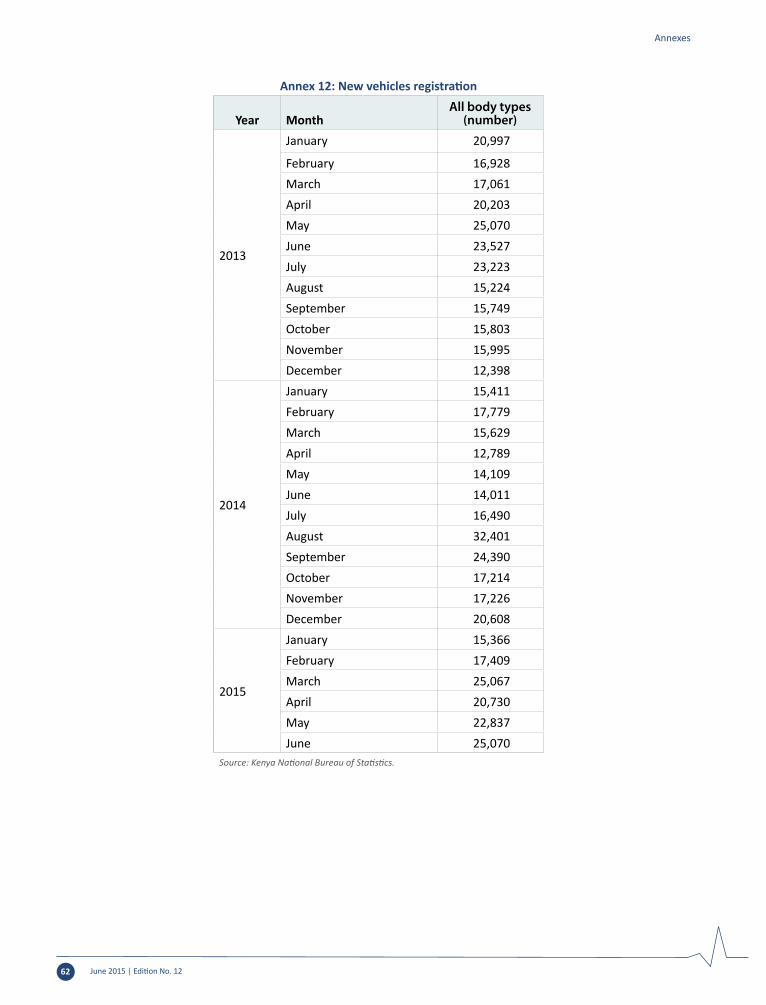
June 2015 | Edition No. 1262
Annex 12: New vehicles registration
Year MonthAll body types
(number)
2013
January 20,997
February 16,928 March 17,061 April 20,203 May 25,070 June 23,527 July 23,223 August 15,224 September 15,749 October 15,803 November 15,995 December 12,398
2014
January 15,411 February 17,779 March 15,629 April 12,789 May 14,109 June 14,011 July 16,490 August 32,401 September 24,390 October 17,214 November 17,226 December 20,608
2015
January 15,366 February 17,409 March 25,067 April 20,730 May 22,837 June 25,070
Source: Kenya National Bureau of Statistics.
Annexes

June 2015 | Edition No. 12 63
Annex 13: Exchange rate Year Month USD UK pound Euro
2013
January 86.9 138.8 115.5
February 87.4 135.5 116.9March 85.8 129.4 111.3April 84.2 128.8 109.6May 84.1 128.7 109.2June 85.5 132.4 112.8July 86.9 131.9 113.7August 87.5 135.5 116.5September 87.4 138.5 116.7October 85.3 137.3 116.3November 86.1 138.6 116.2December 86.3 141.4 118.2
2014
January 86.2 142.0 117.5February 86.3 142.8 117.8March 86.5 143.8 119.6April 86.7 145.1 119.8May 87.4 147.3 120.1June 87.6 148.1 119.2July 87.8 150.0 118.9August 88.1 147.2 117.4September 88.8 145.0 114.7October 89.2 143.7 113.2November 90.0 142.0 112.3December 90.4 141.5 111.5
2015
January 91.4 138.5 106.3February 91.5 140.2 103.9March 91.7 137.5 99.4April 93.4 139.6 100.7May 96.4 149.1 107.5June 98.6 155.1 110.4
Source: Central Bank of Kenya.
Annexes

June 2015 | Edition No. 1264
Annex 14: Interest rates Short-term Long -term
Interbank91-Treasury
billCentral
bank rate
Average deposit
rate Savings
Overall weighted lending
rate
Interest rate
spread
2013
January 5.9 8.1 9.5 6.5 1.7 18.1 11.6
February 9.0 8.4 9.5 6.3 1.6 17.8 11.6March 8.8 9.9 9.5 6.5 1.4 17.7 11.2April 7.9 10.4 8.5 6.4 1.5 17.9 11.5May 7.2 9.5 8.5 6.5 1.5 17.5 10.9June 7.2 6.2 8.5 6.7 1.7 17.0 10.3July 8.0 5.9 8.5 6.6 1.6 17.0 10.4August 9.0 10.0 8.5 6.4 1.7 17.0 10.6September 7.8 9.6 8.5 6.5 1.6 16.9 10.3October 10.7 9.7 8.5 6.4 1.6 17.0 10.6November 10.8 9.9 8.5 6.6 1.6 16.9 10.3December 9.1 9.5 8.5 6.6 1.6 17.0 10.3
2014
January 10.4 9.3 8.5 6.6 1.6 17.0 10.5February 8.8 9.2 8.5 6.6 1.5 17.1 10.5March 6.5 9.0 8.5 6.6 1.6 16.9 10.3April 7.4 8.8 8.5 6.5 1.5 16.7 10.2May 7.8 8.8 8.5 6.4 1.5 17.0 10.6June 6.6 9.8 8.5 6.6 1.5 16.4 9.8July 8.1 9.8 8.5 6.6 1.3 16.9 10.3August 11.8 8.3 8.5 6.5 1.5 16.3 9.8September 7.4 8.4 8.5 6.6 1.5 16.0 9.4October 6.8 8.7 8.5 6.6 1.6 16.0 9.4November 6.9 8.6 8.5 6.7 1.5 15.9 9.2December 6.9 8.6 8.5 6.8 1.8 16.0 9.2
2015
January 7.2 8.6 8.5 6.6 1.6 15.9 9.3February 6.9 8.6 8.5 6.7 1.5 15.5 8.8March 6.8 8.5 8.5 6.6 1.5 15.5 8.8April 8.9 8.4 8.5 6.6 1.9 15.4 8.8May 11.1 8.3 8.5 6.6 1.5 15.3 8.7June 11.8 8.3 10.0 6.6 1.9 15.5 8.8
Source: Central Bank of Kenya.
Annexes

June 2015 | Edition No. 12 65
Anne
x 15
: Cre
dit t
o pr
ivat
e se
ctor
Total private sector annual growth rates
Agriculture
Manufacturing
Trade
Building and construction
Transport and communication
Finance and insurance
Real estate
Mining and quarrying
Private households
Consumer durables
Business services
Other activities
2013
Janu
ary
12.0
13
.3
16.9
9.
0 33
.6
-11.
3 29
.9
16.9
5.
2 7.
3 9.
8 23
.1
10.0
Febr
uary
11.6
8.
0 15
.1
10.1
22
.4
-12.
9 -2
.6
17.3
8.
6 14
.0
8.3
24.5
11
.0
Mar
ch11
.2
11.0
12
.6
10.2
23
.9
-15.
3 -9
.5
15.8
4.
3 11
.0
6.7
24.0
19
.6
April
10.5
4.
2 11
.6
7.6
17.5
-1
2.1
-2.4
13
.9
-17.
7 16
.5
8.2
27.1
16
.9
May
9.5
2.0
4.9
7.3
13.2
-1
3.2
4.2
14.0
-9
.8
24.8
7.
7 37
.4
-0.4
Ju
ne12
.7
1.9
5.5
10.3
11
.1
-7.2
11
.0
-1.2
-1
6.0
27.1
13
.5
45.5
34
.8
July
13.5
6.
5 6.
4 11
.0
9.6
6.3
-0.8
17
.5
-13.
4 27
.3
13.6
36
.0
7.3
Augu
st16
.2
3.6
9.6
15.4
11
.4
9.8
-3.5
16
.9
17.4
26
.6
13.3
42
.1
10.9
Se
ptem
ber
17.4
-0
.5
6.8
20.3
13
.5
13.1
-1
2.4
14.7
18
.8
32.9
18
.3
35.5
15
.0
Oct
ober
18.0
-3
.1
8.8
24.4
11
.8
11.1
-2
5.2
16.6
19
.5
26.5
25
.0
41.3
16
.7
Nov
embe
r20
.0
2.9
13.6
23
.2
10.2
14
.7
-16.
8 18
.4
18.5
27
.7
24.7
41
.3
21.6
De
cem
ber
20.1
2.
0 7.
3 19
.9
2.3
18.1
-8
.5
22.5
11
.0
29.8
18
.1
52.6
27
.0
2014
Janu
ary
20.5
-1
.1
12.8
18
.6
0.1
23.1
-1
3.6
23.3
-1
6.3
35.6
20
.2
50.1
24
.6
Febr
uary
21.5
3.
4 16
.8
20.2
5.
4 31
.2
12.1
24
.0
-14.
0 30
.9
20.4
48
.1
15.1
M
arch
22.7
7.
7 17
.3
25.2
2.
0 44
.8
39.0
28
.4
-8.6
44
.0
22.5
45
.5
-14.
6 Ap
ril23
.9
16.1
22
.8
24.5
4.
4 45
.4
31.2
33
.2
5.9
35.2
21
.8
51.0
-1
5.5
May
25.0
16
.7
28.5
25
.4
10.7
50
.1
26.5
31
.6
9.2
24.7
22
.0
44.0
-3
.4
June
25.8
17
.9
31.7
24
.4
15.1
44
.3
31.2
27
.5
30.7
28
.3
20.6
38
.2
3.0
July
25.5
18
.8
27.5
25
.9
9.4
42.3
37
.8
30.8
24
.3
30.2
20
.3
36.5
1.
8 Au
gust
24.5
20
.9
27.0
25
.1
10.8
46
.1
42.6
29
.4
19.6
27
.8
18.4
31
.7
-0.2
Se
ptem
ber
24.5
30
.8
35.2
20
.7
11.8
43
.8
40.4
36
.5
-0.5
23
.8
16.4
44
.1
-12.
3 O
ctob
er23
.6
36.8
32
.7
18.7
10
.3
45.4
75
.1
35.7
3.
5 38
.0
11.4
27
.5
-24.
8 N
ovem
ber
22.2
32
.1
29.8
19
.7
11.3
45
.2
66.9
31
.6
1.9
38.9
12
.4
28.9
-2
9.9
Dece
mbe
r22
.2
27.9
30
.7
21.2
13
.6
45.6
68
.4
32.4
-1
5.8
39.1
18
.7
25.0
-3
2.3
2015
Janu
ary
21.8
25
.2
30.1
19
.8
17.6
43
.0
76.1
33
.4
-3.8
35
.2
14.2
24
.8
-31.
3 Fe
brua
ry20
.7
24.7
27
.5
21.5
11
.6
38.6
79
.6
29.1
-1
6.2
38.7
15
.3
19.3
-3
1.4
Mar
ch19
.6
22.3
21
.1
18.8
12
.7
31.3
47
.5
19.6
-2
0.1
28.0
12
.4
27.8
-8
.9
Sour
ce: C
entr
al B
ank
of K
enya
.
Annexes

June 2015 | Edition No. 1266
Annex 16: Money aggregate
Growth rates (yoy)
Broad money
supply (M2) Money (M1)Reserve money
2013
January 18.2 16.1 11.5 12.2
February 17.0 15.5 17.6 23.9March 15.8 17.8 16.0 11.5April 18.5 20.0 13.6 9.5May 17.8 21.9 14.9 18.9June 15.6 20.7 16.6 11.7July 13.9 18.5 15.5 10.3August 13.8 17.5 15.7 23.8September 14.7 20.2 12.1 12.1October 12.8 16.0 13.8 22.7November 13.3 19.8 13.3 13.3December 13.8 16.3 10.5 9.2
2014
January 16.7 19.9 10.6 10.3February 17.8 20.3 5.0 9.9March 19.0 20.4 4.5 7.7April 16.1 16.9 8.4 17.7May 18.4 19.9 9.2 11.9June 18.8 21.3 6.9 12.6July 18.8 18.9 8.6 7.3August 20.0 21.0 7.9 15.2September 17.1 12.6 7.9 11.2October 18.4 12.9 6.3 13.5November 17.8 13.5 4.2 9.3December 18.6 13.2 6.2 18.5
2015
January 17.0 11.4 8.2 15.8February 17.2 10.0 9.9 22.9March 16.4 11.9 9.4 11.8April 17.2 13.4 11.1May 14.8 10.0 9.7June 16.4 9.6 10.8
Source: Central Bank of Kenya.
Annexes

June 2015 | Edition No. 12 67
Annex 17: Mobile payments
MonthNumber of
agents
Number of customers(Millions)
Number of transactions
(Millions)
Value of transactions
(Millions)
2013
January 85548 21.4 53.4 142.7
February 88393 21.8 53.5 141.1March 93211 22.3 52.4 134.4April 96319 23.0 56.0 142.6May 100584 23.5 60.3 158.8June 103165 23.8 60.0 152.5July 105669 24.3 62.7 162.8August 108559 23.9 64.7 168.1September 110432 24.0 63.4 165.6October 111697 24.4 68.3 175.3November 112947 24.9 68.7 175.2December 113130 25.3 69.1 182.5
2014
January 114107 25.8 67.1 178.5February 115015 26.1 65.6 172.8March 116196 26.2 74.0 192.7April 116581 26.1 72.1 186.7May 117807 25.8 74.5 198.1June 120781 25.9 74.0 189.9July 122462 26.2 77.5 201.0August 124708 26.3 78.9 206.7September 124179 26.3 78.2 206.3October 128706 26.0 82.9 210.3November 121419 24.9 81.0 203.2December 123703 25.2 85.6 225.5
2015
January 125826 25.4 81.7 210.5February 127187 25.5 80.7 208.1March 128591 25.7 90.3 231.8April 129218 26.1 84.9 213.7May 129735 26.5 89.9 230.2June 131761 26.5 90.7 227.9
Source: Central Bank of Kenya.
Annexes

June 2015 | Edition No. 1268
Annex 18: Nairobi stock exchange (20 share index) and the Dow Jones (New York)
Month NSE (1966 = 100) Dow Jones
2013
January 4417 13,861
February 4519 14,054March 4861 14,579April 4765 14,840May 5007 15,116June 4598 14,910July 4788 15,500August 4698 14,810September 4793 15,130October 4993 15,546November 5101 16,086December 4927 16,577
2014
January 4856 15,699February 4933 16,322March 4946 16,458April 4949 16,581May 4882 16,717June 4885 16,827July 4906 16,563August 5139 17,098September 5256 17,043October 5195 17,391November 5156 17,828December 5113 17,823
2015
January 5212 17,165February 5491 18,133March 5248 17,776April 5091 17,841May 4787 18,011June 4906 17,620
Source: Nairobi Securities Exchange and New York Stock Exchange.
Annexes

June 2015 | Edition No. 12 69
Annex 19: Nominal and real exchange rate
MonthNEER
2003=100REER
2003=100
2013
January 119 66
February 119 67March 116 64April 114 63May 113 63June 115 63July 116 64August 117 65September 117 64October 115 63November 116 63December 116 63
2014
January 116 62February 116 62March 117 62April 117 62May 118 62June 118 62July 118 62August 118 61September 118 61October 118 61November 118 61December 117 60
2015January 117 59February 117 59March 116 58
Source: Central Bank of Kenya.
Annexes

June 2015 | Edition No. 1270
Anne
x 20
: Fis
cal p
ositi
onAc
tual
(per
cent
of G
DP)
2006
/07
2007
/08
2008
/09
2009
/10
2010
/11
2011
/12
2012
/13
2013
/14
2014
/15*
Reve
nue
and
gran
ts19
.419
.818
.920
.519
.919
.219
.219
.919
.3
To
tal r
even
ue18
.618
.718
.219
.419
.418
.818
.819
.318
.9
Ta
x re
venu
e16
.917
.117
.017
.917
.717
.117
.318
.218
.0
I
ncom
e ta
x6.
26.
86.
97.
27.
57.
88.
38.
98.
9
V
AT4.
84.
84.
74.
95.
04.
44.
14.
64.
5
Im
port
dut
y1.
41.
41.
41.
41.
31.
31.
31.
31.
3
Ex
cise
dut
y2.
82.
72.
62.
52.
32.
01.
92.
02.
0
O
ther
reve
nues
1.7
1.4
1.4
2.0
1.5
1.6
1.7
1.3
1.2
Railw
ay le
vy0.
00.
00.
00.
00.
00.
00.
00.
00.
0
Appr
opria
tion-
in-a
id1.
61.
51.
21.
61.
71.
71.
51.
10.
9
Gra
nts
0.8
1.1
0.7
1.0
0.5
0.4
0.5
0.5
0.4
Expe
nditu
re a
nd n
et le
ndin
g20
.923
.122
.324
.023
.523
.724
.825
.728
.3Re
curr
ent
15.3
17.4
16.3
16.9
17.2
16.3
17.5
17.5
18.4
W
ages
and
sala
ries
6.3
6.3
5.8
5.7
5.8
5.5
6.1
5.6
5.1
In
tere
st p
aym
ents
2.1
2.1
1.9
2.1
2.2
2.1
2.7
2.6
3.0
Deve
lopm
ent a
nd n
et le
ndin
g4.
05.
76.
07.
16.
47.
46.
67.
111
.3Tr
ansf
er to
cou
nties
0.0
0.0
0.0
0.0
0.0
0.0
0.2
3.8
4.0
Parli
amen
tary
serv
ice
0.0
0.0
0.0
0.0
0.0
0.0
0.3
0.4
0.4
Judi
cial
serv
ice
0.0
0.0
0.0
0.0
0.0
0.0
0.3
0.3
0.2
Fisc
al b
alan
ceDe
ficit
excl
udin
g gr
ants
(com
mitm
ent b
asis)
-2.3
-4.4
-4.0
-4.6
-4.2
-4.9
-6.0
-6.4
-9.4
Defic
it in
clud
ing
gran
ts (c
omm
itmen
t bas
is)-1
.5-3
.3-3
.4-3
.6-3
.6-4
.5-5
.6-5
.9-8
.9De
ficit
incl
udin
g gr
ants
(cas
h b
asis)
-1.8
0.3
-4.4
-5.8
-3.4
-4.5
-5.1
-6.1
-8.3
Annexes

June 2015 | Edition No. 12 71
Annexes
Fina
ncin
gFo
reig
n-0
.10.
31.
50.
80.
82.
81.
42.
13.
8Do
mes
tic b
orro
win
g1.
9-0
.62.
85.
02.
61.
63.
84.
04.
4Pu
blic
deb
t to
GDP
(net
)36
.633
.435
.436
.639
.137
.038
.544
.045
.5Ex
tern
al d
ebt
20.0
19.1
20.2
18.9
21.0
19.4
18.7
22.6
24.9
Dom
estic
deb
t20
.218
.619
.521
.922
.221
.523
.325
.524
.8M
emo:
GDP
(Cal
enda
r yea
r cur
rent
mar
ket p
rices
, KS
h bi
llion
s)21
51.3
2483
.128
63.7
3169
.337
25.9
4261
.247
30.8
5357
.760
75.6
GDP
(Fisc
al y
ear c
urre
nt m
arke
t pric
es, K
Sh
billi
ons)
2006
.723
17.2
2673
.430
16.5
3447
.639
93.5
4496
.050
44.2
5716
.6
Sour
ce: N
ation
al T
reas
ury
(Qua
rter
ly E
cono
mic
and
Bud
geta
ry R
evie
w, A
ugus
t 201
5) a
nd K
enya
Nati
onal
Bur
eau
of S
tatis
tics.
Actu
al (p
erce
nt o
f GDP
)20
06/0
720
07/0
820
08/0
920
09/1
020
10/1
120
11/1
220
12/1
320
13/1
420
14/1
5*

June 2015 | Edition No. 1272
Annexes
Anne
x 21
: 12-
mon
ths c
umul
ative
bal
ance
of p
aym
ents
2006
2007
2008
2009
2010
2011
2012
2013
2014
2015
*
1. C
URR
ENT
ACCO
UN
T20
0620
0720
0820
0920
1020
1120
1220
1320
1420
15*
Bala
nce
of tr
ade
2. M
ERCH
ANDI
SE A
CCO
UN
T-5
11-1
034
-197
3-1
671
-251
2-3
330
-425
3-4
786
-609
7-6
132
-222
6-2
996
-426
0-3
892
-464
2-6
440
-689
3-7
584
-804
9
2.1
Expo
rts (
fob)
-381
7-4
936
-644
4-5
768
-716
9-9
007
-105
39-1
1229
-127
19-1
2340
Coff
ee
Tea
3516
4132
5048
4528
5225
5807
6183
5822
6174
5759
Hor
ticul
ture
138
166
155
201
209
222
269
192
232
232
Man
ufac
ture
d go
ods
656
693
924
892
1159
1153
1199
1215
1069
1090
Oth
er
509
607
763
692
725
678
695
741
808
743
422
513
625
526
608
729
700
705
592
529
2.2
Impo
rts (
cif)
1792
2153
2580
2216
2525
3026
3320
2969
3473
3166
Oil
Che
mic
als
7333
9069
1149
210
296
1239
514
814
1672
217
051
1889
318
099
Man
ufac
ture
d go
ods
1745
1919
3051
2192
2673
4081
4081
3838
4026
3208
Mac
hine
ry a
nd tr
ansp
ort e
quip
men
t10
0411
5614
4613
2416
0319
4720
7622
7923
8825
13
Oth
er10
6514
3515
8914
1117
7422
5023
0226
2426
7727
32
2252
2800
3063
3065
3808
3686
4748
4600
6128
6210
3. S
ERVI
CES
1267
1759
2343
2304
2537
2848
3251
3593
3673
3435
3.1
Non
-fact
or se
rvic
es
3.2
Inco
me
acco
unt
3306
3902
4470
4097
4657
5676
6286
6443
6622
6208
3.3
Curr
ent t
rans
fers
acc
ount
1591
1940
2184
1876
2527
2566
3645
3646
3373
3366
of w
hich
re
mitt
ance
s-7
0-1
43-4
5-3
8-1
587
-164
-339
-528
-643
1785
2106
2331
2259
2288
3103
2804
3137
3777
3485
4. C
APIT
AL &
FIN
ANCI
AL A
CCO
UN
T40
857
461
160
964
289
111
7112
9114
2814
92
4.1
Capi
tal a
ccou
nt
1186
1888
1505
2451
2675
3288
5514
5471
7475
4850
4.2
Fina
ncia
l acc
ount
211
267
294
290
154
235
235
9824
443
4.2.
1.1
Offi
cial
, med
ium
and
long
-ter
m

June 2015 | Edition No. 12 73
Annexes
4.2.
1.2
Priv
ate,
med
ium
and
long
-term
975
1621
1210
2161
2522
3053
5278
5373
7451
4407
4
.2.1
.2.3
Dire
ct in
vest
men
t (FD
I)-2
02-1
610
646
630
834
011
4759
222
8915
95
4.2.
1.3
Com
mer
cial
ban
ks (n
et)
3859
272
4417
635
-87
-258
981
789
-11
438
153
127
106
107
107
218
1023
755
4.2.
2 Sh
ort t
erm
and
net
err
orsa
nd o
miss
ions
(NEO
)-1
56-5
1549
461
-213
854
4966
631
5
Sho
rt te
rm (i
nclu
ding
por
tfolio
flow
s)
Net
err
ors a
nd o
miss
ions
(NEO
)12
9610
5010
1711
5819
7728
9133
64
714
1032
995
577
1130
1678
2429
2579
2763
2881
5. O
VERA
LL B
ALAN
CE58
218
2258
184
712
1393
524
1075
2-1
173
Mem
o:67
585
4-4
6978
116
3-4
312
6168
513
78-1
282
Gros
s res
erve
s
Offi
cial
Com
mer
cial
ban
ks33
3145
5746
4150
6451
2360
4571
6084
8397
3894
73
Impo
rts c
over
(cal
ende
r yea
r)24
1533
5528
7538
4740
0242
4857
0265
6078
9572
12
Impo
rt c
over
(36
mth
s im
port
s)91
612
0217
6512
1711
2117
9714
5819
2318
4322
62
3.5
4.0
2.7
4.1
3.5
3.1
3.8
4.3
4.6
4
GDP
mar
ket p
rice
(Ksh
s bill
ion)
3.9
4.8
3.4
4.1
3.9
3.7
4.3
4.5
5.0
5
GDP
mar
ket p
rice
(US$
bill
iom
)
1862
2151
2483
2864
3169
3726
4261
4731
5358
6102
25.8
32.0
35.9
37.0
40.0
42.0
50.4
54.9
60.9
62.8
Sour
ce: C
entr
al B
ank
of K
enya
Anne
x 21
: 12-
mon
ths c
umul
ative
bal
ance
of p
aym
ents
2006
2007
2008
2009
2010
2011
2012
2013
2014
2015
*

June 2015 | Edition No. 1274
Annexes
Annex 22: Growth Outlook2014 2015e 2016f 2017f
BASELINE
GDPRevised projections 5.3 5.4 5.7 6.1Previous projections 6.0 6.6 6.5
HIGH CASE SCENARIOGDP
Revised projections 5.3 5.8 6.7 6.9Previous projections 6.5 7.0 7.0
LOW CASE SCENARIOGDP
Revised projections 5.3 5.1 5.5 5.7Previous projections 5.6 5.6 5.7
Source: World Bank.Note: e(estimate); f(forecast)


Produced by Macroeconomics & Fiscal Management, Trade & Competitiveness and Governance Global Practices Africa Region
Growth in 2014 was solid and broad based as the economy performed well while absorbing two major government programs: devolution and infrastructure scale-up. The economy grew 5.3 percent, driven by stronger than expected growth in services and other industry. Consumption demand remained the main source of growth. Investment demand rebounded, as investors dropped their wait and see stance.
The special focus of this update highlights the importance of public participation, transparency, and accountability as a means of improving efficiency, equity, and inclusiveness of government and service delivery. It examines the progress counties have made in implementing a strong legal framework on participation under the devolved system of government, identifies the successes and challenges, and proposes the priority actions that National and County governments can take to enhance public participation.
This report has four messages: First,Kenya’s economic performance remains solid, underpinned by strong infrastructure spending and consumer demand. Growth in 2015 is estimated at 5.4 percent, a 0.6 percent downward revision from its estimate in December 2014. The revision reflects the strong headwinds the economy is facing in the foreign exchange market and the monetary policy response to calm those fears. Second, the current expansionary fiscal path is not sustainable and presents a risk to growth. Although heavy infrastructural spending is a boon for Kenya’s production space and future growth, the short - to medium-term macro-fiscal framework is vulnerable to macroeconomic shock as fiscal space has been wiped out.
Third, county governments, with support from central authorities have made considerable progress towards implementing constitutional and legal provisions for transparency, accountability and participation. In the early stages, they prioritized the setting up of structures and systems to facilitate public participation. Counties have built communication frameworks, and established participatory forums as per legislative requirements. Beyond meeting the legislative requirements counties have adopted innovative initiatives to engage citizens. Much still needs to be done to ensure that proper and adequate mechanisms are put in place. Lastly, the high cost of participation, the lack of administrative capacity and trained staff to implement participatory processes and tokenistic forms of participation continue to hinder effective citizen engagement. While most counties have taken steps to put in place communication systems, most county budgets are still not readily available to the public despite requirements of the PFM Act.
World Bank GroupDelta CenterMenengai Road, Upper HillP. O. Box 30577 – 00100Nairobi, KenyaTelephone: +254 20 2936000Fax: +254 20 2936382Website: www.worldbank.org/kenya
Join the conversation:Facebook and Twitter
@WorldBankKenya
Send questions and comments:#KenyaEconomicUpdate
Storm Clouds GatheringThe economy facing strong headwinds
with a special focus on Public Participation