stormwater drainage and land reclamation for urban … water drainage and land... · stormwater...
TRANSCRIPT

Stormwater Drainage and Land Reclamation for Urban Development


Table of ContentsStormwater Drainage and Land Reclamation for Urban Development........................................................1
FOREWORD..........................................................................................................................................1INTRODUCTION....................................................................................................................................1
A. Background..................................................................................................................................2B. Purpose of the report...................................................................................................................2C. Scope of the report......................................................................................................................2
I. URBANIZATION AND THE DEMAND FOR URBAN LAND................................................................3A. Current trends in urban growth....................................................................................................3B. Increases in land prices and the use of marginal land.................................................................5C. Specific problems of the urban poor............................................................................................5D. Urban health in marginal settlements..........................................................................................9E. Conclusions.................................................................................................................................9
II. POTENTIAL IMPACTS OF STORMWATER DRAINAGE AND LAND RECLAMATION PROJECTS..........................................................................................................................................11
A. Urban land−use planning...........................................................................................................11B. Urban health..............................................................................................................................12C. Socioeconomic benefits.............................................................................................................12
III. TECHNICAL OPTIONS FOR STORMWATER DRAINAGE AND LAND RECLAMATION..............13A. Stormwater management..........................................................................................................13B. Drainage system components...................................................................................................14C. Storage: detention and retention...............................................................................................15D. Drainage system design............................................................................................................20E. Land reclamation options...........................................................................................................24F. Land stabilization.......................................................................................................................30
IV. MAINTENANCE..............................................................................................................................34A. Maintenance objectives.............................................................................................................34B. The maintenance programme....................................................................................................35C. Review of maintenance.............................................................................................................35D. Institutional arrangements for maintenance..............................................................................36
V. PROJECT APPRAISAL....................................................................................................................38A. Technical appraisal....................................................................................................................39B. Social and health impact appraisal............................................................................................39C. Economic and financial appraisal..............................................................................................40D. Institutional appraisal.................................................................................................................41
VI. CONCLUSIONS AND RECOMMENDATIONS...............................................................................41BIBLIOGRAPHY...................................................................................................................................42Annex I: STORMWATER DRAINAGE DESIGN PROCEDURES.........................................................43
A. INTRODUCTION.......................................................................................................................43B. PLANNING................................................................................................................................46C. DESIGN CRITERIA...................................................................................................................47D. FLOOD ESTIMATION...............................................................................................................53E. CHANNEL DESIGN...................................................................................................................63F. DRAINAGE DESIGN FOR URBAN STREETS AND PIPELINES..............................................65G. PUMPING CAPACITIES AND STORAGE REQUIREMENTS IN POLDERS...........................77
i

ii

Stormwater Drainage and Land Reclamation for Urban Development
United Nations Centre for Human Settlements (Habitat)Nations 1991
HS/260/9IEISBN 92−1−131188−8
UNITED NATIONS CENTRE FOR HUMAN SETTLEMENTS (Habitat)P O Box 30030, Nairobi, KENYA. Telephone: 230800, 520600Cable UNHABITAT; FAX: (254) 2 226473, 226479; Telex: 22996 UNHAB KE
FOREWORD
The potential socioeconomic benefits of urban stormwater drainage are huge: improved health and quality oflife in existing low−income human settlements, and the availability of additional usable urban land reclaimedby drainage projects which can be used for human settlements or industry and commerce. Properly designedand maintained stormwater drainage projects almost always increase substantially land values.
This report has been prepared in response to the increasing need for those involved in urban land use andmanagement to develop efficient and cost−effective urban stormwater drainage programmes. It focusesspecifically on the socioeconomic and engineering factors involved in such programmes, with specialemphasis on appropriate strategies for proper operation and maintenance, as well as providing sound adviceon planning and design. Operation and maintenance of stormwater drainage projects has all too often beenneglected in the past − frequently it has been done only in response to emergency situations: this is bothcostly and inefficient. Detailed engineering advice is given in the annex to the report; this is basically astormwater design manual.
The very rapid increase in urbanization that is currently occurring in developing countries is an irreversible factof life facing urban planners and city engineers. The demand for urban land is correspondingly enormous andI am confident that this publication will be invaluable to those professionals involved in urban landmanagement and urban stormwater drainage. These two disciplines together have the ability to regeneratevast areas of land in developing country cities, land that is currently unable to be fully utilized due toinadequate or non−existent stormwater drainage. I hope therefore that this report will serve as a usefulstarting point in increasing awareness of the need for appropriate strategies for urban stormwater drainage, sothat the supply of usable urban land increases.
I gratefully acknowledge the contribution of Mr John Macklin in providing specific inputs to UNCHS (Habitat)'spresent research efforts leading to the completion of this report.
Dr Arcot RamachandranUnder−Secretary−GeneralExecutive Director
INTRODUCTION
1

A. Background
The management of rainfall and the resulting stormwater flows is an essential feature of healthy cities. This isbest illustrated by considering an urban area devoid of any such management practices: during times ofintensive rainfall two events commonly occur − flooding of low−lying areas, and landslides on steep slopeswhich have been denuded of their natural protective vegetation in order to provide space for humansettlements. The latter is perhaps the more dramatic: the shacks of the poor are demolished by the landslidewhich generally continues downhill to damage seriously the houses of richer communities. However, thehealth, both physical and mental, of those living in flooded low−lying areas is often much more adverselyaffected: vector−borne diseases (such as urban malaria, filariasis, even schistosomiasis and yellow fever)become established as the open waters provide opportunity for the vectors to breed very rapidly; anddiarrhoeal diseases − together with malaria, a major killer of children − and geohelminthic infections alsobecome endemic. Urban communities living in such settlements have a very poor health profile, and theirproductivity is correspondingly low. This is not only to their personal disadvantage but, on a strictlycommercial basis, is detrimental to the local industries and businesses that employ them. While stormwatermanagement is not a magic panacea, it is an essential component of urban development in general and ofurban health in particular.
Land subject to regular flooding or landslides has a relatively low value. Stormwater management increasesthe value of land as it then becomes available either for improved − healthier − human settlements or for moreeconomically productive uses such as industry and commerce. The increases in land values are usually, atleast in properly planned and implemented schemes, quite substantial: this benefit alone is economicjustification enough for stormwater management projects to proceed.
B. Purpose of the report
This publication is intended to assist those who are professionally involved in urban land use andmanagement. It seeks to promote the role of stormwater drainage in the production of urban land particularlyfor human settlements, but also for commerce and industry, through the stabilization or reclamation of landthat is currently unsuitable for such use because it is subject to permanent, seasonal or freak flooding.Specifically the purposes of the report are:
(a) To create awareness amongst urban land use planners and municipal engineers indeveloping countries of the economic and social benefits of the provision of good urbanstormwater drainage;
(b) To provide technical information on the design of urban stormwater systems and landreclamation techniques, so that currently unsuitable urban land that is low−lying and subjectto inundation, or on hillsides subject to storm−induced landslides, may be converted into safeland that can be used for low−income human settlements or for industry and commerce.
C. Scope of the report
Chapter I discusses current trends in urbanization and the effects these have on land prices and theconsequent necessity for the urban poor to settle on marginal land that is subject to flooding. It also discussesthe major health problems faced by those living in these settlements. Chapter II identifies the potential impactsof urban stormwater drainage and consequent land stabilization and reclamation − the implications for urbanland−use planning, effects on health and the resulting socioeconomic benefits. Chapter III addresses theengineering factors involved in urban stormwater drainage and land reclamation and stabilization, withemphasis not only on appropriate planning and design (details of the latter are presented in the annex) butalso, in chapter IV, on operation and maintenance which is all too frequently done inadequately so that the fullpotential benefits of urban drainage projects are not realised. Chapter V provides guidance for the appraisal ofurban stormwater drainage projects and, finally, chapter VI identifies areas for further action and research.
2

I. URBANIZATION AND THE DEMAND FOR URBAN LAND
A. Current trends in urban growth
The current position and trends in urbanization in developing countries have recently been summarized in aUNDP Strategy Paper (see box I.1). This rapid and sustained growth in the size of cities and towns creates acorrespondingly huge demand for and pressure on land, principally but not exclusively for housing. In additionto land for housing, however, there is a need for land for urban infrastructure − roads, drainage and utilities −and for commercial, industrial and recreational purposes. While there is such a need for land and while inpractice, as will be noted below, land is being used for urban purposes, there is in many respects a crisis inurban land−use policy in many cities around the world − a crisis that has been caused by a desperatemismatch between the official supply of land and the demand for it. The root cause of this crisis must brieflybe outlined.
The root of the current crisis is that, usually with the best of intentions, governments have adopted policieswhich have unfortunately and far too frequently contributed to land shortages rather than land availability.These policies have emphasised control and regulation over land use and its supply, rather than enabling andfacilitating its release. These policies generally stress the maintenance of inappropriate standards − standardsoften inherited and accepted uncritically from former colonial powers − rather than focus on theappropriateness and affordability of such standards. Government policies have also either shied away from, orattempted to impose inappropriate legal regimes on, traditional land−tenure practices which haveconsequently inhibited the release of land with clear titles for urban use. Finally, these policies generally placetoo much emphasis on public ownership, management and development of urban land, and the resultingheavy bureaucracy normally impedes the release of land. Some examples of these defective policies aregiven below.
Control and regulation of supply and use
There are few better examples of attempts to control the supply and price of urban land than the Urban Land(Ceiling and Regulation) Act 1976 of India. A respected commentator has this to say about the Act and itsoperation:
This Act was aimed at socializing all land in excess of a given quantum on payments of anominal amount, thus making available large chunks of strategically located land for use bythe common man. Exemptions can be granted from the operation of the Act. Thephenomenon of granting exemptions to large property owners, bogus cooperative societieswho enter into agreements to purchase land, commercial builders etc. is universal with theresult that the very purpose of the Act has been defeated.
The National Commission on Urbanization has likewise concluded that the Act has failed to achieve any of itsobjectives. This has not, however, prevented a very rapid rise in urban land prices all over India and aconcomittant shortage of affordable land for housing for the urban poor.
Nigeria may be instanced as another country where similar legislation − the Land Use Act of 1978 − has donenothing to bring more land forward for urban development, but which has created yet another layer ofbureaucracy and corrupt practices which must be overcome before land can be developed.
Even where the supply of land is not controlled, its use too often is. Inappropriate metropolitan models of townand country planning legislation (some of them dating back 70 or more years with emphasis on control ofdevelopment, and the obligation to seek, via official forms, permission to build a house) simply render theself−build efforts of the poor illegal and liable to demolition.
The maintenance of inappropriate standards
Two aspects of this deficiency are plot size and building regulations. Over−large plot size requirements inJordan, for example, have severely handicapped efforts to develop low−cost housing until a downturn in theeconomy caused the plot owners themselves to see the good sense of subdividing their plots in order toincrease their income and also to reduce building costs. Many site−and−service schemes have been beyondthe reach of the urban poor simply because the price of the large plots has been beyond their capacity to pay,and the high costs of running services to the plots have further raised prices.
3

Box I.1. Current urbanization trends in developing countries
The relentless growth of cities is inevitable and irreversible. Standing at 2.4 billion in 1990, the world's urbanpopulation will rise to 3.2 billion in 2000 and 5.5 billion in 2025. The developing countries' share in thesetotals − 63 per cent in 1990 − will rise to 71 per cent in 2000 and 80 per cent in 2025. By the end of the1990s, Mexico City will have almost 22 million residents. Calcutta, Shanghai and Bombay will each havemore than 15 million, and 13 other cities in developing countries will have more than 10 million: Seoul,Cairo, Dakar, Delhi, Lagos, Beijing, Bangkok, Manila, Jakarta, Karachi, Tianjin, Buenos Aires and Rio deJaneiro. In addition to the growth of these megacities, the growth of small and medium−sized cities will alsocontinue.
For decades this growth was seen as inimical to human development. Cities already benefiteddisproportionately from national development efforts, urban development was more costly than ruraldevelopment and the growth of cities merely added to unemployment − these were the prevailing views. So,government policy and international assistance gave greater attention to the countryside.
Today the growth of cities is seen increasingly as essential for human development. The GNP per capitanumbers are much higher in countries with more of their people in cities. The economies of scale in largecities generate goods and services far in excess of their share of the total population. This higherproductivity of urban labour means that wages are higher and unemployment opportunities greater,especially for women. Cities also give their residents the knowledge and skills to become more productive −a propitious cycle. Cities promote the modernization of agriculture, provide markets for farm goods andreduce pressure on land.
Despite the obvious efficiency advantages of cities, the negative consequences of urbanization forlow−income groups are overwhelming. Simply, many city dwellers in developing countries live in crushingpoverty − more than 300 million, or a quarter of all those in urban areas. That number promises to swell. By2000 more than half the developing countries' poor will be in cities and towns: 90 per cent in Latin America,45 per cent in Asia and 40 per cent in Africa. Their living conditions are alarming, for their numbers faroutstrip the supplies of water, waste removal, transport and clinics. Nor do they and their richer neighbourshelp the environment using natural resources and discharging wastes in disturbing quantity, with all thepredictable effects.
Source: Cities, People and Poverty (New York, United Nations Development Programme,1991)
Few countries have yet made any effort to revise their building regulations to allow for more appropriatestandards. In some countries and cities the building regulations are more than 50 years old and are still legallyin operation. For example, in Nairobi insistence of antiquated standards in the regulations held up thecommencement of a major site−and−service project; and in Madras official refusal to allow low−costunconventional materials and practices to be used in site−and−service schemes effectively prevented theurban poor from benefiting from them.
Customary tenure
The African continent has many examples of inappropriate efforts to grapple with customary tenure. Forexample, in urban Lesotho, a World Bank land−reform programme broke down because of suspicions that itwas designed to facilitate foreigners acquiring choice urban plots under a law which only they couldunderstand. In the United Republic of Tanzania and in Zambia, a refusal to permit an officially recognisedmarket in land led to the development of a vigorous alternative market, with major problems of security oftenure due to the consequent absence of any official documentation relating to title. In Nigeria, the impositionof public controls on an evolving market in land merely inhibited the evolution of the market without providingany positive benefit.
Public ownership and management
A favourite device is the creation of an urban development authority which is empowered both to purchaseland in advance of use (and release it in due course for use by the urban poor) and to develop land itself. Theexample of the Delhi Development Authority (DDA) shows that, whatever the theoretical merits of the policy,in practice it can have disastrous results. In Delhi 20,000 hectares of land were notified for compulsoryacquisition and frozen for private development, and the DDA, in order to balance its accounts, has allocatednearly 50 per cent of the land it has released to the urban rich and less than 10 per cent to the urban poor.Land prices have at the same time rocketed. According to a commentator:
4

... regarding of its efficacy in serving desired goals, the fact remains that this policy for Delhi,supported by hefty financial aid from government was sought to be replicated in other stateswith calamitous results... Funds or the expertise to assess needs, plan and executedevelopment programmes or to manage the land were not provided.
Urban development and capital development authorities in Brazil, Pakistan, Nigeria and the United Republicof Tanzania have a similarly dismal record of providing affordable land for the urban poor, many of whomlabour to construct buildings they will never be able to afford to use.
What might be the results of continuing with such inadequate policies? The following are suggested as themore likely outcomes.
(a) Land prices will continue to accelerate and there will be a corresponding decline in thenumber of people who will be able to purchase or rent houses or building plots;
(b) There will be a continuing increase in urban slums. People will not cease to come to cities,but they will cease to be able to do other than slot into already overcrowded squattersettlements or take part in land invasions;
(c) The development of ever larger squatter settlements without adequate services orinfrastructure will cause major urban health problems and a rapid deterioration of the urbanenvironment;
(d) Large cities, full of the unemployed and the poor (too few of whom will have a stake in thesystem through the ownership or secure possession of land or regular employment), will bebeyond the capacity of city governments to deal with and may begin to pose problems to thesecurity of the State and the stability of the local political system.
B. Increases in land prices and the use of marginal land
As a result of these mistaken policies and institutional developments, two interlinked phenomena havebecome increasingly apparent: rapid rises in land prices, and unauthorized developments of marginal lands.We have already noted how the urban ceiling legislation in India brought about a rapid increase in urban landprices. It has also brought a rapid increase in urban development on ecologically sensitive land outside cityboundaries where such land escapes the reach of the urban ceiling legislation. In the United Republic ofTanzania, the inefficiencies of the allocation of public land has had the same two effects: dramatically highprices paid for officially allocated land when it is traded on the unofficial market, and land bought fromtraditional land holders on the outskirts of towns since no other land can be obtained (see box I.2).
Many commentators have noted the same phenomenon of high prices forcing low−income communities on tomarginal land in Latin American and the Caribbean. In Trinidad and Tobago, for example, the hills around Portof Spain are being rapidly developed with unauthorized housing, much of which collapses during the rains socontributing to mudslides and the loss of topsoil. In an effort to overcome the shortage of “official” planneddevelopment land, a group of architects and planners instigated the Sou Sou Land movement, a venturewhich was designed to open up undeveloped land for low−cost housing. Inevitably the land so opened upincluded marginal land and no provision was made for drainage or sanitation. In Latin America, the urban pooroften settle on steep hillsides, as in Rio de Janeiro, for example, with serious consequences of flood−inducedmudslides (see box I.3).
Even where there is not the great pressure on land which migration to large cities causes, the samephenomenon of rapid use of agricultural and marginal land occurs. Box I.4 details the Indian example ofVisakhapatnam in Andhra Pradesh.
C. Specific problems of the urban poor
The problems of the lack of developable land being available at an equitable price or allocated in a fair andreasonable manner are overwhelmingly problems for the urban poor. It is they who get squeezed out of landnear to places of work (unless, as in Bhopal, that land is unsafe for conventional housing). It is they who are
5

not allocated land by the politico−administrative process as they have neither the influence nor funds tosmooth the land allocation process. There are few cities in the developing world where the plight of the urbanpoor is improving: in most their plight is actually getting worse.
There are various manifestations of this. Recent research has shown that increasingly the poor are rentersand not buyers of accommodation. Their landlords are not usually the benevolent, if over bureaucratic, publicauthorities; the majority are private individuals. While many landlords are of the same social class as theirtenants and are merely renting out a part of their own too−small accommodation, low−cost housing isincreasingly becoming commercialized and large−scale landlords are moving into the sector, and they aresimply intent on obtaining as large a return on their capital investment in as short a time as possible. Thisinvolves putting as large a number of people into as small a space as possible and cutting down on basicfacilities and amenities. Inevitably this means that such matters as sanitation and drainage are neglected.Legislation imposing minimum standards on landlords may well exist, but it is rarely enforced − to the cleardetriment of the poor (see box I.5).
To escape such conditions, the urban poor can and do retreat to the outskirts of towns where in terms of landuse and environmental conditions, the situation may not be very different. In towns and cities in manycountries in Africa, land on the urban periphery is still subject to customary tenure and any legal regulationsand restrictions are, in practice, disregarded by traditional land holders. Thus in Maseru, Lesotho, local chiefsroutinely ignore the provisions of the Land Act (1979) which imposes certain conditions on land to be used forurban purposes, and they grant permission for houses to be built all over their land without regard to anyconsiderations of public health or the need for soil conservation, which is a pressing problem in Lesotho. InMexico, the poor obtain accommodation on ejido land − rural land which in theory at least should remain inthe perpetual ownership of peasant farmers. Since the transactions are not sanctioned, and the land is notsubject to any public health regulations, the resulting informal and illegal subdivisions make little provision fordrainage or sanitation. Similar conditions exist where the urban poor obtain land in Brazil and elsewhere inLatin America.
Living on marginal land gives rise to two principal sets of hazards; one natural and the other the result ofhuman decisions and actions. The natural hazards tend to be floods or landslips (earthquakes are likely toaffect all classes, but probably the urban poor will be the hardest hit since their homes are usually of theflimsiest materials). Human decisions and actions embrace fire and demolition or removal. While the formermay be accidental, the latter is usually deliberate and is never less than traumatic, even when done for soundpublic health or ecological reasons. Two contrasting cases are given in boxes 1.6 and 1.7: the first fromBarbados where care was taken to ensure that in so far as possible no one suffered unduly from relocation,and the second from Abuja, Nigeria, where relocation was carried out without sufficient care and so createdmajor environmental and social problems.
Box I.2. Prices paid for government land sold unofficially in some areas ofDar−es−Salaam, United Republic of Tanzania
Area Type of plow Price (1988 Tshs.)Sinza/Kijitonyama High density, bare 150,000 − 200,000Sinza/Kijitonyama High density, incomplete foundation 250,000 − 300,000Sinza/Kijitonyama High density, complete floor slab 350,000 − 400,000Mikocheni High density, bare 400,000 − 1,000,000Oysterbay Low density, bare 2,000,000 − 7,000,000Mbezi Beach High density, bare 100,000 − 150,000Mbezi Beach Medium density, bare 200,000 − 300,000Mbezi Beach Low density, bare 500,000 − 1,000,000Official exchange rate in December 1988: US$ 1 = TShs 122.72.
Source: J.M.L. Kironde, “Land pricing and taxation inTanzania” (paper presented at the Tanzania National LandPolicy Workshop, June 1991).
Box I.3. In Latin America, why do squatters settle on hillsides?
“Hillsides provide readily available land and at essentially no cost. They offer land with limited competitionfrom other sectors. The trade−off is between legal title and expensive land, and land of no cost and oftenwith an advantageous location but with unclear tenure, more difficult construction methods, inconvenient
6

access, and more problematic utility provision. The location is paramount: Hillsides that are centrally locatedare the most desirable and the ones most quickly settled because they provide access to central businessareas with their vast opportunities for casual employment.” The author goes on to comment that “in hillsidessites the threat of eviction is inherently less since there is little interest from developers or other potentialusers, particularly where the gradient is 35 percent or more. Conversely the danger or erosion frommudslides increases as the squatter settlements are consolidated. Two reasons are noted. Firstly, therainfall runoff increases as more surface area is covered by development, and secondly, as the dwellingsbecome more permanent they gradually convert to brick construction and increase the load on the relativelyunstable soils”... More critical are the erosion problems at the community level, where the heavily usedpedestrian walkways require a more organized input and the question is always, “how will the material bepaid for, and who will do the work?”
Source: R. Goethert, “Lessons from squatters in Latin America: Housing on hillsides forlow−income groups”. Regional Development Dialogue, vol 12 (1991), no 2.
Box I.4 Urbanization in Visakhapatnam, Andhra Pradesh, India
“Visakhapatnam, one of the major ports of India, is a rapidly−growing city situated on the East Cost of India(Table A). Geographical modality seems to be a powerful factor in the growth of the town. It is bounded bytwo hill ranges of the Eastern Ghats − Kailasa range on the north and Yarada range on the south. The Bayof Bengal forms the eastern boundary of the town with a coastline of about nine kilometres in length runningnortheast to southwest. The western side is an extensive tidal basin, a major portion of which is being slowlyreclaimed. Within the two dominating hill ranges, a vast expanse of lowlands and a number of hillocksprovide a rugged appearance to the landscape.
“Every land−use pattern is the result of the functional integration of residential, commercial, industrial,transportation and community facility uses in harmony with the topographical features. The city ofVisakhapatnam is constrained by physical barriers on all sides. Hence, the topography plays an importantrole in the spread of the city and the land−use pattern. The city can grow only along the major arteries of thehighways towards northeastern, northwestern and southwestern comers of the plain in what may bevisualised as a ginger−palm pattern. Table B shows a quantitative analysis of urban land use.
“By 1985 agricultural land was completely replaced by industrial and residential lands. The high percentageof land under industrial and institutional uses reveals the growing importance of industries and institutions inVisakhapatnam. Another important land−use change is the reduction of vacant land from 1965 to 1985. Thevacant land has been converted into residential areas due to heavy pressure for residential use. Thepiedmont zone of the Kailasa hill ranges in the north is covered with mango and cashew orchards, whichare also being cleared for industrial and residential purposes. The pressure on the population for minimumneeds especially for shelter made them to find new places and hence, the weaker section people whocannot afford to have houses within the town finding a place by encroaching the slopes of hill ranges...
There is a vast tidal swamp on the western side of the town, which is slowly being reclaimed for port−basedindustries. Changes in land−use occur at highly variable rates from place to place. The reclamation of themarshy tidal basin provides an example of large−scale metamorphism of natural landscape by man... Thetotal area of marshy land was 2,590 hectares during 1933 which was reduced to 600 hectares in 1985.Approximately 80 percent of the total area has now been reclaimed and the remaining 20 percent of thearea is also being slowly reclaimed. The swamp area is mainly destined for port−based industries. Inaddition to the port installations, the establishment of port−dependent industries has brought another freshimpulse for urban extension into the tidal basin, which is being reclaimed from all sides.
Source: S.S. Devi, “Urban land use changes with special reference to Visakhapatuan,India”, in Land Use in Change (Hong Kong University Press, 1989).
Table A. Increases in built−up area and population in Visakhapatnam since 1920
Year Built−up area (km2) Municipal area of the town (km2) Population1920 1.88 15.62 447111942 3.97 5.62 702431961 7.78 29.14 1820001975 20.50 76.33 4500001985 47.79 76.33 710000Table B. Urban land use in Visakhapatnam
7

1965 1985Land Use Area (in km2) Percentage of total
areaArea (in km2) Percentage of total
areaResidential 8.70 11.40 16.34 21.41Industrial 5.20 6.81 6.30 8.25Institutional 2.65 3.47 5.06 6.63Roads and railways 3.60 4.72 5.15 6.75Hills, scrub and waterbodies
6.39 8.37 4.60 6.03
Commercial 0.35 0.46 0.87 1.14Recreation 0.30 0.39 0.79 1.03Agricultural 0.28 0.37 − −Harbour 28.94 37.91 28.94 37.91Vacant 19.94 26.12 8.28 10.85Total area 76.33 76.33
Box I.5 Poor housing and ill health in Olaleye−Iponri, Lagos
Olaleye−Iponri originally consisted of two independent communities lying next to each other on a site ofsome 35 hectares. They are located primarily within the jurisdiction of the Lagos Mainland LocalGovernment. The communities in their present location make up highly compact settlements whoseexpansion is limited by a series of natural and human−made barriers... Olaleye−Iponri's central locationwithin metropolitan Lagos and its contiguity to Alaka Estate makes it a valuable site for its inhabitants,despite the deficiencies of the site and infrastructure and service provision there... most inhabitants aretenants who live within a household, sharing one small room, while most other inhabitants are small−scalelandlords who have built the dwellings they rent out on land they have rented from absentee landowners.
There is very serious over−crowding in Olaleye−Iponri The predominance of large households and the smallsizes of rooms means that many households must live with less than one square metre per person for thewhole plot. More than half of all households live in one room. Households occupying between two to threerooms account for about one−third of all responses. The most common room−size is between 2.4 by 1.8 mand 2.4 by 2.4 m. Occasionally larger rooms are 3 by 3.6 m and 3.6 by 3.6 m. Thus a common feature is tohave households of five or more persons all living in a 2.4 by 1.8 m room.
In regard to excreta disposal, 28 percent of respondents have no access to toilet facilities. Most of thosewith toilet facilities only have access to the outhouse type and, with this, the use of bucket−latrines ispredominant. About 88 percent of Olaleye respondents and 72 percent of Iponri respondents use bucketlatrines. Next in importance is the use of pit latrines (or salgas), which account for about 12 percent inOlaleye and 7 percent in Iponri. Toilet facilities, as with bathroom facilities, are extensively shared; over 90percent of respondents with access to toilets share these facilities. The pressure can be imaginedparticularly in cases where there is only one toilet serving a house with six or more households with anaverage household size of not less than five. It is not surprising that human waste is disposed of as a matterof routine in both the gutters around the houses, nearby bushes, the railway line and any other availablediscreet corner...
In regard to sources of water, only a small proportion of residents have water piped to their living quarters.In Olaleye, 36 percent of respondents have water piped directly into the building in which they live but only21 percent have it piped into their own living quarters. Another 15 percent rely mainly on water from wells intheir buildings, while nearly a third purchase their water from water−hawkers who obtain the water eitherfrom wells or piped sources. For Iponri, about 71 percent of respondents claim they use piped water butonly 36 percent have it piped into their living quarters; about 15 percent purchase water from privatehawkers. Sources such as springs, streams and wells are not important (they are used by about fourpercent of the respondent). For those who obtain water from outside their living quarters, 52 percent ofOlaleye respondents and 45 percent of those in Iponri claim they get water within 100 metres of their livingquarters. The rest either use other means or get water from distances over 100 metres...
Over a quarter of all houses had what the interviewers described as a foul smell arising from open drains,human waste, dead animals and overflowing garbage dumps. This is not surprising as most gutters anddrains were blocked and not cleaned, and there is no systematic form of public−waste disposal. In Olaleye,
8

about 96 percent of the drains are blocked with rubbish and not cleaned at all. In Iponri, 82 percent of thedrains are recorded as blocked, while about 96 percent are recorded as not clean. Garbage disposalfacilities within the vicinity of dwelling exist for 70 percent of Olaleye while in Iponri these exist in 59 percentof the cases
Source: Tade Akin Aina Housing and Health in Olaleye−Iponri, a Low Income Settlement inLagos, Nigeria. In The Poor Die Young
D. Urban health in marginal settlements
The urban poor are at extreme risk from disease − principally water− and excreta−related diseases due totheir inadequate water supplies and sanitation facilities, but also due to a lack of adequate stormwaterdrainage. Diarrhoea is extremely common, as is urban malaria and Bancroftian filariasis, with urbanschistosomiasis becoming more common as the urban peripheries are pushed out into adjacent agriculturalland. Good drainage, both sanitary and stormwater, can eliminate vector breeding sites. Conversely, poor ornon−existent drainage actively promotes vector proliferation on a huge scale and so permits acorrespondingly vast transmission of the diseases they carry. Box I.8 details the problems of Bancroftianfilariasis, and box I.9 of urban malaria.
Mental ill−health in marginal settlements is a major public health issue that is only now beginning to beappreciated. Mental illness, especially minor psychiatric morbidity, is usually multi−faceted, but there can beno doubt that living in marginal settlements subject to flooding and mudslides is a significant contributorycause of chronic depression, anxiety and personality disorders, as well as of the acute water−relatedpsychoses such as malarial psychosis and chronic neuroses such as filarial neurosis (depression induced byelephantiasis).
E. Conclusions
The developing world provides many examples of the same basic point: that the urban poor are drivenincreasingly on to marginal lands or to reside in conditions which provoke high levels of actual risk to theirhealth. When they are relocated, their conditions may even be worsened. While in no way detracting from thehuman aspects of these appalling situations, it is necessary also to highlight their environmentalconsequences. Marginal or ecologically fragile lands often have certain positive environmental roles to play inurban development, quite apart from their recreational potential. Thus mangrove swamps play a vital role as adefence against high seas which may cause flooding of low−flying urban areas. Wooded hillsides may alsooffer protection against violent weather or alternatively be a vital factor in a microclimate which ensures rainand so sufficient water for an urban area. Streams and rivers running through a town are subject to multipleuse; if one of those uses is as a sewer for industrial or domestic wastewaters, then other uses − for washingor drinking − becomes dangerous. It is the urban poor who suffer disproportionately from floods, landslidesand poisoned watersources, so that there is, in fact, a close connection between the human and theenvironmental dimensions of the misuse of marginal urban lands. It is thus in the long−term interests of theurban poor that these lands are restored or returned to their proper environmental role and other land isreleased or reclaimed for urban use. Stormwater drainage has a major role in such land release andreclamation.
Box I.6 Resettlement in Emmerton, Barbados
Emmerton is an area of land immediately adjacent to Bridgetown, the capital of Barbados. The country'sPhysical Development Plan of 1971 deemed Emmerton as the city's worst slum area, and as a high priorityfor clearance and renewal. “It was thus not surprising that after exhaustive design development andeconomic considerations, the decision was taken to use five acres of the Emmerton area for theconstruction of the sewage (wastewater) treatment facility for the city's first sewerage system”. There wereat the time some 560 people living in the Emmerton area, predominantly in chattel houses, many of them ina dilapidated condition. Social surveys showed that a majority of the residents did not wish to leaveEmmerton but “in general, the persons to be removed accepted it as a measure which the government hadto take, but were insistent that uprooting them from their leisurely happy way of life should have its owncompensations in better standards of living and the minimum dislocation from their livelihoods”.
9

A loan for the construction of the sewerage system was to be provided by the Inter−American DevelopmentBank, one of the conditions of which was that before any disbursement of the loan a programme andschedule for the relocation of persons from the site would be provided. The government selected a site twoand a half miles from Emmerton and formed an inter−departmental committee of senior officials to plan thelogistics of the clearing and the compensation “of landlords who may have suffered any loss as a result ofclearance”. The National Housing Corporation was designated as the agency to execute the relocation. Thisearly planning for clearance and “rumours of crude methods to be employed by government in theimplementation of the removal of residents brought very sharp, resentful and hostile reactions from thepersons concerned in the removal as well as from several sectors of the Barbadian community”.
Government recognised the need for a different approach. The Community Development Division wasbrought in, and a citizens' committee representing residents to be removed from Emmerton wasestablished. The functions of the committee were to mobilize the entire community, learn their problems,needs and concerns, discuss government's plans with them and represent their views to Government. TheCommunity Development Division's function was to “obtain the active and positive participation of thepeople of the Emmerton Community...” and via in−depth interviews, become familiar with their concernsabout moving. Government responded to the views and concerns expressed by the Citizens' Committeeand, inter alia, agreed to provide improved amenities and utilities at the relocation site rather than, as hadbeen initially determined, the same standards as existed at Emmerton. The conclusions of thecommentators on the whole operation was that it “cannot be otherwise described but as a successfulcoordinated operation...” even though surveys after the move showed some dissatisfaction with someaspects of it. However, overall, “the early recognition by the Government of Barbados that the people ofEmmerton should become actively involved in the matters of resettlement which concerned and influencedtheir lives and welfare, contributed to the establishment of a harmonious relationship with widespreadcooperation and the willingness by most to sacrifice some of their prejudged suspicious and recalcitrance.
The establishment of the Citizens' Committee helped to engender that feeling of belonging and participationin the sewerage cum resettlement project which helped both the Government and the residents affected inclarifying roles, solving problems and to prevent the spread of unfounded rumours and faulty beliefs amongthe residents. The interchange of ideas and goals led to more effective decision making by government”.
Source: M. Alleyne, A. B. Archer and G. Walters, The Resettlement of Residents fromEmmerton, Bridgetown, Barbados.
Box I.7 Resettlement in Abuja, Nigeria
Abuja was chosen as the new capital of Nigeria in 1976. The decision was taken to start the town withoutincorporating existing infrastructure and settlements. Existing land−use patterns consisted of dispersedclusters of dwellings with very light population density. “Land use was in equilibrium with the ecologicalcapacity of the environment.” The Federal Capital Authority was charged with the duty of resettling thosepeople who wished to remain within the Federal Capital Territory.
A master plan for each resettlement area was prepared. It was proposed that “the population should berehoused at minimum cost and the housing and the environment should be acceptable to the people...”Practice, however, departed from the plan. Corrugated iron sheets instead of thatch were used on the roofof houses. “Since the houses were not adequately ventilated they are unbearably hot during the season ofmaximum insolation. In addition, the housing units are congested, with houses standing only about 10metres apart. This pattern of housing has seriously eroded the privacy which the people highly regard.Population density within the small area of the housing units has been very much increased, therebyaffecting land claims and land use in the resettled area. Households are restricted to minute holding whichare usually insufficient for cultivating and grazing... also, a serious omission in the housing arrangement wasthe lack of recognition of the differential status of households in the allocation of houses.” Perhaps the mostserious omission in the housing units is that there was no provision for granaries and animal shelters. Manyhouseholds have suffered losses in grain as a result of inadequate arrangements for grain storage in theresettlement units. Consequently, the incidence of famine resulting from prolonged shortage of stored grainshas been reported in the two settlement units. Villagers who are unable to tolerate this increased hardshiphave migrated or joined the nomadic group. The speed at which the resettlement programme is beingcarried out does not allow a thorough study of the ecological variations in the resettled areas in order toguard against their disruption.
When all factors are considered, the Abuja resettlement programme has not been able to provide anenvironment within which the peasants will quickly re−establish the ecological balance already attained in
10

their previous settlements. This would require a greater involvement of the affected population in thedecision−making process over matters affecting such issues as farm organisation, land allocation anddesign of dwelling units. Planning and implementation of any resettlement programme should be based onparticipation of the people involved.
Source: F. C. Okafor, “Resettlement and ecological disruption in Abuja, Nigeria,” in LandUse Policy.
Box I.8 Urban health: Bancroftian filariasis
Bancroftian filariasis is a serious disease in urban areas. It is infection with the filarial worm Wuchereriabancrofti: the adult worms live in the human lymphatic system which, as a result of their presence, becomesblocked or partially blocked so impeding its free drainage. Swelling of the lower limbs and genitals thenoccurs and, in its clinical extreme, the disease is know as elephantiasis. People become infected through thebite of infected mosquitos belonging to the Culex quinquefasciatus complex of mosquitos, which breedpreferentially in dirty water such as blocked stormwater drainage channels, marshy swamps, septic tanks andwet latrine pits − anywhere which becomes polluted.
In this sense it is an urban disease caused by man: city authorities improve the water supply but make no orinsufficient provision for the removal of the resulting wastewater. So unplanned rapid urbanization whichresults in sprawling slums and polluted water bodies leads to the creation of enormous breeding sites for thevector mosquito. Chemotherapy is available, but the only way in which transmission of the disease can beprevented is by improved sanitation and improved stormwater drainage, of which good operation andmaintenance is essential for long−term control of the disease.
Box I.9 Urban health: malaria
Urban malaria is a major health problem throughout the developing world. Its mosquito vector is a species ofthe genus Anopheles and it is the local anopheline species and its preferred breeding habitats thatdetermines, in any one place, whether urban malaria is related (in a similar way to Bancroftian filariasis) toinadequacies of sanitation and stormwater drainage. Thus An. stephensi, the main vector of urban malaria inAsia, generally breeds in household water storage containers, and so in Asia urban malaria is not so closelyrelated to sanitation and drainage (although An. stephensi does occasionally breed in flooded borrow pits andblocked open drains). However in Africa and the Americas local vectors such as An. gambiae and An.albimanus breed in undrained water pools, marshes and rice paddies but also, and to a greater extent thanAn. stepehensi, in blocked drains (but not ones so polluted that they favour Culex quinquefasciatus).
II. POTENTIAL IMPACTS OF STORMWATER DRAINAGE AND LAND RECLAMATIONPROJECTS
A. Urban land−use planning
Marginal urban lands subject to frequent flooding are generally left outside the scope of urban planning unlessthe urban authority has plans to reclaim the lands through stormwater drainage projects. Without such plans,the lands are in essence temporarily abandoned and often “invaded” by the landless urban poor. Such asituation is, from an urban planning viewpoint, most unwise since the lands, once reclaimed, may be bettersuited to urban uses other than low−income settlements − industrial or commercial developments, forexample. Yet, once the land is invaded and settled, and however precarious the settlements, it becomesmuch more difficult in sociopolitical terms to clear the land of its human settlement and enhance it, bystormwater drainage, for an alternative use.
Thus, urban planning authorities must be aware of the potential benefits of draining marginal lands subject toflooding. They must plan for draining and reclaiming such land, and assign uses to the land so reclaimed,even though the reclamation project may not be realised in the short term. The land, in its unreclaimed state,must be protected. This will either mean providing alternative land for human settlements if the land to bereclaimed is to be used for another purpose; or it will mean allowing controlled development of the land forhuman settlement. Controlled development must include provision for stormwater drainage.
11

However, in such development programmes, there is a serious dichotomy: will the reclaimed land be toovaluable to allocate it for a low−income human settlement? Urban planners must address questions such asthis, and it is only through a fair and uncorruptible system of urban planning that the urban poor will be able tobenefit from land drainage and reclamation projects. It needs to be remembered that the urban poor make upa large proportion of the urban population in most developing cities, and that businesses need a healthyworkforce. Thus to continue to ignore the needs of the urban poor in the face of the demands of urbanbusiness and commercial sectors becomes, in the end, self−defeating. Both the urban poor and the businessand commercial sectors need land: stormwater drainage of marginal land can satisfy this need, and theresulting reclaimed land must be shared between them, for they are not mutually exclusive groups: they bothneed each other, and it is in the clear interest of the business and commercial sectors to see that the urbanpoor are provided with good land to settle on so that they have a good supply of fit and healthy labour. Urbanplanning, therefore, has to address this unequivocally.
B. Urban health
The principal immediate benefit resulting from the drainage of human settlements is improved environmentalhealth. Vector−borne diseases will decrease substantially, as will faeco−oral diseases and geohelminthicinfections if the settlement has an adequate water supply, adequate sanitation and adequate garbagecollection. Given that the reclaimed land is valuable (see section C below), households have the incentive toinvest further in their housing − so improvements in water supply, sanitation and garbage collection soonfollow drainage improvements. Thus the cycle of urban ill−health can be broken: infrastructure improvements,starting with drainage, reduce disease; a less diseased workforce earns more money, and households withmore money become healthier. The cycle of disease is replaced by a cycle of health. This is urbandevelopment at the human level.
C. Socioeconomic benefits
The principal socioeconomic benefit of urban drainage and land−reclamation projects is the increase in thevalue of land, although, as noted in section A above, if the urban planning process is not equitable, this canhave a detrimental effect on the urban poor. Provided drainage and reclamation projects have been properlydesigned and executed, significant increases in the value of the land are basically inevitable, since land whichis subject to frequent and serious flood inundation has very a low value compared with land which is protectedor has a low risk factor associated with it. Improved drainage of this low−lying land can significantly increasethe land values to the benefit of the owners and also to the community generally due to the ability of localauthorities to increase the valuation of the property tax base within the city.
Land which is subject to inundation is frequently low−lying and consequently the drainage investment requiredto protect it against a reasonable frequency of flooding is significant. It is often necessary to create artificialdrainage patterns within the site so that the area can be drained for local storms and protected from majorflows in the catchment waterways. A typical example, from Greater Manila, is given in box II.1. However, asurplus of economic benefits and financial viability cannot be taken for granted in any drainage andreclamation project. Careful analysis must be made of the costs of providing services at the appropriate levelsand standards, together with conservative estimates of land values when the use is changed. It is essentialthat the environmental benefits and negative impacts be included in the equation, even though these arenotoriously difficult to measure. In addition, the costs of correcting any external adverse effects must beincluded in the development costs. Further details are given in section V.C.
There are, it should be noted, serious economic disbenefits associated with forgetting about drainage. Anexample of this is to be found in the urban component of the Million Houses Programme in Sri Lanka. TheGovernment was prepared to loan up to Rs 15,000 to plot holders to build a house, but it found it also had tospend an average of Rs 12,000 on plot preparation: this was not taken into account at the planning stage andso it ended up as a non−reclaimable government investment which was principally used to reclaim low−lyingland designated for low−income housing or upgrading land already illegally occupied by the householders.
Box II.1 Drainage increases land values in Dagat Dagatan, Greater Manila
The site area in Dagat Dagatan was 410 hectares. The drainage component of the services/infrastructureprovided represented 17 per cent of the total cost for off−site drainage work and 13 per cent for on−site
12

drainage works. Out of a total cost (1978) of 452 million pesos, drainage costs therefore represented 229,000pesos per hectare or 23 pesos per square metre. Land values increased from about 35 pesos per squaremetre to 94 pesos per square metre or 2.7 times due to the improvements and investment of infrastructure.
To make this land useful for urban purposes, reclamation was required to raise the site above the normal sealevel and to grade the site to create local contours to provide the minor drainage system.
The economic analysis undertaken for the project indicated that net benefits were all positive for threedifferent land sale prices which were evaluated. Even at the price of 75 pesos per square metre there werepositive benefits. In addition, there were substantial social benefits both on the site and off the site due toimprovement of communication networks and locational advantages which could not be calculated in moneyterms but which were very real benefits. Additional social benefits noted in the economic analysis were theincreased productivity of neighbouring land and improvements provided by the Dagat Datan development.
The reclamation significantly increased the productivity from the land due to the ability of the governmentagencies to consolidate a large number of small holdings into a single large parcel for redevelopment fromfish ponds to urban use.
III. TECHNICAL OPTIONS FOR STORMWATER DRAINAGE AND LANDRECLAMATION
A. Stormwater management
Drainage systems in urban areas can be broadly divided into two types:
(a) Combined systems, where stormwater and wastewater (sewage) are combined togetherin one system to discharge into the watercourses which form the natural drainage system;
(b) Separate systems, where wastewater is diverted into a separate piped system to isolate itfrom stormwater flows.
In most cases, designers today prefer the use of separate systems, although in many developing countrieswhere sewerage systems have not yet been provided the storm drainage system of necessity also carriesurban wastewater. Conversion to a separate system can often be achieved in stages over time.
This report is principally concerned with the separate−system approach and with the provision of a system tocollect, transport and dispose of the rainfall within a particular catchment. It is essential, however, thatdesigners recognise the implications of low velocities which occur during dry weather in storm drains whichalso carry sewage. Low velocities can result in the deposition of silt and solids, so creating unsatisfactorysanitary and aesthetic conditions.
The main purpose of the urban drainage system is to convey stormwater to the receiving waters with aminimum of nuisance, danger and damage. Goals for urban drainage management are as follows:
(a) To ensure that floodwater inundation of residential commercial and industrial areaslocated in flood−prone landscape occurs only on rare occasions and that the velocity/depthconditions during these events are below prescribed limits;
(b) To provide convenience and safety for pedestrians and traffic by controlling stormwaterflows within prescribed limits;
(c) To retain within each catchment as much incident rainfall and run−off as is possible giventhe planned use of the catchment terrain and its biotic and engineering characteristics.
The application of the first two goals within the drainage system of an urban area brings forward the conceptof the major and minor drainage systems as part of the overall urban run off management.
13

This concept of urban run−off management can be considered as part of an overall strategy for watermanagement within the city. The concept recognises that the total urban drainage system consists of a minorcomponent which includes the network of pipes and surface channels capable of handling run−off from stormsup to an agreed magnitude. Often, this magnitude of design frequency is chosen arbitrarily but, generally, itrelates to the occupation of the land in the catchment and the potential damage which would follow inundationwith floodwaters.
Larger storms than the adopted magnitude of design frequency for the minor system bring into play the majorcomponent of the drainage system. This is the route followed by storm flows which cannot be accommodatedwithin the minor drainage system. This frequently involves the roads and other spaces naturally followed byfloodwaters and is often not the result of deliberate design. It is an important objective of drainage design toensure that adequate capacity is maintained in the path of the major drainage system without creating ahazard or threat of damage up to the design recurrence interval.
It is the recognition of these two major components which designers must keep uppermost in their mindswhen planning and designing a drainage system for an urbanized catchment. There is little benefit to bederived from increasing the capacity of the minor system without recognising the potential for using the majorsystem. The logic of adopting this approach has been that increased capacity in the minor system willincrease flood protection and reduce inconvenience. However, large storms will still cause flooding and thecost of the minor benefits achieved from the increased investment in the minor system may not be justified.There is a need to evaluate carefully the objectives of the minor system from a cost effectiveness standpointand to recognise the value of the major system in coping with overflows from the minor system.
The design of a major drainage system implies the preservation of more open space. The control ofdevelopment in the natural waterways and the preservation of natural channels in developed areas ispreferable to a total commitment to storm drainage structures. This concept of a planned integration ofpermanent water areas in open spaces with provision for temporary flood storage can reduce drainage costsin two ways:
(a) Peak flood flows are attenuated, thereby reducing downstream drainage capacityrequirements;
(b) Temporary storage, if properly designed, provides recreational and aesthetic benefits and,thereby, increases land values.
B. Drainage system components
Drainage systems, particularly in the minor system network, might include pipelines, open channels, naturalsurface channels and canals. The major drainage system would almost certainly include open channels andnatural watercourses within an urbanized (or urbanizing) catchment.
Urban and rural development changes the preexisting natural drainage conditions. Agricultural developmentinvolves the clearing of the natural vegetation and replacement with pasture and harvested crops. Thisprocess usually increases surface water run−off, increases the rate of run−off and reduces the opportunitiesfor infiltration, evaporation and transpiration which are critical components of the overall hydrological cycle.The methods of agricultural improvements to land include ploughing and grazing which can cause erosion,soil loss and sedimentation in streams thus further altering the natural environmental conditions.
Urban development has an even more marked effect than does agricultural development. By its very nature itcovers a large proportion of the developed area with impervious surfaces including roads, footpaths,driveways, houses and outbuildings, commercial and industrial buildings and parking areas. Even parks andgarden areas and sports fields are designed to be free−draining and avoid ponding and to shed the majority ofstorm rainfall by surface drainage and sub−surface pipe systems more quickly than the natural rate ofinfiltration will permit.
This more rapid surface drainage and the provision of lined drains and piping systems, besides increasingrun−off, also removes opportunities for infiltration, evaporation and transpiration. It rapidly increases the rateof run−off concentrating it and aggravating flooding problems in downstream areas. An illustration of the ratesof run−off changes due to increasing percentages of impervious cover as development increases is shown infigure 3.1. It can be seen that evapotranspiration decreases by some 25 per cent, but that surface run−off
14

increases 4.5 times. Major losses also occur in infiltration, which is reduced by some 30 per cent. It is,therefore, of great importance in planning the design of a drainage system that areas of infiltration and storageeither be retained or created within the major drainage network to attempt to mitigate against the impact ofurbanisation on the run−off characteristics.
C. Storage: detention and retention
Any system of run−off involves some storage between rainfall and the collection of the run−off in a majorwatercourse or receiving waterbody. Natural storage occurs as wetting on natural vegetation and in surfacedepressions under conditions of overland flow. This is usually minor, depending on the configuration of thearea concerned.
Where the area concerned contains larger depressions, major open drains or where the surface waterrecharges adjacent aquifers through major pervious soil areas, the natural storage may be much greater. Thestorage in pipes and streams themselves is of significance in the behaviour of the total drainage system. Thisstorage acts to reduce the peak of the storm hydrograph by increasing the time of concentration and byvarying and spreading the range of concentration times from the individual contributing areas. It thereforelessens downstream flooding and the size of the designed drainage system necessary to handle a givenstorm event.
Figure 3.1. Runoff changes due to changes in impermeable cover in catchment
15

Storage may be either temporary or permanent and may be designed into a development to replace thenatural storage lost due to development or to augment insufficient natural storage to avoid aggravatinginadequate downstream capacity. Storage may be designed to be concentrated or distributed, or it may be acombination of these to suit particular design parameters.
Further discussion on designed storage and its role in the control of run−off is given below. Despite itsimportance in understanding of stormwater management, it is not a universal solution. The physicalcharacteristics and constraints in an urban catchment may preclude the provision of sufficient storage, or maymake it uneconomic, even if it is technically feasible.
Detention
Detention is the technique of using temporary storage to collect and hold run−off for a short period of time andthen release it through a controlled outlet into the normal drainage system at a reduced rate. The peak outflowis thus lessened and the drainage system downstream of the temporary storage is more easily able to carrythe storm flow. Detention methods may be implemented at a local or regional level. The difference is reallyonly one of scale, though they may conveniently be thought of as relating to stormwater drainage and regionalflood control respectively.
In recent years there has been a substantial movement in the United States of America and other developedcountries to require a developer to take steps to ensure that peak run−off rates from its development are nothigher than those existing before the development.
Some techniques for providing detention include:
(a) Rooftop detention. In order to meet these requirements some developers of commercialand industrial properties have provided ponding on flat roofs to store stormwater and releaseit gradually into the drainage system. A typical detention ponding ring is shown in figure 3.2.This method of detention makes use of the substantial load carrying capacity of flat roofswhich are designed for high live loads.
(b) Parking areas. Another method used to comply with these requirements of limitedstormwater outflow from commercial properties is to construct parking areas with a largeholding capacity and restricted outflow. Thus the parking area acts as a detention basin forsome time after a sudden downpour. The large parking areas serving shoppers and sportsareas makes this viable when other land is not readily available. Two general methods havebeen used in the United States of America. In one method the parking surface is graded toporous medians which act both as storage basins and seepage pits, so permitting the slowinfiltration of stored water into the ground or the drainage system. The exact details will besite−specific and depend upon prevailing soil conditions including both the permeability andthe susceptibility to siltation. A typical method is shown in figure 3.3. The surface should begraded to assist drainage to the porous median. Slopes between 1 and 4 per cent aregenerally recommended.
(c) Tanks. Some studies have shown that there could be overall economic benefits inresidential development by introducing a fibre−glass tank detention system for eachhousehold in the development. The system consists of a conventional roof and downpipesystem but with all downpipes being led to a single under−house fibre−glass tank whichwould receive and store the house stormwater drainage. Outlet from the tank would bechoked and drained through a small diameter pipe to a reduced drainage system (figure 3.4).Since the tank in this system is to be placed at the very source of a major component of thestormwater run−off, the savings accrue to all components of the drainage system.
(d) Retarding basins. Beyond the local off−site detention areas, there are sometimes one ormore major downstream detention basins, more often known simply as retarding basins. Thekey factor in detention is not a change in run−off quantity but a change in its discharge rate.Each area which is used for the temporary storage of run−off is designed to discharge itsstorage more slowly than the rate of inflow, thereby providing attenuation to the hydrographas it passes through the storage. As a general guide, the rate of release should be less thanor equal to the rate which would have applied to the natural system before development tookplace. The effectiveness of this approach, properly used, is illustrated in figure 3.5. Howeverin a complex system of interconnected detention ponds and retarding basins it is necessary to
16

verify that the resulting sub−catchment hydrographs do not accumulate in such a way as toaffect the outflow hydrograph adversely. This possibility is illustrated in figure 3.6 for a verysimple system. It shows how detention, although lowering the individual hydrograph peaks,could result in a net increase in the overall hydrograph peak due to the concurrence of theindividual hydrographs. Such an example is artificial and unlikely to occur in practice, but theprinciple is important and the resulting hydrographs should always be checked.
Figure 3.2. Detention ring for flat roofs
17

18

19

Figure 3.3. Detention using a porous median in a parking area
Figure 3.4. Household tank detention system
D. Drainage system design
Factors affecting storm flows
The two principal factors affecting storm flows are rainfall and run−off. It is necessary, in designing stormdrainage systems, to use rainfall data for the catchment under consideration. This leads to an estimation ofthe various stream flow characteristics and the run−off quantities to be coped with in the drainage system. Ittherefore follows that, for satisfactory drainage design, adequate rainfall data are essential. However theforms in which rainfall data are normally retained vary considerably, depending on the country and thepurpose for which the rainfall data were originally measured. The commonly used forms of data forhydrological analysis include estimates of basin rainfall depth, rainfall intensity (the amount of rain falling at acertain point over a given period of time), rainfall duration and storm pattern characteristics.
It is common to try to classify rainfall information for drainage design into intensity−frequency−duration dataand storm pattern data. In developed countries the meteorological agency which collects and records rainfalldata at many locations throughout the country is able to produce rainfall intensity−frequency−duration curvesfor a particular location. However in developing countries the availability of data is often limited to daily rainfallinformation and a great deal of effort is needed to convert this data into a useful and reliable basis for stormdrainage design. Further details are given in the annex.
Run−off is that measure of the quantity of water which occurs from the rainfall events. The volumemeasurement of its estimation is the basis for drainage design. It is unusual to find sufficient informationavailable in developing countries for the measurement of run−off in urban catchments, and thus estimatingprocedures must be used based on the rainfall intensity−duration−frequency curves generated from rainfalldata. Run−off depends on a number of factors apart from rainfall, such as the rate at which the water flowsacross the surface of land and reaches the drain being designed. The nature of the ground will affect the
20

eventual quantity of run−off. More porous catchment areas will provide more infiltration. Flat slopes willprovide more areas for storage in low−lying areas in the catchment and consequently opportunities fortranspiration, evaporation and infiltration. Catchments which are already wet (antecedent wetness) will havehigher quantities of run−off for a particular storm.
The more of this rainfall which is lost during the run−off process, the lower will be the requirement for drainagecapacity.
Estimation of flood flows
The processes involved in the transition from rainfall to run−off can be summarized as follows:
(a) Rain falls at a rate which varies with time and with the extent of area covered;
(b) Water runs off the different surfaces in the catchment, the latter flow being affected byretention on the surfaces by their relative distribution by infiltration and by the hydrauliccharacteristics of the surface channels and inlets;
(c) Once in the drain, the water flows at varying rates and the volume of water contained inthe drain also varies with time.
Because of the inadequate records available for run−off, methods for designing storm drains have generallybeen based on rainfall records which are available at many more locations and for substantially longer periodsthan any run−off records.
21

Figure 3.5. Effectiveness of retarding basin in an urbanised catchment
22

Figure 3.6. Possible accumulation of hydrographs
Run−off must be less than rainfall by an amount depending on the physical characteristics of the catchment.
Rational method
The simplest and most widely used example of this approach is the rational formula, which is based primarilyupon the assumption that the maximum rate of run−off will be produced by the most intense rainfall that canbe expected to occur over the basin for the period of time required for surface flow from the furthest part of thebasin to reach the point at which the peak flow is being computed.
The simplicity of the formula and the clearly evident logic on which it is based have led to its widespread andcontinued use. Except in the case of urban areas for which it was originally developed, however, a number ofimportant secondary assumptions implicit in the formula are seldom satisfied. The rational method is anadequate method of approximating the peak rate of run−off from a rainstorm in a given catchment. Its greatestdrawback is that it normally provides only one point on the run−off hydrograph. When the catchments becomecomplex and where subcatchments join, the rational method tends to overestimate the actual flow, soresulting in oversizing of the drainage components. The rational method provides no direct data to routehydrographs through the drainage facilities − that is, it takes no account of the storage and retention within thedrainage system itself and consequently will tend to over−estimate both the run−off and peak flows.
One reason the rational method is normally limited to small areas is that good design practice requires routingof the flows for large catchment areas to achieve an economic design. There is, however, no agreement onthe size of the catchment which should limit the use of the rational formula. Nonetheless it is reasonable totake 20 ha as a maximum area, and where urban catchments are larger they should be broken intosub−catchments of about this size.
One of the basic assumptions underlying the rational method is that run−off is a function of the averagerainfall rate during the time required for water to flow from the most remote part of the drainage area underconsideration to the point or design flow being calculated. However, in practice, the time of concentration canbe an empirical barrier.
The TRRL method
This approach to the estimation of run−off was developed by the Transport and Road Research Laboratory inthe United Kingdom to overcome the problems inherent in the rational method. The TRRL method is ahydrograph technique, which in its present form is implemented as follows:
(a) A hydrograph is constructed for a given pipe, using an area−time graph for the catchmentarea directly connected to the pipe and a rainfall profile;
23

(b) This hydrograph is added to the outfall (i.e., exit) hydrograph of the pipe immediatelyupstream of the one under consideration, displacing it by a time equal to the flow−time in thepipe being considered;
(c) The combined hydrograph is now routed through the reservoir formed by the pipe beingconsidered, assuming instantaneous uniform proportional depth in the pipe underconsideration to the given outfall hydrograph for it;
(d) This outfall hydrograph becomes the upstream (i.e., inflow or entry) hydrograph for thenext pipe downstream, and so on.
The procedure is illustrated in figure 3.7, and the process is equally applicable to open channels, as well as topipes. The method, which has been computerized and for which programs are commercially available, hasbeen modified for tropical conditions where some account has to be made of the stormflow from unpavedareas.
E. Land reclamation options
Reclamation in areas already occupied
Most sites where extensive reclamation is contemplated are low−lying and swampy. Reclamation is seen asthe appropriate means of increasing the value of the land by making it suitable for an urban use.
24

Figure 3.7. Steps in calculation of a hydrograph using the TRRL method
The cost of reclamation has to be balanced against the value added to the land. As the demand for urban landincreases, the economics of reclaiming low−lying land becomes more attractive. As already noted, low−lyingland located near existing urban centres often attracts squatters who build houses on the land, even into thewater, simply because the land is vacant.
The main feature that most squatter colonies have in common is that the land is usually low−lying and eventidal: for example, areas of the Tondo in Greater Manila flooded twice a day with the high tide beforereclamation of these areas was completed. Where squatters have occupied land, densities are often 150houses per hectare. Drainage is normally non−existent. Roads are built above the level of the housing land,
25

houses then being built with raised timber floors. Reclamation in this case is very difficult and can only beundertaken by manual techniques. Occupiers fill their land with solid waste and other fill materials as theybecome available. The whole reclamation procedure can take many years to complete before seeing thebenefits to health from eliminating water under the dwellings and being able to dispose of stormwater andwastewater into a network of pipes and channels. Major programmes to hasten this improvement have beenimplemented − for example, the Zonal Improvement Programmes in the Philippines and the KampungImprovement Programmes in Indonesia. Most other developing countries have, with the assistance ofmultilateral lending agencies, implemented similar slum−upgrading programme.
Reclamation methods for large−scale development
In other cases, housing authorities, faced with the enormous demand for low−cost public housing haveundertaken major urban development projects as sites−and−services projects. These sites are mostfrequently provided with a sanitary core for each housing unit. If these housing estates are to be of maximumbenefit to the target low−income families, they need to be located near industrial areas, ports etc. where workis available so that the journey to work is reduced to 1 or 2 km. The only land which will be vacant and meetthis location criterion is often low−lying swamps which, without extensive reclamation, are unsuitable forhousing.
In these cases, where the land is undeveloped, other method of reclamation, using mechanical means, areavailable to enable large volumes of fill material to be transported at a low unit cost. The cost of transport of fillis a direct function of the distance of the borrow pits. For coastal sites, offshore dredging is a practicalsolution. The process is illustrated in the diagrams in figure 3.8. Two techniques are shown. For borrow sitesless than 2 km offshore, sand fill can be dredged from the sea bottom and flushed to the fill site by pipeline.For distances greater than 2 km, dredges fill barges which discharge into a stockpile nearer to the shore andthe fill is then dredged and transported from the stockpile to the fill site as in the first method.
On−shore borrow pits allow the use of mechanical equipment, excavators, loaders and trucks to carry the fillfrom the borrow pit to the fill site. An example of this is the Mirpur Project in Dhaka. In this case, there wereseveral sites requiring fill. The largest site was filled by trucks transporting fill to the site and the fill was placedwhere needed by manual handling in baskets. Other areas required site excavation and the cut material wastransported by hand to fill areas within the site (figure 3.9).
Some problems on reclaimed sites
The principal physical problem to be faced in sites which are deep filled is the settlement, both short−term andlong−term. The short term settlement is largely a factor of the type of fill materials, and the degree of initialcompaction effort applied. It is desirable for the benefit of structures and roads being built for the sites to bewell compacted as filling proceeds in layers. This is often difficult where dredged materials are used off shore.In these cases it is almost always necessary to found important buildings on piles. Piles are often alsorequired under major sewers and drains since these services must be constructed to grade and the continuedeffective operation depends on them retaining their gradelines.
Long−term settlement is a function of the base material in the areas being filled. Where the land is swampy, itwill often contain substantial depths of clay sediments which are soft and compressible. These will settle asthe load of fill material is increased over the base sediments. Singapore provides a good example of the effectof placing deep fills of 6 m to 12 m over marine clays. The Geotechnic Division of the Singapore Public WorksDepartment suggests that fill can continue to settle beyond 100 years. The curves in figure 3.10 show theanticipated settlement for a site reclaimed off−shore by sand dredging. Two curves show the settlement to beexpected for one or two layers of fill.
26

27

28

Figure 3.8. Alternative reclamation techniques from offshore
Figure 3.9. Filling techniques at Mirpur, Dhaka (a)
Figure 3.9. Filling techniques at Mirpur, Dhaka (b)
29

Figure 3.9. Filling techniques at Mirpur, Dhaka (c)
The curves show that much of the settlement occurs in the first 10 years after fill. This experience suggeststhat:
(a) Potential reclamation sites should be filled several years before development occurs, ifsettlement is to be expected;
(b) Low profile small scale buildings are preferable to high rise and could be founded on shorttimber piles;
(c) More substantial buildings will require fully−piled foundations for stability.
F. Land stabilization
Where the land being reclaimed abuts the seaboard, special protection measures are required to maintain thestability of the site. The type of structure used for this purpose will depend on the availability of land. InSingapore, sea revetments are constructed on specially placed sand fill (see figure 3.11) with flat slopes.Excavation behind these revetments needs to be carefully considered due to the groundwater tableassociated with certain high tidal conditions.
Where space is a premium, a concrete or steel sheet piled wall can be built to protect the filled area fromerosion and reduce the land loss from flat batters.
Seawall design is at a specialist function and required the consideration of a large number of complexinteracting factors to ensure the wall is structurally stable and does not cause more erosion due to the changein the natural seaboard conditions.
Inland sites which are close to large rivers or require major drainage impose severe constraints onconstruction. It is generally necessary to construct the principal drainage channels before the filling of the site.One technique for doing this is illustrated in figure 3.12 where the walls of the channel are built “in the dry” andthe waterway excavated by dragline or dredge depending on the drain dimensions.
As can be seen from the foregoing discussion, reclaiming land requires detailed engineering analysis inhydrology, soil mechanics, maritime engineering and construction techniques for successful implementation.Without this input, the results have a serious impact on land outside the site and result in unstable conditionswithin the site for many years.
30

Figure 3.10. Predicted settlements in Singapore reclamation
Figure 3.11. Revetment shore treatment, Singapore
31

32

33

Figure 3.12. Technique for channel construction and land reclamation
IV. MAINTENANCE
A. Maintenance objectives
The importance of an adequate system for maintenance of the drainage system cannot be overemphasised ifthe system is to operate at its design capacity. If rubbish and silt are allowed to accumulate in channels andrivers, these facilities will not be capable of satisfactorily fulfilling their primary function − the removal ofstormwater run−off. If the inlets into the drainage system from roads are not regularly cleared, they willbecome blocked and stormwater will be prevented from entering drains, so causing local flooding. Theobjective of a maintenance programme should, therefore, be to keep the drainage system operatingdependably, at its design capacity, without breakdowns.
Protection of the capital investment in the drainage system necessitates a planned programme of inspectionand routine clearing. Periodic, thorough and competent inspection while cleaning will reveal points at whichdamage begins to take place. Adequate financial and labour resources must be allocated to ensuresuccessful drainage operation and maintenance. It is therefore necessary for drainage authorities, usually thelocal government, to ensure that maintenance is accorded a sufficiently high priority in the allocation of fundsin annual budgets.
The objectives of carrying out the maintenance programme should be to:
(a) Keep the system operating at design standard at all times;
(b) Obtain the longest life and greatest use of the systems facilities by providing adequatemaintenance and timely repairs;
(c) Achieve the foregoing two objectives at the lowest possible cost.
The history of drainage is full of examples of the difficulties which can occur when maintenance is neglected.Even the best constructed system will eventually fail if adequate maintenance is not undertaken.
Maintenance activity should begin the day the system is placed in operation or, under some circumstances,prior to completion of a system and before the system is placed into operation. Keeping maintenance workcurrent on all facilities in a system is the keystone to any successful drainage enterprise.
There are two primary concepts of maintenance of public property, and most maintenance operations can bereadily classified into one of these categories:
(a) Maintenance by necessity;(b) Preventive maintenance.
“Maintenance by necessity” refers to the practice of “fixing it when it breaks down”. Under this approachcleaning of drains is confined to the minimum necessary to satisfy complaints. Likewise, repair work isundertaken only when a condition becomes so bad that it must be corrected or repaired to restore service orfor safety reasons. Unfortunately, this approach is all too common in rapidly growing cities where the funds forroutine maintenance are inadequate.
“Preventive maintenance” is represented by a systematic programme of inspection, cleaning and repair thatreduces breakdowns and complaints to a minimum. Preventive maintenance not only pays dividends ineconomical operation; a smooth working system also means uninterrupted removal of water at lower cost withreduced risk of damage from flooding as a result of design storms.
Preventive maintenance also has other distinct advantages:
34

(a) It can be scheduled and performed on a regular basis at times that least disrupt otheroperations functions;
(b) Pre−ordered parts can be made more readily available; they may not be so readilyavailable under emergency conditions;
(c) Work can be carried out during normal working hours with less emphasis on extension ofhours and weekend work;
(d) More experienced personnel can be used if the work is scheduled; they may not beavailable in emergencies;
(e) Special tasks of preventive maintenance may be contracted out to reduce the need tocarry a specialist workforce.
B. The maintenance programme
All structures and facilities are subject to deterioration in varying degrees over time. Regular inspectiontherefore is necessary to detect and correct potentially unsafe or unsatisfactory conditions as they develop.Cracks in concrete or masonry, general erosion behind structures or settlement of an embankment can resultin major failures if the cause is not identified and corrected or repaired without delay. Many problems thatdevelop may not be of such a serious nature. In channels, the control of weeds, storm erosion of banks,seepage of water through banks and base, silting and accumulation of debris or solid waste may be lessserious than structural failures, but they still require regular attention if efficiency of the system is to bemaintained. Frequently these latter problems are more time−consuming and costly over the years and aremore frequently neglected since they accumulate slowly.
The use of appropriate materials and methods for repair or replacement is important. This can includeadequate attention to the quality of the concrete aggregate and cements used, and the characteristics ofprotective coatings used to meet environmental requirements. Staff responsible for drainage system operationand maintenance should always be alert to the development of new materials and products and their possibleadoption for the solution of maintenance problems.
The application of the agreed maintenance procedures requires close supervision and the development of arange of skills in the maintenance workforce.
To accomplish the required maintenance, questions arise concerning the use and protection of materials, theneed for lines of communication and access, and the personnel requirements to accomplish the work. Regularinspections and records of complaints will identify any components in the drainage systems which are notmeeting the design criteria. If it is found that a structure or facility does not perform the purpose for which itwas designed, the designer should be advised. In this regard, experienced operation and maintenancepersonnel can be of key assistance if they are given the opportunity to review system designs before a facilityis constructed. In carrying out such reviews, they should consider designs and construction that will requirethe least maintenance consistent with budgetary constraints.
Obtaining the longest life and greatest use of drainage facilities can best be accomplished by providing goodmaintenance and a programme of systematic improvements and replacements. In many instances, it is hardto determine the point at which good maintenance ends and replacement begins. Good maintenance, forexample, may necessitate the replacement of a gate leaf, later a gate shaft, and perhaps later still the liftingdevice itself.
As drainage works advance in age, a programme to replace worn out and obsolete structures is necessary toextend the useful life of the system. The essential requirement is to have a maintenance plan and programme.
C. Review of maintenance
The key to good maintenance is frequent inspection. Inspection followed by proper care of channels,structures and mechanical equipment will avoid major maintenance at a later date. Proper maintenance
35

demands close and continuous examination of system facilities by experienced personnel, followed by timelyrepair and replacement programmes.
The timing of some recurring maintenance needs can sometimes be predicted. However, in generalmaintenance needs can only be determined by careful on−site observation. It is therefore necessary toarrange for periodic inspection of all system facilities at regular intervals. The results of these inspections mustbe recorded so that the performance can be tracked. With the advent of computer technology and thedevelopment of smart software, this recording of information in databases for easy access and managementreporting can expose trends in the extent of the maintenance effort required by various sections of thedrainage system. This information system can then be used to direct the available maintenance funds to thoseareas.
As untreated or uncorrected minor maintenance needs can grow rapidly into major and costly maintenanceproblems, inspections should be made frequently. The interval between subsequent inspections may then bedetermined as performance dictates.
Three procedures which have been developed for the implementation of an inspection programme are:
(i) Initial inspection. When construction is essentially completed, a formal inspection of allwork is made and any uncompleted items and deficiencies listed. This defines the workremaining to be accomplished and provides an opportunity for all concerned to be betterinformed on the condition of the system at the time control is taken over. The inspectionshould be made by a team representing the design, construction and operation andmaintenance agencies.
(ii) Operation and maintenance instructions and criteria. A detailed manual for operation andmaintenance of major structures covering all important features of the operation andmaintenance of the structure should be prepared. The designers' operating criteria should bepublished to cover the technical operations of equipment and structures and the requirementsfor maintenance. This helps to ensure that the facilities will be operated as the designersintended, thus avoiding damage and extending the life of the facility.
(iii) Periodic review of maintenance. These reviews should be in the form of a thoroughinspection of all facilities. The inspection team should include an engineer from the designorganization, a senior representative from the operating agency, and key maintenancepersonnel. The principal purposes of the review are to verify the safety of the structure; todetermine the level of maintenance and conditions that might cause failure of operation; tonote the extent of deterioration as a basis for planning maintenance, repair or rehabilitationwork; and to obtain operating experience data for improvement of future design, construction,maintenance and operation practices.
Reports prepared for all review of maintenance inspection should include the current findings, comparisonswith previous inspections, and a summary of conclusions and recommendations. To provide guidance inplanning and performing repairs, they should also include adequate photographs and drawings to illustrateconditions found. It is suggested that recommended repairs and operating procedures be grouped intocategories according to the importance of problems involved. These might be:
Category 1: recommendations involving matters of great importance which must be actedupon within a prescribed period;
Category 2: recommendations covering a wide range of important problems that should besolved;
Category 3: recommendations for modification of the inspection, operation and maintenanceprocedures.
D. Institutional arrangements for maintenance
The drainage system in a city falls into a distinct hierarchy. At the lowest level is the initial drainage system,the small drains along the edges of the roads and paths, and the kerbs and channels where rain falling on the
36

roads and buildings will slow first. These channels convey water through inlets in the kerb or road edge to theminor drainage network.
The minor network of pipes and open channels are the second level in the hierarchy where the stormwater iscollected and transported to discharge into the next tier, the major drainage system network of naturalstreams and watercourses.
It is not possible to set one single strategy for the management of the whole drainage system which will besuitable for all cities. Much depends on the overall institutional structure in the city: is it one municipality or isthere more than one municipality with a regional authority with metro−wide responsibilities for major drainageworks? It is possible, however, to make some general assertions:
(a) The initial drainage system maintenance should be integrated with the maintenance of thelocal road network. These drains form an integral part of the road. Good drainagemaintenance is an essential requirement of the protection of the road itself. The patrol gangresponsible for the road maintenance should also ensure that the drains, culverts and entrypoints to the drains are clear, serviceable and able to function properly. In general, the publicworks department of the municipality would have this responsibility.
(b) Depending on the structure of the city government, the minor drainage system could alsobe maintained by this same public works agency. This will normally lead to efficient use of theagency's plant and equipment fleet and its labour force. In large cities this will bedecentralized into districts where local depots would hold stores of materials, houseequipment and provide servicing of the district's equipment. It also provides a local contactpoint for residents to lodge complaints. In some cities there is a division of responsibility forthe construction and maintenance of the minor drainage system between the municipality andthe metropolitan regional authority. For example, the regional authority might haveresponsibility for drains where the contributing catchment is greater in area than, say, 100hectares. This has the advantage of locating the maintenance of these larger drains whichfrequently cross municipal boundaries with a single agency. This will lead to a consistentapplication of maintenance standards and design criteria.
(c) The major drainage system includes roads and landscape/park areas where excessstormwater from the minor system flows during heavy storms. These parts of the majordrainage system are not formal drains and are used as overflows from the minor drains. Theirmaintenance needs careful attention so that they will properly fulfil this overflow role in timesof excessive run−off, but they would fall within the ambit of the municipality for routinemaintenance. The other components of the main drainage system, the watercourses, streamsand rivers, are clearly regional, traversing municipal boundaries. These are not only used tocarry excess stormwater but may be used for recreation, transport, irrigation or water supply.Only a metropolitan−wide organization can successfully integrate these functions with thedrainage function of the watercourse. Maintenance should therefore be the responsibility ofthis organization. If no metropolitan agency exists, the role will most likely fall to a provinciallevel of government.
The following are some of the key functions related to drainage maintenance:
(a) Programming and implementation of a regular inspection and maintenance programme ofthe drainage system;
(b) Collection and recording of rainfall and run−off data for all catchments in the area, if this isnot available through a central agency;
(c) The establishment and maintenance of records of all drains in the system and theinspection and repair programme;
(d) The training of staff and operators;
(e) The protection of the public and employees by the development of safety programmes;
(f) Public communications to increase the awareness of the public of the importance of gooddrainage and the community's role in achieving this;
37

(g) Liaison with other agencies who may be affected, or whose functions affect, the drainagesystem;
(h) Consultation with the drainage design and construction agencies to ensure designsincorporate details to facilitate maintenance.
The form of organization for maintenance of urban drainage systems will vary by country and the governmentstructures established in each country. The structure shown in figure 4.1 is indicative only and is meant toshow the levels of the organization and the sections which are required to provide a comprehensivemaintenance programme.
The key sections are:
(a) Safety office − separate from the operations sections to ensure this aspect retains itspriority and status in the organization;
(b) Operations and maintenance;
(c) Inspection, records and survey;
(d) Sub−districts in larger cities with mobile gangs;
(e) Plant maintenance;
(f) Stores.
Figure 4.1. Organization chart for drainage operations and maintenance
V. PROJECT APPRAISAL
The appraisal of drainage and land−reclamation projects should follow the same procedures as for any otherpublic sector project. This will include at least four types of review and analysis:
(a) Technical;(b) Social and health impact;(c) Economic and financial;(d) Institutional.
38

The appraisal process requires a team with skills in a wide range of disciplines including urban planning, civilengineering, institution building, cost estimation, operations and maintenance, financial analysis andeconomic appraisal. For land reclamation, where lots are the product generated and these must be sold, skillsin marketing, valuation, and estate management are also generally necessary.
A. Technical appraisal
The technical appraisal, or the engineering review, of the project will deal with such questions as:
(a) Are the physical scale and quantity of inputs (materials, labour and plant) appropriate forthe development?
(b) Is the quality of materials proposed suitable?
(c) Are the design criteria based on sound planning and engineering principles?
(d) Does the level of service proposed meet the project objectives and affordability levels?
(e) Are the levels of technology to be adopted appropriate?
(f) Do the capital cost estimates meet budget provisions?
(g) Is there adequate access to the site, and are transport facilities satisfactory?
(h) Do the project procurement and project delivery procedures (including the implementationschedule) meet the phasing requirements of the project?
(i) Are the arrangements for stormwater disposal ecologically sound? Has a comprehensiveenvironmental impact statement been prepared?
B. Social and health impact appraisal
The social and health impact appraisal is concerned with the effects of the project on people, and thus isconcerned with such questions as:
(a) Does the project require any houses or other buildings to be demolished? If so, whatarrangements have been made for relocation? Are these acceptable to those households tobe relocated?
(b) What arrangements have been made for access during construction? Are theseacceptable?
(c) Has a detailed health impact statement been prepared? Does it cover malaria, Bancroftianfilariasis and schistosomiasis as well as faeco−oral and geohelminthic infections?
(d) Does the project create any new health hazards, including during the construction phase?
(e) What arrangements have been made for selling new plots to the urban poor? Can theyafford them?
(f) Do the urban poor need special help to participate in, or benefit from, the project? If so,has it been provided?
(g) What legal safeguards have been incorporated into the project to protect the poor?
39

C. Economic and financial appraisal
There are basic differences between financial analysis and economic evaluation. Financial calculations areused as a working appraisal tool throughout the later stages of project preparation to refine design standardsand test the financial implications of various implementation policies.
Economic appraisal attempts to reflect the effect of the project on the national economy and so must take amuch wider view than financial analysis. The purpose of economic appraisal is to estimate the likely netimpact on an investment project, in terms of national welfare. A good project will increase national income,undifferentiated by type of recipient. Income by itself does not create welfare, but leads to the consumption ofgoods and services and can serve as a proxy for such welfare−creating consumption. The viewpoint for theeconomic appraisal is that of a government official or agency concerned about the effect of a project on theoverall economy.
The procedure for economic appraisal is complex and requires identification of the origin of me project inputs(labour, materials and plant) and the destination of outputs. An experienced economist is needed to preparethis analysis. In the words of the World Bank:
Once a project's inputs and outputs have been classified as traded and nontraded, theprocedure is straightforward. The cif or fob prices of the traded items are identified, along withthe domestic costs of moving the items to the project site or domestic marketplace. Then thedomestic market prices of the nontraded items are identified and converted into border−priceequivalents. When all inputs and outputs have been expressed in border prices (including thedomestic transfer costs), one simply inserts those values into the cashflow in place of thefinancial values and computes the economic rate of return.
To calculate the economic (internal) rate of return one can employ a trial−and−error method of finding thediscount rate that reduces the net present value of the economic time series to zero. Ideally, this rate shouldequal or exceed the country's opportunity cost of capital.
A financial analysis is also required, and this has three main objectives:
(a) Confirm that an adequate financing plan exists to cover expenses during the investmentphase of the project;
(b) To ensure that funds are likely to be available as needed during the operational phase ofthe project to pay for current operating and maintenance costs and to repay debt;
(c) To verify that sufficient surplus will be generated, under plausible assumptions about thefuture, to reward equity investors for bearing risk and putting savings into the project ratherthan elsewhere.
Investors can use a variety of techniques to measure the potential rewards of putting funds into one activityrather than another. The objective is usually the same: to maximize the return flow of income withoutexceeding some tolerable level of risk. A disciplined appraisal helps to focus on the nature and extent of riskas well as the likely amount of income to be expected.
The investor, be it a government agency or private developer, will have similar objectives, but the decision toproceed or not may be based on different criteria. The government agency may need to meet some socialcriteria to meet its political objectives. The private sector, unless subsidized by government, will evaluate theproject on the basis that the project will show a superior return on investment than other potential investmentsavailable at the time.
Project timing and phasing are critical factors in determining the rate of return. The phasing will be affected bythe need to meet market demand for the developed land. Development ahead of the market will mean aninvestment lying idle, so generating holding costs on capital. Development which is behind the market will beaffected by competition from other developments.
Several techniques are used in testing the financial viability of a project. It is necessary, when comparingalternative scenarios, to establish the cash flow over the life of the project and to “discount” expenditureplanned for the future to its present−day value. This discounted cash flow is dependent on the selection of a“discount rate”. Again the private−sector investor will need to adopt a different discount rate from the
40

government investor because of their costs and their opportunities for alternative investment.
From most agencies' viewpoint, an after−tax financial return to equity does not convey enough information.Analysts need to look into a project's fundamental strengths, without regard to specific financingconsiderations. They do not want to be misled by financial “gearing” and peculiar borrowing arrangements.For these reasons, the project's financial rate of return on all these resources, donated or borrowed, butbefore taxation, has to be determined.
Sensitivity testing. Testing variables and assumptions to determine their relative influence on the financial andeconomic rates of return should be done. The objective is to discover the impact on the internal rates of returnby changes in the assumptions. Items that are normally significant include the cost of investment and the unitprices of major current cost components (for example, the purchase price of land and the sale prices ofdeveloped lots). Thus the question is asked, “What happens to the financial/economic rate of return if the saleprice of the land is reduced by, say, 10 per cent?” Similar questions relating to increases in the cost of goodsand the delay in completion of the project, and therefore the delay in the revenue stream, need to beanswered. Generally, the greater relative importance of an item within the overall cashflow, the earlier itoccurs in time and the more likely it will be to have an adverse impact on the internal rate of return.
It is also advisable to run the sensitivity analyses for simultaneous adjustment of several variables. Theobjective is to highlight the strengths and weaknesses of the project as an investment. It then may be possibleto identify the potentially damaging factors and to apply appropriate measures to minimize their effects.
D. Institutional appraisal
The institutional appraisal considers topics such as:
(a) Land acquisition procedures and availability;
(b) Project ownership − public, private or mixed?
(c) Target population to be served;
(d) Community consultation;
(e) Operations and maintenance (O&M) of the project assets on completion;
(f) Executing agency capacity and capability and project implementation management;
(g) Levels of staffing for planning, implementation and operations and the scope and extent ofthe skills required for these functions;
(h) Staff training for on−going management (including O&M).
VI. CONCLUSIONS AND RECOMMENDATIONS
A. Conclusions
1. Urban stormwater management is an essential component of urban development programmes and, inparticular, of urban health programmes. It can provide reclaimed, safe urban land for human settlements,industry and commerce. If the reclaimed land is used for human settlements, then these will be much healthierenvironments than undrained settlements, and significant reductions in vector−borne diseases, diarrhoealdiseases and geohelminthic infections will occur.
2. Effective stormwater management can protect not only low−lying areas from inundation, but also humansettlements on steep hillsides where the threat of storm−induced landslips can be minimized or evenobviated.
41

3. Stormwater management projects require careful appraisal, design, implementation, and operation andmaintenance. All these project stages are vital to project success.
4. Properly implemented and maintained stormwater management projects may be expected to increase landvalues significantly. Such projects are almost inevitably highly cost−effective, but improperly developedschemes are likely to be economically, and possibly also ecologically, expensive, if not disastrous.
B. Recommendations
1. Governments in developing countries, both national and local, should become more aware of the potentialsocio−economic benefits − principally improved health and increased land values − of urban stormwatermanagement programmes and projects.
2. Governments need to decide, in any one instance and always on the basis of socio−economic equity, howbest to allocate urban land reclaimed by stormwater drainage to the competing sectors of housing, industryand commerce.
3. Local governments, which are normally responsible for the execution and operation of stormwater drainageprojects, must not only ensure their proper design and implementation, but also make sound provision for theirlong−term successful operation, for which a programme of regular preventative maintenance is essential.
BIBLIOGRAPHY
Engineering aspects
Anderson, J. A., “Hydraulic design of road−edge surface channels”, Highways and Transportation, vol. 38(1991), No. 6, pp. 6−28.
Argue, J. R., Storm Drainage Design in Small Urban Catchments: a Handbook for Australian Practice. SpecialReport No. 34 (Vermont South, Australian Road Research Board, 1986).
Ayoade, J. O., Tropical Hydrology and Water Resources (London, Macmillan, 1988).
Cairncross, S., and Ouano, E. A. R., Surface Water Drainage for Low−Income Communities (Geneva, WorldHealth Organization, 1991).
CETESB, Drenagem Urbana: Manual de Projeto (2nd edition) (São Paulo, CETESB, 1990).
Cotton, A., and Franceys, R., Services for Shelter, Liverpool Planning Manual No. 3 (Liverpool, LiverpoolUniversity Press, 1991), chap. 3, Drainage.
Fiddes, D., The TRRL East African Flood Model, TRRL Laboratory Report No. 706 (London, Her Majesty'sStationery Office, 1976).
Ford, W. G., Adaption of RRL Hydrograph Method of Storm Sewer Design for Tropical Conditions, Report No.LR715 (Crowthorne, Transport and Road Research Laboratory, 1976).
Hall, M. J., and Hockin, D. L., Guide to the Design of Storage Ponds for Flood Control in Partly UrbanisedCatchment Areas. CIRIA Technical Note No. 100 (London, Construction Industry Research and InformationAssociation, 1980).
National Water Council, Design and Analysis of Urban Storm Drainage: the Wallingford Procedure, vols 1−5(London, National Water Council, 1981).
Road Research Laboratory, Rainfall and Runoff from and Industrial Area in Nairobi, Kenya, Report LR408(London, Her Majesty's Stationery Office, 1971).
Shaw, E. M., Hydrology in Practice (2nd edition) (London, Van Nostrand Reinhold, 1988).
42

Snyder, F. F., “Synthetic unit graphs”, Transactions of the American Geophysical Union, vol. 19 (1983), pp.447−454.
Transport and Road Research Laboratory, A Guide for Engineers to the Design of Storm Sewer Systems,Road Note No. 35 (2nd edition) (London, Her Majesty's Stationery Office, 1976).
Health aspects
Cairncross, S., and others, “Engineering mosquitos and filariasis: a case report”, Journal of Tropical Medicineand Hygiene, vol. 91 (1988), pp. 101−106.
Feachem, R. G., Bradley, D. J., Garelick, H. and Mara, D. D. Sanitation and Disease: Health Aspects ofExcreta and Wastewater Management. (Chichester, John Wiley and Son, 1983).
Hardoy, J. E., Cairncross, S. and Satterthwaite, D. The Poor Die Young: Health and Housing in Third WorldCities (London, Earthscan Publications, 1990).
PEEM, Case Studies on Vector−borne Disease Problems Associated with Rural and Urban WaterManagement (PEEM/11/WP/91.1) (Geneva, World Health Organization Panel of Experts on EnvironmentalManagement for Vector Control, 1991).
Rajagopalan, P. K., and others, “Environmental and water management for mosquito control”, in C. F. Curtis(ed), Appropriate Technology in Vector Control, (Boca Raton, FL., CRC Press Inc, 1990), pp. 121−138.
Singh, J., and Tham, A. S. Case History of Malaria Vector Control through the Application of EnvironmentalManagement in Malaysia (WHO/VBC/88.960) (Geneva, World Health Organization, 1988).
Appraisal
Penning−Rowsell, E. C., and Chatterton, J. B., The Benefits of Flood Alleviation: a Manual of AssessmentTechniques (London, Saxon House, 1977).
Annex I: STORMWATER DRAINAGE DESIGN PROCEDURES
A. INTRODUCTION
This Annex has been prepared to provide guidelines for urban drainage practice to agencies undertaking theplanning of human settlements particularly in developing countries. It is not a regulatory code of practice, noris it intended to be a comprehensive document providing detailed design steps for all possible drainage works.Rules and methods appropriate to various situations are presented, together with background information.Since drainage systems and problems are diverse, and related technology is changing, recommendationsmade herein should not be taken as binding. They should be considered in the light of other information andlocal experience when setting standards or regulations.
Drainage systems in developing countries have generally evolved from natural systems passing throughsignificant changes as land uses change from low−density village settlements to gradually increasing higherdensities of urban populations. The systems in most instances combine the functions of drainage ofstormwater runoff with the disposal of wastewater generated by urban development. The result is a combinedsystem which has not been designed to the more exacting standards of a sewerage system coping withlower−volume dry−weather flows and creating the problems of low velocities of flow in flat−graded channels orpipes with attendant problems of settlement of solids, anaerobic decomposition of the solids, and consequentodours and corrosion.
As the settlements grow and the net incomes of populations increase, the next step in the urban drainageprocess is to divert the wastewater from the drainage system into a separate foul−water sewerage system.
This Annex deals only with the design of the components in a stormwater drainage system and does notaddress the implications in design of a combined system.
43

A.1 Drainage systems
Stormwater drainage systems can be divided into the following parts, which are shown in figure A1:
• Roof and property drainage;
• Street drainage (including both piped and surface flows);
• Trunk or major drainage (consisting of larger conduits, usually open channels located onroads or lands reserved for drainage purposes);
• Receiving waters (a river, lake, groundwater storage or the sea).
A.2 Aims and principles
The main purpose of urban drainage system is to collect and convey stormwater to receiving waters, withsafety and minimal damage. Other objectives are:
• Limitation of adverse impacts of urbanization, such as pollution, erosion and sedimentation;
• Water conservation in areas of low rainfall;
• Integration of large−scale drainage works into overall town planning schemes, with multipleuse of land for drainage, recreation or transportation.
44

Figure A.1. Parts of an urban stormwater drainage system
Some principles which storm drainage planning and design should follow where possible are as follows:
• Analyses of stormwater drainage systems should be based on measured or observed realsystem behaviour. Reasonable or “logical” assumptions are inferior to hard evidence;
• Drainage systems must be planned in relation to the total urban system. Drainage works arebuilt and operated within a social and economic framework. They are greatly influenced bylocal environmental planning processes, and must be integrated with other elements of theurban infrastructure. Professionals in the fields of planning, economics and sociology must beconsulted by engineers in developing the most acceptable solutions;
• Drainage systems should be designed and operated to maximize benefits to the community.The good of the community, expressed through a concern for adequacy, safety and economy,is the basis for determining the type, performance, standard and scale of drainage works.Designers must strike a balance between the objectives of providing a high standard ofperformance and of minimizing costs;
• Designers should be influenced by professional considerations such as ethics,standardization and innovation. While there are benefits in following traditional methods ofdesign and standardized procedures, users should question these and be ready to adoptnew, improved procedures where justified. Reference to these basic principles is helpful inresolving uncertainties arising in design management of the systems.
45

B. PLANNING
B.1 General
Any landform includes a natural drainage system and planning and development of new areas should be inharmony with this system to preserve it in its natural state as far as possible.
All new development proposals should take account of:
(a) Possible flood hazards in the whole system;(b) Possibility of upstream development;(c) Erosion hazards;(d) Runoff reduction as an objective.
B.2 Multiple use
When planning a new urban development, drainage facilities should be coordinated with open space andtransport requirements.
• Open spaces
Significant social benefits at reduced land costs can be achieved by combining open space needs forrecreation with major drainage works such as retarding or detention basins.
• Transport
The design and construction of new roads should be fully integrated with the drainage needs of the urbanarea. This results in better roads, better drainage, and minimization of flood hazards during major storms.Rainfall in excess of the design storm will generally be carried within the confines of the street, giving greaterprotection from flooding to private properties.
Similarly, where major transport routes cross significant drainage lines and flood plains of rivers and streams,design must account for runoff from the ultimate upstream development to protect the road or railway andensure that urban flooding does not occur from inadequate provision of waterway under the embankment.
B.3 Natural channels
Natural water courses should be used for storm runoff waterways whenever possible. The use of naturalwaterways, with their generally slower flows will minimize peak flood flows in downstream areas. Linedchannels and underground pipes are most costly, cause faster flow, increased peak flow rates, and caninduce severe flooding if the downstream drainage system is inadequate. However, increased peak flowscaused by higher and more rapid runoff from urban areas can increase velocities in the natural streams,possibly causing erosion and instability of land. It may be necessary to line the stream banks to reduce thiserosion.
B.4 Transfer of problems
Planning and design of stormwater drainage should not be based on the premise that problems can betransferred from one area to another. Channel modifications which simply transfer problems downstreamshould be avoided unless they are part of a comprehensive upgrading of a particular drainage network. Suchproblems include erosion, sediment deposition, increased flooding, and debris transporting.
46

B.5 Storage and reserves
Stormwater runoff can be stored in detention ponds or retarding basins which reduce the downstreamdrainage capacity required, the amount of land acquisition and the expenditure on downstream works.Reserving major drainage ways from development as part of the urban land−use planning process will allowstorm runoff to spread, so causing minimal damage to private property and be temporarily stored for slowerdischarge downstream. It is important in the planning stages of new developments to set aside areas that canbe potential sites for the storage of stormwater runoff. Development of these areas should be restricted as theoverall costs of drainage could be significantly increased in terms of new construction or reconstruction ofexisting facilities which may become inadequate.
Storage is also an important factor to consider in the design of reclamation areas. Frequently, the area to bereclaimed forms part of the natural storage of flood waters caused by bank overflow of rivers or streams.Removal of this storage capacity from the floodplain can have serious effects on the river hydrology: floodlevels may increase, so causing flooding of areas which would not normally be subject to inundation.
Storage provision is required in the design of polder schemes to buffer the pumping capacity provided and tolimit the installation costs. In planning polder schemes, it is vital to allow sufficient storage volume.
C. DESIGN CRITERIA
C.1 Procedures for design and analysis
Design methods determine the arrangement of a drainage system and the characteristics and sizes of itscomponents. They can involve full analysis or simplified procedures. Generally, the larger, more complex andexpensive the project, the more elaborate the method to be used. Consequences of failure which involves anassessment of the resulting risk, should also influence the choice of method.
The many methods available are based on mathematical models of the physical processes involved. Theseare expressed as a set of calculations performed by hand, programmable calculator or computer program.They include:
(a) Hydrological models, which calculate appropriate peak flowrates, storage volumes or flowhydrographs for system components;
(b) Hydraulic models, which define sizes and other characteristics of components, or analysesystem behaviour to define possible failures;
(c) Other models and calculations concerning water quality, structural adequacy ofcomponents, maintenance requirements and economics.
The rainfall/runoff relationship is a complex one, particularly in an urban environment. It involves applying astatistically−derived model of the infinite variations in rainfall patterns to land catchments with an almostchaotic distribution of features which sometimes impede and sometimes promote the passage of water.
To model such a process with any degree of validity requires the use of computers to deal with the extensivecalculations involved. Until the widespread use of computers only a few years ago it was impractical to carryout routine designs on them, even if the programs that are now in use had been available.
Stormwater drainage design is continually changing. New problems are being encountered; tools andmethods are evolving. Designers should aim to improve design processes, by assessing the performance ofpast designs and modifying the design approach if justified.
47

C.2 Hydrological models
Some of the hydrological models currently in use are shown in table C.1 in increasing order of complexity.Some can be combined in various ways with hydraulic models.
Urban area models are the same in principle as those applied to rural catchments. The rational method, unithydrograph procedures and runoff routing models can all be employed where suitable data are available.There are also specialized urban catchment models.
In most developing countries, there are insufficient data to test and calibrate urban hydrological models on awide scale. Rainfall−runoff models employing statistical design rainfall data should be used for mostapplications.
The rational method is the best−known of these, and has been the model most closely associated with urbandrainage design. It uses the formula:
Q = C.I.A./360
where Q is the design flowrate (m3/s)C is a dimensionless runoff coefficientI is a rainfall intensity (mm/h), corresponding to a particular storm duration and average recurrenceinterval, andA is catchment area (ha)
The rational method has been the most popular design aid for urban drainage in the past and continues to beso today because of its ease of use and most designers are familiar with it. While the rational method has aplace in design, it is important to understand its limitations.
The rational method does not model the rainfall/runoff process and does not simulate the effect of catchmentcharacteristics on the response of the catchment to rainfall. Its real role is as a statistical tool which relates afew simple rainfall and catchment features to an expected peak discharge for that catchment.
The degree to which it works depends on how “average” the catchment is and, of course, on how extensivehas been the data collection and statistical analysis. Unfortunately, there is wide variability of catchment typesand a paucity of gauged catchments.
Of necessity, all drainage designs carried out more than a few years ago were based on some form of therational method. Logically this should have resulted in many underdesigned as well as overdesigned systems.However, recent experience is suggesting a bias towards underdesigned systems.
Table C.1. Hydrological models for urban drainage design and analysis
Model Model type Appropriate uses Degree ofcomplexity
Major variations Examples ofmodels
Empiricalequations
Peak flow Estimation of designflows for very smallcatchments inproperty and roaddrainage.
Very simple Rules for roofdrainage design.Talbot's formula.
Rationalmethod
Peak flow Design of small andmedium streetdrainage systems,and large propertydrainage systems.Only applicable tolimited forms ofanalysis.
Simple tomedium (useof computersoptional)
(i) Accumulation of:flowrates,equivalentimpervious areas,areas of differentland−use types.
(ii) Treatment ofpartial area effect.
Unithydrographs
Hydrograph Design and analysison large urbancatchments, where
Medium(computersoptional)
Synthetic unithydrograph methodssuch as Snyder,
48

data are available. Clark−Johnstone.Time area(isochronal)
Hydrograph Design or analysis ofall sizes of system,including thoseinvolving storages.
Medium(computersrequired)
Linear or nonlinearstorages.
TRRL, ILLUDASILSAX
Storage routing Hydrograph Too complex forroutine design atpresent. Used fordetailed analysis oflarger systems andscientific studies.
Medium tocomplex(computersrequired)
WASSP RORB,RAFTS
Kinematic wave Hydrograph Medium tocomplex(computersrequired)
SWMM KWIM
Physicalprocess or soilmoistureaccountingmodels
Continuoushydrograph
Complex(computersrequired)
SWMM, HSPF
The rational method is a simple tool that attempts to model a complex process. It takes into account thefollowing factors:
(a) Catchment area;
(b) A characteristic storm duration which is indexed to the catchment response time, using thetime of concentration;
(c) Rainfall losses using a runoff coefficient to account for the combined effect of land cover,vegetation and soil type.
The rational method does not explicitly take into account a number of key characteristics such as distributedstorage, rainfall temporal pattern, catchment shape and drainage network. As the method takes overall valuesfor the runoff coefficient and time of concentration, it does not account for variations within the catchment offactors such as slope and land use. Estimates for runoff coefficient are arbitrary, while estimation of time ofconcentration becomes increasingly difficult as the catchment increases in size and complexity.
It is generally accepted that the method gives reasonable results when applied to small areas, when thefollowing is generally applied:
(a) The distributed storage is insignificant;
(b) The critical storm duration will be short (that is, less than 15 to 20 minutes) so that therainfall is reasonably uniform for the duration of the storm;
(c) The total storm duration equals or exceeds the time of concentration and rainfall is uniformover the entire storm, so that catchment shape does not affect the peak discharge;
(d) Reasonable estimates can be made for the runoff coefficient and time of concentration.
More complex models employ sets of equations and procedures requiring use of computers. Appropriate usesfor hydrological models are set out in table C.1 and features of models are described below:
• Models can be divided into those which produce a peak flowrate and those which provide afull hydrograph. The former use rational assumptions based on statistical analysis of data toproduce a “standard” design flowrate or discharge. Although they can be used to analyseindividual pipe capacities, they cannot stimulate actual flow behaviour throughout a network.
• Runoff hydrographs may be generated by time−area procedures (combining a hyetographwith an assumed time−area diagram for each sub−area), by routing the hyetograph through ahypothetical linear or nonlinear reservoir, by kinematic wave routing, or by a soil moisture
49

accounting model. All of these can be calibrated to appropriate data. Mosthydrograph−producing models analyse isolated storm events, but the complex soil moisturestorage models can produce continuous hydrographs spanning years of flows.
• Models suited to urban situations can deal with different degrees of development, usually byaltering the proportions of impervious surfaces and by modelling changes to flow paths andconduits. Urban catchments must be subdivided in greater detail than rural ones, todetermine flowrates at points throughout the catchment, rather than only at the outlet.
• Urban areas may have a higher density of raingauges and pluviometers than rural areas.Although urban catchments are relatively small, spatial and temporal rainfall variability isnevertheless a significant problem when modelling actual storm events. It is desirable to havea dense network of rain gauges for more accurate modelling of the actual rainfall distribution.
• A variety of loss models may be used. In the rational method, all losses are included in therunoff coefficient. More elaborate models use separate initial losses for pervious andimpervious surfaces, and extended losses such as runoff coefficients, constant continuingloss rates or decreasing infiltration curves. Programs capable of continuous simulation usecomplex soil−moisture accounting models.
C.3 Data
Data are required to:
• Describe physical processes associated with drainage systems;
• Develop, calibrate and test models;
• Provide a basis for design of drainage works, such as design rainfall intensities and stormpatterns;
• Monitor system operation, and such aspects as water pollution.
C.3.1 Rainfall data
Measurement of rainfall is made in all developing countries now, but the length of the record, the spacialdistribution of recording stations and the availability of data on rainfall events against time are very oftenlimited in scope or even non−existent. It is necessary, therefore, to search diligently in the central and regionaloffices of the agencies responsible for meteorological records to locate the basic rainfall data upon which tobase the design of drainage systems.
C.3.2 Runoff data
Very little information on the runoff of stormwater is available in urban areas in developing countries. It isusually possible, however, to obtain local information in small catchments by field measurement and gaugingof principal components in the drainage system during storm events provided the designer has sufficient timefor the development of the system design parameters.
Observation and experience by local residents and authorities can provide informal information on floodlevels. These may be of considerable value in the absence of quantitative measurements, particularly wherethey are systematically recorded with rainfall data.
50

C.4 Standards of performance
C.4.1 Introduction
Drainage standards are influenced by many factors, including:
• The level of hydraulic performance required;• Construction and operating costs;• Maintenance requirements;• Safety;• Aesthetics;• Regional planning goals;• Legal and statutory requirements.
They are usually expressed by an average recurrence interval (ARI). These measures determine themagnitude of a design rainfall or runoff event with which the system can cope. Past practice has often beenbased on one level of operation, but it is usually appropriate to design for several performance levels, whichmay include:
• A maintenance requirement (frequent event), related to a short design ARI, perhaps lessthan one year;
• A convenience or nuisance−reduction requirement (infrequent event), possibly a 1− 2− or5−year ARI;
• A flood damage prevention requirement, (severe or rare event), or about a 50− to 100−yearARI;
• A disaster management requirement (extreme event), related to extreme events such asprobable maximum floods.
The first two, possibly three, are relevant to minor drainage, and all but the second to major drains.
Methods for determining appropriate design standards are discussed in section C.4.2. Ideally, standardsshould be set after consideration of all effects arising from construction and operation of drainage works.Benefit−cost analysis usually has limited application, since the benefits of drainage systems are extremelydifficult to measure. An approach in which costs of alternative standards are compared with some measure of“performance” is appropriate in most cases.
Several factors affect the accuracy of estimated flow rates or capacities for given average recurrenceintervals. First, there is inherent variability in rainfall or runoff values obtained from fitted statisticaldistributions. Also, the ARI of the runoff derived from a rainfall−runoff model may differ from that of the rainfallinput, due to differing antecedent conditions and nonlinear effects in the rainfall−runoff process.
C.4.2 Selection of average recurrence intervals
The selection of a suitable design ARI must be made by the designer in the light of economic and financialconsideration of local conditions and requirements. It may be appropriate for designers to vary the standardsapplied to different points in a drainage system, depending on the perceived risks of failure. This is oftenrelated to the land use.
Estimation of costs of alternative designs is possible by hand calculations but is more easily done incomputer−aided design procedures, which allow scope for sensitivity analysis. In general, drainage systemcosts increase by roughly 10 per cent for each doubling of the design ARI, but for particular designs, costs willvary with a range of parameters. For example, the cost implications of adopting a 2 year and 5 year ARI forresidential and commercial/industrial areas for the design of the minor drainage system were investigated inBandung, Indonesia: the analysis indicated that, for a cost increase of 11 per cent, a channel designed withARI of 2 years would reduce the annual flood damage by 56 per cent over a channel designed on a 1−yearARI. To obtain a further 29 per cent reduction in average annual flood damage, a cost increase of 15 per cent
51

would have been required for a 5−year ARI. An analysis of this type must be made in specific situations. Nofirm rule of benefit can be applied.
For major drainage systems the emphasis shifts to prevention of flood damages. Benefits are easier toquantify, and benefit−cost analyses can be conducted. Regardless of the economic outcome, it may benecessary to select a design ARI which conforms to community standards, particularly those pertaining tofloodplain management.
In addition to the ARI used for design, the performance of larger trunk drainage systems should be evaluatedfor extreme events such as probable maximum floods. This is to ensure that systems will fail in a predictableand relatively safe manner in such events, although significant damages should be expected.
Standards may change. When a revised set of standards is introduced, they can be readily applied to newworks after a transition period. However, there may be anomalies in connections to existing works built toolder standards, and many existing drains may have insufficient capacity according to the new criteria. It isclearly not feasible to upgrade existing works in the short−term. The new standards should be taken as anobjective to be pursued in long−term (say 20−year) upgrading programmes.
Levels of service for the design of drainage works in developing countries is frequently based on affordabilitycriteria and financial analysis. The design criteria set out in section 3.5 will, in most instances, be acceptableand will provide a significantly improved quality of living conditions in areas subject to frequent inundation bystorm runoff.
C.5 Basic design criteria
C.5.1 Basis of design
Drainage design will be considered on the basis that two separate and distinct drainage systems exist. Theseare the minor or local drainage systems and the major drainage system.
(a) Minor drainage system
The minor drainage system is that part of the total drainage system which caters for the maximum runoff fromthe initial storm. Included in this system are: street gutters, roadside drainage channels and ditches, culverts,stormwater pipes, open channels, and any other features designed to handle runoff from the initial storm. Allelements of the minor drainage system should be designed for at least the initial storm. The initial storm mayhave a design ARI of 2 years or 5 years depending on the adjacent land use.
(b) Major drainage system
Provision will also be made to provide capacity for the safe discharge of a 20−year return period flood in riversand main canals with catchment areas in excess of 100 hectares. Provision should be made to minimizemajor property damage and prevent loss of life from the runoff expected from the flood of a 100−year returnperiod. The major drainage system can include natural streams, rivers, floodplains, lined channels, majorpipes, major roads.
C.5.2 Calculation of stormwater runoff
Runoff calculations for areas up to 500 hectares should be based on the Modified version of the rationalformula as set out in section C.2. This method takes account of channel storage and gives the designhydrograph if required. Where the catchment area exceeds 500 hectares, the results determined by themodified rational method should be compared with the results obtained from the Snyder synthetic unithydrograph method or a similar hydrograph model. In estimating the design discharge for complex drainagesystems a flood hydrograph shall be prepared as set out in section D.3.
52

C.5.3 Design recurrence intervals
In some circumstances (e.g., where major works are proposed in a highly developed or capitalized area) acost−benefit analysis which takes into account the socio−economic consequences of design floodexceedence may be appropriate in determining the design storm recurrence interval.
Runoff calculations for both initial and major storms are commonly based on design recurrence intervalsshown in table C.2.
Table C.2. Design storm recurrence intervals
Drainage system Return period (years)Minor Residential land use 2
Commercial land use 5Industrial land use 5
Major All main water carriers with > 100 ha catchment. 20All uses checked and assessed for adequacy. 100
C.5.4 Calculation of capacity of stormwater drains
Manning's formulae for open channel flow should be used in calculating the capacity of existing and newstormwater drainage channels. The Colebrook−White equations should be used for the calculation of the flowin pipes.
C.5.5 Drainage reserves
Drainage reserves are necessary to prevent development encroaching on flood prone land and to give accessfor plant and machinery for maintenance and repair operations. Recommended reserve widths are shown intables C.3 and C.4.
Table C.3. Reserve widths for catchments less than 50 ha
Drain Reserve width (m) for drainageareas of:
0.50 ha 5−50 haBetween building lots Top width + 1 m Top width +3 mAlongside roads Top width Top widthWhere downstream development is proposed in an undeveloped catchment, drainage reserve toaccommodate the ultimate 1 in 100 year flood with its natural flood path should be reserved, or alternativelythe reserve widths shown in table C.4 should be provided.
Table C.4. Reserve widths for catchments more than 50 ha
100 year discharge (m3/s) Reserve width (m)30 30
30−100 40100−200 75200−300 90
300 Analyse separately
D. FLOOD ESTIMATION
53

D.1 General
The flood estimation procedures for urban drainage system design recommended in this manual have beenselected from an assessment of the conditions likely to be found in developing countries where limited reliablestatistical data are available and simplicity of application is warranted. The modified rational method has beendeveloped to improve the accuracy of the standard rational method to take account of the variable runoffcoefficients in the catchment and the losses in rainfall and storage in the system. It should be used for areasup to 500 hectares. Areas larger than 500 hectares should be calculated by both the modified rational methodand the Snyders unit hydrograph method; for design, the higher figure is adopted.
D.2 Modified rational method
The formula for peak runoff estimation is:
Q = FCCSIA, (D.1)
where Q = the peak discharge in cubic metres per second of return period T yearsI = the average intensity of rainfall in mm per hour for a duration equal to the time ofconcentration (tc) and return period T yearA = the catchment area in hectaresC = coefficient of runoffCS= storage coefficientF = factor of proportionality (= 0.00278 when A in hectares)
(a) Time of concentration
The time of concentration is the time required for water to flow from the most remote point of the catchment tothe point being investigated. For urban stormwater drains, the time of concentration (tc) consists of the timerequired for runoff to flow over the ground surface to the nearest drain (to) and the time of flow in the drain tothe point under consideration (td):
tc = to + td, (D.2)
Overland flow time
The time for overland flow (to) should be estimated from figure D.1 using appropriate values of length, slopeand runoff coefficient C (see table D.2 and figures D.2 and D.3 for values of C.)
Drain flow time
The time of flow in drains (td) is estimated from the hydraulic properties of the drain. In the case of naturalstreams where the hydraulic properties are difficult to determine the time of flow shall be estimated using thevelocities shown in table D.1.
Table D.1. Approximate steam velocity
Average slope of Stream (percentage) Average velocity(metres/second)
Less than 1 0.41 − 2 0.62 − 4 0.94 − 6 1.26 − 10 1.510 − 15 2.4
(b) Rainfall intensity
For a given storm recurrence interval, the rainfall intensity (I) is the average rate in millimetres per hour ofprecipitation from a storm having a duration equal to the time of concentration (tc). Rainfall intensity − duration
54

− frequency relationships must be derived for the locality.
(c) Runoff coefficient
The runoff coefficient C is difficult to determine precisely and can be interpreted in different ways. Engineeringjudgement is necessary in selecting the appropriate procedure. Coefficients for the modified rational methoddescribed above should be based on ultimate catchment development and weighted where more than oneland use is likely.
A weighted coefficient (Cw) should be calculated where land uses vary or surface characteristics exist in thecatchment:
Figure D.1. Surface flow times (time of concentration) for areas with sheet flow
FORMULA
where t = time of travel over surface in minutesn = roughness coefficients for the surfaceLf = length of flow in metress = Slope of surface in %
EXEMPLA
Length of overland flow 100 mAverage slope of surface 2%Poorly grassed surfaceTime of travel = 15 minutes.
Cw = (A1C1 + A2C2 +..... + AnCn) ÷ A, (D.3)
where A1, A2, An = n areas of relatively uniform land use or surface character comprising the totalarea AC1, C2, Cn = corresponding runoff coefficients obtained from table D.2 (or from figures D.2 andD.3)
Table D.2: Rational method runoff coefficient
55

Land use Runoff coefficient (c)UrbanCentral commercial Industrial 0.90 − 0.95Residential 0.80 − 0.90− Low−density: 20 houses/ha 0.25 − 0.40− Medium−density: 20−60 houses/ha 0.40 − 0.70− High−density: 60−160 houses/ha 0.70 − 0.80Parks and recreation areas 0.20 − 0.30RuralSteep slopes > 20 percent 0.50 − 0.60Undulating slopes > 20 percent 0.40 − 0.50Terraced slopes 0.25 − 0.35Irrigated ricefields and pasture 0.45 − 0.55(d) Storage coefficient
As the catchment areas gets larger the effect of channel storage on the attenuation of the flood wavebecomes more pronounced. To allow for channel storage effect the peak discharge calculated by the basicRational Method formula Q = CIA/360 should be multiplied by a storage coefficient (Cs) to modify the basicformula:
Cs = 2tc/(2tc+td) (D.4)
D.3 Design hydrograph
In the application of the modified rational formula in cases where a design hydrograph is required, the form ofthe hydrograph shown in figure D.4 should be used.
In figure D.3, the peak discharge Qp is found from equation D.1. For detention ponds where the critical stormduration is greater than the time of concentration, then the hydrograph shown in figure D.5 should be used.This situation generally occurs when the average outlet discharge of the pond is less than 50 per cent of thepeak inflow.
56

57

58

Figure D.2. Run−off coefficients for urban catchments
59

60

61

Figure D.3. Run−off coefficients for rural catchments
Figure D.4. Design hydrograph − rainfall duration equals time of concentration
Figure D.5. Design hydrograph − rainfall duration exceeds time of concentration
In figure D.5 the peak discharge Q'p is found by
Q'p = F C C's Ie.A, (D.5)
where
Cs' = 2te/(2te + td), (D.6)
te = the critical storm duration as determined by trial and error
Ie= the average rainfall density for the critical storm duration te and a return period T years.
D.4 Partial areas effect
The modified rational method described in section D.2 is based on the assumption that the peak dischargeresults from a storm of such duration that the whole of the catchment contributes to the runoff at the pointbeing examined. At a point further down the principal drainage route the time of concentration increases andthe intensity of rainfall as determined by the increasing time of concentration decreases. These effects cancause variations in the peak discharge which is calculated on the assumption that the whole area contributes.It is possible that an intense storm of duration less than the total time of concentration but having the sameaverage frequency of recurrence, may produce a greater discharge because the higher intensity had a greatereffect than the smaller contributing area. This situation is known as a partial area effect and should bechecked for under the following situations:
(a) the junction of two main drains;(b) the outlet of a large sub−area with a relatively short time of concentration;
62

(c) the outlet of a small area with a relatively long time of concentration.
A simplified method of determining the peak discharge with a partial area effect is as follows:
(a) Construct the normal hydrograph for the design point as set out in figure D.4 using thelongest time of concentration and the total contributing area;
(b) Construct a hydrograph of the same shape as figure D.4 using the smaller time ofconcentration of the two drains in question and only using the area that would contribute torunoff in this shorter time;
(c) Check whether the new discharge is higher than that derived in (a) above;
(d) The area contributing can be roughly determined by going back the drain a lengthrepresented by the time (td + to) equal to the smaller time of concentration.
E. CHANNEL DESIGN
E.1 General
Open channels can have advantages over piped systems in several ways − for example, lower cost, greatercapacity, multiple use for recreational and aesthetic purposes, and potential for detention storage. There arealso disadvantages which must be considered: for example, increased right of way needs and maintenancecosts, as well as hazards to pedestrians and vehicular traffic. Careful planning and design for new works areneeded to minimize the disadvantages and increase the benefits. The ideal channel is a natural one becausevelocities are usually low, resulting in longer times of concentration and, hence, lower downstream peaks.Channel storage is also available to reduce peak flows and maintenance costs are generally lower because ofthe natural stability of the channel. Lined channels should be chosen when right of way or velocity of flowconsiderations dictate the requirements, or increased capacity is required within a given right of way.
E.2 Flow computation
Use Manning's formula for uniform flow calculations:
Q = (AR2/3s2)/n, (E.1)
where Q = flow, m3/secA = area of flow section m2
R = hydraulic radius, ms = slope of channel, m/mn = Manning's roughness coefficient (given in table E.1)
Table E.1: Recommended Values for Manning's Coefficient of Roughness 'n'
Type of channel and description nConcrete lined 0.015Stone pitching 0.025Unlined/formed 0.035 − 0.045Natural streams 0.040 − 0.050
E.3 Lined channels
Channel linings usually consist of concrete, stone pitching or a combination of the two. The decision on liningmaterials used principally relies on local custom and the local availability and cost of the materials. The side
63

slopes will generally range from vertical to one to one and should be designed as retaining walls. Thedesirable minimum velocity is 0.75 − 1.0 metres per second for self−cleansing conditions and the maximum is3.0 metres per second for reasons of safety.
E.4 Vegetated channels
Where there are no restrictions on right−of−way width and land slope is compatible, vegetated channels cannormally be constructed at less cost. The invert of the channel should be lined for low flows designed with acapacity of 3−5 per cent of the design flow.
Erosion control measures will normally be necessary. Cut−off walls at regular intervals will help to maintain astable grade and cross section. Design criteria are given in table E.2.
Table E.2. Design criteria for vegetated channels
Major storm Initial stormVelocity not more than 2 m/s not less than 0.75 m/sDepth not more than 1.5 m not less than 0.3 mSide slopes not steeper than 1 in 3 not steeper than 1 in 3Freeboard not less than 0.3 m N/AManning's 'n' 0.035 − 0.045 0.035 − 0.045
E.5 Natural channels
Natural channels in steep areas tend to have erodible banks and increased erosion can be expected withurbanization. Increased erosion may also occur in flatter sections as a result of increased urban discharge.Some modifications may be necessary to create more stable conditions and to ensure that the maximumvelocity is kept below 2 metres per second wherever possible. Criteria and techniques which should be usedin designing or checking the capacity of natural channels include the following:
(a) Channel and overbank capacity should be adequate for the major storm;
(b) Channel velocity shall be subcritical at any section;
(c) Water surface limits should be defined so that the flood plain can be zoned whereappropriate, to prevent urban development.
E.6 Unkerbed streets
To ensure satisfactory drainage to adjacent open channels, formation and sealing should be taken to the endof main drains and shoulders should be graded to the edge of minor drains. If the road shoulder does notpermit direct runoff to the drain, spaced inlets should be provided. Such inlets should be no wider than half ametre and be spaced at half the interval required for entry pits under kerbed gutter conditions.
E.7 Design calculations
The form in table E.3 could be adopted for general usage for systematically preparing the computations forthe design of open channel systems in urban areas.
64

F. DRAINAGE DESIGN FOR URBAN STREETS AND PIPELINES
F.1 General
Design criteria for the collection and transport of runoff water on public streets is based on a reasonablefrequency of interference to traffic when kerbs and gutters are constructed on each side of the street. That is,some portion of the road surface will be inundated once during the initial design storm return period. Duringthis period, lesser storms may also cause some lesser degree of inundation. This is making use of the streetas part of the urban drainage system but should not conflict with its primary function of traffic movement.
F.2 Gutter capacity
For streets with formed kerbs, the theoretical gutter capacity Qg (m3/s) can be calculated by using themodified Manning's formula for flow in a shallow triangular channel.
Qg = 0.375z/ns½d8/3, (F.1)
where z = the reciprocal of the crown slope, m/mn = Manning's coefficient of roughnesss = gutter slope, m/md = depth of flow in gutter, m
Typical values of n are:
Concrete 0.012Hotmix 0.014Flush seal 0.018Stone pitchers 0.025If the gutter is a lined or unlined drain or swale, an open channel equation such as Manning's formula(equation E.1) can be applied.
The gutter should be designed so that the width of flow on the road pavement does not exceed 2 m in widthduring the initial storm. Figure F.1 will assist in the design of gutters.
65

Table E.3. Stormwater design calculation sheet for channels
66

Figure F.1. Design chart for flow in triangular channels
F.3 Drainage inlets
A stormwater drainage inlet is an opening into a drainage system for the entrance of stormwater runoff. It isimportant that inlets be properly designed, constructed and maintained so that the drainage system operatesat its full capacity. Sufficient openings shall be provided to limit the gutter flow width to 2 metres. There arevarious types of inlet but it is recommended that, where possible, the kerb opening inlet be used as it is themost dependable type. Figure F.2 illustrates typical details of one suitable type of kerb inlet.
(a) Design
67

Inlets may be installed either on a continuous grade or in sag points, i.e. a low point in the road grade. Theinlets can be gratings or kerb opening inlets. A kerb opening inlet is an opening in a kerb through which thegutter flow passes to the drain. The gutter may be depressed or undepressed in the area of the grate or kerbopening. On continuous grades of less than 5 per cent slope, a depressed opening is recommended. Thedrawing in figure F.2 shows a depressed opening. While the gutter slope exceeds 5 per cent it isrecommended that deflectors in the depressed gutter be used. For a sag condition the gutter should be thedepressed type. For an underground drainage system, side entry pits should be used with precast concretecovers for ease of access for maintenance. Time of flow in the gutter can be estimated from Figure F.3.
For sag pits, the following relationships can be used:
(i) For a grating
Qi= 1.66 Pd1.5 up to about 0.12 m of ponding (d < 0.12), (F.2)
or
Qi = 0.67 A (2gd)0.5 over 0.43 m of ponding (d > 0.43), (F.3)
where Qi is the inlet flowrate, m3/sd is the average depth of ponding, mP is the perimeter length of the pit, excluding the section against the kerb, m (bars can bedisregarded)A is the clear opening of the grate, m2, (i.e., total area minus area of bars)g is acceleration due to gravity, 9.8 m/s2
For depths between 0.12 and 0.43 m, the situation is indefinite, but generally the first equation isrecommended.
(ii) For an undepressed kerb inlet
For ponding up to about 1.4 times the height of the inlet, h (d = 1.4h)
Qi = 1.66 L d1.5, (F.4)
or for ponding greater than 1.4 h
Qi = 0.67A [2g(d − h/2)]1.5
where Qi is the inlet flowrate, m3/sd is the average depth of ponding, mL is the inlet width, mA is the clear area of the opening, m2
g is acceleration due to gravity, m2/s
68

69

70

Figure F.2. Typical inlet−side entry for stormwater drain
Figure F.3. Design chart for flow times in street channels
71

General relationships of this type are not available for pits on grade. Capacities of these can be changedsignificantly by small differences in dimensions and by features such as depressions and types of grate.Capacities are also influenced by characteristics of the adjacent roadway, such as cross−slope androughness.
The capacity of depressed side entry pits is shown on figure F.4. Reduction factors should be applied to thetheoretical capacity of inlets to compensate for effects which decrease capacity through debris plugging,pavement overlaying and variations from design assumptions. The allowed capacity shall be determined byapplying the appropriate reduction from table F.1.
Table F.1. Reduction factors to apply to inlets
Condition Inlet type Percentage of theoretical capacity allowedSag Kerb opening 80Continuous grade Kerb opening 80Continuous grade Deflector 75(b) Spacing of inlets
Figure F.4 shows the capacity of 1 m long depressed side entry pits for different longitudinal grades andshoulder crossfalls. In determining the required spacing of inlets, the flow from figure F.4 should be multipliedby the reduction factor in table F.1 to compare with the channel capacity determined from figure F.1.
F.4 Pipe flow
For calculation of pipe size, the assumption is made that the pipes will flow full during the design flood. Allmethods of design require the estimation of friction losses using some formula. For full flows in circular pipes,the Darcy−Weisbach equation is more accurate:
hL =(f L/D)(V2/2g), (F.6)
where hL = the head loss, mf = a dimensionless friction factorL = pipe length, mD = pipe diameter, mV = velocity of flow, m/sg = acceleration due to gravity, m/s2
The friction factor f is obtained from a suitable equation based on the Colebrook−White equation.
72

Figure F.4. Design chart for capacity of side−entry inlets
NOTES (1) Length of side entry pit opening “L” = 1.0(2) Shoulder crosfall S = 0.05, 0.025, 0.010 m/m(3) % Capture = 95%(4) For other values of “L” or “Sc” use logarithmic interpolation(5) S = 0.025 − 0.010 includes all crosfall within this range
Pipe sizes can be determined from figure F.5 which is based on the Colebrook−White equations. Theseequations are considered to give the most satisfactory results and the equations for smooth turbulence andrough turbulence respectively are given below.
73

1/(f0.5) = 2 log (R/f) − 0.8, (F.7)
1/(f0.5) = 2 log (D/2ks) + 1.74, (F.8)
where f = Darcy Weisbach friction factorR = Reynolds numberD = pipe diameter, mks = roughness factors
For the Colebrook−White equations, the values of the linear measure of roughness (ks) can be found fromtable F.2.
It is recommended that design wall roughness should reflect conditions well into the service life of the pipe,somewhere between the “good” and “poor” values given in table F.2. Thus for concrete pipes, a value of ks =0.3 mm is suitable. For analysis of existing pipes, ks values appropriate to their condition should be used.
Figure F.5(a). Design chart for flow in circular pipes flowing full (ks = 0.6 mm)
74

75

Figure F.5(b). Design chart for flow in circular pipes flowing full (ks = 0.1 mm)
Table F.2. Recommended concrete roughness values (ks) for Colebrook−White equations
ks (mm) forcondition
Classification Good Normal PoorConcrete Class 4. Monolithic construction against oiled steel forms, with no surfaceirregularities, smooth−surfaced precast pipes with no shoulders or depressions at thejoints.
0.06 0.15 0.60
Class 4a. Smooth−surfaced precast pipe−lines in units of 2 m or over, with spigot andsocket joints, or ogee joints pointed internally.
− 0.15 0.3
Class 3. Monolithic construction against steel forms, wet−mix or spun precast pipes, orwith cement or asphalt coating.
0.3 0.6 1.5
Class 2. Monolithic construction against rough forms, rough texture precast pipes orcement gun surface (for very coarse textures, take ks equal to size of aggregate inevidence).
0.6 1.5 −
Class 1. Precast pipes with mortar squeeze at joints. − 3 6Smooth trowelled surfaces 0.3 0.6 1.5Fibre−reinforced cement pipes 0.15 0.3Glass−reinforced plastic 0.003 0.010 0.015
F.5 Pipe system design
The calculation process for a pipe network consists of the following basic steps:
(i) Layout of trial pipe network with approximate positions of inlets
(ii) Design and determine sub−catchment areas and time of flow (tc) to each inlet (figure D.1,F.3 or F.5)
(iii) Estimate coefficient of runoff (C) from table F.2
(iv) Determine rainfall intensity for inlet design from IDF curves
(v) Calculate flow to site of inlet by conventional rational formula Q = CIA/360
(vi) Determine capacity of both gutter and inlet to accommodate this flow and adjust inletlocation and type if necessary
(vii) Determine total catchment area, critical time of concentration, and estimate design flowfor the point under consideration
(viii) Measure length and slope of pipe receiving this flow and obtain pipe size from figure F.5or published tables
(ix) Obtain velocity of flow and time of flow to add to tc for next calculation
Table F.3 could be used for the calculations required in the design of piped drainage systems.
76

Table F.3. Stormwater design calculation sheet for pipelines
When determining pipe invert levels, losses in side entry pits and other junctions should be consideredparticularly in steeper areas.
G. PUMPING CAPACITIES AND STORAGE REQUIREMENTS IN POLDERS
G.1 Principles of drainage in a polder
A polder is an area with ground levels which are so low in relation to the nearest river or the sea that freedrainage is impossible. The area is then enclosed by three banks or dykes which prevent water from enteringfrom the outside, and discharge of the rainfall on the area inside the levee banks is effected by pumping.
Because practically all the rain which falls on the area has to be pumped out again (with the exception of asmall percentage which evaporates), the polder area should be limited in size.
The drainage system inside a polder consists of:
• Minor drainage system;
• The main collector drains situated in the lowest parts of the polder and heading towards thepumping station;
• A pumping station with storage.
If there is no storage, the pumping station would have to be able to pump out immediately whatever discharge
77

comes down the main collector drain. The peak discharge, however, only occurs during a short period, andimportant reductions in cost of the installed pumping capacity can be obtained by providing a storagereservoir.
G.2 Pumping capacity versus storage requirement
A large capacity in the pumping station will make it unnecessary to have a large storage reservoir. A smallpumping capacity will require a large reservoir from which the water can slowly be pumped out.
Somewhere between these two extremes lies the optimum capacity of the storage. This optimum isdetermined by economic considerations: for example, where the land required for a reservoir is scarce andcostly, a large pumping capacity will be cheaper; where land is relatively cheap, a large reservoir and smallpumps may be chosen.
Additional considerations which may influence the economic evaluation are those concerning the risk ofinundations. On the one hand, if the pumps are too small the reservoir may not be empty before the nextstorm. However, if the reservoir is too small there will be no reserves should the pumps fail to work.
The usual method of establishing the optimum combination of pumping capacity and storage requirement isshown in figure G.1. In the figure the following mass curves or lines of accumulated volumes of water in mmon the total polder area are shown:
(a) The mass curve of rainfall of the chosen average return interval (ARI) (for example therainfall with an ARI of 20 years);
(b) The cumulated discharge arriving at the pumping station. This line is established bydetermining the run−off hydrographs of each sub−catchment area, using run−off coefficientsappropriate for each case, and by combining all these hydrographs into a compositehydrograph for the whole polder. The shape of the polder area determines the time ofconcentration and the shift of line “b” in relation to line “a”. The discharges arriving at thepumping station can be expressed as a water depth over the full polder area;
78
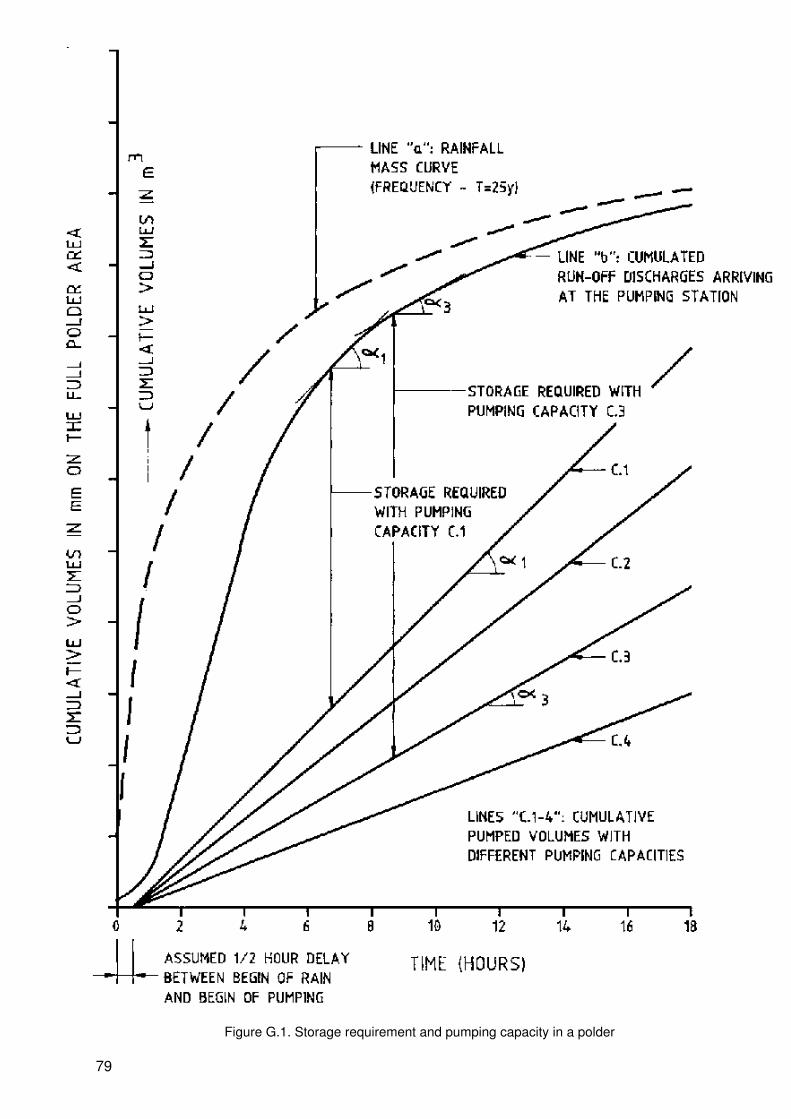
Figure G.1. Storage requirement and pumping capacity in a polder
79

Lines C1, C2, C3 etc. are the lines of accumulated pumped volumes of water (again expressed as a waterdepth over the full polder area) obtained with different pumping capacities.
From the graphical presentation in figure G.1 the required storage capacity can be determined by drawing atangent to the line “b” parallel to one of the “C” lines. This will indicate the storage capacity required inconjunction with the pumping capacity represented by that “C” line. This required storage capacity will have tobe available in the storage reservoir between the lowest water level that can be obtained by pumping and thehighest water level permissible in the reservoir in relation to the surrounding land levels.
The various pumping capacities and storage requirements can then be economically selected. Usually theeconomic pumping capacity will be somewhere between 10 and 20 l/s per ha.
The pumping station will have to be carefully designed to be able to discharge water straight from theincoming main drain as well as from the reservoir. Also, the efficiency of the pumps should not differ too muchbetween pumping at low or at high water levels in the reservoir. Archimedean screw−pumps are often mostsuitable for this purpose.
The reservoir should be excavated deep enough to prevent plant growth even at low water stages. In the dryseason the water level maintained in the reservoir for this purpose can be higher than the low−water levelwhich is needed in the wet season for the required storage capacity. Care should be taken to prevent debrisfrom being thrown into the storage. Floating debris carried downstream in the main drain should be preventedas much as possible from being carried into the storage reservoir by the construction of suitable screens onthe inlets to the reservoir.
80