stormwater management report - … groot & benson pty ltd alexandra drive development – water...
TRANSCRIPT

STORMWATER MANAGEMENT
REPORT
Nambucca Gardens Estate Proposed Development
January 2012
de Groot & Benson Pty Ltd

STORMWATER MANAGEMENT
REPORT
Nambucca Gardens Estate Proposed Development
January 2012
de Groot & Benson Pty Ltd
ACN 052 300 571 Ph 02 6652 1700 Fax 02 6652 7418 Email: [email protected]
236 Harbour DrivePO Box 1908
Coffs Harbour NSW 2450

de Groot & Benson Pty Ltd
Alexandra Drive Development – Water Quality Management Report
Job No: 91111 – File name : 91111 StormWater Management Amnd D.docx
Page 124 January 2012
TABLE OF CONTENTS
TABLE OF CONTENTS ................................................................................................................. 1
1 INTRODUCTION .................................................................................................................. 4
2 BACKGROUND ..................................................................................................................... 4
3 SITE DESCRIPTION ................................................................................................................ 5
3.1 LOCATION ......................................................................................................................... 5 3.2 CLIMATE ............................................................................................................................. 5 3.3 CATCHMENT TOPOGRAPHY AND HYDROLOGY ............................................................ 6 3.3.1 GROUND WATER ........................................................................................................... 6
.................................................................................................................................................... 7
4 HYDROLOGY & FLOODING ................................................................................................ 8
4.1 OVERALL CATCHMENT ...................................................................................................... 8 4.2 DESIGN FLOWS .................................................................................................................. 9 4.3 HYDRAULIC MODELLING ................................................................................................. 9 4.4 FLOOD LEVEL ESTIMATION (INC GLOBAL WARMING AND CLIMATE CHANGE) ............ 9 4.4.1 FLOOD MODELLING ...................................................................................................... 9 4.4.2 CLIMATE CHANGE EFFECTS .......................................................................................... 10 4.4.3 RESULTS ........................................................................................................................ 11 4.5 PROBABLE MAXIMUM FLOOD (PMF) .............................................................................. 12 4.6 COUNCIL’S FLOOD PLAIN RISK MANAGEMENT PLAN .................................................. 12
5 WATER QUALITY ................................................................................................................ 14
5.1 REQUIREMENT ................................................................................................................. 14 5.2 RELEVANT LEGISLATION AND POLICIES ........................................................................ 14 5.2.1 NORTH COAST REGIONAL ENVIRONMENTAL PLAN .................................................. 15 5.2.2 SEPP 71 – COASTAL PROTECTION ................................................................................ 15 5.2.3 COFFS HARBOUR CITY COUNCIL URBAN STORMWATER MANAGEMENT PLAN ...... 15 5.2.4 NAMBUCCA RIVER ESTUARY MANAGEMENT PLAN .................................................... 17 5.3 COMPONENTS OF STORMWATER TREATMENT SYSTEMS .............................................. 19 5.3.1 GROSS POLLUTANT TRAPS .......................................................................................... 20 5.3.2 VEGETATED SWALES ..................................................................................................... 20 5.3.3 CONSTRUCTED WETLANDS ......................................................................................... 20 5.3.4 BIO – RETENTION SWALES ........................................................................................... 21 5.3.5 RAIN WATER TANKS ..................................................................................................... 21 5.3.6 BUFFER / FILTER STRIPS ................................................................................................. 21 5.4 STORMWATER TREATMENT SYSTEM DESIGN AND PERFORMANCE .............................. 22 5.5 EFFECT ON GROUNDWATER .......................................................................................... 22 5.6 MUSIC MODELLING ........................................................................................................ 22 5.6.1 MODELLING ASSUMPTIONS ........................................................................................ 23 5.6.2 PRE – DEVELOPMENT MODELLING .............................................................................. 25 5.6.3 POST – DEVELOPMENT MODELLING ........................................................................... 25 5.6.4 OPTION 2 ...................................................................................................................... 26 5.7 OPTION 2 BREAKDOWN ................................................................................................. 27

de Groot & Benson Pty Ltd
Alexandra Drive Development – Water Quality Management Report
Job No: 91111 – File name : 91111 StormWater Management Amnd D.docx
Page 224 January 2012
5.8 CATCHMENT 1, 2, 6, 7 ...................................................................................................... 27 5.9 CATCHMENT 3, 4, 5 ......................................................................................................... 28 5.10 MAINTENANCE .............................................................................................................. 28
6 CONCLUSIONS ................................................................................................................... 29
7 REFERENCES ........................................................................................................................ 30
APPENDIX A - MUSIC DATA .................................................................................................... 31
APPENDIX B - CONCEPT DESIGN ............................................................................................ 37
de Groot & Benson Pty Ltd
Alexandra Drive Development – Water Quality Management Report
Job No: 91111 – File name : 91111 StormWater Management Amnd D.docx
Page 324 January 2012
DOCUMENT CONTROL STATUS
Issue Rev. Issued To Qty Date Reviewed Approved
Draft 2 Geoff Smyth 1 15/3/10 RDG RDG
Final Geoff Smith 1 October 2010 RDG RDG
Printed: 24 January, 2012 3:36 PM Last Saved: 24 January 2012 3:34 PM File Name: S:\91\91111 Faringdon Way\WP\91111 StormWater Management Amnd
D.docx Project Manager: Rob de Groot Name of Organisation: Nambucca Gardens Estate Pty Ltd Name of Project: WATER QUALITY MANAGEMENT REPORT Name of Document: STORM WATER QUALITY Job Number: 91111

de Groot & Benson Pty Ltd
Alexandra Drive Development – Water Quality Management Report
Job No: 91111 – File name : 91111 StormWater Management Amnd D.docx
Page 424 January 2012
1 INTRODUCTION This report examines all stormwater aspects relating to the development including:
Flooding and global warming impacts water quality stormwater runoff volumes
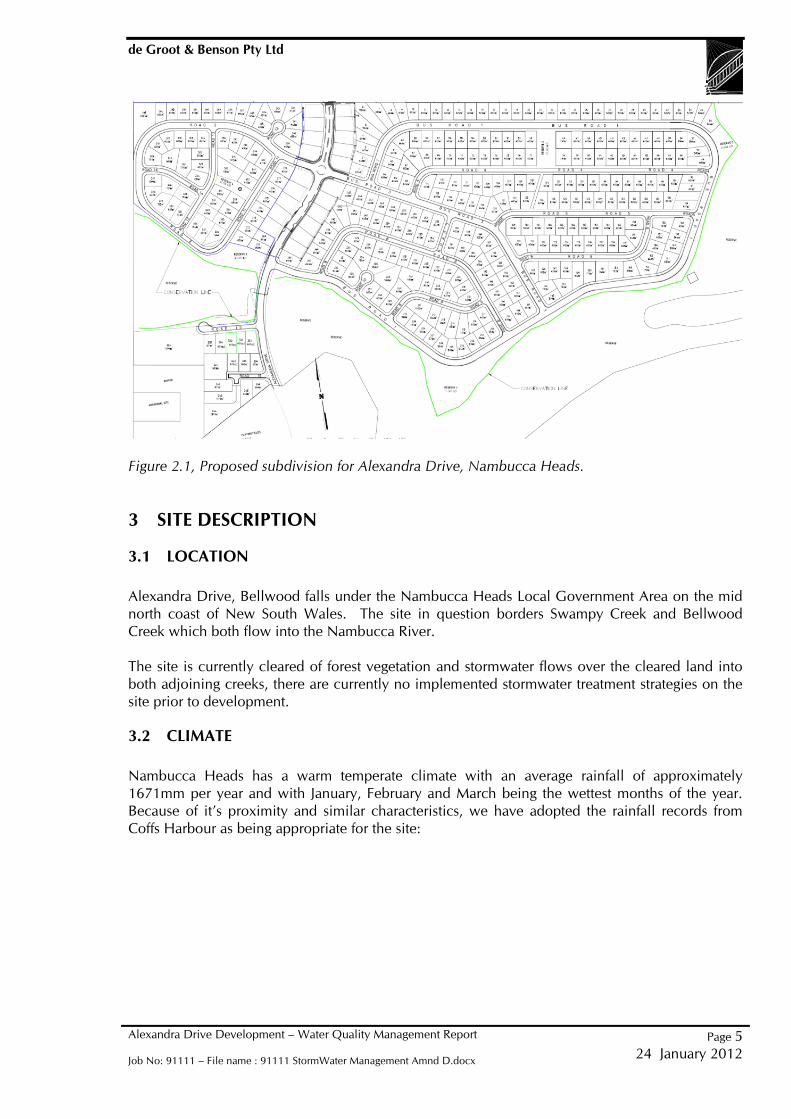
2 BACKGROUND De Groot and Benson were asked by Nambucca Gardens Estate Pty Ltd to prepare a report to investigate the possible options for stormwater treatment that satisfied local and state guidelines, the investigation encompassed the proposed subdivision at Alexander Drive, Bellwood, and Nambucca Heads. The current request by the client is for a subdivision consisting of approximately 346 lots Figure 2.1. There is currently a minor existing development involving 20 lots, these lots currently have no stormwater management or treatment train system and discharge water over the pre-existing cleared land the then flows into both Swampy, Bellwood Creek and the Nambucca River. This development is subject to SEPP 71 legislation which prevents the discharge of untreated stormwater into a coastal creek. This document therefore seeks to offer options that adhere to this legislation and achieve the goals set by local and state government for stormwater quality.
de Groot & Benson Pty Ltd
Alexandra Drive Development – Water Quality Management Report
Job No: 91111 – File name : 91111 StormWater Management Amnd D.docx
Page 524 January 2012
Figure 2.1, Proposed subdivision for Alexandra Drive, Nambucca Heads.
3 SITE DESCRIPTION
3.1 LOCATION Alexandra Drive, Bellwood falls under the Nambucca Heads Local Government Area on the mid north coast of New South Wales. The site in question borders Swampy Creek and Bellwood Creek which both flow into the Nambucca River. The site is currently cleared of forest vegetation and stormwater flows over the cleared land into both adjoining creeks, there are currently no implemented stormwater treatment strategies on the site prior to development.
3.2 CLIMATE Nambucca Heads has a warm temperate climate with an average rainfall of approximately 1671mm per year and with January, February and March being the wettest months of the year. Because of it’s proximity and similar characteristics, we have adopted the rainfall records from Coffs Harbour as being appropriate for the site:

de Groot & Benson Pty Ltd
Alexandra Drive Development – Water Quality Management Report
Job No: 91111 – File name : 91111 StormWater Management Amnd D.docx
Page 624 January 2012
Figure 3.2, Average rainfall data for Coffs Harbour region, error bars indicate variance in rainfall possible in any month or year. The MUSIC model provides rainfall and evaporation data sets. The closest centre available for modelling is Coffs Harbour and this has been used for modelling water quality.
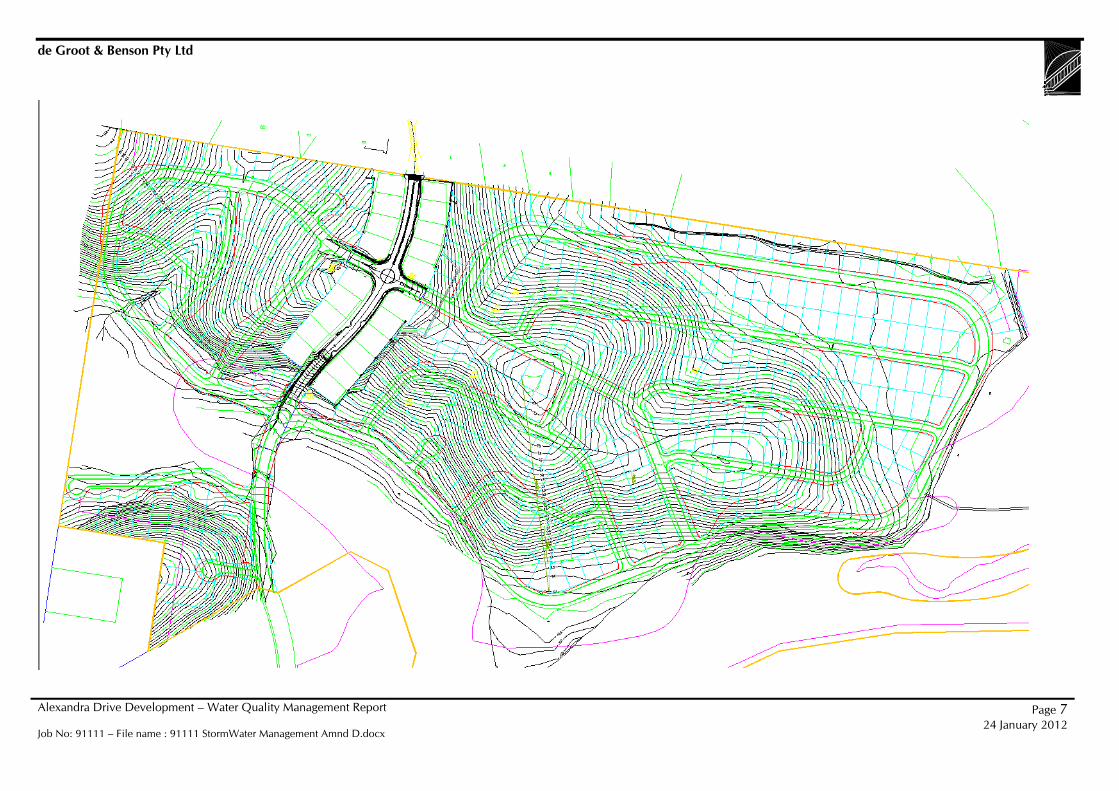
3.3 CATCHMENT TOPOGRAPHY AND HYDROLOGY The topography of proposed site is shown on Figure 3.3
3.3.1 GROUND WATER The borehole samples obtained from the site revealed no signs of ground water or aquifers. The ground water table is therefore well below any zone that could be affected.
Average rainfall data for Nambucca / Coffs Harbour
-50
0
50
100
150
200
1 2 3 4 5 6 7 8 9 10 11 12
Month
Rainfall (mm)
Series2 Poly. (Series2)
de Groot & Benson Pty Ltd
Alexandra Drive Development – Water Quality Management Report
Job No: 91111 – File name : 91111 StormWater Management Amnd D.docx
Page 7 24 January 2012
Figure 3.3, Topographic map of land to be developed.

de Groot & Benson Pty Ltd
Alexandra Drive Development – Water Quality Management Report Job No: 91111 – File name : 91111 StormWater Management Amnd D.docx
Page 824 January 2012
4 HYDROLOGY & FLOODING
4.1 OVERALL CATCHMENT The catchment for both the Bellwood and swampy creek extends north to the Pacific Highway and west to the ridge containing the Old Coast Road. The catchment areas are shown bellow in figure 4.1. The total catchment area is 447.5 ha of land comprising of a small amount of developed land and mainly forest and cleared pastoral land. The site comprises approx 54 ha of this.
Figure 4.1 Catchment Areas around Bellwood and swampy creek. The areas of the sub-catchments used are shown below in table 4.1.
Sub-catchment Area (ha)
1 52
2 28.1
3 62.1
4 48.7
5 16.1
6 34.7
7 92.1
8 26.3
9 66.4
10 21
Total 447.5
1
2
34
5
6
7 8
91

de Groot & Benson Pty Ltd
Alexandra Drive Development – Water Quality Management Report Job No: 91111 – File name : 91111 StormWater Management Amnd D.docx
Page 924 January 2012
4.2 DESIGN FLOWS Pre developmental flows were calculated using the computer model DRAINS and by using the impervious factor contained in the model, for pre development this factor was obviously 0 for areas of the development that had only vegetation and was calculated at 50% for post development. Flows have been estimated using the DRAINS program which analyses flows in stormwater systems and open channels. Prior to development flow was calculated at being 35.2 m³/s while after development flow was calculated at being 36.6 m³/s, this constituted an increase of 3.9%. Single nodes were used in drains to estimate the flow with the post development node containing a higher percentage of impervious ground corresponding to that which will occur as a result of development. The time of concentration for the impervious and pervious areas was calculated using the probabilistic rational method. Calculations performed are as follows.
Time of Concentration: tc = 0.76 * A^(.38) in hours tc = 0.76 * 4.47^.38 = 1.343 hours = 81 minutes
4.3 HYDRAULIC MODELLING Flows prior to development and post development have been modelled to ascertain whether the development of the site will generate flows that significantly exceed pre-development levels. The need for this is to show whether or not the development of Alexandra drive will increase flooding downstream and for residences to the south of Swampy Creek. Modelling was performed using the HEC-RAS computer programme, with sections being taken along the creek with the first being taken at the Pacific highway Bridge (the narrowest section of the creek system). HEC-RAS is a model from the United States Army Corp of Engineers that analyses creek flows and levels. Cross section of the existing Bellwood and Swampy creek systems are imported to the model, flows previously calculated are also admitted. Figure 4.2 shows the schematic of the overall model. In addition, Nambucca Shire Council commissioned the Nambucca Heads Flood Study which was undertaken in 2011 by Sinclair Knight Merz. The results of this study have been used for comparison purposes for this development.
4.4 FLOOD LEVEL ESTIMATION (INC GLOBAL WARMING AND CLIMATE CHANGE)
4.4.1 FLOOD MODELLING Flood level estimate was carried out using the HEC-RAS Software. Cross-Sections were determined from the available aerial photography.

de Groot & Benson Pty Ltd
Alexandra Drive Development – Water Quality Management Report Job No: 91111 – File name : 91111 StormWater Management Amnd D.docx
Page 1024 January 2012
The results of the modelling for the pre- and post scenarios is shown in Section 4.4.3
4.4.2 CLIMATE CHANGE EFFECTS The effects of global warming and climate change have been taken into account and modelled using HEC-RAS to ascertain the effects of rising sea levels and increase rainfall in ARI events. NSW Governments Department of Environment and Climate Change paper Floodplain Risk Management Guideline was referred to in particular Annexure 17b ‘Practical Consideration of Climate Change’, this report recommended guidelines for modelling and analysis, these were:
0.91m rise in sea levels as adopted by the Nambucca Shire Council
ARI increases of 10, 20 and 30% to be modelled The results of the modelling for the pre- and post scenarios is shown in Section 4.4.3
Figure 4.2, Cross-sections taken through swampy and Bellwood creek up to the bridge at the Pacific Highway.
Bellwood Creek
Swampy Creek
Development Site
de Groot & Benson Pty Ltd
Alexandra Drive Development – Water Quality Management Report Job No: 91111 – File name : 91111 StormWater Management Amnd D.docx
Page 1124 January 2012
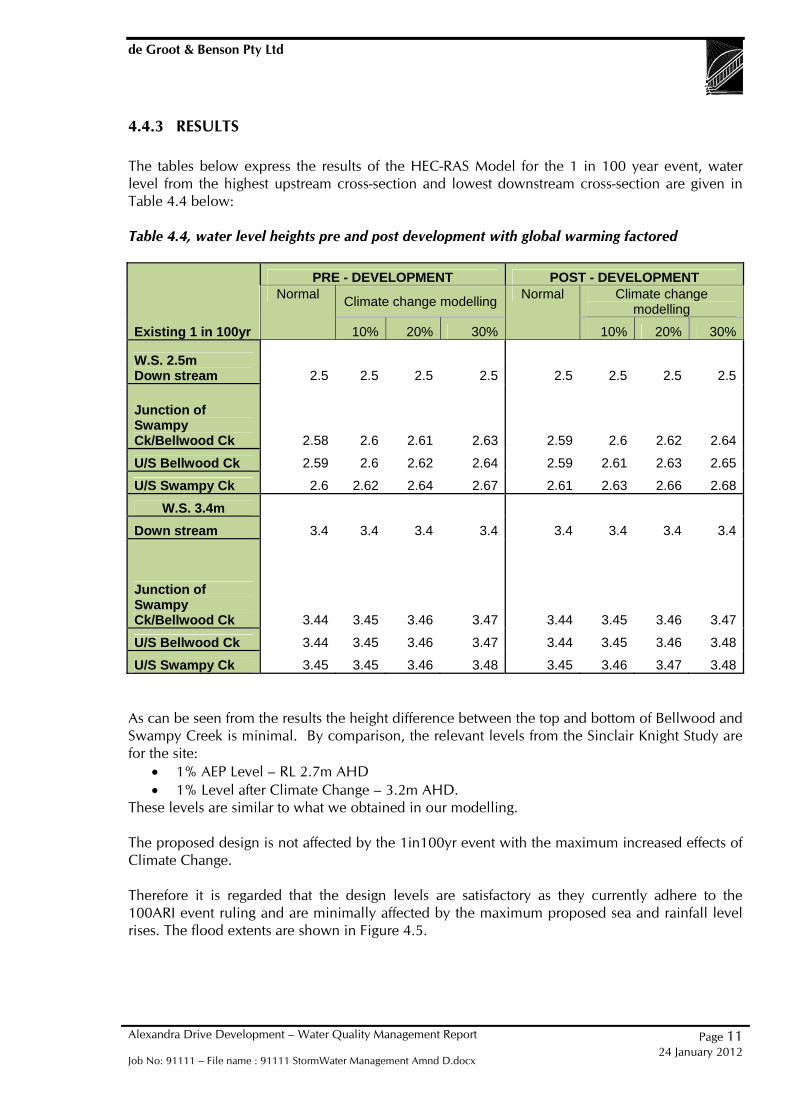
4.4.3 RESULTS The tables below express the results of the HEC-RAS Model for the 1 in 100 year event, water level from the highest upstream cross-section and lowest downstream cross-section are given in Table 4.4 below: Table 4.4, water level heights pre and post development with global warming factored
Existing 1 in 100yr
PRE - DEVELOPMENT POST - DEVELOPMENT Normal
Climate change modelling Normal Climate change
modelling
10% 20% 30% 10% 20% 30%
W.S. 2.5m Down stream
2.5 2.5 2.5 2.5 2.5 2.5 2.5 2.5
Junction of Swampy Ck/Bellwood Ck 2.58 2.6 2.61 2.63 2.59 2.6 2.62 2.64
U/S Bellwood Ck 2.59 2.6 2.62 2.64 2.59 2.61 2.63 2.65
U/S Swampy Ck 2.6 2.62 2.64 2.67 2.61 2.63 2.66 2.68
W.S. 3.4m
Down stream 3.4 3.4 3.4 3.4 3.4 3.4 3.4 3.4
Junction of Swampy Ck/Bellwood Ck 3.44 3.45 3.46 3.47 3.44 3.45 3.46 3.47
U/S Bellwood Ck 3.44 3.45 3.46 3.47 3.44 3.45 3.46 3.48
U/S Swampy Ck 3.45 3.45 3.46 3.48 3.45 3.46 3.47 3.48 As can be seen from the results the height difference between the top and bottom of Bellwood and Swampy Creek is minimal. By comparison, the relevant levels from the Sinclair Knight Study are for the site:
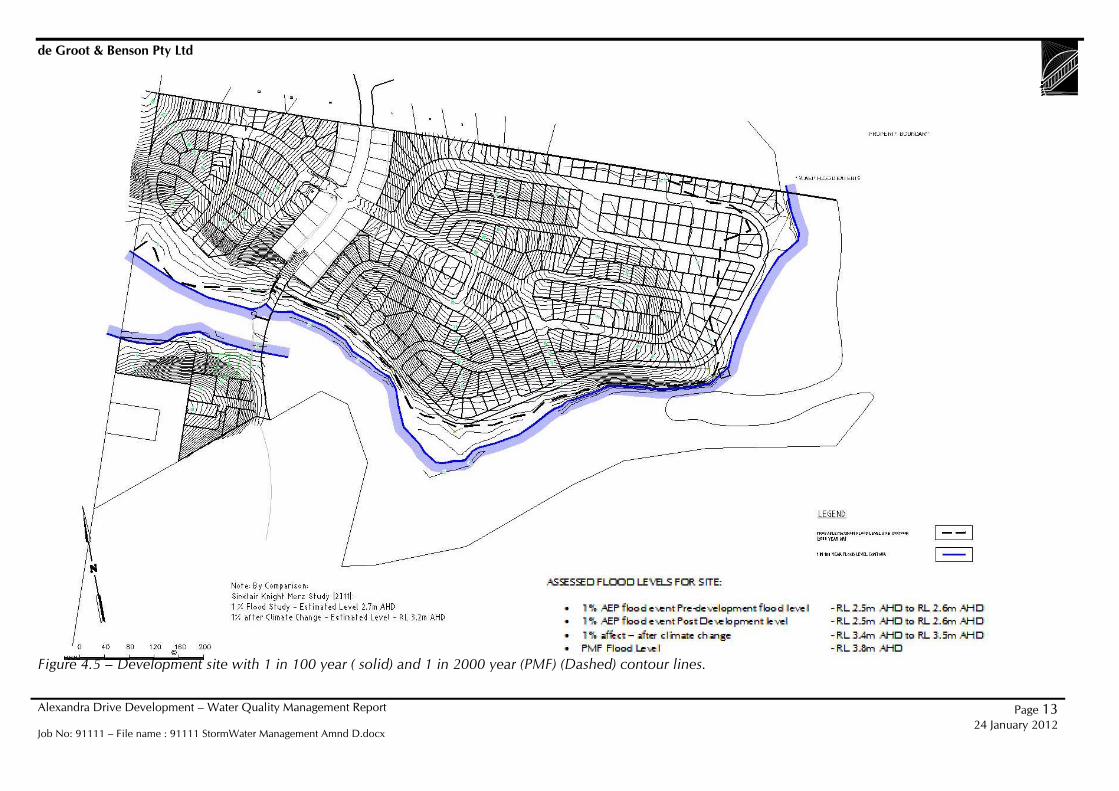
1% AEP Level – RL 2.7m AHD 1% Level after Climate Change – 3.2m AHD.
These levels are similar to what we obtained in our modelling. The proposed design is not affected by the 1in100yr event with the maximum increased effects of Climate Change. Therefore it is regarded that the design levels are satisfactory as they currently adhere to the 100ARI event ruling and are minimally affected by the maximum proposed sea and rainfall level rises. The flood extents are shown in Figure 4.5.

de Groot & Benson Pty Ltd
Alexandra Drive Development – Water Quality Management Report Job No: 91111 – File name : 91111 StormWater Management Amnd D.docx
Page 1224 January 2012
4.5 PROBABLE MAXIMUM FLOOD (PMF) In order to determine the impact of the probable maximum flood level on the development site, an analysis of the PMR modelling done by Sinclair-Knight-Merz and submitted as part of the RTA Environmental Assessment of The Warrell creek to Urunga Pacific Highway Upgrade Project was undertaken. Figures 2.2 and A1-3 (Working paper 5) of the RTA Environmental Assessment were used in order to estimate the PMF in the region of the development site. Mean terrain heights (AHD) and 2000 year ARI flood level inundation diagrams developed in the RTA study were used in order to assess the PMF level height along the northern, southern and eastern boundaries of the development zone. An average of the flood levels along these boundaries was then taken in order to determine a PMF level representative of the development area as a whole. The results of the analysis concluded that a PMF level at RL 3.8m was expected at the development site. The RL 3.8m PMF Level contour is show below in Figure 4.5. In the “Nambucca River Flood Study” by Sinclair Knight Study in 2011, they estimated the PMF level for the site to be RL 7.5m AHD. This level resulted from a 4m flood gradient in final 1km of the river flow. Whilst a PMF flood is a very rare event, we are highly doubtful that the RL 7.5m level is accurate, as we feel there will be significant breakout at the ocean that will result in substantial lowering of this level.
4.6 COUNCIL’S FLOOD PLAIN RISK MANAGEMENT PLAN The flooding assessment was reviewed in light of Nambucca Shire Council’s “Floodplain Risk Management Plan” dated February 2001 and adopted in February 2005. This plan developed a set of measures for minimising flood risk in for the Nambucca River. We comment on how the proposed development complies with the relevant measures proposed in the Management Plan: (please note that section references relate to the Management plan: Measure Development Response 3.1.1 Planning and Development Controls
All proposed development is above the 1%AEP flood level as defined by Council and determined in this report3
3.1.2 House Raising Not applicable 3.1.3 Floodway Management All works proposed are above the 1% AEP flood level and do
not impact on existing floodways 3.1.4 Flood Proofing Not Applicable 3.1.5 Macksville Not applicable 3.1.6 Data compilation – non tidal areas
Not applicable
3.1.7 and 3.1.8 Flood Study – non tidal areas
Not applicable
Further, in Section 3.2 of the Management Plan Council identified various Response Modifications strategies. These all relate to tasks to be undertaken by Council and do not specifically propose any actions or requirements on developers or on the planning of new residential developments.
de Groot & Benson Pty Ltd
Alexandra Drive Development – Water Quality Management Report Job No: 91111 – File name : 91111 StormWater Management Amnd D.docx
Page 13 24 January 2012
Figure 4.5 – Development site with 1 in 100 year ( solid) and 1 in 2000 year (PMF) (Dashed) contour lines.

de Groot & Benson Pty Ltd
Alexandra Drive Development – Water Quality Management Report Job No: 91111 – File name : 91111 StormWater Management Amnd D.docx
Page 1424 January 2012
5 WATER QUALITY
5.1 REQUIREMENT In order to limit the impact of water quality on the Swampy Creek, Bellwood Creek and Nambucca River from the proposed development, a stormwater quality management strategy has been developed for the proposed 356 lots located off Alexandra drive, Bellwood, Nambucca Heads. The selection of treatment options was performed with reference to the Water Sensitive Urban Design Engineering Guidelines for Stormwater by Brisbane City Council, Urban Stormwater Management Plan by Coffs Harbour City Council and Water Sensitive Urban Design (WSUD) principles. These sought to minimise the delivery of polluted stormwater to the creeks affected. Modelling of stormwater quality and quantity was undertaken using the stormwater support modelling tool MUSIC version 3.0.1 developed by the CRC eWater (formally the CRC for catchment hydrology). Rainfall data and evapo-transportation data over 6 minute intervals from Coffs Harbour were imported into the program to ascertain the most accurate results to this area. The pre-developed site was modelled using an agricultural source node with 100% pervious land; this was done as the land has already been cleared for sometime and exhibits no physical signs of forested area on the site. These results were used as a benchmark as to the water quality needed to be achieved before the release of stormwater into the subsequent creeks and Nambucca River. Post development was modelled using an urban source node with 50% pervious and impervious properties. The MUSIC modelling indicates that treatment train to be used (grass swales, household water tanks) is satisfactory under all local, state and national guidelines on stormwater in particular those guidelines stated in both Nambucca and Coffs Harbour stormwater management plans:
To implement ‘best practice’ stormwater management techniques. To maintain natural drainage patterns wherever possible. To ensure no net increase in the average annual load of pollutants entering the stormwater
system and receiving waters above that occurring in pre existing conditions, and; To improve water quality wherever possible.
The system of treatment proposed for the development is widely used throughout Australia, is in keeping with the design of the development, poses no unique hazards that would not otherwise exist, is cost effective and requires minimal maintenance.
5.2 RELEVANT LEGISLATION AND POLICIES The treatment train system detailed later in this report has been designed to comply with all relevant legislation and policies. The proposed site falls under the coastal zone as defined in the State Government Planning Policy (SEPP 71). The compliance and outcomes of this legislation as well as local government policy is set out below. In addition, this report references:
NSW Government Flood Plain Development manual Practical Considerations of Climate Change (DECC, Oct 2007) Managing urban Stormwater: Soils & Conservation (The Blue Book) – Landcom March
2004 Nambucca River Estuary Management Plan
de Groot & Benson Pty Ltd
Alexandra Drive Development – Water Quality Management Report Job No: 91111 – File name : 91111 StormWater Management Amnd D.docx
Page 1524 January 2012
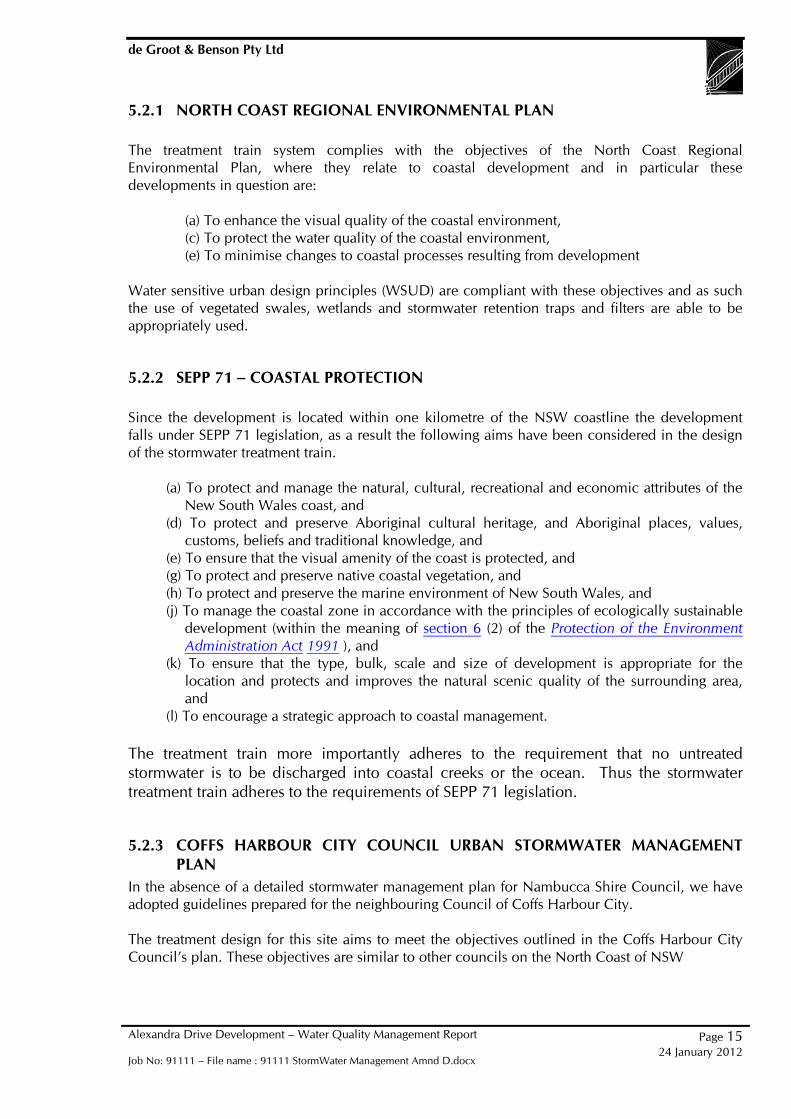
5.2.1 NORTH COAST REGIONAL ENVIRONMENTAL PLAN The treatment train system complies with the objectives of the North Coast Regional Environmental Plan, where they relate to coastal development and in particular these developments in question are:
(a) To enhance the visual quality of the coastal environment, (c) To protect the water quality of the coastal environment, (e) To minimise changes to coastal processes resulting from development
Water sensitive urban design principles (WSUD) are compliant with these objectives and as such the use of vegetated swales, wetlands and stormwater retention traps and filters are able to be appropriately used.
5.2.2 SEPP 71 – COASTAL PROTECTION Since the development is located within one kilometre of the NSW coastline the development falls under SEPP 71 legislation, as a result the following aims have been considered in the design of the stormwater treatment train.
(a) To protect and manage the natural, cultural, recreational and economic attributes of the New South Wales coast, and
(d) To protect and preserve Aboriginal cultural heritage, and Aboriginal places, values, customs, beliefs and traditional knowledge, and
(e) To ensure that the visual amenity of the coast is protected, and (g) To protect and preserve native coastal vegetation, and (h) To protect and preserve the marine environment of New South Wales, and (j) To manage the coastal zone in accordance with the principles of ecologically sustainable
development (within the meaning of section 6 (2) of the Protection of the Environment Administration Act 1991 ), and
(k) To ensure that the type, bulk, scale and size of development is appropriate for the location and protects and improves the natural scenic quality of the surrounding area, and
(l) To encourage a strategic approach to coastal management. The treatment train more importantly adheres to the requirement that no untreated stormwater is to be discharged into coastal creeks or the ocean. Thus the stormwater treatment train adheres to the requirements of SEPP 71 legislation.
5.2.3 COFFS HARBOUR CITY COUNCIL URBAN STORMWATER MANAGEMENT PLAN
In the absence of a detailed stormwater management plan for Nambucca Shire Council, we have adopted guidelines prepared for the neighbouring Council of Coffs Harbour City. The treatment design for this site aims to meet the objectives outlined in the Coffs Harbour City Council’s plan. These objectives are similar to other councils on the North Coast of NSW
de Groot & Benson Pty Ltd
Alexandra Drive Development – Water Quality Management Report Job No: 91111 – File name : 91111 StormWater Management Amnd D.docx
Page 1624 January 2012
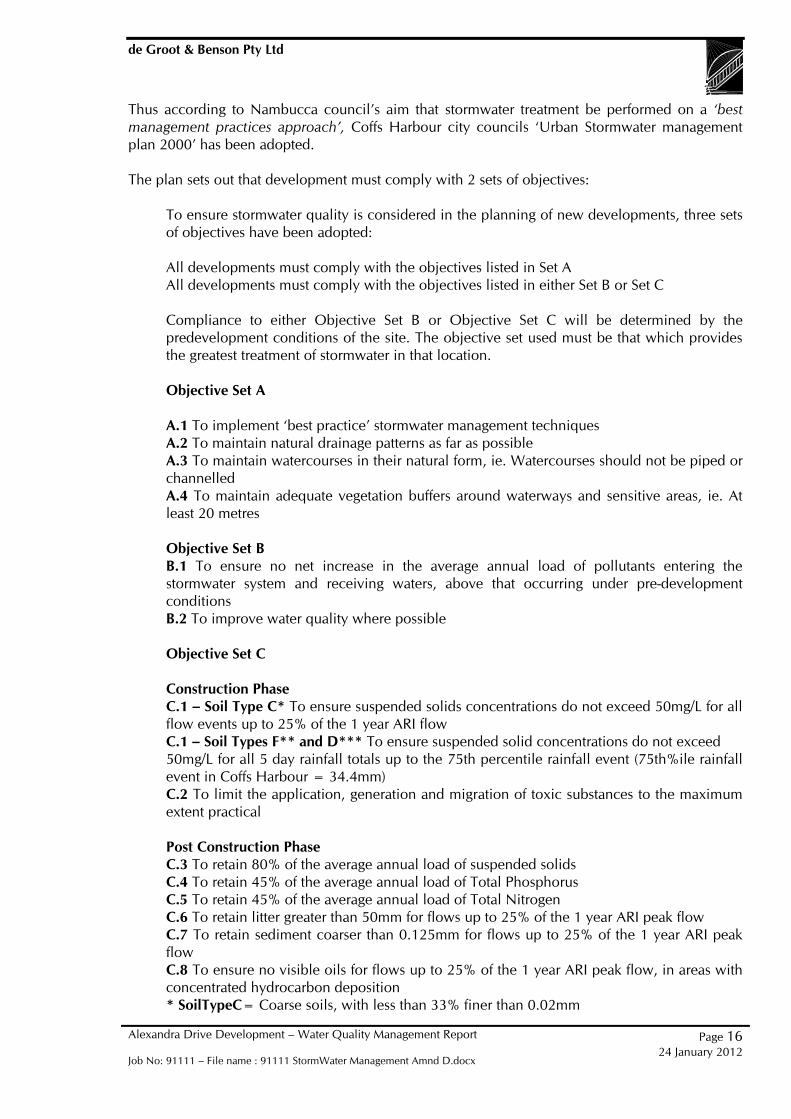
Thus according to Nambucca council’s aim that stormwater treatment be performed on a ‘best management practices approach’, Coffs Harbour city councils ‘Urban Stormwater management plan 2000’ has been adopted. The plan sets out that development must comply with 2 sets of objectives:
To ensure stormwater quality is considered in the planning of new developments, three sets of objectives have been adopted: All developments must comply with the objectives listed in Set A All developments must comply with the objectives listed in either Set B or Set C Compliance to either Objective Set B or Objective Set C will be determined by the predevelopment conditions of the site. The objective set used must be that which provides the greatest treatment of stormwater in that location. Objective Set A A.1 To implement ‘best practice’ stormwater management techniques A.2 To maintain natural drainage patterns as far as possible A.3 To maintain watercourses in their natural form, ie. Watercourses should not be piped or channelled A.4 To maintain adequate vegetation buffers around waterways and sensitive areas, ie. At least 20 metres Objective Set B B.1 To ensure no net increase in the average annual load of pollutants entering the stormwater system and receiving waters, above that occurring under pre-development conditions B.2 To improve water quality where possible Objective Set C Construction Phase C.1 – Soil Type C* To ensure suspended solids concentrations do not exceed 50mg/L for all flow events up to 25% of the 1 year ARI flow C.1 – Soil Types F** and D*** To ensure suspended solid concentrations do not exceed 50mg/L for all 5 day rainfall totals up to the 75th percentile rainfall event (75th%ile rainfall event in Coffs Harbour = 34.4mm) C.2 To limit the application, generation and migration of toxic substances to the maximum extent practical Post Construction Phase C.3 To retain 80% of the average annual load of suspended solids C.4 To retain 45% of the average annual load of Total Phosphorus C.5 To retain 45% of the average annual load of Total Nitrogen C.6 To retain litter greater than 50mm for flows up to 25% of the 1 year ARI peak flow C.7 To retain sediment coarser than 0.125mm for flows up to 25% of the 1 year ARI peak flow C.8 To ensure no visible oils for flows up to 25% of the 1 year ARI peak flow, in areas with concentrated hydrocarbon deposition * SoilTypeC= Coarse soils, with less than 33% finer than 0.02mm
de Groot & Benson Pty Ltd
Alexandra Drive Development – Water Quality Management Report Job No: 91111 – File name : 91111 StormWater Management Amnd D.docx
Page 1724 January 2012
** Soil Type F = Fine soils, with more than 33% finer than 0.02mm ***Soil Type D = Dispersible soils, with more than 33% finer than 0.02mm and more than 10% dispersible materials For further details, consult the Department of Housing’s Managing Urban Stormwater: Soils and Construction.
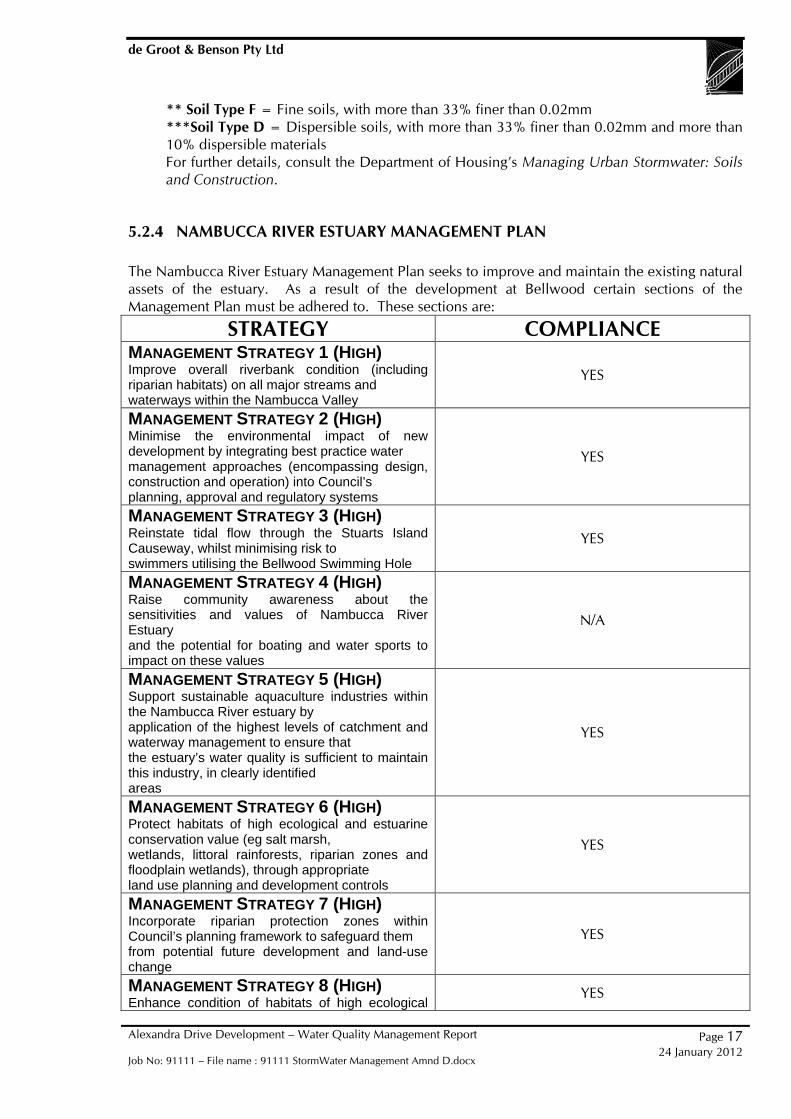
5.2.4 NAMBUCCA RIVER ESTUARY MANAGEMENT PLAN The Nambucca River Estuary Management Plan seeks to improve and maintain the existing natural assets of the estuary. As a result of the development at Bellwood certain sections of the Management Plan must be adhered to. These sections are:
STRATEGY COMPLIANCE MANAGEMENT STRATEGY 1 (HIGH) Improve overall riverbank condition (including riparian habitats) on all major streams and waterways within the Nambucca Valley
YES
MANAGEMENT STRATEGY 2 (HIGH) Minimise the environmental impact of new development by integrating best practice water management approaches (encompassing design, construction and operation) into Council’s planning, approval and regulatory systems
YES
MANAGEMENT STRATEGY 3 (HIGH) Reinstate tidal flow through the Stuarts Island Causeway, whilst minimising risk to swimmers utilising the Bellwood Swimming Hole
YES
MANAGEMENT STRATEGY 4 (HIGH) Raise community awareness about the sensitivities and values of Nambucca River Estuary and the potential for boating and water sports to impact on these values
N/A
MANAGEMENT STRATEGY 5 (HIGH) Support sustainable aquaculture industries within the Nambucca River estuary by application of the highest levels of catchment and waterway management to ensure that the estuary’s water quality is sufficient to maintain this industry, in clearly identified areas
YES
MANAGEMENT STRATEGY 6 (HIGH) Protect habitats of high ecological and estuarine conservation value (eg salt marsh, wetlands, littoral rainforests, riparian zones and floodplain wetlands), through appropriate land use planning and development controls
YES
MANAGEMENT STRATEGY 7 (HIGH) Incorporate riparian protection zones within Council’s planning framework to safeguard them from potential future development and land-use change
YES
MANAGEMENT STRATEGY 8 (HIGH) Enhance condition of habitats of high ecological
YES
de Groot & Benson Pty Ltd
Alexandra Drive Development – Water Quality Management Report Job No: 91111 – File name : 91111 StormWater Management Amnd D.docx
Page 1824 January 2012
and/or conservation value e.g., salt marsh, wetlands, littoral rainforests, riparian zone and floodplain wetlands
MANAGEMENT STRATEGY 9 (HIGH) Raise community awareness of coastal/estuary processes to increase the level of understanding of shoaling mechanisms and associated implications as well as the consequences of intervention measures
N/A
MANAGEMENT STRATEGY 11 (MEDIUM) Rationalise and improve access points, boat ramps and associated facilities to protect existing estuarine values and to provide quality public foreshore access to the estuary
N/A
MANAGEMENT STRATEGY 12 (MEDIUM) Integrate and improve upon existing water quality monitoring activities occurring within the estuary to provide a better indicator of overall estuarine health, whilst addressing all existing license and operational requirements
N/A
MANAGEMENT STRATEGY 13 (MEDIUM) Improve swimmer safety in the lower estuary by a variety of means including improved signage / safety equipment, provision of new swimming areas and/or improving the safety aspects of existing swimming areas
N/A
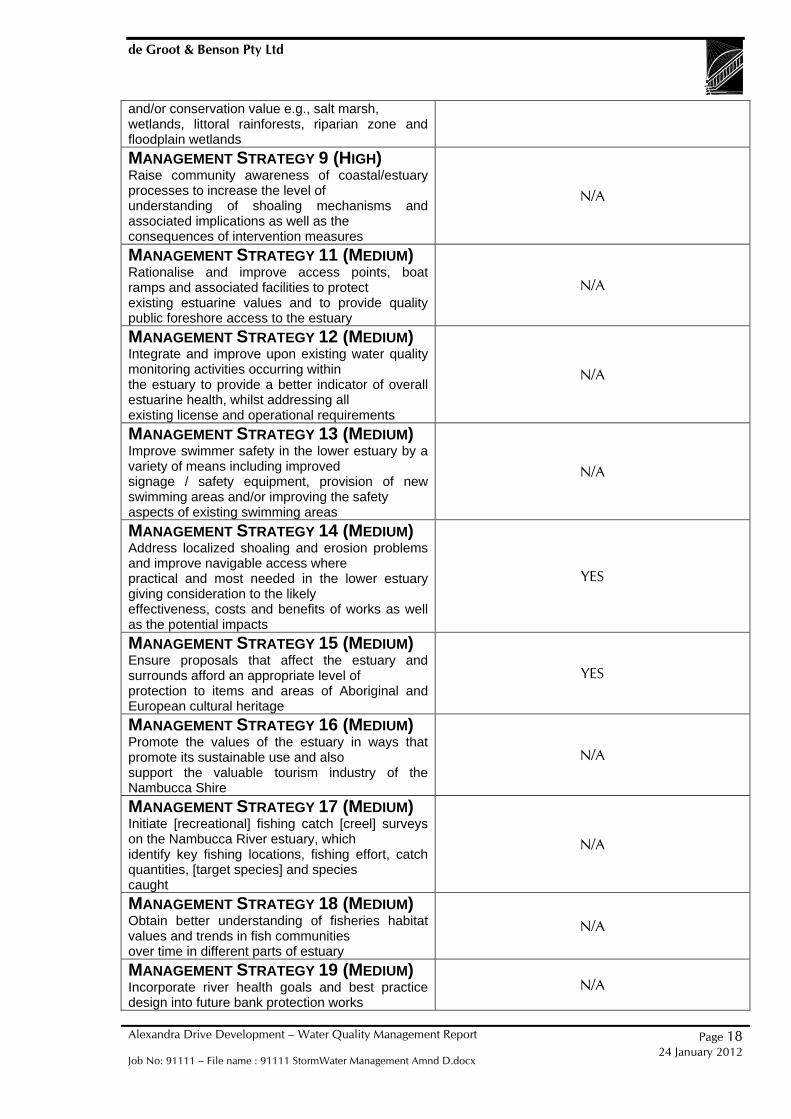
MANAGEMENT STRATEGY 14 (MEDIUM) Address localized shoaling and erosion problems and improve navigable access where practical and most needed in the lower estuary giving consideration to the likely effectiveness, costs and benefits of works as well as the potential impacts
YES
MANAGEMENT STRATEGY 15 (MEDIUM) Ensure proposals that affect the estuary and surrounds afford an appropriate level of protection to items and areas of Aboriginal and European cultural heritage
YES
MANAGEMENT STRATEGY 16 (MEDIUM) Promote the values of the estuary in ways that promote its sustainable use and also support the valuable tourism industry of the Nambucca Shire
N/A
MANAGEMENT STRATEGY 17 (MEDIUM) Initiate [recreational] fishing catch [creel] surveys on the Nambucca River estuary, which identify key fishing locations, fishing effort, catch quantities, [target species] and species caught
N/A
MANAGEMENT STRATEGY 18 (MEDIUM) Obtain better understanding of fisheries habitat values and trends in fish communities over time in different parts of estuary
N/A
MANAGEMENT STRATEGY 19 (MEDIUM) Incorporate river health goals and best practice design into future bank protection works
N/A
de Groot & Benson Pty Ltd
Alexandra Drive Development – Water Quality Management Report Job No: 91111 – File name : 91111 StormWater Management Amnd D.docx
Page 1924 January 2012
(e.g. construction of future foreshore retaining walls) through an integrated and streamlined approvals process
MANAGEMENT STRATEGY 20 (LOW) Ensure climate change and sea level rise implications are incorporated into the current LEP and forward planning
YES
MANAGEMENT STRATEGY 21 (LOW) Protect habitats of moderate or local ecological value (eg areas of native regrowth)
YES
MANAGEMENT STRATEGY 22 (LOW) Enhance condition of habitats of moderate or local ecological value
YES
MANAGEMENT STRATEGY 23 (LOW) Ensure adequate representation of all key local stakeholder groups is maintained on the Estuary and Coastline Management Committee (ECMC) and that stakeholder input is encouraged in the implementation of the Plan
N/A
MANAGEMENT STRATEGY 24 (LOW) Ensure all foreshore structures are appropriately licenced, designed and maintained to protect foreshore amenity and access
N/A
MANAGEMENT STRATEGY 25 (LOW) Improve recognition of Crown Land areas in the lower estuary, particular those around existing facilities that may promote greater connectivity and tourist related usage of the area
N/A
5.3 COMPONENTS OF STORMWATER TREATMENT SYSTEMS The above aims provide a basis for best management practice in treating stormwater; the development adheres to the aims presented in Set A and Set B as these objectives provide the best treatment of stormwater as outlined above. Therefore the stormwater leaving the site and entering Swampy Creek, and Bellwood Creek contains pollutant levels less than that prior to development. As part of the design of the treatment train system, current ‘best practice’ techniques, stormwater treatment measures and legislation were reviewed and incorporated into the modelling process. The treatment train most appropriate for the site was evaluated on this and the criteria that the most cost effective, low maintenance option was chosen while still satisfying all guidelines of water quality. Stormwater treatment trains are can consist of a variety of treatment options in series to be able to obtain the desired water quality and outlet flow. As a result stormwater can be treated at three different stages; the source, transport within the catchment and through technology treatment systems. A brief list and description of the processes considered follows; a layout of the possible positions of treatment options is located in Appendix A.
de Groot & Benson Pty Ltd
Alexandra Drive Development – Water Quality Management Report Job No: 91111 – File name : 91111 StormWater Management Amnd D.docx
Page 2024 January 2012
5.3.1 GROSS POLLUTANT TRAPS Gross Pollutant Traps (GPT’s) are designed for the effective removal of litter and solids such as rubbish, debris and organic matter down to as small as half a millimetre. GPT’s can be placed anywhere in the treatment train but is understandable that they would be used first as large size pollutants can limit the effectiveness of treatments further on in the train. Pollutant traps can also be used at the end of the treatment train to remove any scattered debris from entering the creek system. Significant maintenance is required with GPT’s as they require regular maintenance, cleaning and replacement of filters if fine filters are used. GPT’s without a wet sump are seen as a better option as they are easier to maintain and reduce the risk of poor water quality within the GPT. There are a wide range of GPT’s commercially available and they need to be individually evaluated so the most effective option for the system is used. The development being proposed is of low density and in a rural landscape therefore the presence of rubbish and unnatural debris is regarded as being uncommon as no commercial activity is anticipated, hence there being less need for GPT’s in the proposed system.
5.3.2 VEGETATED SWALES Swales are either grassed and or vegetation lined channels which carry storm stormwater to a depository. Swales are a cost effective system that can be used to replace pipe networking and are able to treat stormwater when grades are kept below 5%. Swales are able to remove particulates, enhance infiltration, slow the runoff of stormwater and when used correctly can add to the urban décor. Swales also offer a habitat for flora and fauna and if designed correctly will not promote mosquito breeding grounds. If vegetation is to be used special care has to be taken that pooling of water is avoided Swales have been proposed in the treatment train as the main treatment technique as the ratio of swale area to catchment area enables the swales to be highly effective in removing pollutants. It has been advised that the swales be primarily lined with grass at the base of the swale with options for vegetation over 250mm to be placed on the sides of the swale. Vegetation if used incorrectly can promote damming and downstream erosion. Furthermore, problems have occurred with water ingress into pavement sub grades causing road failures.
5.3.3 CONSTRUCTED WETLANDS Wetlands are an effective way of removing pollutants from stormwater, promoting wildlife habitats and improving overall water quality in the ecosystem. By using chemical, biological and physical means wetlands can easily remove suspended solids, phosphorus and other soluble pollutants and associate bound material. Wetlands have not been proposed in the treatment train due to the maintenance required and the fact that further treatment of the water by this stage is not necessary as the quality of the water is already of sufficient quality that it passes all local and state regulations.
de Groot & Benson Pty Ltd
Alexandra Drive Development – Water Quality Management Report Job No: 91111 – File name : 91111 StormWater Management Amnd D.docx
Page 2124 January 2012
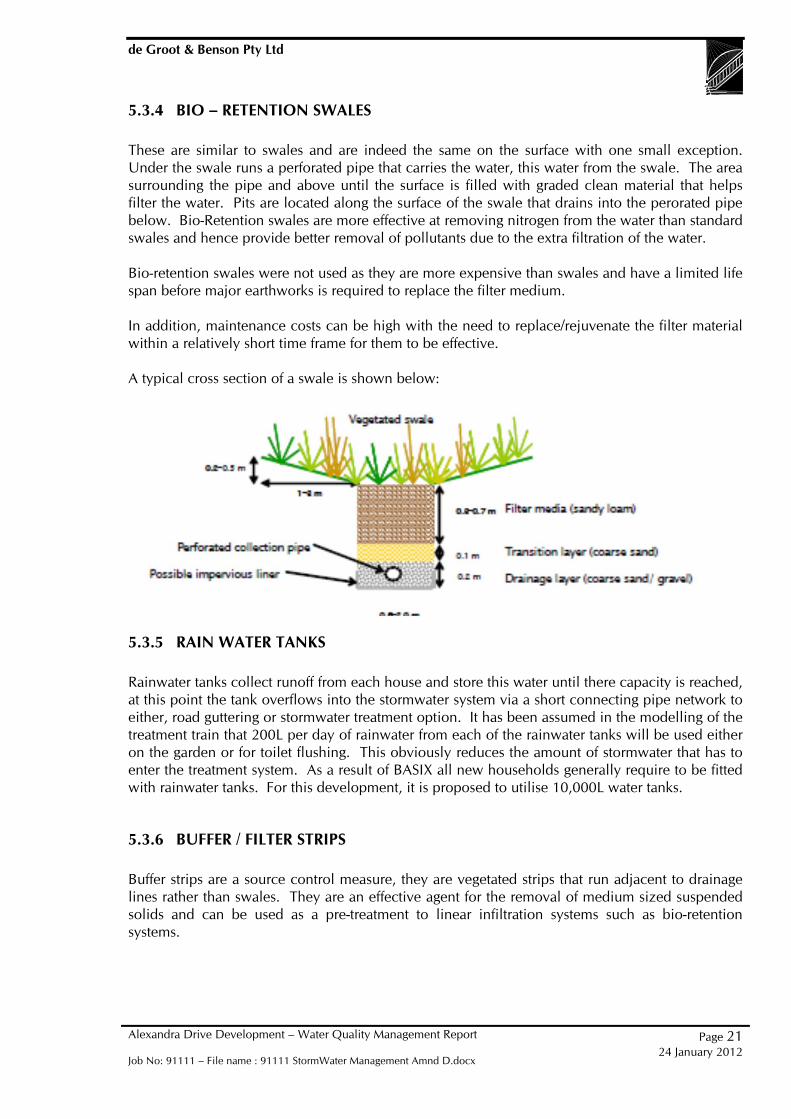
5.3.4 BIO – RETENTION SWALES These are similar to swales and are indeed the same on the surface with one small exception. Under the swale runs a perforated pipe that carries the water, this water from the swale. The area surrounding the pipe and above until the surface is filled with graded clean material that helps filter the water. Pits are located along the surface of the swale that drains into the perorated pipe below. Bio-Retention swales are more effective at removing nitrogen from the water than standard swales and hence provide better removal of pollutants due to the extra filtration of the water. Bio-retention swales were not used as they are more expensive than swales and have a limited life span before major earthworks is required to replace the filter medium. In addition, maintenance costs can be high with the need to replace/rejuvenate the filter material within a relatively short time frame for them to be effective. A typical cross section of a swale is shown below:
5.3.5 RAIN WATER TANKS Rainwater tanks collect runoff from each house and store this water until there capacity is reached, at this point the tank overflows into the stormwater system via a short connecting pipe network to either, road guttering or stormwater treatment option. It has been assumed in the modelling of the treatment train that 200L per day of rainwater from each of the rainwater tanks will be used either on the garden or for toilet flushing. This obviously reduces the amount of stormwater that has to enter the treatment system. As a result of BASIX all new households generally require to be fitted with rainwater tanks. For this development, it is proposed to utilise 10,000L water tanks.
5.3.6 BUFFER / FILTER STRIPS Buffer strips are a source control measure, they are vegetated strips that run adjacent to drainage lines rather than swales. They are an effective agent for the removal of medium sized suspended solids and can be used as a pre-treatment to linear infiltration systems such as bio-retention systems.
de Groot & Benson Pty Ltd
Alexandra Drive Development – Water Quality Management Report Job No: 91111 – File name : 91111 StormWater Management Amnd D.docx
Page 2224 January 2012
5.4 STORMWATER TREATMENT SYSTEM DESIGN AND PERFORMANCE The Model for Urban Stormwater Improvement Conceptualisation (MUSIC, version 4) was used to analyse the quality of the stormwater both prior to development and after development has occurred. MUSIC is used to aid in the design of stormwater and give feedback on the effectiveness of a system; it is not a design system and should not be used as one.
5.5 EFFECT ON GROUNDWATER The treatment train proposals do not assume no infiltration into the groundwater. As noted previously, geotechnical investigations of the site, did not encounter any groundwater close to the surface. The treatment train proposes to treat all water effectively “above ground” and will not result in any additional nutrients etc being directed into the soil profile. In terms of general impact on groundwater, we note the following:
The total site area is approx 54.9 ha. Of this area approx 20.7ha of land is at a slope of less than 3%. It is from this flatter land that the majority of any groundwater recharge would take place.
Approximately 4.8ha of the site will be converted to sealed roadways. Of this area approx 0.2ha is on land with a slope of less than 3%.
Approximately 11.6 ha of the site will be converted to roofed or driveway areas. Of this area approx 0.5ha is on land with a slope of less than 3%.
In other words, the area of the site available for groundwater re-charge will decrease by 16.4 ha (or 29%). However, in terms of land less than 3% slope, the decrease is only about 1.5ha or about 7% of the flatter land.
This being the case, it is our opinion that the development will have minimal effect on groundwater hydrology.
5.6 MUSIC MODELLING The performance, design and output of a treatment train system were evaluated using MUSIC a well regarded industry modelling program. It should be stated again that MUSIC is not a design tool but an evaluation tool whose purpose is to aid in the design and evaluation of treatment train systems. A variety of treatment scenarios were modelled from the very basic with poor water quality output to the complex and expensive in which water quality was improved to levels well above those required, these were performed to act as a calibration for the program. More seriously designed treatment systems that took into account available space, cost, maintenance, urban design and above all desired water quality were then modelled for their effectiveness and performance. Swales, Bio-retention swales, wetlands and GPT’s were modelled. The model was divided into seven catchments according to the lie of the land and the movement of stormwater. The proposed subdivision consists of 356 lots. For modelling purposes the MUSIC model was run using 2001 (standard year) and 1999 (wet year) rainfall data at 6min intervals, wet year was modelled to see if the treatment train system would be effective under those conditions.
de Groot & Benson Pty Ltd
Alexandra Drive Development – Water Quality Management Report Job No: 91111 – File name : 91111 StormWater Management Amnd D.docx
Page 2324 January 2012
Finally for the preferred option, was modelled and ran with 42 years of rainfall data taken at 6min intervals to verify results
5.6.1 MODELLING ASSUMPTIONS The performance of the model was analysed in a number of ways using 1 general set up parameter.
Each catchment has its own treatment train that can combine together with other
catchment treatments if required. All the catchments are modelled at once and discharge into one common receiving node ‘the creek’ (creek refers to both Swampy and Bellwood creek).
Pre-development was modelled using a standard undeveloped site node due to the land being cleared for some time. A ratio of 96% pervious grounds was used for the source node.
Post-development was modelled using 50-50% pervious to impervious land due to the presence of roads, houses and other structures.
The water quality at the time prior to development was assumed as being the target water quality for post-development treatment.
10,000L rain water tanks were assumed for each lot and were thus incorporated into the treatment train being modelled. It was also assumed that each household would recycle 200L per day of rainwater from the tanks on the garden and in flushing toilets.
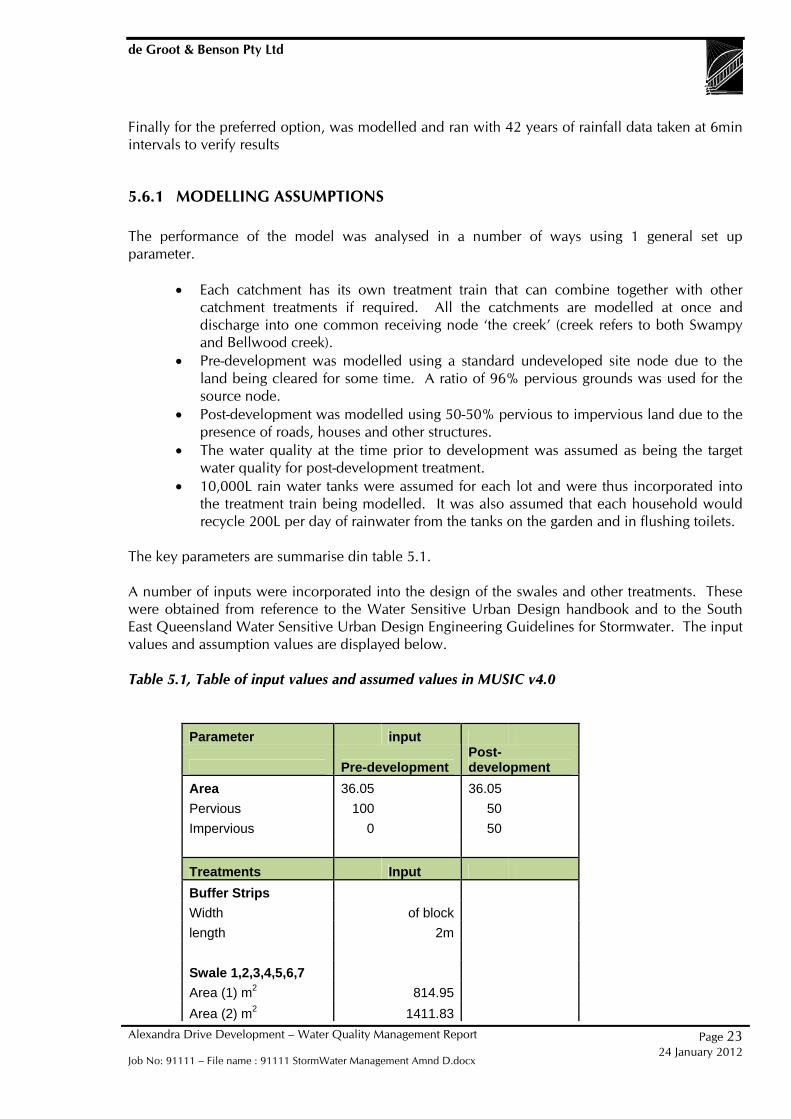
The key parameters are summarise din table 5.1. A number of inputs were incorporated into the design of the swales and other treatments. These were obtained from reference to the Water Sensitive Urban Design handbook and to the South East Queensland Water Sensitive Urban Design Engineering Guidelines for Stormwater. The input values and assumption values are displayed below. Table 5.1, Table of input values and assumed values in MUSIC v4.0
Parameter input
Pre-development Post-development
Area 36.05 36.05
Pervious 100 50
Impervious 0 50
Treatments Input
Buffer Strips
Width of block
length 2m
Swale 1,2,3,4,5,6,7
Area (1) m2 814.95
Area (2) m2 1411.83

de Groot & Benson Pty Ltd
Alexandra Drive Development – Water Quality Management Report Job No: 91111 – File name : 91111 StormWater Management Amnd D.docx
Page 2424 January 2012
Area (3) m2 945.9
Area (4) m2 997.65
Area (5) m2 1213.34
Area (6) m2 864.9
Area (7) m2 743.2
Rainwater tank
Volume (L) 10,000
Use per day (L) 200

de Groot & Benson Pty Ltd
Alexandra Drive Development – Water Quality Management Report Job No: 91111 – File name : 91111 StormWater Management Amnd D.docx
Page 2524 January 2012
5.6.2 PRE – DEVELOPMENT MODELLING The existing pre-development scenario was modelled to determine the pollutant loads already present in the existing stormwater, figure below shows the system modelled. A combination of a forest source node representing the majority of the site and an urban source node representing existing housing was used. These pollutant levels were used as the targets for treatment of stormwater post-development as is consistent with state and local government policies.
Figure 5.1, Pre-development model for Alexandra Drive proposed development. The results of the pre-development area modelling are displayed below. Note that these loads were considered as the target for post-development treatment and water quality levels. The average pollutants in the stormwater prior to development are shown in table 5.2.
PREDEVELOPMENT MODEL
Forest Node 33.5ha
Urban Node 2.5ha
POLLUTANT QUANTITY (KG/YR)
TSS 27100
TP 38.5
TN 348
Table 5.2, pollutants in stormwater prior to development as generated by MUSIC.
5.6.3 POST – DEVELOPMENT MODELLING Two treatment trains were analysed thoroughly for their performance, cost, maintenance requirements and overall ability to reduce pollution. A combination of swales, bio-retention swales, retention basin and rainwater tanks were used for the two options, these options were:
Option 1 – consisting of a train of, bio-retention swales and standard swales as-well as a retention basin. Sources 3,4,5 flowed along bio-retention swales into the retention basin, it was thought that significant treatment would be required along this section of the catchment as these 3 areas accounted for nearly half of the overall catchment area. Sources 1,2,6,7 all had standard swales employed in their treatment trains.

de Groot & Benson Pty Ltd
Alexandra Drive Development – Water Quality Management Report Job No: 91111 – File name : 91111 StormWater Management Amnd D.docx
Page 2624 January 2012
Option 2 – after considering the fact that each house has a mandatory rainwater tank it
was then decided to account for these in the treatment train system. A usage value of 200L of stormwater in the tank per day would be used by lot occupants. A system was then devised on the back of data obtained on option 1 which included rainwater tanks on each lot which ran over buffer strips and then fed into a number bio retention swales located in each catchment. Catchment 4 and 3 were the only catchments which required normal grassed swales which fed into a bio-retention swale.
In modelling buffer strips, swales and bio-retention swales standard MUSIC parameters were used and where appropriate the site conditions such as exfiltration rate were entered.
5.6.4 OPTION 2 After considering the results that were obtained from option 1 a new approach was formulated in which rainwater tanks that will be present on each property would be used as storage for stormwater. The overflow from the rainwater tanks would then flow over buffer or filter strips on each block of land into a combination of bio-retention swales and swales that would filter the remaining water and remove pollutants to a satisfactory level; this can be seen in Figure 5.3. Option 2 was designed on the premise of achieving a simpler, more cost effective but still quality system that achieved water quality demands. As previously stated water from the tank was assumed to be used on the garden and in toilet flushing. Table 5.4 conveys the results on pollutant reduction and whether or not they pass water quality standards prior to development.
Figure 5.3, Treatment train layout for Option2, note each source has its own treatment train and discharges into the creek. Rainwater tanks are the sum of all the individual tanks that fall under that source area.

de Groot & Benson Pty Ltd
Alexandra Drive Development – Water Quality Management Report Job No: 91111 – File name : 91111 StormWater Management Amnd D.docx
Page 2724 January 2012
POLLUTANT PRE‐DEVELOPMENT LEVELS
POST DEVELOPMENT LEVELS
TSS 27100 6100
TP 38.5 33.8
TN 348 345
GP's 2.99E+03 0
Table 5.4, Results from MUSIC on the effectives of pollutant removal for Option 2. As can be seen in Table 5.4 the treatment train system passes all water quality targets set by the pre-development pollutant levels. It is therefore recommended that Option 2 be implemented as it is less expensive, achieves water quality targets and does not require future replacement and minimal maintenance.
5.7 OPTION 2 BREAKDOWN Option 2 has been chosen as the preferred option due to its functionality low maintenance cost and ability to blend into and enhance the suburban landscape. Each swale is approximately 3.5m wide by 0.4m deep; a grass height of 250mm is to be maintained in the swale for maximum pollutant control to avoid damming and creating stagnant water. Tree and shrub vegetation as shown in Appendix B is limited to only the upper slopes of the swale and may not impact on water movement at the bottom of the swale for risk of damming and creating stagnant water. All swales are to be installed with intermittent grated pits to remove excess water and allow for maximum quality treatment; also at the end of each swale are grated pits to enable distribution and piping of treated water. Each block is to be fitted with a 10,000L water tank and of this 10,00L approximately 200L/day is to be used on toilet flushing and general garden watering. Below is Table 5.5 showing the number of Rainwater tanks per Catchment Area.
Catchment Area
No. of Tanks
1 43
2 43
3 26
4 62
5 94
6 63
7 19
Table 5.5, Number of tanks per Catchment area A breakdown of the individual swale systems in there corresponding catchment areas is as follows:
5.8 CATCHMENT 1, 2, 6, 7 Catchment one as shown in figure 3.3, figure 5.4/5.5 clearly defines the route of the bio-retention swale along the internal side of the road closest to the dwelling. The reason for this is to minimise water flow across the road pavement to prevent unwanted erosion and rubbish on the road. By reducing the water flow on the road negotiation of corners by motorists is safer during storm

de Groot & Benson Pty Ltd
Alexandra Drive Development – Water Quality Management Report Job No: 91111 – File name : 91111 StormWater Management Amnd D.docx
Page 2824 January 2012
periods. By placing the bio-swale on the dwelling side of the road it requires that the road be superelevated to obtain a cross-fall of 3% back into the swale. This cross-fall enables rainfall on the road to be treated and allows for corners to be correctly superelevated for safer higher speed driving. Appendix B outlines the swale design and culverts for driveways
5.9 CATCHMENT 3, 4, 5 Road 4 and Bus road 1 contain swales on the western (upper hill) side of the road to treat stormwater. Figure 5.6 shows the layout and position of the swales. As with swales in catchments 1,2,6,7 driveway culverts would have to be used to ensure no damming or ponding of water will occur. Once again a 3% cross-fall has been placed on the road angled back into the swale to ensure that no excess water and debris crosses and becomes stranded on the road, improving driver safety. Catchment 3 borders the western side of road 6 and road. Same road cross-all and driveway characteristics as in all other swales also apply here. A swale will also traverse from the border of Catchment 2 to the designated reserve; this is introduced to provide pollutant control. Water will be piped from across the road into the swale and will then exit from the swale into Swampy Creek.
5.10 MAINTENANCE The life cycle costs and construction have been taken into account in the design of the treatment train system, from this the most site effective cost effective option has been provided, after construction however maintenance and replacement costs need to be taken into account. After construction:
Swales need to be periodically mowed to keep the grass height at approximately 250mm. Bio retention swales would need replacement after between 5-10yrs service.
Since GPT’s were not used in any options they are not being considered for there maintenance costs.
de Groot & Benson Pty Ltd
Alexandra Drive Development – Water Quality Management Report Job No: 91111 – File name : 91111 StormWater Management Amnd D.docx
Page 2924 January 2012
6 CONCLUSIONS MUSIC modelling indicates that both treatment options would be effective in removing pollutants from stormwater for the total catchment and would discharge water of higher quality than that which would currently be discharged pre development. All relevant local and state government guidelines and legislation is adhered to in both options. Coffs Harbour City Council’s Urban Stormwater Management plan (2000) is also adhered to. Option 2 has been recommended as it adheres to all relevant legislation and policies from state and local government and is a cost effective, low impact design that can be easily incorporated into the urban design of the development. This system consists of a treatment train of rainwater tanks and swales to remove pollutants. This treatment system is very common in Australia and is proven to work and not impact to greatly on any one party in terms of cost. The urban landscape can easily be incorporated into the swales design and can even improve the urban design. Option 2 is the most cost effective, unobtrusive, low maintenance option that adheres to al legislation and guidelines. Hydraulic modelling has shown that the 3.9% increase in flow after development is insignificant in changing the overall height of the creek to levels that would cause possible flooding for existing dwellings and lots of land already clear of current flood levels. The effects of climate change on the site are also negligible with only minor flooding that doesn’t affect dwellings occurring if the maximum theorised sea level rise is achieved. Increase in rainfall has little effect on the system due to how wide the system is during a flood or ARI event.
de Groot & Benson Pty Ltd
Alexandra Drive Development – Water Quality Management Report Job No: 91111 – File name : 91111 StormWater Management Amnd D.docx
Page 3024 January 2012
7 REFERENCES Coffs Harbour City Council (2000), Urban Stormwater Management Plan. Brisbane City Council (2005), Draft Water Sensitive Urban Design Engineering Guidelines: Stormwater John R Argue (2004), Water Sensitive Urban Design: Basic Procedures for ‘Source Control’ of Stormwater, University of South Australia. Department of Environment and Climate Change, Floodplain Risk Management Guideline Annexure 17(b) ‘Practical Consideration of Climate Change’.

de Groot & Benson Pty Ltd
Alexandra Drive Development – Water Quality Management Report Job No: 91111 – File name : 91111 StormWater Management Amnd D.docx
Page 3124 January 2012
APPENDIX A - MUSIC DATA Pre Development For year containing 1999 rainfall data. Total Area (ha),36.05 Area Impervious (ha),1.27756140350878 Area Pervious (ha),34.7724385964912 Field Capacity (mm),80 Pervious Area Infiltration Capacity coefficient - a,200 Pervious Area Infiltration Capacity exponent - b,1 Impervious Area Rainfall Threshold (mm/day),1 Pervious Area Soil Storage Capacity (mm),120 Pervious Area Soil Initial Storage (% of Capacity),30 Groundwater Initial Depth (mm),10 Groundwater Daily Recharge Rate (%),25 Groundwater Daily Baseflow Rate (%),5 Groundwater Daily Deep Seepage Rate (%),0 Stormflow Total Suspended Solids Mean (log mg/L),2.3 Stormflow Total Suspended Solids Standard Deviation (log mg/L),0.31 Stormflow Total Suspended Solids Estimation Method,Stochastic Stormflow Total Suspended Solids Serial Correlation,0 Stormflow Total Phosphorus Mean (log mg/L),-0.27 Stormflow Total Phosphorus Standard Deviation (log mg/L),0.3 Stormflow Total Phosphorus Estimation Method,Stochastic Stormflow Total Phosphorus Serial Correlation,0 Stormflow Total Nitrogen Mean (log mg/L),0.59 Stormflow Total Nitrogen Standard Deviation (log mg/L),0.26 Stormflow Total Nitrogen Estimation Method,Stochastic Stormflow Total Nitrogen Serial Correlation,0 Baseflow Total Suspended Solids Mean (log mg/L),1.4 Baseflow Total Suspended Solids Standard Deviation (log mg/L),0.13 Baseflow Total Suspended Solids Estimation Method,Stochastic Baseflow Total Suspended Solids Serial Correlation,0 Baseflow Total Phosphorus Mean (log mg/L),-0.88 Baseflow Total Phosphorus Standard Deviation (log mg/L),0.13 Baseflow Total Phosphorus Estimation Method,Stochastic Baseflow Total Phosphorus Serial Correlation,0 Baseflow Total Nitrogen Mean (log mg/L),0.074 Baseflow Total Nitrogen Standard Deviation (log mg/L),0.13 Baseflow Total Nitrogen Estimation Method,Stochastic Baseflow Total Nitrogen Serial Correlation,0
de Groot & Benson Pty Ltd
Alexandra Drive Development – Water Quality Management Report Job No: 91111 – File name : 91111 StormWater Management Amnd D.docx
Page 3224 January 2012
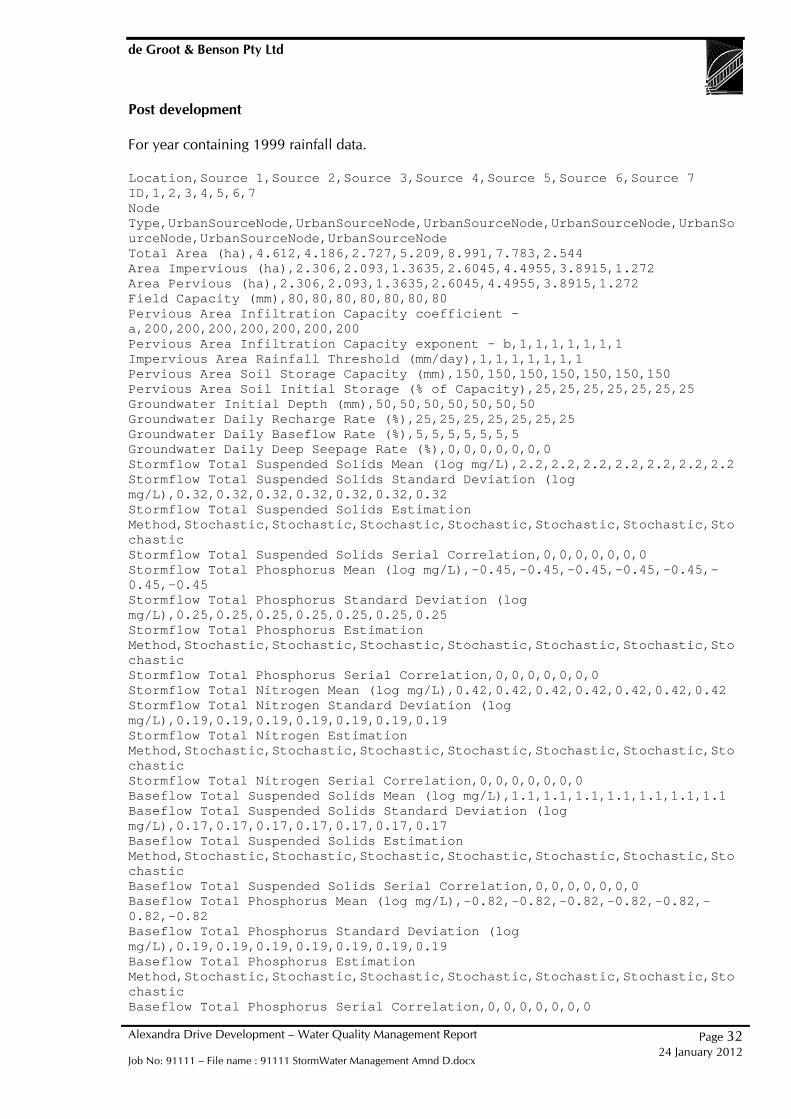
Post development For year containing 1999 rainfall data. Location,Source 1,Source 2,Source 3,Source 4,Source 5,Source 6,Source 7 ID,1,2,3,4,5,6,7 Node Type,UrbanSourceNode,UrbanSourceNode,UrbanSourceNode,UrbanSourceNode,UrbanSourceNode,UrbanSourceNode,UrbanSourceNode Total Area (ha),4.612,4.186,2.727,5.209,8.991,7.783,2.544 Area Impervious (ha),2.306,2.093,1.3635,2.6045,4.4955,3.8915,1.272 Area Pervious (ha),2.306,2.093,1.3635,2.6045,4.4955,3.8915,1.272 Field Capacity (mm),80,80,80,80,80,80,80 Pervious Area Infiltration Capacity coefficient - a,200,200,200,200,200,200,200 Pervious Area Infiltration Capacity exponent - b,1,1,1,1,1,1,1 Impervious Area Rainfall Threshold (mm/day),1,1,1,1,1,1,1 Pervious Area Soil Storage Capacity (mm),150,150,150,150,150,150,150 Pervious Area Soil Initial Storage (% of Capacity),25,25,25,25,25,25,25 Groundwater Initial Depth (mm),50,50,50,50,50,50,50 Groundwater Daily Recharge Rate (%),25,25,25,25,25,25,25 Groundwater Daily Baseflow Rate (%),5,5,5,5,5,5,5 Groundwater Daily Deep Seepage Rate (%),0,0,0,0,0,0,0 Stormflow Total Suspended Solids Mean (log mg/L),2.2,2.2,2.2,2.2,2.2,2.2,2.2 Stormflow Total Suspended Solids Standard Deviation (log mg/L),0.32,0.32,0.32,0.32,0.32,0.32,0.32 Stormflow Total Suspended Solids Estimation Method,Stochastic,Stochastic,Stochastic,Stochastic,Stochastic,Stochastic,Stochastic Stormflow Total Suspended Solids Serial Correlation,0,0,0,0,0,0,0 Stormflow Total Phosphorus Mean (log mg/L),-0.45,-0.45,-0.45,-0.45,-0.45,-0.45,-0.45 Stormflow Total Phosphorus Standard Deviation (log mg/L),0.25,0.25,0.25,0.25,0.25,0.25,0.25 Stormflow Total Phosphorus Estimation Method,Stochastic,Stochastic,Stochastic,Stochastic,Stochastic,Stochastic,Stochastic Stormflow Total Phosphorus Serial Correlation,0,0,0,0,0,0,0 Stormflow Total Nitrogen Mean (log mg/L),0.42,0.42,0.42,0.42,0.42,0.42,0.42 Stormflow Total Nitrogen Standard Deviation (log mg/L),0.19,0.19,0.19,0.19,0.19,0.19,0.19 Stormflow Total Nitrogen Estimation Method,Stochastic,Stochastic,Stochastic,Stochastic,Stochastic,Stochastic,Stochastic Stormflow Total Nitrogen Serial Correlation,0,0,0,0,0,0,0 Baseflow Total Suspended Solids Mean (log mg/L),1.1,1.1,1.1,1.1,1.1,1.1,1.1 Baseflow Total Suspended Solids Standard Deviation (log mg/L),0.17,0.17,0.17,0.17,0.17,0.17,0.17 Baseflow Total Suspended Solids Estimation Method,Stochastic,Stochastic,Stochastic,Stochastic,Stochastic,Stochastic,Stochastic Baseflow Total Suspended Solids Serial Correlation,0,0,0,0,0,0,0 Baseflow Total Phosphorus Mean (log mg/L),-0.82,-0.82,-0.82,-0.82,-0.82,-0.82,-0.82 Baseflow Total Phosphorus Standard Deviation (log mg/L),0.19,0.19,0.19,0.19,0.19,0.19,0.19 Baseflow Total Phosphorus Estimation Method,Stochastic,Stochastic,Stochastic,Stochastic,Stochastic,Stochastic,Stochastic Baseflow Total Phosphorus Serial Correlation,0,0,0,0,0,0,0
de Groot & Benson Pty Ltd
Alexandra Drive Development – Water Quality Management Report Job No: 91111 – File name : 91111 StormWater Management Amnd D.docx
Page 3324 January 2012
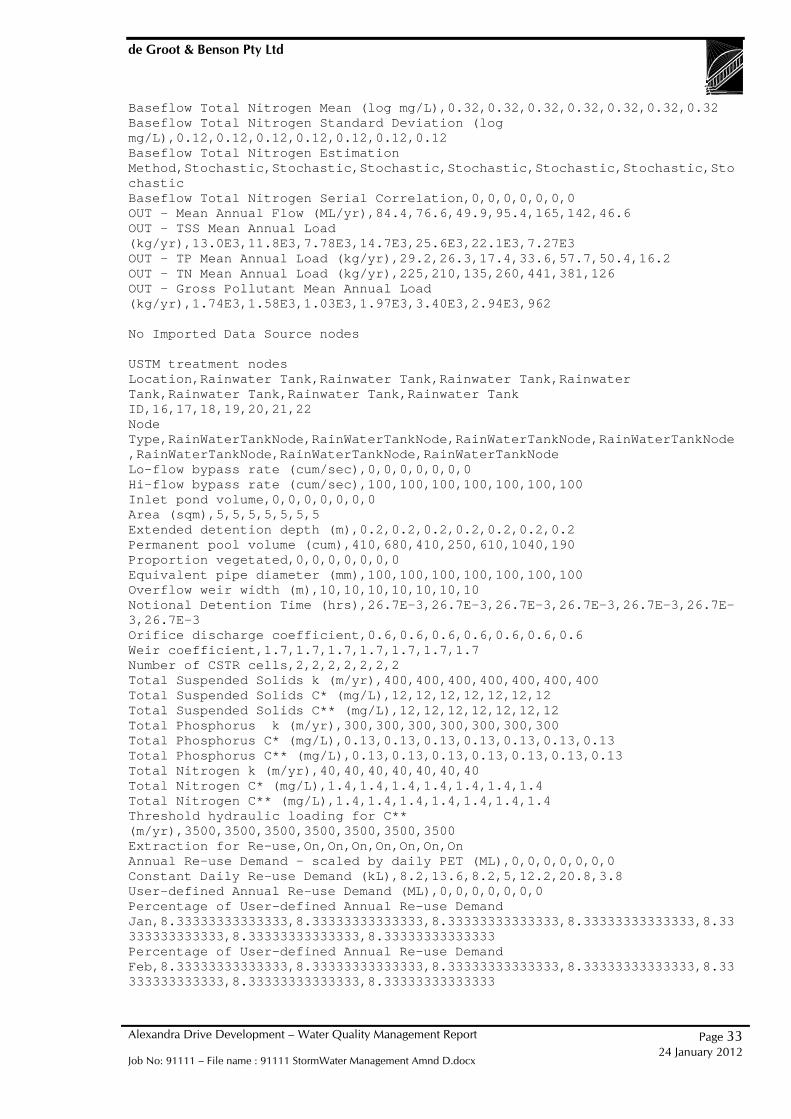
Baseflow Total Nitrogen Mean (log mg/L),0.32,0.32,0.32,0.32,0.32,0.32,0.32 Baseflow Total Nitrogen Standard Deviation (log mg/L),0.12,0.12,0.12,0.12,0.12,0.12,0.12 Baseflow Total Nitrogen Estimation Method,Stochastic,Stochastic,Stochastic,Stochastic,Stochastic,Stochastic,Stochastic Baseflow Total Nitrogen Serial Correlation,0,0,0,0,0,0,0 OUT - Mean Annual Flow (ML/yr),84.4,76.6,49.9,95.4,165,142,46.6 OUT - TSS Mean Annual Load (kg/yr),13.0E3,11.8E3,7.78E3,14.7E3,25.6E3,22.1E3,7.27E3 OUT - TP Mean Annual Load (kg/yr),29.2,26.3,17.4,33.6,57.7,50.4,16.2 OUT - TN Mean Annual Load (kg/yr),225,210,135,260,441,381,126 OUT - Gross Pollutant Mean Annual Load (kg/yr),1.74E3,1.58E3,1.03E3,1.97E3,3.40E3,2.94E3,962 No Imported Data Source nodes USTM treatment nodes Location,Rainwater Tank,Rainwater Tank,Rainwater Tank,Rainwater Tank,Rainwater Tank,Rainwater Tank,Rainwater Tank ID,16,17,18,19,20,21,22 Node Type,RainWaterTankNode,RainWaterTankNode,RainWaterTankNode,RainWaterTankNode,RainWaterTankNode,RainWaterTankNode,RainWaterTankNode Lo-flow bypass rate (cum/sec),0,0,0,0,0,0,0 Hi-flow bypass rate (cum/sec),100,100,100,100,100,100,100 Inlet pond volume,0,0,0,0,0,0,0 Area (sqm),5,5,5,5,5,5,5 Extended detention depth (m),0.2,0.2,0.2,0.2,0.2,0.2,0.2 Permanent pool volume (cum),410,680,410,250,610,1040,190 Proportion vegetated,0,0,0,0,0,0,0 Equivalent pipe diameter (mm),100,100,100,100,100,100,100 Overflow weir width (m),10,10,10,10,10,10,10 Notional Detention Time (hrs),26.7E-3,26.7E-3,26.7E-3,26.7E-3,26.7E-3,26.7E-3,26.7E-3 Orifice discharge coefficient,0.6,0.6,0.6,0.6,0.6,0.6,0.6 Weir coefficient,1.7,1.7,1.7,1.7,1.7,1.7,1.7 Number of CSTR cells,2,2,2,2,2,2,2 Total Suspended Solids k (m/yr),400,400,400,400,400,400,400 Total Suspended Solids C* (mg/L),12,12,12,12,12,12,12 Total Suspended Solids C** (mg/L),12,12,12,12,12,12,12 Total Phosphorus k (m/yr),300,300,300,300,300,300,300 Total Phosphorus C* (mg/L),0.13,0.13,0.13,0.13,0.13,0.13,0.13 Total Phosphorus C** (mg/L),0.13,0.13,0.13,0.13,0.13,0.13,0.13 Total Nitrogen k (m/yr),40,40,40,40,40,40,40 Total Nitrogen C* (mg/L),1.4,1.4,1.4,1.4,1.4,1.4,1.4 Total Nitrogen C** (mg/L),1.4,1.4,1.4,1.4,1.4,1.4,1.4 Threshold hydraulic loading for C** (m/yr),3500,3500,3500,3500,3500,3500,3500 Extraction for Re-use,On,On,On,On,On,On,On Annual Re-use Demand - scaled by daily PET (ML),0,0,0,0,0,0,0 Constant Daily Re-use Demand (kL),8.2,13.6,8.2,5,12.2,20.8,3.8 User-defined Annual Re-use Demand (ML),0,0,0,0,0,0,0 Percentage of User-defined Annual Re-use Demand Jan,8.33333333333333,8.33333333333333,8.33333333333333,8.33333333333333,8.33333333333333,8.33333333333333,8.33333333333333 Percentage of User-defined Annual Re-use Demand Feb,8.33333333333333,8.33333333333333,8.33333333333333,8.33333333333333,8.33333333333333,8.33333333333333,8.33333333333333

de Groot & Benson Pty Ltd
Alexandra Drive Development – Water Quality Management Report Job No: 91111 – File name : 91111 StormWater Management Amnd D.docx
Page 3424 January 2012
Percentage of User-defined Annual Re-use Demand Mar,8.33333333333333,8.33333333333333,8.33333333333333,8.33333333333333,8.33333333333333,8.33333333333333,8.33333333333333 Percentage of User-defined Annual Re-use Demand Apr,8.33333333333333,8.33333333333333,8.33333333333333,8.33333333333333,8.33333333333333,8.33333333333333,8.33333333333333 Percentage of User-defined Annual Re-use Demand May,8.33333333333333,8.33333333333333,8.33333333333333,8.33333333333333,8.33333333333333,8.33333333333333,8.33333333333333 Percentage of User-defined Annual Re-use Demand Jun,8.33333333333333,8.33333333333333,8.33333333333333,8.33333333333333,8.33333333333333,8.33333333333333,8.33333333333333 Percentage of User-defined Annual Re-use Demand Jul,8.33333333333333,8.33333333333333,8.33333333333333,8.33333333333333,8.33333333333333,8.33333333333333,8.33333333333333 Percentage of User-defined Annual Re-use Demand Aug,8.33333333333333,8.33333333333333,8.33333333333333,8.33333333333333,8.33333333333333,8.33333333333333,8.33333333333333 Percentage of User-defined Annual Re-use Demand Sep,8.33333333333333,8.33333333333333,8.33333333333333,8.33333333333333,8.33333333333333,8.33333333333333,8.33333333333333 Percentage of User-defined Annual Re-use Demand Oct,8.33333333333333,8.33333333333333,8.33333333333333,8.33333333333333,8.33333333333333,8.33333333333333,8.33333333333333 Percentage of User-defined Annual Re-use Demand Nov,8.33333333333333,8.33333333333333,8.33333333333333,8.33333333333333,8.33333333333333,8.33333333333333,8.33333333333333 Percentage of User-defined Annual Re-use Demand Dec,8.33333333333333,8.33333333333333,8.33333333333333,8.33333333333333,8.33333333333333,8.33333333333333,8.33333333333333 Filter area (sqm), , , , , , , Filter depth (m), , , , , , , Filter median particle diameter (mm), , , , , , , Saturated hydraulic conductivity (mm/hr), , , , , , , Voids ratio, , , , , , , Length (m), , , , , , , Bed slope, , , , , , , Base Width (m), , , , , , , Top width (m), , , , , , , Vegetation height (m), , , , , , , Proportion of upstream impervious area treated, , , , , , , Seepage Rate (mm/hr),0,0,0,0,0,0,0 Evap Loss as proportion of PET,0,0,0,0,0,0,0 Depth in metres below the drain pipe, , , , , , , IN - Mean Annual Flow (ML/yr),84.4,142,76.6,49.9,95.4,165,46.6 IN - TSS Mean Annual Load (kg/yr),13.0E3,22.1E3,11.8E3,7.78E3,14.7E3,25.6E3,7.27E3 IN - TP Mean Annual Load (kg/yr),29.2,50.4,26.3,17.4,33.6,57.7,16.2 IN - TN Mean Annual Load (kg/yr),225,381,210,135,260,441,126 IN - Gross Pollutant Mean Annual Load (kg/yr),1.74E3,2.94E3,1.58E3,1.03E3,1.97E3,3.40E3,962 OUT - Mean Annual Flow (ML/yr),81.4,138,73.6,48.1,90.9,157,45.2 OUT - TSS Mean Annual Load (kg/yr),12.2E3,21.0E3,11.1E3,7.25E3,13.8E3,24.1E3,6.84E3 OUT - TP Mean Annual Load (kg/yr),27.9,48.3,25.0,16.5,31.8,54.5,15.5 OUT - TN Mean Annual Load (kg/yr),217,366,201,129,247,419,122 OUT - Gross Pollutant Mean Annual Load (kg/yr),0.00,0.00,0.00,0.00,0.00,0.00,0.00
de Groot & Benson Pty Ltd
Alexandra Drive Development – Water Quality Management Report Job No: 91111 – File name : 91111 StormWater Management Amnd D.docx
Page 3524 January 2012
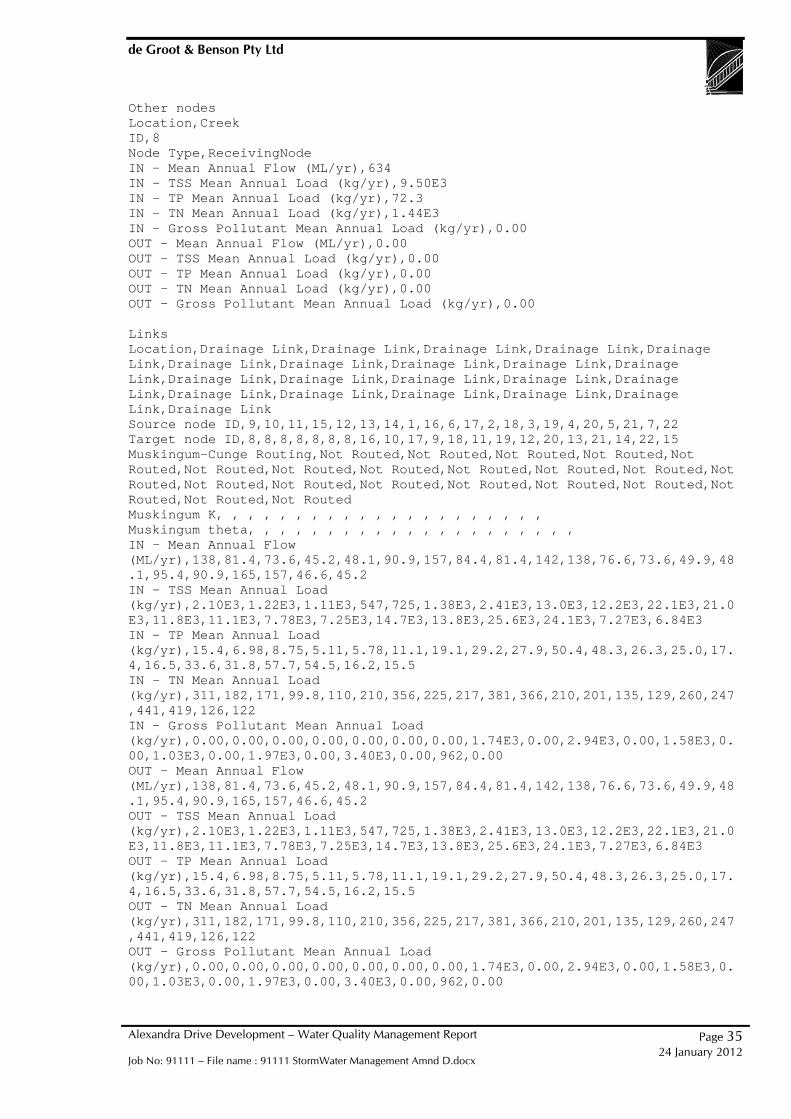
Other nodes Location,Creek ID,8 Node Type,ReceivingNode IN - Mean Annual Flow (ML/yr),634 IN - TSS Mean Annual Load (kg/yr),9.50E3 IN - TP Mean Annual Load (kg/yr),72.3 IN - TN Mean Annual Load (kg/yr),1.44E3 IN - Gross Pollutant Mean Annual Load (kg/yr),0.00 OUT - Mean Annual Flow (ML/yr),0.00 OUT - TSS Mean Annual Load (kg/yr),0.00 OUT - TP Mean Annual Load (kg/yr),0.00 OUT - TN Mean Annual Load (kg/yr),0.00 OUT - Gross Pollutant Mean Annual Load (kg/yr),0.00 Links Location,Drainage Link,Drainage Link,Drainage Link,Drainage Link,Drainage Link,Drainage Link,Drainage Link,Drainage Link,Drainage Link,Drainage Link,Drainage Link,Drainage Link,Drainage Link,Drainage Link,Drainage Link,Drainage Link,Drainage Link,Drainage Link,Drainage Link,Drainage Link,Drainage Link Source node ID,9,10,11,15,12,13,14,1,16,6,17,2,18,3,19,4,20,5,21,7,22 Target node ID,8,8,8,8,8,8,8,16,10,17,9,18,11,19,12,20,13,21,14,22,15 Muskingum-Cunge Routing,Not Routed,Not Routed,Not Routed,Not Routed,Not Routed,Not Routed,Not Routed,Not Routed,Not Routed,Not Routed,Not Routed,Not Routed,Not Routed,Not Routed,Not Routed,Not Routed,Not Routed,Not Routed,Not Routed,Not Routed,Not Routed Muskingum K, , , , , , , , , , , , , , , , , , , , , Muskingum theta, , , , , , , , , , , , , , , , , , , , , IN - Mean Annual Flow (ML/yr),138,81.4,73.6,45.2,48.1,90.9,157,84.4,81.4,142,138,76.6,73.6,49.9,48.1,95.4,90.9,165,157,46.6,45.2 IN - TSS Mean Annual Load (kg/yr),2.10E3,1.22E3,1.11E3,547,725,1.38E3,2.41E3,13.0E3,12.2E3,22.1E3,21.0E3,11.8E3,11.1E3,7.78E3,7.25E3,14.7E3,13.8E3,25.6E3,24.1E3,7.27E3,6.84E3 IN - TP Mean Annual Load (kg/yr),15.4,6.98,8.75,5.11,5.78,11.1,19.1,29.2,27.9,50.4,48.3,26.3,25.0,17.4,16.5,33.6,31.8,57.7,54.5,16.2,15.5 IN - TN Mean Annual Load (kg/yr),311,182,171,99.8,110,210,356,225,217,381,366,210,201,135,129,260,247,441,419,126,122 IN - Gross Pollutant Mean Annual Load (kg/yr),0.00,0.00,0.00,0.00,0.00,0.00,0.00,1.74E3,0.00,2.94E3,0.00,1.58E3,0.00,1.03E3,0.00,1.97E3,0.00,3.40E3,0.00,962,0.00 OUT - Mean Annual Flow (ML/yr),138,81.4,73.6,45.2,48.1,90.9,157,84.4,81.4,142,138,76.6,73.6,49.9,48.1,95.4,90.9,165,157,46.6,45.2 OUT - TSS Mean Annual Load (kg/yr),2.10E3,1.22E3,1.11E3,547,725,1.38E3,2.41E3,13.0E3,12.2E3,22.1E3,21.0E3,11.8E3,11.1E3,7.78E3,7.25E3,14.7E3,13.8E3,25.6E3,24.1E3,7.27E3,6.84E3 OUT - TP Mean Annual Load (kg/yr),15.4,6.98,8.75,5.11,5.78,11.1,19.1,29.2,27.9,50.4,48.3,26.3,25.0,17.4,16.5,33.6,31.8,57.7,54.5,16.2,15.5 OUT - TN Mean Annual Load (kg/yr),311,182,171,99.8,110,210,356,225,217,381,366,210,201,135,129,260,247,441,419,126,122 OUT - Gross Pollutant Mean Annual Load (kg/yr),0.00,0.00,0.00,0.00,0.00,0.00,0.00,1.74E3,0.00,2.94E3,0.00,1.58E3,0.00,1.03E3,0.00,1.97E3,0.00,3.40E3,0.00,962,0.00

de Groot & Benson Pty Ltd
Alexandra Drive Development – Water Quality Management Report Job No: 91111 – File name : 91111 StormWater Management Amnd D.docx
Page 3624 January 2012
NOTE: Swale nodes were designed as generic nodes and treatment properties were adapted as according to the Brisbane City Council’s Draft Water Sensitive Urban Design Engineering Guidelines: Stormwater. This refers to the effectiveness of the swale being a function of the area of the catchment.

de Groot & Benson Pty Ltd
Alexandra Drive Development – Water Quality Management Report Job No: 91111 – File name : 91111 StormWater Management Amnd D.docx
Page 3724 January 2012
APPENDIX B - CONCEPT DESIGN

Drawing No.
Coffs Harbour NSW 2450
236 Harbour Drive
A.C.N. 052 300 571
Pty Ltd
de Groot &
Benson
Email [email protected]
Fax (02) 6652 7418
Phone (02) 6652 1700
Engineers &
Planners
Consulting
ApprovedDesign
NAMBUCCA SHIRE COUNCIL
APPROVED ON BEHALF OF
Drawn
Date
DATE
CITY ENGINEER
CheckedSheet No.
AP.BYDR.BYREVISIONDATERDG JAN 2012
RDGJAT
AS SHOWN
RDG
REV
Amendment No.
Council No.
Scale
Surveyed
-
DVD No.
5
Datum
AHD
BELLWOOD, NAMBUCCA HEADS
PROPOSED SUBDIVISION OF LOT 2 DP1119830
STORMWATER PLAN
Drawing No.
Coffs Harbour NSW 2450
236 Harbour Drive
A.C.N. 052 300 571
Pty Ltd
de Groot &
Benson
Email [email protected]
Fax (02) 6652 7418
Phone (02) 6652 1700
Engineers &
Planners
Consulting
ApprovedDesign
NAMBUCCA SHIRE COUNCIL
APPROVED ON BEHALF OF
Drawn
Date
DATE
CITY ENGINEER
CheckedSheet No.
AP.BYDR.BYREVISIONDATERDG JAN 2012
RDGJAT
AS SHOWN
91111-105
RDG
REV
Amendment No.
Council No.
Scale
Surveyed
-
DVD No.
5
Datum
AHD
PROPOSED LAYOUT OF BIO SWALES
INDICATIVE LOCATION OF PIPED DRAINAGE SYSTEM
(REFER SHEETS 120 ONWARDS FOR FURTHER DETAIL)
INTERALLOTMENT DRAINAGE WHERE LOTS
SLOPE AWAY FROM ROADWAY