stormwater pump station diversions feasibility evaluation · stormwater pump station diversions...
TRANSCRIPT

Stormwater Pump Station
Diversions Feasibility
Evaluation
Prepared for
Bay Area Stormwater Management
Agencies Associat ion ( BASMAA)
Oak land, Ca l i fornia
August 20, 2010


201 North Civic Dr., Suite 115
Walnut Creek, CA 94596
Stormwater Pump Station Diversions
Feasibility Evaluation
Prepared for
Bay Area Stormwater Management Agenc ies Associat ion ( BASMAA)
Oak land, Ca l i fornia
September 13, 2010
BC Job # 139444
This is a draft and is not intended to be a f inal representat ion
of the work done or recommendations made by Brown and Caldwell .
I t should not be relied upon; consult the f inal report .


ii
DRAFT for review purposes only. Use of contents on this sheet is subject to the limitations specified at the end of this document.
G:\Engineering and Construction\Flood\CleanWater\Arleen\Regional\BASMAA\Regional permit\POCs\General C11 & C12\C.11-12f-diversions\Draft FINAL -Pump
Station FER 9-13-2010.doc
Table of Contents
List of Figures ................................................................................................................................. iii
List of Tables .................................................................................................................................. iii
List of Abbreviations ...................................................................................................................... iv
Executive Summary ....................................................................................................................... 1
1. Background ................................................................................................................... 1-1
1.1 Problem Statement ...................................................................................................... 1-1
1.2 Planning Context .......................................................................................................... 1-3
2. Approach ....................................................................................................................... 2-1
2.1 BASMAA Technical Oversight ...................................................................................... 2-1
2.2 Information gathered ................................................................................................... 2-1
2.3 Approach to Development of Selection Criteria......................................................... 2-1
2.3.1.1 Selection criteria used by other programs ................................................ 2-2
2.4 Approach to Develop Cost/Benefit Analysis .............................................................. 2-7
2.4.1 Cost Estimating Tools ........................................................................................ 2-7
2.4.2 Load Estimating Tools .................................................................................... 2-10
3. Findings ...................................................................................................................... 3-14
3.1 Recommended Selection Criteria ............................................................................ 3-14
3.1.1 Needs .............................................................................................................. 3-14
3.1.2 Costs and Alternatives ................................................................................... 3-23
3.1.3 Acceptability .................................................................................................... 3-23
3.2 Cost and Benefit Analysis of Three Scenarios ........................................................ 3-25
3.2.1 Non-constructed Pilot Diversions .................................................................. 3-26
3.2.2 Conveyance System Cleanout ....................................................................... 3-27
3.3 POTW and Collection System Agency Constraints/Concerns ................................ 3-27
3.4 Conceptual Framework for Crediting PCB Load Reductions ................................. 3-28
4. Process and schedule for pilot project implementation ............................................ 4-1
5. Limitations .................................................................................................................... 5-1
References ..................................................................................................................................... 1

Pump Station Diversions Feasibility Evaluation Table of Contents
iii
DRAFT for review purposes only. Use of contents on this sheet is subject to the limitations specified at the end of this document.
G:\Engineering and Construction\Flood\CleanWater\Arleen\Regional\BASMAA\Regional permit\POCs\General C11 & C12\C.11-12f-diversions\Draft FINAL -Pump
Station FER 9-13-2010.doc
List of Figures
Figure 1-1. Conceptual Illustration of Pilot Stormwater Diversion to POTW Projects in
Context with Other Potential Control Strategies ................................................................. 1-4
Figure 2-1. Decision Tree for Dry Weather Diversion Consideration in Orange County,
California. ............................................................................................................................... 2-3
Figure 2-2. Adaptive Management Decision Tree for the Las Vegas Wash Selenium
Management Plan. ................................................................................................................ 2-5
Figure 2-3. Feasibility and Design Criteria Used by Caltrans for Dry Weather Diversions. ... 2-6
Figure 2-4. Conceptual diagram of two different options for pump station diversions. ........ 2-9
Figure 2-5. Concentrations of PCB vs. TSS under different assumed concentrations of PCBs
in sediment. ........................................................................................................................ 2-12
Figure 2-6. Concentrations of Hg vs. TSS under different assumed concentrations of Hg in
sediment. ............................................................................................................................ 2-13
Figure 3-1. Map of Pump Station Locations, PCB concentrations in Sediments, Locations of
POTWs, and POTW Service Areas in San Mateo County. ................................................ 3-16
Figure 3-2. Map of Pump Station Locations, PCB concentrations in Sediments, Locations of
POTWs, and POTW Service Areas in Napa County. .......................................................... 3-17
Figure 3-3. Map of Pump Station Locations, PCB concentrations in Sediments, Locations of
POTWs, and POTW Service Areas in Marin County. ......................................................... 3-18
Figure 3-4. Map of Pump Station Locations, PCB concentrations in Sediments, Locations of
POTWs, and POTW Service Areas in Contra Costa County. ............................................. 3-19
Figure 3-4. Map of Pump Station Locations, PCB concentrations in Sediments, Locations of
POTWs, and POTW Service Areas in Alameda County. .................................................... 3-20
Figure 3-5. Map of Pump Station Locations, PCB concentrations in Sediments, Locations of
POTWs, and POTW Service Areas in Santa Clara County. ............................................... 3-21
List of Tables
Table 2-1. Planning Cost Estimates for Pilot Diversion Project Components ........................ 2-8
Table 2-2. Planning O&M and Treatment Cost Estimates for Pilot Diversion Projects ......... 2-8
Table 2-3. Estimated Costs for Different Pilot Diversion Approaches ................................. 2-10
Attachment 1. List of Major POTWs in the Bay Area .................................................................. 1

Pump Station Diversions Feasibility Evaluation Table of Contents
iv
DRAFT for review purposes only. Use of contents on this sheet is subject to the limitations specified at the end of this document.
G:\Engineering and Construction\Flood\CleanWater\Arleen\Regional\BASMAA\Regional permit\POCs\General C11 & C12\C.11-12f-diversions\Draft FINAL -Pump
Station FER 9-13-2010.doc
List of Abbreviations
BASMAA Bay Area Stormwater Management Agencies
Association
CW4CB Clean Watersheds for a Clean Bay
FER Feasibility Evaluation Report
GIS geographic information systems
gpm gallons per minute
HMP hydromodification management plans
LID Low Impact Development
mgd million gallons per day
MPC Monitoring and Pollutants of Concern
MS4s municipal separate storm sewer systems
NPDES National Pollutant Discharge Elimination
System
O&M operations and maintenance
PCBs polychlorinated biphenyls
POTWs publicly owned treatment works
PPDG Project Planning and Design Guide
ROW Right-of-way
SCADA Supervisory control and data acquisition
SFEI San Francisco Estuary Institute
SFB-RWQCB San Francisco Bay Regional Water
Quality Control Board
the Bay San Francisco Bay
TMDL Total Maximum Daily Load
TOC Technical Oversight Committee
WLAs Wasteload allocations


ES-1
DRAFT for review purposes only. Use of contents on this sheet is subject to the limitations specified at the end of this document.
G:\Engineering and Construction\Flood\CleanWater\Arleen\Regional\BASMAA\Regional permit\POCs\General C11 & C12\C.11-12f-diversions\Draft FINAL -Pump
Station FER 9-13-2010.doc
Executive Summary
This Feasibility Evaluation Report (FER) fulfills reporting requirements for Fiscal Year 2009/10 under
provisions C.11.f and C.12.f of the Municipal Regional Stormwater National Pollutant Discharge
Elimination System (NPDES) Permit (Order No R2-2009-0074), more commonly referred to as the
Municipal Regional Permit (MRP). Provisions C.11.f and C.12.f of the MRP are nearly identical provisions
for control of mercury (C.11) and polychlorinated biphenyls (PCBs) (C.12) that require the evaluation of
pilot diversions to publicly owned treatment works (POTWs) of dry weather urban runoff and/or first flush
events from stormwater pump stations. The pilot projects are being evaluated in parallel with other BMP
pilot implementation projects, including stormwater treatment retrofits, sediment management pilot
projects, and source investigations to identify contaminated sites. The first product required under these
provisions is a feasibility evaluation to be included in the 2010 Annual Reports for each Permittee. The
feasibility evaluation is to include, but is not limited to, costs, and impacts on the stormwater and
wastewater agencies and benefits to the receiving waters that would result from pilot projects that divert
and treat dry weather runoff and first flush flows. The 2010 Annual Report is to summarize the feasibility
evaluation, including:
Selection criteria leading to the identification of five candidate and five alternate pump stations;
Time schedules for conducting pilot studies; and
A proposed method for distributing mercury and PCBs load reductions to participating wastewater
and stormwater agencies..
Selection criteria have been developed based on a review of other programs that have scoped and/or
implemented urban runoff diversion projects and discussions with stormwater program representatives.
The Selection criteria are intended to inform the selection of sites (i.e., pump stations) for potential
diversion and framed around water quality needs, the broader regional context of pilot-testing a variety
of pollutant control strategies in the Bay Area, and acceptability, as summarized in Table ES-1 below.
Maps of PCB concentrations in sediments, pump station locations, and POTW service areas are included
in this report to assist with the needs criterion. Guidance is also provided for addressing the
acceptability criteria. Tools for developing cost estimates and estimating potential load reductions of
PCBs and Hg from stormwater discharges as a result of pilot diversion projects are also included.

Pump Station Diversions Feasibility Evaluation Executive Summary
ES-2
DRAFT for review purposes only. Use of contents on this sheet is subject to the limitations specified at the end of this document.
G:\Engineering and Construction\Flood\CleanWater\Arleen\Regional\BASMAA\Regional permit\POCs\General C11 & C12\C.11-12f-diversions\Draft FINAL -Pump
Station FER 9-13-2010.doc
Table ES-1. Proposed Selection Criteria and Information Needed
Criteria Information Needed
Needs
Will the project yield a significant PCB load reduction?
PCB concentrations in sediments from the local drainage;
Pump station inventories in GIS and tabular formats
Event-mean PCB concentrations in stormwater;
TSS and flow measurements;
Drainage area assessments
Will the project provide unique or new information? Peer review from Technical Oversight Committee
Does a pilot project fit into the broader regional context of pilot-
testing a range of pollutant control strategies, including pollution
prevention, site remediations, enhanced sediment management,
and stormwater treatment retrofitting strategies?
Peer review from Technical Oversight Committee
Costs and
Alternatives
Are the capital and operation and maintenance costs associated
with diversion prohibitive?
Site investigations
Conceptual designs and drawings
Preliminary site-specific cost estimates
Treatment and connection costs/charges.
Are there ways to control upstream sources of PCBs through
remediation, removal, isolation, or run-on diversion? Source identification studies
Peer review from Technical Oversight Group
Site investigations, including right-of-way mapping Can onsite treatment or infiltration retrofits be implemented?
Acceptability
Is there an accessible POTW willing and able to provide treatment
service?
POTW service area map
Communication with POTW managers
Can the pilot diversion be sited within acceptable design criteria? Pre-design checklist assessment (Table 1)
The cost and load estimating tools were applied to three hypothetical scenarios: a constructed pilot
diversion, a temporary pilot diversion, and a strategic conveyance system cleanout pilot project. The
constructed pilot diversion scenario resulted in an estimated PCB load reduction of 1.6 grams per year
discharged to the Bay at a one-time cost of $750,000; over twenty years this would reduce 32 grams of
PCBs at a cost of $23,500 per gram of PCBs removed; the cost per gram would increase if the
hypothetical pilot diversion were to be terminated in less than twenty years. The temporary pilot
diversion scenario resulted in an estimated one-time load reduction of 0.11 grams discharged to the
Bay, at a cost of $180,000, or $1,600,000 per gram of PCBs removed in total. The strategic conveyance
system cleanout scenario resulted in an estimated one-time load reduction of 0.095 grams of PCBs per
year, at a cost of $28,000, or $300,000 per gram of PCBs removed in total. All three of these scenarios
represent fractionally small (0.0006 to 0.008 percent) amounts of the total estimated stormwater PCB
load currently discharged to the Bay (20 kg). Those hypothetical costs all reflect the simplifying
assumption that the receiving POTW waives treament fees.
The simplifying assumption that a POTW waives treatment fees is, in fact, unlikely. In most cases,
wastewater and stormwater programs are funded through separate sources, and so institutional factors
may make such a waiver problematic. Connection fees typically range from $9,000 to $18,000 per
thousand gallons per day, and treatment fees typically range from $300 to $2,400 per MG treated. As a
result, these cost estimates for the hypothetical scenarios are llikely underestimated. Other charges
may also be assessed, such as East Bay MUD’s “wastewater capacity fee” of at least $97.40 per 100
cubic feet per month, or $130,000/MG/month.
The report concludes with a proposed approach to distribute credit for load reductions to participating
stormwater programs and POTWs, and a proposed preliminary schedule for pilot project implementation.
1-1
DRAFT for review purposes only. Use of contents on this sheet is subject to the limitations specified at the end of this document.
G:\Engineering and Construction\Flood\CleanWater\Arleen\Regional\BASMAA\Regional permit\POCs\General C11 & C12\C.11-12f-diversions\Draft FINAL -Pump
Station FER 9-13-2010.doc
Section 1
Background
This Feasibility Evaluation Report (FER) fulfills reporting requirements for Fiscal Year 2009/10 under
provisions C.11.f and C.12.f of the Municipal Regional Stormwater National Pollutant Discharge
Elimination System (NPDES) Permit (Order No R2-2009-0074), more commonly referred to as the
Municipal Regional Permit (MRP). Provisions C.11.f and C.12.f of the MRP are nearly identical provisions
for control of mercury (C.11) and polychlorinated biphenyls (PCBs) (C.12) that require the evaluation of
pilot diversions to publicly owned treatment works (POTWs) of dry weather urban runoff and/or first flush
events from stormwater pump stations. The pilot projects are being evaluated in parallel with other BMP
pilot implementation projects, including stormwater treatment retrofits, sediment management pilot
projects, and source investigations to identify contaminated sites. The first product required under these
provisions is a feasibility evaluation to be included in the 2010 Annual Reports for each Permittee. The
feasibility evaluation is to include, but is not limited to, costs, and impacts on the stormwater and
wastewater agencies and benefits to the receiving waters that would result from pilot projects that divert
and treat dry weather runoff and first flush flows. The 2010 Annual Report is to summarize the feasibility
evaluation, including:
Selection criteria leading to the identification of five candidate and five alternate pump stations;
Time schedules for conducting pilot studies; and
A proposed method for distributing mercury and PCBs load reductions to participating wastewater
and stormwater agencies.
The data sources, computational tools, and recommendations of this report are intended to guide
municipal Permittees in the selection and scoping of stormwater pilot diversion pilot projects. This
section presents a brief overview of the problem statement and planning context of the pilot diversion
concept. The second section summarizes the approach to develop this Feasibility Evaluation Report
(FER). The third section summarizes the findings in regard to:
Selection criteria to inform site selection
Cost/benefit analysis of three example scenarios
A framework for crediting load reductions attained
Information tools available
Opportunities and constraints
The fourth section of the report briefly summarizes for Permittees how the tools in this report can be
used to scope out candidate pump station pilot diversion projects. The report concludes with a proposed
preliminary schedule for selection of candidate pump stations and development and implementation of
pilot project studies.
1.1 Problem Statement
Bay Area storm water dischargers have been required to implement significant reductions in the annual
loads of mercury and polychlorinated biphenyls (PCBs) discharged to San Francisco Bay (the Bay) from
areas served by municipal separate storm sewer systems (MS4s). The requirements have been
established as wasteload allocations (WLAs) in the Total Maximum Daily Load (TMDL) plans for mercury
and PCBs in the Bay adopted by the San Francisco Bay Regional Water Quality Control Board

Pump Station Diversions Feasibility Evaluation Section 1
1-2
DRAFT for review purposes only. Use of contents on this sheet is subject to the limitations specified at the end of this document.
G:\Engineering and Construction\Flood\CleanWater\Arleen\Regional\BASMAA\Regional permit\POCs\General C11 & C12\C.11-12f-diversions\Draft FINAL -Pump
Station FER 9-13-2010.doc
(SFB-RWQCB 2006; SFB-RWQCB, 2008). The mercury TMDL requires a two-fold reduction in the annual
average mass of mercury discharged from urban stormwater, from the current estimated load of
160 kg/yr down to 82 kg/yr by the year 2026. The PCBs TMDL requires approximately a tenfold
reduction in the annual average mass of PCBs discharged from all stormwater1 (i.e., urban and non-
urban), from 20 kg/yr down to 2 kg/yr by the year 2028.
Those numeric load reduction targets are important to keep in mind when evaluating the load reduction
benefit of any specific pilot project and comparing to other alternatives for PCB load reduction. They also
show that PCB load reduction is the driver for planning control measure implementation, because the
reductions required are larger than those of mercury. For this reason, SFB-RWQCB staff has guided Bay
Area Stormwater Management Agencies Association (BASMAA) members to plan pilot projects with a
focus on PCB load reductions, and report the mercury load reductions attained by those same pilots.
Following that guidance, this FER focuses on PCBs for planning and scoping pump station pilot diversion
projects; parallel load reduction calculations for mercury are included for completeness with the MRP
requirements.
The MRP states that the objectives of the pilot diversion pilot studies are to:
Evaluate the reduced loads of PCBs and mercury from diversion of dry weather and first flush urban
runoff to sanitary sewers;
Gain knowledge and experience to determine the implementation level of urban runoff diversion in
subsequent permit terms; and
Document the knowledge and experience gained through pilot implementation.
The pilot diversion projects that would result from this study are not expected to be the sole, or even
most significant, actions to implement reductions in discharges for the PCBs TMDL. Although pilot
diversions are expected to yield some quantifiable pollutant load reduction benefit, the most significant
benefit of the pilot projects is the lessons learned about key management questions:
Can pilot diversion of first flush and/or dry weather urban runoff significantly reduce stormwater
loads of PCBs?
What is the cost per gram of PCBs removed by the pilot diversion approach?
How does that cost per gram for pilot diversion compare to alternatives such as pollution prevention,
remediation of contaminated sites, strategies to enhance pollutant removal during sediment
management, and stormwater treatment retrofits?
What are the technical, regulatory, and institutional challenges to stormwater diversion into POTWs
for the purposes of reducing PCB loads?
What would motivate a POTW to accept stormwater for treatment?
Answering these management questions is beyond the scope of this FER. The questions above establish
a framework for the final report on the pilot projects.
1 The PCBs TMDL assumes that the non-urban contribution of PCBs is relatively small, i.e., < 0.1 kg/yr, compared to the urban
contribution. If this assumption is correct, then the requirement for a 90 percent load reduction from “all stormwater sources”
would have essentially the same outcome as requiring a 90 percent load reduction from urban stormwater.

Pump Station Diversions Feasibility Evaluation Section 1
1-3
DRAFT for review purposes only. Use of contents on this sheet is subject to the limitations specified at the end of this document.
G:\Engineering and Construction\Flood\CleanWater\Arleen\Regional\BASMAA\Regional permit\POCs\General C11 & C12\C.11-12f-diversions\Draft FINAL -Pump
Station FER 9-13-2010.doc
1.2 Planning Context
It is important to understand the overall planning context of this FER. Pilot diversion projects are but one
facet of a broader control strategy for PCBs and mercury that involves many different activities (Figure
1-1). The implementation plans for the PCBs and mercury TMDLs are adaptive – lessons learned during
the first decade of implementation will guide future emphasis on projects and activities that have
relatively greater efficacy per unit cost. Projects required of stormwater dischargers to adaptively
implement the mercury and PCBs TMDLs are specified in provisions of the MRP, and are briefly
summarized below.
Load reductions expressed as WLAs in a TMDL are implemented by the SFB-RWQCB through provisions
in adopted NPDES permits. For Bay Area stormwater dischargers, the MRP requires four general types of
pilot projects and activities to show progress towards attaining WLAs for PCBs and mercury: pollution
prevention, remediation of contaminated sites, strategies to enhance pollutant removal during sediment
management, and stormwater treatment.
Pollution prevention activities focus on stopping PCBs and mercury from getting into stormwater in the
first place. Pollution prevention for mercury focuses on collection and recycling of mercury-containing
products (Provision C.11.a of the MRP). Pollution prevention for PCBs focuses on industrial inspections
(Provision C.12.a), such as the evaluation and prevention of PCB release from building materials such as
caulk (Provision C.12.b).
Remediation of contaminated sites and strategies to enhance pollutant removal during sediment
management rely on the fact that both mercury and PCBs tend to be associated with sediments.
Monitoring studies have shown that PCB concentrations are heterogenous throughout the San Francisco
Bay area. Substantial concentrations of PCBs in sediments (e.g, 1 mg/kg up to 90 mg/kg) may be found
today in flood control conveyances downstream of areas where PCBs were historically used and/or
released (Yee and Mckee, 2010)2. The report by Yee and Mckee (2010) also pointed out that in many
cases, identification of high PCB concentrations in sediments at one location would indicate that a
“halo” of elevated PCB concentrations in sediments may be found within approximately 2500 meters of
the contaminated site. Provisions C.11.c and C.12.c require pilot projects to investigate and remediate
on-land locations with elevated PCB and mercury concentrations in sediment.
Provisions C.11.d and C.12.d require pilot projects to develop and pilot-test methods to enhance
removal of sediment with PCBs and mercury, mainly during existing municipal street and storm drain
system operation and maintenance activities. These provisions also require consideration of street
flushing and routing to the sanitary sewer, an approach that overlaps with one of the scenarios
evaluated in this FER (stormwater conveyance cleanouts). In addition to managing contaminated
sediments through street sweeping and cleanouts of stormwater conveyances, it will be important to
focus efforts on removing or capping in-place sources of contaminated sediments to streets and
stormwater conveyances.
Stream maintenance and ecosystem restoration projects in streams and baylands at times involve
sediment removal and/or stream bank stabilization. To the extent that those activities also remove or
isolate in place contaminated sediment, they provide a load reduction benefit to the Bay. Conversely, if
stream maintenance or ecosystem restoration projects mobilize previously isolated contaminated
sediments, those activities would increase contaminant loads to the Bay.
2 The summary report by Yee and Mckee compiles data from studies including: Applied Marine Sciences (AMS) Inc. (2002a);
AMS 2002b; AMS, 2007; EOA (20002a); EOA (2002b); EOA (2002c); EOA (2003a); EOA (2003b); EOA (2004); EOA (2007a);
EOA (2007b); and Klienfelder (2006). Those original reports are available in the supplemental CD provided with this FER.

Pump Station Diversions Feasibility Evaluation Section 1
1-4
DRAFT for review purposes only. Use of contents on this sheet is subject to the limitations specified at the end of this document.
G:\Engineering and Construction\Flood\CleanWater\Arleen\Regional\BASMAA\Regional permit\POCs\General C11 & C12\C.11-12f-diversions\Draft FINAL -Pump
Station FER 9-13-2010.doc
Stormwater treatment may be beneficial in situations where it is too late to prevent on-land pollution,
and defined, controllable source areas cannot be identified. Stormwater treatment can include designing
and constructing dedicated treatment retrofits to serve contaminated catchments. Pilot treatment
retrofits are required under Provision C.11.e for mercury and C.12.e for PCBs.
MRP Provisions C.11/12.c., d., and e. are being implemented through a regional collaboration that is
funded through a grant from the United States Environmental Protection Agency, with local cost matches
(BASMAA, 2010). Alternatively, stormwater treatment can be accomplished by existing POTWs, if
diversion and conveyance systems can be feasibly constructed and a local POTW can be identified that
is willing and able to provide treatment services. That approach is required by Provision C.11.f for
mercury and C.12.f for PCBs, and this approach is the focus of this FER.
Figure 1-1. Conceptual Illustration of Pilot Stormwater Diversion to POTW Projects in Context with Other Potential
Control Strategies

2-1
DRAFT for review purposes only. Use of contents on this sheet is subject to the limitations specified at the end of this document.
G:\Engineering and Construction\Flood\CleanWater\Arleen\Regional\BASMAA\Regional permit\POCs\General C11 & C12\C.11-12f-diversions\Draft FINAL -Pump
Station FER 9-13-2010.doc
Section 2
Approach
2.1 BASMAA Technical Oversight
This report has been prepared under the direction of BASMAA representatives. The scope of work was
developed through a series of discussions at BASMAA Monitoring and Pollutants of Concern (MPC)
committee meetings in January through March, 2010. Staff and Permittees from each countywide
stormwater program began meeting once a month in June 2010 to provide technical oversight to
development of this FER. This Technical Oversight Committee (TOC) will continue to advise Permittees
who are scoping and implementing pilot diversion projects. The primary role of TOC during the
implementation stage will be to provide consistency in effectiveness evaluation methods and peer
review on the value of new information expected from pilot projects and the merits of diversion pilots as
compared to other pollutant control alternatives possible at the proposed locations. The TOC for this FER
also has considerable overlap with the Clean Watershed for a Clean Bay (CW4CB) grant project,
providing coordination between the two experts.
2.2 Information gathered
In general, two types of information were gathered and compiled for this report: information on
contaminated sediments in the Bay Area, and information about urban runoff diversion into POTWs. In
addition, geographic information systems (GIS) data were made available by the San Francisco Estuary
Institute (SFEI) upon completion of their Proposition-13 funded study focused on urban runoff best
management practices (Yee and Mckee, 2010). Concentrations of PCBs in sediments have been
superimposed on locations of pump stations and POTWs to assist in the selection of candidate locations.
Maps of POTW service areas are provided alongside the GIS representations to further assist the
selection3.
2.3 Approach to Development of Selection Criteria
The approach to developing the draft selection criteria starts by looking at other programs that have
scoped and/or implemented urban runoff diversion projects. The approach builds on the thought
process worked out by other programs by addressing the following questions:
What selection criteria have been used by other programs to evaluate the feasibility of urban runoff
diversions into treatment plants?
What are the most appropriate selection criteria for projects in the San Francisco Bay region that
would meet the requirements of Provision C.11.f/C.12.f? Selection criteria should address relevant
pump station and POTW characteristics and institutional barriers/incentives.
What regional and site information is needed to evaluate a project using the selection criteria?
What specific regional information is currently available that would enable use of the selection
criteria?
3 Note to BASMAA reviewers: GIS layers of POTW service areas have been recently acquired and, at the direction of the
oversight committee for this report, can be incorporated directly onto the maps of contaminated sediments and pump station
locations.

Pump Station Diversions Feasibility Evaluation Section 2
2-2
DRAFT for review purposes only. Use of contents on this sheet is subject to the limitations specified at the end of this document.
G:\Engineering and Construction\Flood\CleanWater\Arleen\Regional\BASMAA\Regional permit\POCs\General C11 & C12\C.11-12f-diversions\Draft FINAL -Pump
Station FER 9-13-2010.doc
What are the known data gaps?
How would a program that is scoping a diversion project address the data gaps?
2.3.1.1 Selection criteria used by other programs
This section summarizes selection criteria used to scope and/or implement pilot diversion projects from
three case studies: California Beach communities, the Las Vegas Valley, and the California Department
of Transportation.
2.3.1.1.1 California Beach Communities
During the information gathering stage of this project, the following California communities were
identified that have developed diversion programs:
Orange County
San Diego County
Los Angeles County
Ventura County
Monterey County
Santa Cruz County
All of the counties above have beach communities. Essentially all of the dry weather diversion projects
carried out in those communities have been motivated by the need to reduce or eliminate sources of
bacteria to beaches and other areas used for water contact recreation. Of the programs reviewed, the
Orange County Watersheds (2003) report was the only one which provided detailed documentation of
their selection (or decision) criteria. The flowchart illustrating the decision criteria for dry weather
diversions in Orange County is shown in Figure 1.
The Orange County selection criteria thought process illustrated in Figure 1 starts by screening against
the two following general questions about dry weather discharges in coastal watersheds:
Is there a water quality impairment to be addressed?
Are there source control or treatment alternatives to dry weather diversions?
If the answers are yes, there is a water quality impairment and no, there are no better alternatives such
as source control or onsite treatment, then the site is assessed against acceptability criteria for diversion
into the Orange County Sanitation District conveyance and treatment system. Acceptability criteria used
in Orange County Watersheds (2003) are:
Local conveyance and treatment capacity;
Potential to impact recreation or habitat by diversion;
Other community and/or regulatory concerns.
As noted above, the Orange County Watersheds (2003) report is the most formal documentation of
diversion selection criteria available. Interviews with project stakeholders from some of the above beach
communities (e.g., City of Santa Cruz, Orange County Sanitation District), were conducted during the
development of a draft Selenium Management Plan for Las Vegas Wash (Brown and Caldwell, 2009a). In
addition, stakeholders involved in dry weather diversions in the cities of Los Angeles and Ventura were
interviewed during the development of a white paper on urban runoff diversions on behalf of the Bay
Area Clean Water Agencies (Carollo, 2009). Those stakeholder interviews tend to support the more
formal acceptability criteria, as outlined above.

Pump Station Diversions Feasibility Evaluation Section 2
2-3
DRAFT for review purposes only. Use of contents on this sheet is subject to the limitations specified at the end of this document.
G:\Engineering and Construction\Flood\CleanWater\Arleen\Regional\BASMAA\Regional permit\POCs\General C11 & C12\C.11-12f-diversions\Draft FINAL -Pump
Station FER 9-13-2010.doc
Figure 2-1. Decision Tree for Dry Weather Diversion Consideration in Orange County, California.
From Orange County Stormwater Program (2003)

Pump Station Diversions Feasibility Evaluation Section 2
2-4
DRAFT for review purposes only. Use of contents on this sheet is subject to the limitations specified at the end of this document.
G:\Engineering and Construction\Flood\CleanWater\Arleen\Regional\BASMAA\Regional permit\POCs\General C11 & C12\C.11-12f-diversions\Draft FINAL -Pump
Station FER 9-13-2010.doc
2.3.1.1.2 Las Vegas Valley
The draft Las Vegas Wash Selenium Management Plan (Brown and Caldwell, 2009a) followed an overall
thought process similar to Southern California beach diversion projects, starting with water-quality needs
and source area opportunities, and subsequently screening opportunity areas against capacity,
constructability, cost, and community acceptance criteria. In the case of the Las Vegas Wash, the
pollutant of concern was selenium in a desert wetland ecosystem, rather than bacteria in waters of
swimmable beaches. The interest in reducing selenium loads was as a mitigation measure for the
construction of an effluent bypass pipeline project to a deepwater outfall at Lake Mead. If constructed,
the pipeline would generate electric power from the elevation drop to Lake Mead, and it would remove
treated wastewater discharges from the Las Vegas Wash. These discharges provide dilution of selenium
concentrations within existing groundwater seepage that enters the wash. Consequently, a means of
reducing selenium loads via diversion of dewatering and seepage flows from tributaries of the wash into
wastewater treatment plants would add value to the project by enabling diversion of relatively larger
effluent flows from Las Vegas Wash into the pipeline, thereby creating relatively more electric power
while concurrently reducing surface water impacts of treated effluent to Lake Mead, as the pipeline
would allow discharge at the bottom of the lake.
The selection criteria led to diversion of selenium seepage sources into treatment plants from the base
of watersheds as the most cost-effective alternative, because of the economic value of water flowing
through the proposed bypass pipeline. The plan accounted for uncertainty in the alternatives analysis by
proposing an adaptive approach that would initiate the more straightforward diversion projects in initial
stages, while concurrently evaluating the feasibility of reducing seepage flows by changes in upland
irrigation management practices or installation of onsite treatment or upstream diversion projects. The
adaptive management decision tree proposed in the draft Las Vegas Wash Selenium Management Plan
is illustrated in Figure 2-2 below.
Owing to declining economic conditions in the Las Vegas Valley, the bypass pipeline project has been put
on hold (i.e., shelved); therefore, the draft Selenium Management Plan has not advanced beyond the
planning and conceptual design/cost estimating stage. The draft plan does offer useful preliminary
design and cost estimating concepts for large scale (i.e., 1 to 6 mgd) diversion projects involving varying
levels of complexity in conveyance system design.

Pump Station Diversions Feasibility Evaluation Section 2
2-5
DRAFT for review purposes only. Use of contents on this sheet is subject to the limitations specified at the end of this document.
G:\Engineering and Construction\Flood\CleanWater\Arleen\Regional\BASMAA\Regional permit\POCs\General C11 & C12\C.11-12f-diversions\Draft FINAL -Pump
Station FER 9-13-2010.doc
> 70 mgd
< 70 mgd
Stage 2:
Monson and
Flamingo base
of watershed
diversions
Stage 3:
Duck
Creek base
of
watershed
diversion60 – 90
mgdEnterprise?
No
Yes Stage 3:
Pittman
Wash base
of watershed
diversion
30 – 50
mgd
40 – 60
mgd
$ / MG
upstream ≥
downstream?
Yes
No
Stage 2:
Monson base of
watershed, Flamingo
upstream diversions
Stage 2:
Monson and
Flamingo base of
watershed diversions
30 – 50 mgd
Duck Creek
Benefit >
Cost?
Yes
No
Consider implementing
smaller upstream
diversions and/or irrigation
reduction approach in Duck
Creek watershed
50 – 65 mgd
Minimum
Effluent flow
to attain
5 µg/L?
Will additional flow reductions
cause wildlife impairment or
other problems?
Stage 1:
Flow reduction &
monitoring
Yes
85 – 105 mgd
Remain in
Stage 185 – 105 mgd
No
60 – 90 mgd
Figure 2-2. Adaptive Management Decision Tree for the Las Vegas Wash Selenium Management Plan. Numbers associated with each arrow represent the estimated minimum effluent flow range (mgd) to attain 5 µg/L water quality standard at the
completion of each stage. The goal of the plan is to attain the lowest possible effluent flow, while maintaining selenium concentrations below
the water quality standard. Underlined numbers represent the estimated minimum effluent flow ranges at the completion of Plan
implementation. Dashed boxes indicate decision points. Shaded boxes indicate the likely course of action based on current information.
2.3.1.1.3 The California Department of Transportation (Caltrans)
The Caltrans Stormwater Quality Handbooks’ Project Planning and Design Guide (PPDG) defines a
regimented process for selection of structural BMPs during the design process for major projects.
Selection criteria are defined by the “T-1 Checklist,” which appears in Appendix E of the PPDG. If dry
weather flows are present, designers are to consider dry weather diversions. Figure 2-3 below shows the
feasibility and design criteria used in the Caltrans design process to consider dry weather diversions. The
Caltrans example is a useful starting point for informing more detailed selection analysis of siting and
design feasibility.
One example of a dry weather diversion constructed by Caltrans is the Jamboree Road overcrossing near
Interstate 5 in Orange County. In that location, dewatering discharges are sent to the Orange County
Sanitation Disrtict because of concerns over nitrogen and selenium in San Diego Creek. An example of
temporary diversions by Caltrans is the Caldecott Tunnel, connecting Alameda County and Contra Costa
County. Power washing discharges from the tunnel are diverted to the East Bay Municipal Utility District.

Pump Station Diversions Feasibility Evaluation Section 2
2-6
DRAFT for review purposes only. Use of contents on this sheet is subject to the limitations specified at the end of this document.
G:\Engineering and Construction\Flood\CleanWater\Arleen\Regional\BASMAA\Regional permit\POCs\General C11 & C12\C.11-12f-diversions\Draft FINAL -Pump
Station FER 9-13-2010.doc
Dry Weather Flow Diversion
Feasibility
1. Is a Dry-Weather Flow Diversion acceptable to a Publicly Owned Treatment Works (POTW)? Yes No
2. Would a connection require ordinary (i.e., not extraordinary) plumbing, features or construction methods to implement? Yes No
If “No” to either question above, Dry Weather Flow Diversion is not feasible.
3. Does adequate area exist within the right-of-way to place Dry Weather Flow Diversion devices? If “Yes”, continue to Design Elements sections. If “No”, continue to Question 4.
Yes No
4. If adequate area does not exist within right-of-way, can suitable, additional right-of-way be acquired to site Dry Weather Flow Diversion devices and how much right-of-way would be needed? _________ (acres) If “Yes”, continue to the Design Elements section.
If “No”, continue to Question 5.
Yes No
5. If adequate area cannot be obtained, document in Section 5 of the SWDR that the inability to obtain adequate area prevents the incorporation of this Treatment BMP into the project.
Complete
Design Elements
* Required Design Element – A “Yes” response to these questions is required to further the
consideration of this BMP into the project design. Document a “No” response in Section 5 of the SWDR to describe why this Treatment BMP cannot be included into the project design.
** Recommended Design Element – A “Yes” response is preferred for these questions, but not required
for incorporation into a project design.
1. Does the existing sanitary sewer pipeline have adequate capacity to accept
project dry weather flows, or can an upgrade be implemented to handle the
anticipated dry weather flows within the project’s budget and objectives? *
Yes No
2. Can the connection be designed to allow for Maintenance vehicle access? * Yes No
3. Can gate, weir, or valve be designed to stop diversion during storm events? * Yes No
4. Can the inlet be designed to reduce chances of clogging the diversion pipe or
channel? *
Yes No
5. Can a back flow prevention device be designed to prevent sanitary sewage from
entering storm drain? * Yes No
Figure 2-3. Feasibility and Design Criteria Used by Caltrans for Dry Weather Diversions.
From the December 2008 Update of the Caltrans PPDG, Appendix E, T-1 Checklist Part 3
Feasibility Question #2 in Figure 2-3 above references “extraordinary plumbing.” By way of example, the
Caltrans PPDG defines extraordinary plumbing:

Pump Station Diversions Feasibility Evaluation Section 2
2-7
DRAFT for review purposes only. Use of contents on this sheet is subject to the limitations specified at the end of this document.
G:\Engineering and Construction\Flood\CleanWater\Arleen\Regional\BASMAA\Regional permit\POCs\General C11 & C12\C.11-12f-diversions\Draft FINAL -Pump
Station FER 9-13-2010.doc
“Sites requiring extraordinary plumbing to collect and treat runoff (e.g., jacking operations under
a highway, bridge deck collection systems, etc.) may be considered infeasible due to their
associated costs. Sites requiring extraordinary features or construction practices, such as
retaining walls and shoring, may also be infeasible due to their associated costs relative to the
cost of the BMP itself.”
Other than those examples of extraordinary plumbing, the wording of the PPDG is deliberately broad to
allow the designer and the District Stormwater Coordinator lattitude to make design decisions.
In summary, the most well-documented programs of urban runoff diversion into sanitary conveyance and
treatment systems involve dry weather diversions of urban runoff. In both the California beaches and Las
Vegas Wash examples discussed above, the evaluation criteria started with water quality needs, then
looked for alternatives to diversion to POTWs, and then screened diversions against acceptability criteria
including conveyance and treatment capacity, constructability, cost, and community/regulatory
acceptance. In the Caltrans example, the selection criteria reviewed focused on feasibility and
constructability. Some important distinctions that set the above examples apart from this FER are:
The tangible benefits of reducing beach closures or harvesting water in a desert may be more
immediate and apparent to municipal decision makers than the concept of reducing PCB loads to the
Bay; and
The technical challenges of capturing and treating first flush and other stormwater flows would
require some refinements to selection criteria to be used in this FER.
With those distinctions in mind, Section 3.1 in the Findings section below builds on the framework of
“needs, alternatives, acceptability” to propose screening criteria to be used in this FER.
2.4 Approach to Develop Cost/Benefit Analysis
2.4.1 Cost Estimating Tools
Cost estimates for pilot diversions can be divided into two categories: capital costs, and operations and
maintenance (O&M) costs.
Capital cost estimates for each component of a pilot diversion project are shown in Table 2-1. The
estimates were developed from existing case studies for different agencies. These estimates are
provided to illustrate ranges and will vary substantially depending on the agency and pump station
location. Construction materials and labor will vary depending on the type of pilot diversion to be
constructed. A pilot diversion which requires no additional pumps and is adjacent to a sanitary sewer line
with excess capacity will have relatively small construction costs, while a pilot diversion which requires
large quantities of large diameter pipe will cost much more. Connection fees will also vary depending on
the sanitation agency and location of the pilot diversion. Diversions to POTWs with excess plant and
sanitary sewer capacity will cost less than locations which require upgrades to sanitary sewers and
treatment plants. Right-of-way (ROW) acquisition would depend on the type and quantity of land which is
acquired. For the purposes of this analysis, it is assumed that ROW acquisition (or overly complex
easement agreements) or treatment plant upgrades would lead to the conclusion that a pilot diversion
project is not feasible. Supervisory control and data acquisition (SCADA) control costs will vary depending
on the type of monitoring and control equipment specified. Some form of monitoring and controls would
likely be required in all cases.

Pump Station Diversions Feasibility Evaluation Section 2
2-8
DRAFT for review purposes only. Use of contents on this sheet is subject to the limitations specified at the end of this document.
G:\Engineering and Construction\Flood\CleanWater\Arleen\Regional\BASMAA\Regional permit\POCs\General C11 & C12\C.11-12f-diversions\Draft FINAL -Pump
Station FER 9-13-2010.doc
Table 2-1. Planning Cost Estimates for Pilot Diversion Project Components
Component Cost Range ($1000’s) Factors Affecting Cost
Construction Materials and Labor 25 – 750 Type of pilot diversion, length
Connection Fees 9 – 18/1,000 gpd Sanitary sewer capacity, plant capacity, sanitary sewer
ordinance requirements, discharge/sanitary sewer use fees
Right of Way Variable Size, land use, location
SCADA/Safety Controls 10 – 50 Type of monitoring/control
Capital Support (Permits, Planning and Design) 40 percent of construction costs Complexity of diversion
Cost estimates based on information from Brown and Caldwell (2009a); Brown and Caldwell (2009b); Sacramento Stormwater Quality
Partnership (2006); Orange County Stormwater Program (2003); San Francisco Estuary Partnership (2010).
Another significant consideration affecting capital costs would be the need to re‐route existing utilities to
accommodate the diversion. This has been a major cost factor in determining acceptable locations for
treatment measures targeted at other pollutants, e.g. large in-line trash capture devices. For the
purposes of this FER, those additional costs are not considered for pilot projects, as significant re-routing
is assumed to be outside the scope of a pilot project.
O&M Costs are primarily related to the annual cost of electricity to operate pumps (if needed),
monitoring the diversion to ensure proper function, scheduled and emergency maintenance of pumps
and diversion structure, and the treatment fees established by the receiving POTW. Cost estimates for
these activities and items are summarized in Table 2-2 below. The annual costs of electricity, inspections
and maintenance are derived from monthly O&M costs reported by the Orange County Stormwater
Program (2003) for small diversions ranging from 0.01 MGD to 0.3 MGD. By comparison, the
Sacramento Stormwater Quality Partnership (2006) estimated annual O&M costs of $40,000 for
similarly sized diversions. The lower range of treatment fees is based on the estimated “chemicals and
electricity only” costs for a large Las Vegas Valley treatment plant estimated by Brown and Caldwell
(2009a). The upper range is based on the “whole plant operational costs” estimated by Brown and
Caldwell (2009a). The actual fee charged will depend on the individual POTW, and the jurisdictional
relationship between the POTW and the stormwater discharger and local sanitary sewer use ordinance
requirements. For comparison, treatment fees estimated by the Sacramento Stormwater Quality
Partnership (2006) are approximately $340 per MG treated; The San Jose /Santa Clara Water Pollution
Control Plant reports O&M costs of approximately $400 per MG treated.
Table 2-2. Planning O&M and Treatment Cost Estimates for Pilot Diversion Projects
Pump electricity, inspections and maintenance ($/year) 10,000 – 60,000
Treatment fees ($/MG gallons treated) 300 – 2400
Cost estimates based on information from Brown and Caldwell (2009a); Brown and Caldwell (2009b);
Sacramento Stormwater Quality Partnership (2006); Orange County Stormwater Program (2003).
Electricity costs would be reduced for intermittent pumping, in proportion to the planned run time. For planning
purposes, it can be assumed that a minimum of $5,000 per year is required for inspections and maintenance.
Table 2-3 shows the estimated costs for different potential pilot diversion scenarios. It is important to
note that these cost estimates are based on simplifying assumptions and existing information. Actual
costs can vary heavily depending on site/diversion specific characteristics.
For non-constructed pilot diversions there are no capital costs as the pilot diversion occurs by rented
equipment and hired labor. The operation costs will vary depending on how the pilot diversions are

Pump Station Diversions Feasibility Evaluation Section 2
2-9
DRAFT for review purposes only. Use of contents on this sheet is subject to the limitations specified at the end of this document.
G:\Engineering and Construction\Flood\CleanWater\Arleen\Regional\BASMAA\Regional permit\POCs\General C11 & C12\C.11-12f-diversions\Draft FINAL -Pump
Station FER 9-13-2010.doc
staged. For pilot diversion and cleanouts staged during dry weather, scheduling and availability of
equipment and staff is easier, thus lower costs are achieved, as opposed to increased costs attributed to
mobilizations in response to wet weather events. The expected capital costs of constructed pilot
diversions will vary depending on conveyance distance, pipe size, and if additional hydraulic head is
required to divert stormwater.
Two types of constructed pilot diversions are potentially available. The type employed would depend on
the location of the pump station (Figure 2-4). The one type (Option 1) would involve the installation of an
additional pump (or pumps) within the wet well to divert flow directly to the sanitary sewer. This type of
diversion provides inherent control of the quantity of water that can be diverted to the sanitary sewer,
but involves higher initial costs due to pump station reconfiguration. However, the use of dedicated
pumps selected to match the specific head requirements of the conveyance system would allow that
system to be optimized, i.e., smaller pipe sizes can be used. This could result in cost saving for the
conveyance system, which could be of particular importance for systems that require long conveyance
pipes. Operation and maintenance would vary depending on the type and size of the pilot diversion.
Another option (Option 2) would be a gravity-fed flow system using the existing pumps and capacity of
the station. All stormwater discharged after the pumps would be diverted using only gravity flow to the
sanitary sewer. A weir or other control device would be needed to prevent overloading of the sanitary
sewer during large storm events. This type of pilot diversion requires larger-sized pipes, but no additional
pumps. Gravity flows and passive pilot diversions would require less O&M while larger flows and pumps
would regularly fall on the higher end of the expected range.
Overflow To Receiving Water
To Receiving Water
Gravity Diversionto POTW(+24” Pipe)
Pressure Diversion to POTW (4”-8” Pipe)
Pump Station Pump Station
OverflowWeir
Option 1 Option 2
PumpPump 1 Pump 2
Figure 2-4. Conceptual diagram of two different options for pump station diversions.

Pump Station Diversions Feasibility Evaluation Section 2
2-10
DRAFT for review purposes only. Use of contents on this sheet is subject to the limitations specified at the end of this document.
G:\Engineering and Construction\Flood\CleanWater\Arleen\Regional\BASMAA\Regional permit\POCs\General C11 & C12\C.11-12f-diversions\Draft FINAL -Pump
Station FER 9-13-2010.doc
Table 2-3. Estimated Costs for Different Pilot Diversion Approaches
Pilot Diversion Approach Capital Cost
($1,000) O&M Cost ($1,000/yr)
Non-constructed pilot diversion using all rented equipment for strategic cleanout (7 days duration) 0 28
Non-constructed pilot diversion using all rented equipment in dry weather (90 days duration) 0 360
Non-constructed pilot diversion using all rented equipment in wet weather (30 days duration) 0 180
Constructed pilot diversion adjacent to sanitary sewer large enough to support gravity feed 100 10 – 60
Constructed pilot diversion adjacent to sanitary sewer requiring pumped feed 500 10 – 60
Constructed pilot diversion with moderate connection distance (<500 ft) to sanitary sewer large enough to
support gravity feed 500 – 1,500 10 – 60
Constructed pilot diversion with moderate connection distance (<500 ft) to sanitary sewer via small
diameter conveyance requiring pump 500 – 1,000 10 – 60
Constructed pilot diversion with long connection distance (>500 ft) to sanitary sewer large enough to
support gravity feed 1,500 – 3,000+ 10 – 60
Constructed pilot diversion with long connection distance (>500 ft) to sanitary sewer via small diameter
conveyance requiring pump 500 – 1,500 10 – 60
Temporary pilot diversion costs assume $4,000 per day for labor during dry weather pilot diversions (four person crew) and equipment
(one 20,000 gallon storage tank, three pumps, two support trucks, temporary check dams, and incidental equipment). Temporary pilot
diversion costs are assumed to be 50 percent higher ($6,000 per day) during wet weather because of difficulties introduced by scheduling,
safety and logistics.
2.4.2 Load Estimating Tools
The potential PCB load reduction benefits attainable from pilot diversion projects can be estimated
based on either expected average PCB concentrations in stormwater, or expected average PCB
concentrations in sediments captured by the pilot diversion. This section provides planning tools to
assist with this estimation.
The first approach starts by asking “how much water is expected to be diverted into the POTW,” and
“what is the average PCB concentration in that diverted water?” Water volumes can be estimated from
the design storm perspective and the conveyance and treatment capacity perspective. The design storm
perspective would multiply the catchment area (acres) by the design storm event (inches of rain) to
derive the treatment volume, after unit conversion. However, in most cases, the limiting factor on
treatment volume would be storage, conveyance and treatment capacity. Therefore, it makes most
sense, for scoping purposes, to base treatment volume estimates on constraints established by the
conveyance system, available storage capacity (if any), and limits on the treated volume that are either
set by the POTW or that necessarily result from treatment costs. A similar approach would apply to dry
weather diversions; rather than design storm considerations the flow question for a dry weather
diversion would be “what is the average expected dry weather flow.”
For reference, a typical portable water tank can hold approximately 20,000 gallons. A diversion pump
running at 75 gpm would move approximately 100,000 gallons in a day. If a 50 MGD treatment plant
accepted up to 500,000 gallons of stormwater per day, the pilot diversion would use about 1 percent of
the treatment capacity of the plant. Flows spanning this range are used to estimate loads.
PCB concentrations in stormwater can be estimated based on limited case study information available.
The Ettie Street Pump Station Supplemental Environmental Project report (EBMUD 2010) serves as a
useful benchmark for PCB concentrations in stormwater from a highly contaminated catchment of about
8 square kilometers comprised of mixed urban land uses with a predominantly industrial history. The
report also provides data from Cerrito Creek, which is a similar sized catchment having an open creek in
a suburban location that recieves stormwater flows from upstream residential and commercial areas.

Pump Station Diversions Feasibility Evaluation Section 2
2-11
DRAFT for review purposes only. Use of contents on this sheet is subject to the limitations specified at the end of this document.
G:\Engineering and Construction\Flood\CleanWater\Arleen\Regional\BASMAA\Regional permit\POCs\General C11 & C12\C.11-12f-diversions\Draft FINAL -Pump
Station FER 9-13-2010.doc
Average PCB concentrations in dry weather from the Ettie Street Pump Station ranged from 3 ng/L to
5 ng/L at the pump station, and approximately 1 ng/L at the reference creek (Cerrito Creek).
Average first flush stormwater concentrations ranged from 16 ng/L in Cerrito Creek to as much as
50 ng/L in the first flush and wet weather influent to the Ettie Street Pump Station.
Episodic measurements as high as 200 ng/L were observed.
That concentration range is used as a basis for estimating PCB loads removed by pilot diversions
ranging from 20,000 gallons to 500,000 gallons in Table 2- below.
Table 2-4 highlights the fact that dry weather diversions would not yield substantial load reduction
benefits if the PCB concentrations are relatively low (e.g., 1 ng/L). A dry weather diversion of 0.1 mgd
would yield between 0.0004 to 0.004 grams of PCBs per day, or 0.1 to 1 grams per year if dry weather
flows were pumped 250 days out of the year. That is equivalent to 0.0006 to 0.006 percent of the total
PCB load reduction (18 kg) required from urban stormwater by the TMDL. To attain 10 percent of the
total PCB load reduction (i.e., 1.8 kg), a total of 3.5 billion gallons per year of dry or wet weather runoff
having an average concentration of 50 ng/L would be required.
For storm events that yield higher PCB concentrations in runoff, more substantial load reductions may be
attained. If 100,000 gallons of water having 200 ng/L PCBs were diverted from a single storm event, a
total mass of 0.08 grams of PCBs could be diverted from discharge to the Bay. If 500,000 gallons could
be diverted during a single event, it would be equivalent to 0.4 grams of PCBs, or 0.002 percent of the
18 kg load reduction required of urban stormwater by the TMDL.
The equation used to calculate values in Table 2-4 is:
Table 2-4. PCB Load Estimating Tool (grams)
Diverted Volume (gal)
PCB Concentration in Stormwater (ng/L)
1 10 50 100 200
20,000 0.0001 0.0008 0.0038 0.0076 0.015
50,000 0.0002 0.0019 0.0095 0.019 0.038
100,000 0.0004 0.0038 0.019 0.038 0.076
200,000 0.0008 0.0076 0.038 0.076 0.15
400,000 0.0015 0.015 0.076 0.15 0.31
500,000 0.0019 0.019 0.095 0.19 0.38
1,000,000 0.0038 0.038 0.19 0.38 0.76

Pump Station Diversions Feasibility Evaluation Section 2
2-12
DRAFT for review purposes only. Use of contents on this sheet is subject to the limitations specified at the end of this document.
G:\Engineering and Construction\Flood\CleanWater\Arleen\Regional\BASMAA\Regional permit\POCs\General C11 & C12\C.11-12f-diversions\Draft FINAL -Pump
Station FER 9-13-2010.doc
For context, the expected range of PCB concentrations in stormwater can be estimated based on
assumed concentrations of PCBs in sediments and total suspended sediments (TSS) concentrations
(Figure 2-5). Typical PCB concentrations in sediments within the urban landscape range from 0.1 mg/kg
to 1 mg/kg; contaminated sediments found in localized areas can be as high as 10 mg/kg or more. It is
assumed that highly contaminated sediments would be addressed through sediment management or
site remediation, and that diversion projects would address more diffuse contamination areas where the
average first flush concentration of PCBs on suspended sediments is 1 mg/kg or less. Under typical TSS
concentrations in stormwater (< 500 mg/L), PCB concentrations would tend to be 200 ng/L or less.
0.1
1
10
100
1000
10000
0 200 400 600 800 1000
PC
B (n
g/L
)
TSS (mg/L)
0.1 mg/kg 1.0 mg/kg 10 mg/kg CTR Objective
Figure 2-5. Concentrations of PCB vs. TSS under different assumed concentrations of PCBs in sediment.
Solid line indicates the California Toxics Rule (CTR) water quality objective (0.17 ng/L)
Tools similar to those used for PCBs can also be applied to estimating mercury loads avoided (Table 2-5,
Figure 2-6). The higher range of mercury concentrations in stormwater (< 2,000 ng/L) reflects the
assumption that mercury concentrations in suspended sediments from contaminated areas could be as
high as 10 mg/kg.
This approach to load estimating is used to develop the cost-benefit analysis of example pilot diversion
scenarios in Section 3.2.

Pump Station Diversions Feasibility Evaluation Section 2
2-13
DRAFT for review purposes only. Use of contents on this sheet is subject to the limitations specified at the end of this document.
G:\Engineering and Construction\Flood\CleanWater\Arleen\Regional\BASMAA\Regional permit\POCs\General C11 & C12\C.11-12f-diversions\Draft FINAL -Pump
Station FER 9-13-2010.doc
Table 2-5. Hg Load Estimating Tool (grams)
Diverted
Volume (gal)
Hg Concentration in Stormwater (ng/L)
1 10 50 500 2000
20,000 0.0001 0.0008 0.0038 0.0379 0.1514
50,000 0.0002 0.0019 0.0095 0.0946 0.3785
100,000 0.0004 0.0038 0.0189 0.1893 0.7570
200,000 0.0008 0.0076 0.0379 0.3785 1.5140
400,000 0.0015 0.0151 0.0757 0.7570 3.0280
500,000 0.0019 0.0189 0.0946 0.9463 3.7850
1,000,000 0.0038 0.0379 0.1893 1.8925 7.5700
1
10
100
1000
10000
0 200 400 600 800 1000
Me
rcu
ry (n
g/L
)
TSS (mg/L)
0.5 mg/kg 1.0 mg/kg 10 mg/kg CTR Objective
Figure 2-6. Concentrations of Hg vs. TSS under different assumed concentrations of Hg in sediment.
Solid line indicates the California Toxics Rule (CTR) water quality objective (0.50 ng/L)

3-14
DRAFT for review purposes only. Use of contents on this sheet is subject to the limitations specified at the end of this document.
G:\Engineering and Construction\Flood\CleanWater\Arleen\Regional\BASMAA\Regional permit\POCs\General C11 & C12\C.11-12f-diversions\Draft FINAL -Pump
Station FER 9-13-2010.doc
Section 3
Findings
3.1 Recommended Selection Criteria
This section proposes screening criteria that are developed around the framework of needs, alternatives,
and acceptability outlined in the previous sections. These criteria are intended to inform the selection of
pilot diversion sites, but may not include all considerations that would need to be taken into account as
potential pilot diversion sites are evaluated.
3.1.1 Needs
The overall water quality need is a reduction in the load of PCBs and mercury discharged from urban
areas into the Bay. Guidance from the SFB-RWQCB further specifies that pilot diversion projects should
focus on abating discharges of PCBs from contaminated drainages, and concurrently evaluate the added
value of mercury load reductions achieved by PCB-focused projects. That is, project siting decisions
should be led primarily by PCB loads.
Watershed load reduction goals help put PCB loads into context as a selection criterion. The CW4CB
grant recently awarded to BASMAA sets forth the ambitious goal of reducing PCB loads by 0.3 to 1.5 kg
per year through a series of coordinated investigation, reporting, potential remediation, and treatment
retrofit projects. If the goal is achieved, the load reduction would be about one to seven percent of the
currently estimated 20 kg per year of PCBs discharging from Bay Area urban storm systems.
It is proposed that individual pilot diversion projects that reduce the current PCB load to the Bay by one
percent or more per year (i.e., reduce PCBs by 0.2 kg/yr or more) could be considered meaningful steps
towards attainment of the PCB wasteload allocation for urban stormwater. In contrast, pilot projects that
attained load reductions on the order of 0.01 kg/year (ten grams) or less would not yield significant
progress, by themselves. Small pilots could be useful if they can be cost-effectively replicated numerous
times throughout the watershed, or if they provide information that can be scaled up to evaluate the
costs and benefits of larger projects.4
The selection criteria based on water quality needs are summarized by the following two questions:
Will the project yield a substantial PCB load reduction? An important tool for answering this question is
an understanding of the spatial distribution of PCBs in sediments of the San Francisco Bay watersheds.
The most recently available synthesis of PCB monitoring data is available in the grant-funded study by
Yee et al (2010), titled “Concentrations of PCBs and Hg in soils, sediments and water in the urbanized
Bay Area: Implications for best management.” Figures and tables in that report highlight urbanized areas
of the Bay with the highest PCB concentrations in sediments collected from catch basins and street
curbs.
Provisions C.11.f and C.12.f strongly emphasize existing stormwater pump stations as the most likely
areas for pilot diversion projects. Pump station inventory reports have been submitted to the SFB-
RWQCB and compiled in tabular and GIS formats. Matching areas of high PCB concentrations in
sediments with the known spatial distribution of pump stations is a useful step to efficiently make an
4 The SFB-RWQCB has stated that diversion projects may have other benefits unrelated to PCBs and Hg (e.g., reductions in
discharges of low DO water, bacteria, etc.

Pump Station Diversions Feasibility Evaluation Section 3
3-15
DRAFT for review purposes only. Use of contents on this sheet is subject to the limitations specified at the end of this document.
G:\Engineering and Construction\Flood\CleanWater\Arleen\Regional\BASMAA\Regional permit\POCs\General C11 & C12\C.11-12f-diversions\Draft FINAL -Pump
Station FER 9-13-2010.doc
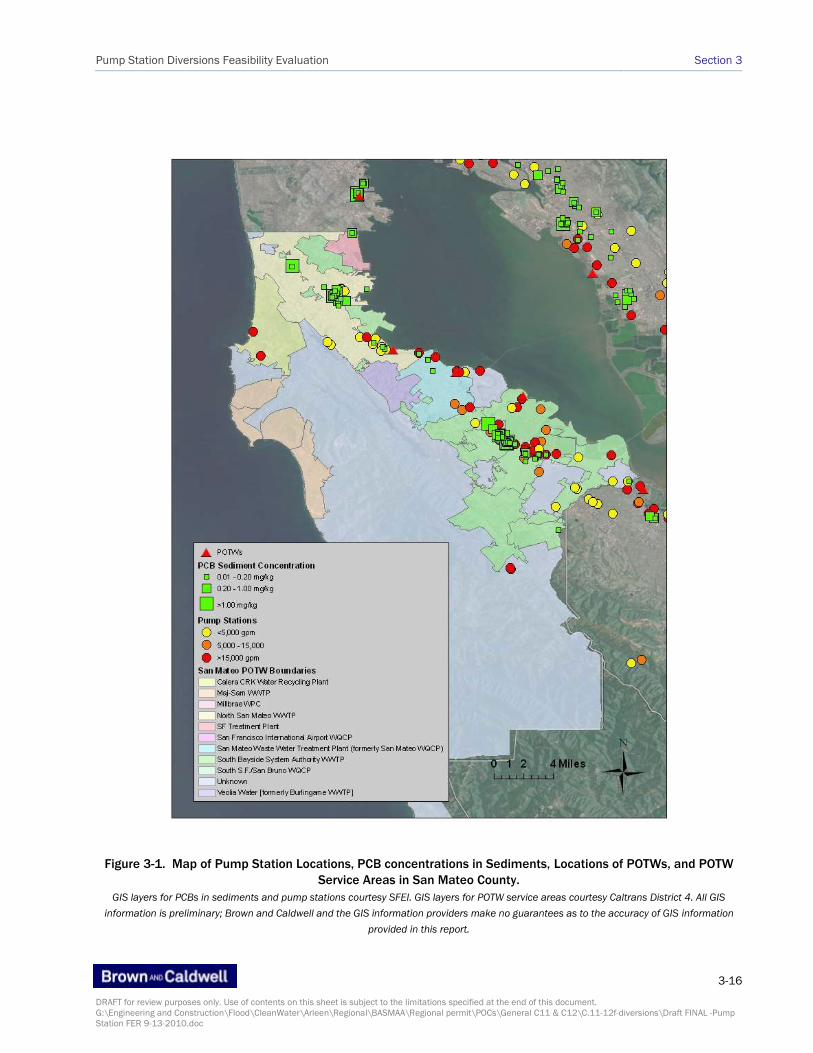
initial screening of likely candidate pump stations based on potential for load reductions. Figures 3-1
through 3-6 below show the locations of pump stations, measured PCB concentrations in storm drain
sediments, and POTW service areas. For illustration purposes, only sediment samples with detectable
PCB concentrations are included in the figures. These planning tools can be used to assist in the
evaluatation of the water quality needs criteria.
Pump Station Diversions Feasibility Evaluation Section 3
3-16
DRAFT for review purposes only. Use of contents on this sheet is subject to the limitations specified at the end of this document.
G:\Engineering and Construction\Flood\CleanWater\Arleen\Regional\BASMAA\Regional permit\POCs\General C11 & C12\C.11-12f-diversions\Draft FINAL -Pump
Station FER 9-13-2010.doc
Figure 3-1. Map of Pump Station Locations, PCB concentrations in Sediments, Locations of POTWs, and POTW
Service Areas in San Mateo County.
GIS layers for PCBs in sediments and pump stations courtesy SFEI. GIS layers for POTW service areas courtesy Caltrans District 4. All GIS
information is preliminary; Brown and Caldwell and the GIS information providers make no guarantees as to the accuracy of GIS information
provided in this report.

Pump Station Diversions Feasibility Evaluation Section 3
3-17
DRAFT for review purposes only. Use of contents on this sheet is subject to the limitations specified at the end of this document.
G:\Engineering and Construction\Flood\CleanWater\Arleen\Regional\BASMAA\Regional permit\POCs\General C11 & C12\C.11-12f-diversions\Draft FINAL -Pump
Station FER 9-13-2010.doc
Figure 3-2. Map of Pump Station Locations, PCB concentrations in Sediments, Locations of POTWs, and POTW
Service Areas in Napa County.
GIS layers for PCBs in sediments and pump stations courtesy SFEI. GIS layers for POTW service areas courtesy Caltrans District 4. All GIS
information is preliminary; Brown and Caldwell and the GIS information providers make no guarantees as to the accuracy of GIS information
provided in this report.

Pump Station Diversions Feasibility Evaluation Section 3
3-18
DRAFT for review purposes only. Use of contents on this sheet is subject to the limitations specified at the end of this document.
G:\Engineering and Construction\Flood\CleanWater\Arleen\Regional\BASMAA\Regional permit\POCs\General C11 & C12\C.11-12f-diversions\Draft FINAL -Pump
Station FER 9-13-2010.doc
Figure 3-3. Map of Pump Station Locations, PCB concentrations in Sediments, Locations of POTWs, and POTW
Service Areas in Marin County.
GIS layers for PCBs in sediments and pump stations courtesy SFEI. All GIS information is preliminary; Brown and Caldwell and the GIS
information providers make no guarantees as to the accuracy of GIS information provided in this report.

Pump Station Diversions Feasibility Evaluation Section 3
3-19
DRAFT for review purposes only. Use of contents on this sheet is subject to the limitations specified at the end of this document.
G:\Engineering and Construction\Flood\CleanWater\Arleen\Regional\BASMAA\Regional permit\POCs\General C11 & C12\C.11-12f-diversions\Draft FINAL -Pump Station FER 9-13-2010.doc
Figure 3-4. Map of Pump Station Locations, PCB concentrations in Sediments, Locations of POTWs, and POTW Service Areas in Contra Costa County.
GIS layers for PCBs in sediments and pump stations courtesy SFEI. GIS layers for POTW service areas courtesy Caltrans District 4. All GIS information is preliminary; Brown and Caldwell and the GIS
information providers make no guarantees as to the accuracy of GIS information provided in this report.

Pump Station Diversions Feasibility Evaluation Section 3
3-20
DRAFT for review purposes only. Use of contents on this sheet is subject to the limitations specified at the end of this document.
G:\Engineering and Construction\Flood\CleanWater\Arleen\Regional\BASMAA\Regional permit\POCs\General C11 & C12\C.11-12f-diversions\Draft FINAL -Pump Station FER 9-13-2010.doc
Figure 3-4. Map of Pump Station Locations, PCB concentrations in Sediments, Locations of POTWs, and POTW Service Areas in Alameda County.
GIS layers for PCBs in sediments and pump stations courtesy SFEI. GIS layers for POTW service areas courtesy Caltrans District 4. All GIS information is preliminary; Brown and Caldwell and the GIS
information providers make no guarantees as to the accuracy of GIS information provided in this report.

Pump Station Diversions Feasibility Evaluation Section 3
3-21
DRAFT for review purposes only. Use of contents on this sheet is subject to the limitations specified at the end of this document.
G:\Engineering and Construction\Flood\CleanWater\Arleen\Regional\BASMAA\Regional permit\POCs\General C11 & C12\C.11-12f-diversions\Draft FINAL -Pump Station FER 9-13-2010.doc
Figure 3-5. Map of Pump Station Locations, PCB concentrations in Sediments, Locations of POTWs, and POTW Service Areas in Santa Clara County.
GIS layers for PCBs in sediments and pump stations courtesy SFEI. GIS layers for POTW service areas courtesy Caltrans District 4. All GIS information is preliminary; Brown and Caldwell and
the GIS information providers make no guarantees as to the accuracy of GIS information provided in this report.

Pump Station Diversions Feasibility Evaluation Section 3
3-22
DRAFT for review purposes only. Use of contents on this sheet is subject to the limitations specified at the end of this document.
G:\Engineering and Construction\Flood\CleanWater\Arleen\Regional\BASMAA\Regional permit\POCs\General C11 & C12\C.11-12f-diversions\Draft FINAL -Pump Station FER 9-13-2010.doc
Figure 3-6. Map of Pump Station Locations, PCB concentrations in Sediments, Locations of POTWs, and POTW Service Areas in Solano County.
GIS layers for PCBs in sediments and pump stations courtesy SFEI. GIS layers for POTW service areas courtesy Caltrans District 4. All GIS information is preliminary; Brown and Caldwell and the GIS
information providers make no guarantees as to the accuracy of GIS information provided in this report.

Pump Station Diversions Feasibility Evaluation Section 3
3-23
DRAFT for review purposes only. Use of contents on this sheet is subject to the limitations specified at the end of this document.
G:\Engineering and Construction\Flood\CleanWater\Arleen\Regional\BASMAA\Regional permit\POCs\General C11 & C12\C.11-12f-diversions\Draft FINAL -Pump
Station FER 9-13-2010.doc
Will the project provide unique or new information? This is a more subjective question that would
require input from the Technical Oversight Committee, including the SFB-RWQCB, to properly screen. It is
an important question because, given the compliance time frame and inherent scale of pilot projects,
they will most likely be small and temporary in nature. Therefore, in addition to targeting opportunity
areas where pump stations serves drainage areas that have high PCB concentrations, pilot projects
should be designed with the intent of producing information that will be useful to assess the costs and
benefits of full scale implementation.
3.1.2 Costs and Alternatives
Overall cost is an important screening crtieria for pilot projects. Some simple planning tools for
determining whether or not a pilot project is cost prohibitive are presented in Section 2.4.1 above. In
general, pilot projects that would require significant new conveyance infrastructure or incur significant
treatment costs may be less attractive than pilot projects with relatively simple diversion connections
located in jurisdictions where reduced or waived treatment costs could be negotiated.
Alternatives to diversion, such as pollution prevention, street sweeping, sediment management, and
stormwater treatment retrofits, should always be considered in conjunction with diversion to POTWs. This
FER is developed to comply with an MRP requirement that also prescribes five pilot projects; therefore,
consideration of alternatives is not a specific screening criterion for pilot projects, although it would be
an important screening criteria for additional implementation beyond the pilot stage. The oversight
committee will provide input and feedback on diversion sites considering the broader regional context of
pilot-testing a variety of pollutant control strategies in the Bay Area.
3.1.3 Acceptability
There are two screening criteria that should be evaluated to determine whether diversion into POTWs is
acceptable:
Is there an accessible POTW willing and able to provide treatment service? A key piece of information to
help identify the POTW which serves an area of interest s a map of POTW service areas, such as the
examples shown in Figures 3-1 through 3-9. Additionally, Pump station inventory data compiled by the
SFB-RWQCB includes partial listings of the nearest POTW. The best way to assess the willingness,
existing ability and challenges of a POTW to accept a diversion is to begin discussions with the
appropriate staff and collectively explore opportunities and constraints of the potential diversion in
question. Because of the likely change needed to existing POTW procedures, policies, and principles, it is
expected that inevitably, decision makers representing the POTW will also need to be involved and
approve the pilot diversion. In order for a POTW decision maker to evaluate the request, they would need
certain information, including the amount to be diverted, the expected timing and duration of the pilot
diversion, and the loads of PCBs, mercury, suspended sediment, dissolved solids, and biochemical
oxygen demand expected. Some of the concerns of POTWs are briefly summarized in Section 3.3 below
and by the Bay Area Clean Water Agencies (Carollo, 2009)
Can the pilot diversion be sited within acceptable design criteria? This criterion would be evaluated
using maps, diagrams, a site walk, and other resources necessary to complete a pre-design checklist
comparable to the one illustrated in Figure 2-3. A more pertinent checklist has been developed for
this FER and is shown in Table 3-1.

Pump Station Diversions Feasibility Evaluation Section 3
3-24
DRAFT for review purposes only. Use of contents on this sheet is subject to the limitations specified at the end of this document.
G:\Engineering and Construction\Flood\CleanWater\Arleen\Regional\BASMAA\Regional permit\POCs\General C11 & C12\C.11-12f-diversions\Draft FINAL -Pump
Station FER 9-13-2010.doc
Table 3-1. Proposed Checklist for Evaluating Engineering Feasibility of Pilot Diversions
1 Does the POTW in question have existing capacity during wet weather?
2 Does the POTW in question have existing capacity during dry weather?
3 What is the distance to any potential sanitary sewer pilot diversion connections (linear feet)?
4 Does the potential connection require any land acquisition or easements?
5 Does the POTW fully own or control the sanitary sewer system?
6 Is the POTW willing to accept discharge from a stormwater pilot diversion project?
7 What is the capacity of the pump station (gpm)?
8 What is the wet weather capacity of the sanitary sewer system downstream of the potential pilot diversion
connection?
9 What percentage of the pump station flow can be diverted to the sanitary sewer system if at all?
10 Does the pump station have sufficient area in either the wet well or after the pump to build a pilot diversion?
11 Would the pump station convey flow to the sanitary sewer system via gravity flow or an additional pump.
Questions 1 and 2 initially determine the feasibility of a POTW to accept stormwater flow. POTWs with
little excess capacity will not likely take on stormwater discharges. If it is possible to divert water,
questions 3, 4, and 5 consider the route necessary to convey water to the sanitary sewer system. Longer
distance pilot diversions will likely be cost prohibitive, as well as routes which require acquisition of land
or easements for construction. If the POTW does not own the sanitary sewer system, or shares
ownership, negotiations for sanitary sewer capacity and the timing of discharges would involve more
parties, and likely be more complex. Questions 6, 7, and 8 determine the capacity of the sanitary sewer
system at a chosen pilot diversion point, to accept, some, all, or none of the wet or dry weather flow from
the diversion. Of particular concern is whether accepting a diversion would increase the risk of a Sanitary
Sewer Overflow (SSO). Finally, questions 9 and 10 determine whether the pump station itself is
amenable to retrofit for pilot diversion. Pump stations in small areas with limited space for expansion
would likely be ill-suited to build a flow control device for gravity flow to a sanitary sewer connection. In
stations with small wet well capacity it would be difficult to install new pumps for conveyance.
Table 3-2 below summarizes the selection criteria, and the information needed to apply the criteria.

Pump Station Diversions Feasibility Evaluation Section 3
3-25
DRAFT for review purposes only. Use of contents on this sheet is subject to the limitations specified at the end of this document.
G:\Engineering and Construction\Flood\CleanWater\Arleen\Regional\BASMAA\Regional permit\POCs\General C11 & C12\C.11-12f-diversions\Draft FINAL -Pump
Station FER 9-13-2010.doc
Table 3-2. Proposed Selection Criteria and Information Needed
Criteria Information Needed
Needs
Will the project yield a significant PCB load reduction?
PCB concentrations in sediments from the local drainage;
Pump station inventories in GIS and tabular formats
Event-mean PCB concentrations in stormwater;
TSS and flow measurements;
Drainage area assessments
Will the project provide unique or new information? Peer review from Technical Oversight Committee
Does a pilot project fit into the broader regional context of
pilot-testing a range of pollutant control strategies, including
pollution prevention, site remediations, enhanced sediment
management, and stormwater treatment retrofitting
strategies?
Peer review from Technical Oversight Committee
Costs and
Alternatives
Are the capital and operation and maintenance costs
associated with diversion prohibitive?
Site investigations
Conceptual designs and drawings
Preliminary site-specific cost estimates
Treatment and connection costs/charges.
Are there ways to control upstream sources of PCBs through
remediation, removal, isolation, or run-on diversion? Source identification studies
Peer review from Technical Oversight Group
Site investigations, including right-of-way mapping Can onsite treatment or infiltration retrofits be implemented?
Acceptability
Is there an accessible POTW willing and able to provide
treatment service?
POTW service area map
Communication with POTW managers
Can the pilot diversion be sited within acceptable design
criteria? Pre-design checklist assessment (Table 1)
3.2 Cost and Benefit Analysis of Three Scenarios
This section evaluates three hypothetical scenarios to estimate the costs, grams of PCBs removed, and
resulting cost per gram. These scenarios are hypothetical, based on untested assumptions and may not
represent actual conditions or costs associated with stormwater pump station diversions in the Bay Area.
Additionally, these scenarios are intended to only represent a range of possible costs and benefits that
may be expected. Costs and benefits are evaluated in the context of three types of scenarios that are
inherently different in scale and implementation timeframes. For those scenarios with longer
implementation timeframes, costs can be spread out accordingly and therefore provide an unequal
comparison against scenarios with shorter implementation durations. For these reasons, costs should
not be used to directly compare the cost efficiencies between scenarios presented, but rather used to
assess the range of costs that may be expected for an individual scenario. Constructed Pilot Diversions
Under this scenario, it is assumed that a pilot diversion is constructed which includes operational
controls that allow selective pilot diversion of first flush and wet weather events. The pilot diversion is
assumed to require minimal distance to tie into the sanitary sewer system. The pilot diversion is
assumed to be a gravity feed into a large capacity sewage line, requiring minimal annual O&M costs due
to electricity. The receiving POTW has agreed to accept one million gallons per 24-hour storm event no
more than eight times during the storm season. It is assumed, for this hypothetical scenario, that the
Pump Station Diversions Feasibility Evaluation Section 3
3-26
DRAFT for review purposes only. Use of contents on this sheet is subject to the limitations specified at the end of this document.
G:\Engineering and Construction\Flood\CleanWater\Arleen\Regional\BASMAA\Regional permit\POCs\General C11 & C12\C.11-12f-diversions\Draft FINAL -Pump
Station FER 9-13-2010.doc
POTW has agreed to waive treatment fees5. A pilot diversion and pump system has been constructed
which can convey large volumes of flow (750 gpm to deliver one million gallons in 24 hours). Based on
Table 2-1, the capital outlay for this project is assumed to be $750,000. The removal effectiveness for
PCBs and Hg is assumed to be >95 percent.
If the average PCB concentration in diverted stormwater were 50 ng/L, each million gallons diverted
would reduce PCB loads discharged directly to the Bay by 0.2 grams (see Table 2-4). Eight such events
each year would annually reduce PCB loads by 1.6 grams. Over twenty years, this would correspond to
32 grams of PCBs (assuming concentrations would remain unchanged over this timeframe).
Assuming that a ten-fold higher stormwater mercury concentration (500 ng/L), this would correspond to
a load reduction of 16 grams of mercury per year, or 320 grams over twenty tears.
If the treatment plant provides treatment service for free, then achieving a total load reduction of
32 grams PCBs and 320 grams mercury over twenty years by this approach would result in a capital
outlay and operation and maintenance cost of approximately $23,500 per gram of PCBs reduced, and
$2,350 per gram of mercury reduced. This estimate is a very crude, demonstrative example that does
not consider life-cycle costs, net present worth cost adjustments, or other complexities. The cost per
gram would increase substantially if the hypothetical pilot diversion were to be terminated in less than
twenty years.
3.2.1 Non-constructed Pilot Diversions
Under this scenario, it is assumed that a wet weather pilot diversion project that does not require the
construction of diversion structures, but rather is implemented using check dams and pumps to divert
storm flows into storage tanks, and subsequently routing into a sanitary sewer when there is sufficient
capacity. Because no capital costs incurred under this scenario, municipalities diverting stormwater have
less financial risk compared to the first scenario described. It is assumed that sufficient site area is
available to locate ten storage tanks, and that the site area has pavement competent to withstand the
weight of ten full tanks. The project is assumed to last for thirty days, and the daily cost of equipment
rental and staffing is $6,000, for a total project cost of $180,000 (per Table 2-3). As with the
constructed pilot diversion scenario above, treatment fees are assumed to be waived for this scenario5.
The project is assumed to occur in the wettest months (i.e., January – February), and for the purposes of
this scenario is assumed to capture a total of three major storm events, diverting a total of 600,000
gallons of wet weather flows (200,000 gallons each event) having an average PCB concentration of 50
ng/L.
Referring to Table 2-4, each 200,000 gallon pilot diversion event would capture 0.04 grams of PCBs, for
a total of 0.12 grams diverted into the POTW. Again assuming 95 percent removal, this would yield a net
load reduction of 0.11 grams, or 0.0006 percent of the total currently estimated PCB stormwater load.
Although the total project cost is lower compared to construction of a constructed pilot diversion, the
cost per gram removed is significantly higher: approximately $1,600,000 per gram of PCBs removed.
Assuming a ten-fold higher Hg concentration (500 ng/L), the net load reduction would be 1.1 grams for
this scenario, at a cost of $160,000 per gram.
5 The simplifying assumption that a POTW waives treatment fees is, in fact, unlikely. In most cases, wastewater and stormwater
programs are funded through separate sources, and so institutional factors may make such a waiver problematic. As noted in
Tables 2-1 and 2-2 above, connection fees typically range from $9,000 to $18,000 per thousand gallons per day, and
treatment fees typically range from $300 to $2,400 per MG treated. As a result, these cost estimates for the hypothetical
scenarios are llikely underestimated. Other charges may also be assessed, such as East Bay MUD’s “wastewater capacity fee”
of at least $97.40 per 100 cubic feet per month, or $130,000/MG/month. See, for example:
http://www.ebmud.com/our-water/wastewater-treatment/wastewater-treatment-programs/wastewater-rates-charges-and-fees

Pump Station Diversions Feasibility Evaluation Section 3
3-27
DRAFT for review purposes only. Use of contents on this sheet is subject to the limitations specified at the end of this document.
G:\Engineering and Construction\Flood\CleanWater\Arleen\Regional\BASMAA\Regional permit\POCs\General C11 & C12\C.11-12f-diversions\Draft FINAL -Pump
Station FER 9-13-2010.doc
3.2.2 Conveyance System Cleanout
Under this scenario, it is assumed that a sediment sampling and visual inspection has identified a
conveyance with contaminated sediments. A cleanout of the impacted portion of the system takes place
over a period of seven days, at a lower cost ($4,000 per day) than the wet weather pilot diversion
because the dry weather work can be more easily scheduled. A total of ten kilograms of contaminated
sediments having an average PCB concentration of ten parts per million (10 mg /kg) is flushed from the
system and captured in a single, 20,000 gallon storage tank, and then discharged into the sanitary
sewer. Again, treatment fees are assumed to be waived for this analysis5. Under this scenario, the total
mass of PCBs removed would be 100 mg, or 0.1 grams. If 95 percent of the PCB load discharge to the
POTW is removed by treatment, the net load reduction benefit to the Bay would be 0.095 grams. The
total project cost is $28,000. The cost per gram of PCBs removed under this scenario would be
approximately $300,000 per gram.
Under this scenario, it is assumed that sediment with 10 mg/kg PCBs have mercury concentrations of
1 mg/kg. This assumption reflects the observations that sediments from old industrial areas that are
substantially contaminated with PCB are not typically found in the same locations as sediments
impacted by mining waste that have mercury concentrations of 10 mg/kg or more. The corresponding
load reduction of mercury would be 0.01 grams, at a cost of $3,000,000 per gram.
Although this third scenario is the most cost-effective, in terms of cost per gram, and also one of the
most likely scenarios to be acceptable to a POTW, the overall load reduction is still relatively small –
again about 0.0005 percent of the total stormwater PCB load to the Bay. Additionally, this scenario (and
non-constructed diversions) allow municipalities to be more adaptive in directing resources where they
are most needed. This scenario could, however, be a useful diagnostic tool. If, after conducting the
cleanout, follow-up inspections show that contaminated sediments are again found in the conveyance
system after the rainy season ends, that would suggest a need to look upstream to possibly identify
areas where sediment removal, capping, and/or run-on pilot diversion could be implemented to protect
the stormwater conveyance system.
3.3 POTW and Collection System Agency Constraints/Concerns
A draft white paper developed by the Bay Area Clean Water Agencies presents a summary of constraints
faced by POTWs when deciding whether or not to accept stormwater discharges for treatment
(BACWA, 2009). Those issues have been raised in previous technical reports submitted to the
SFB-RWQCB (e.g., Applied Marine Sciences, 2003).
Some of the main constraints faced by POTWs include:
Treatment capacity and conveyance system capacity - The BACWA (2009) white paper noted that most
treatment and conveyance system capacity issues could be addressed by restricting diversion flows.
Restirctions could be achieved through the design of orifices, weirs, and pumps. As noted in the cost /
benefit analysis, treatment and conveyance and capacity issues may limit the load reduction benefits
attainable.
Conveyance system ownership and permission of all owners - Not all POTWs own the collection and
conveyance systems that serve them. If a different entity than the POTW owns the collection system, it
would require another negotiation to enable the diversion. If there are multiple collection system owners,
the negotiation could be more complex.
Ordinance prohibitions - The BACWA (2009) white paper notes that:
Pump Station Diversions Feasibility Evaluation Section 3
3-28
DRAFT for review purposes only. Use of contents on this sheet is subject to the limitations specified at the end of this document.
G:\Engineering and Construction\Flood\CleanWater\Arleen\Regional\BASMAA\Regional permit\POCs\General C11 & C12\C.11-12f-diversions\Draft FINAL -Pump
Station FER 9-13-2010.doc
“There are few existing agreements and local laws (e.g. ordinances) that relate to stormwater
diversions, including a POTW’s ability to accept, deny or condition the acceptance of stormwater
diversions (e.g. flow restrictions, pretreatment requirements). Most wastewater agencies
operating separate sanitary sewers currently forbid the discharge of stormwater into the sanitary
system. However, many wastewater agencies have a stipulation in their rules that allow
discharges to the sanitary system with the permission of the POTW.”
Potential to upset biological processes, especially in advanced treatment plants. Introduction of
heterogeneous surface waters puts a POTW at risk of treatment system upsets, particularly in advanced
plants where inoculations of foreign bacteria can interfere with microbial communities essential to the
treatment process.
Effect of PCB loads on effluent - In its report on the Ettie Street Pump Station diversion project (EBMUD,
2010), EBMUD noted that PCB loads to influent are not 100% removed by the treatment process. As a
result, EBMUD stated that the compliance with respect to “PCBs and other pollutants for which the Bay
is impaired would require particularly close evaluation for diversion potential.” There is only a small,
preliminary amount of data available on current concentrations of PCBs in treated effluent (SFRWQCB,
2008) . However, the limited amount of information available indicates that PCB concentrations in
treated effluent are likely to be above water quality objectives for PCBs established in the California
Toxics Rule.
Effect of PCB loads on biosolids - Initial discussions with the Technical Oversight Committee (July 14,
2010) led to the conclusion that PCB loads from pilot diversion projects may be sufficiently small that
they would not significantly change the PCB concentration of biosolids. The preliminary load calculations
in Section 3.2 tend to support this – conveyance system and treatment plant capacity would likely
become limiting factors before PCB concentrations in biosolids would be a constraint. However, it is
worth noting that deliberate introduction of PCBs into sewage treatment systems has strong potential to
cause perception problems related to biosolids. For example, a recent incident in Milwaukee, Wisconsin
led to the inadvertent introduction of PCB contaminated sediments in to the municipal sewage treatment
system during a sanitary sewer system rehabilitation project (Behm, 2009). As a result, commercial
production and sale of biosolids from the treatment plant was halted for several months. Recovery from
the incident caused the Milwaukee Metropolitan Sewerage District approximately $4 million.
3.4 Conceptual Framework for Crediting PCB Load Reductions
The MRP requires that this FER include “a proposed method for distributing PCBs load reductions to
participating wastewater and stormwater agencies.” proposed approach for crediting mercury and PCB
load reductions to POTWs. This section proposes a method for illustrative purposes, in order to comply
with the NPDES permit. Any program of incentives or credits to POTWs would need to be developed with
POTW involvement.
The effect of a diversion on compliance would be of particular concern. For example, in its report on the
Ettie Street Pump Station pilot diversion project (EBMUD, 2010), EBMUD noted that PCB loads to
influent are not 100 percent removed by the treatment process. As a result, EBMUD stated that the
compliance with respect to “PCBs and other pollutants for which the Bay is impaired would require
particularly close evaluation for pilot diversion potential.”
There is only a small, preliminary amount of data available on current concentrations of PCBs in treated
effluent (SFB-RWQCB, 2008) . However, the limited amount of information available indicates that PCB
concentrations in treated effluent are likely to be above water quality objectives for PCBs established in
the California Toxics Rule. The San Francisco Bay PCBs TMDL has established WLAs for PCBs in treated
effluent that add up to 2 kg per year for all Bay Area wastewater dischargers combined. The estimated
current loads are slightly higher, 2.3 kg per year. The SFB-RWQCB has stated that it expects PCB

Pump Station Diversions Feasibility Evaluation Section 3
3-29
DRAFT for review purposes only. Use of contents on this sheet is subject to the limitations specified at the end of this document.
G:\Engineering and Construction\Flood\CleanWater\Arleen\Regional\BASMAA\Regional permit\POCs\General C11 & C12\C.11-12f-diversions\Draft FINAL -Pump
Station FER 9-13-2010.doc
concentrations in effluent to decrease over time as a result of the fact that PCBs are no longer
manufactured or used. Recognizing that pilot diversion projects would increase PCB loads to POTWs, the
SFB-RWQCB also included a 1 kg per year WLA to be made available to individual POTWs who agree to
accept stormwater for discharge.
IN the staff report accompanying the San Francisco Bay PCBs TMDL, the explanation for the 1 kg per
year WLA available for stormwater treatment is as follows:
“A potential means to reduce urban stormwater runoff PCBs loads will be to strategically
intercept and route runoff to municipal wastewater treatment systems. We propose a separate
wasteload allocation for discharges associated with urban stormwater runoff treatment via
municipal wastewater treatment systems, since such actions will result in increased PCBs loads
from municipal wastewater dischargers, and the proposed individual wasteload allocations for
municipal wastewater dischargers reflect current performance levels. We propose a wasteload
allocation of 0.9 kg/yr, which is the difference between the TMDL of 10 kg/yr and the sum of the
other proposed wasteload and load allocations.”
The proposed method is to credit the participating stormwater permittee for the estimated load diverted
as progress towards attainment of the TMDL wasteload allocation. Participating POTWs would likely seek
some form of regulatory protection from effluent limit exceedances or system upsets caused by the pilot
diversions. The SFB-RWQCB could consider offering some of the 1 kg per year WLA as an incentive for
POTW participation. A crediting ratio could be proposed to allow a small increase in POTW loads in
comparison to the stormwater loads removed. For example, if the crediting ratio were 10:1, then the
1.6 grams of PCBs removed annually under Scenario 1 above would allow the participating POTW to
increase loads by 0.16 grams per year. A crediting ratio of 10:1 would allow for a 90 percent removal
efficiency by the POTW: for every ten additional grams of PCBs in stormwater treated by the POTW, an
addtiional one tenth of a gram would be discharged, resulting in a net PCB load reduction. The SFB-
RWQCB would likely need to seek input and buy-in on this concept from the United States Environmental
Protection Agency, as well as local environmental stakeholders, to incorporate this or any other crediting
framework into NPDES permits.

4-1
DRAFT for review purposes only. Use of contents on this sheet is subject to the limitations specified at the end of this document.
G:\Engineering and Construction\Flood\CleanWater\Arleen\Regional\BASMAA\Regional permit\POCs\General C11 & C12\C.11-12f-diversions\Draft FINAL -Pump
Station FER 9-13-2010.doc
Section 4
Process and Schedule for Pilot
Project Implementation
A proposed timeline for pilot project implementation is shown in Table 4-1 below. This FER completes
Task 1, which is led by a BASMAA as a regional project. Task 2.0 will begin upon submittal of this FER.
Copermittees, with some assistance from BASMAA as needed, would use this report to propose five
candidate and five alternate pump stations for pilot projects. A technical memorandum summarizing the
candidate and alternate pump stations would be submitted to the SFB-RWQCB by September 15, 2011.
After that time, preliminary designs and cost estimates for the pilot diversions would be advanced.
Sampling and analysis plans would be developed though a regional project. Progress would be
summarized in Annual Reports submitted by BASMAA to the SFB-RWQCB. The MRP requires a final
report to be completed by March 15, 2014.

Pump Station Diversions Feasibility Evaluation Section 4
4-2
DRAFT for review purposes only. Use of contents on this sheet is subject to the limitations specified at the end of this document.
G:\Engineering and Construction\Flood\CleanWater\Arleen\Regional\BASMAA\Regional permit\POCs\General C11 & C12\C.11-12f-diversions\Draft FINAL -Pump Station FER 9-13-2010.doc
Table 4-1. Proposed Schedule for Pilot Project Implementation
Task Programs/ Permittees Regional
Suggested Start Date Suggested End Date
1.0 – Feasibility Evaluation
1.1. Develop draft list of criteria that should be considered when selecting areas or stormwater pump stations for potential pilot
diversions to POTWs, and associated data/information needed to apply the criteria. A X
May 15, 2010
July 21, 2010 1.2 Develop a preliminary cost and benefit assessment for three (?) types/configurations of areas or pump stations using existing
data and information A X
1.3 Develop draft methodologies for distributing loads between POTWs and stormwater programs when diverting areas or pump
station discharges to POTWs. A X
1.4 Summarize criteria, cost benefit analysis, and loads methodology in a report and include a time schedule for selection and
implementation of pilot diversions. A X
Draft – August 11, 2010
Final – September 15, 2010
2. 0 Pump Station Retrofits
2.1 Apply criteria developed in Task 1.1 and select a minimum of 5 primary and 5 alternate pump stations or areas (2 per county)
that will be considered for pilot diversion. X A September 8, 2010 February 28, 2011
2.2. Develop memorandum summarizing pump stations or areas selected in task 2.1 above and a refined cost benefit
assessment for these pump stations or areas. A X March 1, 2011
Draft – May 15, 2011;
Final – August 15, 2011
2.3 Further scope pilot diversion infrastructure needs, and develop preliminary/conceptual design (5 percent) and engineering
for pump stations or areas selected in Task 2.1. X A June 1, 2011 December 1, 2011
2.4 Refine conceptual design into 30 percent level of design and acquire permits/agreements as needed. X A December 1, 2011 December 11, 2012
2.5 Retrofit existing pump stations or areas to allow for pilot diversion to POTW (i.e., construction) under predefined conditions X A January 21, 2013 June 1, 2013
3.0 Monitoring
3.1 Develop regional sampling and analysis plan (Including a QAPP and SOP) and data reporting templates A X July 1, 2011 June 30, 2013
3.2 Monitor diversions (early implementation may be possible at some stations) X A July 1, 2013 January 31, 2014
3.3 Conduct QA/QC, data analyses A X July 1, 2013 February 28, 2014
4.0 Reporting
4.1 Summarize pilot diversion project status/progress in Annual Report X A July 1, 2010 September 15, 2014
4.2 Prepare summary report for inclusion in integrated report A X January 2, 2014 March 15, 2014
Notes: A = Assist; X = Task Lead. Monitoring results produced after December 1, 2013 may not appear in the March 15, 2014 Integrated Report submittal.

5-1
DRAFT for review purposes only. Use of contents on this sheet is subject to the limitations specified at the end of this document.
G:\Engineering and Construction\Flood\CleanWater\Arleen\Regional\BASMAA\Regional permit\POCs\General C11 & C12\C.11-12f-diversions\Draft FINAL -Pump
Station FER 9-13-2010.doc
Section 5
Limitations
This document was prepared solely for the BASMAA in accordance with professional standards at the
time the services were performed and in accordance with the contract between BASMAA and Brown and
Caldwell dated June 3, 2010. This document is governed by the specific scope of work authorized by
BASMAA; it is not intended to be relied upon by any other party except for regulatory authorities
contemplated by the scope of work. We have relied on information or instructions provided by BASMAA
and other parties and, unless otherwise expressly indicated, have made no independent investigation as
to the validity, completeness, or accuracy of such information.
This document sets forth the results of certain services performed by Brown and Caldwell with respect to
the property or facilities described therein (the Property). BASMAA recognizes and acknowledges that
these services were designed and performed within various limitations, including budget and time
constraints. These services were not designed or intended to determine the existence and nature of all
possible environmental risks (which term shall include the presence or suspected or potential presence
of any hazardous waste or hazardous substance, as defined under any applicable law or regulation, or
any other actual or potential environmental problems or liabilities) affecting the Property. The nature of
environmental risks is such that no amount of additional inspection and testing could determine as a
matter of certainty that all environmental risks affecting the Property had been identified. Accordingly,
THIS DOCUMENT DOES NOT PURPORT TO DESCRIBE ALL ENVIRONMENTAL RISKS AFFECTING THE
PROPERTY, NOR WILL ANY ADDITIONAL TESTING OR INSPECTION RECOMMENDED OR OTHERWISE
REFERRED TO IN THIS DOCUMENT NECESSARILY IDENTIFY ALL ENVIRONMENTAL RISKS AFFECTING THE
PROPERTY.
Further, Brown and Caldwell makes no warranties, express or implied, with respect to this document,
except for those, if any, contained in the agreement pursuant to which the document was prepared. All
data, drawings, documents, or information contained this report have been prepared exclusively for the
person or entity to whom it was addressed and may not be relied upon by any other person or entity
without the prior written consent of Brown and Caldwell unless otherwise provided by the Agreement
pursuant to which these services were provided.

Pump Station Diversions Feasibility Evaluation References
REF-1
DRAFT for review purposes only. Use of contents on this sheet is subject to the limitations specified at the end of this document.
G:\Engineering and Construction\Flood\CleanWater\Arleen\Regional\BASMAA\Regional permit\POCs\General C11 & C12\C.11-12f-diversions\Draft FINAL -Pump
Station FER 9-13-2010.doc
References
Applied Marine Sciences, Inc. 2000-01 Alameda County Watershed Sediment Sampling Program: Two-Year Summary and
Analysis. Prepared for Alameda Countywide Clean Water Program, September 2002a.
Applied Marine Sciences, Inc. Analysis of 2000-01 Source Investigations in Ettie Street Pump Station and Glen Echo
Creek Watersheds, Oakland, California. Prepared for Alameda Countywide Clean Water Program, August 2002b.
Applied Marine Sciences, Inc. Draft Approach, Feasibility, and Expected Benefits of Implementation Actions for Urban
Runoff in the San Francisco Bay Mercury TMDL. Prepared for the Clean Estuary Partnership, July 2003.
Applied Marine Sciences. Post-Abatement Sampling and Analysis for PCBs in the Ettie Street Pump Station Watershed.
Prepared for Alameda Countywide Clean Water Program: 12 pp, 2007.
Bay Area Stormwater Management Agencies Association. Clean Watersheds for a Clean Bay. Grant Proposal Prepared for
the United States Environmental Protection Agency, April 2010.
Behm, Don. PCBs to be Cleared from Mitchell Park Sewer. Milwaukee Wisconsin Journal-Sentinel, November 8, 2009.
Brown and Caldwell. Las Vegas Wash Selenium Management Plan, Volume 1: Summary Report. Prepared for the Clean
Water Coalition, June 2009a.
Brown and Caldwell. Las Vegas Wash Selenium Management Plan, Volume 2: Technical Reports. Prepared for the Clean
Water Coalition, June 2009b.
Carollo Engineers. Draft Stormwater Diversion White Paper. Prepared for the Bay Area Clean Water Agencies, November
2009.
CH2MHill. Urban Runoff Study. Prepared for the Orange County Sanitation District, November, 2004.
East Bay Municipal Utility District. Characterization of Stormwater Flows, Diversion of Dry Weather and First Flush Flows
to a Publicly-Owned Treatment Works. Prepared for the San Francisco Bay Regional Water Quality Control Board, July
2010.
EOA, Inc. Final Report: Joint Stormwater Agency Project to Study Urban Sources of Mercury, PCBs, and Organochlorine
Pesticides. April 2002a. Prepared for: Santa Clara Valley Urban Runofff Pollution Prevention Program; San Mateo
Countywide Stormwater Pollution Prevention Program; Contra Costa Clean Water Program; Marin County Stormwater
Pollution Prevention Program; Vallejo Flood Control and Sanitation District; and Fairfield Suisun Sewer District, April
2002a.
EOA, Inc. Case Study Investigating Elevated Levels of PCBs in Storm Drain Sediments in San Mateo County. Prepared for
San Mateo Countywide Stormwater Pollution Prevention Program, April 2002b.
EOA, Inc. Case Study Investigating Elevated Levels of PCBs in Storm Drain Sediments in San Jose, California. Prepared for
the Santa Clara Valley Urban Runofff Pollution Prevention Program, April 2002c.
EOA, Inc. Year Two Case Study Investigating Elevated Levels of PCBs in Storm Drain Sediments in San Jose, California.
Prepared for the Santa Clara Valley Urban Runofff Pollution Prevention Program, June 2003a.
EOA Inc. Case Study Investigating Elevated Levels of PCBs in Storm Drain Sediments in the Pulgas Creek Pump Station
Drainage San Carlos, California. Prepared for San Mateo Countywide Stormwater Pollution Prevention Program, June
2003b.
EOA, Inc. Case Study Investigating PCBs in Storm Drain Sediments from Colma Creek Colma, California. Prepared for San
Mateo Countywide Stormwater Pollution Prevention Program, May 2004.
EOA Inc. Concentrations of PCBs in Stormwater Conveyance Systems in the Cutting Boulevard and Wright Avenue
Drainage Areas (Richmond, CA). Prepared for the Contra Costa Clean Water Program, May 2007a.
EOA, Inc. (2007). Summary of Polychlorinated Biphenyls (PCBs) Data in Sediment Collected from Richmond, California
Streets and Storm Drains. Prepared for City of Richmond: 23 pp. 2007b.
Kleinfelder, Inc. (2006). Private Property Sediment Sampling Report: Ettie Street Watershed, Oakland, California.
Prepared for City of Oakland, 2006.
LFR Inc. Feasibility Assessment for Managing Stormwater Loads in San Francisco Bay. Prepared for the Clean Estuary
Partnership, November 2006.

Pump Station Diversions Feasibility Evaluation References
REF-2
DRAFT for review purposes only. Use of contents on this sheet is subject to the limitations specified at the end of this document.
G:\Engineering and Construction\Flood\CleanWater\Arleen\Regional\BASMAA\Regional permit\POCs\General C11 & C12\C.11-12f-diversions\Draft FINAL -Pump
Station FER 9-13-2010.doc
Orange County Stormwater Program. Drainage Area Management Plan, Appendix E6: Dry Weather Diversion Study.
October, 2003.
Sacramento Stormwater Quality Partnership. "Dry Weather Diversion Feasibility Study." October 2006.
San Francisco Bay Regional Water Quality Control Board. Mercury in San Francisco Bay Proposed Basin Plan Amendment
and Staff Report for Revised Total Maximum Daily Load (TMDL) and Proposed Mercury Water Quality Objectives.
Adopted resolution R2-2006-052, August 2006.
San Francisco Bay Regional Water Quality Control Board. Total Maximum Daily Load for PCBs in San Francisco Bay Final
Staff Report for Proposed Basin Plan Amendment. Adopted resolution R2-2006-052, Adopted Resolution R2-2008-
0012.
San Francisco Estuary Partnership. Workplan - Estuary 2100 Phase 2: Building Partnerships for Resilient Watersheds.
Prepared for the United States Environmental Protection Agency, February 2010.
Yee, Donald and McKee, Lester. Task 3.5: Concentrations of PCBs and Hg in soils, sediments and water in the
urbanized Bay Area: Implications for best management. A technical reportof the Watershed Program. SFEI
Contribution 608. San Francisco Estuary Institute, March 2010.
Wilson, Rick. "The Use of Dry Weather Storm Drain Diversions in California – Diverted by Diversion." July 2010.

Pump Station Diversions Feasibility Evaluation
1
DRAFT for review purposes only. Use of contents on this sheet is subject to the limitations specified at the end of this document.
G:\Engineering and Construction\Flood\CleanWater\Arleen\Regional\BASMAA\Regional permit\POCs\General C11 & C12\C.11-12f-diversions\Draft FINAL -Pump Station FER 9-13-2010.doc
Attachment 1. List of Major POTWs in the Bay Area
NPDES
Permit POTW Area Outfall Agencies
Service
Population
Dry
Weather
Design
Flow (mgd)
Biosolids
Disposal
Methods
CA0038318 SF International Airport Mel Leong Treatment
Plant San Mateo County NBSU SF International Airport
Commercial
Airport 2.20 Landfill
CA0038130 Cities of South San Francisco and San Bruno
WQCP San Mateo County NBSU
City of S. San Francisco, San Bruno, Daly
City, Colma 106,000 13.00 Landfill
CA0038369 South Bayside System Authority WWTP San Mateo County Same
West Bay Sanitary District, City of Belmont,
San Carlos, Redwood City, Woodside and
San Mateo County
217,000 29 mgd Landfill
CA0037532 City of Millbrae WPCP San Mateo County NBSU City of Millbrae 22,000 3.00 Landfill/Land
Application
CA0037788 City of Burlingame WWTF San Mateo County NBSU Burlingame, Hillsborough, San Mateo
County 37,000 5.50
Landfill/Land
Application
CA0037541 San Mateo WWTP San Mateo County Same City of San Mateo, Foster City,
Hillsborough, Belmont; San Mateo County 137,000 15.70 NA
CA0037613 Dublin/San Ramon Services District Alameda County LAVWMA/EBDA DSRSD, City of Pleasanton NA 17.00 NA
CA0038008 Union Sanitary District Alvarado WWTP Alameda County EBDA City of Fremont, Newark, Union City 320,000 33.00 Landfill
CA0038008 Livermore WRP Alameda County LAVWMA/EBDA City of Livermore, Ruby Hill (Pleasanton) NA 8.50 Landfill/Land
Application
CA0037869 Hayward WPCF Alameda County EBDA City of Hayward 140,000 16.50 Landfill/Land
Application
CA0037869 San Leandro WPCP Alameda County EBDA City of San Leandro 50,000 7.60 Landfill
CA0037869 Oro Loma/Castro Valley Sanitary Districts
WPCP Alameda County EBDA
San Lorenzo, Ashland, Cherryland,
Fairview, Castro Valley; City of San Leandro
and Hayward
126,000 14.90 Landfill
CA0037702 EBMUD WPCP Alameda County Same
City of Albany, Alameda, Berkeley,
Emeryville, Oakland, Piedmont; Stege
Sanitary District
636,635 120.00 Landfill/Land
Application
CA0037834 Palo Alto Regional WQCP Santa Clara County Same
City of Los Altos, Los Altos Hills, Palo Alto,
Mountain View, East Palo Sanitary District;
Stanford University
228,500 39.00 Incineration

Pump Station Diversions Feasibility Evaluation
2
DRAFT for review purposes only. Use of contents on this sheet is subject to the limitations specified at the end of this document.
G:\Engineering and Construction\Flood\CleanWater\Arleen\Regional\BASMAA\Regional permit\POCs\General C11 & C12\C.11-12f-diversions\Draft FINAL -Pump Station FER 9-13-2010.doc
Attachment 1. List of Major POTWs in the Bay Area
NPDES
Permit POTW Area Outfall Agencies
Service
Population
Dry
Weather
Design
Flow (mgd)
Biosolids
Disposal
Methods
CA0037842 San Jose/Santa Clara WPCP Santa Clara County Same
City of San Jose, Santa Clara, Milpitas;
SCC CSD No. 2 and 3; WVSD, Campbell
Los Gatos, Monte Sereno, Saratoga; and
Cupertino, Burbank and Sunol Sanitary
Districts
1,365,000 167.00 Landfill/Land
Application
CA0037621 Sunnyvale WPCP Santa Clara County Same City of Sunnyvale, Rancho Rinconada,
Moffett Field 136,000 29.50
Landfill/Land
Application
South County RWWT Authority Santa Clara County
CA0037826 Rodeo Sanitary District WPCF Contra Costa County Same City of Rodeo and Tormey NA 1.14 NA
CA0037648 Central Contra Costa Sanitary District WWTP Contra Costa County Same Contra Costa County 445,000 53.80 NA
CA0038539 West County Wastewater District Treatment
Plant Contra Costa County
West County Agency
(WCA) Common
Outfall
City of Richmond, San Pablo, Tara Hills,
Rollingwood, Bayview, El Sobrante, Pinole,
CC County
90,000 12.50 NA
CA0037796 Pinole/Hercules WPCP Contra Costa County Rodeo Sanitation
District City of Pinole and Hercules NA 4.06 Landfill
CA0005240 C&H Sugar WWTP Contra Costa County Same C&H Sugar, Crockett Community Services
District NA 0.30
Off-site
disposal
CA0038539 Richmond Municipal Sewer District WPCP Contra Costa County
West County Agency
(WCA) Common
Outfall
City of Richmond, Richmond Municipal
Sewer District No. 1 68,000 16.00 NA
CA0037770 Mt. View Sanitary District WWTP Contra Costa County Same Mt. View Sanitary District 25,000 3.20 NA
CA0038547 Delta Diablo Santitation District WWTP Contra Costa County Same Pittsburg, Antioch, Baypoint 189,000 16.50 Landfill/Land
Application
CA0037885 Port Costa WWTP Contra Costa County Same Port Costa 182 0.03 CCCSD
CA0038024 Fairfield-Suisun Sewer District WWTP Solano County Same City of Fairfield, City of Suisun, Solano
County 132,500 17.5
Landfill/Land
Application
CA0037699 Vallejo Sanitation and Flood Control District
WWTP Solano County Same NA NA 15.50 NA