strategic 2017 budget presentations by departments
TRANSCRIPT
STUDY SESSION
TO: Mayor and Council
FROM: Mark Woulf
DEPARTMENT: City Manager's Office
DATE: May 8, 2017
SUBJECT: Strategic 2017 Budget Presentations by Departments
DESCRIPTION:
Strategic 2017 Budget Presentations by Departments
RECOMMENDATION:
Departments will present a strategic view of their 2017 Budgets, cost drivers, concerns/opportunities and the expected impact on 2018.
SUMMARY:
Departments presenting this evening:
Utilities
Littleton Englewood Wastewater Treatment Plan

Utilities Department 2017

Department Overview
Description: The Utilities Department consists of a 28 MGD conventional water treatment plant, approximately 166 miles of water distribution main, approximately 78 miles of collection main, storm drainage collection system and a billing system that processes over 108,000 utility bills annually. The department has seven divisions with 44 full time employees.
Mission: Our mission is to develop, manage, operate and maintain Englewood’s water, wastewater and storm drainage resources prudently and professionally to provide the greatest benefit for the community’s investment.

Department Priority Results
Through our mission, the following priority results are achieved:
Sustainable Natural Environment
Safe and Healthy Community
Attractive, Engaged, Inclusive and Welcoming Community with Desirable, Livable Neighborhoods
Effective Mobility and Reliable Infrastructure
Orderly, Well-Managed Growth and Development
Allen Plant

Distribution and Collection

Utilities Department Staff
Utilities Administration

March 2017 Year-To-DateFunds Summary Water Fund
$2.6, 29%
$1.6, 18%
$4.5, 51%
$0.2, 2%
Dollars $(M)
Personnel Services
Debt Service
Operating Costs
Capital Spending

March 2017 Year-To-DateFunds Summary Sewer Fund
$0.9, 5%
$4.3, 24%
$10.5, 59%
$2.2, 12%
Dollars $(M)
Personnel Services
Debt Service
Operating Costs
Capital Spending
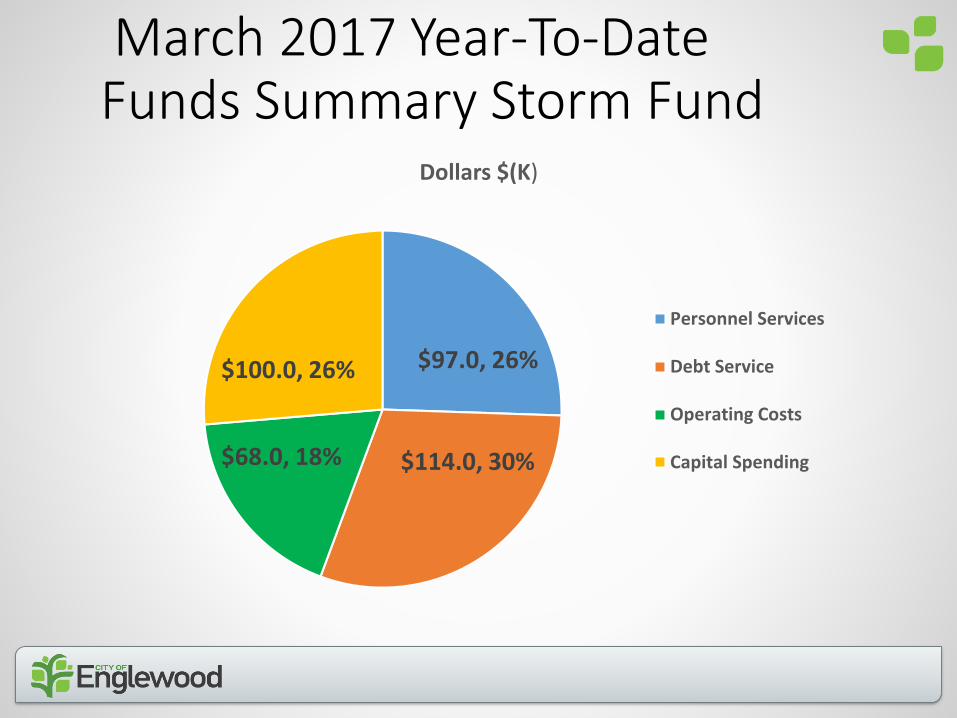
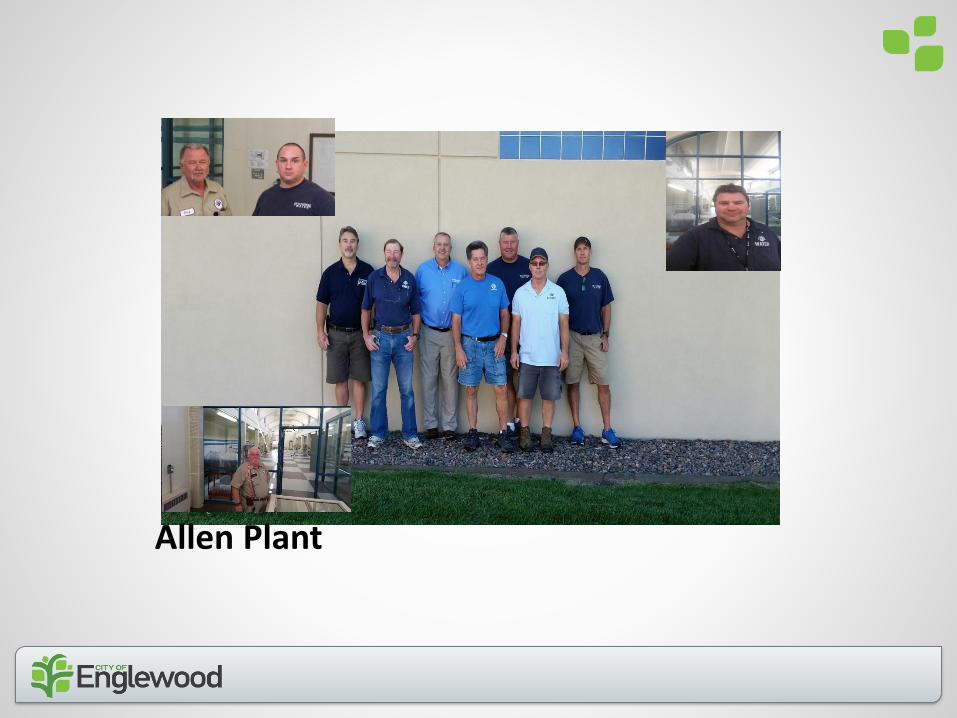
March 2017 Year-To-DateFunds Summary Storm Fund
$97.0, 26%
$114.0, 30%$68.0, 18%
$100.0, 26%
Dollars $(K)
Personnel Services
Debt Service
Operating Costs
Capital Spending

2017 MAJOR PROJECTS UPDATEWater Fund
• CIS Infinity Upgrade
• Filter Media Replacement
• Meadow Creek Conduit Inspection and Flume Rehabilitation
• Water Main Replacement
• Residuals Study
Sewer Fund
• CIS Infinity Upgrade
• Collection System Repair and Replacement
Storm Water
• Large pipe evaluation
• Collection System Repair and Maintenance

CHALLENGES
• Water Rights Defense
• State and EPA Regulatory Mandates
• Storm Sewer System Evaluation
• MS4 Permit – Municipal Separate Storm Sewer System
• Treated Water Hardness – Big Dry Creek Diversion Project
• L/E WWTP Funding
LLEWTP Share, 92%
8%
LLEWTP Share
Collection/Administration

OPPORTUNITIES
REVENUE ENHANCEMENTS/COST RECOVERY
Water Fund:
- Meter Replacement Program
- Plan Review and Inspection Fees
- Service Charges
Sewer Fund:
- District Billing Fee
- Plan Review and Inspection Fees
Storm Water Fund:
- Update Impervious Study

POLICY CONSIDERATIONS
• Fees For Services – All Divisions
• Rate Increases – Sewer & Storm Water 2018 or 2019
• Municipal Code Updates

QUESTIONS:

Littleton/Englewood
Wastewater Treatment Plant

Automated Industrial Facility Focused on Resource Conservation
• 24/7 Uptime Requirements
• 80 Dedicated Professionals Supporting:• $500+ Million New Constructed Value
• 152,000+ Lab Analyses Annually
• 3,000+ alarm points
• 1600+ assets/instruments managed
• 150 control panels
• 80 Variable Frequency Drives (VFDs)
• 7 different Smart Information Networks
• Public Interfaces• Biosolids Hauling and Land Application
• Odor Management & Control
• Public River and Commercial Corridor

Automated Industrial Facility
• Highly Automated Treatment Process• Minimize Chemical Use
• Minimize Energy Footprint
• Minimize Operating Costs
• Leverage Capacity
• Optimize Human Resources

Resource Conservation
• Provide for the Beneficial Use of Nearly 24 million Gallons per day of Sewage• Could fill Mile High Stadium Daily• 300,000+ customers from 108 square mile area• Flow Conveyed through 625 miles of pipe• 18 Sanitation Districts Served• Includes Pretreatment Program• South Platte River Corridor
• Recreation• Drinking Water• Aquatic Life & Wildlife• Agriculture

Resource Conservation
• Recover Other Resources derived from the Process• Land Application of Biosolids
• Phosphorus-rich Soil Amendments
• Biogas as an Energy Resource
• Energy-rich By-products Available from Local Industry

Strategic Direction

Why does the city provide these services? • City Charter explicitly states that “The City shall
have the power to enter into agreement with other persons, associations, corporations, municipalities, or quasi-municipal bodies, for… development of sewage facilities upon such terms as may be agreed upon.”
• Joint-Use Wastewater Treatment Facilities Agreement of 1982 outlines the agreement for the construction and operation of the L/E WWTP

Joint-Use Agreement
• Facility Budget reviewed and approved annually by each City Council
• City of Englewood shall operate the WWTP under the control of a Supervisory Committee
• Operating Costs recouped in proportion to actual flows from each City) - Englewood is paid a 3% administration fee
• Equal Ownership of Plant Infrastructure• Equal cost sharing for capacity expansions
• Equal cost sharing for asset replacement

What expenses are budgeted for 2017?
Personnel, $7,411,788
Operating Costs,
$7,663,454
Capital Costs, $4,080,000
Total Expenses = $19,155, 242

What revenue sources support these services?
Sewer Fund Reserves$343,202
Charges for Service
$18,838,964
Other Revenue$292,831
Investment Income $23,447
Total Revenue = $19,155, 242

2017 Update
• No Permit Violations
• YTD revenue and expenses in line w/ previous years
• Discharge Permit Expected to be Issued this Year
• Capital projects Planned or Underway• Strategic Operations Plan• North, South, and Valley Interceptors Rehabilitation• Rehabilitation of Digester 2 Roof• Beneficial Biogas Utilization
• Organizational Alignment
• Industrial Pretreatment Local Limits Evaluation
• Special Evaluations for Temperature, Mercury, Uranium

Challenges Ahead• Compliance and Safety – Foundational to All
• Reestablish and Align Facility Identity – Resource Recovery (Beyond Compliance)
• Facility is 40 Years Old – Asset Reinvigoration
• Pending Tighter Regulations – Phosphorus, Nitrogen, Temperature
• Data Utilization – Transparent Decision Making
• Leveraging Available Infrastructure – Creative Ways to Produce Net Community Benefit, Reduce Operating Costs, & Produce Revenue Streams

Capital Projects – Looking Ahead
$0
$2,000,000
$4,000,000
$6,000,000
$8,000,000
$10,000,000
$12,000,000
$14,000,000
$16,000,000
$18,000,000
2018 2019 2020 2021 2022
Routine Capital Major Capital
•P
lan
nin
g Le
vel A
ccu
racy
(+/
-4
0%
)
•En
glew
oo
d C
ost
~ 5
0%
of
the
se V
alu
es
Fund Balances within the Sewer Fund Must Be Augmented to Fund this Level of Capital Intensity - Will Need to Increase Revenue Sources

Operations – Looking Ahead
• Are there Options for Additional Funding Sources or ways to Reduce Costs? • Pipeline-Grade Natural Gas
• Local Industry Energy By-Products
• Phosphorus Recovery
• Heat Recovery
• Leverage Capacity

Recap – Issues for 2018 Budget
• Organizational Realignment
• Asset Maintenance and Reinvigoration
• Planning for Needed Capital Improvements.
• Evaluate and present business cases for revenue generation and cost mitigation.
• Gas Utilization Project

Questions?