strategic alpine space areas for cross-regional cooperation
TRANSCRIPT
Strategic Alpine Space Areas
for Cross-regional Cooperation
Gerd Meier zu Köcker, Mateja Dermastia, Michael Keller
June 2017
S3-4AlpClusters is co-financed by the European Regional Development Fund through the Interreg Alpine Space programme
This report was produced within the framework of the S3-4AlpClusters project (deliverable D.T. 1.2.1)
funded by the Alpine Space INTERREG Programme of the European Commission. It was prepared by
Dr. Gerd Meier zu Köcker (ClusterAgentur BW) and Mateja Dermastia (Anteja ECG – Poly4emi).
Regional input for this report was received from all project partners participating in the first phase of
project implementation (January – June 2017). The authors would especially like to thank Christian
Ketels and Sergiy Protsev for their support in providing regional specific data as well as Michael Keller
and Jacques Bersier for their helpful suggestions; Darja Radic, Konstantin Schneider and Benedikt
Sedlmayr for support on data analysis and Fernando Quezada for contributing the Massachusetts
case and general review.
doi:10.23776/001
Disclaimer
The information and views set out in this “Strategic Alpine Space Areas for Cross-regional
Cooperation” are those of the authors and do not necessarily reflect the official opinion of the
European Commission or the respective regions of the project partners. Neither the European
Commission institutions and bodies nor any person acting on their behalf may be held responsible for
the use that may be made of the information contained therein. Reproduction is authorised, provided
the source is acknowledged, unless otherwise stated. Permission must be obtained for use or
reproduction of third party copyrighted material which is specified as such.
The information in this report is provided without assuming any legal responsibility for correctness or
completeness. The data presented in the report are based on the information given by the project
partners and other sources cited.
For further information about the S3-4AlpClusters project, you will find a short description at the end of
the document. To learn more and to download additional resources please refer to the project website
http://www.alpine-space.eu/projects/s3-4alpclusters/en/home.
Page 3
Table of Contents
Key Concepts and Definitions.................................................................................................... 5
Summary ...................................................................................................................................... 6
1. Introduction and Background ............................................................................................. 7
2. Findings ............................................................................................................................... 12
2.1 Priority Areas .............................................................................................................. 12 2.2 Specialisation Areas of S3-4AlpClusters Partners Compared to other
European Regions ..................................................................................................... 15 2.3 Region-Specific Remarks .......................................................................................... 17 2.4 Policy Instruments ...................................................................................................... 20
3. Strategic Alpine Space Areas for Cross-regional Cooperation.................................... 22
3.1 Strategic Alpine Space Area to Cope with Economic Globalisation .......................... 23 3.2 Strategic Alpine Space Area to Cope with Demographic Change ............................. 24 3.3 Strategic Alpine Space Area to Cope with Climate Change ...................................... 25 3.4 Strategic Alpine Space Area to Shape the Transit Region ........................................ 26
4. The Way Ahead ................................................................................................................... 27
Appendix: Comparative Perspectives on Cross-regional Cooperation:
The Case of Massachusetts, USA ............................................................................................ 29
S3-4AlpClusters in a Nutshell .................................................................................................. 32
Page 4
List of Acronyms
BSR
cEDW
EDW
ERDF
ESIF
GDP
KET
PA
Baltic See Region
Cross-regional Entrepreneurial Discovery Workshop
Entrepreneurial Discovery Workshop
European Regional Development Fund
European Structural and Investment Funds
Gross Domestic Product
Key Enabling Technology
Priority Area
R&D
RDI
S3
Research and Development
Research, Development and Innovation
Smart Specialisation Strategy
SME
STI
Small and Medium-sized Enterprise
Science, Technology and Innovation
Page 5
Key Concepts and Definitions
For the purpose of this report, the key concepts and definitions are understood as follows:
Clusters: Clusters are generally described as groups of companies, mainly SMEs and other
actors (government, research and academic community, institutions for collaboration, financial
institutions) co-locating within a geographic area, cooperating around a specialised niche, and
establishing close linkages and working alliances to improve their competitiveness.
Cluster initiatives: A cluster initiative is an organised effort aimed at fostering the
development of the cluster either by strengthening the potential of cluster actors or shaping
relationships between them. They often have a character like a regional network. Cluster
initiatives may be managed by cluster organisations.
Cluster organisations: Cluster organisations are entities that support the strengthening of
collaboration, networking, and learning in innovation clusters and act as innovation support
providers by providing or channelling specialised and customised business support services to
stimulate innovation activities, especially in SMEs. They are usually the actors that facilitate
strategic partnering across clusters. Cluster organisations are also called cluster
managements.
Cluster participants: Cluster participants are companies (users and suppliers), academia or
other intermediaries, which are commonly engaged in a cluster initiative. When a cluster
initiative has a certain legal form, like an association, cluster participants are often called
cluster members.
Cluster policy: Cluster policy is an expression of political commitment, composed of a set of
specific government policy interventions that aim to strengthen existing clusters and / or
facilitate the emergence of new ones. A cluster policy is seen as a framework policy that
opens the way for the bottom-up dynamics seen in clusters and cluster initiatives. This differs
from the approach taken by traditional industrial policies which try (and most often fail) to
create or back winners.
Programme: Programmes are vehicle to implement a policy, e. g. a funding programme for
R&D in environmental technology. In addition to programmes, policies are also implemented
through regulation (= regulatory framework, e. g. law on consumer protection).
Smart Specialisation Strategies (S3): Smart Specialisation is a strategic approach to
economic development through targeted support for research and innovation. It involves a
process of developing a vision, identifying the place-based areas of greatest strategic
potential, developing multi-stakeholder governance mechanisms, setting strategic priorities
and using smart policies to maximise the knowledge-based development potential of a region,
regardless of whether it is strong or weak, high-tech or low-tech1.
Priority Areas are “the locus for resource concentration and prioritisation within S3”. They
should include the “activities that are likely to effectively transform the existing economic
structures through R&D and innovation” (ibid, p.3).
1
Foray, D. (2015). Smart Specialization, Opportunities and Challenges for Regional Innovation Policy, Routledge.
Page 6
Summary
The present report identifies potential synergies among Smart Specialisation Strategies (S3) of the
S3-4AlpClusters partners. It goes beyond the current state of discussion on S3 formulation and
promotes a better understanding of what cross-regional collaboration and resulting synergies mean for
the selected partners from the Alpine Region in the context of Smart Specialisation. The report is
intended to shed light on sectors and industries which can be matched transnationally to gain critical
mass for global success as well as on tools and policy instruments that can likely support such
development. The report shifts away from traditional approaches to cluster matchmaking as a tool for
cross-sectorial and cross-regional cooperation. It provides valuable insights into the forthcoming
demands and dynamics of cross-regional cluster collaboration. It highlights the opportunities for joint
innovation among regions of different population sizes as well as different investment capacities, and
different areas of specialisation.
Using data collected by partners on their respective S3, a variety of indicators were analysed. The 11
S3-4AlpClusters regions are innovation front-runners which specialise in selected areas of emerging
industries. The participating regions differ significantly in terms of their size, numbers, and variety of
clusters in traditional and emerging industries, as well as investments and complexity of policy
instruments. Individual S3 approaches of the partner regions vary greatly. Some regions use a
regional innovation strategy as S3; others have one national-level S3 and another S3 at the regional
level.
It is a challenge to match Priority Areas (PAs) of S3. ICT / Digitalisation, Environment / Energy,
Agrofood, Life Science / Health and Manufacturing are areas most often targeted by the Priority Areas
(PA) of the partners’ regions. They include a variety of different sub areas which can be a source of
synergies, but the partners’ S3 do not define the particular areas of cross regional collaboration. There
are no single policy instruments applied by S3-4AlpClusters partner regions for purposes of supporting
cross-regional cooperation to create critical mass in selected priority areas in the Alpine macro-
regional context. Some other studies and statistics were used in this respect. Mapping studies of the
European Cluster Panorama from the European Cluster Observatory provided insights into the current
strengths of the partner’s regions in comparison to other EU regions. Further, S3 synergy diamonds
were developed to capture the concentration of activities in the Alpine Space region in selected areas
of specialisation. However, sector dynamic and flow of interactions are linked to the future
development and thus cannot be accurately estimated in this phase.
The insight gained at the macro-regional level so far indicates that much more work is needed to
overcome the obstacles that arise from the local context of S3. The challenge remains to understand
the potential of the market and the mechanisms needed to facilitate linkages among Alpine Space
actors for purposes of initiating transformative actions with actual market implications. Many more
SMEs, firms, and entrepreneurs would need to be engaged in cross-regional activities in order to
reach a critical mass in their respective interactions.
Cross-regional Entrepreneurial Discovery Workshops (cEDW), in this respect, can provide a forum in
which such interaction might be initiated and can help to foster the creation of meaningful cross-
regional linkages and synergies. In this setting, the new evidence based discussions redirect attention
to the more grounded, day-to-day interactions by which real companies in real places do transactions,
pursue innovations, start new businesses and create jobs. In addition, cEDW can enhance policy
learning and adaptation of policy tools that can further promote the concentration of resources on
those activities that transform the existing economic structures through R&D and innovation within a
given region and across the S3-4AlpClusters partner regions. Ideally, a new level of interactions and
activities can deliver higher returns on taxpayers’ money and promote the well-being of Alpine Space
community.
Page 7
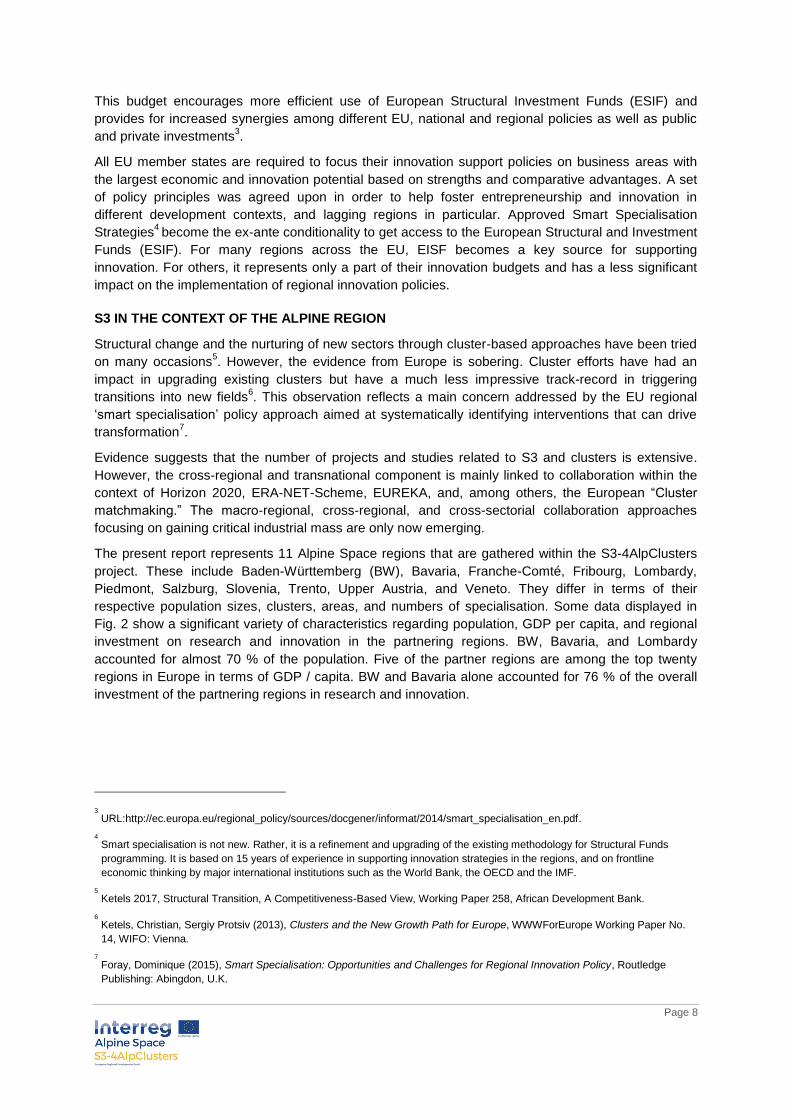
1. Introduction and Background
The ongoing globalisation of markets ties the sustainability of firms to the competitiveness of the
industries in which they participate. Even in local markets, firms within industries and clusters within
regions increasingly compete with firms and industries across the globe (s. Fig. 1). Success in the
global market requires entire industries and corresponding value chains to deliver a product into the
market faster than competitors from other countries or regions. This implies innovation and production
value chains that increasingly span over countries and continents2.
Figure 1: Trends on globalisation
SMART SPECIALISATION
In recent years, the Smart Specialisation concept has gained increasing importance in regions within
the EU. One of the rationales for this trend is the emergence of new industries and increasing
technological convergence which leads to the continuous reshaping of the business environment as
well as calls for new business models, novel strategies, and creative policy approaches. On the other
hand, during the current time of increasingly tight budgets, regions need to prioritise their spending on
innovation efforts. The question is not whether EU regions will stop growing without innovation but
rather whether the growth rate can be further enhanced by promoting more innovation in selected
priority areas.
Smart Specialisations become an attractive option from the perspective of the 2014 – 2020 EC
budget.
2
Trend acknowledge in recent EU publication “Reflection Paper on Harnessing Globalisation”,
https://ec.europa.eu/commission/publications/reflection-paper-harnessing-globalisation_en.
Page 8
This budget encourages more efficient use of European Structural Investment Funds (ESIF) and
provides for increased synergies among different EU, national and regional policies as well as public
and private investments3.
All EU member states are required to focus their innovation support policies on business areas with
the largest economic and innovation potential based on strengths and comparative advantages. A set
of policy principles was agreed upon in order to help foster entrepreneurship and innovation in
different development contexts, and lagging regions in particular. Approved Smart Specialisation
Strategies4 become the ex-ante conditionality to get access to the European Structural and Investment
Funds (ESIF). For many regions across the EU, EISF becomes a key source for supporting
innovation. For others, it represents only a part of their innovation budgets and has a less significant
impact on the implementation of regional innovation policies.
S3 IN THE CONTEXT OF THE ALPINE REGION
Structural change and the nurturing of new sectors through cluster-based approaches have been tried
on many occasions5. However, the evidence from Europe is sobering. Cluster efforts have had an
impact in upgrading existing clusters but have a much less impressive track-record in triggering
transitions into new fields6. This observation reflects a main concern addressed by the EU regional
‘smart specialisation’ policy approach aimed at systematically identifying interventions that can drive
transformation7.
Evidence suggests that the number of projects and studies related to S3 and clusters is extensive.
However, the cross-regional and transnational component is mainly linked to collaboration within the
context of Horizon 2020, ERA-NET-Scheme, EUREKA, and, among others, the European “Cluster
matchmaking.” The macro-regional, cross-regional, and cross-sectorial collaboration approaches
focusing on gaining critical industrial mass are only now emerging.
The present report represents 11 Alpine Space regions that are gathered within the S3-4AlpClusters
project. These include Baden-Württemberg (BW), Bavaria, Franche-Comté, Fribourg, Lombardy,
Piedmont, Salzburg, Slovenia, Trento, Upper Austria, and Veneto. They differ in terms of their
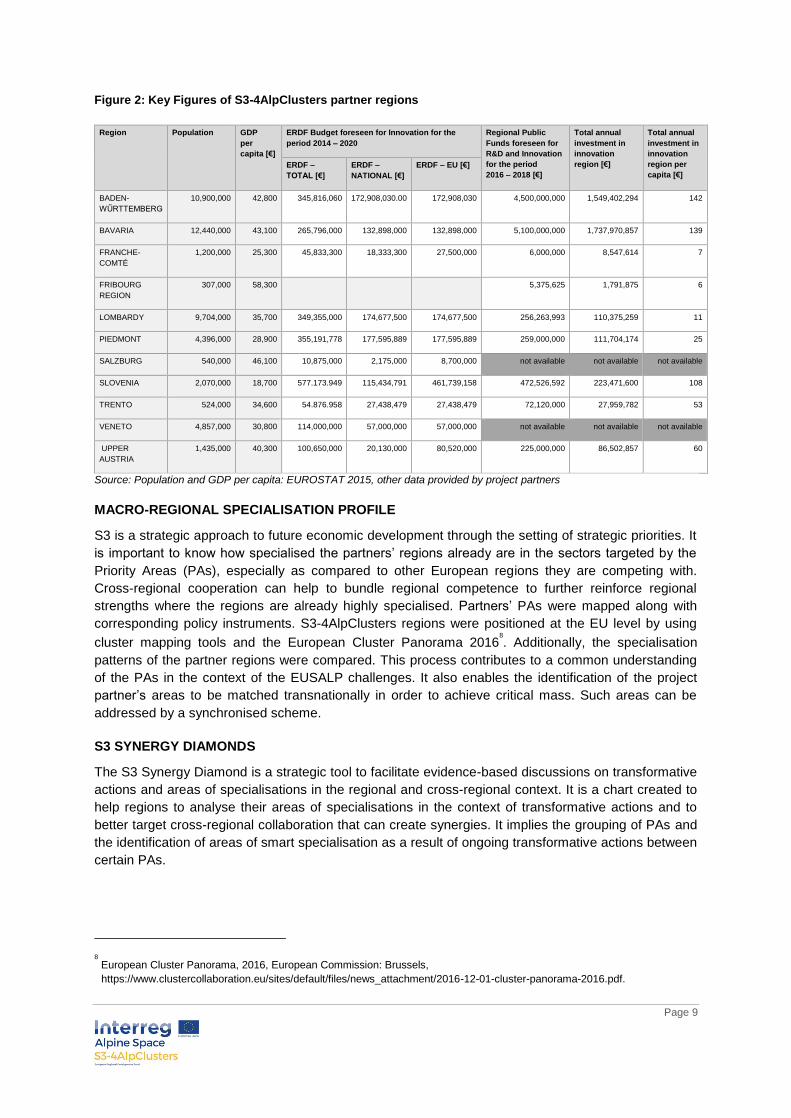
respective population sizes, clusters, areas, and numbers of specialisation. Some data displayed in
Fig. 2 show a significant variety of characteristics regarding population, GDP per capita, and regional
investment on research and innovation in the partnering regions. BW, Bavaria, and Lombardy
accounted for almost 70 % of the population. Five of the partner regions are among the top twenty
regions in Europe in terms of GDP / capita. BW and Bavaria alone accounted for 76 % of the overall
investment of the partnering regions in research and innovation.
3
URL:http://ec.europa.eu/regional_policy/sources/docgener/informat/2014/smart_specialisation_en.pdf.
4
Smart specialisation is not new. Rather, it is a refinement and upgrading of the existing methodology for Structural Funds
programming. It is based on 15 years of experience in supporting innovation strategies in the regions, and on frontline
economic thinking by major international institutions such as the World Bank, the OECD and the IMF.
5
Ketels 2017, Structural Transition, A Competitiveness-Based View, Working Paper 258, African Development Bank.
6
Ketels, Christian, Sergiy Protsiv (2013), Clusters and the New Growth Path for Europe, WWWForEurope Working Paper No.
14, WIFO: Vienna.
7
Foray, Dominique (2015), Smart Specialisation: Opportunities and Challenges for Regional Innovation Policy, Routledge
Publishing: Abingdon, U.K.
Page 9
Figure 2: Key Figures of S3-4AlpClusters partner regions
Region Population GDP
per
capita [€]
ERDF Budget foreseen for Innovation for the
period 2014 – 2020
Regional Public
Funds foreseen for
R&D and Innovation
for the period
2016 – 2018 [€]
Total annual
investment in
innovation
region [€]
Total annual
investment in
innovation
region per
capita [€]
ERDF –
TOTAL [€]
ERDF –
NATIONAL [€]
ERDF – EU [€]
BADEN-
WŰRTTEMBERG
10,900,000 42,800 345,816,060 172,908,030.00 172,908,030 4,500,000,000 1,549,402,294 142
BAVARIA 12,440,000 43,100 265,796,000 132,898,000 132,898,000 5,100,000,000 1,737,970,857 139
FRANCHE-
COMTÉ
1,200,000 25,300 45,833,300 18,333,300 27,500,000 6,000,000 8,547,614 7
FRIBOURG
REGION
307,000 58,300 5,375,625 1,791,875 6
LOMBARDY 9,704,000 35,700 349,355,000 174,677,500 174,677,500 256,263,993 110,375,259 11
PIEDMONT 4,396,000 28,900 355,191,778 177,595,889 177,595,889 259,000,000 111,704,174 25
SALZBURG 540,000 46,100 10,875,000 2,175,000 8,700,000 not available not available not available
SLOVENIA 2,070,000 18,700 577.173.949 115,434,791 461,739,158 472,526,592 223,471,600 108
TRENTO 524,000 34,600 54.876.958 27,438,479 27,438,479 72,120,000 27,959,782 53
VENETO 4,857,000 30,800 114,000,000 57,000,000 57,000,000 not available not available not available
UPPER
AUSTRIA
1,435,000 40,300 100,650,000 20,130,000 80,520,000 225,000,000 86,502,857 60
Source: Population and GDP per capita: EUROSTAT 2015, other data provided by project partners
MACRO-REGIONAL SPECIALISATION PROFILE
S3 is a strategic approach to future economic development through the setting of strategic priorities. It
is important to know how specialised the partners’ regions already are in the sectors targeted by the
Priority Areas (PAs), especially as compared to other European regions they are competing with.
Cross-regional cooperation can help to bundle regional competence to further reinforce regional
strengths where the regions are already highly specialised. Partners’ PAs were mapped along with
corresponding policy instruments. S3-4AlpClusters regions were positioned at the EU level by using
cluster mapping tools and the European Cluster Panorama 20168
. Additionally, the specialisation
patterns of the partner regions were compared. This process contributes to a common understanding
of the PAs in the context of the EUSALP challenges. It also enables the identification of the project
partner’s areas to be matched transnationally in order to achieve critical mass. Such areas can be
addressed by a synchronised scheme.
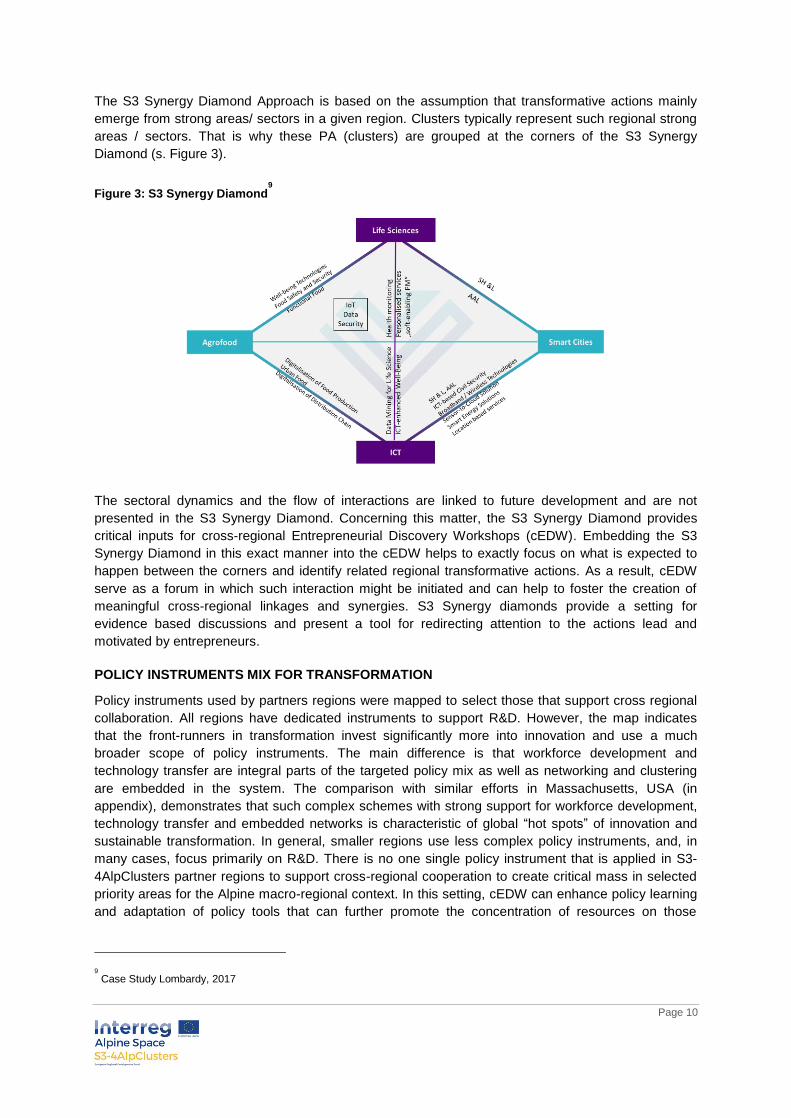
S3 SYNERGY DIAMONDS
The S3 Synergy Diamond is a strategic tool to facilitate evidence-based discussions on transformative
actions and areas of specialisations in the regional and cross-regional context. It is a chart created to
help regions to analyse their areas of specialisations in the context of transformative actions and to
better target cross-regional collaboration that can create synergies. It implies the grouping of PAs and
the identification of areas of smart specialisation as a result of ongoing transformative actions between
certain PAs.
8
European Cluster Panorama, 2016, European Commission: Brussels,
https://www.clustercollaboration.eu/sites/default/files/news_attachment/2016-12-01-cluster-panorama-2016.pdf.
Page 10
The S3 Synergy Diamond Approach is based on the assumption that transformative actions mainly
emerge from strong areas/ sectors in a given region. Clusters typically represent such regional strong
areas / sectors. That is why these PA (clusters) are grouped at the corners of the S3 Synergy
Diamond (s. Figure 3).
Figure 3: S3 Synergy Diamond9
The sectoral dynamics and the flow of interactions are linked to future development and are not
presented in the S3 Synergy Diamond. Concerning this matter, the S3 Synergy Diamond provides
critical inputs for cross-regional Entrepreneurial Discovery Workshops (cEDW). Embedding the S3
Synergy Diamond in this exact manner into the cEDW helps to exactly focus on what is expected to
happen between the corners and identify related regional transformative actions. As a result, cEDW
serve as a forum in which such interaction might be initiated and can help to foster the creation of
meaningful cross-regional linkages and synergies. S3 Synergy diamonds provide a setting for
evidence based discussions and present a tool for redirecting attention to the actions lead and
motivated by entrepreneurs.
POLICY INSTRUMENTS MIX FOR TRANSFORMATION
Policy instruments used by partners regions were mapped to select those that support cross regional
collaboration. All regions have dedicated instruments to support R&D. However, the map indicates
that the front-runners in transformation invest significantly more into innovation and use a much
broader scope of policy instruments. The main difference is that workforce development and
technology transfer are integral parts of the targeted policy mix as well as networking and clustering
are embedded in the system. The comparison with similar efforts in Massachusetts, USA (in
appendix), demonstrates that such complex schemes with strong support for workforce development,
technology transfer and embedded networks is characteristic of global “hot spots” of innovation and
sustainable transformation. In general, smaller regions use less complex policy instruments, and, in
many cases, focus primarily on R&D. There is no one single policy instrument that is applied in S3-
4AlpClusters partner regions to support cross-regional cooperation to create critical mass in selected
priority areas for the Alpine macro-regional context. In this setting, cEDW can enhance policy learning
and adaptation of policy tools that can further promote the concentration of resources on those
9
Case Study Lombardy, 2017
Page 11
activities that transform the existing economic structures through R&D and innovation within a given
region and across the S3-4AlpClusters partner regions.
The identification of synergies this report aims for is based on the assumption that all Alpine Space
regions have developed Smart Specialisation Strategies. Related Priority Areas can serve as Strategic
Alpine Space Areas for cross-regional cooperation. A variety of indicators were analysed by using
data collected by partners on their respective S3. In the present exercise, three basic principles were
applied: collection of relevant data on S3 from partner regions, utilisation of consultation and feedback
from partners and experts, and ensuring alignment between EU Strategy for the Alpine Region
(EUSALP) challenges and objectives of S3-4AlpClusters partner regions.
Page 12
2. Findings
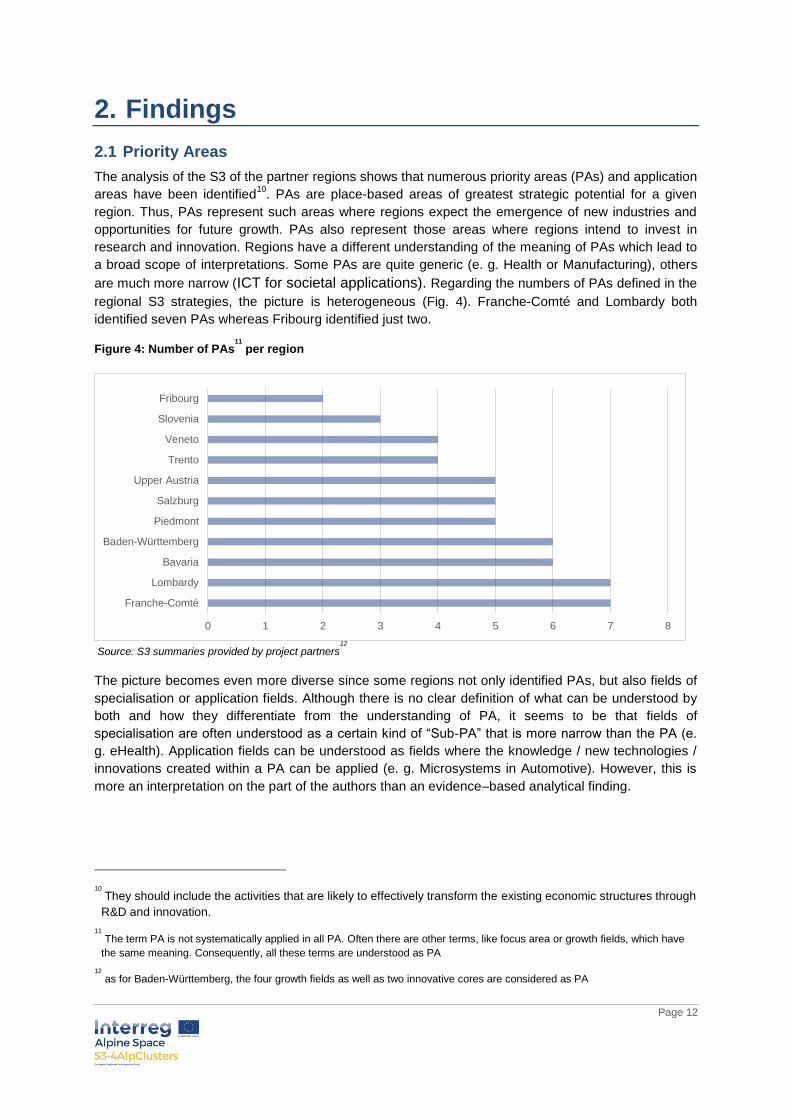
2.1 Priority Areas
The analysis of the S3 of the partner regions shows that numerous priority areas (PAs) and application
areas have been identified10
. PAs are place-based areas of greatest strategic potential for a given
region. Thus, PAs represent such areas where regions expect the emergence of new industries and
opportunities for future growth. PAs also represent those areas where regions intend to invest in
research and innovation. Regions have a different understanding of the meaning of PAs which lead to
a broad scope of interpretations. Some PAs are quite generic (e. g. Health or Manufacturing), others
are much more narrow (ICT for societal applications). Regarding the numbers of PAs defined in the
regional S3 strategies, the picture is heterogeneous (Fig. 4). Franche-Comté and Lombardy both
identified seven PAs whereas Fribourg identified just two.
Figure 4: Number of PAs11
per region
Source: S3 summaries provided by project partners
12
The picture becomes even more diverse since some regions not only identified PAs, but also fields of
specialisation or application fields. Although there is no clear definition of what can be understood by
both and how they differentiate from the understanding of PA, it seems to be that fields of
specialisation are often understood as a certain kind of “Sub-PA” that is more narrow than the PA (e.
g. eHealth). Application fields can be understood as fields where the knowledge / new technologies /
innovations created within a PA can be applied (e. g. Microsystems in Automotive). However, this is
more an interpretation on the part of the authors than an evidence–based analytical finding.
10
They should include the activities that are likely to effectively transform the existing economic structures through
R&D and innovation.
11
The term PA is not systematically applied in all PA. Often there are other terms, like focus area or growth fields, which have
the same meaning. Consequently, all these terms are understood as PA
12
as for Baden-Württemberg, the four growth fields as well as two innovative cores are considered as PA
0 1 2 3 4 5 6 7 8
Franche-Comté
Lombardy
Bavaria
Baden-Württemberg
Piedmont
Salzburg
Upper Austria
Trento
Veneto
Slovenia
Fribourg
Page 13
Figure 5: Sectors covered by the partners’ regions PA
Number of
PAs
Agrofood Manufacturing Mobility /
Automotive
Creative
Industries
Life
Sciences /
Health
Materials ICT /
Digitalisation
Environment &
Energy
Tourism Smart
Cities /
Quality of
Life
Building /
Construction
Building
Aerospace
Baden-
Württemberg
6 x x x x x x
Bavaria 6 x x x x x x
Franche-Comté 7 x x x x x x x
Fribourg 2 x x x x x x
Lombardy 7 x x x x x x x
Piedmont 5 x x x x x
Salzburg 5 x x x x x x x
Slovenia 3 x x x x x x x x x
Trento 4 x x x x x
Upper Austria 5 x x x x x x
Veneto 4 x x x x x x x
8 8 6 4 8 6 9 8 4 3 4 3
Fig. 5 displays which sectors are targeted by the project partner region by PA. Sometimes the PAs
defined by the regions cover more areas than one sector (e. g. Fribourg “Tourism and Food” or
Baden-Württemberg “ICT and Intelligent Production”). When having a closer look at the PAs across
the participating regions, it becomes clear that sectors like ICT / Digitalisation, Environment / Energy,
Agrofood, Life Science / Health and Manufacturing are areas most often targeted by the partners’
regions PA (Fig. 6).
Figure 6: Number of regions that prioritise certain sectors based on their PA
Source: S3 summaries provided by project partners
0 1 2 3 4 5 6 7 8 9 10 11
ICT / Digitalisation
Environment / Energy
Agrofood
Life Science / Health
Manufacturing
Mobility / Automotive
Materials
Creative Industries
Building / Construction
Tourism
Aerospace
Smart City / Quality of Life
Page 14
Fig. 7 shows how different regions, on average, intend to invest per PA. Whereas Bavaria and Baden-
Württemberg invest more than 250 Mio EUR per PA on average per anno, Trento, Fribourg and
Franche-Comté invest less than 10 Mio EUR. It is obvious that this can lead to significant disparities
in STI capacity and investments. However, an educated guess would be that those regions that
invest comparably low amounts of money will significantly benefit by bundling financial resources
across neighbouring regions and, thus, can achieve a critical mass in terms of public (and private)
investments in order to gain industrial leadership in these PAs.
Figure 7: Public regional investment per PA
Source: S3 summaries provided by project partners, no data provided for Salzburg and Veneto
Partner regions reported about 125 policy instruments which address innovation interests linked to the
57 Priority Areas. They reflect a high degree of variability and extensive horizontal linkages. Bavaria -
and to certain extent Slovenia – both have specific measures directed at their respective Priority
Areas. In terms of the cross regional and cross sectorial cooperation, regions tend to display limited
activities. The alignment of policy instruments among neighbouring regions is very low.13
Some of
regions promote export by using clusters and only Baden-Württemberg launched transregional
support schemes with Sweden and other Scandinavian regions focused on innovation.
Fig. 8 compares the number of policy instruments per regions against the overall annual public
investment in STI. Baden-Württemberg applies a high number of policy instruments. This allows the
region to have very tailor-made and demand oriented policy instruments in place with significant
budgets. The Fribourg region defined more than 10 policy instruments, but tends to have a less than
critical amount of funding on average due to the low overall public investment. Franche-Comté,
spending a similar amount of public funding per year, works with a lower number of more generic
policy instruments that all cover the different areas defined in its PA. Also Slovenia and Lombardy
have a high amount of public funding (on average) available per policy instrument.
13
See StressTest results, http://www.alpine-space.eu/projects/s3-4alpclusters/en/home.
€- €50.000.000 €100.000.000 €150.000.000 €200.000.000 €250.000.000 €300.000.000
Bavaria
Baden-Württemberg
Slovenia
Piedmont
Upper Austria
Lombardy
Trento
Fribourg
Franche-Comté
Page 15
Figure 8: Annual overall investments vs. number of Policy Instruments
Data provided by the partners, no data available for Salzburg and Trento
These first results put forward a variety of issues that need a closer look in the next phases of the
project. The ongoing discussions point out that much more clarity is needed on how current PAs (and
Areas of Specialisation / Application Areas) are defined and embedded in regional innovation policies
and strategies and which PAs can be best matched transregionally in order to gain critical mass.
Exchanges with partners confirmed that much more attention should be given to the Entrepreneurial
Discovery Process as a tool to identify demand-driven opportunities for cross-sectoral cooperation.
One of the core objectives might be to bundle strengths to keep or gain industrial leadership in those
areas which are of interest for the Alpine Space regions.
2.2 Specialisation Areas of S3-4AlpClusters Partners Compared to other European Regions
The previous chapter has shown that the following PAs are of most interest to the partner regions:
ICT / Digitalisation,
Environment / Energy,
Agrofood,
Life Science / Health, and
Manufacturing.
For purposes of cross-regional collaboration based on regional strengths, the position of the project
partner regions within Europe needs further consideration. How much specialised are the partner
Page 16
regions in these PA compared to European peers? Specialisation can be measured by the relative
size of regional employment in a given sector (or PA) reflected in its location quotient (LQ)14
.
This relative measure indicates how much stronger a region is in a specific sector (PA) than it would
be expected given its overall size, compared to the average employment size in the specific sector
(PA) across all European regions. The European Cluster Panorama 201615
was used for positioning
the S3-4AlpClusters region in the EU regarding specialisations, but Fribourg region is not included in
this analysis as the data for Switzerland were not available.
Fig. 9 displays to where S3-4AlpClusters partner regions are highly specialised compared to all EU
regions, e. g. in Mobility (6 regions), Medical Devices (5 regions), Biopharmaceutical (4 regions),
Digitalisation (3 regions), Environmental Industries (3 regions), and Tourism (2 regions) can be
considered. Very regional specific LQ-values are given for Baden-Württemberg (6,5 for Medical
Devices), Bavaria (3,1 for Medical Devises), Franche-Comté (2,7 for Mobility), Salzburg and Trento
(both 3,0 for Tourism).
Fig. 9: Specialisation areas of selected Alpine Space regions with comparison with European peers
Source: European Cluster Panorama and location quotient of partners’ regions in selected sectors compared to 251 European
NUT 2 region; no data available for Fribourg region, Espcace Mittelland was chosen as corresponding NUT 2 region.
14
An LQ is computed as an industry’s share of a regional total for some economic statistics (earnings, GDP by metropolitan
area, employment, etc.) divided by the industry’s share of the regional total for the same statistic. For example, an LQ of 1.0 in
mining means that the region equally specialises in mining; while an LQ of 1.5 means that the region has a significant higher
concentration in mining than other regions. Bureau of Economic Analyses, https://www.bea.gov/faq/index.cfm?faq_id=478.
15
European Cluster Panorama, 2016, European Commission: Brussels,
https://www.clustercollaboration.eu/sites/default/files/news_attachment/2016-12-01-cluster-panorama-2016.pdf.
1,5
2
2,5
3
3,5
4
4,5
5
Food processing Medical Devices Biopharmacentical Digitalisation
Tourism Environmental Industries Construction Mobilty
Page 17
The findings given in Fig. 9 show good conformity to the PA defined in the partner regions’ S3. The
only exception is the Agrofood area, where most of the regions scored between 0,6 (Baden-
Württemberg) and 1,6 (Trento).
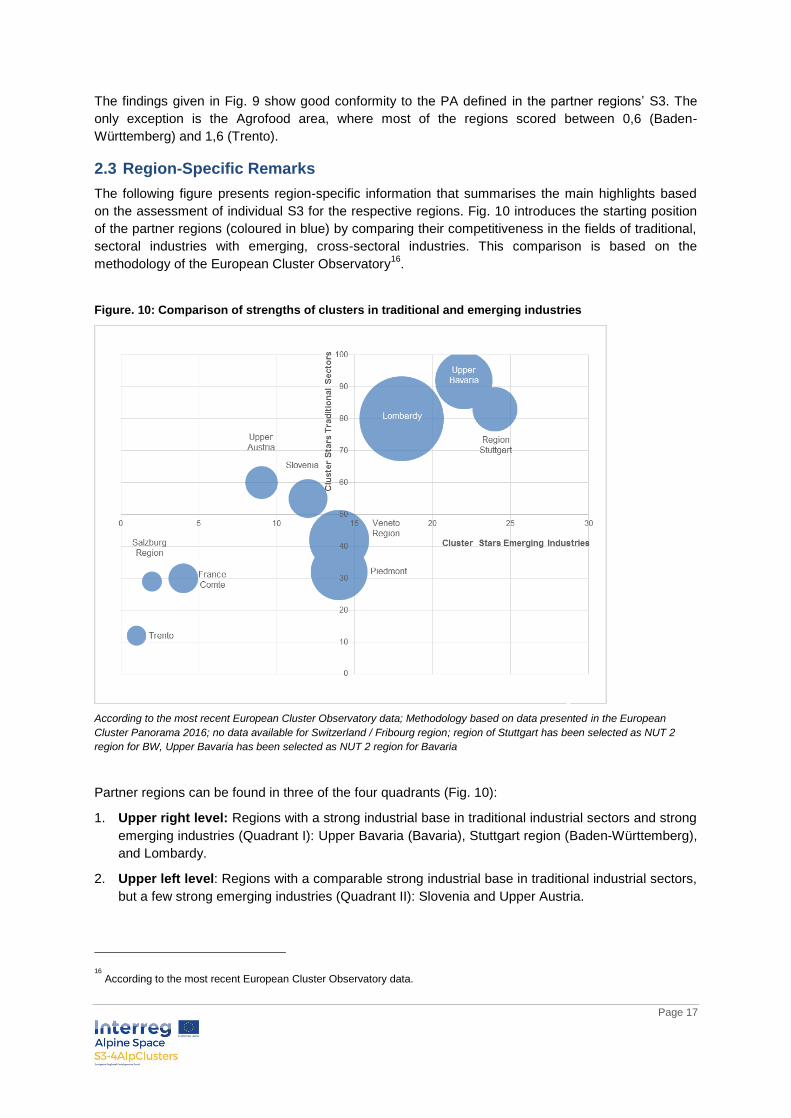
2.3 Region-Specific Remarks
The following figure presents region-specific information that summarises the main highlights based
on the assessment of individual S3 for the respective regions. Fig. 10 introduces the starting position
of the partner regions (coloured in blue) by comparing their competitiveness in the fields of traditional,
sectoral industries with emerging, cross-sectoral industries. This comparison is based on the
methodology of the European Cluster Observatory16
.
Figure. 10: Comparison of strengths of clusters in traditional and emerging industries
According to the most recent European Cluster Observatory data; Methodology based on data presented in the European
Cluster Panorama 2016; no data available for Switzerland / Fribourg region; region of Stuttgart has been selected as NUT 2
region for BW, Upper Bavaria has been selected as NUT 2 region for Bavaria
Partner regions can be found in three of the four quadrants (Fig. 10):
1. Upper right level: Regions with a strong industrial base in traditional industrial sectors and strong
emerging industries (Quadrant I): Upper Bavaria (Bavaria), Stuttgart region (Baden-Württemberg),
and Lombardy.
2. Upper left level: Regions with a comparable strong industrial base in traditional industrial sectors,
but a few strong emerging industries (Quadrant II): Slovenia and Upper Austria.
16
According to the most recent European Cluster Observatory data.
Page 18
3. Lower left level: Regions with limited industries in traditional and emerging sectors (Quadrant II):
Franche-Comté, Trento, and Salzburg.
Piedmont and Veneto build a certain group “in the middle”, sharing some characteristics of all other
groups. A closer look indicates some common patterns relevant for each of the quadrants.
1. Upper right level: Regions with a strong industrial base in traditional industrial sectors and
strong emerging industries (Quadrant I): Upper Bavaria (Bavaria), Stuttgart region (Baden-
Württemberg), and Lombardy.
These regions succeeded in building strong emerging industries (and strong clusters) starting from
strong traditional industrial industries (regional assets). Regardless of whether these regions already
had a certain kind of smart specialisation strategy in the past, the industry base successfully
incorporated new emerging industries. All three regions are among EU hotspots of emerging
industries and hotspots of clusters.
While all three regions count a high number of gazelles17
in emerging industries, especially Lombardy
outperforms all EU regions in terms employments’ level in the gazelles (s. Fig. 10). The box below
summarises some characteristics for the three regions.
Baden-Württemberg Bavaria Lombardy
Public investment in RDI 1.5
BN EUR per year with a
small share of ERDF
Hot-spot region in emerging
industry
Dialogue-driven policy
process since decades
Complex policy instruments
allow targeted funding*
Public investment in RDI 1.7
BN EUR per year with a small
share of ERDF
Hot-spot region in emerging
industry
S3 is the regional innovation
strategy
Complex policy instruments
allow targeted funding*
Small share of public
investment coming from ERDF
S3 designed in line with the EC
Separate S3 governance is
created
Highest level of employment in
gazelles in Europe
*Comparable to more than S3-4AlpClusters regions
2. Upper left level: Regions with a comparable strong industrial base in traditional industrial
sectors, but a few strong emerging industries (Quadrant II): Slovenia and Upper Austria.
Slovenia and Upper Austria have a high number of cluster stars in traditional industries. Both result in
a good basis on which to create new emerging industries but might be challenged with limited options
for scaling up in their home regions. Cross-regional cooperation in selected areas has the potential of
accelerating the emergence of new industries that are important for both regions. This is the case due
to limited capabilities in academia and industries as well as in public investments (compared to other
regions positioned in the upper right quadrant).
Slovenia developed a comprehensive S3 based on an entrepreneurial discovery process which
resulted in well-selected transformative activities in which a new generation of clusters (strategic
partnerships) plays a critical role. Slovenia is the only country with significant investment per priority
areas comparable to Baden-Württemberg and Bavaria. Upper Austria did not develop its own S3
strategy since it is well aligned to Austrian S3. Firms and actors align their project objectives to
national S3 when they apply for structural funds.
17
Gazelles are considered to be fast-growing new firms (less than 5 years old and grew by at least 10 % a year over 3 years).
Data from the European Cluster Observatory 2016.
Page 19
Upper Austria Slovenia
S3 at the level of Austria
High attention given to clusters as tool to
implement S3
Complex policy instrument with limited
programme budgets
3rd
highest public investment in RDI among S3-
4AlpClusters partners
Comprehensive S3 based on facts and
Entrepreneurial Discovery Processes
Strategic partnerships as a backbone of S3
implementation*
Small number of policy instruments, but with
significant programme budgets
*Comparable to more than S3-4AlpClusters regions
3. Lower left level: Regions with limited industries in traditional and emerging sectors
(Quadrant III): Franche-Comté, Fribourg, Trento, Salzburg, Piedmont, and Veneto
Regions in this group are characterised by the size and by highest specialisations in selected fields (s.
Fig. 8). Further transformative actions might be challenged by the rather low number of clusters in
strong traditional industries. Thus, cross-regional collaboration among these types of highly
specialised small regions is of very high importance. This is not necessarily to bundle industrial critical
mass but rather to be more exposed to global demand from different areas. Cross-regional
cooperation brings together areas of individual regional strengths that can, when merged, act as a
starting point for new emerging industries. The respective S3 take this demand into account. However,
the current S3 of all regions analysed in this report are limited in terms of initiating cross-regional
cooperation18
.
Smaller, but highly specialised regions
Franche-Comté Fribourg Region Trento Salzburg
Highest number of
PAs among all
partners
Cross-regional
cooperation with
neighbouring regions
encouraged
One generic policy
instrument in place
S3 run as joint public
private efforts, not
linked to the guidelines
of the EC
Lowest number of PAs
(two) among the project
partners’ region
Comparable high
number of policy
instruments in place
compared to the limited
public investments
S3 process is
run according
to the
guidelines of
the EC
S3 at the level of
Austria
Strong focus on cross-
regional cooperation in
Life Science and Smart
Data
High number of policy
instruments in place
compared to the limited
number of public
investments
Entrepreneurial driven regions
18
See regional StressTest reports, available at: http://www.alpine-space.eu/projects/s3-4alpclusters/en/home.
Piedmont Veneto
Small number of policy instruments, but with
significant programme budgets
Very high level of employment in gazelles in
Europe
S3 process is run according to the guidelines of the
EC
S3 is well aligned on national and neighbouring
regional level
Very high level of employment in gazelles in Europe
Cluster initiatives are actively involved in the
development of S3
Missing data for regional, non-ERDF funds
Policy instrument dedicated to R&D
Page 20
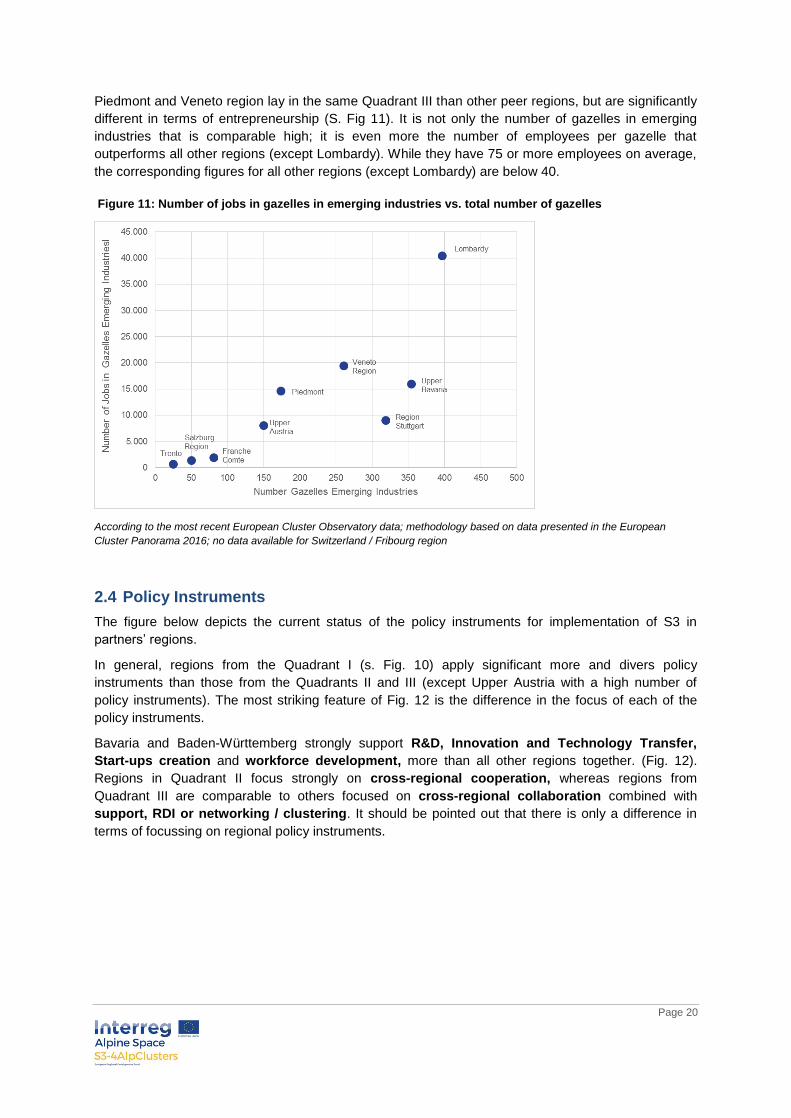
Piedmont and Veneto region lay in the same Quadrant III than other peer regions, but are significantly
different in terms of entrepreneurship (S. Fig 11). It is not only the number of gazelles in emerging
industries that is comparable high; it is even more the number of employees per gazelle that
outperforms all other regions (except Lombardy). While they have 75 or more employees on average,
the corresponding figures for all other regions (except Lombardy) are below 40.
Figure 11: Number of jobs in gazelles in emerging industries vs. total number of gazelles
According to the most recent European Cluster Observatory data; methodology based on data presented in the European
Cluster Panorama 2016; no data available for Switzerland / Fribourg region
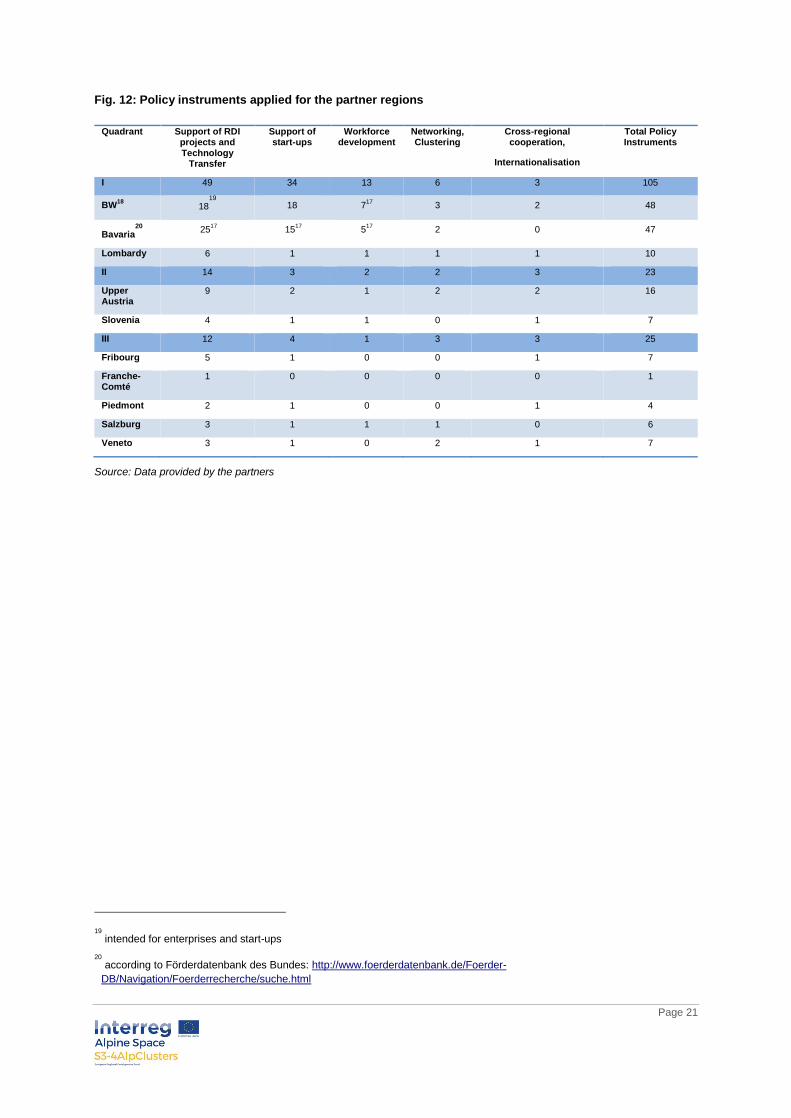
2.4 Policy Instruments
The figure below depicts the current status of the policy instruments for implementation of S3 in
partners’ regions.
In general, regions from the Quadrant I (s. Fig. 10) apply significant more and divers policy
instruments than those from the Quadrants II and III (except Upper Austria with a high number of
policy instruments). The most striking feature of Fig. 12 is the difference in the focus of each of the
policy instruments.
Bavaria and Baden-Württemberg strongly support R&D, Innovation and Technology Transfer,
Start-ups creation and workforce development, more than all other regions together. (Fig. 12).
Regions in Quadrant II focus strongly on cross-regional cooperation, whereas regions from
Quadrant III are comparable to others focused on cross-regional collaboration combined with
support, RDI or networking / clustering. It should be pointed out that there is only a difference in
terms of focussing on regional policy instruments.
Page 21
Fig. 12: Policy instruments applied for the partner regions
Quadrant Support of RDI projects and Technology
Transfer
Support of start-ups
Workforce development
Networking, Clustering
Cross-regional cooperation,
Total Policy Instruments
Internationalisation
I 49 34 13 6 3 105
BW18
1819
18 717
3 2 48
Bavaria20
25
17 15
17 5
17 2 0 47
Lombardy 6 1 1 1 1 10
II 14 3 2 2 3 23
Upper Austria
9 2 1 2 2 16
Slovenia 4 1 1 0 1 7
III 12 4 1 3 3 25
Fribourg 5 1 0 0 1 7
Franche-Comté
1 0 0 0 0 1
Piedmont 2 1 0 0 1 4
Salzburg 3 1 1 1 0 6
Veneto 3 1 0 2 1 7
Source: Data provided by the partners
19
intended for enterprises and start-ups
20
according to Förderdatenbank des Bundes: http://www.foerderdatenbank.de/Foerder-
DB/Navigation/Foerderrecherche/suche.html
Page 22
3. Strategic Alpine Space Areas for Cross-regional Cooperation
Defining Strategic Alpine Space Areas for Cross-sectoral Cooperation involves the identification of
those areas where one can expect the highest impact of cross-sectoral cooperation on
competitiveness and industrial and academic leadership for the individual Alpine Space regions as
well as for the macro-region itself. In this case, cross-sectoral cooperation is seen as tool rather than
an objective. Consequently, those Strategic Alpine Space Areas are of highest relevance:
They contribute to the EU Strategy for the Alpine Region (macro-regional level).
The EU Strategy for the Alpine Region (EUSALP) was published on 28 July 2015 in the
Communication and the Action Plan on the EU Strategy for the Alpine Region. The
implementation of the Strategy is based on the key principles applied to the existing macro-
regional strategies: no new EU funds, no additional EU formal structures and no EU
legislation. These conditions require a coordinated approach, synergy effects and a more
effective use of existing EU funds and other financial instruments. The EUSALP will affect
around 80 million people living in 48 regions in seven countries. Of these, five are EU member
states (Austria, France, Germany, Italy and Slovenia) and two are non-EU countries
(Liechtenstein and Switzerland).
EUSALP covers the following thematic policy areas:
Economic growth and innovation,
Mobility and connectivity,
Environment and energy.
The Strategy is designed to help the Alpine Region cope with major challenges, such as:
Economic Globalisation that requires the region to distinguish itself as competitive and
innovative by developing a “knowledge and information” society,
Demographic Trends characterised particularly by the combined effects of ageing and
new migration models,
Climate Change / Energy Change and its foreseeable effects on the environment,
biodiversity and on the living conditions of its inhabitants,
Its specific geographical position in Europe as a Transit Region and as an area with
unique geographical and natural features which will set the frame for all future
developments.
Areas of common interest for the Alpine Space Regions can contribute to the goals and
objectives defined within the individual S3. Most of the Alpine Space regions are highly developed
and competitive but many are comparably small in terms of industrial agglomeration or are lacking
a strong base of traditional or emerging industries (s. Fig. 10). Thus, for regions located in the
Quadrants II and III, cross-regional cooperation in those PAs is of fundamental interest where a
combination of respective PAs can lead to new transformation actions and the emergence of
industries from which all involved regions benefit.
Consequently, five Strategic Alpine Space Areas have been identified that meet both requirements
described above. It systematically takes into account that transformative actions mainly happen
between two or several PAs.
Page 23
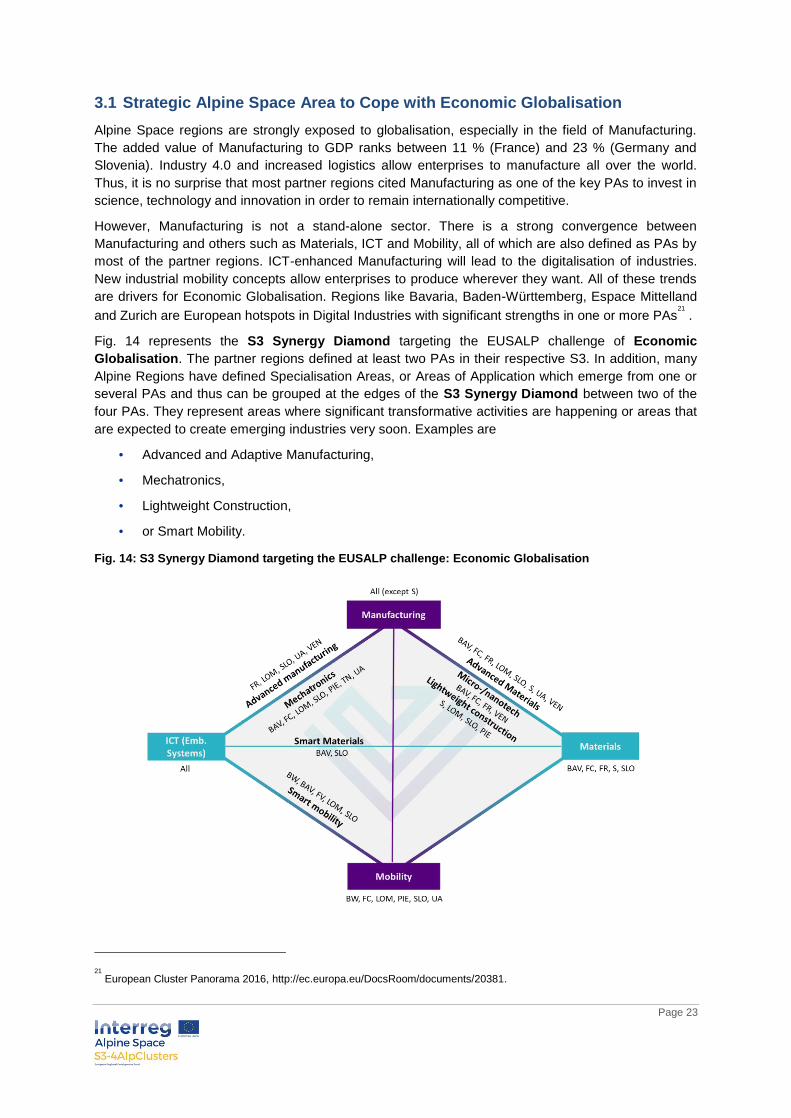
3.1 Strategic Alpine Space Area to Cope with Economic Globalisation
Alpine Space regions are strongly exposed to globalisation, especially in the field of Manufacturing.
The added value of Manufacturing to GDP ranks between 11 % (France) and 23 % (Germany and
Slovenia). Industry 4.0 and increased logistics allow enterprises to manufacture all over the world.
Thus, it is no surprise that most partner regions cited Manufacturing as one of the key PAs to invest in
science, technology and innovation in order to remain internationally competitive.
However, Manufacturing is not a stand-alone sector. There is a strong convergence between
Manufacturing and others such as Materials, ICT and Mobility, all of which are also defined as PAs by
most of the partner regions. ICT-enhanced Manufacturing will lead to the digitalisation of industries.
New industrial mobility concepts allow enterprises to produce wherever they want. All of these trends
are drivers for Economic Globalisation. Regions like Bavaria, Baden-Württemberg, Espace Mittelland
and Zurich are European hotspots in Digital Industries with significant strengths in one or more PAs21
.
Fig. 14 represents the S3 Synergy Diamond targeting the EUSALP challenge of Economic
Globalisation. The partner regions defined at least two PAs in their respective S3. In addition, many
Alpine Regions have defined Specialisation Areas, or Areas of Application which emerge from one or
several PAs and thus can be grouped at the edges of the S3 Synergy Diamond between two of the
four PAs. They represent areas where significant transformative activities are happening or areas that
are expected to create emerging industries very soon. Examples are
Advanced and Adaptive Manufacturing,
Mechatronics,
Lightweight Construction,
or Smart Mobility.
Fig. 14: S3 Synergy Diamond targeting the EUSALP challenge: Economic Globalisation
21
European Cluster Panorama 2016, http://ec.europa.eu/DocsRoom/documents/20381.
Page 24
Cross-regional cooperation focussing on the Specialisation Areas or Areas of Application at the edges
of this S3 Synergy Diamond will bundle complementary regional strengths, competences and efforts.
All partner regions can benefit from this. Successful cooperation will contribute at the regional level as
well as on the EUSALP level.
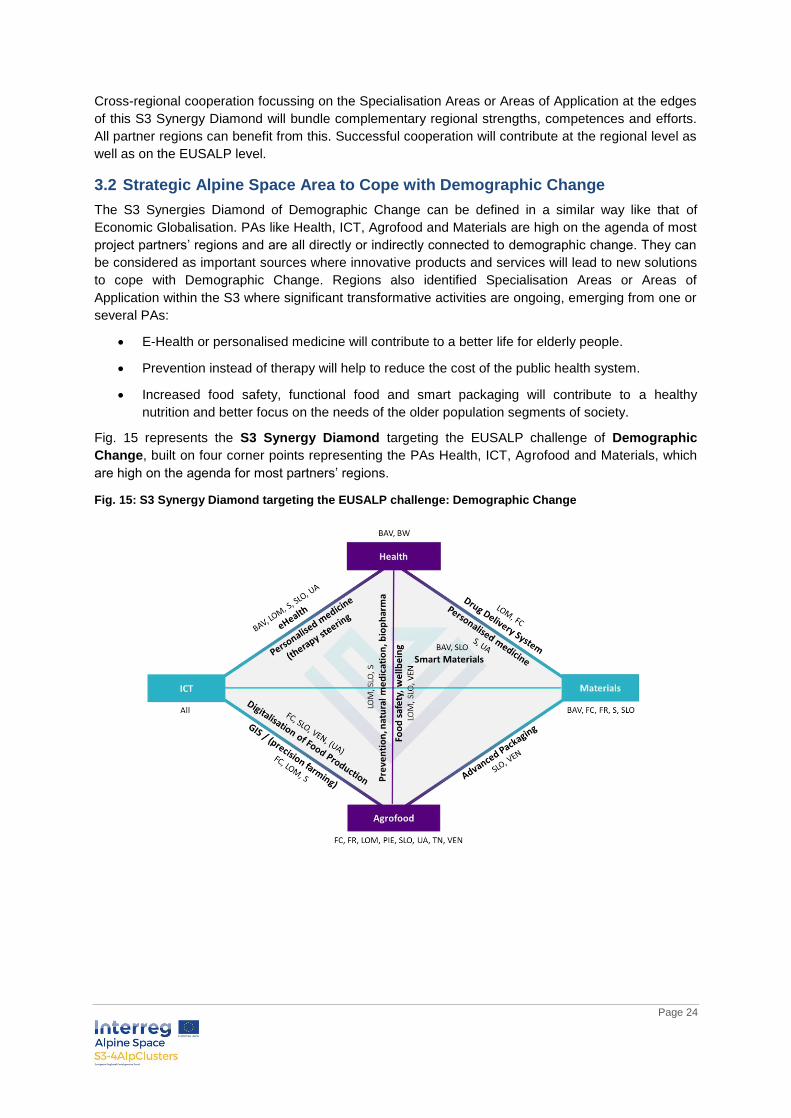
3.2 Strategic Alpine Space Area to Cope with Demographic Change
The S3 Synergies Diamond of Demographic Change can be defined in a similar way like that of
Economic Globalisation. PAs like Health, ICT, Agrofood and Materials are high on the agenda of most
project partners’ regions and are all directly or indirectly connected to demographic change. They can
be considered as important sources where innovative products and services will lead to new solutions
to cope with Demographic Change. Regions also identified Specialisation Areas or Areas of
Application within the S3 where significant transformative activities are ongoing, emerging from one or
several PAs:
E-Health or personalised medicine will contribute to a better life for elderly people.
Prevention instead of therapy will help to reduce the cost of the public health system.
Increased food safety, functional food and smart packaging will contribute to a healthy
nutrition and better focus on the needs of the older population segments of society.
Fig. 15 represents the S3 Synergy Diamond targeting the EUSALP challenge of Demographic
Change, built on four corner points representing the PAs Health, ICT, Agrofood and Materials, which
are high on the agenda for most partners’ regions.
Fig. 15: S3 Synergy Diamond targeting the EUSALP challenge: Demographic Change
Page 25
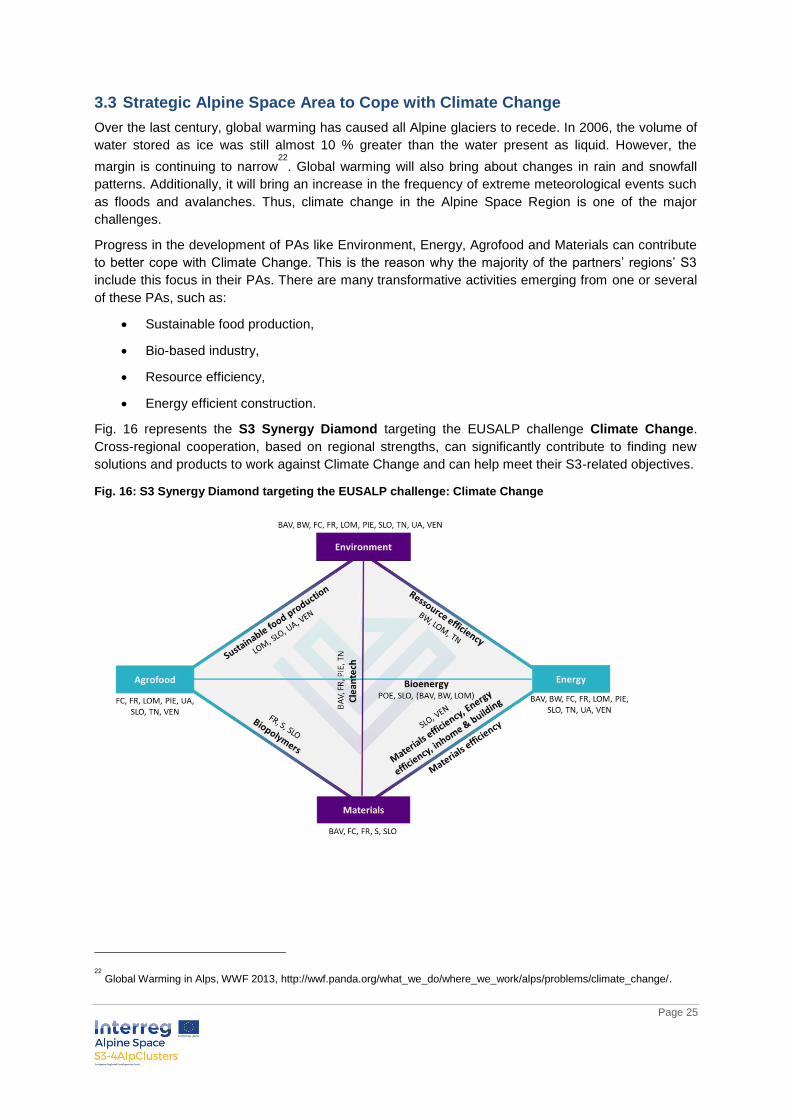
3.3 Strategic Alpine Space Area to Cope with Climate Change
Over the last century, global warming has caused all Alpine glaciers to recede. In 2006, the volume of
water stored as ice was still almost 10 % greater than the water present as liquid. However, the
margin is continuing to narrow22
. Global warming will also bring about changes in rain and snowfall
patterns. Additionally, it will bring an increase in the frequency of extreme meteorological events such
as floods and avalanches. Thus, climate change in the Alpine Space Region is one of the major
challenges.
Progress in the development of PAs like Environment, Energy, Agrofood and Materials can contribute
to better cope with Climate Change. This is the reason why the majority of the partners’ regions’ S3
include this focus in their PAs. There are many transformative activities emerging from one or several
of these PAs, such as:
Sustainable food production,
Bio-based industry,
Resource efficiency,
Energy efficient construction.
Fig. 16 represents the S3 Synergy Diamond targeting the EUSALP challenge Climate Change.
Cross-regional cooperation, based on regional strengths, can significantly contribute to finding new
solutions and products to work against Climate Change and can help meet their S3-related objectives.
Fig. 16: S3 Synergy Diamond targeting the EUSALP challenge: Climate Change
22
Global Warming in Alps, WWF 2013, http://wwf.panda.org/what_we_do/where_we_work/alps/problems/climate_change/.
Page 26
3.4 Strategic Alpine Space Area to Shape the Transit Region
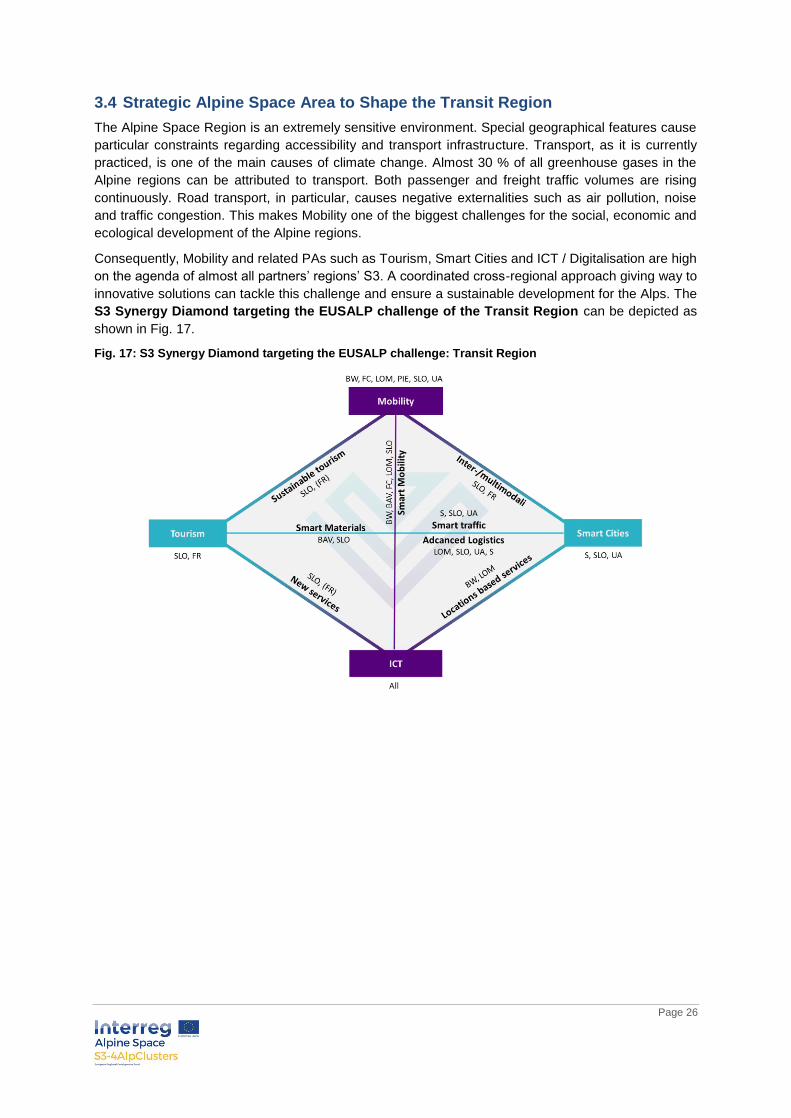
The Alpine Space Region is an extremely sensitive environment. Special geographical features cause
particular constraints regarding accessibility and transport infrastructure. Transport, as it is currently
practiced, is one of the main causes of climate change. Almost 30 % of all greenhouse gases in the
Alpine regions can be attributed to transport. Both passenger and freight traffic volumes are rising
continuously. Road transport, in particular, causes negative externalities such as air pollution, noise
and traffic congestion. This makes Mobility one of the biggest challenges for the social, economic and
ecological development of the Alpine regions.
Consequently, Mobility and related PAs such as Tourism, Smart Cities and ICT / Digitalisation are high
on the agenda of almost all partners’ regions’ S3. A coordinated cross-regional approach giving way to
innovative solutions can tackle this challenge and ensure a sustainable development for the Alps. The
S3 Synergy Diamond targeting the EUSALP challenge of the Transit Region can be depicted as
shown in Fig. 17.
Fig. 17: S3 Synergy Diamond targeting the EUSALP challenge: Transit Region
Page 27
4. The Way Ahead
The analysis of the S3 of the project partners’ region confirmed the essence and validity of S3 as a
policy process which depends on many determinants. Our study helped to confirm that regions in the
Alpine Space area are sufficiently different so as to not be entirely comparable. However, they do
focus on many similar PAs, which is a good common ground to jointly tackle Alpine Space related
challenges. It also provides a common ground for cross-regional cooperation. One of the concerns is
that cross-sectoral cooperation is often initiated by policy makers and therefore can lack effective
demand from the industrial side.
This report clearly outlines why and in which areas the Alpine Space Regions shall engage in cross-
regional cooperation. Since transformative activities are mainly occurring between different traditional
industries, smaller regions without a strong and broad industrial base are less likely to succeed in
developing a significant number of emerging industries in regions compared to Bavaria or Baden-
Württemberg. Cross-regional cooperation and bundling of different traditional sectors can represent a
good approach for the creation of critical mass, especially for smaller regions, provided it is need
oriented and tailor-made.
The five S3 Synergy Diamonds identified clearly where regions can benefit from cross-regional
cooperation and where they represent a promising scope for cross-regional cooperation. The
diamonds consistently place four prevailing PAs in the centre, where a significant number of
transformative actions can happen at the edges between the PAs.
Since there are just no dedicated cross-regional support schemes in place, the key question is how to
best proceed in order to harvest the huge potential for cross-regional cooperation among the Alpine
Space regions. Two main actions are needed:
Implement entrepreneurial discovery exercises as activities that are important design
principles to further identify what transformative actions shall be supported by the project
partners’ regions23
. Entrepreneurial discovery exercises applying such S3 Synergy Diamonds
provided quality, fact-based inputs. They served to guide the discussion towards the main
prevailing transformative actions which are of interest to the regions24
. Based on the region-
specific finding, cross-regional entrepreneurial discovery workshops (cEDW) must be
conducted to match the preferences of the project partners’ regions. Such exercises shall also
contain a common discussion of what policy instruments are most suitable for in terms of
supporting cross-regional cooperation.
Develop policy framework conditions that enable and facilitate cross-sectoral cooperation. The
current approaches which rely on Horizon 2020 or the INTERREG funding scheme are not
entirely appropriate. By means of synchronising a policy instrument towards a synchronised
scheme within the Alpine Space region, framework conditions can be created that serve to
provide a compatible environment for transformative actions across regions consistent with
the different needs of the participating regions. The Synchronised Call scheme can focus on
those transformative actions which are of common interest (based on the findings of the
cEDW) and where critical mass of industry and academia can be created by bundling regional
strengths. The precondition is the identification of transformative actions that cross borders
and actors that are eager to establish linkages and working relationships.
23
Coffano, Monica/Foray, Dominique, 2014: The Centrality of Entrepreneurial Discovery in Building and Implementing a Smart
Specialisation Strategy, Scienze Regionali, Vol. 13/1, pp. 3350.
24
The S3 Synergy Diamonds have been applied in connection with entrepreneurial discovery processes in Munich (Bavaria),
Linz (Upper Austria) as well as in Milano (Lombardy) in the period of March – May 2017.

Page 28
For purposes of providing a comparative view of how cross-regional cooperation can serve to broaden
and diversify options for economic development, it is of interest to review examples from outside the
Alpen Space region. There are other macro-regions, like the Baltic Sea Region, that have already
proceeded in this manner. They implemented the so-called Innovation Express Call25
scheme that
facilitates cross-regional cooperation. It is a common approach for supporting internationalisation of
enterprises driven by cluster initiatives. It is based on a joint call coordinated by BSR Stars partners in
collaboration with the Nordic Council of Ministers. It also allows regions like Baden-Württemberg to
participate. Cluster organisations can apply on behalf of their cluster actors to their respective ’home’
funding agency in accordance with regional funding procedures. The advantage is that all partners
receive funding. This good practice shows that moving forward is more a question of political
willingness to make real use of the Alpine Space macro-regional approach. There is no lack of real
opportunities.
A case description of the cluster-building experience in Massachusetts, USA is provided in the
appendix to this report. The state of Massachusetts, with a population of about 5 million, is a global hot
spot of innovation in life sciences. This case reflects some of the similarities among inter-regional,
intra-regional and intra-state flows of resources stemming from inter-industry cooperation and
innovation efforts. The case can provide certain benchmarking considerations for the Alpine Space
regions towards smart diversification. In last decade in average Massachusetts institutions received
more than $1,2 billion in competitively awarded grants from National Institute for Health (Federal
level)26
. In addition, the Life Science Center managed a $1 billion EUR initiative (state level, 10 years)
which offers several incentives programmes from research grant to workforce development. For the
past two years, the Massachusetts Life Sciences Center’s (MLSC) competitive tax incentive program
has focused on increasing regional diversity of the Massachusetts life sciences sector. As a recent
activity, the Massachusetts Administration announced more than $19 million competitive tax incentive
awards to 22 life sciences companies from across Massachusetts. Only in 2015 Massachusetts
received $2 billion in 2015 venture capital. Due to the length and extent of its content, the case is
presented in the appendix.
In the next phase of the project, a more detailed benchmarking exercise between the S3-4AlpClusters
region and other macro-regions (including global hot spots of innovation) will be included. This can
provide a more detailed review of possible peer macro-regions and hot spots of global innovation. The
next phase will explore certain regional economic development strategies and approaches that might
be recommended for the next phase of the project. In particular, it will offer additional insight on
regional actors and on the dynamics of cross-regional relationships. We have found that these
regional comparisons can be powerful motivators for change; helping to bring business and
community leaders into a process of joint development and joint implementation.
25
for further details www.bsr-stars.eu/innovation-express/
26
8 of the top 14 NIH-funded independent hospitals are in Massachusetts. In Europe hospitals are not considered as an major
innovation actors. The State of Massachusetts general received almost $350 mio in 2014.
Page 29
Appendix: Comparative Perspectives on Cross-regional Cooperation: The Case of Massachusetts, USA
For purposes of providing a comparative view of how cross-regional cooperation can serve to broaden
and diversify options for economic development, it is of interest to review examples from outside the
Alpine Space region. The following case example derives from the cluster-building experiences in
Massachusetts, USA. This case reflects some of the similarities represented by both inter-regional
(intra-state) and intra-regional (intra-state) flows of resources stemming from inter-industry
cooperation and innovation efforts.
From Route 128 to a world leading Life Science Cluster: Perhaps one of the better recognised
areas of technology-based development in the Commonwealth of Massachusetts is Route 128, the
65-mile stretch of highway surrounding Boston and Cambridge. Often compared with California’s
Silicon Valley in terms of its prolific generation of advanced electronics and software companies,
Route 128 benefitted from the commercial spinoffs stemming from the US federal government
sponsored research at top Massachusetts universities. Located between the greater Boston metro-
west region and the central part of the state, Route 128 can be said to represent the commercial
outcome of intra-state cross-regional cooperation. The current-day configuration of high-tech
industries along Route 128 reflects products that have benefitted from the rapid advancements in
microelectronics applications to healthcare and life sciences.
Growth of life sciences: The impressive growth of the life-sciences cluster in Massachusetts can be
traced to the world-class standing of the research hospitals associated with the top universities and
related brain pool in the state. Enabled by highly competitive federal research funds from the National
Institutes of Health (NIH) and related agencies, the life-sciences sector in Massachusetts has thrived
with continuing innovations in medical devices, robot-assisted surgery, bio-pharmaceuticals,
diagnostic tools, telemedicine, digital medicine and other sub-fields.
Regional context: The global nature and dynamics of technology research and commercialisation
activities associated with the life sciences are well recognised. However, it is necessary to
acknowledge the types of local conditions associated with regional clusters where such activities take
place. In Massachusetts, the regional development context is constantly changing and evolving in
accordance with the growth stages and diversification of the knowledge-based industries. In terms of
the life sciences, a good portion of the activity is concentrated in the Boston / Cambridge area in the
eastern region of the state and has been steadily increasing in the Worcester area in the central
region of the state. The evolving development of high-performance computing capacity and materials
science in the western part of the state provides yet another contribution to the intra-state cross-
regional synergy.
Regional actors and their working relationship: To put these cooperation dynamics into
perspective, one must recognise the regional actors and the sectors that comprise the governmental,
academic, industrial and general public in Massachusetts. Each of these sectors can be further
disaggregated into distinct levels and types of entities. In the government sector, there are federal,
state, municipal and regional agencies. In the case of the federal government, the federal procurement
policies have greatly benefited Massachusetts over the years in areas associated with technology
advancement in electronics, software and control systems. The federal government’s Small Business
Innovation Research Programme is associated with several different federal agencies and has made
an important contribution to the state.

Page 30
Support infrastructure for enabling healthcare-related entrepreneurship in Massachusetts: In
the academic sector, there are universities, community colleges, research institutes, teaching
hospitals and technical schools. Each of these levels plays a significant yet distinctive role in human
resource development and capacity building. In the industrial sector, it is relevant to consider
distinctive innovation-related roles played by large, medium and small firms, service providers,
commercial R&D, manufacturing and business associations. To understand the role of the general
public as a sector, it is helpful to stratify the various “publics” according to the particular technology
issues they focus on and their respective levels of activism.
Structural-functional adaptations for inter-industry dynamics: Another key consideration in
observing the environment for life science development in Massachusetts is that the above-named
sectors have dynamic interactions that cut across organisational boundaries and evolve over time. In
this regard, certain structural and functional adaptations can be observed in each sector. At
Massachusetts universities, for example, some of the structural adaptations have involved the creation
or expansion of technology licensing offices, patent policies, conflict of interest provisions, industrial
liaison offices and others. Some of the adaptations at the state government level have included the
formation of dedicated offices and programmes for innovation stimulation, special fiscal instruments,
locational incentives as well as workforce development. In the area of workforce development, a
particularly important legislative measure on the part of the public sector has been with regard to
adjusting the “non-compete” provision in the state law. Such a provision previously inhibited the ability
of qualified professionals to accept a position with a competing company within a certain period after
leaving the former company. Other adaptations that can be observed in the private sector include the
creation of specialised trade associations, industry consolidation, partnerships with large industry,
proliferation of professional services and more.
Inter-industry dynamics: General workforce development in Massachusetts has been driven in large
part by the nature of the types of industries in the state. In addition to selected areas of life sciences
such as biopharmaceuticals, diagnostics and medical devices, these have included others like
aerospace, defence, semiconductors, computers, and related fields. Certain well-known anchor
companies have served Massachusetts in this regard. It is recognised that the vertical integration of
industries like those mentioned above has been changing over the last several decades. Because
these industries deal in products with high proprietary content, high knowledge content and high
information content, they require advanced skills levels, high product quality and rapid response to
market trends. The larger companies have continuously increased the outsourcing of much of their
production and have increasingly relied on suppliers to drive the innovation process. It is important to
consider how knowledge and sources of innovation flow between key participants within the
manufacturing innovation ecosystem.
Critical enabling factors for life sciences research, development and commercialisation: Cross-
regional flows of qualified human resources have greatly contributed to the presence and growth of a
solid and growing core of qualified labour force in the life sciences in Massachusetts is considered to
be a key enabling factor for the success of the sector. The pool of highly trained men and women
involved in upstream research represent a wide variety of basic and applied disciplines. Similarly, as
the life science cluster has expanded and diversified, new professional disciplines are now
represented in downstream activities of bioprocessing, separations, quality control / quality assurance
and others.
Key actors and drivers involved in human capital formation: Massachusetts is home to 114
colleges and universities, many of which are among the top-ranked research universities in the
country as well as internationally. In addition to providing leading-edge training and education to the
region’s human resource base, these university institutions are engines of novel discoveries in virtually
every field of science engineering and technology relevant to today’s competitive global challenges.
Page 31
As engines of continuous innovation, selected universities and research hospitals in Massachusetts
and New England have been the source of new start-up companies, many of which have grown to be
significant players in the state’s innovation economy. Other regional actors include trade associations
and professional services such as lawyers, accountants, investment community, press and
communications media, public interest groups and patient advocacy groups. While this is only a partial
list, the important observation here is with regard to the regional diversification of the groups and their
respective roles within the innovation community.
Policy Instruments and state grants. In the area of public support for biomedical innovation in the
Commonwealth’s policy is to make special efforts to reach out to all regions of the state. The
Massachusetts Life Sciences Centre (MLSC) is among the highest profile state sponsored initiatives.
This Centre manages a EUR 1 Billion Life Sciences Initiative which offers several incentives
programmes. The Cooperative Research Grant programme is designed to support industry-university
cooperation. Through a competitive process, these university grants of EUR 220,000 per year for up to
three years require that the industry partner provide a matching amount. The Accelerator Loan
Programme can provide up to EUR 650,000 early-stage life science companies to help obtain
investment capital. Additional programmes of this agency are designed to enable internships at
companies and others are designed to provide tax incentive benefits on the basis of projected job
creation impact of applicant companies. Other general tax credit programmes are also available to
qualified companies through the Massachusetts Technology Collaborative and MassDevelopment. In
all cases, intra-state cross-regional cooperation has served to support joint efforts toward the
development of sustainable clusters and value-added chains of productive economic activity.
Page 32
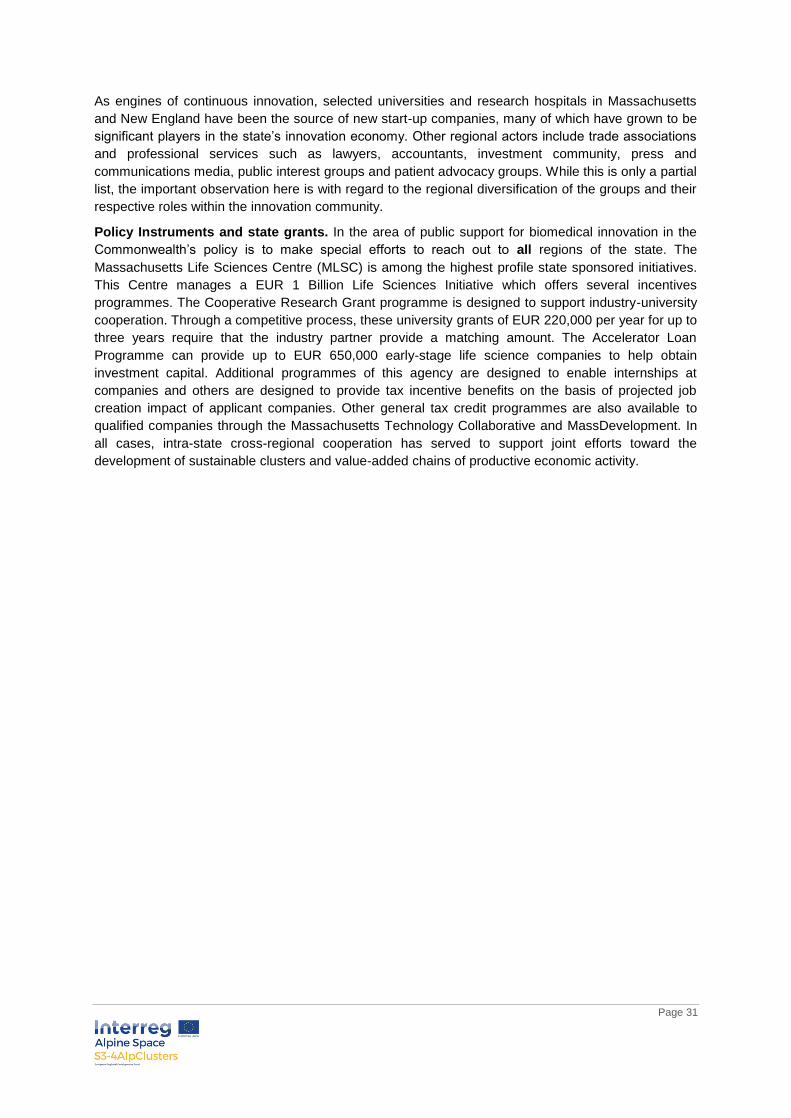
S3-4AlpClusters in a Nutshell
Smart Specialisation with Smart Clusters
Smart Specialisation Strategies (S3) are a lever of EU Cohesion Policy. One of the biggest challenges
is to make use of the interplay between S3 and clusters. How can S3 be used to foster innovation
processes and spark entrepreneurship within clusters? How can S3 be implemented through clusters
to gain sustainable and inclusive growth? There is a lack of experience among regions on how to use
clusters in the implementation of S3 and how to develop implementation tools to fully benefit SMEs. In
addition, alignment between and knowledge about other regions’ strategies are very limited.
This is exactly the focus of the S3-4AlpClusters project, which believes that the interplay between S3
and clusters is an innovative approach that could spread innovation in the whole Alpine Space. S3-
4AlpClusters will launch cross-regional coordinated actions between the different sectors/regions
involved and enhance transnational cluster cooperation. The final aim is to generate critical mass for
SMEs and to improve the framework conditions for innovation in the Alpine Space.
S3-4AlpClusters will develop:
A joint transnational cluster action plan to improve transnational, cluster-based cooperation
An S3-based innovation model for cluster development
A fully synchronized call scheme
New services validated by pilot clusters
The S3-4AlpClusters community includes cluster managers, entrepreneurs, academics and
policymakers, and is supported by public authorities and S3 experts.
The NUMBERS of S3-4ALPCLUSTERS
15 Partners 35 decision makers
9 Observers 11 Alpine Regions
830 SME 10 pilot clusters to be involved
FOLLOW S3-4AlpClusters
www.alpine-space.eu/projects/s3-4alpclusters/en/home
Page 33
S3-4ALPCLUSTERS Partners
HES-SO // FR-HEIA-FR INNOSQUARE CLUSTERS
Business Upper Austria - OÖ Wirtschaftsagentur GmbH
ClusterAgentur Baden-Württemberg
Veneto Region - Research Clusters and Networks Unit
Poly4EMI hosts by Anteja ECG d.o.o
Innovation and Technology Transfer Salzburg GmbH
University of Franche-Comté - FEMTO-ST
PROPLAST - Consortium for the Plastic Culture Promotion
Cluster Technologies for Smart Cities & Communities Lombardy Foundation
Autonomous Province of Trento (PAT)
Trentino Innovation Hub
Lombardy Region Government
Bavarian Research Alliance GmbH
Government Office for Development and European Cohesion Policy
Veneto Innovazione S.p.A.