strategic & operational august 3, 2021 quarterly report
TRANSCRIPT

Strategic & Operational Quarterly Report
Eugene Water & Electric Board
August 3, 2021

1
Table of Contents EXECUTIVE SUMMARY ..................................................................................................................................................... 2
BOARD ACTIVITY .............................................................................................................................................................. 3
EWEB STRATEGY & ANNUAL GOALS ................................................................................................................................. 4
GOAL 1 – UTILITY OPERATIONS ........................................................................................................................................ 5
ELECTRIC UTILITY FINANCIAL REPORT ........................................................................................................................... 5
WATER UTILITY FINANCIAL REPORT .............................................................................................................................. 7
CUSTOMER PROGRAMS & SERVICES REPORT ............................................................................................................... 9
ENERGY OPERATIONS REPORT ....................................................................................................................................12
WATER DIVISION .........................................................................................................................................................20
WORKFORCE REPORT ..................................................................................................................................................28
SHARED & STRATEGIC OPERATIONAL UPDATES ...........................................................................................................32
GOAL 2 – ADVANCED METERING.....................................................................................................................................42
GOAL 3 – REVISE & UPDATE STRATEGIC PLAN .................................................................................................................44
GOAL 4 – COLLABORATE & ALIGN WITH THE BOARD .......................................................................................................45
GOAL 5 – CONTINUE ELECTRIFICATION IMPACT ASSESSMENT .........................................................................................53
GLOSSARY .......................................................................................................................................................................54
APPENDICES ....................................................................................................................................................................55

2
EXECUTIVE SUMMARY
The Management of Eugene Water & Electric Board (EWEB) is pleased to provide this quarterly report, including preliminary unaudited financial results, operational performance measures, and the status of strategic initiatives and annual goals. Most metrics are presented through the previous quarter, with noteworthy, milestones, and qualitative information updated as to the publication date of this report.
Both the Electric and Water utilities have favorable performance year-to-date, with net income $2.9 million and $3.9 million favorable to budget, respectively. Operating expenses for both utilities were favorable by $1.8 million and $1.9 million, respectively. Both utilities are projecting year-end deposits to reserves (positive net income).
While the net revenue is strong through the first half of 2021, there are several issues that may impact the utilities finances and goal adherence going forward, including the following.
Sinkholes at Trail Bridge Reservoir
Sinkholes have been discovered in Trail Bridge Reservoir as part of routine monitoring efforts, which has the potential to shut down generation at Carmen-Smith, significantly impacting the production and financial contribution of the project. EWEB staff are working diligently to manage the safety risk, while actively investigating sinkhole conditions and cause, and are working closely with the Dam Safety Division of the Federal Energy Regulatory Commission and expert consults to address the issue and develop a risk mitigation plan.
Supply Chain Issues
Recently, EWEB has experienced significant supply chain issues impacting availability, lead times, and prices. Price escalation for some materials has significantly exceeded the typical inflationary rates of 2-4% over the past 10 years, including tree trimming (9%), ductile iron fittings (27-60%), brass fittings (10-15%), submersible transformers (45%) as examples. Net impacts of the price increases are $150,000 between both utilities, with minimal impact to budget, while the more significant concern is availability for projects.
Smart Meter Deployment
The supply chain issues mentioned above are mostly impacting water construction and smart meter deployment. On June 30th, meter supplier, Sensus, informed EWEB that they will not be able to supply residential meters for the months of August and September. EWEB’s meter installer, UPA, reduced their deployment to 50% as of July 19th to retain staff. If residential meter deliveries resume in October as anticipated, then the potential impact to the overall schedule will be approximately six weeks.
Except for the potential impacts of aforementioned issues, most annual goals are on track to be completed in 2021.
For the second consecutive year, the Water Utility received the top national safety award (WENDELL LADUE SAFETY AWARD) from the American Water Works Association (AWWA). Because EWEB had the foresight to install on-site hypochlorite generation at the Hayden Bridge Water Treatment Plant in late 2019, we were not impacted by the chlorine shortage that effected utilities across the country at the end of Q2.
At the end of the second quarter, EWEB launched a new customer portal, including bill redesign, payment processing, and customer self-service functions. At the end of Q2, 18,500 customers had registered with the portal and nearly 4,700 enrolled in autopay. The target is to reach pre-cutover registration and enrollment levels within the first 90 days following launch.
Overall, EWEB continues to work on building organizational and customer confidence through the transparent communication of our results, including those discussed herein. We appreciate your ongoing support.
Frank Lawson, General Manager
3
BOARD ACTIVITY
During the months of April, May, June and July, the Board of Commissioners took significant actions and held meaningful discussions including, but not limited to, the following:
• Endorsement of a Record of Decision designating the final design report (siting) for the E. 40th Water Storage Project.
• Review and Discussion of EWEB’s 2020 Year-end Audited Financial Statements and Management Letter with internal auditor, Moss Adams.
• Approval of up to $1.5M for grants to facilitate acquisition and management of floodway properties affected by the Holiday Farm Fire.
• Commissioners held a work session focused on opportunities and challenges of decarbonization, and EWEB’s role. • Commissioners conducted a work session to discuss wildfire mitigation planning, and to assess the Utility’s
strategic plan. • The Board received updates on Electric and Water capital projects and discussed the Capital Plan’s assumptions
and principles. • Commissioners endorsed Management’s strategy to modernize critical business applications using an Enterprise
Resource Planning (ERP) approach. • The Board provided guidance for EWEB’s Headquarters buildings and associated real property. • Reviewed annual update of EWEB’s Integrated Resource Plan • Commissioners reengaged with the McKenzie valley community, holding their first in-person public meeting since
the beginning of the pandemic. • The Board received updates and held a hearty discussion around Financial Planning, including Capital
Improvement Plans, the Long-Term Financial Plan, and 2022 Budget Assumptions. Management is obligated to report explicit information as guided by Board policy and voluntarily reports additional supplemental information, contained as follows: Required Reporting Per Board Policy Appendix A: Electric Utility Financial Statement (EL1) Appendix B: Water Utility Financial Statement (EL1) Appendix C: Electric Utility EL1 Capital Report Appendix D: Water Utility EL1 Capital Report Appendix E: Capital Spending Summary (Supplement to EL1 Reports) Appendix F: Contracts Awarded Report (EL2) Appendix G: Community Investment Report (EL3) Additional Appendices Appendix H: Electric Division Metrics Scorecard Appendix I: Water Division Details Appendix J: Workforce Composition Appendix K: Fleet Sustainability Report

4
EWEB STRATEGY & ANNUAL GOALS
The EUGENE WATER & ELECTRIC BOARD STRATEGIC PLAN (2017-2020) was approved August 2, 2017, revised July 10, 2018, and provides the basis for policies, decisions, and the annual goals established for the organization. This Quarterly Report is organized to provide status and progress information based on those annual goals. On January 5, 2021 the EWEB Commissioners approved the following annual goals for the organization.
Goal #1 – Maintain or improve our “day-to-day” performance consistent with Board direction, policies, and organizational values, with an emphasis on increasing workforce resiliency Goal #2 – Effectively execute and operationalize a multi-divisional information system program by successfully scaling-up advanced metering for revenue management purposes Goal #3 – Revise and update the strategic plan in order to identify and prioritize the most impactful 3-5-year strategic issues, decisions, and projects Goal #4 – Collaborate and align with the Board to develop directional guidelines and decision criteria on issues having long-term strategic and policy-setting impacts, including development and approval of:
a) revised/updated Watershed Recovery & Protection Program, including appropriate 2021 budget amendments and future revenue mechanisms, and
b) TBL-based plan for the lower McKenzie River Hydroelectric Projects in compliance with FERC, and collaboration with the McKenzie Valley community, and
c) multi-year Information System/Technology Investment Plan, in support of both business continuity and strategic priorities, including 10-year annual spending projections for incorporation into EWEB’s Long-Term Financial Plan and 2022 Annual Budget, and
d) Initial risk-based Wildfire Mitigation Plan, for likely filing with Oregon Public Utility Commission, and e) first multi-year COSA, including revised ratemaking principles.
Goal #5 – Continue electrification impact assessment, specifically analyzing the future decarbonizing trends of electricity and natural gas, and the division of costs/benefits between participants, utilities, and society at-large -- a.k.a. who benefits and who pays?

5
GOAL 1 – UTILITY OPERATIONS
Goal #1 – Maintain or improve our “day-to-day” performance consistent with Board direction, policies, and organizational values, with an emphasis on increasing workforce resiliency.
Electric Utility Financial Report SEE APPENDIX A – ELECTRIC UTILITY FINANCIAL STATEMENT
OVERALL STATUS: ON TARGET
Deborah Hart
Status Summary The Electric Utility is forecasting a year-end deposit to reserves of $4.1 million with key rating agency metrics related to debt service coverage and days cash above target. Item of Interest As of June, retail consumption was 4.2% better than budget. 2021 budgets were reduced to account for lingering COVID economic conditions.
FINANCIAL METRICS
The Rate of Return projection was well below target as of June. 2021 revenue assumptions were more conservative to account for continuing COVID economic impacts and lowered the metric for the current year. Net operating income was down in 2020 due to reduced generation from EWEB hydro plants and reduced customer demand. Delays in capital spending reduced the associated overhead transfers from O&M. Repair costs in response to the Holiday Farm fire also contributed to lower net operating income. FERC ordered EWEB to cease operation of the Leaburg project due to increased canal seepage and public safety concerns. The future of the project is uncertain and Board discussion will determine if the project returns to service. The net book value of the project was moved from plant in service to property held for future use. Reclassification of Leaburg plant and a 2020 bond issuance increased the Debt as a Percent of Net Book Value ratio above target in 2020. This ratio moved 3% closer to the target range in March 2021 with large additions to plant and has been steady since. Remaining metrics conform to Board targets.

6
NET INCOME
For the six months ended June 30, 2021, net income for the Electric Utility was $5.2 million.
BUDGET CONTROLS
The year-end forecast for the O&M budget is $9.3 million unfavorable primarily due to purchased power costs which are offset by wholesale revenue.
$74.0 $66.1
$2.5
$2.5
$17.5
$17.7
$16.0
$17.7
$3.8 $3.8
$6.5 $6.4
$-
$20
$40
$60
$80
$100
$120
$140
Mill
ions
($)
Electric O&M Expenses
CILT
Non-Operating
Admin. & General, and Other
Transmission & Distribution andGeneration
System Control
Purchased Power & Wheeling
YTD ACTUAL
YTD BUDGET

7
Water Utility Financial Report SEE APPENDIX B – ELECTRIC UTILITY FINANCIAL STATEMENT
OVERALL STATUS: ON TARGET
Deborah Hart Status Summary Financial metrics conformed to Board targets through June. Following a nearly $4 million budget amendment for watershed recovery, the anticipated 2021 year-end deposits to reserves are $1.6 million. Item of Interest Year-to-date water consumption was 36% above budget. Regional drought conditions persist, and water revenue budgets were reduced in 2021 to allow for COVID impacts.
FINANCIAL METRICS
Financial ratios are presented alongside the condensed financial statements in Appendix B. All metrics conformed to Board targets.
NET INCOME
For the six months ended June 30, 2021, net income for the Water Utility was $3.9 million.
BUDGET CONTROLS

8
Source of supply, pumping and purification expense was under budget by $1.3 million. A $3.95 million budget amendment approved in March for watershed recovery drove the favorable variance in operating expenses, and watershed recovery costs will be spent as the year progresses.
$4,037 $5,384
$3,009
$3,319 $1,200
$1,311 $2,014
$2,241 $1,172
$1,150
$-
$2,000
$4,000
$6,000
$8,000
$10,000
$12,000
$14,000
$16,000
Thou
sand
s $
Water Utility O&M Expenses
Non-Operating
Admin & General
Customer &Conservation
Transmission anddistribution
Source of supply,pumping andpurification
2021 YTD ACTUALS
2021 YTD BUDGET

9
Customer Programs & Services Report OVERALL STATUS: ON TARGET
Julie McGaughey Status Summary Successful launch of the Customer Portal. All financial and response metrics are on target. Item of Interest EWEB launched the new online customer portal and redesigned bill to customers on June 14 following a “soft launch” to 26 customers in April. At the end of Q2, 18,500 customers had registered with the portal and nearly 4,700 enrolled in autopay. The target is to reach pre-cutover registration and enrollment levels within the first 90 days following launch.
CUSTOMER OPERATIONS RESPONSE & EFFECTIVENESS
In Q2, Customer Service assisted 41,644 customers, up 32% from Q2 2020. Much of the June 2021 uptick is attributable to assisting customers to sign up for the new portal.
ENERGY & WATER CONSERVATION AND BILL ASSISTANCE PROGRAMS
Energy efficiency activity is steady and on track at 47% of target and 44% of budget, and the solar PV incentive budget is 100% committed for the year.

10
EWEB is on track to deliver $1.5M in EWEB Customer Care (ECC) bill assistance in the 2021 program year, with $1.2M rate funded and further overages supported by surplus customer donations. ECC was increased to $280 per customer/year in May, and a retroactive adjustment was made for all customers year to date. Year over year, there is a notable Q2 decline in assistance provided due to additional funding provided in 2020 to support customers through the pandemic.
Interest in Holiday Farm Fire programs such as the Home Site Relocation Program and the Underground Electric Service project have been slow to materialize due to changes in state statutes, Lane County permit requirements and construction timelines. An uptick in program inquiries points to potential spending in the third quarter.

11
COMMUNICATIONS EFFECTIVENESS
VIEW THE DRINKING WATER QUALITY/CONSUMER CONFIDENCE REPORT. VIEW PURE WATER PARTNERS MCKENZIE FLOAT VIDEO. SEE APPENDIX G – COMMUNITY INVESTMENT REPORT for a list of community investment contributions through Q2 2021 categorized by type of investment: Sponsorships, Donations, Grants and Mutual Aid; Customer Solutions Products and Services; System Development Charge (SDC) Waivers; Contributions in Lieu of Taxes (CILT); EWEB Ambassador Efforts and Events (Paid).

12
Energy Operations Report Energy Production & Planning
OVERALL STATUS – ENERGY PRODUCTION & PLANNING: BELOW TARGET
Megan Capper, Lisa Krentz Status Summary EWEB-Owned hydroelectric production was significantly below target as several generators experienced both planned and unplanned outages. Trading operations were within compliance, and Power Planning continued supply-chain management activities with Bonneville Power Administration (BPA), particularly the 2022 Rate Case. Item of Interest Sinkholes have been discovered at Trail Bridge Reservoir, with more information on Page 35.
EWEB POWER SUPPLY PERFORMANCE
Q2 2021 Generation Reliability by Fuel Type
Generation Type Availability
Factor (AF) Forced Outage Factor (FOF)
Notes
Target >90% <3.00% Wind 95.20% N/A The Harvest Wind Project turbines were available and
operating during the quarter. Hydro 74.63% 15.47% All Carmen Units were offline for two weeks in May
during the transmission line relocation. Trail Bridge Unit was down for bearing repair in April. Walterville unit was down for annual outage in June. All other hydro resources were available and operating at the end of Q2 except for Leaburg.
Thermal 86.28% 0.00% IP Unit was offline the first week of April for annual maintenance. It was available and operating for the remainder of the quarter. Wauna steam turbine generator sale was final April 6th.
AF: Availability Factor. Multiplied by 100, this factor indicates the percentage of time that the generating units were available for operation. FOF: Forced Outage Factor. Multiplied by 100, this factor indicates the percentage of time that the generating units were forced offline due to an unplanned event.
POWER TRADING PERFORMANCE & COMPLIANCE
Financial and position limits are monitored and reported to the Risk Management Committee regularly. The last short term compliance report is presented below in slightly redacted form. Both Short Term and Mid Term trade activities were within compliance limits throughout the second quarter of 2021.

13
POWER PLANNING ACTIVITIES
Northwest Power Pool Regional Resource Adequacy Program
• Participants have completed Phase 2B of the design process, providing a detailed program structure and the creation of an initial non-binding period to promote further regional engagement and problem solving. Staff expect to better understand the operational and financial impacts of program participation through engagement during the non-binding period.
• With the retirement of our Chief Energy Officer, Susan Ackerman, Matt Schroettnig, EWEB’s Power Resources Counsel has taken Susan’s seat on the Steering Committee.
• The launch of Phase 3 of the program, as well as the proposed NWPP Governance structure will soon be available. The upcoming August 3 NWPP RA SYMPOSIUM will provide additional details, and will include Frank Lawson as an executive panelist at the symposium.
BP-22 Power and Transmission Rate Cases
• BPA’s Draft Records of Decision indicate an effective Power rate increase of between 0-3%, and an effective Transmission rate increase of no greater than 8%.
• BPA’s Final Record of Decision is expected by the end of July, and the precise rates and rate impacts will be made available shortly thereafter. The new rates will be effective October 1, 2021.

14
Electric Distribution
OVERALL STATUS – ELECTRIC DISTRIBUTION: ON TARGET Tyler Nice, Lisa Krentz
Status Summary The Electric Power System is currently operating within the 5-year reliability indexes due to a mild winter and spring with few large-scale outages. No major contingencies are present which would affect long term reliability. Staffing continues to be an issue within the division effecting some strategic and customer facing operational metrics. However, improvement is expected to occur over the next quarter as multiple vacancies have been filled, which will decrease backlogs and increase throughput as these individuals are onboarded. Capital work is generally on track with a projected spend approaching close to 100% expected, and compliance related work can be managed within cycle requirements even with some current backlog experienced.
ELECTRIC SYSTEM RELIABILITY
Outage Frequency & Duration vs. 5-Year Averages
Significant Outages, Causes, Mitigation

15
Major Disruptions
• In May, a feeder cable connection failed which tripped off a River Road neighborhood resulting in an outage for 1,158 customers for a little more than an hour (Classified: Equipment Failure).
• In May, a primary cable failed which blew a fuse in a pad mount switch resulting in an outage for 193 customers for almost 3 hours (Classified: Equipment Failure).
Preventative Operations & Maintenance
The Electric Utility has established a division wide ‘Metrics Scorecard’ for tracking key performance indicators associated with “Goal #1” operational metrics such as turnaround time, customer response, and compliance activities. SEE APPENDIX H - ELECTRIC DIVISION SCORECARD. Departmental Metrics of Risk:
• Distribution Engineering: Customer related design work backlog is increasing due to sustained demand and continued staff shortage. Target metrics are for 3-week turnarounds from contact to design assigned, and to return high level estimates within 3 days of request. Present wait times for a design assignment is 8 weeks, and high-level design turn arounds are also currently delayed. The following mitigations to limit impact to customer wait time are being worked:
o EWEB driven capital work is on hold to shift resources to Customer facing work. This is resulting in a corresponding unfavorable downstream metric in the Line Department due
to delayed PUC work. Over the course of the PUC cycle it is expected this backlog can be recovered once the Distribution Engineering Department Staffing is fulfilled.
o Increasing use of consultants to complete design work for PUC related designs o Have filled one open vacancy with an entry level design tech. o Launching third party recruiter to fill an additional technician position. o Evaluating position description and recruiting options for revision to make better competitive in labor
marketplace. • Electric Meter Shop: Increasing backlogs in Connect/Disconnect and Move in/Move Out workflows. Due to staffing
vacancies (vacancies for experienced meter techs have been open over a year). Mitigation efforts include: o Assessing shop organization structure, efficiencies, and process. o Launching third party recruiter to fill an additional technician position.
• Systems Engineering: Increasing backlog of design projects and Operations and Maintenance Support projects due to multiple engineering vacancies.
• Two positions are in the process of being filled which will result in additional bandwidth and ability to gain on unfavorable metrics.
• Vegetation Program: The Forestry team is approximately 6 months behind schedule in the 5-year program. The main contributor is resources diverted to Holiday Farm Fire related tree removal and the early season focus on high fire risk circuits. Contract tree crews are in high demand on the west coast due to wildfire concerns and availability continues to suffer. An additional Forester resource is being added to the department to decrease backlog and staff are actively working with the Tree Contractor to increase resourcing in the field.

16
CUSTOMER CONNECTIONS
• Q2 2021 cumulative customer inquiries have seen a 18% increase over Q2 2020. Trending suggests a sustained
rise through the last 7 quarters over the average inquiry amount. • Distribution Engineering is completing a Continuous Improvement Effort for the customer inquiry process to
reduce resource efforts.
Distribution Engineering Customer Performance Metrics
Performance Categories (Customer-Driven)
Year to date Q2 2020
Year to date Q2 2021
Percentage (+/-)
Customer Inquiries 738 872 +18.2% Projects Release for Construction 137 149 +8.76%
Projects Waiting for Customer Information
33 61 +84.8%
Design Queue Wait Time (time from customer inquiry to start)
5 weeks 8 weeks +60.0%
02004006008001000
Customer Inquiries
Amount Average

17
CAPITAL INVESTMENTS & PROJECTS
Electric Utility and Shared Services Capital Spending Summary & Project Updates
The Electric capital plan is projected to approach 100% of budget.
SEE APPENDIX C – ELECTRIC UTILITY EL-1 CAPITAL REPORT - Shared Services project updates are provided within the Electric Utility Capital section, but the project budget and costs are split between Electric and Water in the appendices.
TYPE 1 – General Capital Projects (Electric and Shared Services)
Type 1 General Capital is budgeted year-by-year for routine capital expenditures totaling less than $1 million and is funded with rates and customer contributions. Typical examples include “pole replacements” as part of Transmission & Distribution.
Projected Year end: Over Budget
• Bertelsen Operations Expansion property purchase • Customer driven work increase • Generation infrastructure replacements
0
10000000
20000000
30000000
40000000
50000000
60000000
Jan Feb Mar Apr May Jun Jul Aug Sep Oct Nov Dec
2021 Overall Capital Spending
Budget Straight Line Projection Actual

18
TYPE 2 – Rehabilitation & Expansion (Electric and Shared Services) Type 2 capital projects are discrete, with a defined completion period, and lifetime expenditures over $1 million. Depending on the project, this work
may be funded with rates, customer contributions, or bond funds.
Projected Year End: On Target
TYPE 3 – Carmen-Smith License Deployment (Electric and Shared Services) Type 3 projects are large strategic programs with long term impacts and are generally bond-funded.
OVERALL STATUS – CARMEN-SMITH LICENSE DEPLOYMENT: BELOW TARGET Lisa Krentz
Second quarter 2021 activity included completion of fish passage design, which is now under review by regulatory agencies, and substantial relocation of the transmission line from Deer Creek. Initiating the turbine generator unit rehabilitation and rebuilding the Chinook Salmon Spawning Channel are anticipated in Q3 2021. Project Schedule
• Majority of license deployment activities are on track for compliance, although eleven depend on approved extension requests to remain in compliance.
• Several projects are currently behind schedule, as identified in the FERC operating license, primarily due to staffing limitations.
• Delays to construction of upstream and downstream fish passage projects are expected for several reasons, including unanticipated review and actions to satisfy FERC dam safety requirements and the emergent sinkholes in Trail Bride Reservoir.
• Four Settlement Parties initiated Dispute Resolution in 2020 due to delay of fish passage projects. EWEB is working with these Parties on mitigation actions to resolve the dispute.

19
Status Number of
Projects Proportion of Tracked
Projects Out of compliance1 8 7% On track for compliance2 87 75% Completed 7 6% On hold, no fault3 14 12%
1 Proposed plan and schedule for fish passage has not been approved and we will not meet deadline for fish passage construction. Does not include Extension of Time Requests (EOT) awaiting FERC approval. 2 Projects that are scheduled/in progress and expect to be completed on time. Assumes FERC approval of EOT. 3 Awaiting Agency comments or submitted on time and awaiting FERC approval.

20
Water Division
OVERALL STATUS: ON TARGET Karen Kelley
Status Summary The Water Operations Division uses the Multiple Barrier Approach to Safe Drinking Water, an integrated system of procedures, processes and tools that collectively prevent or reduce the contamination of drinking water from source to tap. The purpose of this approach is to provide safe, reliable drinking water to customers 24/7/365 and to reduce the operational risks to public health while being good stewards of our customer/owner’s infrastructure and funding resources. At the end of Q2, most areas are on target and the few that are not are well understood and being managed with available resources. Item of Interest Considerable time and effort has been put into the E. 40th Reservoir Project from staff in both the Water Division and the Customer Programs and Services Section. Progress has been made in planning and design while addressing significant public interest in the project. See the Customer Programs and Services Report and APPENDIX E Water Utility Spending Summary and Project Updates for more information. A chlorine shortage at the end of Q2 caused serious concern for water and wastewater utilities throughout Oregon and across the country in some cases. The shortage was brought on by a series of events impacting the largest chlorine producers in the U.S. We were very fortunate that EWEB had the foresight to address the supply chain risks by installing an on-site hypochlorite generation system at Hayden Bridge Water Filtration Plant in late 2019. However, not all utilities were as prepared for this shortage, and we were approached by several asking us for help. We were able to assist by providing additional water to the City of Veneta. We also learned the plant is capable of producing and filling storage containers for use in other utilities if/when needed. Fortunately, the primary producer of chlorine repaired equipment and was able to resume the supply before our neighboring utilities ending up needing extra chlorine. EWEB is the Class III WENDELL LADUE SAFETY AWARD winner for the second year in a row. This is a national award from the American Water Works Association for water providers employing between 100-500 employees. It is given in recognition of distinguished water utility safety programs. Our statistics show that in approximately 152,000 hours worked, we had 1 case with time loss (10 days), and 2 cases needing medical treatment for an overall incident rate of 3.94 (water employees only). It is an honor to win this award and shows a commitment to safety by all in the Division.

21
CUSTOMER CONNECTIONS
Metric 2020 Quarterly Average Q1 2021 Number of New Service Requests 22 19 Design Time (Avg) 7 Days 6 Days Time Waiting on Customer (Avg) 19 Days 28 Days Construction Time (Avg) 15 Days 9 Days
WATER QUALITY & RELIABILITY (SOURCE TO TAP)
Watershed Monitoring
OVERALL STATUS: ON TARGET
Monitoring runoff associated with the Holiday Farm Fire and from urban sources continued throughout the winter and targeted storm events. EWEB staff are maintaining 14 real-time water quality instruments in the field that help us track changing water quality conditions in our source water and prepare for any necessary treatment adjustments. Cyanotoxins EWEB began monitoring for harmful algal blooms (HABs) and cyanotoxins in mid-March 2021. Both Cougar and Blue River Reservoir had some HABs in Q2, but no reportable levels of cyanotoxins have been measured. For more information visit our CYANOBACTERIAL HARMFUL ALGAE BLOOMS website.
Drinking Water Source Protection
OVERALL STATUS: BELOW TARGET Pure Water Partners Program The Pure Water Partners (PWP) program is an incentive-based strategy that aims to protect existing healthy riparian and floodplain areas and restore degraded riparian forests along the McKenzie River through voluntary actions with landowners. During Q2, we worked with our partners to restructure the program. We integrated Holiday Farm Fire restoration efforts with the original intent of the PWP Program by drafting a new, more comprehensive 7-year Watershed Stewardship Agreement for landowners. This agreement will encompass riparian restoration and protection, erosion control, invasive species management, fuels reduction, and Firewise/naturescaping principles. We are finalizing the new Watershed Stewardship Agreement and we expect to start enrolling landowners in Q3 and reporting on metrics in Q4. – see Goal 4a.
Water Treatment Effectiveness
OVERALL STATUS: ON TARGET Water Treatment McKenzie River water is treated to drinking water standards using conventional treatment trains that include redundancy to protect from treatment failures. The treatment process is closely monitored and constantly adjusted to ensure production of safe drinking water prior to delivery to customers.

22
Q2 Project Updates
Granular Activated Carbon (GAC) was used in our pilot testing partnership with the University of Toronto beginning in Q2. The GAC is a third filter media referred to as a filter cap. Testing indicates stratification during backwash was acceptable and the process is viable. With this early success the group immediately moved forward with algae toxin testing to estimate removal by using a surrogate dye. Initial testing indicates the GAC can provide an added barrier to Cylindrospermopsin which is a toxin commonly found in our watershed. Early results show a 35% removal efficiency can be attained. Additional benefits that are seen in test results are decreased chlorine demand, decreased disinfection byproducts, and increased organics removal. Testing for other common toxins will resume in Q3.
Production
Production levels for the second quarter were above the five-year maximum with the highest production recorded for the month of April. Increased organics load from fire impacts as well as diatom growth in the early warm water season has increased chemical usage and sludge waste. In response to the increased load, operations has amended the sludge hauling and excavation contract and engaged in a continuous improvement effort to reduce residuals.
Delivery/System Reliability
OVERALL STATUS: ON TARGET There were no significant outages or EWEB caused boil notices during Q2.
Reliability Metrics Unit AWWA Median
Benchmark*
EWEB 2-Year Average
YTD Results
On Target?
Water Operations: System Integrity
Leaks and Breaks per 100 Miles of Pipe # 9.6 11.1 3.6
Customer Relations: Water Service Disruptions
Minimize Frequency of Unplanned Outages # 61.1 101 35 Average Duration of Unplanned Outages Minutes 222 118.5 118 Percentage of Customers who Experience a Planned or Unplanned Water Outage
% N/A 3.91% 0.64%

23
Water Operations: Regulatory Compliance
Boil Water Notices caused by EWEB
# of Notices N/A 1.5 1
* AWWA Median Benchmark from 2019 data.
Preventative Operations & Maintenance
OVERALL STATUS: BELOW TARGET Exercising valves is important preventative maintenance because easily identifiable and properly functioning valves can help reduce the size and duration of outages. Due to higher priority work, very little valve exercising has taken place in 2020 and 2021. Exercising distribution system valves (2-12”) is currently below target but the crews are actively working on them. All critical distribution valves (16-20”) have been inspected and operated for the year. Arterial transmission valves (30”+) are currently ahead of schedule, while system pressure separation valves, along with reservoir and pump station valves, are currently right on schedule. Residential backflow testing is critical to ensuring backflow devices properly protect our system from contamination. Testing increased in Q2 as irrigation season began.
Reliability Metrics Unit Goal EWEB 2-Year Average
YTD Results
On Target?
Customer Relations: Water Service Disruptions
Exercise distribution system valves (2-12”) 18,522 20%
Annually 650 284 Exercise critical distribution valves (16-20”) 292 Annually 163 292 Exercise arterial transmission valves (30”+) 43 Annually 9.5 33 Exercise system pressure separation valves 84 Semi-
annually 42 84 Exercise reservoir and pump station valves 339 Semi-
annually 127.1 339 Water Operations: Regulatory Compliance
Testing compliance on residential backflow devices
% 95% 93.3% 70%
Drinking Water Quality & Complaints
OVERALL STATUS: ON TARGET
From the Holiday Farm Fire, total metals remained relatively low across tributaries for Q2. For nutrients, we did see a slight temporary increase in nitrate levels in several tributaries while mainstem concentrations remain low. Our treatment plant has been able to reduce nutrient levels in the finished drinking water and maintain compliance with all state and federal requirements for public health. We initiated the triennial Lead and Copper monitoring during Q2, and it will be finalized during Q3. 50 samples are collected from kitchen or bathroom faucets in Eugene’s highest risk homes containing copper pipe with a lead solder that were installed prior to the federal lead ban. We currently have 46 sample results reported by the laboratory and all results are within EPA and OHA requirements. For more information on the water quality impacts from the Holiday Farm Fire and on finished drinking water quality generally, including the 2020 Water Quality Report published in May, visit our WATER QUALITY REPORTS website.

24
Safe Drinking Water Act Quarter In Compliance?
Q2
Emergency Preparedness Activities
OVERALL STATUS: BELOW TARGET Natural hazard and security response mitigation plans along with resiliency plans are a final barrier in place to protect the public if harmful contaminants should make it through the other water system barriers. Our enhanced Emergency Response Plan is in the final review stage and will be followed by plan testing and training. The COVID 19 Pandemic has hampered our ability to conduct the multi-agency intertie drill and emergency well drills, which are now scheduled for Q3 & Q4. The McKenzie Watershed Spill Drill normally takes place in Q3 and is on track.
Metric 2021 Goal YTD Status On Target? Finalize Enhanced Emergency Response Plan
Q2 In Process
McKenzie Watershed Spill Drill Annual Incomplete (Q3)
Emergency Well Drill (2 sites) Annual Incomplete (Q4)
Exercise Emergency Intertie (EWEB, SUB, Rainbow)
Annual Incomplete (Q3)
Emergency Water Treatment Trailer Exercise
Quarterly Completed Q1
Emergency Water Distribution Trailer Exercise
Semi-Annual Completed Q1
Emergency Response Plan Testing & Exercise
Annual Incomplete (Q3)

25
SEE APPENDIX E – CAPITAL SPENDING SUMMARY - Refer also to Emergency Water Supply in the Water Utility Capital Spending Summary and Project Updates.
CAPITAL INVESTMENTS & PROJECTS
Water Utility Capital Spending Summary & Project Updates
Overall, water capital expenditures are projected to match budget in 2021. Bids received later this year on the E. 40th Reservoir project and the timing of construction could affect this projection. The Q3 quarterly report will reflect this.
SEE APPENDIX D – WATER UTILITY EL-1 CAPITAL REPORT - Shared Services project updates are provided within the Electric Utility Capital section, but the project budget and costs are split between Electric and Water in the appendices.
TYPE 1 – General Capital Projects (Water) Type 1 General Capital is budgeted year-by-year for routine capital expenditures totaling less than $1 million and is funded with rates and customer
contributions. Typical examples include “main replacements” as part of Distribution & Pipe Services.
OVERALL STATUS: BELOW TARGET Water Type 1 capital expenditures are projected to be slightly below budget driven largely by an underspend in pump station work due to project delays and in main replacements/improvements. The main replacement work is our largest Type 1 area of work and is one we will be paying close attention to in the next several quarters due to possible supply chain impacts. Delays in material procurement could delay several of our large, planned projects. Service work expenditures are anticipated to be slightly above budget.

26
TYPE 2 – Rehabilitation & Expansion (Water and Shared Services) Type 2 capital projects are discrete, with a defined completion period, and lifetime expenditures over $1 million. Depending on the project, this
work may be funded with rates, customer contributions, or bond funds.
OVERALL STATUS: ON TARGET Although water Type 2 Capital Expenditures are projected to match budget, there are several large changes. In 2021 water is constructing the second phase of a large transmission main project extending from the EWEB headquarters site across University of Oregon property. This was originally planned for construction in 2022 however it was brought forward a year to coordinate its construction with a City bike path improvement in the same area. The overage caused by this is offset by a change in the timing of construction expenditures of the E. 40th Reservoir Project. The total Type 2 projected expenditures could be affected by the bids received and the timing of the earthwork for the E. 40th Reservoir project.
TYPE 3 STRATEGIC - Emergency Water Supply
Type 2 capital projects are discrete, with a defined completion period, and lifetime expenditures over $1 million. Depending on the project, this work may be funded with rates, customer contributions, or bond funds.
OVERALL STATUS: BELOW TARGET
2021 water capital work in this area is focused on continued efforts to construct emergency water distribution sites. This year, this effort will largely be focused on the South Eugene site. Expenditures are anticipated to be below budget.

27

28
Workforce Report
OVERALL STATUS: ON TARGET Lena Kostopulos
Status Summary
Workforce Services Operations
Workforce Services programs are performing as expected and meeting established targets. Mid-year information pertaining health and other insurance plan utilization rates does not indicate any reason to anticipate premium rate increases outside those which are standard for administrative costs. Worker’s Compensation experience remains within 3-year averages, also suggesting no significant premium increase. The Mobile Work Initiative is underway to implement some full-time and hybrid telecommuting schedules on an on-going basis. Leaders recognize mobile work as a lasting change in the employment landscape and as a means to improve operations through efficiencies, and to enable broader and more diverse candidate pools for EWEB positions. Greater workforce flexibility will also be an important aspect of ensuring EWEB remains an attractive regional employer.
HEALTH & SAFETY
EWEB received two safety awards, first place in the AWWA and second place in the NWPPA Annual contests. Over 50% of EWEB employees have self-reported as fully vaccinated against Covid-19.
Injury Reporting
*OSHA Recordable Injury: Death, any injury resulting in days away from work “OSHA time loss days,” any injury resulting in restricted duty or job transfer, or any injury requiring medical treatment beyond first aid.
231619
0
5
10
15
20
25
3 Year Avg20202021
Total Injuries Jan-June
1111
6
02468
1012
3 Year Avg20202021
OSHA Recordable Jan-June

29
* OSHA Time Loss Days: Number of full days of work missed because of a recordable injury or illness.
Safety Concerns/Good Catch Reporting
Good catch reporting continues to improve; Safety concerns continue to be largely Covid-driven.
WORKFORCE MANAGEMENT
Workforce Resiliency
Capacity and resiliency studies continue in each division, with some groups having completed initial analysis and planning, and beginning execution. For example, Generation is implementing plans to ensure staffing resources align with the requirements of emerging work on Carmen-Smith, Leaburg/Walterville and canal projects. Filling electric and generation skilled craft, and other utility-specific engineering and technical jobs remains a challenge. The available pool of workers in these occupational categories is shrinking. Examples of efforts to reach and hire qualified candidates include contracting with utility-specific hiring agencies, expansion and continuing evaluation of advertising outlets, recrafted posting language emphasizing positive features of EWEB employment, offering “signing incentives,” and revisiting relocation assistance practices.
70
117
200
20406080
100120140
3 Year Avg20202021
Number of OSHA Time Loss Days Jan-June
6152367 911
21
101
0
25
50
75
100
125
150
175
200
2018201920202021
Safety Concern/Good Catch Reporting Jan-June
Q1 Q2
COVID-1955%
Vehicle 9%
Employee Security
9%
Unsafe Act or Condition
27%
Safety Concerns/Good Catch Distribution by Category 2021 Jan-June

30
The number of out-of-area candidates continues to diminish, presumably due to the high cost and limited availability of both purchased and rental housing. The adoption of a mobile workforce philosophy may be helpful in overcoming this obstacle for some occupations, but telecommuting strategies will not affect fieldwork and other jobs which cannot operate remotely. EWEB continues to build internal candidate pools through BOLI-endorsed apprenticeships, other internal training programs, and career progression strategies. While these are good long-term approaches, they can take years to complete. For example, craft apprenticeships take approximately 4 years. Specifically, regarding electric craft workers, regional utilities have dramatically increased wages, making competition for an already limited pool of workers even tighter. A study of wages among comparators revealed that EWEB electric craft wages have fallen notably below the average for the region. This is a big concern since EWEB’s union agreement will not be renegotiated until late 2022 for a 2023 renewal. If left unaddressed, the gap between EWEB wages and those of other regional employers would continue to grow. To that end, EWEB Management proposed a mid-term increase of 3% for electric job classifications only, to which IBEW leadership agreed. Other non-electric IBEW-represented jobs are excluded, as wages for those jobs presently meet or exceed their comparator averages.
Capacity & Resiliency Indicators/Disruption Risk Protected leave usage and incidental absence rates are lower than in 2020 but nearly identical to 2019 pre-Covid levels for the same period. This may be due to increasing opportunities to see medical providers and to undergo medical procedures which were suspended during pandemic-related closures. More post-Covid experience is required to establish a trend or to draw more precise conclusions. Absence due to leave utilization, including vacation and comp time, represents only a fraction of available work time and therefore, does not indicate much disruption risk.

31
While nearly 20% of EWEB’s workforce meets minimum retirement-eligibility thresholds, the number of probable retirements, 29, represents just over 5%. Probable retirements are considered those which are likely within 2 years, generally providing ample time for proper succession planning, knowledge transfer, or the repurposing of roles. Attrition rates remain low across all categories, again not representing a disruption risk.
4%
0%2% 2%
6%
1%3% 2%
12%
2%
6%4%
0%
5%
10%
15%
20%
Overall Attrition Involuntary Voluntary Non-Retirement
Retirement
Attrition
2021 2020 2019

32
Shared & Strategic Operational Updates
PHYSICAL SECURITY
OVERALL STATUS: ON TARGET Nate Wahto
With the decrease of civil unrest in the area, the patrol team was able to shift focus to providing more proactive patrols of EWEB sites. With that, total field contacts rose to 205. An increase of 62% over Q1. This is likely due to a combination of warmer temperatures and the increase in movement from the unhoused population. Reportable property nuisances due to politically motivated graffiti or other issues have decreased from 43 in Q1, to 37 in Q2. However, breaches into secure areas increased to 8, a record high for the Utility in that time span. One of note was at Adams substation where an individual cut through the chain link fencing on the north side and gained access to the substation yard.
Calls for service, or patrol responses, were also at an all-time high with more than 130. These requests include escorting employees or contractors due to unsafe conditions, investigating reports of suspicious or criminal activity, and other requests. External political, economic, and other societal factors increase these responses. For Security Systems, 12 new cameras are now operational. Most notably, several cameras have been added at Water Distribution sites that enable duty operators to remotely view and investigate concerns that could impact critical assets. Additional cameras plan to be added at remote sites to enhance EWEB’s ability to monitor critical infrastructure.
CYBER SECURITY
OVERALL STATUS: ON TARGET Rod Price/Ed Penn
The Cyber Security Department Updated Mission & Vision
Mission: Managing cybersecurity risks that could adversely affect the sensitive data entrusted to us by our customer-owners and those that impact the ability to deliver water and electricity safely and reliably. Vision: To be a trusted counselor that ensures the Utility meets the cyber security standards and behaviors necessary to securely deliver water and electricity.
0
100
200
300
PropertyNuisance
Citizen Contacts Trespass Breaches
Patrol Activity
Q1 Q2

33
ISMS Status
The table below contains a high-level overview of the status of the Information Management System (ISMS) Programs. "Complexity" refers to the difficulty to implement and document, which also includes the degree to which it is outside the control of cyber. "Functionality" expresses the degree to which the program is working, regardless of how well it is documented, and is based on our current understanding of the environment and EWEB's processes. "Current step" refers to the where the program is in terms of the work that Cyber is doing on the ISMS itself, and ranges from analysis, documentation, implementation, through maturing.
Status of the ISMS Programs
Program Complexity Functionality Current step Asset Management High Functional Analysis Cyber Security Operations Low Functional Maturing Data Protection Moderate Needs Work Documentation Disaster Recovery and Business Continuity High unknown Analysis Communication and Operations Moderate Functional Analysis Employee Security Moderate Functional Analysis Identity and Access Management Moderate Functional Documentation Incident Response Moderate Functional Implementation Security Awareness Low Functional Maturing Third Party Vendor Risk Management-Supply Chain Risk Management
Low Documented Implementation
Threat and Vulnerability Management Moderate Functional Maturing
ESA Updates
To better understand the security needs of the Utility, Cyber, Physical Security, and Enterprise Risk performed a combined Enterprise Security Assessment in 2020, focused on the ROC. This assessment resulted in several recommendations, which both Cyber and Physical Security are working with our partners on this year. The Enterprise Security Assessment was a significant step toward fulfilling our vision of becoming a trusted counselor to the Utility.
Status of the Cyber Recommendations
Recommendation Complexity Effort Status Retain IR Vendor Low Moderate On Track Organizational Cyber IR Team Moderate Low Complete Multifactor Authentication (MFA) Implementation Expansion Moderate Moderate On Track Role Based Access Control Implementation High High On Track SIEM Completed Low Moderate On Track Maturing Security Assessments Low Moderate On Track Improved Endpoint Detection Moderate Moderate On Track Baseline Security Improvements Moderate High Delayed Improved Security Awareness Low High On Track Modernize Critical Software High High TBD
Threat and Vulnerability Program Status
We are currently building out our visibility and response tools with a goal of covering all critical assets within one year. We use Tenable.SC as our Vulnerability management tool. Approximately 44% of our Windows servers are scanned by this tool. We leverage Tripwire Enterprise to monitor changes in our environment and to look for signs of intrusion by an

34
attacker. Around 60% of our Windows server are monitored by Tripwire Enterprise. Coverage from our Vulnerability management tool and Change Monitoring tools is shown below.
Cyber Security Awareness Training
We regularly reinforce email security best practices for employees as we interact with people on phishing samples that they send in.
Phishing emails forwarded to the Cyber Security Department
We do quarterly simulated phishing attacks on EWEB employees. This helps minimize the threat of phishing attacks at EWEB by sharpening the cyber skills of all employees.
Results of Q2 2021 Simulated Phishing Campaign
0
20
40
60
80
100
April May June Total

35
REGULATORY COMPLIANCE
Dam Safety
OVERALL STATUS: BELOW TARGET Lisa Krentz
Item of Note Trail Bridge Reservoir Sinkholes Two sinkholes were discovered in Trail Bridge Reservoir as part of routine monitoring efforts. EWEB staff are working diligently to manage the safety risk to the public downstream of the dam while actively investigating sinkhole conditions and cause and are working closely with the Dam Safety Division of the Federal Energy Regulatory Commission and expert consults to address the issue and develop a risk mitigation plan. We have implemented several risk-reduction measures to date, including voluntarily lowering the Trail Bridge Reservoir level approximately 7 feet below normal operation elevation on June 21, increasing monitoring and surveillance at the dam and downstream, and ensuring effective notification and communication with Emergency Action Plan (EAP) partners. EWEB met with EAP partners on July 15 to discuss the findings and risk management for public safety and the environment moving forward. Engineering investigations are underway to better understand historical construction conditions, evaluate monitoring data and the potential failure modes, and identify risks and investigation methods. Additional Dam Safety Program
Key Performance Areas Status and Progress Implement Owner’s Dam Safety Program (ODSP) elements in the Board Policy
• 5 areas are successfully executed. 4 in progress. • Staff have prioritizing engineering issues at Trail Bridge
Reservoir and Walterville Canal. FERC dam safety regulatory compliance
• 20 technical submittals were e-filed with FERC for the quarter.
Dam Safety Surveillance and Monitoring (DSSM)
• Specially focused DSSM procedures were set up for Trail Bridge sinkholes and Walterville forebay embankment.
Dam safety assessment, evaluation, and improvement activities
Major updates: • Staff actively evaluating and investigating Trail Bridge
sinkholes. • Staff continues work on major projects that impact dams
and require extensive FERC reviews: o Carmen Diversion flow release structures o Smith reservoir flood mitigation and flow
release control structures o Trail Bridge fish up/downstream passage
improvements o Leaburg Canal semi qualitative risk
assessment • Consultant for Walterville Canal safety evaluations is on
board now. Work will begin this month. • Retaining a Board of Consultants for the Smith Dam
mitigation project required by FERC.

36
NERC Compliance
OVERALL STATUS: ON TARGET Tyler Nice
During the second quarter, the following compliance violations were self-reported, or outstanding.
• PRC-025 - The relay settings deployed in November 2019 for the Carmen Substation and Generator protection did not meet standard requirements. Two relay settings, the Unit voltage-controlled phase time overcurrent (51V-C) and 115kV Line phase distance (21) protection settings did not meet the requirements of PRC-025. The new relay settings were developed using calculations that were assumed to meet the requirements of PRC-025 and were put into service before formal verification of PRC-025 compliance was performed. EWEB has mitigated this violation and will submit full documentation along with preventative measures by July 22, 2021.
• PRC-019 - EWEB did not perform coordination as required by PRC-019 R2 for Carmen Units 1 & 2 within the 90-day timeframe required under the standard when protection system components and the generator step-up transformers associated with these Units changed. EWEB has mitigated this violation and will submit full documentation along with preventative measures by July 22, 2021.
FERC Compliance
OVERALL STATUS: ON TARGET Lisa Krentz
The Federal Energy Regulatory Commission (FERC) did not issue any violations of EWEB’s FERC licenses during Q2.

37
INFORMATION SERVICES OPERATIONS
OVERALL STATUS: ON TARGET Daniele McCallum / Bruce Debysingh
MDM Performance Metric
MDM Critical system errors is a sum, AMI Billing Process Uptime is a proportion, and AMI Read Validation Performance is an average. All KPIs within vendor recommendations
Q2 Incident Management
471
56 24
517
39 20
100
200
300
400
500
600
99.99%-100% 99.98-99% <99%
Network Device Availability
Q1 Q2
183
260
202
180
0
50
100
150
200
250
99.99%-100% 99.98-99% <99%
Production Server Availability
Q1 Q2
MDM Q2 Benchmark KPIs

38
IS Project Status Report
Severity Level Date Status Service Affected Customers Affected Est. Uses Impacted
Impact Category Resolve Time (Hours)
Major 14-Apr Resolved Okta / O365 All EWEB (Internal) 500 Change 1Major 6-May Resolved CIS & CSS Portal (QUA) EWEB Customers (External) 1100 Change 1.5Major 11-May Resolved Outlook All EWEB (Internal) 500 Vendor Incident 36Critical 21-May Resolved RNI- AMI AMS, Meter Shop, Dispatch, Electric, Water 30-50 Vendor Incident 3Major 31-May Resolved GIS - Designer Distribution Engineering 20 Change 24Major 31-May Resolved GIS - Designer, ArcFM Distribution Engineering, CAD & Mapping (mappers) 25 Change 24Major 11-Jun Resolved Teams All EWEB (Internal) 500 Vendor Incident 24Minor 16-Jun Resolved Phone System All EWEB (Internal) 500 Vendor Incident 7

39
LEGISLATIVE UPDATES
OVERALL STATUS: ON TARGET
Anne Kah/Jason Heuser At the August 3, 2021, Regular Board Meeting, Government Affairs Manager, Jason Heuser will present the State Legislative Session Update to Commissioners, including the following: State:
• 100 Percent Clean Energy Standard: The 2021 Oregon Legislature passed legislation that requires Oregon’s largest investor-owned utilities to reduce greenhouse gas emissions by 100 percent below baseline levels by 2040. Interim goals are 80 percent emissions reduction by 2030 and 90 percent reduction by 2035. Consumer-Owned Utilities (COUs), including EWEB, are not subject to the standard but will continue to adhere to the standards for COUs in the existing Renewable Portfolio Standard. Utilities will be allowed temporary exemptions from emission reduction targets if compliance with the policy violates a cost cap or undermines the reliability of the electric grid. the Oregon Energy Facilities Siting Council would be prohibited from allowing new or expanded natural gas power plants.
• McKenzie Watershed Recovery Investment: The legislature allocated funds for Post-Fire McKenzie Watershed Recovery including: 1) A $4 million grant to EWEB for riparian/floodplain acquisition and restoration; 2) $325,000 for the Finn Rock Reach restoration project; and $15 million for water and wastewater infrastructure, including septic system repair/replacement and a community wastewater project at Blue River.
• Utility Wildfire Mitigation Plans: legislation was approved requiring that IOU plans will be submitted by December 31st, 2021 and approved by the Oregon Public Utilities Commission. COU plans must be completed by June 30th, 2022 and submitted to the PUC (to be compiled only for statewide planning purposes), but COU plans will be approved by their governing bodies (i.e., EWEB Commissioners).
LEGAL MATTERS
Deborah Hart/Sarah Creighton
• Central Lincoln PUD v. Oregon Department of Energy et al.: EWEB has joined with other utilities, including
cooperatives and people’s utility districts, to challenge aspects of the Energy Supplier Assessments (ESA) imposed by the Oregon Department of Energy (ODOE). ODOE appealed the trial court’s decision favoring the plaintiffs. The Court of Appeals issued their written decision on October 7, 2020, substantially ruling against the Petitioners, reversing refunds of past assessments, and remanding the case for further action by the trial court. However, the ruling in the lower court that the ESA is a tax was upheld, as a result future ESA increases must be approved by the legislature -- by a 3/5ths majority in both the House and the Senate. This higher threshold for the approval of any future ESA rate increase may result containing future growth of the ESA. The matter is pending reactivation at the Marion County Circuit Court.
• N. Harris Computer Corporation v. EWEB: In May 2018, EWEB issued a letter notice of termination on a vendor
contract with a division of N. Harris Computer Corporation, relating to the installation and configuration of a replacement customer information system (CIS). Despite efforts to resolve the conflict by mediation, N. Harris Computer Corporation filed a lawsuit against EWEB on December 17, 2018, asserting Breach of Contract, seeking approximately $740,000. EWEB filed an answer and counter complaint based on misrepresentation, breach of contract, and seeking rescission with restitution for financial damages. EWEB’s response to the plaintiff’s motions for summary judgment has been filed, and the court took the motions under advisement July 2019. The schedule

40
for discovery and trial will be dependent upon the timing and scope of the court’s decisions on the pending motions.
• Jody Anderson, et. al. v. Eugene Water & Electric Board and Lane Electric Cooperative, Inc.: Complaint was filed in Lane County Circuit Court on April 16, 2021 (amended May 17, 2021) by 175 plaintiffs claiming damages alleged on theories of statutory wildfire liability, negligence, gross negligence, trespass, nuisance, and inverse condemnation arising from the Holiday Farm Fire which began on September 7, 2020. Pre-trial discovery has yet to commence, pending the filing and resolution of motions contesting the legal sufficiency of the allegations in the amended complaint.
• Karen Anderson, Devine Restorations Investment Trust, et al. v. Lane Electric Cooperative, Inc., and Eugene Water & Electric Board: On May 24, 2021, Complaint was filed by 76 plaintiffs claiming damages on theories of wildfire liability, negligence, trespass, and nuisance arising from the Holiday Farm Fire. As on July 19, 2021, EWEB has yet to be formally served with a Summons and Complaint.
PURCHASING – SUPPLY CHAIN
Deborah Hart/Sarah Gorsegner
What is going well
EWEB has a well-stocked inventory for the majority of routinely used materials required to provide water and electric service including poles, pipe, transformers, conductor, and repair materials for both the electric and water materials.
Where we are challenged
For materials that have raw materials in limited supply EWEB is experiencing long lead times, high prices, and in some cases limited availability. Price escalation for some materials has significantly exceeded the inflationary rates of 2-4% we have experienced over the past 10 years. Net impacts are $150,000, minimal impact to budget, with more significant concern of material availability for projects. 2021 Price Escalation
Tree Trimming-9% Price Escalation
Ductile Iron Fittings-27-60% Price Escalation
Brass Fittings-10-15% Price Escalation
Submersible Transformers-45% Price Escalation
Budget impacts from the increased pricing is estimated at $150,000, with around $120,000 due to tree trimming labor increases.

41
Some materials have a pause in availability or very long lead times. Purchasing is working with project teams and contractors to consider alternative options and to place orders early. Some work has been impacted by limited availability, primarily Water Construction and AMI Electric Smart Meter Deployment projects.

42
GOAL 2 – ADVANCED METERING
Goal #2 – Effectively execute and operationalize a multi-divisional information system program by successfully scaling-up advanced metering for revenue management purposes.
OVERALL STATUS: BELOW TARGET Rod Price
Status Summary Water meter deployment is on track to complete installations the end of 2023. Electric meter installations are planned for completion in early 2022. Recent supply chain issues are impacting the schedule but may not change the early 2022 target. Successful meter reads remain consistently within targets at 98-99% for the last six months indicating overall health of systems from meter to billing. Item of Interest Facilities In the latter half of 2019 the AMI Program team began work on the AMI Facilities upgrades. The scope of the work included system hardware for new and existing facilities, three upgraded poles and four completely new facilities. As of 7/9/2021 all sites are completed with some tuning still in process. Supply Chain Issues On 6/30/2021 Sensus informed EWEB that they will not be able to supply 2S residential meters for the months of August and September. UPA is reducing their deployment to 50% as of 7/19/2021 in order to retain staff. We anticipate 2S meter deliveries to resume in October. The potential impact to the overall schedule may push the UPA completion by six weeks.
BUDGET
SEE APPENDIX C – ELECTRIC UTILITY EL-1 CAPITAL REPORT - Shared Services project updates are provided in the Advanced Metering Report, but the project budget and costs are split between Electric and Water in the appendices.

43
METER INSTALLATIONS (as of 6/30/2021)
Electric mass deployment is projected to be completed in early 2022.
Water deployment is projected to be completed by end of year 2023.
UPA VENDOR PERFORMANCE (as of 7/16/2021)
Total to Date % of Total
Meters Installed 15,248 32% RTU’s (Return to Utility as unable to install)
221 1.45%
Claims 4 0.03% Appointments (contract limit 2%) 218 1.28%

44
GOAL 3 – REVISE & UPDATE STRATEGIC PLAN
Goal #3 Revise and update the strategic plan in order to identify and prioritize the most impactful 3-5-year strategic issues, decisions, and projects.
OVERALL STATUS: ON TARGET Frank Lawson
Status Summary Two public meetings have been held to discuss revisions to the strategic plan. As presented, the most impactful 3-5-year strategic issues, decisions, and projects include:
a. Advanced Metering & Analytics – e.g., Meter Data Management (MDM) System, Customer Experience System, Financial System & Customer Information System (CIS)
b. Integrated (Electric) Resource Plan – informs electricity supply contracts, new energy services, and EWEB-owned asset decisions
c. Rate Design –pricing agnostic to customer/product choices (prerequisite to new energy services) d. Resiliency (Electric) – e.g., disruptive-event mitigation plans, fortify/automate system controls (including
telecommunications), replace aging high-impact underground conductors, prioritize links between local generation and essential services (resilient spine)
e. Resiliency (Water) – e.g., watershed recovery, base-level reservoirs and transmission, Willamette water treatment plant design
Item of Interest A work session is scheduled for September 21, 2021 to finalize revisions to the strategic plan prior to proposed approval on October 5th.
PROJECT MILESTONES
• Multiple Work Sessions Q1/Q2 2021 • Final Revision Work Session Sept. 21, 2021 • Plan Revision Approval Oct. 2021
COMPLETED
Board Work Sessions were held on February 16 and April 20th to discuss a strategic review and carbon and energy, respectively.
IN PROGRESS
Preparing for Policy Proposals/Discussions – September 21, 2021

45
GOAL 4 – COLLABORATE & ALIGN WITH THE BOARD
Goal #4 – Collaborate and align with the Board to develop directional guidelines and decision criteria on issues having long-term strategic and policy-setting impacts, including development and approval of: a) Revised/updated Watershed Recovery & Protection Program, including appropriate 2021 budget amendments and future revenue mechanisms.
OVERALL STATUS: ON TARGET Karl Morgenstern
Status Summary The initial emergency response phase or risk-based actions were 95% completed in Q1, with the final revegetation sites being completed in Q2 for a total of 89 properties being replanted. The main accomplishments in Q2 are as follows:
• Completed fire fuels treatments on 25 properties to meet Oregon Department of Forestry (ODF) funding deadline of 6/30/21.
• Upgraded, redeveloped, and field-tested property assessment tools to include revegetation needs, invasive weed problems, need for fuels treatment, and potential erosion issues.
• Develop Pure Water Partners (PWP) process for re-assessing all properties previously worked on during the emergency response phase (over 300 properties) where the landowner signs a new access agreement (assessment activities scheduled for Q3).
• Worked closely with State agencies, legislature committee chairs, federal congressional delegation, Lane County, and others to promote funding needs and secure outside funding to support HFF recovery efforts.
• Planning and design efforts continue to move forward to support large-scale floodplain restoration projects (resiliency actions). The McKenzie River Trust Finn Rock Reach Phase 1 floodplain restoration project implementation will occur in Q3.
PROGRAM MONITORS
The Holiday Farm Fire (HFF) watershed recovery and restoration efforts were in transition in Q2 from emergency response to developing a comprehensive property assessment process that includes identifying revegetation needs for winter 2021/22 planting, excessive fire fuels in need of treatment, invasive weed outbreaks to be treated, and erosion issues that need to be addressed ahead of fall rains (risk-based actions). Metrics associated with these assessment and work activities will be reflected in the Q3 reporting. The following summaries provide an overview of the landowner incentive programs, land acquisition efforts, budget and outside investments, and water quality impacts from the Holiday Farm Fire. HFF Landowner Incentive Programs
EWEB established a set of programs to provide landowners impacted by the HFF with grant funds and/or 0% interest loans as incentives for septic system repair/replacement, septic system upgrades, and rebuilding homes and structures out of riparian setback or special hazard areas (floodway or floodplain). These efforts are coordinated with Lane County and have been slow to gain traction to date as summarized below:
• Issued four (4) 0% interest loans for septic system replacement or repair • Five landowners have expressed interest in rebuilding farther back from the river and are assessing what is
possible.

46
Floodway/Riparian Land Acquisitions
FLOODWAY PARCELS ACQUIRED
The goal is to acquire 30 parcels that have destroyed structures from the HFF in the floodway/riparian area by 2023. The three parcels acquired to date total approximately 5 acres.
2021 LAND ACQUISITION BUDGET
Funding and Budget Tracking (2021 Budget Amendment)
In March 2021, the Board approved a $3.9 million Water budget amendment to fund watershed recovery and restoration efforts (including carry over of $500,000 from 2020) over this year.
2021 BUDGET EXPENDITURES
This level of investment will be sufficient to support this ongoing work and is being leveraged by other funding as indicated below.
23
7
0
2
4
6
8
Q2 Total In Process
1,500,000
245,000
1,255,000
0
500,000
1,000,000
1,500,000
2,000,000
Budget Spend Remaining
675,000 635,000
1,310,000
0
500,000
1,000,000
1,500,000
Q1 Q2 Total Spent

47
NON-EWEB WATERSHED RECOVERY FUNDING
Holiday Farm Fire Water Quality Impacts
Water quality monitoring through Q2 indicates that impacts from the HFF continue to be muted and are mainly tied to storm events, which have been less frequent and significant in 2021. Drought conditions have significantly impacted river flows in Q2 and will continue to be a challenge through the summer. WATER QUALITY TRENDS
7,600,000 7,275,000
14,875,000
0
5,000,000
10,000,000
15,000,000
20,000,000
Funding Secured Funding Pending Total Fudning

48
Goal #4 – Collaborate and align with the Board to develop directional guidelines and decision criteria on issues having long-term strategic and policy-setting impacts, including development and approval of: b) TBL-based plan for the lower McKenzie River Hydroelectric Projects in compliance with FERC, and collaboration with the McKenzie Valley community.
OVERALL STATUS: ON TARGET Lisa Krentz
Status Summary During Q2, staff made significant progress on gathering some of the additional information needed for the Board to ultimately make an informed decision on the operation of Leaburg Canal.
COMPLETED
• Preliminary Triple Bottom Line analysis for stormwater conveyance vs. return to service (current license period) • Regulatory options legal analysis • Water Rights research • Roadmap for decision making process of current license term options • Contract awarded for near term risk mitigation actions (design of safety measures for current operating
conditions)
IN PROGRESS
• Communication and stakeholder engagement strategy development • Water quality impact analysis for stormwater conveyance vs. return to service • Roadmap for comprehensive TBL (prioritization list for items requiring further investigation) • Near term risk mitigation action implementation plan development

49
Goal #4 – Collaborate and align with the Board to develop directional guidelines and decision criteria on issues having long-term strategic and policy-setting impacts, including development and approval of: c) Multi-year Information System/Technology Investment Plan, in support of both business continuity and strategic priorities, including 10-year annual spending projections for incorporation into EWEB’s Long-Term Financial Plan and 2022 Annual Budget.
OVERALL STATUS: ON TARGET Travis Knabe
Status Summary
• ET/Board Approval Secured • Scoping for Assessment & Implementation Planning • Board Presentation - targeting Q4
Item of Interest Requested Assessment Proposal from Milestone on existing approved contract
PROJECT MILESTONES
COMPLETED
• Developed introductory plan and presentation for business continuity and strategic priorities • Presentation and review of draft plan by Executive Team • Draft approved by ET • Draft ROD Completed • Present to Board
IN PROGRESS
• 10-year budget and Long-Term Financial Plan impacts • Proposal for Assessment & Planning • Program Development

50
Goal #4 – Collaborate and align with the Board to develop directional guidelines and decision criteria on issues having long-term strategic and policy-setting impacts, including development and approval of: d) Initial risk-based Wildfire Mitigation Plan, for likely filing with Oregon Public Utility Commission.
OVERALL STATUS: ON TARGET Tyler Nice
Status Summary Oregon State PUC will require EWEB to create and submit a board adopted plan by June 2022. Procurement of a consultant experienced with Wildfire Plan Development contract is in final negotiations and a contract is expected to be executed the last week of July. Phase 1 development of the plan will be focused on operational and communication tactics as well as analysis of EWEB’s high risk fire circuits and applicability of PSPS and development of criteria. Target draft plan for Board review is planned for Q4 2021. Internal staff resources have been dedicated as well to complete interagency and community communication and coordination.
PROJECT MILESTONES
Board Update – Completed at May Work Session 2021 Develop Communication Plan – Complete July 2021 Dedicate Internal Resources – Complete July 2021 Procure Consultant – Est. July 2021 Fire Risk Analysis – Est. Q3 2021 PSPS Applicability Study and Criteria – Est. Q3 2021 Internal Response and Protocol Gap Analysis – Est. Q3 2021 Internal Response and Protocol Enhancements – Est. Q3 2021 Draft Plan for Review – Est. Q4 2021 Final Plan Approval – Est. Q1 2022
COMPLETED
Operational/Tactical Plan Development
• As-Is procedure/process/criteria documentation assembled. (Vegetation program, red flag responses, etc.) • Internal resources assigned as subject matter experts for various plan aspects
Community/Agency Communication
• Draft communication plan developed • Updated of website information • Initial contact with local partners has been initiated
Consultant Procurement
• Proposal finalized and negotiated • Final terms and conditions negotiations • Mobilization – est. end of July 2021

51
IN PROGRESS
• Scheduling of kickoff of consultant activities • Preparation of data and documentation for submission for review • Finalization of communication plan • Ongoing attendance to interagency emergency management partners • Ongoing attendance to PUC workgroups

52
Goal #4 – Collaborate and align with the Board to develop directional guidelines and decision criteria on issues having long-term strategic and policy-setting impacts, including development and approval of: e) First multi-year COSA, including revised ratemaking principles.
OVERALL STATUS: ON TARGET Deborah Hart
Status Summary The multi-year COSA is a long-term strategic objective to support future rate design efforts. The completion of the multi-year COSA will inform the 2022 rate proposal in the fall to be included in November and December Budget/Rates Board Agenda items.
PROJECT MILESTONES
Multi-Year COSA/Pricing Recommendations Fall 2021 Board Meetings
COMPLETED
• April Board presentation and discussion of ratemaking principles • Executed contract with consultant and commenced data gathering and validation
IN PROGRESS
• Board COSA 101 Presentation, scheduled for September Board meeting • Board COSA Rates Presentation (Budget Rates Process) for November Board meeting

53
GOAL 5 – CONTINUE ELECTRIFICATION IMPACT ASSESSMENT
Goal #5 – Continue electrification impact assessment, specifically analyzing the future decarbonizing trends of electricity and natural gas, and the division of costs/benefits between participants, utilities, and society at-large -- a.k.a. who benefits and who pays?
OVERALL STATUS: ON TARGET Megan Capper
Status Summary The Electrification Study is on schedule to report preliminary results of our cost/benefit results and corresponding adoption rates of EVs and water & space heat conversion at the August 2021 Board meeting. As proof of concept, we will also look at creating virtual transformers with hourly loading by combining AMI/GIS information. Preliminary results will focus on findings under the base case. In our base case we use reasonable escalation assumptions in both electric and gas rates and extend trends we see today into the outyears. The final report due out in November will include scenarios of different gas/electricity blends and costs.
PROJECT MILESTONES
Initial Results/Report – Board Presentation August 2021 Final Report November 2021

54
GLOSSARY
AF: Availability Factor. Multiplied by 100, this factor indicates the percentage of time that the generating units were available for operation. BLM: Business Line Manager CI: Continuous Improvement CIA: Contributions in Aid of Construction CIS: Customer Information System CIP: Capital Improvement Plan CIP: Critical Infrastructure Protection CRM: Customer Relationship Manager CSU1 and CSU2: Carmen-Smith turbine units 1 & 2 FERC: Federal Energy Regulatory Commission FCRPS: Federal Columbia River Power System FOF: Forced Outage Factor. Multiplied by 100, this factor indicates the percentage of time that the generating units were forced offline due to an unplanned event. GCF: Gross Capacity Factor. Multiplied by 100, this factor indicates the percentage of megawatt hours generated relative to the maximum number of megawatt hours that could have been generated if the generating unit had been operating continuously at full capacity. GIS: Geographical Information System GOF: Gross Output Factor. Multiplied by 100, this factor indicates the percentage of megawatt hours generated relative to the maximum number of megawatt hours that could have been generated if the generating unit had been operating at full capacity when available to generate. HW - Harvest Wind ICS: Incident Command System IP: International Paper KGAL: 1,000 gallons KPI: Key Performance Indicator LBU1 and LBU2 - Leaburg turbine units 1 & 2 NERC: North American Electric Reliability Corporation PERS: Public Employees Retirement System PPE: Personal Protective Equipment PSPS: Public Safety Power Shutoff PUC: Public Utility Commission RCP: Retail Cash Payment RMC: Risk Management Committee SAIDI: System Average Interruption Duration Index SAIFI: System Average Interruption Frequency Index STC - Stone Creek TB - Trail Bridge WGA: Western Generation Agency (WGA) is the name of the intergovernmental entity formed by EWEB and Clatskanie People’s Utility District (CPUD). The WGA steam turbine generator is located at the Georgia Pacific paper mill named Wauna. WV – Walterville

55
APPENDICES
Appendix A: Electric Utility Financial Statement Appendix B: Water Utility Financial Statement Appendix C: Electric Utility EL-1 Capital Report Appendix D: Water Utility EL-1 Capital Report Appendix E: Capital Spending Summary Appendix F: Contracts Awarded Report Appendix G: Community Investment Report Appendix H: Electric Division Metrics Scorecard Appendix I: Water Division Details Appendix J: Workforce Composition Appendix K: Fleet Services Sustainability Report Disclaimer: The unaudited financial statements provided in this report are intended for management purposes only. [RETURN TO TABLE OF CONTENTS]
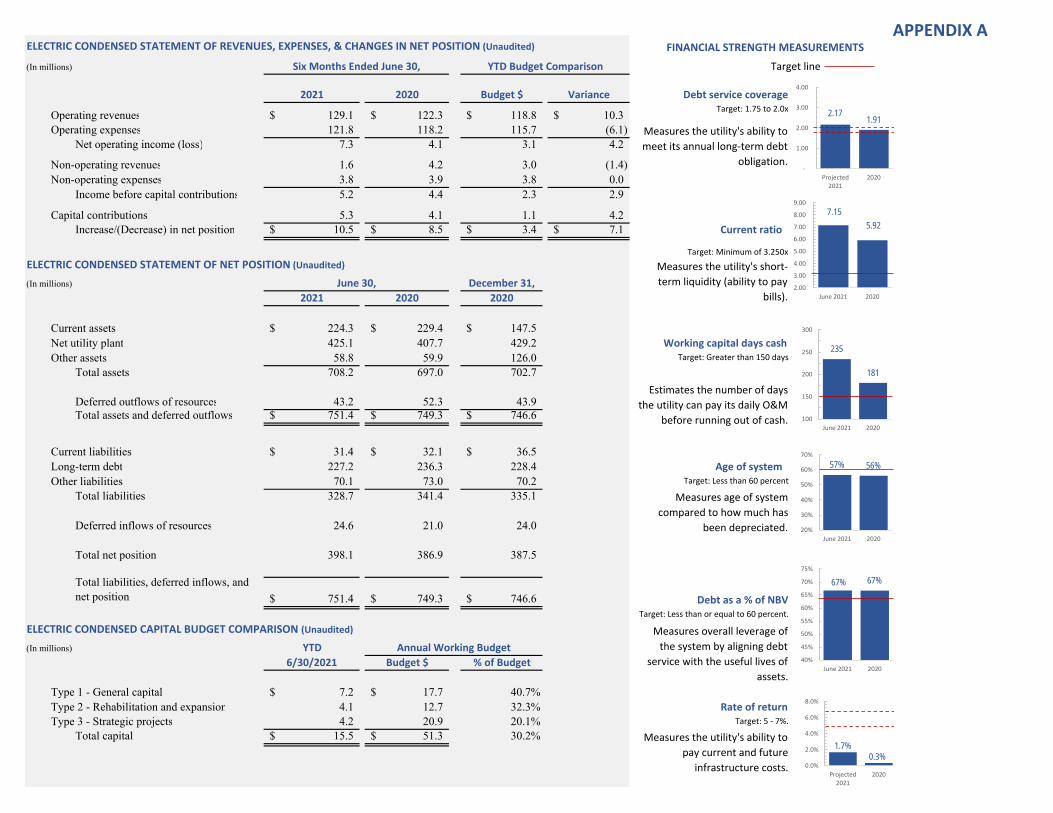
ELECTRIC CONDENSED STATEMENT OF REVENUES, EXPENSES, & CHANGES IN NET POSITION (Unaudited)
(In millions) Target line
2021 2020 Budget $ Variance
Operating revenues 129.1$ 122.3$ 118.8$ 10.3$ Operating expenses 121.8 118.2 115.7 (6.1)
Net operating income (loss) 7.3 4.1 3.1 4.2
Non-operating revenues 1.6 4.2 3.0 (1.4) Non-operating expenses 3.8 3.9 3.8 0.0
Income before capital contributions 5.2 4.4 2.3 2.9
Capital contributions 5.3 4.1 1.1 4.2 Increase/(Decrease) in net position 10.5$ 8.5$ 3.4$ 7.1$
ELECTRIC CONDENSED STATEMENT OF NET POSITION (Unaudited)
(In millions) December 31,2021 2020 2020
Current assets 224.3$ 229.4$ 147.5$ Net utility plant 425.1 407.7 429.2 Other assets 58.8 59.9 126.0
Total assets 708.2 697.0 702.7
Deferred outflows of resources 43.2 52.3 43.9 Total assets and deferred outflows 751.4$ 749.3$ 746.6$
Current liabilities 31.4$ 32.1$ 36.5$ Long-term debt 227.2 236.3 228.4 Other liabilities 70.1 73.0 70.2
Total liabilities 328.7 341.4 335.1
Deferred inflows of resources 24.6 21.0 24.0
Total net position 398.1 386.9 387.5
Total liabilities, deferred inflows, and net position 751.4$ 749.3$ 746.6$
ELECTRIC CONDENSED CAPITAL BUDGET COMPARISON (Unaudited)(In millions) YTD
6/30/2021 Budget $ % of Budget
Type 1 - General capital 7.2$ 17.7$ 40.7%Type 2 - Rehabilitation and expansion 4.1 12.7 32.3%Type 3 - Strategic projects 4.2 20.9 20.1%
Total capital 15.5$ 51.3$ 30.2%
Measures overall leverage of the system by aligning debt
service with the useful lives of assets.
Annual Working Budget
Rate of returnTarget: 5 ‐ 7%.
Measures the utility's ability to pay current and future
infrastructure costs.
June 30,
Working capital days cashTarget: Greater than 150 days
Estimates the number of days the utility can pay its daily O&M
before running out of cash.
Age of system
Measures the utility's ability to meet its annual long‐term debt
obligation.
Target: Less than or equal to 60 percent.
Current ratio
Target: Minimum of 3.250x
Measures the utility's short‐term liquidity (ability to pay
bills).
Target: Less than 60 percent
Measures age of system compared to how much has
been depreciated.
Debt as a % of NBV
FINANCIAL STRENGTH MEASUREMENTS
Six Months Ended June 30, YTD Budget Comparison
Debt service coverage Target: 1.75 to 2.0x 2.17
1.91
‐
1.00
2.00
3.00
4.00
Projected2021
2020
7.15 5.92
2.00
3.00
4.00
5.00
6.00
7.00
8.00
9.00
June 2021 2020
235
181
100
150
200
250
300
June 2021 2020
57% 56%
20%
30%
40%
50%
60%
70%
June 2021 2020
67% 67%
40%
45%
50%
55%
60%
65%
70%
75%
June 2021 2020
1.7%0.3%
0.0%
2.0%
4.0%
6.0%
8.0%
Projected2021
2020
APPENDIX A

WATER CONDENSED STATEMENT OF REVENUES, EXPENSES, & CHANGES IN NET POSITION (Unaudited)
(In thousands) Target line2021 2020 Budget $ Variance
Operating revenues 18,525$ 16,947$ 16,133$ 2,392$ Operating expenses 13,788 14,028 15,727 1,939
Net operating income (loss) 4,737 2,919 406 4,331
Non-operating revenues 340 515 33 307 Non-operating expenses 1,172 1,078 1,150 (22)
Income before capital contributions 3,905 2,356 (711) 4,616
Capital contributions 1,378 1,117 800 578 Increase/(Decrease) in net position 5,283$ 3,473$ 89$ 5,194$
WATER CONDENSED STATEMENT OF NET POSITION (Unaudited)(In millions) December 31,
2021 2020 2020
Current assets 63.6$ 67.0$ 63.6$ Net utility plant 200.8 187.8 196.3 Other assets 13.0 10.5 13.1
Total assets 277.4 265.3 273.0
Deferred outflows of resources 13.1 15.8 13.2 Total assets and deferred outflows 290.5$ 281.1$ 286.2$
Current liabilities 5.9$ 5.4$ 6.6$ Long-term debt 75.0 78.4 75.4 Other liabilities 21.8 22.7 21.7
Total liabilities 102.7 106.5 103.7
Deferred inflows of resources 7.3 6.4 7.3
Total net position 180.5 168.2 175.2 290.5$ 281.1$ 286.2$
WATER CONDENSED CAPITAL BUDGET COMPARISON (Unaudited)(In thousands) YTD
6/30/2021 Budget $ % of Budget
Type 1 - General capital 4,634$ 9,133$ 50.7%Type 2 - Rehabilitation and expansion 3,236$ 11,575 28.0%Type 3 - Strategic projects 114$ 412 27.7%
Total capital 7,984$ 21,120$ 37.8%
Total liabilities, deferred inflows, and net position
Annual Working Budget
Rate of returnTarget: 5 ‐ 7%.
Target: Greater than 150 days
Estimates the number of days the utility can pay its daily O&M before running out of cash.
Age of systemTarget: Less than 60 percent
Target: Less than or equal to 60 percent.
Debt as a % of NBV
Working capital days cash
Measures the utility's ability to pay current and future infrastructure costs.
Measures age of system compared to how much has been depreciated.
Measures overall leverage of the system by aligning debt service with the useful lives of assets.
Current ratio
FINANCIAL STRENGTH MEASUREMENTS
June 30,
Six Months Ended June 30, Budget ComparisonDebt service coverage
Target: Minimum of 3.25x
Measures the utility's short‐term liquidity (ability to pay bills).
Target: 2.0 ‐ 2.50x
Measures the utility's ability to meet its annual long‐term debt obligation.
3.48
4.51
1.00
2.00
3.00
4.00
5.00
Projected 2021 2020
10.78 9.66
2.00
4.00
6.00
8.00
10.00
12.00
June 2021 2020
581646
100200300400500600700
June 2021 2020
42% 42%
20%
30%
40%
50%
60%
70%
June 2021 2020
41% 42%
30%
35%
40%
45%
50%
55%
60%
June 2021 2020
5.3% 5.2%
0.0%
2.0%
4.0%
6.0%
8.0%
10.0%
Projected2021
2020
APPENDIX B

EUGENE WATER & ELECTRIC BOARDELECTRIC UTILITY EL‐1 CAPITAL REPORTQ2 2021
2021 % OF YEAR‐ENDAPPROVED WORKING ACTUAL BUDGET PROJECTION
TYPE 1 ‐ GENERAL CAPITALGeneration Infrastructure 1,440,000$ 1,440,000$ 252,300$ 18% 1,755,000.00$ Substation Infrastructure 2,000,000 2,000,000 613,900 31% 2,000,000Transmission & Distribution Infrastructure 7,211,000 7,211,000 3,576,500 50% 6,975,000Telecommunications 1,319,000 1,319,000 533,300 40% 954,000 Information Technology 4,667,000 4,667,000 612,200 13% 3,867,000Buildings, Land, & Fleet 1,074,000 1,073,950 1,657,000 154% 3,167,000
TOTAL TYPE 1 PROJECTS 17,711,000$ 17,710,950$ 7,245,200$ 41% 18,718,000.00$
TYPE 2 ‐ REHABILITATION & EXPANSION PROJECTSDowntown Network 1,070,000$ 1,070,000$ 210,200$ 20% 1,329,000.00$ Consolidation of Operations ‐ ‐ 57,100 0% 57,100 Electric T&D ‐ Master Plan ‐ 760,000 24,400 3% 760,000 Distribution Resiliency Upgrades 2,235,000 1,475,000 406,100 28% 702,000 Upriver Reconfiguration/Holden Creek ‐ ‐ 500 0% 500Electric Meter Upgrade 6,900,000 7,630,000 2,656,500 35% 6,600,000Telecommunications ‐ ‐ 300 0% ‐Information Technology 2,524,000 1,794,000 568,100 32% 1,794,000Hayden‐Bridge Lab & Backup Services Building ‐ ‐ 121,300 0% 135,000
TOTAL TYPE 2 PROJECTS 12,729,000$ 12,729,000$ 4,044,500$ 32% 11,377,600.00$
TYPE 3 ‐ STRATEGIC PROJECTS & PROGRAMSCarmen‐Smith Relicensing 20,900,000$ 20,900,000$ 4,173,800$ 20% 19,110,000.00$
TOTAL ELECTRIC CAPITAL PROJECTS 51,340,000$ 51,339,950$ 15,463,500$ 30% 49,205,600.00$
Type 1 ‐ General Capital is budgeted Year‐by‐Year for recurring capital expenditures from January through December. Type 1 Capital includes categorized collections of projects of less than $1 million, and typically involves dozens of individual projects that add up to $3.5‐4.5 million per year.
Type 2 projects have "discrete" scopes, schedules (launch through completion), and cost over $1MM during the project life, and project life can span multiple years.
Type 3 projects are large strategic programs with long term impacts and are typically bond‐funded.
ANNUAL BUDGET
APPENDIX C

EUGENE WATER & ELECTRIC BOARDWATER UTILITY EL‐1 CAPITAL REPORTQ2 2021
2021 % OF YEAR‐ENDAPPROVED WORKING ACTUAL BUDGET PROJECTION
TYPE 1 ‐ GENERAL CAPITALSource ‐ Water Intakes & Filtration Plant 463,000$ 464,004$ 644,600$ 139% 1,010,000$ Distribution & Pipe Services 5,769,000 5,767,999 3,052,000 53% 5,500,000 Distribution Facilities 1,401,000 1,401,004 167,200 12% 600,000 Information Technology 690,000 690,180 164,100 24% 690,000 Buildings, Land, & Fleet 810,000 810,000 606,600 75% 1,200,000
TOTAL TYPE 1 PROJECTS 9,133,000$ 9,133,187$ 4,634,500$ 51% 9,000,000$
TYPE 2 ‐ REHABILITATION & EXPANSION PROJECTSSource ‐ Water Intakes & Filtration Plant 100,000$ 100,000$ 257,700$ 258% 450,000$ Distribution Facilities 7,416,000 6,694,999 346,000 5% 3,700,000 Distribution & Pipe Services ‐ 721,002 436,100 60% 3,500,000 Water Meter Upgrade 3,200,000 3,480,206 2,049,000 59% 3,200,000 Information Technology 859,000 578,327 142,000 25% 400,000 Consolidation of Operations ‐ ‐ 14,300 0% 15,000
TOTAL TYPE 2 PROJECTS 11,575,000$ 11,574,535$ 3,245,100$ 28% 11,265,000$
TYPE 3 ‐ STRATEGIC PROJECTS & PROGRAMSEmergency Water Supply 412,000$ 412,000$ 113,600$ 28% 300,000$
TOTAL WATER CAPITAL PROJECTS 21,120,000$ 21,119,721$ 7,993,200$ 38% 20,565,000$
Type 1 ‐ General Capital is budgeted Year‐by‐Year for recurring capital expenditures from January through December. Type 1 Capital includes categorized collections of projects of less than $1 million, and typically involves dozens of individual projects that add up to $3.5‐4.5 million per year.
Type 2 projects have "discrete" scopes, schedules (launch through completion), and cost over $1MM during the project life, and project life can span multiple years.
Type 3 projects are large strategic programs with long term impacts and are typically bond‐funded.
ANNUAL BUDGET
APPENDIX D

APPENDIX E
Capital Spending Summary In accordance with Board Policy EL1, staff will provide the Board with quarterly updates for all current year projects on the Capital Improvement Plans. General Capital Renewal and Replacement projects (Type 1) will be reported by category (e.g., substations, shared IT infrastructure, transmission & distribution mains). Infrastructure Rehabilitation & Expansion (Type II) and Strategic Projects (Type III) will be reported individually. Type II and III projects are further defined as those that are projected to be greater than $1 million for the life of the project.
Electric Utility and Shared Services Capital Spending Summary TYPE 2 – Rehabilitation & Expansion (Electric and Shared Service) Shared Services project updates are provided within the Electric Utility Capital section below, but the project budget and costs are split between Electric and Water in Appendix C and D. Downtown Network
Project Initiation: Sep - 2010 Initial Scope Budget: $ 15,000,000 Initial Planned Completion: Dec - 2015 Actual Project Costs To-Date: $ 10,378,000
Projected Completion: Dec - 2028 Total Final Cost Projection: $ 20,000,000 Consolidation of Operations No significant activity occurred in Q2 2021. Electric T&D – Master Plan No significant activity occurred in Q2 2021. Distribution Resiliency Upgrades
Project Initiation: Jan – 2019 Initial Scope Budget: $ 1,862,000 Initial Planned Completion: Dec – 2020 Actual Project Costs To-Date: $ 1,829,000
Projected Completion: Mar - 2021 Total Final Cost Projection: $1,973,000 Electric Metering Upgrade
Project Initiation: Feb - 2018 Initial Scope Budget: $ 13,695,000 Initial Planned Completion: Dec - 2021 Actual Project Costs To-Date: $ 17,597,000
Projected Completion: May - 2022 Total Final Cost Projection: $ 24,675,305

APPENDIX E
Leaburg Canal Risk Mitigation Improvements ‐ Generation EWEB has hired a consulting engineering team to support design and implementation of risk mitigation improvements for the Leaburg Canal. These efforts will begin in Q2.
Project Initiation: Jul - 2021 Initial Scope Budget: $ 21,500,000 Initial Planned Completion: Dec - 2028 Actual Project Costs To-Date: $ 0
Projected Completion: Dec - 2028 Total Final Cost Projection: $ 21,500,000 TYPE 3 – Carmen Smith Relicensing (Electric and Shared Services) The Carmen-Smith Relicensing Program Summary (below) has been updated to reflect the 2016 renegotiated Settlement Agreement scope, schedule, and budget (pending additional information from the Finance Department).
Project Initiation: Nov - 2016 Initial Scope Budget: $ 139,000,000 Initial Planned Completion: Dec - 2027 Actual Project Costs To-Date: $ 46,300,000
Projected Completion: Dec – 2029 Total Final Cost Projection: $ 136,800,000
Water Utility Capital Spending Summary and Project Updates
TYPE 2 – Rehabilitation & Expansion (Water and Shared Services) Shared Services project updates are provided within the Electric Utility Capital section above, but the project budget and costs are split between Electric and Water in Appendix C and D. Source – Water Intakes & Filtrations Plant No significant activity occurred in Q2 2021. Distribution Facilities and Distribution & Pipe Services The E. 40th Ave. Reservoirs, the Riverfront Transmission Pipeline and the AMI Water Meter projects listed below are included in these categories on the EL1 report. No other significant activity occurred through Q2 2021. E. 40th Ave. Reservoir
Project Initiation: 2018 Initial Scope Budget: $10,250,000 Initial Planned Completion: Dec 2021 Actual Project Costs To-Date: $679,000
Projected Completion: Dec 2023 Total Final Cost Projection: $25,000,000
Final cost projection includes Board endorsed decision to construct two tanks in current project.
The Final Project Cost differs from the $20M included in the recent triple bottom line analysis (TBL) in that the TBL only included those items related to the one tank/two tank decision. The total Project Cost includes additional common items such as:
• On-site water supply and storm system piping • On-site drainage treatment systems • Engineering, Ecological, Surveying and Landscape Architecture services. • Daily and special inspection services • Electrical work including lighting, instrumentation, fiber communication, backup battery power, and
valve control. • Water quality sampling station including instruments and an enclosure.

APPENDIX E
• Internal EWEB time and EWEB overhead • Site preparation including tree removal and grubbing. • Construction and ornamental fencing
The cost projection above is consistent with past CIPs for our base level work which included $25M for the first two storage tanks. Riverfront Transmission Pipeline Phase 2
Project Initiation: 2020 Initial Scope Budget: $2,850,000 Initial Planned Completion: Dec 2022 Actual Project Costs To-Date: $476,000
Projected Completion: Dec 2021 Total Final Cost Projection: $3,500,000 Project was brought forward one year to coordinate with a city bike path improvement project. EWEB received very good bids on this project. Due to low unit prices, additional length was added to project to complete work outside Right-of-Way. This additional length is the reason for the higher final cost projection. AMI Water Metering Upgrade
Project Initiation: Feb-2018 Initial Scope Budget: $17,828,000 Initial Planned Completion: Dec-2021 Actual Project Costs To-Date: $10,584,000
Projected Completion: Dec-2023 Total Final Cost Projection: $18,443,000 TYPE 3 ‐ Emergency Water Supply
Project Initiation: 2018 Initial Scope Budget: $4,000,000 Initial Planned Completion: 2028 Actual Project Costs To-Date: $1,728,000
Projected Completion: 2023 Total Final Cost Projection: $2,500,000 Construction of new emergency distribution sites is anticipated to end in 2023 with an anticipated total of 8 sites. Efforts will then shift to operation and maintenance of established sites.

APPENDIX F
Q2 2021 Quarterly Contracts Report
Contract Execution Date Contractor City, State Contract Title, Detailed Description Expiration Date Contract Amount Contract Process Executive Manager
4/1/2021 Delta Operations Eugene, OR Wastewater Treatment System Consulting. Support for operation of the Ecomachine at the Roosevelt Operations Center.
4/30/2026 102,750$ Direct Negotiation Rod Price
4/20/2021 EES Consulting a GDS Associates Company
Marietta, GA Cost of Service model updates. Provide a revenue requirement study including load and customer forecasting.
12/31/2021 54,640$ Direct Negotiation Deborah Hart
5/27/2021 White Glove Building Maintenance
Salem, Oregon Roosevelt Operations Center & Headquarters Window Washing. Exterior Window Washing at EWEB Facilities
5/25/2026 60,000$ Informal ITB Rod Price
5/26/2021 Transformer Technologies Salem, Oregon Disposal of PCB Transformers. Transportation, recycling, and safe disposal of transformer oil and metals
5/1/2026 145,000$ Direct Negotiation Rod Price
4/8/2021 Art2Link Corp Carmel, IN Upgrade BizTalk Application. Consulting services to support the upgrades of EWEB's Enterprise Service Bus. The Service Bus supports data across multiple software systems.
7/31/2021 46,000$ Direct Negotiation Travis Knabe
4/26/2021 Contech Services Vancouver, WA Walterville Forebay & Spillway Concrete Crack & Joint Repair. Concrete repair to fill joints, cracks, and voids measuring from 1"-4" wide in the Forebay and Spillway at Walterville.
6/30/2021 121,575$ Formal RFP Rod Price
5/11/2021 Kleinschmidt Associates Portland, OR Carmen-Smith Facilitation Support, Consultant support for strategic and technical review of Carmen Smith relicensing and settlement documents.
4/26/2026 100,000$ Direct Negotiation Rod Price
5/5/2021 Stanley Consultants Centennial, CO Distribution Design and Public Utility Commission Corrections. Engineering Services to provide design for EWEB's 12kV distribution system including designing for installing, removing, and replacing distribution system components.
7/30/2021 49,890$ Direct Negotiation Rod Price
5/24/2021 My Brothers Farm Creswell, OR Filbert Moth Monitoring. Monitoring Gypsy Moth to determine when to treat orchards to minimize impacts to Water Source Protection.
12/31/2025 63,460$ Quotes Rod Price
5/10/2021 Stored Energy Systems Longmont, CO Substation battery system. Provide batteries and accessories for use at EWEB Substations.
One Time Purchase 45,104$ Quotes Rod Price
6/30/2021 PACIFIC EXCAVATION INC Eugene, OR E 40th Ave Storage Tanks - Tree Removal, Tree Removal services to facilitate construction of 2 new water storage reservoirs
10/15/2021 110,500$ Formal ITB Rod Price
5/28/2021 Revolution Electric Eugene, OR Hunsaker/Irving Electric Service Relocations. Requires moving secondary boxes, lateral lines, trenching, directional drilling, and installing new meter bases and panels. Moving of services required due to City of Eugene widening Hunsaker/Irving Road project.
7/31/2021 70,377$ Quotes Rod Price
6/29/2021 Flux Resources, LLC Lake Oswego, OR Recruitment Services. Provide candidate search services, skills assessment, reference checks, and other position filling services
12/31/2021 20% of filled position Salary Direct Lena Kostopulos

APPENDIX F
6/8/2021 BenefitHelp Solutions Milwaukie, OR Administrative Services for Retiree Plans. Administration of EWEB's retiree insurance premium enrollment and billing including managing delinquent accounts. Advisory services on current laws, rules, and regulations.
5/31/2026 105,000$ Direct Lena Kostopulos
6/23/2021 Oregon Woods Eugene, OR Vegetation Maintenance and Irrigation. Protect newly planted seedlings and native species after revegetation after the Holiday Farm Fire.
12/31/2021 96,770$ Informal Quotes Rod Price
6/23/2021 Coast Fork of the Willamette Watershed Council Youth
Crew
Cottage Grove OR CFWYC Watershed Rehabilitation. Weeding and mulching around newly planted seedlings planted after the Holiday Farm Fire.
12/31/2021 40,000$ Direct Rod Price
6/28/2021 Skip Tracer and Lads Harrisburg, OR Water Tender on Call. Support Vegetation Maintenance and Irrigation Services in response to the revegetation after the Holiday Farm Fire.
12/31/2021 80,000$ Informal Quotes Rod Price
For questions please contact Sarah Gosegner, 541-685-7348

APPENDIX G
EVENT/DESCRIPTION PAYMENT DATE EVENT DATE AMOUNT INVESTMENT AREA CATEGORY NOTES
Andrew Reasoner Wildlife Preserve, local youth centers, and nurseries.
Remove and replant fawn lilies N/A May N/A ENVIRONMENTAL: Water Quality/Reliability Discretionary
EWEB recently teamed up with volunteers from the Columbines School of Botanical Studies to remove and replant fawn lilies at the E. 40th Water Storage project site as part of our effort to preserve and protect the site and habitats on it. Fawn lilies are a first food for indigenous Kalapuya people. The volunteers plan to distribute the bulbs to local native youth centers and nurseries. Some of the bulbs will be replanted at the Andrew Reasoner Wildlife Preserve as part of a native youth nutritional and ecological internship program.
$0
Friends of Trees Tree planting at E. 40th Water Storage project site N/A 02/27/21 N/A ENVIRONMENTAL: Water Quality/Reliability Discretionary
EWEB teamed up with Friends of Trees to plant a variety of native trees on the south side of the ridgeline on the site of the water storage project at E. 40th. EWEB donated the mulch and plant stock for the 18 trees, while FOT coordinated the volunteers. Species included white and black oaks, valley ponderosa, pine, incense cedar, pacific madrone and Oregon myrtles – species that are more adaptable to warmer, drier climates, making the habitat more acclimated to the future.
Emerald Valley Electric Vehicle Association rEV Up! EV Education Workshops Q1Multiple
throughout 2021
$5,000 ENVIRONMENTAL: Energy Efficiency/Renewable Discretionary
As part of EWEB's transportation electrification efforts, EWEB is sponsoring rEV Up workshops for our community through the Emerald Valley Electric Vehicle Association (EVEVA) group. These workshops provide EV education and secure dealership discounts for attendees. Monthly workshops will be provided in 2021 (the $5000 sponsorship supports those workshops for the entire year); Q1 workshops have already taken place.
Portland General Electric Mutual Aid N/A 02/15/21 N/A PEOPLE: Safety Net DiscretionaryThree electric line crews were dispatched to the Salem area to provide mutual aid to PGE during the February snow and ice storm that saw roughly 300,000 PGE customers out of power system wide. EWEB crews spent several days assisting in restoration efforts.
ShelterCare Water service to ShelterCare facility Q1 N/A $2,276 PEOPLE: Safety Net Discretionary
The Water department has been working to expand water service to a ShelterCare facility. ShelterCare is a private, nonprofit human-services agency directed by a board of community volunteers offering a range of housing and support services for individuals and families who are homeless, or on the verge of homelessness, with a committed focus on individuals living with mental illness. Because this is not a "new" service, the associated development charge is not eligible to be waived under the System Development Charge Waiver program, however, we feel it meets the spirit of the program therefore we are "waiving" the charge through the application of the discretionary community investment budget funds.
Eugene 4J School District Jan-June 2021 Education Grant 01/28/21 N/A $130,000 ECONOMIC: Education Board Directed
Bethel School District Jan-June 2021 Education Grant 01/28/21 N/A $40,500 ECONOMIC: Education Board Directed
McKenzie School District Jan-June 2021 Education Grant 01/28/21 N/A $11,000 ECONOMIC: Education Board Directed
Springfield School District Jan-June 2021 Education Grant 01/28/21 N/A $24,500 ECONOMIC: Education Board Directed
Leaburg Canal Property Grant Match under EWEB's Healthy Farms Clean Water Program 01/07/21 N/A $3,925 ENVIRONMENTAL: Water Quality/Reliability Discretionary
Match for a nutrient management project on a property near Leaburg Canal, under EWEB's Healthy Farms Clean Water Program. Other funding sources include OWEB, the landowner and the Upper Willamette Soil & Water Conservation District. The composting facility reduces nutrients and runoff into the canal and ultimately the McKenzie River. EWEB is contributing $3,925 of the overall $14,764 project cost.
$213,276
$213,276
Q2
Quarterly Highlight - EWEB's Annual Employee Giving ProgramEach year, EWEB provides employees the opportunity to support charities through payroll deduction and other financial contributions. Charities include the umbrella organizations United Way of Lane County and EarthShare Oregon and their many partners. The option to donate to EWEB’s own Energy Share program was a new addition in 2021. A total of $16,230 was raised for worthy causes, with almost $1,400 of that raised for Energy Share.
This year’s program also featured optional virtual presentations from local partners including United Way of Lane County highlighting their work with Wildfire Relief and COVID Impacts; EarthShare of Oregon with special presenters Joe Moll from McKenzie River Trust and Heather King with Willamette Riverkeeper; and St. Vincent de Paul who provided an overview of the important work they do in our community to support those in need, specifically the unhoused community of Eugene.
EWEB also provided support to St. Vinnie’s in the form of a laundry supply drive which aimed to collect laundry supplies to assist St. Vinnie’s in keeping our unhoused neighbors equipped with sanitary and clean clothes throughout the COVID-19 pandemic as a part of their wrap-around services.
Q1
Q1 SUBTOTAL
SPONSORSHIPS, DONATIONS, GRANTS & MUTUAL AID TOTAL YTD
Community Investment - Q2 2021Total investment Year to Date - over $9 million (not including Energy Efficiency loans, Water Truck deployments, or volunteer/ambassador efforts and events)
Community Investment Program guidelines are in place to ensure consistency and transparency for how we invest our customers' dollars for the betterment and well-being of the community we serve. Requests that provide strong alignment between EWEB's discretionary community investment criteria and the Strategic Plan are vetted through the General Manager's office for consideration. Sponsorship dollars are focused on initiatives that are both closely connected to EWEB's core mission and provide the broadest benefit to our customers.
Sponsorships, Donations, Grants & Mutual AidAGENCY
Q2 SUBTOTAL
Page 1 of 4

AGENCY EVENT/DESCRIPTION PAYMENT DATE EVENT DATE AMOUNT INVESTMENT AREA CATEGORY NOTES
EWEB Energy Efficiency Programs Energy Efficiency Incentives - Residential Q2 N/A $299,813 ENVIRONMENTAL: Energy Efficiency/Renewable Discretionary 326 customers – 10% of projects (35% of dollars) were for limited income customers and 13% were rentals.
EWEB Energy Efficiency Programs Energy Efficiency Incentives - Non-residential Q2 N/A $111,460 ENVIRONMENTAL: Energy Efficiency/Renewable Discretionary 28 non-residential customers.
EWEB Energy Efficiency Programs Energy Efficiency Incentives - Efficient Growth Q2 N/A $60,524 ENVIRONMENTAL: Energy Efficiency/Renewable Discretionary 11 residential and 1 commercial customer.
EWEB Energy Efficiency Programs Transportation Electrification Q2 N/A $21,343 ENVIRONMENTAL: Energy Efficiency/Renewable Discretionary 39 residential and 2 commercial customers received rebates for Level 2 EV Chargers.
EWEB Greenpower Program Solar Electric Incentives Q2 N/A $49,734 ENVIRONMENTAL: Greenpower Customer Voluntary18 residential net-metered projects were completed and received Greenpower-funded incentives. 1 commercial direct generation project was completed (City of Eugene).
EWEB Water Conservation Programs Hand Valve and Toilet Rebates, Septic Maintenance Incentives Q2 N/A $10,250 ENVIRONMENTAL: Water Quality/Reliability Discretionary 36 residential hand valve rebates, 21 toilet rebates, and 21 septic pumping rebates.
$553,124
EWEB Energy Efficiency Programs Energy Efficiency Incentives - Residential Q1 N/A $400,391 ENVIRONMENTAL: Energy Efficiency/Renewable Discretionary 335 customers - 15% of projects (40% of dollars) were for limited income customers and 14% were in rentals.
EWEB Energy Efficiency Programs Energy Efficiency Incentives - Non-residential Q1 N/A $322,780 ENVIRONMENTAL: Energy Efficiency/Renewable Discretionary 40 non-residential customers.
EWEB Energy Efficiency Programs Energy Efficiency Incentives - Efficient Growth Q1 N/A $24,776 ENVIRONMENTAL: Energy Efficiency/Renewable Discretionary 9 residential and 2 commercial customers.
EWEB Energy Efficiency Programs Transportation Electrification Q1 N/A $17,672 ENVIRONMENTAL: Energy Efficiency/Renewable Discretionary 31 residential and 1 commercial customers received rebates for Level 2 EV Chargers.
EWEB Greenpower Program Solar Electric Incentives Q1 N/A $36,375 ENVIRONMENTAL: Greenpower Customer Voluntary22 residential net-metered projects were completed. 17 received Greenpower-funded incentives, and 5 did not qualify. 1 commercial direct generation project was completed (City of Eugene).
EWEB Water Conservation Programs Hand Valve and Toilet Rebates, Septic Maintenance Incentives Q1 N/A $17,775 ENVIRONMENTAL: Water Quality/Reliability Discretionary35 residential hand valve rebates, 49 toilet rebates, and 43 septic pumping rebates (25 of the septic rebates were payments for the Q4 2020 $300 promotion).
$819,769
$1,372,893
EWEB Customer Care Program Limited Income Energy Assistance Q2 N/A $349,696 PEOPLE: Safety Net Board Directed
EWEB provided Customer Care (ECC) bill assistance to 1,041 customers in Q2 and increased assistance to $280 retroactive to January 1, for a total of $326,400. Energy Share contributed $23,296 to 132 customers. EWEB credited federal LIHEAP funds to 666 customers, and federal funds distributed through COE and Lane County to 26 customers. Total does not include federal funds.
EWEB Limited Income Assistance Electric Line Repair Grants (Income eligible) Q2 N/A $2,929 PEOPLE: Safety Net Discretionary 3 electric repair grants.
EWEB Water Conservation Programs Water Line Repair Grants (Income eligible) Q2 N/A $7,090 ENVIRONMENTAL: Water Quality/Reliability Discretionary 2 water leak repair grants.
$359,715
EWEB Customer Care Program Limited Income Energy Assistance Q1 N/A $522,886 PEOPLE: Safety Net Board DirectedEWEB Customer Care (ECC) credited $485,940 to 1,869 customers. Energy Share contributed $36,946 to 208 customers. EWEB credited federal LIHEAP funds to 1309 customers, and federal funds distributed through COE and Lane County to 74 customers. Total does not include federal funds.
EWEB Limited Income Assistance Electric Line Repair Grants (Income eligible) Q1 N/A $1,128 PEOPLE: Safety Net Discretionary 3 electric repair grants.
EWEB Water Conservation Programs Water Line Repair Grants (Income eligible) Q1 N/A $165 ENVIRONMENTAL: Water Quality/Reliability Discretionary 1 water leak repair grant.
$524,179
$883,894
EWEB Energy Efficiency Programs Energy Efficiency Loans - Residential Q2 N/A $380,312 ENVIRONMENTAL: Energy Efficiency/Renewable Discretionary 64 residential energy efficiency loans.
EWEB Water Conservation Programs Water Line Repair & Septic Repair/Replacement Loans Q2 N/A $14,061 ENVIRONMENTAL: Water Quality/Reliability Discretionary 4 residential water line repair loans.
EWEB Resiliency Program Generator Loan Program Q2 N/A $11,231 PEOPLE: Emergency Preparedness Discretionary 3 residential generator loans.
EWEB Electric Service Line Upgrade Loan Program Electric Service Line Upgrade Loan Program Q2 N/A $9,018 PEOPLE: Safety Net Discretionary 2 residential electric service upgrade loan.
$414,622
EWEB Energy Efficiency Programs Energy Efficiency Loans - Residential Q1 N/A $393,391 ENVIRONMENTAL: Energy Efficiency/Renewable Discretionary 71 residential energy efficiency loans.
EWEB Water Conservation Programs Water Line Repair & Septic Repair/Replacement Loans Q1 N/A $40,099 ENVIRONMENTAL: Water Quality/Reliability Discretionary 12 residential water line repair loans.
EWEB Resiliency Program Generator Loan Program Q1 N/A $8,551 PEOPLE: Emergency Preparedness Discretionary 3 residential generator loans.
EWEB Electric Service Line Upgrade Loan Program Electric Service Line Upgrade Loan Program Q1 N/A $2,445 PEOPLE: Safety Net Discretionary 1 residential electric service upgrade loan.
$444,486
$859,108
ENERGY AND WATER LOANS
Q2
Customer Solutions Products and Services
ENERGY EFFICIENCY INCENTIVES
Q1 SUBTOTAL
Q1
Q2
Q2 SUBTOTAL
ENERGY EFFICIENCY INCENTIVES YTD TOTAL
LIMITED INCOME ASSISTANCE YTD TOTAL
ENERGY AND WATER LOANS YTD TOTAL
Q2 SUBTOTAL
Q1
Q1 SUBTOTAL
Q1 SUBTOTAL
Q1
LIMITED INCOME ASSISTANCE
Q2 SUBTOTAL
Q2
Page 2 of 4

EVENT/DESCRIPTION PAYMENT DATE EVENT DATE AMOUNT INVESTMENT AREA CATEGORY NOTES
Q2
$0
Homes for Good and Lane County The Nel Q1 N/A $6,829 PEOPLE: Safety Net Board DirectedHomes for Good and Lane County have partnered to build 45 units of supportive housing for people experiencing chronic homelessness. The Nel, at 1100 Charnelton St., qualified for a $6829 water SDC waiver (total development costs were about $14.5M).
11th and Lincoln, LLC (Private developer) The Lincoln Apartments Q1 N/A $6,831 PEOPLE: Safety Net Board DirectedThe Lincoln Apartments (11th and Lincoln) consist of 59 units of affordable housing. This project, to begin construction in October 2021, qualified for a $6831 water SDC waiver (like the project above, an existing 1.5” water meter will be replaced with a 2” meter, so the waiver is just for the increased capacity costs).
$13,660
$13,660
EVENT/DESCRIPTION PAYMENT DATE EVENT DATE AMOUNT INVESTMENT AREA CATEGORY NOTES
City of Eugene Contribution in lieu of taxes (CILT) Q2 N/A $2,872,108 Required Mandated
City of Springfield Contribution in lieu of taxes (CILT) Q2 N/A $113,091 Required Mandated
$2,985,198
City of Eugene Contribution in lieu of taxes (CILT) Q1 N/A $3,420,398 Required Mandated
City of Springfield Contribution in lieu of taxes (CILT) Q1 N/A $128,525 Required Mandated
$3,548,924
$6,534,122
EVENT/DESCRIPTION PAYMENT DATE EVENT DATE AMOUNT INVESTMENT AREA CATEGORY NOTES
Q2 Eugene YMCA Camp Dogwood Electric Generation Presentation N/A 07/08/21 N/A ENVIRONMENTAL: Energy Efficiency/Renewable Discretionary
EWEB Communications staff delivered a 30-minute presentation to a group of 25 kids (ages 8-10) about EWEB, where their water and electricity comes from, how electricity is generated, and how solar power works. The presentation was made kid-friendly through the use of a few solar powered toys and an activity simulating a turbine and electromagnetism generation.
Eugene Area/Springfield Chamber of Commerce Greeters Breakfast N/A 05/17/21 N/A ENVIRONMENTAL: Energy Efficiency/Renewable DiscretionaryEWEB Communications staff spoke briefly at the Greeters Breakfast providing information on EWEB's commercial energy programs to approximately 150 participants and provided a nominal sponsorship, door prize and EWEB branded items.
CERT Northwest (Community Emergency Response Team) Pledge to Prepare N/A 03/13/21 N/A PEOPLE: Emergency Preparedness Discretionary
Consulate of Mexico in Portland > Mexican Mobile Consulate in Eugene
Assistance obtaining legal documents N/A 02/20-02/21 N/A PEOPLE: Safety Net Discretionary
Based on feedback from the community, the agency requested EWEB’s participation. EWEB provided Spanish language materials offering guidance on accessing our limited income bill assistance program. EWEB also provided general information regarding weatherization programs available to customers including weatherization grants for qualifying households.
Locals Helping Locals Holiday Farm Fire event N/A 02/05-02/06 N/A PEOPLE: Safety Net N/AEWEB staffed an information table at this event held at McKenzie High School to answer questions and provide information about what EWEB is continuing to do to help customers affected by the Holiday Farm Fire. Staff was able to connect with and support local upriver organizers.
EVENT/DESCRIPTION PAYMENT DATE EVENT DATE AMOUNT INVESTMENT AREA CATEGORY NOTES
Q2 McKenzie Watershed Council Annual McKenzie River Clean-Up N/A 06/26/20 N/A ENVIRONMENTAL: Water Quality/Reliability Discretionary5 employee volunteers plus their family members picked up trash in five areas around Leaburg Dam for the annual event.
Q1 No events in Q1
No SDC waivers in Q2
AGENCY
EWEB Ambassadors provided over 42 hours of services to the Community YTD
Q1
Q2
AGENCYSystem Development Charge (SDC) Waivers
Q1
CILT YTD TOTAL
Q1
Contributions in Lieu of Taxes (CILT)
Q1 SUBTOTAL
AGENCY
Q2 SUBTOTAL
SDC WAIVERS YTD TOTAL
Volunteer Efforts and Events (Unpaid)AGENCY
EWEB employees, friends and families have volunteered 10 hours YTD
EWEB Ambassador Efforts and Events (Paid)
Q1 SUBTOTAL
Q1 SUBTOTAL
Page 3 of 4

EVENT/DESCRIPTION PAYMENT DATE EVENT DATE AMOUNT INVESTMENT AREA CATEGORY NOTES
Donation of downed trees N/A TBD N/A ENVIRONMENTAL: Water Quality/Reliability DiscretionaryDowned trees from the E. 40th Water Storage project are being donated to a City of Eugene wetlands restoration project, where they will continue to provide habitat long into the future.
Donation of downed trees N/A TBD N/A ENVIRONMENTAL: Water Quality/Reliability DiscretionaryDowned trees from the E. 40th Water Storage project are being donated in the SE neighborhood and also to City of Springfield for public use projects.
2021 Greenpower grant winner - will receive up to $50,000 TBD N/A Up to $50k ENVIRONMENTAL: Greenpower Customer Voluntary
The Eugene Mission plans to use the grant to install a solar energy system for a new Learning Center on its campus to assist unhoused families and community members. The organization is in the process of renovating one of the 12 buildings on its 7.5-acre campus to create the Learning Center. The Learning Center will include a culinary training kitchen, meeting and classroom spaces, a computer lab and a therapeutic day use area for the growing population of homeless families.
2021 Greenpower grant winner - will receive up to $50,000 TBD N/A Up to $50k ENVIRONMENTAL: Greenpower Customer Voluntary
This year marks the second award for Friends of Trees, which won a grant in 2018 to fund a large-scale volunteer tree planting event in west Eugene. The 2021 grant will be used for another tree planting effort with a focus on urban areas and communities historically excluded from the benefits of green space. The project will also include engaging volunteers in the stewardship of trees to promote more sustainable neighborhoods and urban habitat areas.
Surplus House Donation Q3 Q3 $115,000 PEOPLE: Safety Net Discretionary
In Nov 2020, EWEB purchased property along the Leaburg Canal for dam safety and canal repair access purposes, which included a manufactured home. Rather than renting and maintaining the home, it was decided that EWEB would donate the home to a family in need impacted by the Holiday Farm Fire. EWEB contacted Lane County who worked with DEV Northwest, a low-income housing agency, to identify a recipient family and manage the logistics and costs for relocation of the home. The recipient family, who lost their home and business to the fire, attended the June 15 Upriver board presentation to express their appreciation. We expect the transfer to occur at the end of August. RLID real market value of the house is $115,000.
Co-Sponsorship of Comfort Station Water Booth N/A 07/21-07/25 $0 ENVIRONMENTAL: Water Quality/Reliability DiscretionaryThe annual Booth Fee was carried over from last year's event since the fair was cancelled in 2020 due to the pandemic. EWEB will provide the use of a drinking water fountain w/chiller for the event, as well as, Ambassador staffing for shifts throughout the duration of the fair.
Up to $215k
SE Eugene, City of Springfield
Lane County and DEV Northwest
Friends of Trees - Eugene Metro
The Eugene Mission
City of Eugene
AGENCY
UPCOMING AND/OR COMMITTED SPONSORSHIPS, DONATIONS, GRANTS TOTAL
Upcoming and/or committed Sponsorships, Donations, Grants
Lane County Fair
Page 4 of 4

Electric Division Metrics Scorecard
KeyMeeting target Not meeting targetNot reported
Dept Category Metric Q1Final
Q2Final
Q3Final
Q4Final
Explanation for Not Meeting Target
Substation Customer Reponse Time: Complete 39 NERC battery testing in Q1 Work Queue: Complete 12 Power Transformers Maintenance Turn Around: Complete all ECR's in 30 days
Relay Customer Reponse Time: Test 86 NERC Devices annually Competing Emergent Work
Work Queue: Test 331 non-NERC Devices annually Competing Emergent Work
Turn Around: Complete All ECR's in 30 days - (internal customer)
Transformer Customer Reponse Time: Stage crew material within 24 hours of request Work Queue: Prepare all Scrap Material Quarterly Turn Around: Complete Live line tool testing within 3 days
Line Customer Reponses Time: Customer driven project "wait time" less than 3 weeksCustomer Reponse Time: Line crew emergent call out less than 30 minutesWork Queue: Backlog of "form 3" work less than 8 jobsWork Queue: Preventative Maintenance for Network completion Work Queue: Preventative Maintenance for Switch inspections Work Queue: Identified NESC feeders repaired per 2021 schedule Competing Emergent Work
Meter Customer Reponse Time: Customer bills accuracyWork Queue: 40 Site Visits & PUC audits Staffing Limitations
Work Queue: 10% Meter Testing (SPh) Staffing Limitations
Work Queue: 100% Meter Testing (3Ph)Work Queue: 100% Meter Testing Refurbished Staffing Limitations
Work Queue: 100% Tamper ChecksWork Queue: 10 CT Sites per month Staffing Limitations
Work Queue: 100% Investigating zero consumptionWork Queue: 100% Recheck New installed CT jobs
Vegetation Management Customer Reponse Time: Back log for plan less than 8 weeks Staffing Limitations
Work Queue: Vegetaion plan greater than 23 miles per month Staffing Limitations
Turn Around: Customer Tags response less than 48 hours Staffing Limitations
Landscape Customer Reponse Time: Incoming Jobs - 15-20 per quadrant within 5 daysWork Queue: Cycles of Daily work finish all stops in quadrant each monthTurn Around: Customer Jobs within 3 days
Dispatch Customer Reponse Time: Processing switching orders less than 3 daysWork Queue: Posting 100% of completed switching orders to Outlook calendar Turn Around: Time between receiving a Hold Order and processing Hold less than 15 minutes
Coordinators Customer Reponse Time: Service Request pending approval to active within 10 minutesTurn Around: Taking action on Service Requests from other depts less than 2 days
Troubleshooters Customer Reponse Time: First Responder Emergent Call out response within 10 minutesTurn Around: 100% completion of items scheduled
Service Crew Customer Reponse Time: After hours response completed within the same dayTurn Around: 100% completion of items scheduled
Systems Engineering Customer Reponse Time: System Event Response by next business day Staffing Limitations
Work Queue: No Engineering Change Requests greater than 1 year Staffing Limitations
Turn Around: System Event Root Cause Analysis less than 30 days Staffing Limitations
Distribution Engineering Customer Reponse Time: 90% of Customer Inquiries response within 24 business hoursWork Queue: Customer (Internal/External) Design Requests assigned within 3 weeks Competing Emergent Work
Turn Around: 90% of High Level Estimates provided within 3 business days Competing Emergent Work
NERC Compliance Customer Reponse Time: Completed Compliance Deadlines Work Queue: Complete 2 Compliant department Spot Checks monthly Competing Emergent WorkTurn Around: Train 50 empoloyees per year Competing Emergent Work
0.00
0.10
0.20
0.30
0.40
0.50
0.60
0.70
Jan Feb Mar Apr May Jun Jul Aug Sep Oct Nov Dec
Cumulative 2021 SAIFI
5 Year Average Range SAIFI
0
10
20
30
40
50
60
70
Jan Feb Mar Apr May Jun Jul Aug Sep Oct Nov Dec
Cumulative 2021 SAIDI
5 Year Average Range SAIDI
0
10
20
30
40
50
60
70
Jan Feb Mar Apr May Jun Jul Aug Sep Oct Nov Dec
Electric Safety Metrics
GCNMCC Monthly 3-yr Avg. OSHA Recordables3-yr Avg. Total Injuries 2021 OSHA Recordables2021 Total Injuries GCNMCC Cumulative
51739950
$-
$10,000,000
$20,000,000
$30,000,000
$40,000,000
$50,000,000
$60,000,000
Jan Feb Mar Apr May Jun Jul Aug Sep Oct Nov Dec
Electric Capital Spending
Budget Projection Acutal
APPENDIX H

APPENDIX I
Water Division Details The Water Operations Division uses the Multiple Barrier Approach to Safe Drinking Water, an integrated system of procedures, processes and tools that collectively prevent or reduce the contamination of drinking water from source to tap. The purpose of this approach is to provide safe, reliable drinking water to customers 24/7/365 and to reduce the operational risks to public health while being good stewards of our customer/owner’s infrastructure and funding resources. For more information: HTTP://WWW.EWEB.ORG/OUTAGES-AND-SAFETY/WATER-SAFETY-IN-YOUR-HOME-OR-BUSINESS/DRINKING-WATER-QUALITY Drinking Water Source Protection The purpose of the Source Water Protection Program is to minimize adverse impacts on the source of our community’s drinking water. Specifically, the program aims to 1) identify and understand the threats to our drinking water through watershed monitoring and 2) reduce the risk of pathogens and pollutants entering the treatment plant through source water protection to ultimately manage or reduce the degree of treatment required.
Robust Water Treatment McKenzie River water is treated to drinking water standards using conventional treatment trains that include redundancy to protect from treatment failures. The treatment process is closely monitored and constantly adjusted to ensure production of safe drinking water prior to delivery to customers. Production Production levels for the second quarter were above the 5-year average.

APPENDIX I Secure Water Supply Network Once the water is adequately treated, the quality must be maintained as it is delivered to EWEB customers. Replacing aging infrastructure, repairing leaks, flushing, maintaining a disinfectant residual and positive pressure, and protecting against cross-connections are critical aspects of the program to ensure water quality, reliability, and adequate fire flow. Water Quality Monitoring Monitoring the quality of our raw, treated, and distributed drinking water is essential to ensuring safe water for EWEB’s customer/owners. Monitoring data gives water operations staff the ability to adjust treatment and system operation to safeguard quality for human consumption. We track customer complaints as another means to evaluate long-term water quality trends in the distribution system. Emergency Preparedness Natural hazard and security response mitigation plans along with resiliency plans are a final barrier in place to protect the public if harmful contaminants should make it through the other water system barriers (source water protection, water treatment, water supply system reliability, and water quality monitoring). Refer also to Emergency Water Supply in the Water Utility Capital Spending Summary and Project Updates.

Q2 2021 Workforce Composition The following charts are demographic snapshots of EWEB’s workforce composition as compared to that of the State of Oregon and Lane County, as reported by the US Census Bureau in Q2 of 2021, the most recent quarter for which they have data.
87%
13%
90%
10%
83%
15%
0%
20%
40%
60%
80%
100%
Non-Minority Minority
Workforce Composition: All Sectors
Oregon Lane County EWEB Q2 2021
92%
8%
83%
15%
0%
20%
40%
60%
80%
100%
Non-Minority Minority
Workforce Composition: Utility Sector
Oregon EWEB
53%
99%
68%
51% 49%47%
1%
32%
49% 51%
0%
10%
20%
30%
40%
50%
60%
70%
80%
90%
100%
MAPT IBEW EWEB Oregon Lane County
Gender Distribution
Male Female
43%
67%72%
57%
33%28%
0%
10%
20%
30%
40%
50%
60%
70%
80%
Executive Manager Supervisor
Women in EWEB Leadership
Male Female
APPENDIX J

2021-Q2 Fleet Services Sustainability Progress Report
Fleet Services continues to use low CI alternative fuels approved through Oregon’s Clean Fuels Program in the fleet operation.
• By choosing to use low CI fuels in place of fossil-based unleaded and diesel fuels, our exposer toGHG emissions decreased 36.9% under our 2009 baselines.
• By blending higher percentages of Ethanol and Renewable Diesel, we have been able toeffectively reduce the fossil-based fuels used by EWEB’s vehicles and equipment by 63.2%.
• The cost difference (YTD) to use low CI alternative fuels averaged 2.9% more than conventionalfossil-based fuels through Q2. This equivalates to the current cost of $15.37 to reduce one (1)metric/ton of CO² emissions.
APPENDIX K