strategic analysis for a financial management system...
TRANSCRIPT

STRATEGIC ANALYSIS FOR A FINANCIAL MANAGEMENT SYSTEM
DECISION
by
Lloyd Bauer
PROJECT SUBMITTED IN PARTIAL FULFILLMENT OF
THE REQUIREMENTS FOR THE DEGREE OF
MASTER OF BUSINESS ADMINISTRATION
In the Executive MBA Program
of the
Faculty
of
Business Administration
© Lloyd Bauer, 2011
SIMON FRASER UNIVERSITY
Term Spring 2011
All rights reserved. However, in accordance with the Copyright Act of Canada, this work
may be reproduced, without authorization, under the conditions for Fair Dealing.
Therefore, limited reproduction of this work for the purposes of private study, research, criticism, review and news reporting is likely to be in accordance with the law,
particularly if cited appropriately.

ii
Approval
Name: Lloyd Bauer
Degree: Master of Business Administration
Title of Project: Strategic Analysis For A Financial Management System
Decision.
Supervisory Committee:
___________________________________________
Dr. Blaize Horner Reich
Senior Supervisor RBC Professor of Technology and Innovation
Segal Graduate School of Business
___________________________________________
Mark Moore
Senior Lecturer
Segal Graduate School of Business
Date Approved: ___________________________________________

iii
Abstract
A core-operating requirement of any company is that of effective and efficient
financial management. This analysis paper focuses on financial management within a
specific company. It attempts to answer the question of ―Should we replace the financial
system, and if so what approach should be taken to replace it?‖
The document analyzes the current company challenges and opportunities, the
external vendor market, evaluates options and alternatives, and concludes with a
recommendation related to financial management at the company.
The challenges identified are primarily symptoms resulting from structural set-up
of the finance software, inconsistent business rules, multiple independent financial tools,
and the lack of required functionality present within the current financial software. Using
qualitative and quantitative evaluation the recommendation is to standardize the financial
business rules and practices across the company, and to replace the underlying
procurement and financial software with a current generation product.

iv
Executive Summary
This project provides a detailed analysis of the financial management system of a
specific company. The objective of the analysis was to present a strategic
recommendation in answer to the question ―Should we replace the financial system, and
if so what approach should be taken to replace it?‖
The document begins by analyzing the internal company challenges, opportunities
and potential benefits related to financial management. It then proceeds to identify
potential solution options, define evaluation criteria, and evaluate the potential solution
options. This is followed by a scan of the external financial software industry. The
report concludes with a recommendation and associated timeline.
Internal Analysis
The first step in conducting internal analysis of financial management is to define
what financial management means. Financial management generally refers to the areas
of resource management and finance operations. It is a subset of the broader term of
operational management. Operational management encapsulates the following business
functions:
Financial Accounting
Human Resources
Manufacturing
Supply Chain Management
v
Project Management
Customer Relationship Management
For this project, the primary focus was on the financial accounting, supply chain
and project management functions. The company is structured as three separate
organizations that have responsibility for the vast majority of the company‘s overall
financial management. The three organizations include the Head Office, the Bus
Company, and the Rail Company. Two financial software systems support the three
organizations. After interviewing the senior financial management of the company, five
key pain points and opportunities emerged.
1. Financial Analysis and Reporting – Substantial challenges exist in providing
financial analysis and reporting. Opportunities to provide self serve reporting for
department managers and the simplification of reporting would improve decision
making for the organization.
2. Multiple Non-Integrated Systems – Operating with multiple systems revealed
consolidation and data entry duplication challenges that were labour intensive and
prone to entry errors. For procurement, the lack of cross organization visibility
made it difficult to maximize supplier contracts and to manage vendor
performance. Improving the integration of systems would result in improved
productivity of Managers, and Financial department staff.
3. Manual Work Processes and Work-Arounds – Many of the finance work
processes were labour intensive manual paper processes. The structure and
complexity of the finance software had a side effect of promoting extensive data

vi
extracts to accomplish work outside of the core software tool. Opportunities exist
to streamline the supply chain process, and automate work processes.
4. System Structure – The original configuration and setup of the financial software
does not meet the needs of a multi-company structure. Examples include
different company chart of accounts, inter-company transactions, and cost centre
hierarchies.
5. Legacy Tool – The financial products are legacy software products that are no
longer receiving functional upgrades by the vendors. The main financial product
used by the Head Office and the Bus Company is difficult to train and use. There
is a longer-term risk that the product will cease to have vendor support.
The potential tangible benefits identified total $4.9 million annually. This benefit
is associated with the core accounting system as well as the procurement function. The
majority of the benefits relate to improvements in the procurement function, which
accounts for approximately 80% of the total tangible benefit.
Options Analysis
Five solution options were identified to address the problems and opportunities.
The first was to patch or modify the current system to address the structural issues having
the most impact. This option would be the simplest and least costly, but it would solve
only a small amount of the pain points and opportunities identified.
The second option was to extend the financial system to all three companies. This
would place a single financial system into the organization and would solve many of the
key consolidation issues.

vii
The third option was to replace the financial accounting system. This solution
would address the structural deficiencies and implement a proven solution for the
financial challenges, but would not address the majority of benefit residing in the
procurement area.
The fourth option would implement a new procurement and financial accounting
solution using a phased approach. The procurement solution, having the greatest benefit
potential, would be implemented in year one. The financial accounting function would
continue to operate using the current software for the next three years at which point it
would be replaced also.
The fifth and final option was to implement a leading industry software solution
to address both the financial accounting and procurement functions. This would provide
early benefits for the company in both accounting and procurement, but would also be the
highest cost and risk option.
Each of the five options were evaluated based upon the criteria of how well they
met the business need, how well they addressed the technical and project risks, the impact
on business practices and resources, and the strength of the cost/benefit. Applying
weighted scoring resulted in the highest score for the fourth option, to implement a
leading industry software solution to address both the procurement and financial
accounting functions.
External Market Analysis – Financial Software Industry
Financial management solutions are a subset of the larger enterprise resource
planning (ERP) software market. The ERP market has evolved into three product tiers

viii
based on the relative size of the customer company. The first tier is represented by very
large companies, generally having revenues over $1 billion annually and over 1,000
employees. The second tier is represented by mid-sized software vendor solutions
targeting mid to large sized companies. Customers in this tier have revenues in the range
of $50 million to $1 billion annually, and 100-999 employees. The third tier is
represented by software vendors that cater to the small business market, or those that are
very industry specific.
Mapping the software industry tiers to the organization being analyzed places the
organization in the second tier. This indicates potential software solutions to be those
suited for the mid-sized, second tier market.
Recommendation
In conclusion, the answer to the question ―Should we replace the financial
system?‖ became clear. Yes, the financial system should be replaced, and the best
approach would be Option 4. The Option 4 solution replaces the current financial system
with a combined procurement and finance accounting solution using a phased approach.
Phase 1 would implement the procurement solution, followed by Phase 2 to implement
the financial accounting solution. The solution would replace the procurement and
finance accounting systems currently in operation at the Head Office, Bus Company, and
Rail Company, with one enterprise wide system.
The total cost of the solution is estimated to be $4.7 million, with annual benefits
of $4.9 million. Applying industry indicators of implementation and support costs
revealed a potential internal rate of return of 240%.

ix
The next step would be to determine the specific software vendor solution. This
requires in-depth requirements analysis and the submission of formal vendor proposals.
The recommended next steps for Phase 1 would be to:
Gather detailed requirements, specifications, and project scope.
Issue a Request for Proposals to obtain quotations for the implementation
of a Procurement solution.
Conduct a Gap Analysis and evaluation of the proposals.
Define detailed business rules, processes and future state model.
Design, test and implement Procurement solution.
The project timeline for phase 1 to implement the procurement solution is
completion in a period of 26 months. The project includes a second phase to implement
the financial accounting solution in year 3, with full benefits beginning in year 4. The
second phase would follow the same steps as the procurement solution phase, this time
selecting and implementing a financial accounting system.
These steps will take the organization to a successful implementation of the
required changes to achieve the expected business objectives and maximum benefits.

x
Dedication
To my wife Sandy, without whose untiring support I could not have reached this
milestone!
To my daughter Lindsay and sons Cameron & Austin, thank you for your support and
understanding as Dad spent long hours studying and writing!
xi
Acknowledgements
Thank you to my friends and family as I disappeared for a while during this educational
journey.
Thank you to the SFU Professors, staff, and classmates for an excellent learning
experience.
Thank you to my employer for all their support and encouragement.
Thank you to Team Q – Lara, Ernest, Scott and Yashar. We had a great time, I‘ll carry
some excellent memories of our time together!
xii
Table of Contents
Approval .................................................................................................................................... ii
Abstract .................................................................................................................................... iii
Executive Summary ................................................................................................................. iv
Dedication .................................................................................................................................. x
Acknowledgements ................................................................................................................... xi
Table of Contents .................................................................................................................... xii
List of Figures......................................................................................................................... xiv
List of Tables ........................................................................................................................... xv
Glossary .................................................................................................................................. xvi
1: Introduction .......................................................................................................................... 1
2: Internal Analysis ................................................................................................................... 2
2.1 Financial Management Business Area Definition ................................................................ 2
2.2 Company and Financial System Area – Current State ......................................................... 3
2.3 Problems and Opportunities ................................................................................................ 4
2.3.1 Chief Financial Officer - Head Office .................................................................... 4 2.3.2 Accounting – Head Office ...................................................................................... 7 2.3.3 Procurement – Head Office, Bus Company, and Rail Company ............................ 11 2.3.4 Finance Function – Bus Company ........................................................................ 16 2.3.5 Finance Function – Rail Company ....................................................................... 18 2.3.6 Technical Support of the Financial Systems ......................................................... 21 2.3.7 Financial Software ............................................................................................... 23 2.3.8 Overall Finance Volumes ..................................................................................... 25 2.3.9 Summary of Pain Points and Opportunities .......................................................... 27
2.4 Tangible Benefits ............................................................................................................. 29
3: Options Analysis ................................................................................................................. 33
3.1 Solution Options............................................................................................................... 33
3.2 Evaluation Criteria ........................................................................................................... 36
3.3 Evaluation of Alternatives ................................................................................................ 37
3.3.1 Option 1: Modify Current Systems ....................................................................... 37 3.3.2 Option 2: Extend Current System to Rail Company .............................................. 40 3.3.3 Option 3: Replace System (Accounting Only) ...................................................... 43 3.3.4 Option 4: Replace System (Procurement First) ..................................................... 47 3.3.5 Option 5: Replace System In-house (ERP) ........................................................... 50

xiii
3.4 Evaluation of Alternatives - Summary .............................................................................. 52
3.4.1 Evaluation Summary ............................................................................................ 53 3.4.2 Cost / Benefit Sensitivity Analysis ....................................................................... 54
3.5 Corporate Social Responsibility ........................................................................................ 57
4: External Market Analysis – Finance Software Industry ................................................... 60
4.1 Industry Definition ........................................................................................................... 60
4.2 Market Segmentation........................................................................................................ 61
4.3 Competitor Overview of Financial Software Companies ................................................... 65
4.3.1 Oracle .................................................................................................................. 66 4.3.2 SAP ..................................................................................................................... 68 4.3.3 Epicor .................................................................................................................. 70 4.3.4 Infor Global Solutions .......................................................................................... 71 4.3.5 Lawson ................................................................................................................ 72 4.3.6 Sage ..................................................................................................................... 73 4.3.7 Microsoft Dynamics............................................................................................. 74 4.3.8 Unit 4 Business Software – previously Agresso .................................................... 75
4.4 Summary of Financial Software Companies...................................................................... 77
4.5 Software As A Service - Alternative ................................................................................. 78
5: Recommendation and Conclusion ...................................................................................... 79
Appendices .............................................................................................................................. 83
Appendix A – Custom Build Option .......................................................................................... 84
Appendix B: Option 1 - Cost/Benefit Assumptions ................................................................... 88
Appendix C: Option 2 - Cost/Benefit Assumptions ................................................................... 89
Appendix D: Option 3 - Cost/Benefit Assumptions ................................................................... 90
Appendix E: Option 4 - Cost/Benefit Assumptions ................................................................... 91
Appendix F: Option 5 - Cost/Benefit Assumptions ................................................................... 92
Appendix G: Option 5 – Sensitivity Analysis of Cost Increase .................................................. 93
Appendix H: Option 5 – Sensitivity Analysis of Lower Benefits ............................................... 94
Bibliography ............................................................................................................................ 95
Works Cited .............................................................................................................................. 95
Interviews ................................................................................................................................. 96
Websites Reviewed ................................................................................................................... 97
_______________________________________________........................................................ 98

xiv
List of Figures
Figure 2-1 Financial Systems within the Organization .............................................................. 25
Figure 2-2 Benefit Areas .......................................................................................................... 31
Figure 3-1 Solution Options ..................................................................................................... 33
Figure 3-2 Internal Rate of Return of Options ........................................................................... 53
Figure 4-1 ERP Functional Areas ............................................................................................. 61
Figure 4-2 Forrester ERP Market Share .................................................................................... 62
Figure 4-3 Strategic ERP Product Tiers .................................................................................... 64
Figure 4-4 Gartner Magic Quadrant for Mid-Market ERP Companies ....................................... 65
Figure 5-1 Implementation Timeline – Procurement Phase 1 .................................................... 80
Figure 5-2 Overall Project Phase Timeline ................................................................................ 81
xv
List of Tables
Table 2-1 Common Administrative Functional Areas ................................................................. 2
Table 2-2 ERP Functions ............................................................................................................ 5
Table 2-3 Procurement Transaction Volume ............................................................................. 13
Table 2-4 Procurement Staffing Levels ..................................................................................... 14
Table 2-5 Invoice Transaction Volumes ................................................................................... 26
Table 2-6 Payment Transaction Volumes.................................................................................. 26
Table 2-7 Financial System Users............................................................................................. 27
Table 2-8 Productivity Savings ................................................................................................. 30
Table 2-9 Summary of Benefits ................................................................................................ 32
Table 3-1 Option 1: Modify Current Systems ........................................................................... 38
Table 3-2 Cost/Benefit for Option 1.......................................................................................... 40
Table 3-3 Option 2: Extend Current System to Rail Company .................................................. 41
Table 3-4 Cost Benefit for Option 2 .......................................................................................... 43
Table 3-5 Option 3: Replace System (Accounting Only) ........................................................... 44
Table 3-6 Cost Benefit for Option 3 .......................................................................................... 46
Table 3-7 Option 4: Replace System (Procurement First) .......................................................... 47
Table 3-8 Cost Benefit for Option 4 .......................................................................................... 49
Table 3-9 Option 5: Replace System In-house (ERP) ................................................................ 50
Table 3-10 Cost Benefit for Option 5 ........................................................................................ 52
Table 3-11 Option Scoring Summary ....................................................................................... 54
Table 3-12 IRR Calculations .................................................................................................... 55
Table 3-13 Sensitivity Analysis - Business Viability 50% ......................................................... 56
Table 5-1 Option: Custom Build a New System (Financial) ...................................................... 85
Table 5-2 Cost Benefit for Option ............................................................................................ 87

xvi
Glossary
COTS Commercial Off The Shelf - commercially available products generally sold in volume
EDI Electronic Data Interchange – structured data used to transmit data between computer
systems
ERP Enterprise Resource Planning - computer software used to manage business resources, information and functions
FTE Full Time Equivalent – Equivalent to the work time of one full time employee
G/L General Ledger – main accounting record of a business
IRR Internal Rate of Return – rate of return calculation to measure the profitability of an investment
KPI Key Performance Indicator – key performance measures of a business
SaaS Software as a Service - computer system software operated by third party companies using secure access over the Internet.
SCM Supply Chain Management – business processes involved in producing products or
services for end customers
XML Extensible Markup Language – data format for encoding documents

1
1: Introduction
The company analyzed is the regional transport authority, with responsibility for
both the Bus Company, and the Rail Company that provide services to the region. A key
component of the business is the financial management of the company. The
organizations financial goals are to optimize current revenue streams, reduce costs, and to
develop new sustainable funding sources to meet long-term goals. The current finance
Enterprise Resource Planning (ERP) solution is nearing the end of its product life cycle
and is challenged in meeting the needs of the organization. This analysis paper focuses
on answering the question of ―Should we replace the financial system, and if so what
approach should be taken to replace it?‖
To answer this question I will analyze the current company challenges and
opportunities, the external vendor and customer market, evaluate options and alternatives,
and conclude with a recommendation related to financial management at the company.
2
2: Internal Analysis
In this section, I will begin by defining the business area of financial
management. I will then be providing company background, an overview of the financial
management area, and a detailed analysis of the pain points and opportunities within the
company.
2.1 Financial Management Business Area Definition
In looking at the financial management challenges of the company, it is important
to define the scope of what we mean by financial management. Financial management is
a subset of the broad common administrative functions of a company. This includes
business processes and systems to administer the functions of finance, accounting, human
resources, manufacturing, supply chain management, project management and customer
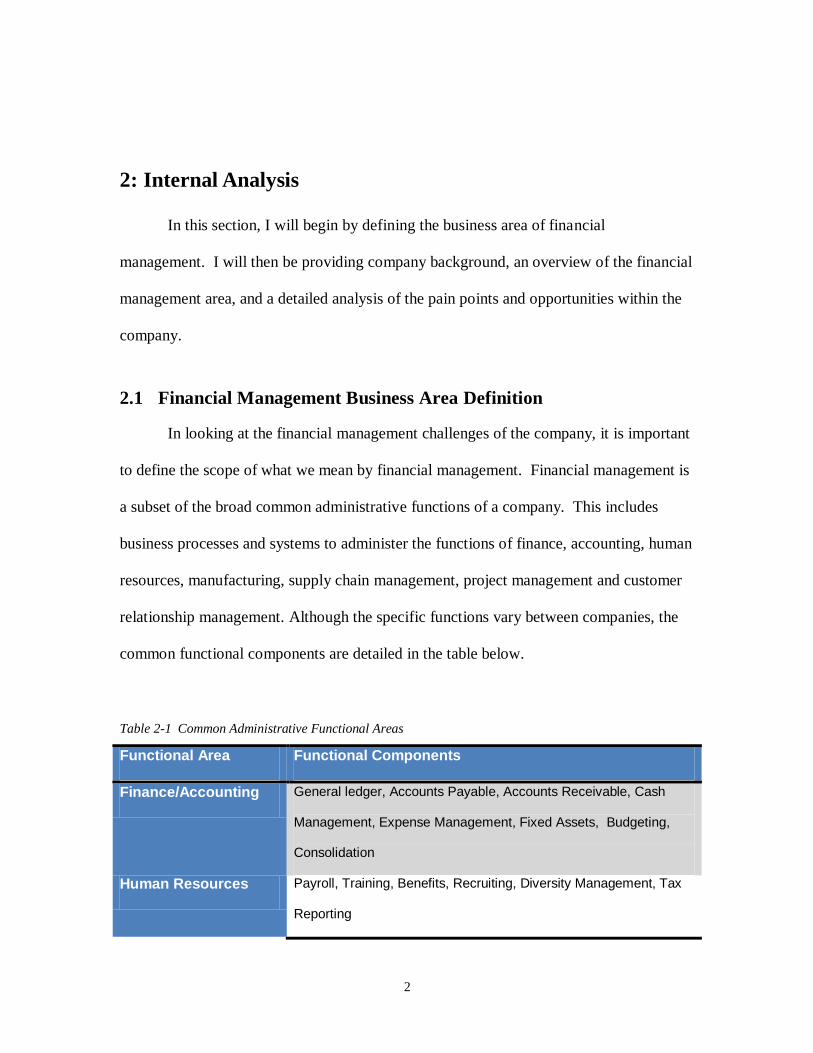
relationship management. Although the specific functions vary between companies, the
common functional components are detailed in the table below.
Table 2-1 Common Administrative Functional Areas
Functional Area Functional Components
Finance/Accounting General ledger, Accounts Payable, Accounts Receivable, Cash
Management, Expense Management, Fixed Assets, Budgeting,
Consolidation
Human Resources Payroll, Training, Benefits, Recruiting, Diversity Management, Tax
Reporting
3
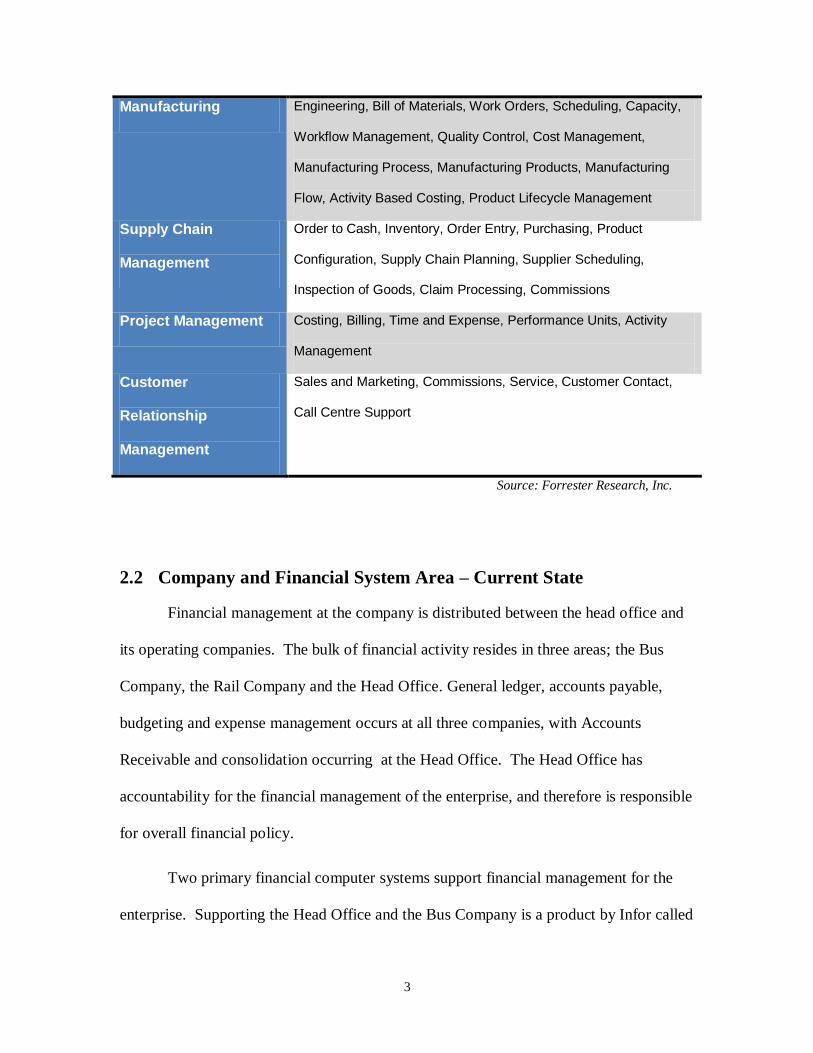
Manufacturing Engineering, Bill of Materials, Work Orders, Scheduling, Capacity,
Workflow Management, Quality Control, Cost Management,
Manufacturing Process, Manufacturing Products, Manufacturing
Flow, Activity Based Costing, Product Lifecycle Management
Supply Chain
Management
Order to Cash, Inventory, Order Entry, Purchasing, Product
Configuration, Supply Chain Planning, Supplier Scheduling,
Inspection of Goods, Claim Processing, Commissions
Project Management Costing, Billing, Time and Expense, Performance Units, Activity
Management
Customer
Relationship
Management
Sales and Marketing, Commissions, Service, Customer Contact,
Call Centre Support
Source: Forrester Research, Inc.
2.2 Company and Financial System Area – Current State
Financial management at the company is distributed between the head office and
its operating companies. The bulk of financial activity resides in three areas; the Bus
Company, the Rail Company and the Head Office. General ledger, accounts payable,
budgeting and expense management occurs at all three companies, with Accounts
Receivable and consolidation occurring at the Head Office. The Head Office has
accountability for the financial management of the enterprise, and therefore is responsible
for overall financial policy.
Two primary financial computer systems support financial management for the
enterprise. Supporting the Head Office and the Bus Company is a product by Infor called

4
SmartStream. Both the Head Office and the Bus Company run on the same instance of
SmartStream. The system is not configured to be multi-company. Management of the
two separate companies is accomplished by using two series of cost centre numbers for
reporting separation. Originally the same account codes were used by both companies,
but over time the account codes have diverged from each other.
Supporting the Rail Company is a core financial package using a purchased
product called SBT. Sage Group has since acquired SBT, the company. The system has
substantial custom integration with other business functions within the Rail Company.
The integration is built on FoxPro custom software.
Financial management is conducted at each operating company, with
consolidation happening at the Head Office level. The consolidation is largely a manual
effort due to the disparate systems and configuration.
2.3 Problems and Opportunities
In order to better understand the problems and opportunities that exist in the area
of financial management, a number of interviews were conducted. The interviews
captured information from the key financial management areas to determine what were
the pain points, and the potential benefits.
2.3.1 Chief Financial Officer - Head Office
In February 2011, an interview with the Chief Financial Officer was conducted.
The purpose of the interview was to determine the top level challenges and opportunities
for the company overall.
5
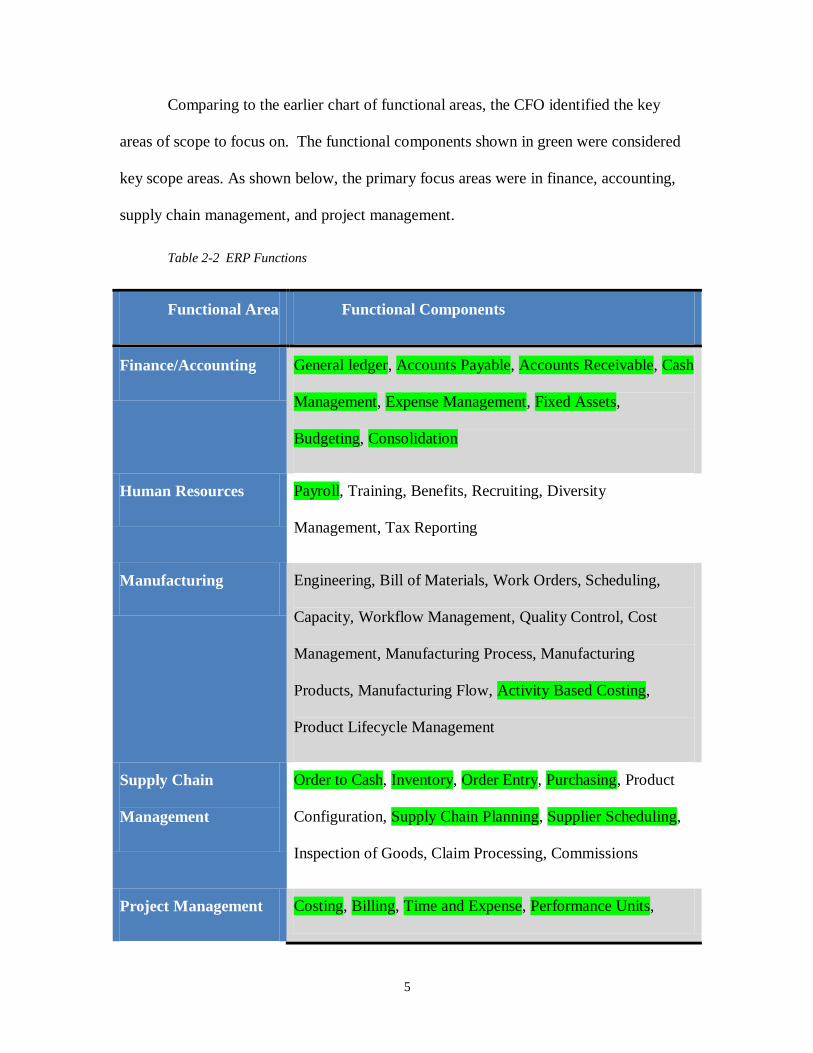
Comparing to the earlier chart of functional areas, the CFO identified the key
areas of scope to focus on. The functional components shown in green were considered
key scope areas. As shown below, the primary focus areas were in finance, accounting,
supply chain management, and project management.
Table 2-2 ERP Functions
Functional Area Functional Components
Finance/Accounting General ledger, Accounts Payable, Accounts Receivable, Cash
Management, Expense Management, Fixed Assets,
Budgeting, Consolidation
Human Resources Payroll, Training, Benefits, Recruiting, Diversity
Management, Tax Reporting
Manufacturing Engineering, Bill of Materials, Work Orders, Scheduling,
Capacity, Workflow Management, Quality Control, Cost
Management, Manufacturing Process, Manufacturing
Products, Manufacturing Flow, Activity Based Costing,
Product Lifecycle Management
Supply Chain
Management
Order to Cash, Inventory, Order Entry, Purchasing, Product
Configuration, Supply Chain Planning, Supplier Scheduling,
Inspection of Goods, Claim Processing, Commissions
Project Management Costing, Billing, Time and Expense, Performance Units,

6
Activity Management
Customer Relationship
Management
Sales and Marketing, Commissions, Service, Customer
Contact, Call Centre Support
Source: Forrester Research, Inc.
Challenges with the current Finance/ERP system are focused around the manual
business processes required to manage the finances of the company, the lack of seamless
integration, and the challenge in responding quickly to information needs.
Financial Analysis and Reporting - There is no easy way to recall financial or
activity information out of the system. Answering cost and volume questions like ―How
much did you spend on a particular service item?‖, is difficult and time consuming.
Lack of Seamless Integration - The financial system does not have any integrated
drill down capability, since the disparate financial systems supply summarized and self
contained information for consolidation.
Manual Work Processes - The Month End and Year End financial reporting
cycles are lengthy and labour intensive. No central supplier contract and receivables
view exposes the organization to potential supplier risk of defaulting on payments, or to
over reliance on the performance of a single supplier. Potential exists for streamlining
the supply chain process to improve the efficiency of business transactions with
suppliers. The primary supply chain variable cost elements within the bus company
division include labor, fuel and parts.

7
In considering new areas for innovation and opportunity, a new Finance/ERP
system could improve the readiness of the organization to provide quick, timely budget
forecasts. It would also enable improved decision-making ability related to unit and
activity based costing.
One question posed was whether financial management at the Head Office was a
generic back office solution or if it was important to consider solutions in the context of
the transportation industry. Indications from the CFO lean towards the Head Office
financial management being a generic back office function. No particular solution
appears to provide significant unique functionality related to the transportation industry.
2.3.2 Accounting – Head Office
At the Head Office, the accounting business function focuses on the general
ledger, accounts payable, accounts receivable, cash management, expense management,
fixed assets, and consolidation of accounts across the three companies. Discussions with
the manager of accounting revealed the following findings:
Reporting and Analysis - Conducting analysis and reporting within the current
software tool is very cumbersome. The tool also has limited reporting capability, in part
due to our setup. The combination of the two has resulted in the creation of workarounds
largely facilitated by capability built outside of the tool. The accountants have a need for
both regular and ad hoc reporting which they have found to be very difficult to
accomplish in the existing tool. Many small database extracts have spawned to
compensate for this limited reporting capability. In addition, SmartStream reporting
within the tool requires the assistance of IT Analysts. If a report is required, it is placed
in the reporting queue, and then ran during the overnight batch run. This results in

8
substantial business delays for any reporting that is time sensitive. With so many
reporting tools there can be inconsistencies in the data depending upon how the query is
setup.
Substantial opportunity exists to facilitate self-serve online reporting with drill
down capability for managers and financial administrators. This would reduce the
workload on the production of reports and the volume of basic questions coming into the
accounting business area. Accounting has recently used ―SpreadSheet Server‖, a
reporting tool, to help with the reporting. Although conceptually a good product, it is
prone to crashing.
To manage the large number of construction contracts, the functionality is not
adequate within the tool, and therefore is managed in a separate contracts database
administered in a Microsoft access database outside the system. This database contains
information on the companies, the size of the contract and information related to payment
schedules. Some information must then be manually entered back in the core financial
system resulting in work effort duplication and risk of data entry errors.
Business Workflow Routing – the business process for sign-offs, verification and
routing of financial transactions is accomplished outside of the tool. The tool for
facilitating workflow approvals based on signing authority has not been explored, and
therefore is completed as a largely manual paper process. This hinders timely approvals
and is difficult to locate where a specific approval item is at any point in time.
Opportunities exist to capture incoming invoices electronically, either through electronic
data interchange or optical character recognition to reduce manual data entry and improve
cycle times. Expense Report workflow is also substantially manual. Expense Reports

9
are entered on a spreadsheet, printed, routed through interoffice mail for approval, and
then sent to accounting to manually enter into the accounting system. For projects, one
full time person handles the movement of paper for project signoff work flow. This
includes among others, paperwork for procurement, RFP‘s, contracts, change orders, and
supplier invoices.
Tool setup – Several challenges were identified that were related to the setup and
configuration of the tool. This is believed to be a combination of issues related to
improper configuration when the tool was initially setup, the fact that the tool is now an
older product late in its life cycle and the fact the business has evolved over time. The
chart of accounts has multiple issues.
The tool was configured with a 3 digit chart of accounts number, which we are
now running out of numbers and must compensate by doing illogical actions within the
tool. The financial operation between the Bus Company and the Head Office operate
with different chart of accounts. This causes difficulty in any rollup, consolidation or
comparison of financial accounts between the two companies.
Intercompany transactions cannot be accomplished with one transaction in one
system. They must be manually input on both systems resulting in business delays,
inefficiency, and risk of data input error. Cost centre hierarchies are not set up properly
for how the business is structured now.
Foreign exchange function is not setup in the tool. The tool does however have
capability for multi-currency functions. Any foreign currency transactions must be
converted manually into Canadian funds outside the tool, and then be manually re-
entered.

10
There is no interface between the project and general ledger (G/L) sub ledger
functions. Reconciliation between the two is very time consuming.
Usability – Overall the tool is not user friendly and cumbersome to use. It
requires specialized expertise and lengthy training to use the system. This is particularly
apparent with the accounts payable function, although there is some belief this is at least
in part related to our complex business processes and rules. Fixed asset functionality is
lacking, and to compensate fixed assets are tracked by 30 spreadsheets in a sub ledger
outside of the tool. Final numbers are then manually placed in the general ledger. This
causes constant reconciliation activity, forces duplicate data entry, and prevents any drill
down capability.
The project management function is reasonably adequate, with one opportunity
identified to improve key performance indicator capability within the tool.
Transaction Volumes – Accounts payable at the Head Office processes 150
physical cheques per week, along with 20 EFT transactions. For expenses, the Head
Office processes 20-25 paper expense reports every 2 weeks.
Benefits - From an accounting perspective, the benefit estimation is $650,000 per
year. This benefit represents soft benefits that help productivity but are unlikely to
translate to the bottom line. The benefit is derived by extrapolating the accounting
solution enterprise-wide (the Head Office, Bus and Rail companies using the same
system); and improvements in workflow related to lost invoices, duplicate copies, and
expense report rekeying.

11
Head Office Manager and staff productivity:
Accounting Department productivity:
Total Head Office Accounting Benefit = $650,000 (rounded)
2.3.3 Procurement – Head Office, Bus Company, and Rail Company
The Head Office business group of enterprise procurement & supply chain
management (SCM) is the authorized agent and contracting authority for all 3rd party
goods, services and construction works. Procurement & SCM is responsible for the
competitive bid process(es), marketplace strategies, contracting, negotiating, supplier
performance management and all commercial relationship related matters1. Within the
operating organizations of the Bus Company and the Rail company, Procurement
functions exist to administer supply chain processes to support their unique business
operations. This is focused primarily on equipment, services and parts to support daily
operations. Challenges and opportunities identified in the procurement area include:
Cross Organization Visibility – The multiple procurement functions operate
largely independently. This makes it difficult to conduct aggregation across the
organization for information like contractor or supplier history.
1 Company Head Office Procurement and Supply Chain ―2010 Review & 2011 Look-ahead‖ Report

12
Multiple Systems – Across the organization, multiple systems are used to manage
the procurement and supply chain function. The Head Office uses the Infor SmartStream
product, the Rail Company uses a custom FoxPro suite of applications, and the Bus
Company uses a combination of Infor SmartStream and Infor EAM. Opportunities may
exist for the Head Office to increase the utilization of Infor EAM for the procurement and
capital management process at the Head Office. This would be dependent upon Head
Office accounting also utilizing Infor EAM as well as the Rail Company. At the Bus
Company, the maintenance planning and inventory management happens in Infor EAM,
which then generates a work order to the procurement function. Increased integration
would improve efficiency and consistency.
Consistency - Multiple processes and tools result in inconsistent processes and a
lack of visibility across the organization. Attempts to aggregate information are
hampered by the lack of quality data sources since much of the information is captured in
free-form text within the information system. This incomplete and inconsistent
information affects the ability for the procurement function to respond to procurement
requests quickly and to maximize organization value.
Transaction vs. Strategic Focus – Today the business function of procurement
and supply chain management is largely transactional. A request for a product or service
comes into the procurement department, and is executed on a per transaction basis. For
each transaction the procurement department manages the RFP process, writes and signs
supplier contracts, issues purchase orders, and manages delivery. A shift to strategic
sourcing is planned to improve supplier development, collaborative supply chain

13
management, cross-functional supplier teams, relationship design, master contracts and
supplier performance evaluation.
Performance Measurement – The current procurement tool is not used to
‗manage‘ the process. Instead it is used to record activity and information to support
work activity. The management of the procurement process needs to be conducted
outside of the tool. Challenges exist in calculating the unit cost of products and services,
process efficiencies, and the holding cost of capital directly from within the current
system. Much of the reporting today relates to volumes, but not how well the business
function is performing.
Transaction Volumes – The total volume of procurement transactions across the
organization is in the order of $800 Million in purchases per year. A parts inventory of
$30 Million is carried between the Bus Company and the Rail Company operating
companies. At the Head Office roughly 1,000 purchase orders are generated each year
with a transaction time of between 20 -25 days from requisition to a signed supplier
contract. Across the organization the transaction volume breaks down as shown in the
following table:
Table 2-3 Procurement Transaction Volume
Organization Entity Purchase Orders / Yr Contract $ Volume Parts Inventory
Bus Company $171 Million $20 Million
Rail Company $47 Million $10 Million
Head Office 1,000 $581 Million
Total $799 Million $30 Million
Source: Procurement Manager, 2011.

14
The associated staffing complement to support the procurement business function is itemized
below. The Bus and Rail Companies have 90% of the procurement and supply chain
management staffing in the company enterprise-wide.
Table 2-4 Procurement Staffing Levels
Organization Entity Procurement and Supply Chain Staffing
Bus Company 75 (includes warehouse stock keeping)
Rail Company 23 (includes warehouse stock keeping)
Head Office 11
Total 109
Source: Procurement Manager, 2011.
In the future, opportunities exist for the definition and implementation of
enterprise procurement standards, supplier performance tracking, and master data records
for vendors and commitments. The ability to shift from transaction sourcing to strategic
sourcing for enterprise capital and master contracts would position the organization for
improved procurement performance.
Benefits - Potential Savings (quantifiable benefits):
Assuming a $799M spend a 1% savings would yield approximately $8M per year.
For the purposes of evaluation and cost/benefit calculation, I will use a conservative
estimate of 0.5%, which would yield $4M per year in savings. The savings are derived
from:
Cost per unit reductions

15
Aggregation of demand across enterprise
Holding costs reductions
Potential Savings (Soft Benefits):
Reduction in duplication of effort related to data entry and consolidation.
Standardization of processes and data would allow one standardized way
of conducting procurement processes across the enterprise reducing
training costs, on-boarding costs/complexities, allow for knowledge
sharing, and potential workload balancing.
Reduction in data integrity administration
Consistent internal controls that mitigate potential financial and/or
operational risk
Improved customer service & responsiveness to internal customers
Efficiency gains in automating the entire procurement cycle
Efficiency gains in aggregated demand planning & master contracting.
This would enable going to the market once as an enterprise, instead of
multiple times for similar products or services.
Reinvestment in efficiency/productivity gains into areas currently not
being performed consistently would yield further benefits or savings:
o Supplier Performance Management / Contract Management
o Electronic Supplier Integration through Electronic Data Interchange
(EDI), Extensible Markup Language (XML) or other methods
o Category Management
o Supplier & Marketplace Development
o Market Research
o Key Performance Indicator (KPI) & Performance Management

16
2.3.4 Finance Function – Bus Company
The finance function at the Bus Company handles the accounts payable, expense
management, budgeting, and procurement functions for the bus operations. The pain
points and opportunities identified by the Bus Company include:
Foundational Structure – The original implementation of SmartStream had a
narrow focus and lacked a well designed foundational structure. At the time the company
was using another financial product (Walker). The subsequent conversion to
SmartStream was essentially a recreation of the configuration of the old system. One area
in particular is the lack of structure to handle a multi-company operation. This results in
manual workarounds to handle intercompany transactions. The lack of automation forces
manual journal entries on both sides and injects timing issues and challenges with the
different chart of accounts.
Additional challenges exist with the setup of cost centres. The usual method to
handle cost centres is to define an entity such that each company could use the same cost
centre numbers. Today the system has a limit of 999 cost centre numbers, with 1-600
allocated to the Bus Company and 601 -999 allocated to the Head Office. This structure
has fundamental challenges whenever cost structures change.
Consolidation – Consolidation of the multi-company financials is not automated
and must be done manually outside of the tool.
Multi-Currency – An original design decision regarding currency limited the
system to fields that handle only Canadian currency, in order to reduce the size of the
database. To handle what was a small volume of US funds, the system was set up to
handle the US exchange as a tax. This workaround forces manual paperwork outside of

17
the system, and does not work whenever the value of the Canadian dollar exceeds that of
the US.
Chart of Accounts – The chart of accounts began as one set of accounts, since
prior to 1999 the functions of the Head Office and the Bus Company were one company.
Since the time the Head Office became a separate company, the chart of accounts has
drifted apart. This creates great difficulty in mapping during consolidation of financial
accounts.
Software Tool – Although the basic day to day financial functionality is solid, the
SmartStream tool is showing its age as a software product. SmartStream is no longer
sold by Infor, and is therefore on a declining customer base of installations. We are
operating the latest version, however the tool hasn‘t progressed since 2008. At the Bus
Company, upgrades have occurred but the core functionality hasn‘t changed since 2001.
The training manual used by the Bus Company was created in July 1998, and is still the
one used today to train new staff. Updates by Infor now are limited to keeping the
linkage with new SQL database versions.
Visibility and Automation – The tool offers minimal automation of processes.
Opportunities exist to automate invoice approval, receipt settlement, payments, employee
expenses, and purchasing cards. A lack of visibility into the system during procurement
processes, payment commitments, and other financial processes forces the creation of
compensating processes outside of the tool.
Extracts – In order to manage the necessary business financial reporting and
analysis, many database extracts have been created. This creates additional work and
difficulty in keeping the various databases in sync.

18
Benefits – The potential benefits associated with improvements in the financial
system are categorized into two components. The first is savings related to automation
and efficiency of work within the financial services area. Potential savings represent
12.5% of the work effort of the department, or 1 full time equivalent (FTE). This
potential work saving would allow work to be reallocated to other work functions that
would deliver improvements in financial management for the company. The second area
of savings is related to improved visibility into financial management for the cost centre
managers. There are currently 52 managers in the Bus Company. It is anticipated a
savings of 2-3 hours per month per manager in locating, and analyzing financial
information for decision making and oversight. The following formula calculates the
expected Bus company benefit.
Total Bus Company Accounting Benefit = $150,000 (rounded) per year
2.3.5 Finance Function – Rail Company
The finance function at the Rail Company handles the accounts payable,
budgeting, expense management and procurement functions for rail operations. At the
Rail Company, 20 managers have financial cost centre responsibilities for budgeting,
forecasting and expense management. The finance department has 11 staff and the

19
procurement department including stores inventory has 23 staff. The pain points and
opportunities identified by the Rail Company include:
Visibility into Financial Activity: The lack of tools to provide good visibility of
financials for managers results in the ownership of financial management primarily with
the accounting department. The department managers approve payments, but accounting
is responsible for analyzing statements for variances, verifying expenditures, and
identifying mis-coding of invoices. The ability to provide managers self serve and drill
down capability would enable increased financial management accountability directly in
the hands of department managers.
Reporting and Analytics: The financial system does not have built in financial
analytics capability. In order to perform analytics, report extracts are generated from the
tool. The report is then rekeyed into Microsoft Excel for analysis purposes.
Procurement Integration: The current process for supply chain management is
primarily manual, with minimal automation. Workflow approval processes are manual
paper processes. Challenges exist in knowing what parts inventory is located where at
any point in time. The specifics of warranty consignment information are cumbersome to
manage. The procurement function is handled by separate FoxPro systems that are not
seamlessly integrated with the financial system.
Finance System Setup: In order to provide financial reporting to the head office
for consolidation, the Rail Company must manually map account codes. This mapping
activity is caused by the difference between the chart of accounts. It would be preferable
for the company to have one chart of accounts, with everyone having access to the same
chart of accounts. The finance system has an addition challenge with handling contracts.
20
The system does not recognize contracts and therefore requires entry into the tool using a
workaround method. This workaround also causes challenges with reconciliation
activities.
Foreign Exchange: The handling of foreign exchange is challenging with
accounting for the exchange rate variations between the time of receipt of the product or
service and the invoice date.
Core Finance System: The SBT Accounting software has not been upgraded for
several years. It is used to provide base accounting functionality and has not been
extended through tool upgrades.
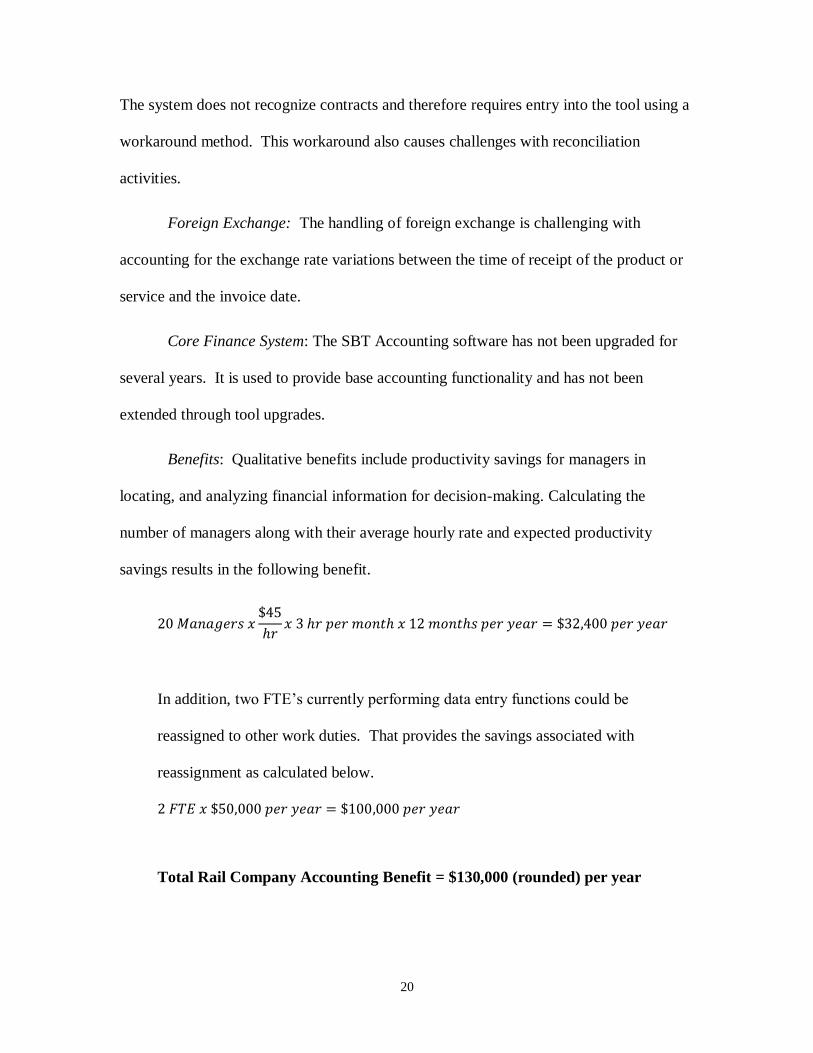
Benefits: Qualitative benefits include productivity savings for managers in
locating, and analyzing financial information for decision-making. Calculating the
number of managers along with their average hourly rate and expected productivity
savings results in the following benefit.
In addition, two FTE‘s currently performing data entry functions could be
reassigned to other work duties. That provides the savings associated with
reassignment as calculated below.
Total Rail Company Accounting Benefit = $130,000 (rounded) per year
21
Qualitative benefits include savings in:
Financial management effectiveness
Management visibility of financial activity
Consistency of data to aid in consolidation efforts
2.3.6 Technical Support of the Financial Systems
Technical support for the finance function is provided from two separate support
departments. The Head Office technology systems support area provides technical
support for the Head Office and the Bus Company. The Rail Company has its own
technical support group that provides technical support to the Rail Company financial
systems. The following sections describe the functions, challenges and opportunities in
the two technical groups.
2.3.6.1 Head Office and Bus Company
Support of the system is divided into two categories of functional and technical
support. Functional support handles business process and tool issues in administering the
finance process. Technical support includes application code fixes, database support,
access control and software setup. Today 2 FTE‘s handle functional support on a day-to-
day basis, and 1 FTE handles the technical support. In additional, a support and
maintenance contract is in place with the vendor at a cost of $166,000 per year.
System support is very lean in terms of support resources. It is anticipated that if
we changed the financial system we would not see any savings in work effort to support
the system. We would likely need to maintain new automation and system functionality
present in a new system, which would require the same or additional support resources.
22
Examples of this additional functionality would be financial data cubes and manager self
service tools.
The product currently in operation is the latest version offered by the vendor.
Upgrades are provided, but they are released only to provide technical fixes to maintain
compatibility with other manufacturer components. This includes PowerBuilder
software, Microsoft SQL database, and other bolt-on software modules.
Challenges with system support are centred on the original configuration, number
of databases and disparate add-ons:
Configuration – decisions made 10-14 years ago during setup are now causing
increasing support issues. Business changes and functionality requirements cannot be
accommodated easily in the tool and instead must either be illogically modified or bolt-
on functionality added outside the tool.
Database – The configuration and extensive requirement for reporting out of the
system have spawned many Microsoft Access databases out of the system. There are 35
background databases integral to the overall system, which require extensive technical
database support. A minor risk exists related to system downtime in the event of a
database issue. Restoring the large number of databases can result in a 2-3 hour
restoration time before returning to normal business operation.
Desktop Software – The SmartStream financial tool is a Client/Server software
product which requires additional work effort to support and maintain the software
installed on each client desktop. New software tools are most often web based which
operate using a standard web browser.
23
2.3.6.2 Rail Company
The Information Technology Services department at the Rail Company provides
technical support for the Rail Company. Day-to-day support and maintenance is
provided by the equivalent of 0.5 FTE. The core SBT software does not require much in
the way of maintenance and support. The software has not been upgraded on a regular
basis, so the work tends to be that of maintaining the software and less enhancement or
extension work.
Much of the effort in providing technical support is in the FoxPro custom
software that has been built and integrated over many years. Microsoft purchased Foxpro
in 1992, and continued to provide software version updates until 2007. In 2007
Microsoft announced Visual FoxPro 9 would be the last version produced. The product
would continue to receive compatibility updates, however the product would be sunset.
2.3.7 Financial Software
Two financial software products are in operation across all of the companies,
SmartStream and SBT. SmartStream by Infor is the core financial system used by the
Bus Company and the Head Office. It is the core software providing accounts payable,
accounts receivable and general ledger functions. SmartStream is a Windows Client
Server application, running on Microsoft SQL Server and a Windows PowerBuilder
client. It is still a Client Server product that we are operating today.
The system was implemented at the Bus Company in 1994, and historically has a
major version upgrade every two to three years. The system was upgraded from Sybase
to SQL Server 2000 in 2002. The last major functionality upgrade was in 2008. The
system includes functionality and data for:

24
Revenue
Expenditures
Budget
Bank Account
Chart of Accounts
The system has several interfaces to other software systems operating within the company:
Interface to and from EAM, the enterprise asset management system also supplied
by Infor.
Interface to PeopleSoft HR – Finance/Chart of Accounts (Cost Centre) using the
corporate database.
Interface from PeopleSoft Payroll – To supply payroll amounts to the general
ledger.
Interface from PeopleSoft Payroll – Finance expenditures for salary employee
accruals
Interface from PeopleSoft Payroll - Finance/Expenditures for wage employee
accruals
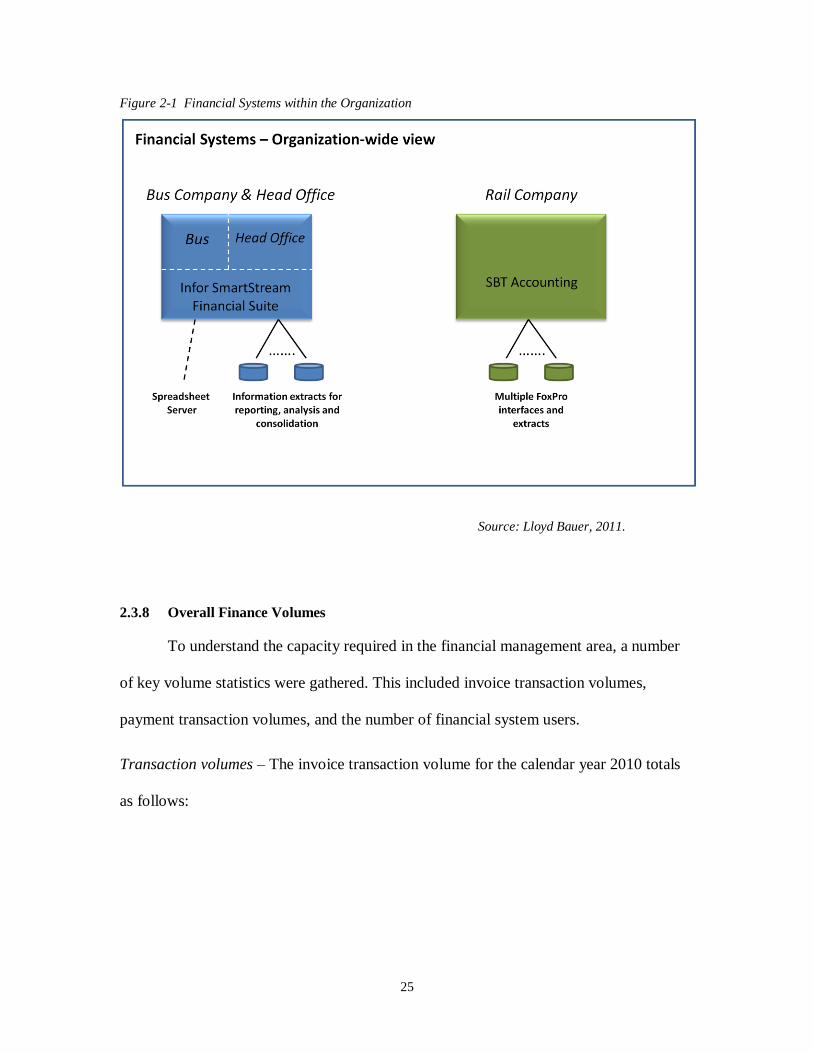
The Rail Company has a separate financial system. The system is a SBT
Accounting package at the core, with extensive FoxPro custom code built around the
core. Five user licenses of SBT are used to administer the accounting package. The
FoxPro custom code provides interface and extract capability. Multiple modules provide
accounts payable, inventory management, and procurement functions. See figure below
that illustrates the financial systems supporting the company enterprise-wide:
25
Figure 2-1 Financial Systems within the Organization
Source: Lloyd Bauer, 2011.
2.3.8 Overall Finance Volumes
To understand the capacity required in the financial management area, a number
of key volume statistics were gathered. This included invoice transaction volumes,
payment transaction volumes, and the number of financial system users.
Transaction volumes – The invoice transaction volume for the calendar year 2010 totals
as follows:

26
Table 2-5 Invoice Transaction Volumes
Head Office Bus Company Total
Invoices 14,479 44,248 58,727
Invoice Lines 23,894 91,914 115,808
Source: Finance Manager, 2011.
The total payment amount issued in 2010 was $851 Million. The individual payment
volumes that produced this payment amount was just over 21,000 transactions. The
payment transaction volume for the year breaks down as follows:
Table 2-6 Payment Transaction Volumes
Head Office Bus Company Total
Cheques 7,378 7,480 14,858
Electronic Funds
Transfer
760 4,141 4,901
Wire Transfer 1,251 297 1,548
Total Payments 9,389 11,918 21,307
Source: Finance Manager, 2011.
User Base – The total number of users with direct access to the SmartStream financial
system is just over 100 users enterprise-wide. This includes managers who have access to
the system. The allocation is broken down as follows:

27
Table 2-7 Financial System Users
User Groups Head Office Bus Company Total
Accounting 9 10 19
Procurement 10 8 18
Financial Planning &
System Support
11 12 23
Projects 42 1 43
Other 4 2 6
TOTAL 76 33 109
Source: Finance Manager, 2011.
2.3.9 Summary of Pain Points and Opportunities
After interviewing and research the key financial areas of the company, five
primary themes emerged.
1. Financial Analysis and Reporting – Challenges exist whenever financial analysis
and reporting is required. This applies to both within the financial departments,
and with the business managers of the broader organization. Analysis and
reporting is cumbersome within the tool, and is therefore frequently done to the
extent possible outside the tool. Opportunities to provide self serve reporting for
department managers and the simplification of reporting would improve decision
making for the organization.

28
2. Multiple Non-Integrated Systems – Operating with multiple systems revealed
several shortcomings. Consolidation across disparate systems is challenging. The
rekeying of information and duplication of data entry is labour intensive and
prone to entry errors. Drill down for financial analysis is not possible. For
procurement, the lack of cross organization visibility makes it difficult to
maximize supplier contracts and to manage vendor performance. Improving the
integration of systems can result in improved productivity of managers, and
financial department staff.
3. Manual Work Processes and Work-Arounds – Many of the finance work
processes are manual paper processes. The budgeting and forecasting process for
the organization is lengthy and labour intensive. The structure and complexity of
the tool have a side effect of extensive data extracts to accomplish work outside of
the core tool. This is inefficient and causes a risk of inconsistency in reporting.
Opportunities exist to streamline the supply chain process, and automate work
processes.
4. System Structure – The original configuration and setup of the SmartStream
software does not meet the needs of a multi-company structure. Examples
include different company chart of accounts, inter-company transactions, and cost
centre hierarchies. In addition, the system was not setup to handle foreign
exchange or to integrate the project and G/L sub ledgers.

29
5. Legacy Tool – the financial products are showing their age. The main financial
product used by the Head Office and the Bus Company is no longer being sold.
Upgrades are non-functional in nature and are targeted at keeping compatible with
the underlying database and software development tools. The product uses legacy
Client/Server technology and is difficult to train and use. The benefit of staying
on this tool has been the extension of the original investment and the ability to
focus on other organizational priorities than the financial back office function.
2.4 Tangible Benefits
The tangible benefits, also known as quantifiable benefits, are itemized in the
following section. Understanding the dollar value of the benefits helps in determining
what the acceptable range of cost investment would be to achieve the associated benefits.
The total tangible benefits identified in the finance, accounting and procurement areas are
in the order of $8.9 Million per annum. These savings and opportunities are primarily
generated by improvements in automation, efficiency, consolidation tool functionality
and structure.
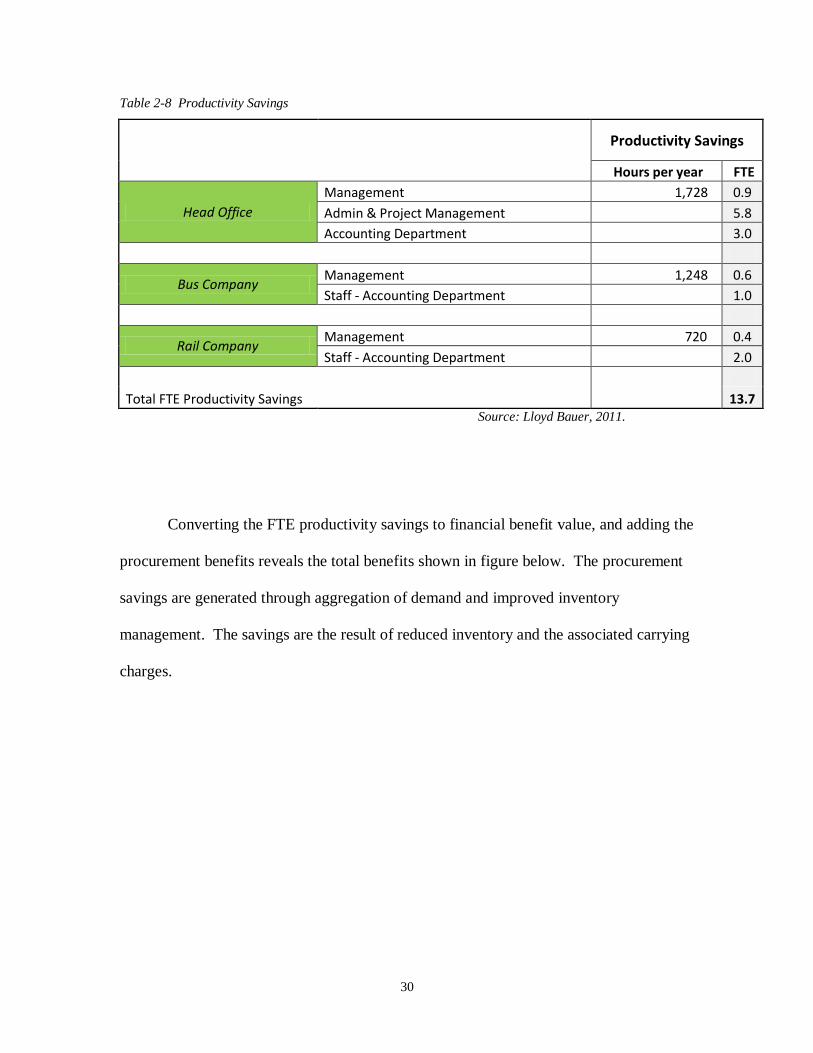
The productivity savings would free up the equivalent of 13.7 FTE‘s throughout
the organization. This includes accounting staff, department managers, administrators
and project managers. The breakdown of productivity saving is shown in table 2-8.
30
Table 2-8 Productivity Savings
Productivity Savings
Hours per year FTE
Head Office
Management 1,728 0.9
Admin & Project Management 5.8
Accounting Department 3.0
Bus Company Management 1,248 0.6
Staff - Accounting Department 1.0
Rail Company Management 720 0.4
Staff - Accounting Department 2.0
Total FTE Productivity Savings 13.7 Source: Lloyd Bauer, 2011.
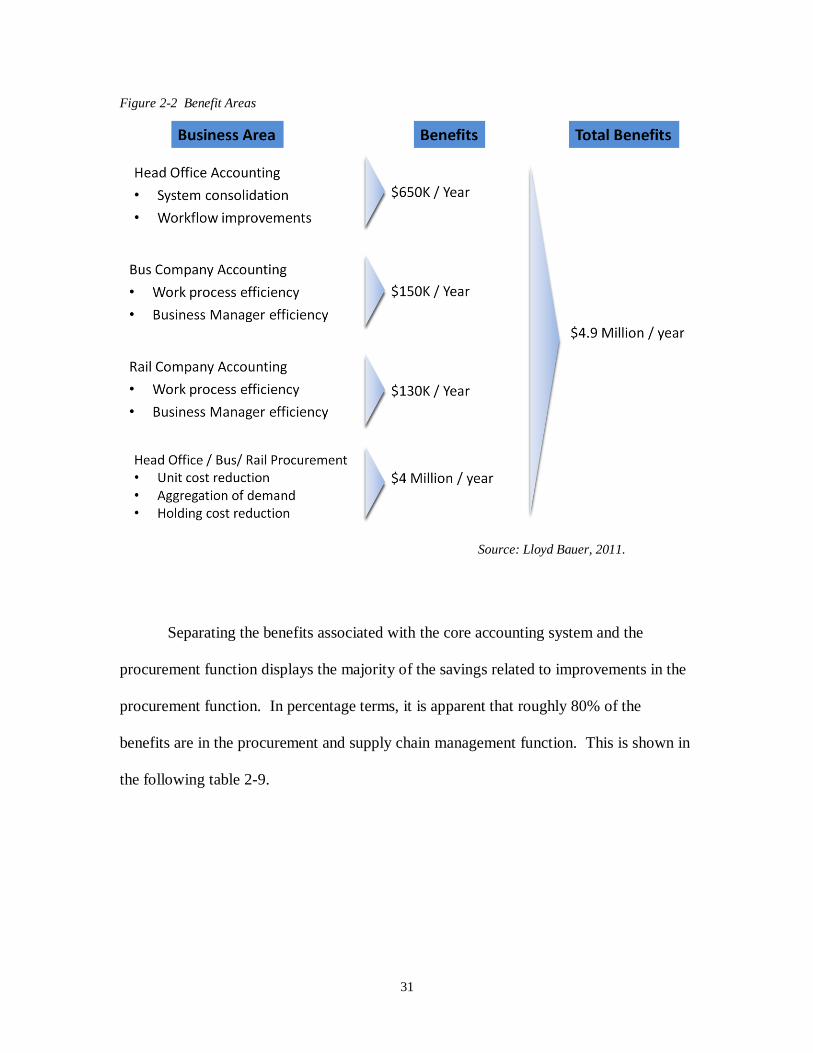
Converting the FTE productivity savings to financial benefit value, and adding the
procurement benefits reveals the total benefits shown in figure below. The procurement
savings are generated through aggregation of demand and improved inventory
management. The savings are the result of reduced inventory and the associated carrying
charges.
31
Figure 2-2 Benefit Areas
Source: Lloyd Bauer, 2011.
Separating the benefits associated with the core accounting system and the
procurement function displays the majority of the savings related to improvements in the
procurement function. In percentage terms, it is apparent that roughly 80% of the
benefits are in the procurement and supply chain management function. This is shown in
the following table 2-9.

32
Table 2-9 Summary of Benefits
Business Area Finance Accounting Only Procurement Only
Head Office Accounting $650K per year
Bus Company
Accounting
$150K per year
Rail Company
Accounting
$130K per year
Head Office / Bus/ Rail
Procurement
$4M per year
Total $930K per year $4M per year
Source: Lloyd Bauer, 2011.
33
3: Options Analysis
In this section, I will be analyzing the solution options to address the problems
and opportunities identified in the previous section. I will identify the solution options,
define the evaluation criteria, and then evaluate the options using the defined criteria.
Included in this section is information related to corporate social responsibility.
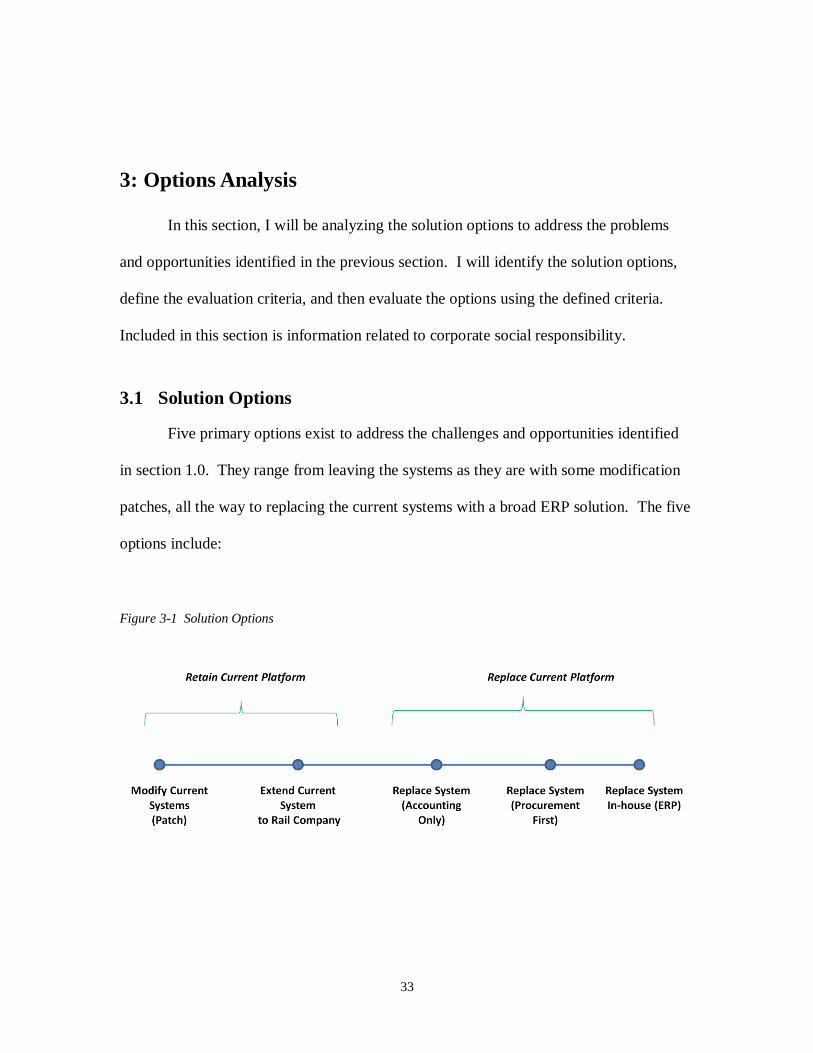
3.1 Solution Options
Five primary options exist to address the challenges and opportunities identified
in section 1.0. They range from leaving the systems as they are with some modification
patches, all the way to replacing the current systems with a broad ERP solution. The five
options include:
Figure 3-1 Solution Options

34
Option 1: Modify Current Systems
This option would extend the life of the current systems by performing simple
modification to the current processes, and configuration. Moving to a common set of
account codes would simplify consolidation and intercompany transfers. Some workflow
could be provisioned outside of the tool to reduce the manual paper flow of reviews and
approvals. The current software products would remain in place.
Option 2: Extend Current System to Rail Company
Moving to a single product would reduce the consolidation efforts and improve enterprise
visibility of financial management. The current SmartStream tool would be extended for
use out to the Rail Company. This would replace the Rail Company financial software,
and reduce the overall organization cost of maintaining two financial systems.
Option 3: Replace System (Accounting Only)
This option replaces the existing financial software solutions with a new commercial off
the shelf (COTS) software solution. The solution would be expected to address the
structural deficiencies of the current software, and be able to accommodate a multi-
company business environment. Given the financial requirements of the Head Office
enterprise are believed to be generic, it is reasonable to expect a matching product could
provide the required functionality. This solution would address the financial accounting
business function only. The Procurement function would not be addressed with this
option.
35
Option 4: Replace System (Procurement First)
This option would implement a new procurement and financial accounting solution using
a phased approach. The procurement solution would be implemented in year 1, with
benefits beginning in year 2. The financial accounting function would continue to
operate using the current software for the next three years. In year 4 the financial
accounting software would be replaced, with accounting benefits beginning in year 4.
Option 5: Replace System In-house (ERP)
This option replaces the existing financial software solutions and the broader ERP
functions with a new commercial off the shelf (COTS) software ERP solution. The
solution would be expected to address the broad requirements including core financial,
human resources, supply chain management, project management, and activity based
costing.
When evaluating Option 5, it is recommended to also investigate Software as a Service
(SaaS) solutions. SaaS solutions offer computer system software operated by third party
companies using secure access over the Internet. They hold the promise of decreasing the
time to implement and lower the capital cost of implementation. The privacy legislation
and organizational risk associated with contractor responsibility for the organizations
financial transactions and system would need to be carefully considered.
A sixth option to custom build the financial software solution was briefly considered.
This option was rejected because of two reasons. The first was financial software is
readily available in the marketplace for the company‘s generic financial requirements.
The second was the total cost of ownership resulted in a negative internal rate of return.
Refer to Appendix A for the evaluation of this sixth option.

36
3.2 Evaluation Criteria
Prior to evaluating the five options, the criteria for evaluation needed to be defined. Four
criteria were defined to evaluate the solution options:
1. Business Needs: How well does the solution address the pain points and
opportunities identified by the business areas?
2. Project Risk Management: What technology risks exist in terms of technology
maturity, integration, support, and architecture impact. What project management
risks exist related to project size, duration, and effort?
3. Business Viability: How significant is the change to business processes and
practices. How significant is the change to the business organization model? How
critical are the business resources to the delivery of the project? How viable is the
solution in terms of disruption risk to business operations?
4. Cost / Benefit: What is the total cost of ownership (TCO) of the various options
over a five year period?
Each criteria was applied a weighting and each solution was scored on a scale of 1
to 5 in order to compare the solution options. One is the lowest score with five being the
highest score. The weighting distribution is as follows:
Business Need: 30%
Project Risk Management: 20%
Business Viability: 20%
Cost / Benefit: 30%
Total: 100%

37
3.3 Evaluation of Alternatives
This section provides the evaluation results for each solution option with the
evaluation criteria applied. Each option provides information on how well they support
the business need, risk management, viability, and the strength of the cost/benefit. I have
used the internal rate of return over a five year period as the comparative measure. Each
criteria factor is scored based upon the predefined weighting and one to five scoring
range.
3.3.1 Option 1: Modify Current Systems
Business Needs: This option would extend the life of the current system by performing
simple modification to the current processes and configurations. Moving to a common
set of account codes would simplify consolidation and intercompany transfers. By
revisiting the fundamental structure of the current system the most significant issues
related to integration and consolidation would be addressed. Some workflow could be
provisioned outside of the tool to reduce the manual paper flow of reviews and approvals.
This option does not address the financial analysis and reporting, and automation of
workflow processes that are manually handled outside of the finance software.
38
Table 3-1 Option 1: Modify Current Systems
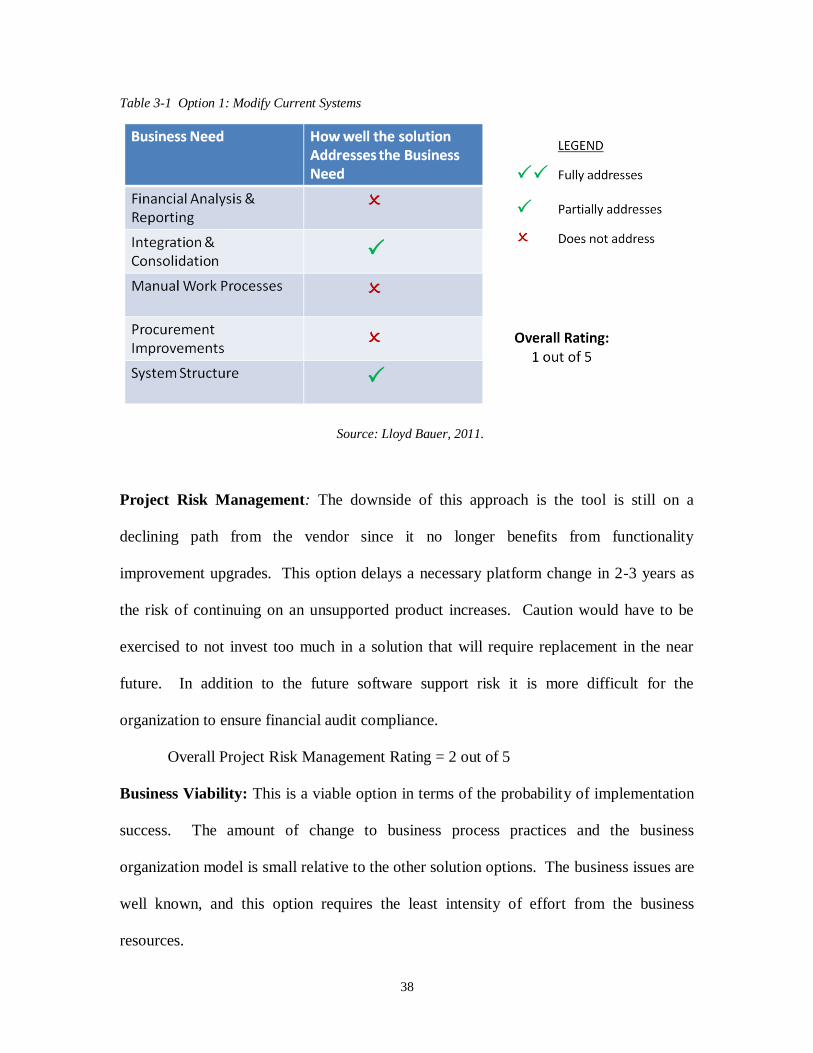
Source: Lloyd Bauer, 2011.
Project Risk Management: The downside of this approach is the tool is still on a
declining path from the vendor since it no longer benefits from functionality
improvement upgrades. This option delays a necessary platform change in 2-3 years as
the risk of continuing on an unsupported product increases. Caution would have to be
exercised to not invest too much in a solution that will require replacement in the near
future. In addition to the future software support risk it is more difficult for the
organization to ensure financial audit compliance.
Overall Project Risk Management Rating = 2 out of 5
Business Viability: This is a viable option in terms of the probability of implementation
success. The amount of change to business process practices and the business
organization model is small relative to the other solution options. The business issues are
well known, and this option requires the least intensity of effort from the business
resources.
39
Overall Business Viability Rating = 5 out of 5
Cost/Benefit: The benefits of improved efficiency related to integration and
consolidation are achievable with this solution. Since this option only focuses on key
changes, the benefits are calculated at 25% of the total benefits for Head Office and Bus
Company accounting. It is estimated that a cost of $250,000 would be required for
structuring of the underlying configuration of the existing finance software. No
incremental increase in support costs is expected. See detailed assumptions in Appendix
B. The resulting Internal Rate of Return is 71%.
Overall Cost/Benefit Rating = 3 out of 5

40
Table 3-2 Cost/Benefit for Option 1
Year 1 Year 2 Year 3 Year 4 Year 5
CAPITAL COSTS
Labour 250,000$
Technology -$
Other
SUB-TOTAL CAPITAL 250,000$ -$ -$ -$ -$
OTHER
Ongoing Operating / Support Costs
SUB-TOTAL OTHER -$ -$ -$ -$ -$
TOTAL PROJECT COSTS / OUTFLOW 250,000$ -$ -$ -$ -$
Benefits: Head Office Accounting -$ 162,500$ 162,500$ 162,500$ 162,500$
Benefits - Bus Accounting 37,500$ 37,500$ 37,500$ 37,500$
Benefits - Rail Accounting -$ -$ -$ -$
Benefits - Procurement -$ -$ -$ -$
TOTAL PROJECT BENEFITS / INFLOW -$ 200,000$ 200,000$ 200,000$ 200,000$
NET CASH FLOW 250,000-$ 200,000$ 200,000$ 200,000$ 200,000$
CUMULATIVE CASH FLOW 250,000-$ 50,000-$ 150,000$ 350,000$ 550,000$
INTERNAL RATE OF RETURN (IRR) 71%
Source: Lloyd Bauer, 2011.
3.3.2 Option 2: Extend Current System to Rail Company
Business Needs: Moving to a single product would reduce the consolidation efforts and
improve enterprise visibility of financial management. The current SmartStream tool
would be extended for use out to the Rail Company. This would replace the Rail
Company financial software, and reduce the overall organization cost of maintaining two
financial systems. Prior to extending the system to the Rail Company, it would be

41
necessary to revisit the fundamental structure of the current system as described in
Option 1. This option does not address the financial analysis and reporting, and
automation of workflow processes that are manually handled outside of the finance
software.
Table 3-3 Option 2: Extend Current System to Rail Company
Source: Lloyd Bauer, 2011.
Project Risk Management: This option has similar risks to that of option 1. Like option
1, the downside of this approach is the tool is still on a declining path from the vendor
since it no longer benefits from functionality improvement upgrades. This option delays
a necessary platform change in 2-3 years as the risk of continuing on an unsupported
product increases. Risk of this option is higher however since we have added additional
finance business functions onto a tool that will be unsupported and require replacement in
the near future. Caution would have to be exercised to not invest too much in a solution
that will soon require replacement. In addition to the future software product risk, it is

42
more difficult for the organization to ensure financial audit compliance with the current
product. The amount of work effort is higher than option 1 due to the need to consolidate
accounting practices between the Head Office and the Rail Company.
Overall Project Risk Management Rating = 1 out of 5
Business Viability: For option 2 the amount of business change is higher than option 1
due to the need to consolidate accounting practices between the Head Office and the Rail
Company. This reduces the viability of the option since the issues are less understood and
will bring complexity to business process implementation of the option.
Overall Business Viability Rating = 3 out of 5
Cost/Benefit: This option includes the cost of restructuring the existing accounting
software. It does not include costs or benefits associated with the procurement function.
The benefits of improved efficiency related to integration and consolidation are
achievable with this solution, and extended to the Rail Company. The benefits are
calculated at 25% of the total benefits for Head Office, Bus and Rail Company
Accounting. It is estimated that a cost of $450,000 would be required for structuring of
the underlying configuration of the existing finance software. No incremental increase in
support costs is expected. See detailed assumptions in Appendix C. The resulting
internal rate of return is 37%.
Overall Cost/Benefit Rating = 2 out of 5

43
Table 3-4 Cost Benefit for Option 2
Year 1 Year 2 Year 3 Year 4 Year 5
CAPITAL COSTS
Labour 450,000$
Technology -$
Other
SUB-TOTAL CAPITAL 450,000$ -$ -$ -$ -$
OTHER
Ongoing Operating / Support Costs
SUB-TOTAL OTHER -$ -$ -$ -$ -$
TOTAL PROJECT COSTS / OUTFLOW 450,000$ -$ -$ -$ -$
Benefits: Head Office Accounting -$ 162,500$ 162,500$ 162,500$ 162,500$
Benefits - Bus Accounting 37,500$ 37,500$ 37,500$ 37,500$
Benefits - Rail Accounting 32,500$ 32,500$ 32,500$ 32,500$
Benefits - Procurement -$ -$ -$ -$
TOTAL PROJECT BENEFITS / INFLOW -$ 232,500$ 232,500$ 232,500$ 232,500$
NET CASH FLOW 450,000-$ 232,500$ 232,500$ 232,500$ 232,500$
CUMULATIVE CASH FLOW 450,000-$ 217,500-$ 15,000$ 247,500$ 480,000$
INTERNAL RATE OF RETURN (IRR) 37%
Source: Lloyd Bauer, 2011.
3.3.3 Option 3: Replace System (Accounting Only)
Business Needs: This option replaces the existing financial software solutions with a new
commercial off the shelf (COTS) software solution. The solution would be expected to
address the structural deficiencies of the current software, and be able to accommodate a
multi-company business environment. Given the financial requirements of the Head

44
Office enterprise are generic in nature, it is reasonable to expect a matching product
could provide the required functionality.
The financial software industry has a wide range of product offerings to serve small,
medium, and large companies. The financial reporting and analysis functions would be
able to be performed within the tool. Many products come with self-serve capability to
enable business Managers to have visibility into budgets, expenses and forecasts.
This option still does not address the procurement needs and challenges of the company.
Although many of the manual work processes would be automated with this option, the
automation of procurement workflow would not be addressed.
Table 3-5 Option 3: Replace System (Accounting Only)
Source: Lloyd Bauer, 2011.
Project Risk Management: The proven technology of this option reduces the risk of an
unsuccessful implementation. With a standard off the shelf product, the risk of
knowledge retention is reduced greatly over that of a custom built solution. This option

45
reduces the risk of obsolescence and future support risk of the current software solution.
It will be important to understand the size, capacity, and technical requirements in order
to select the appropriate vendor solution.
The pre-packaged software provides high technical and implementation viability of this
solution option. With proven, field tested implementations in production at other
organizations, the viability of meeting business objectives and delivering the solution on
time and on budget has a high confidence rating.
Overall Project Risk Management Rating = 5 out of 5
Business Viability: The proven functionality of this pre-packaged software provides
high business model viability. With proven, field tested implementations in production at
other organizations, the disruption to business operations is reduced. Pre-packaged
software does require the company‘s financial business practices, processes and rules to
be modified to fit the software. These are often industry proven solutions however, so
modifying to industry standards is preferred.
Overall Business Viability Rating = 5 out of 5
Cost/Benefit: This option includes the $600,000 acquisition cost of accounting software,
along with the 100% of the associated accounting related benefits. This option does not
include costs or benefits of the procurement software. Implementation costs are
calculated at a ratio of 3 times the software cost. Annual support costs are comparable to
the current software, so there is no incremental increase in support cost. See detailed
assumptions in Appendix D. The resulting internal rate of return is 20%.

46
Overall Cost/Benefit Rating = 1 out of 5
Table 3-6 Cost Benefit for Option 3
Year 1 Year 2 Year 3 Year 4 Year 5
CAPITAL COSTS
Labour 1,800,000$
Technology 600,000$
Other
SUB-TOTAL CAPITAL 2,400,000$ -$ -$ -$ -$
OTHER
Ongoing Operating / Support Costs
SUB-TOTAL OTHER -$ -$ -$ -$ -$
TOTAL PROJECT COSTS / OUTFLOW 2,400,000$ -$ -$ -$ -$
Benefits: Head Office Accounting -$ 650,000$ 650,000$ 650,000$ 650,000$
Benefits - Bus Accounting 150,000$ 150,000$ 150,000$ 150,000$
Benefits - Rail Accounting 130,000$ 130,000$ 130,000$ 130,000$
Benefits - Procurement -$ -$ -$ -$
TOTAL PROJECT BENEFITS / INFLOW -$ 930,000$ 930,000$ 930,000$ 930,000$
NET CASH FLOW 2,400,000-$ 930,000$ 930,000$ 930,000$ 930,000$
CUMULATIVE CASH FLOW 2,400,000-$ 1,470,000-$ 540,000-$ 390,000$ 1,320,000$
INTERNAL RATE OF RETURN (IRR) 20%
Source: Lloyd Bauer, 2011.

47
3.3.4 Option 4: Replace System (Procurement First)
Business Needs: This option would implement a new procurement and financial
accounting solution using a phased approach. It replaces the existing procurement and
financial accounting software with new commercial off the shelf (COTS) solutions.
Along with option 5, this solution option provides the broadest range of business
functionality to meet the challenges and opportunities identified from the business areas.
Table 3-7 Option 4: Replace System (Procurement First)
Source: Lloyd Bauer, 2011.
Project Risk Management: Like solution option 3, the proven technology of this option
reduces the risk of an unsuccessful implementation. The risk of this option is higher
however due to the increased complexity and technical integration of the project. Project
risk increases with the size and complexity of the project. Implementing the solution

48
using a phased approach reduces the project risk by breaking the design, build, and
implementation into two phases.
Overall Project Risk Management Rating = 4 out of 5
Business Viability: Similar to solution option 3, the pre-packaged software provides
business model viability of this solution option. With proven, field tested
implementations in production at other organizations, the disruption to business
operations is reduced. This option does have a higher business resource requirement than
option 3, as well as an increase in the amount of change required to business processes.
This is offset however by applying a phased approach to implementation, which spreads
the resource requirement out over a longer period.
Overall Business Viability Rating = 5 out of 5
Cost/Benefit: This option includes the full cost of the accounting and procurement
software, along with the 100% of the associated benefits, using a phased in approach. A
ten percent uplift in the software cost is added due to the separation of software purchases
and reduced negotiating leverage. This results in a software cost of $935,000. Included is
the incremental annual ongoing software support cost of 20% of the cost of the
procurement software. Implementation costs are calculated at a ratio of 4 times the
software cost. Procurement software, having the greatest financial benefit impact, would
be implemented first with the benefits beginning in the second year. The financial
accounting software would continue to be used for an additional three years at which time
it would be replaced. Benefits of the financial accounting software would begin in year

49
4. See detailed assumptions in Appendix E. This option has the highest internal rate of
return of all the options coming in at 240%.
Overall Cost/Benefit Rating = 5 out of 5
Table 3-8 Cost Benefit for Option 4
Year 1 Year 2 Year 3 Year 4 Year 5
CAPITAL COSTS
Labour 1,100,000$ 2,640,000$
Technology 275,000$ 660,000$
Other
SUB-TOTAL CAPITAL 1,375,000$ -$ 3,300,000$ -$ -$
OTHER
Ongoing Operating / Support Costs 55,000$ 55,000$ 55,000$ 55,000$
SUB-TOTAL OTHER -$ 55,000$ 55,000$ 55,000$ 55,000$
TOTAL PROJECT COSTS / OUTFLOW 1,375,000$ 55,000$ 3,355,000$ 55,000$ 55,000$
Benefits: Head Office Accounting -$ -$ -$ 650,000$ 650,000$
Benefits - Bus Accounting -$ -$ 150,000$ 150,000$
Benefits - Rail Accounting -$ -$ 130,000$ 130,000$
Benefits - Procurement 4,000,000$ 4,000,000$ 4,000,000$ 4,000,000$
TOTAL PROJECT BENEFITS / INFLOW -$ 4,000,000$ 4,000,000$ 4,930,000$ 4,930,000$
NET CASH FLOW 1,375,000-$ 3,945,000$ 645,000$ 4,875,000$ 4,875,000$
CUMULATIVE CASH FLOW 1,375,000-$ 2,570,000$ 3,215,000$ 8,090,000$ 12,965,000$
INTERNAL RATE OF RETURN (IRR) 240%
Source: Lloyd Bauer, 2011.
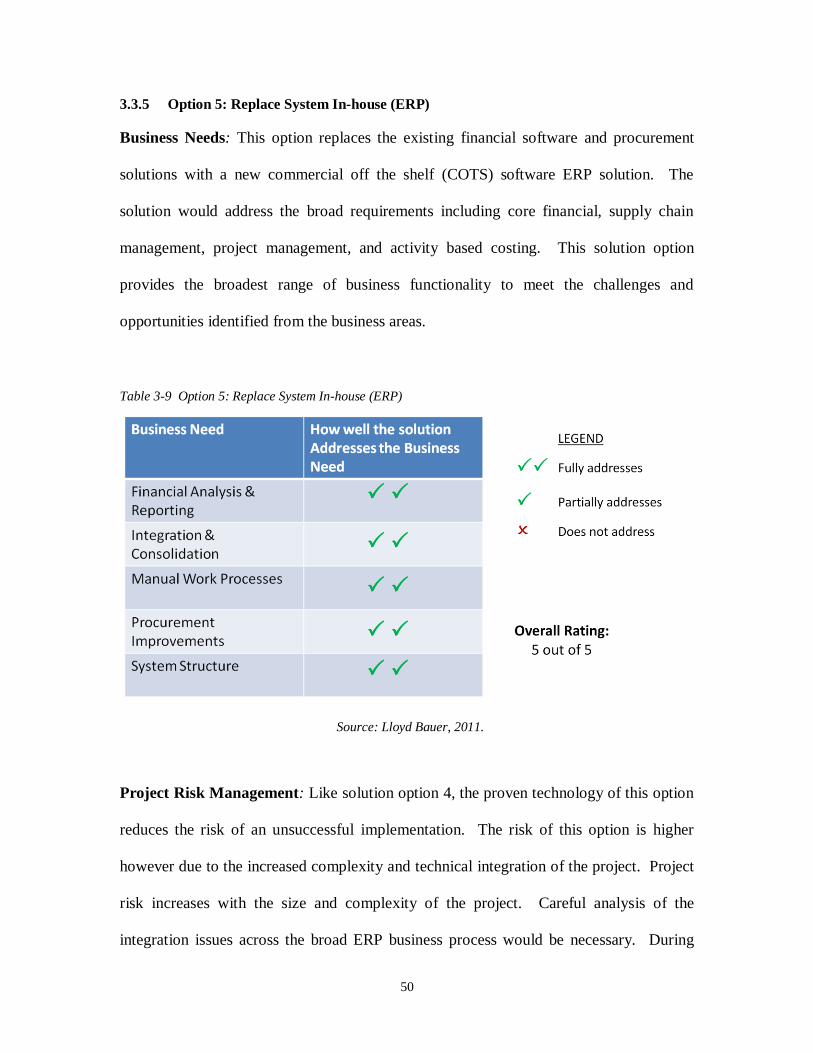
50
3.3.5 Option 5: Replace System In-house (ERP)
Business Needs: This option replaces the existing financial software and procurement
solutions with a new commercial off the shelf (COTS) software ERP solution. The
solution would address the broad requirements including core financial, supply chain
management, project management, and activity based costing. This solution option
provides the broadest range of business functionality to meet the challenges and
opportunities identified from the business areas.
Table 3-9 Option 5: Replace System In-house (ERP)
Source: Lloyd Bauer, 2011.
Project Risk Management: Like solution option 4, the proven technology of this option
reduces the risk of an unsuccessful implementation. The risk of this option is higher
however due to the increased complexity and technical integration of the project. Project
risk increases with the size and complexity of the project. Careful analysis of the
integration issues across the broad ERP business process would be necessary. During

51
product selection process the question of whether best of breed point solutions would
provide a better, more cost effective solution will need evaluation.
Overall Project Risk Management Rating = 3 out of 5
Business Viability: Similar to solution option 4, the pre-packaged software provides
business model viability of this solution option. With proven, field tested
implementations in production at other organizations, the impact to business operations is
reduced over that of custom-built solutions. This option does have a higher business
resource requirement than option 4, as well as an increase in the amount of change
required to business processes.
Overall Business Viability Rating = 4 out of 5
Cost/Benefit: This option includes the full cost ($850,000) of the accounting and
procurement software, along with the 100% of the associated benefits. Implementation
costs are calculated at a ratio of 3 times the software cost. This option includes
incremental annual ongoing software support cost of 20% of the cost of the procurement
software. See detailed assumptions in Appendix F. The resulting internal rate of return
is 139%.
Overall Cost/Benefit Rating = 4 out of 5

52
Table 3-10 Cost Benefit for Option 5
Year 1 Year 2 Year 3 Year 4 Year 5
CAPITAL COSTS
Labour 2,550,000$
Technology 850,000$
Other
SUB-TOTAL CAPITAL 3,400,000$ -$ -$ -$ -$
OTHER
Ongoing Operating / Support Costs 50,000$ 50,000$ 50,000$ 50,000$
SUB-TOTAL OTHER -$ 50,000$ 50,000$ 50,000$ 50,000$
TOTAL PROJECT COSTS / OUTFLOW 3,400,000$ 50,000$ 50,000$ 50,000$ 50,000$
Benefits: Head Office Accounting -$ 650,000$ 650,000$ 650,000$ 650,000$
Benefits - Bus Accounting 150,000$ 150,000$ 150,000$ 150,000$
Benefits - Rail Accounting 130,000$ 130,000$ 130,000$ 130,000$
Benefits - Procurement 4,000,000$ 4,000,000$ 4,000,000$ 4,000,000$
TOTAL PROJECT BENEFITS / INFLOW -$ 4,930,000$ 4,930,000$ 4,930,000$ 4,930,000$
NET CASH FLOW 3,400,000-$ 4,880,000$ 4,880,000$ 4,880,000$ 4,880,000$
CUMULATIVE CASH FLOW 3,400,000-$ 1,480,000$ 6,360,000$ 11,240,000$ 16,120,000$
INTERNAL RATE OF RETURN (IRR) 139%
Source: Lloyd Bauer, 2011.
3.4 Evaluation of Alternatives - Summary
This section summarizes the evaluation results and scoring for the options and
evaluation criteria. Also in this section is a sensitivity analysis of the options. The
analysis will determine the sensitivity to the overall scoring of a change in the weighting
to place a higher emphasis on the business viability of the solution.

53
3.4.1 Evaluation Summary
The Internal Rate of Return (IRR) calculation indicates the options with the
highest returns are Option 4 – Replace System (Procurement First) and Option 5 –
Replace System In-house (ERP).
Figure 3-2 Internal Rate of Return of Options
Source: Lloyd Bauer, 2011.
Applying the scoring criteria to the five criteria factors results in the scoring
results shown below in table 3.6. Option 4 – Replace System (Procurement First) has the
highest score, with Option 5 ―Replace System In-House (ERP)‖ receiving the second
highest score.
0%
50%
100%
150%
200%
250%
Option 1 Option 2 Option 3 Option 4 Option 5
71%37% 20%
240%
139%
Internal Rate of Return

54
Table 3-11 Option Scoring Summary
Option Business
Needs Score Weighting
Weighted Score
Risk Management
Score Weighting
Weighted Score
Option 1
1 30% 0.3 2 20% 0.4
Option 2
2 30% 0.6 1 20% 0.2
Option 3
4 30% 1.2 5 20% 1
Option 4
5 30% 1.5 4 20% 0.8
Option 5
5 30% 1.5 3 20% 0.6
Option Viability
Score Weighting
Weighted Score
Cost/ Benefit Score
Weighting Weighted
Score TOTAL
Option 1
5 20% 1 3 30% 0.9 2.6
Option 2
3 20% 0.6 2 30% 0.6 2
Option 3
5 20% 1 1 30% 0.3 3.5
Option 4
5 20% 1 5 30% 1.5 4.8
Option 5
4 20% 0.8 4 30% 1.2 4.1
Source: Lloyd Bauer, 2011.
3.4.2 Cost / Benefit Sensitivity Analysis
At the Head Office, we have a hurdle rate of 6% (IRR), for investments requiring
a financial return. The cost of capital (interest payment on borrowing) varies depending
on the timeline. Usually IT projects would have a 5 -10 year life. The cost of capital is
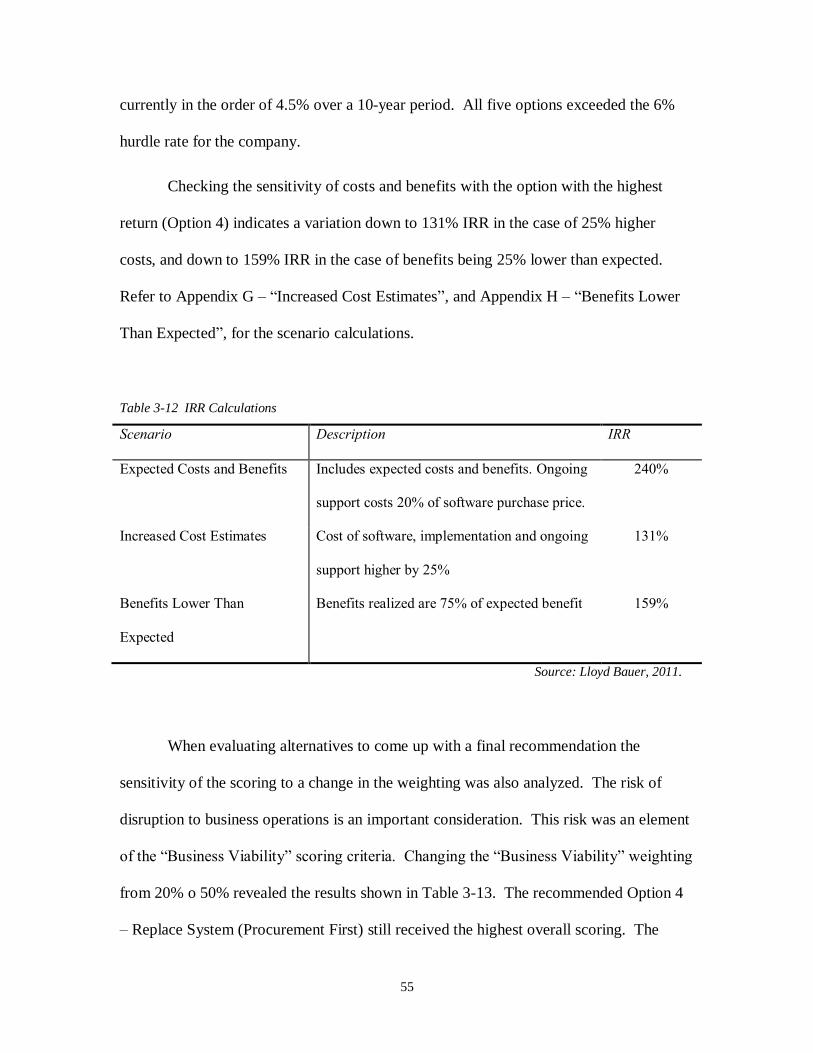
55
currently in the order of 4.5% over a 10-year period. All five options exceeded the 6%
hurdle rate for the company.
Checking the sensitivity of costs and benefits with the option with the highest
return (Option 4) indicates a variation down to 131% IRR in the case of 25% higher
costs, and down to 159% IRR in the case of benefits being 25% lower than expected.
Refer to Appendix G – ―Increased Cost Estimates‖, and Appendix H – ―Benefits Lower
Than Expected‖, for the scenario calculations.
Table 3-12 IRR Calculations
Scenario Description IRR
Expected Costs and Benefits Includes expected costs and benefits. Ongoing
support costs 20% of software purchase price.
240%
Increased Cost Estimates Cost of software, implementation and ongoing
support higher by 25%
131%
Benefits Lower Than
Expected
Benefits realized are 75% of expected benefit 159%
Source: Lloyd Bauer, 2011.
When evaluating alternatives to come up with a final recommendation the
sensitivity of the scoring to a change in the weighting was also analyzed. The risk of
disruption to business operations is an important consideration. This risk was an element
of the ―Business Viability‖ scoring criteria. Changing the ―Business Viability‖ weighting
from 20% o 50% revealed the results shown in Table 3-13. The recommended Option 4
– Replace System (Procurement First) still received the highest overall scoring. The

56
second highest score did switch from Option 5 – Replace System In-house (ERP), to
Option 3 – Replace System (Accounting Only). This is due to the increased business
disruption of replacing both the procurement and financial accounting functions both
within a short period of time in Option 5.
Table 3-13 Sensitivity Analysis - Business Viability 50%
Option Business
Needs Score Weighting
Weighted Score
Risk Management
Score Weighting
Weighted Score
Option 1
1 15% 0.15 2 15% 0.3
Option 2
2 15% 0.3 1 15% 0.15
Option 3
4 15% 0.6 5 15% 0.75
Option 4
5 15% 0.75 4 15% 0.6
Option 5
5 15% 0.75 3 15% 0.45
Option Viability
Score Weighting
Weighted Score
Cost/ Benefit Score
Weighting Weighted
Score TOTAL
Option 1
5 50% 2.5 3 20% 0.6 3.55
Option 2
3 50% 1.5 2 20% 0.4 2.35
Option 3
5 50% 2.5 1 20% 0.2 4.05
Option 4
5 50% 2.5 5 20% 1 4.85
Option 5
4 50% 2 4 20% 0.8 4
Source: Lloyd Bauer, 2011.

57
When considering the options that require the acquisition of products and services it is important
to consider the impact related to corporate social responsibility. In the following section 3.5, I
will discuss corporate social responsibility related to fair purchasing practices and protection of
private information. Since all three of the leading options require financial ERP software, I will
follow the corporate social responsibility section with a scan of the external financial software
industry in section 4.
3.5 Corporate Social Responsibility
To ensure Corporate Social Responsibility (CSR), it will be important to
underscore two areas in particular. The first is to ensure fair and equitable vendor
selection process. The second is to ensure appropriate measures are taken to address the
protection of personal information.
The fair and equitable vendor selection relates to the process by which a final
solution and the associated contract is provisioned. Adhering to a rigorous request for
proposal (RFP) process will ensure companies with potential solution options all have the
same information, terms and conditions to provide equality of the proposal process. To
ensure equity during the proposal evaluation process it will be important to define
evaluation and scoring criteria upfront. The final vendor solution decision will be based
on a defendable and transparent scoring result.
The second area of CSR is addressing the protection of personal information.
Computer technology has been increasingly trending towards ―software as a service‖,
where computer systems are provided and operated by third party companies using secure
access over the Internet. In order to access the most efficient, cost effective, high
58
performance online services, one often finds service offerings outside of Canada, and
often residing in the United States.
In 2001, the United States introduced the US Patriot Act, officially known as the
―Public Law 107-56 - Uniting and Strengthening America by Providing Appropriate
Tools Required to Intercept and Obstruct Terrorism (USA PATRIOT ACT) Act of
2001‖. This act increases the ability of US law enforcement agencies to search
telephone, e-mail communications, medical, financial, and other records, without the
owner‘s or the occupant‘s permission or knowledge.
In practical terms, the impact of this ACT means if a Canadian company engaged
a US based company to provide computing services, the US Government has the legal
right to request the US company to hand over information on systems they are operating
for the Canadian company. This could be done without the Canadian company‘s
approval or knowledge.
In British Columbia, under the office of the Information and Privacy
Commissioner, the BC Provincial Government legislated the Freedom of Information and
Protection of Privacy Act (FOIPP Act). The FOIPP Act covers all provincial government
public bodies, including government ministries and most government agencies, boards,
commissions and Crown corporations. The Act has two main purposes, the first, to make
public bodies more open and accountable, and the second, to protect citizens‘ right to
personal privacy by prohibiting unauthorized collection, use or disclosure of personal
information by public bodies. Personal information is recorded information about an
identifiable individual. Personal information includes such things as an individual's name,
address, birth date, e-mail address and phone number.

59
Before entering into a SaaS solution with a provider it will be important to engage
in political and legal risk analysis, and continue to monitor for changes on an ongoing
basis.
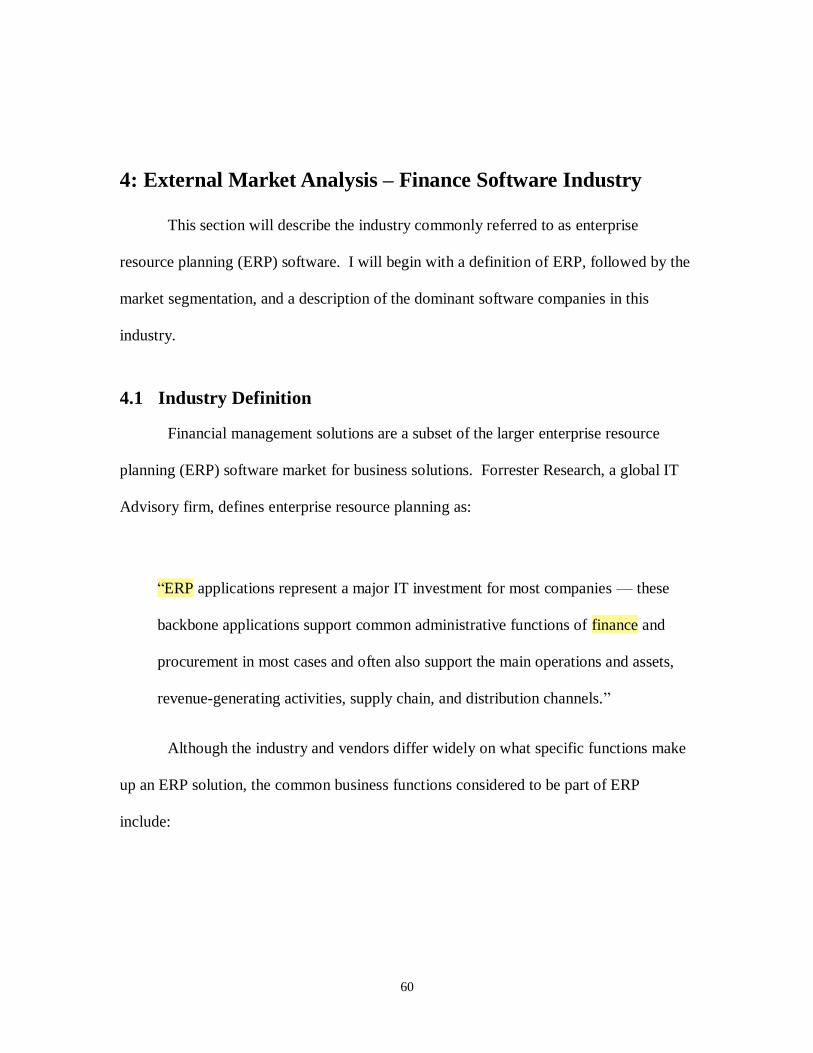
60
4: External Market Analysis – Finance Software Industry
This section will describe the industry commonly referred to as enterprise
resource planning (ERP) software. I will begin with a definition of ERP, followed by the
market segmentation, and a description of the dominant software companies in this
industry.
4.1 Industry Definition
Financial management solutions are a subset of the larger enterprise resource
planning (ERP) software market for business solutions. Forrester Research, a global IT
Advisory firm, defines enterprise resource planning as:
―ERP applications represent a major IT investment for most companies — these
backbone applications support common administrative functions of finance and
procurement in most cases and often also support the main operations and assets,
revenue-generating activities, supply chain, and distribution channels.‖
Although the industry and vendors differ widely on what specific functions make
up an ERP solution, the common business functions considered to be part of ERP
include:

61
Figure 4-1 ERP Functional Areas
Source: Forrester Research, Inc.
I will focus on the business requirements for ERP functions and the associated
software industry market.
4.2 Market Segmentation
Forrester Research estimated the worldwide ERP market to be $43.5 Billion in
2008. This is primarily made up of license revenues, maintenance revenues and
professional services. Oracle and SAP are the market leaders in terms of revenue,
together representing the majority of ERP market share. The following figure shows the
worldwide market share of leading ERP companies.
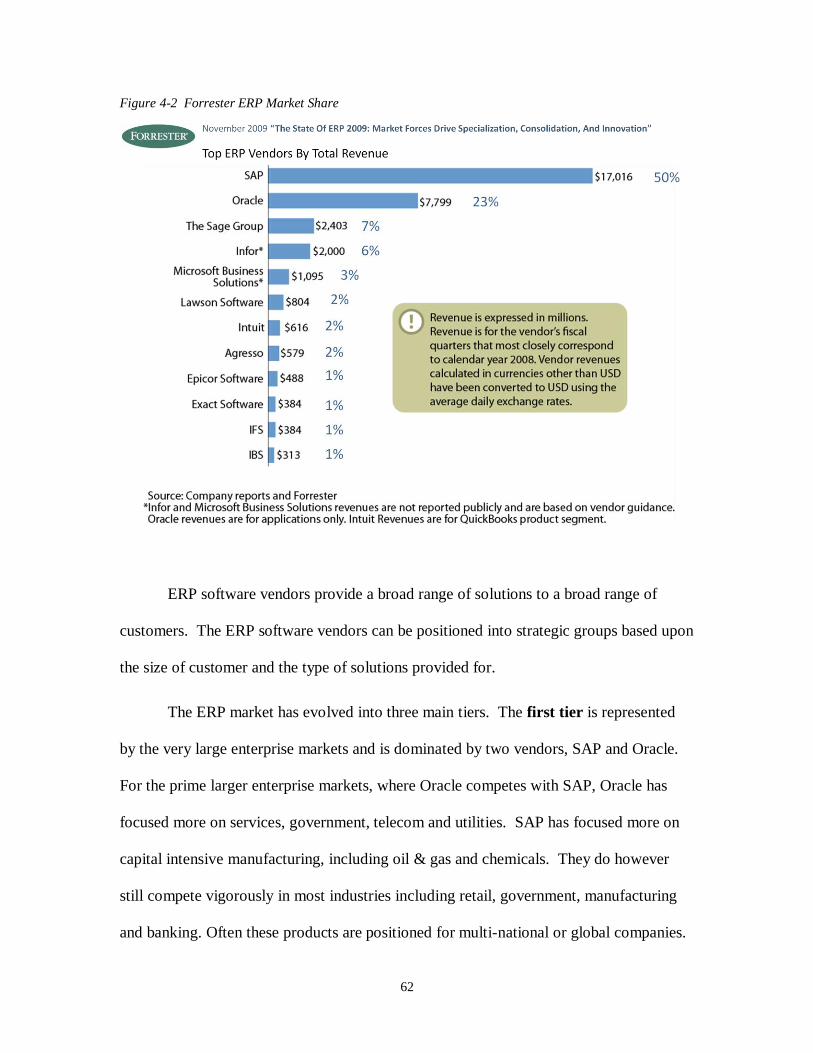
62
Figure 4-2 Forrester ERP Market Share
ERP software vendors provide a broad range of solutions to a broad range of
customers. The ERP software vendors can be positioned into strategic groups based upon
the size of customer and the type of solutions provided for.
The ERP market has evolved into three main tiers. The first tier is represented
by the very large enterprise markets and is dominated by two vendors, SAP and Oracle.
For the prime larger enterprise markets, where Oracle competes with SAP, Oracle has
focused more on services, government, telecom and utilities. SAP has focused more on
capital intensive manufacturing, including oil & gas and chemicals. They do however
still compete vigorously in most industries including retail, government, manufacturing
and banking. Often these products are positioned for multi-national or global companies.
63
The first tier is considered for those companies with revenues exceeding $1 Billion
annually, and over 1,000 employees. Both SAP and Oracle also have distinct product
offerings targeted a mid-sized companies.
The second tier is made of mid-size vendors providing solutions to the mid to
large company market. These vendors tend to provide more specific industry
functionality. Companies in this tier include Infor, Lawson, Microsoft, Sage, and Epicor.
Gartner defines customers in the mid-market segment as those with between 100 and 999
employees and revenues between $50 million to $1 Billion in revenue.
The third tier includes vendors that cater to the small business market, or those
that are very industry specific. Examples of companies in this tier include Intuit, the
makers of the QuickBooks accounting software product for small businesses, and IBS,
who specialise in the distribution resource management market.
The following figure 4-3 illustrates the industry mapping of the three product tiers
to customer revenue and number of employees.

64
Figure 4-3 Strategic ERP Product Tiers
Source: Forrester Research, 2011.
For this report, I will be focusing on the mid and top tier product vendors and
solutions. In 2009 The Head Office and its operating companies had revenues of $1.18
billion, and approximately 6,500 employees. Referring to Gartner‘s definition of mid-
market companies, this places The company at the top end of second tier products, and at
the bottom end of tier one products.
Gartner created their magic quadrant in December 2010 for ERP Mid-market
companies. Gartner placed Microsoft Dynamics AX and SAP‘s Business All-in-One
products in the upper leader-visionary quadrant.
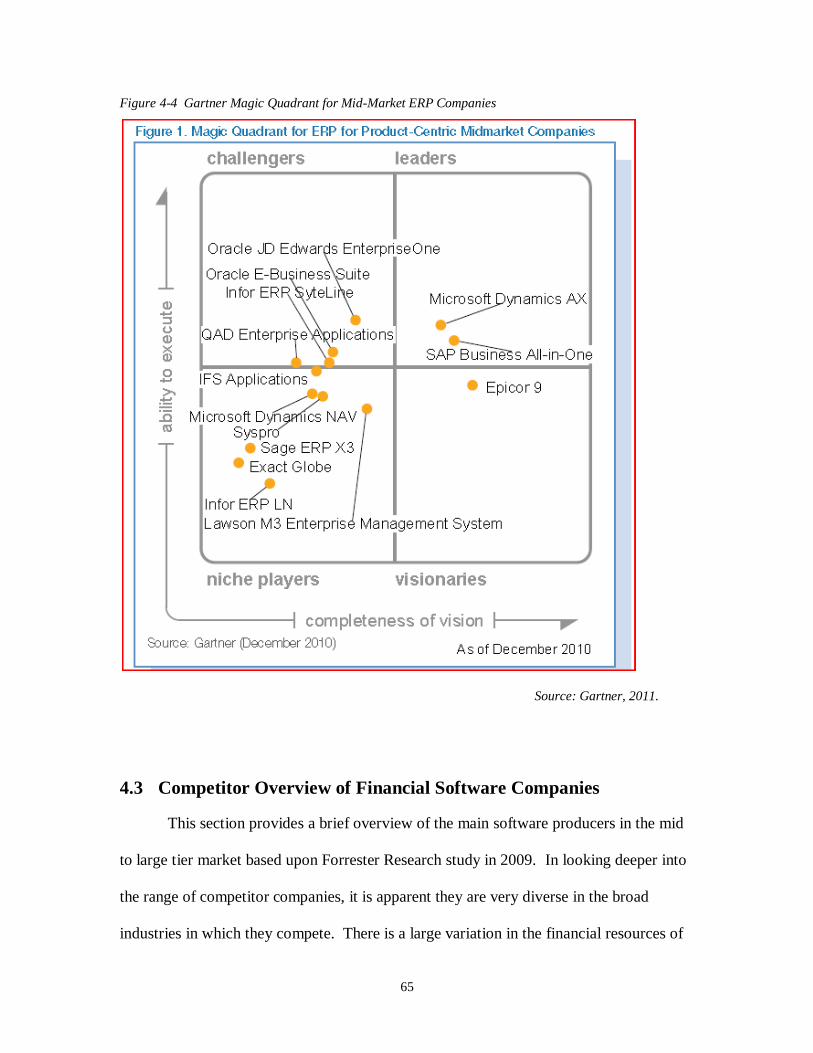
65
Figure 4-4 Gartner Magic Quadrant for Mid-Market ERP Companies
Source: Gartner, 2011.
4.3 Competitor Overview of Financial Software Companies
This section provides a brief overview of the main software producers in the mid
to large tier market based upon Forrester Research study in 2009. In looking deeper into
the range of competitor companies, it is apparent they are very diverse in the broad
industries in which they compete. There is a large variation in the financial resources of

66
the companies. The main ERP software producers along with their categorization are
described below:
Oracle – Top tier
SAP – Top tier
Epicor – middle tier
Infor - middle tier
Lawson – middle tier, ―Intentia‖
Microsoft- middle tier
Sage Group- middle tier
Unit 4 (Agresso) – middle tier
4.3.1 Oracle
Website: http://www.oracle.com/us/solutions/financial-management/index.html
Oracle is the world‘s largest enterprise software company2. Oracle‘s Enterprise
Resource Planning (ERP) applications are used to automate and integrate a variety
business processes, including: supply chain planning, manufacturing, logistics, order
fulfillment, asset lifecycle management, purchasing, accounts receivable and payable,
general ledger, cash and treasury management, travel and expense management, human
resources, payroll, benefits, and talent management.
Oracle began business operation in 1977.
2 Oracle 2010 annual report

67
As of May 31, 2010, Oracle employed approximately 105,000 full-time
employees.
Revenue for year ending May 31, 2010 = $26.8 billion3 US ($20.6 Billion of
which is software related)
Net income $6.1 Billion for year ending May 31, 2010.
In 2010, software represented 77% of Oracle‘s total revenue.
Oracle has four main product lines for the category of financial management:
Oracle E-Business Suite Financials
JD Edwards EnterpriseOne Financial Management
Oracle Fusion Financials
Peoplesoft Enterprise Financials
Of these four product lines, Oracle states its mid-size company solutions to be the
Oracle E-Business Suite financials, the ―JD Edwards EnterpriseOne Financials‖ or the
―Peoplesoft Enterprise Financials‖4. The JD Edwards EnterpriseOne Financials product
is designed to help companies respond to changing environments. It is targeted at the key
industries of Engineering and Construction, Consumer Goods, Manufacturing and
Distribution, Energy, Natural Resources, and Real Estate. The Peoplesoft Enterprise
Financials product is designed to automate, centralize and standardize global transaction
processes. This is often through a shared services arrangement. The key industries for
the PeopleSoft Enterprise Financials product includes Education and Research, Financial
Services, HealthCare, professional Services, and Public Sector.
3 Oracle 2010 annual report, page 90 4 Oracle Website

68
The E-Business Suite is positioned to operate as a shared service across
businesses and regions. The key industries include Aerospace and Defense,
Communications, Financial Services, Healthcare, High Technology, Industrial
Manufacturing, Media and entertainment, Oil and Gas, Public sector, Retail and Utilities.
Oracle also has an On-Demand product based on their E-Business Suite product
line. On-Demand is Oracle‘s software and hardware management and maintenance
services for customers. The service is hosted at Oracle‘s data centre facilities, or selected
partner data centres.
Product Consideration:
The Oracle products positioned for mid-sized companies closest to our
requirements include the JD Edwards Financial Management and the Peoplesoft
Financial product. The PeopleSoft Financial product would have integration and support
benefits associated with the currently installed Peoplesoft Human Resource product.
4.3.2 SAP
Website: http://www.sap.com/canada/index.epx
SAP is a global provider of enterprise software applications and support. SAP is
headquartered in Waldorf Germany. Following is the company statistics:
SAP acquired Business Objects in 2007 and Sybase in 2010.
Revenue for FY 2010 = 12.4 Billion Euros
Operating Profit (IFRS) FY 2010 = 2.6 billion Euros

69
Number of employees globally = 53,513 as of Dec 31, 2010. (14,783 in the
Americas)
SAP has enterprise software solutions in Finance, Human Resources, Information
Technology, Sustainability, Product Development, Procurement, Supply Chain,
Manufacturing, Sales, Marketing, and Service. SAP‘s flagship financial product is ―SAP
ERP Financials‖. It offers core accounting and reporting capability, financial supply
chain management, and treasury functionality. SAP is generally considered a top tier
product for very large enterprises. SAP does however offer business management
solutions for small to medium sized businesses. They offer three solutions in the small to
medium sized business category:
SAP Business One – for companies with 10 – 100 employees
SAP Business By Design – for companies with 100 – 500 employees, this is a
SaaS deployment offering but is not currently available in Canada. (available in
US, Germany, France, UK, China, India)
SAP Business All in One – for companies with 100- 2500 employees, on-premise
solution with an option for hosting
Product Consideration:
Utilizing SAP‘s Best Fit Solution Advisor tool which considers several factors
including company size, growth projections, operational goals and deployment
preferences, our requirements lead to a recommendation of the SAP ―Business All in
One‖ solution as the best fit of the three SAP options. This basic assessment would
require more analysis to be verified.

70
4.3.3 Epicor
Website: http://www.epicor.com/pages/default.aspx
Epicor is a publicly traded company specializing in business software solutions.
They provide integrated enterprise resource planning, customer relationship management,
supply chain management, human capital management, and enterprise retail software
solutions. Their flagship ERP product is called ―Epicor 9‖. Epicor offers both an in-
house software package and a SaaS offering. Both products are built using a second
generation Service Oriented Architecture (SOA) and Web 2.0 technologies. The SaaS
product is delivered exclusively by Epicor, although they are also aligned with Microsoft
to provide a cloud ERP offering. The SaaS product offering is specifically targeted at
small manufacturing companies. Following is the company statistics:
Founded : 1984
Revenue: $440.3 million (FY 2010)
Employees : 2,800
Headquarters: Irvine, California, USA
Customers: 20,000+
Countries operating: over 150 countries
Product Consideration:
Epicor‘s close alignment with Microsoft products provides integration and support
benefits due to the Microsoft standard operating system and office software that is

71
standard within the company. The ERP product called ―Epicor 9‖, either as an in-house
software package or SaaS offering should be considered.
4.3.4 Infor Global Solutions
Website: http://www.infor.com/solutions/fms/
Infor is a privately held software company. Infor acquired Baan in 2006. Infor‘s
flagship product is called Infor ERP LN and their financial management product is called
Infor FMS. Infor claims to have more than 20,000 customers in over 180 countries for its
Info FMS product.5 Infor offers products for both on-premise and SaaS solutions.
Following is the company statistics:
Revenue: $1.8 Billion USD in FY 2010.
Employees : 8,000
Direct offices in 30 countries
Implementation and support in over 100 countries
Headquarters: Alpharetta, Georgia, USA
Founded: 2002
Customers: 70,000+
Global company: Americas, Asia Pacific, Europe, Middle East, Africa
Infor Financial solutions include the following business functions:
Financial Accounting
5 Infor Website
72
Project Accounting
Banking Solutions
Expense Management
Infor‘s financial accounting solutions include the following specific functions:
General Ledger
Accounts Receivable - credit, cash, and customer management
Accounts Payable - payables processing, invoicing, processing payments, and
integration with purchasing and financial systems.
Purchasing
Inventory - inventory operations, warehouse management
Fixed Assets - tracking and maintenance of information needed for financial and
tax accounting, property control, and depreciation forecasting
Product Consideration:
Infor‘s enterprise asset management product is currently installed and operating within
the company. The integration between financial accounting, procurement and the current
asset management product may have benefits of integration and support. The Infor
product called Infor FMS, within their Infor ERP LN line, should be considered either as
an in-house software package or SaaS offering.
4.3.5 Lawson
Website: http://www.lawson.com/

73
Lawson is an international ERP software company. Their flagship product is
called Lawson M3. They have a long history in the manufacturing and distribution
markets. Recently they have also been targeting the fashion and textile, food and
beverage, and equipment service and rental industries. Following is the company
statistics:
Headquarters: Minneapolis, Minnesota, USA
Publicly traded company
Revenue: $750 Million US in 2007
Customers: 4,000 in 33 countries
Employees 3,800
Product Consideration:
Lawson is a significant company in the mid-size ERP market with their product called
Lawson M3. The product should be considered as an in-house software package
solution.
4.3.6 Sage
Website: http://www.sageproerp.com/products/accounting/
Sage is a global enterprise software company. AMR Research reported that Sage
was the world‘s third largest supplier of ERP software, and the largest supplier to small
business. Following is the company statistics:
Headquarters: Newcastle, UK
Customers: 6.1 Million

74
Offices in 24 countries and products & services in 160 countries
Publicly traded company on the London Stock Exchange
Founded: 1981
Revenue: 1.44 Billion British Pounds in 2009
Profit: 190 Million British Pounds in 2009
Employees: 13,400 (in 2010)
Product Consideration:
Sage is a significant company in the mid-size ERP market with their product called Sage
ERP. The Sage ERP X3 and Sage ERP Accpac products should be considered as in-
house software package solutions.
4.3.7 Microsoft Dynamics
Website: http://www.microsoft.com/en-us/dynamics/compare.aspx
Microsoft offers an ERP product called Dynamics. The core functionality
includes financial management, supply chain management, HR Management,
Collaboration, Business Intelligence, and Project Management. Microsoft Dynamics is
offered in 4 product Lines:
Microsoft Dynamics AX – for mid-size and larger organizations, and multinationals
Microsoft Dynamics GP – basic financial and operations product
Microsoft Dynamics NAV – suited for subsidiaries of global organizations
Microsoft Dynamics SL – specialized vertical industries

75
Product Consideration:
Using Microsoft‘s online product selector tool, and questions related to our
industry, the country we operate in, and the number of employees, the tool directed us
towards Microsoft Dynamics GP out of the 4 product lines. The requirement for multi-
company functionality, and multi-currency would be factors in considering the Microsoft
Dynamics AX product as a possible alternative as well. This basic assessment would
require more analysis for verification. The close alignment with other Microsoft products
provides integration and support benefits due to the Microsoft standard operating system
and office software that is standard within the company today.
4.3.8 Unit 4 Business Software – previously Agresso
Website: http://www.unit4software.com/
UNIT4 Business Software is a Dutch software company with their head office in
Sliedrecht, Netherlands. It has subsidiaries and offices in 24 countries across Europe,
North America, the Asia-Pacific region and Africa. Unit4 claims to be one of the top
five providers of enterprise resource planning (ERP) solutions for mid-market
professional services and public sector organizations around the world. In 2008, IDC
ranked Unit4 as a top six ERP vendor in the mid-market segment. Following is the
company statistics:
Original company was founded in 1980
Revenues in 2009 - $517 Million US
Employees – over 4,100 employees

76
Customers – 6,000 customers
Deployments – over 10,000 software deployments
Users – 1.8 Million users of their software products
Countries - 100
Unit4‘s main products are the ―Agresso Business World ERP suite‖ and the
―Coda Financials accounting software‖. The Coda Financials accounting software is a
separate operating entity within Unit4, and is a lower tier product. The Coda software
product is targeted at the small business market, and therefore not suitable for large or
mid-size companies. In 2000, Unit4 merged with Agresso Group, and the company name
has since been changed to Unit4 Business Software.
The Unit4 software ―Business World ERP suite‖ is a fully integrated ERP
product. The ERP suite includes: financial management, human resources and payroll,
procurement management, project costing and billing, reporting and analytics, business
process automation, field services and asset maintenance, and customer relationship
management (CRM).
The product can be roughly sized to the target market based on the number of full
time employees, and the size of the revenue or operating budget. The company has
indicated the product is suited for a company size of between 200 to 250 employees, with
an upper range of 10,000 employees. In terms of revenue, the product is suited for
companies over $50 Million per year up to $1 Billion per year.
77
Product Consideration:
Unit4 is a significant company in the mid-size ERP market with their product called
―Agresso Business World ERP suite‖. The Unit4 product should be considered as an in-
house software package solution.
4.4 Summary of Financial Software Companies
Our high level functional requirements and company size places us in the zone for
products suited for the upper mid-tier ERP market. A cursory market scan revealed the
following product offerings best suited for further consideration.
Oracle - JD Edwards Financial Management and the Peoplesoft Financial
product.
SAP - SAP ―Business All in One‖ product
Epicor - Epicor 9 ERP product
Infor - Infor FMS, within their Infor ERP LN line
Lawson - Lawson M3 product
Microsoft- Microsoft Dynamics GP and the Microsoft Dynamics AX product
Sage Group- Sage ERP X3 and Sage ERP Adccpac products
Unit 4 (Agresso) - Agresso Business World ERP suite
In order to refine the specific product selection, detailed requirement
specifications need to be complied and a request for proposals (RFP) prepared. The
results of the evaluation of the RFP submissions would point to a specific product and
vendor solution based upon the proposals received.
78
4.5 Software As A Service - Alternative
Many of the vendor products identified are based on a purchase and install of the
software in-house. Some however offer hosted solutions. Although quite new in the
marketplace, there is an increase in considering hosted Software As A Service (SaaS) as
the delivery method for ERP implementations. A study by the Aberdeen Group in June
2010 indicated there was a‖ 70% increase in the percentage of respondents willing to
consider SaaS as a delivery method. At the same time, the willingness to consider other
options has decreased or remained about the same.‖6 Two of the common barriers to
entry of implementing ERP solutions is the effort to implement and the upfront cost. The
promise of SaaS solutions is to reduce both those barriers of entry. A key issue
associated with SaaS offerings for Canadian companies is the regulatory environment
regarding the protection of privacy. Most SaaS offerings are hosted in the US, where the
Patriot Act has broad implications related to Canadian, and in particular, British
Columbia privacy laws.
When looking at solutions, it will be important to consider the option of a hosted
SaaS solution when going to the market for solution proposals.
6 Aberdeen Group, ―Epicor Express Aims to Take ERP Mainstream‖, June 2010

79
5: Recommendation and Conclusion
After analyzing the current situation, identifying solution options, evaluating the
alternatives, and conducting external market analysis, the solution option with the top
score was Option 4. The Option 4 solution replaces the current financial system and
replaces it with a combined procurement and finance accounting solution using a phased
approach. The solution would replace the systems currently in operation at the Head
Office, Bus Company, and Rail Company, with one enterprise wide system. The
preceding analysis determined the largest benefit opportunity was in the area of
procurement and supply chain management. Addressing both the procurement and the
core accounting functions provided the greatest overall benefit to the organization.
The specific software vendor solution requires detailed requirements analysis and
formal vendor proposals to arrive at a specific vendor solution. I recommend the
following approach for the next steps. These steps will take the organization to a
successful implementation of the required changes to achieve the expected business
objectives and benefits.
Gather detailed requirements, specifications, and scope in preparation for
tendering a request for proposals to the market.
Issue a request for proposals to obtain quotations for the implementation
of a Procurement solution. Include both the software purchase and
Software-as-a-Service solution options.

80
Conduct a gap analysis and evaluation of the proposals to determine the
best solution to address the business problem and opportunities.
Define detailed business rules, processes and future state model.
Design, test and implement solution using thorough project and change
management practices.
The project implementation timeline for phase 1 to implement the procurement
solution is shown in the figure 5-1 below. The phase 1 of the project is expected to be
completed in a period of 26 months.
Figure 5-1 Implementation Timeline – Procurement Phase 1
The project includes a second phase to implement the financial accounting solution in
year 3. The second phase would follow the same steps as the procurement solution

81
phase, this time selecting and implementing a financial accounting system. The timing of
the two phases is shown in the figure below.
Figure 5-2 Overall Project Phase Timeline
Source: Lloyd Bauer, 2011.
The above project timelines assume the organizational priority supports
proceeding with a replacement of the finance accounting and procurement systems. If
however, the organizational resource and capital finance capacity is not able to provide
the resources to fund the replacement of the finance and procurement systems in the near
term, then Option 1 – ―Modify Current Systems‖ should be strongly considered. This
option could function as an interim solution for up to 3 years. Modifying the current
system would address the fundamental structural deficiencies and provide the third
highest internal rate of return results, while extending the life of the current finance
system investment.
82
Having analyzed the pain points and opportunities along with the possible
solutions it is apparent there is substantial positive internal rate of return potential. The
answer to the research question of ―Should we replace the financial system?‖, is yes. This
warrants proceeding with the gathering of in-depth requirements, along with new system
investment in addressing the challenges of procurement and financial management across
the organization.

83
Appendices

84
Appendix A – Custom Build Option
A sixth option was considered to custom build a new financial system in-house. The low
overall scoring, combined with a negative IRR removed the option from consideration.
The evaluation is included here for reference only.
Option: Custom build a New System (Financial)
Business Needs: This option would replace the existing financial software solutions with
a new custom built software solution. The solution would be built to address the
structural deficiencies of the current products, and be designed to accommodate a multi-
company business environment. It would be built to the specifications of the Head
Office, Bus Company and Rail Company.
Strong review of this option needs to be considered given the financial requirements of
the enterprise are believed to be quite generic. There is no unique advantage to the
financial system at Head Office, and the requirements could easily be accommodated by
an off the shelf financial package.

85
Table 5-1 Option: Custom Build a New System (Financial)
Source: Lloyd Bauer, 2011.
Project Risk Management: This option has the highest risk associated with successful
implementation and coming in on target for the project budget. There is also an on-going
support risk associated with custom built software, since the software will have been
custom built by a small group of software design and programming experts. Project risk
is high due to the need to form a large project team of analysts and programmers. Good
system documentation will be critical to ensure loss of knowledge should the team
members leave the organization. Extensive testing of the application will be required
since it will not be field proven at other implementations.
Overall Project Risk Management Rating = 2 out of 5
Business Viability: This option gathers the financial business requirements for the
overall company, and then custom builds a system to meet the business requirements. It
is in the best position to meet the business requirements of finance, since it is custom
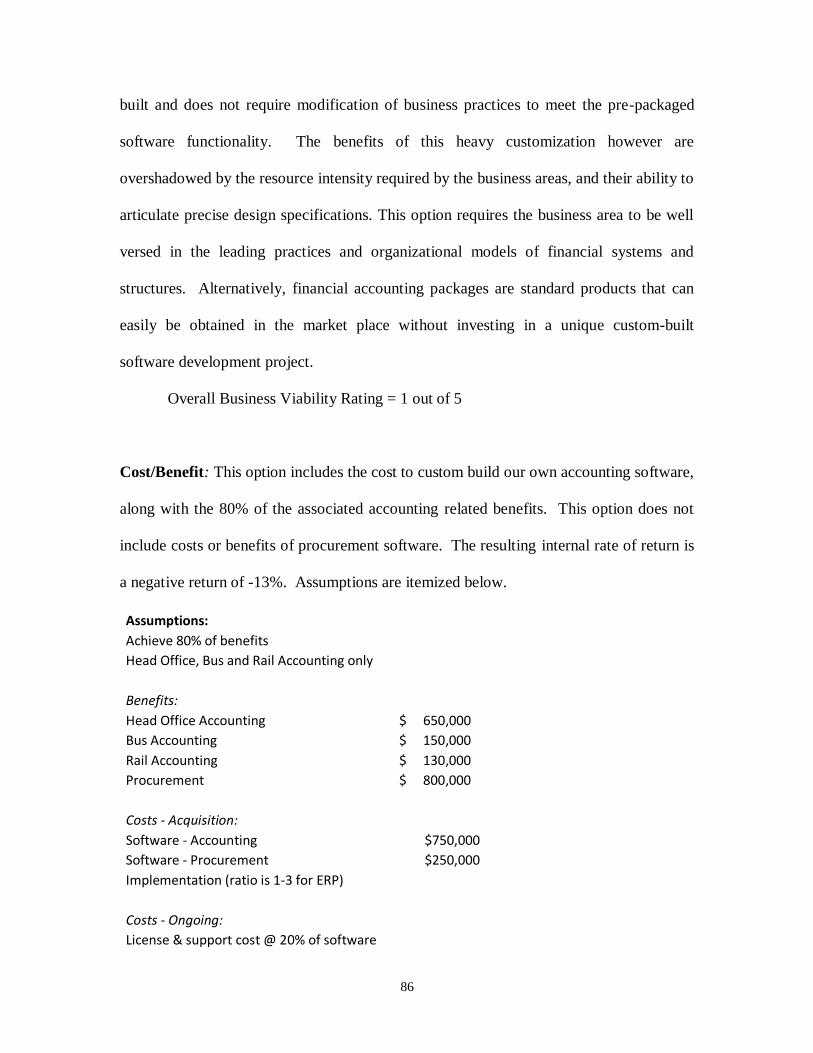
86
built and does not require modification of business practices to meet the pre-packaged
software functionality. The benefits of this heavy customization however are
overshadowed by the resource intensity required by the business areas, and their ability to
articulate precise design specifications. This option requires the business area to be well
versed in the leading practices and organizational models of financial systems and
structures. Alternatively, financial accounting packages are standard products that can
easily be obtained in the market place without investing in a unique custom-built
software development project.
Overall Business Viability Rating = 1 out of 5
Cost/Benefit: This option includes the cost to custom build our own accounting software,
along with the 80% of the associated accounting related benefits. This option does not
include costs or benefits of procurement software. The resulting internal rate of return is
a negative return of -13%. Assumptions are itemized below.
Assumptions: Achieve 80% of benefits Head Office, Bus and Rail Accounting only
Benefits: Head Office Accounting $ 650,000
Bus Accounting $ 150,000
Rail Accounting $ 130,000
Procurement $ 800,000
Costs - Acquisition: Software - Accounting $750,000
Software - Procurement $250,000
Implementation (ratio is 1-3 for ERP)
Costs - Ongoing: License & support cost @ 20% of software
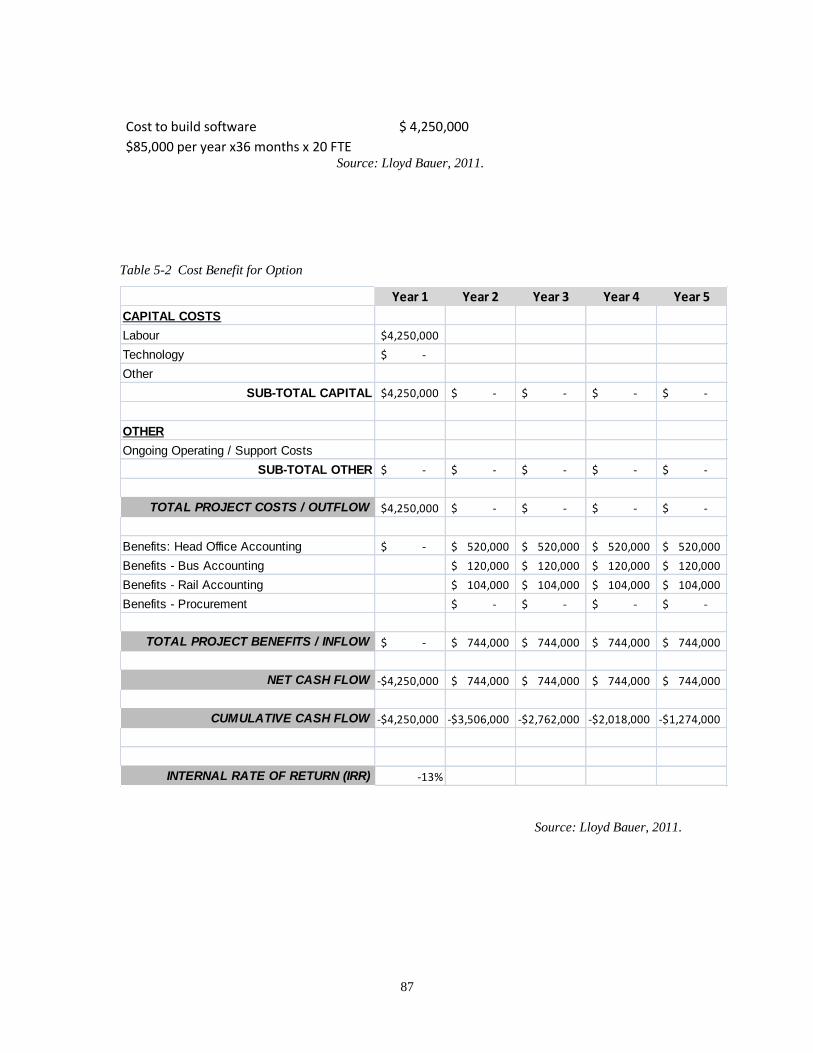
87
Cost to build software $ 4,250,000
$85,000 per year x36 months x 20 FTE Source: Lloyd Bauer, 2011.
Table 5-2 Cost Benefit for Option
Year 1 Year 2 Year 3 Year 4 Year 5
CAPITAL COSTS
Labour 4,250,000$
Technology -$
Other
SUB-TOTAL CAPITAL 4,250,000$ -$ -$ -$ -$
OTHER
Ongoing Operating / Support Costs
SUB-TOTAL OTHER -$ -$ -$ -$ -$
TOTAL PROJECT COSTS / OUTFLOW 4,250,000$ -$ -$ -$ -$
Benefits: Head Office Accounting -$ 520,000$ 520,000$ 520,000$ 520,000$
Benefits - Bus Accounting 120,000$ 120,000$ 120,000$ 120,000$
Benefits - Rail Accounting 104,000$ 104,000$ 104,000$ 104,000$
Benefits - Procurement -$ -$ -$ -$
TOTAL PROJECT BENEFITS / INFLOW -$ 744,000$ 744,000$ 744,000$ 744,000$
NET CASH FLOW 4,250,000-$ 744,000$ 744,000$ 744,000$ 744,000$
CUMULATIVE CASH FLOW 4,250,000-$ 3,506,000-$ 2,762,000-$ 2,018,000-$ 1,274,000-$
INTERNAL RATE OF RETURN (IRR) -13%
Source: Lloyd Bauer, 2011.

88
Appendix B: Option 1 - Cost/Benefit Assumptions
Assumptions:
Achieve 25% of benefits for option 1
Head Office and Bus Accounting only for option 1
Benefits:
Head Office Accounting $ 650,000
Bus Accounting $ 150,000
Rail Accounting na
Procurement na
Costs - Acquisition:
Software - Accounting na
Software - Procurement na
Implementation (ratio is 1-3 for ERP) na
Costs - Ongoing:
License & support cost @ 20% of software
No incremental increase
Cost to Restructure software in option 1 $ 255,000
$85,000 per yr x 6 months x 6 FTE

89
Appendix C: Option 2 - Cost/Benefit Assumptions
Assumptions: Achieve 25% of benefits for option 2 Head Office,Bus and Rail Accounting only for option 2
Benefits: Head Office Accounting $ 650,000
Bus Accounting $ 150,000
Rail Accounting $ 130,000
Procurement na
Costs - Acquisition: Software - Accounting na
Software - Procurement na
Implementation (ratio is 1-3 for ERP) na
Costs - Ongoing:
License & support cost @ 20% of software
No incremental costs
Cost to Restructure software in option 1 $ 453,333
$85,000 per yr x 8months x 8 FTE
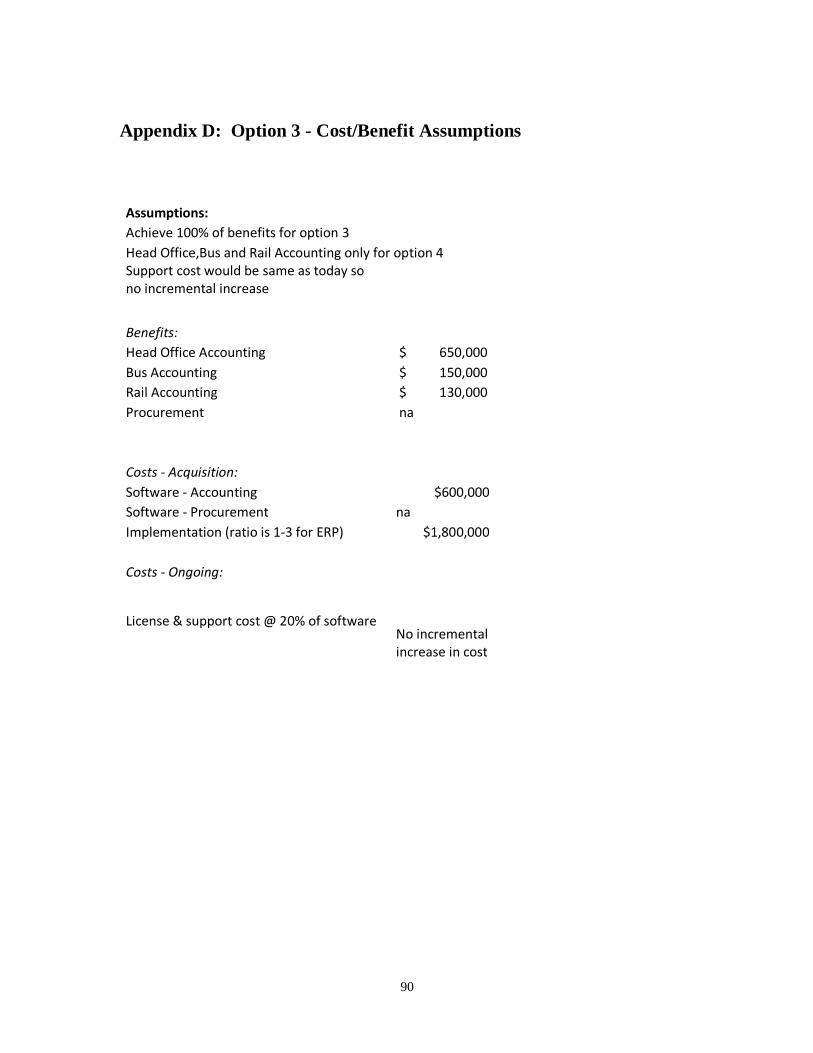
90
Appendix D: Option 3 - Cost/Benefit Assumptions
Assumptions: Achieve 100% of benefits for option 3 Head Office,Bus and Rail Accounting only for option 4
Support cost would be same as today so no incremental increase
Benefits: Head Office Accounting $ 650,000
Bus Accounting $ 150,000
Rail Accounting $ 130,000
Procurement na
Costs - Acquisition: Software - Accounting $600,000
Software - Procurement na
Implementation (ratio is 1-3 for ERP) $1,800,000
Costs - Ongoing:
License & support cost @ 20% of software No incremental increase in cost

91
Appendix E: Option 4 - Cost/Benefit Assumptions
Assumptions: Achieve 100% of benefits for option 4 Procurement implemented in year 1, benefits begin year 2
Accounting implemented in year 3, benefits begin year 4
Benefits: Head Office Accounting $ 650,000
Bus Accounting $ 150,000
Rail Accounting $ 130,000
Procurement $ 4,000,000
Costs - Acquisition: Software - Accounting $600,000
Software - Procurement $250,000
Implementation (ratio 1-4 for separating into 2 phases) $ 3,400,000
Software cost increase by 10% due to separating into 2 phases
Costs - Ongoing: License & support cost @ 20% of
Procurement software $55,000
No incremental support cost for Accounting Software

92
Appendix F: Option 5 - Cost/Benefit Assumptions
Assumptions: Achieve 100% of benefits for option 5
Support cost would increase for procurement portion @ 20% of procurement software
Benefits: Head Office Accounting $ 650,000
Bus Accounting $ 150,000
Rail Accounting $ 130,000
Procurement $ 4,000,000
Costs - Acquisition: Software – Accounting $600,000
Software – Procurement $250,000
Implementation (ratio is 1-3 for ERP) $ 2,550,000
Costs - Ongoing: License & support cost @ 20% of software $50,000
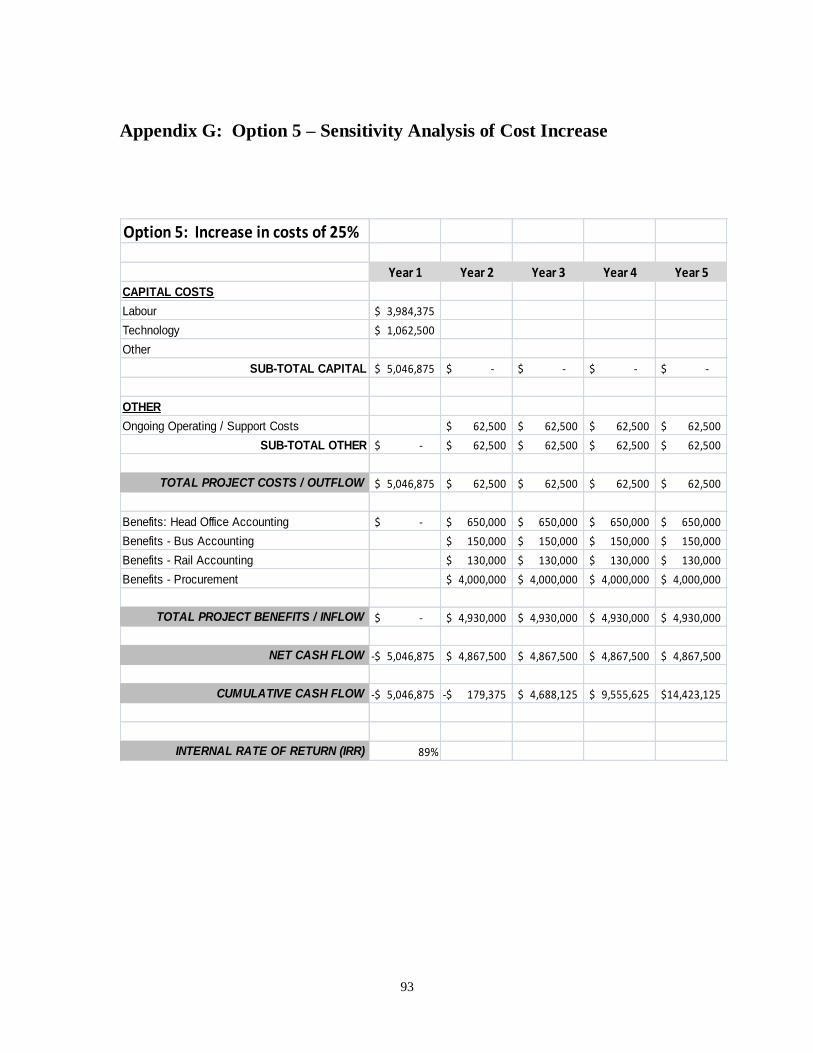
93
Appendix G: Option 5 – Sensitivity Analysis of Cost Increase
Option 5: Increase in costs of 25%
Year 1 Year 2 Year 3 Year 4 Year 5
CAPITAL COSTS
Labour 3,984,375$
Technology 1,062,500$
Other
SUB-TOTAL CAPITAL 5,046,875$ -$ -$ -$ -$
OTHER
Ongoing Operating / Support Costs 62,500$ 62,500$ 62,500$ 62,500$
SUB-TOTAL OTHER -$ 62,500$ 62,500$ 62,500$ 62,500$
TOTAL PROJECT COSTS / OUTFLOW 5,046,875$ 62,500$ 62,500$ 62,500$ 62,500$
Benefits: Head Office Accounting -$ 650,000$ 650,000$ 650,000$ 650,000$
Benefits - Bus Accounting 150,000$ 150,000$ 150,000$ 150,000$
Benefits - Rail Accounting 130,000$ 130,000$ 130,000$ 130,000$
Benefits - Procurement 4,000,000$ 4,000,000$ 4,000,000$ 4,000,000$
TOTAL PROJECT BENEFITS / INFLOW -$ 4,930,000$ 4,930,000$ 4,930,000$ 4,930,000$
NET CASH FLOW 5,046,875-$ 4,867,500$ 4,867,500$ 4,867,500$ 4,867,500$
CUMULATIVE CASH FLOW 5,046,875-$ 179,375-$ 4,688,125$ 9,555,625$ 14,423,125$
INTERNAL RATE OF RETURN (IRR) 89%

94
Appendix H: Option 5 – Sensitivity Analysis of Lower Benefits
Option 5: Benefits Lower by 25%
Year 1 Year 2 Year 3 Year 4 Year 5
CAPITAL COSTS
Labour 2,550,000$
Technology 850,000$
Other
SUB-TOTAL CAPITAL 3,400,000$ -$ -$ -$ -$
OTHER
Ongoing Operating / Support Costs 50,000$ 50,000$ 50,000$ 50,000$
SUB-TOTAL OTHER -$ 50,000$ 50,000$ 50,000$ 50,000$
TOTAL PROJECT COSTS / OUTFLOW 3,400,000$ 50,000$ 50,000$ 50,000$ 50,000$
Benefits: Head Office Accounting -$ 487,500$ 487,500$ 487,500$ 487,500$
Benefits - Bus Accounting 112,500$ 112,500$ 112,500$ 112,500$
Benefits - Rail Accounting 97,500$ 97,500$ 97,500$ 97,500$
Benefits - Procurement 3,000,000$ 3,000,000$ 3,000,000$ 3,000,000$
TOTAL PROJECT BENEFITS / INFLOW -$ 3,697,500$ 3,697,500$ 3,697,500$ 3,697,500$
NET CASH FLOW 3,400,000-$ 3,647,500$ 3,647,500$ 3,647,500$ 3,647,500$
CUMULATIVE CASH FLOW 3,400,000-$ 247,500$ 3,895,000$ 7,542,500$ 11,190,000$
INTERNAL RATE OF RETURN (IRR) 101%
95
Bibliography
Works Cited
Reich, B. (2010). Information Technology and Organizational Transformation – BUS
621, Presented at Simon Fraser University Executive MBA Course, Vancouver, B.C.
Hamerman, P., (2008) ERP Applications 2008: The Battle Goes Vertical. Cambridge,
MA. Forrester Research.
Lawrie, G., (Oct 2010) It‘s Time to Clarify your Global ERP Strategy. Cambridge,
MA. Forrester Research.
Vollmer, K., Lawrie, G., Gilpin, M., (May 2010) It‘s Time to Tame the ERP
Integration Beast. Cambridge, MA. Forrester Research.
Hamerman, P., (Nov 2009) The State of ERP 2009: Market Forces Drive
Specialization, Consolidation, And Innovation. Cambridge, MA. Forrester Research.
Hamerman, P., (Dec 2009) Trends 2010: ERP Applications. Cambridge, MA.
Forrester Research.

96
Hamerman, P., (Jan 2011) Trends 2011: ERP Customers Demand Better Flexibility,
Cost Transparency, And Mobility. Cambridge, MA. Forrester Research.
Bartels, A., Herbert, L., (Jan 2011) Which Software Markets Will SaaS Disrupt?.
Cambridge, MA. Forrester Research.
Hestermann, C, Pang, C., Montgomery, N., (December 2010) Magic Quadrant for ERP For
Product-Centric Mid-Market Companies. Stamford, Connecticut, U.S.A., Gartner Inc.
Castellina, N., Jutras, C., (June 2010) Epicor Express Aims to Take ERP Mainstream.
Boston, MA. Aberdeen Group.
Higgins, R., (2009) Analysis for Financial Management. McGraw-Hill Irwin. New York,
New York.
Pearlson, K., Saunders, C., (2010) Managing and Using Information Systems - A Strategic
Approach. John Wiley & Sons, Inc. Hoboken, NY.
Interviews
Chief Financial Officer – Head Office
Accounting Manager – Head Office
Finance Manager – Bus Company
Finance Manager – Rail Company

97
Procurement Manager – Head Office
Enterprise Systems Technical Support Manager – Head Office
Websites Reviewed
Oracle: Website: http://www.oracle.com/us/solutions/financial-management/index.html
SAP: Website: http://www.sap.com/canada/index.epx
Epicor: Website: http://www.epicor.com/pages/default.aspx
Infor global solutions: Website: http://www.infor.com/solutions/fms/
Lawson: Website: http://www.lawson.com/
Sage: Website: http://www.sageproerp.com/products/accounting/
Microsoft: Website: http://www.microsoft.com/en-us/dynamics/compare.aspx
Unit 4 Business software: Website: http://www.unit4software.com/

98
_______________________________________________