strategic distribution platform support of conus army units
TRANSCRIPT

For More InformationVisit RAND at www.rand.org
Explore the RAND Arroyo Center
View document details
Support RANDPurchase this document
Browse Reports & Bookstore
Make a charitable contribution
Limited Electronic Distribution RightsThis document and trademark(s) contained herein are protected by law as indicated in a notice appearing later in this work. This electronic representation of RAND intellectual property is provided for non-commercial use only. Unauthorized posting of RAND electronic documents to a non-RAND website is prohibited. RAND electronic documents are protected under copyright law. Permission is required from RAND to reproduce, or reuse in another form, any of our research documents for commercial use. For information on reprint and linking permissions, please see RAND Permissions.
Skip all front matter: Jump to Page 16
The RAND Corporation is a nonprofit institution that helps improve policy and decisionmaking through research and analysis.
This electronic document was made available from www.rand.org as a public service of the RAND Corporation.
CHILDREN AND FAMILIES
EDUCATION AND THE ARTS
ENERGY AND ENVIRONMENT
HEALTH AND HEALTH CARE
INFRASTRUCTURE AND TRANSPORTATION
INTERNATIONAL AFFAIRS
LAW AND BUSINESS
NATIONAL SECURITY
POPULATION AND AGING
PUBLIC SAFETY
SCIENCE AND TECHNOLOGY
TERRORISM AND HOMELAND SECURITY
This product is part of the RAND Corporation documented briefing series. RAND
documented briefings are based on research briefed to a client, sponsor, or targeted au-
dience and provide additional information on a specific topic. Although documented
briefings have been peer reviewed, they are not expected to be comprehensive and may
present preliminary findings.

Strategic Distribution Platform Support of CONUS Army Units
Marc Robbins
Prepared for the United States Army
Approved for public release; distribution unlimited
ARROYO CENTER
The RAND Corporation is a nonprofit institution that helps improve policy and decisionmaking through research and analysis. RAND’s publications do not necessarily reflect the opinions of its research clients and sponsors.
R® is a registered trademark.
© Copyright 2011 RAND Corporation
Permission is given to duplicate this document for personal use only, as long as it is unaltered and complete. Copies may not be duplicated for commercial purposes. Unauthorized posting of RAND documents to a non-RAND website is prohibited. RAND documents are protected under copyright law. For information on reprint and linking permissions, please visit the RAND permissions page (http://www.rand.org/publications/ permissions.html).
Published 2011 by the RAND Corporation1776 Main Street, P.O. Box 2138, Santa Monica, CA 90407-2138
1200 South Hayes Street, Arlington, VA 22202-50504570 Fifth Avenue, Suite 600, Pittsburgh, PA 15213-2665
RAND URL: http://www.rand.orgTo order RAND documents or to obtain additional information, contact
Distribution Services: Telephone: (310) 451-7002; Fax: (310) 451-6915; Email: [email protected]
Library of Congress Cataloging-in-Publication Data
Robbins, Marc L., 1954- Strategic distribution platform support of CONUS Army units / Marc Robbins. p. cm. Includes bibliographical references. ISBN 978-0-8330-5928-4 (pbk. : alk. paper) 1. United States. Army—Transportation. 2. Military trucks—United States. 3. Logistics—United States. 4. Physical distribution of goods—Management. I. Title.
UC273.R63 2011 355.80973—dc23
2011045964
The research described in this report was sponsored by the United States Army under Contract No. W74V8H-06-C-0001.

- iii -
Preface
Home station units depend upon a reliable distribution system to provide them the supplies they need to train and prepare for possible deployments. Most of the focus of concern in the past decade has been on how forces deployed to theaters of combat operation have been supported by the global distribution system—understandably, for an Army engaged in two wars. But with forces returning home from Iraq, and with a drawdown anticipated to begin in Afghanistan after July 2011, along with repositioning of forces in Europe and Korea to the continental United States (CONUS) as part of the Integrated Global Presence and Basing Strategy (IGPBS), support to Army forces in CONUS will be of increasing concern. In addition, as contingencies wind down, budgetary concerns are likely to be of increasing importance. The Department of Defense (DoD), and the Army, will be under increasing pressure to do more with less and will require a distribution system that helps maintain readiness and supports training goals with timely delivery of needed supplies, and does so at the lowest cost possible.
The Deputy Chief of Staff of the Army for logistics tasked RAND Arroyo Center to investigate ongoing trends in distribution support to the Army, with particular focus on CONUS units, and to report on emerging issues and opportunities. This documented briefing focuses on one key element of that support: the performance of the scheduled truck network that has been a keystone of support to Army forces in CONUS. It is a revised version of a briefing given to a group of senior Army and DoD logistics leaders at RAND Arroyo Center’s annual “Logistics Day” on September 21, 2010.
This research was sponsored by the Deputy Chief of Staff for Logistics, Headquarters, Department of the Army, and conducted within RAND Arroyo Center’s Military Logistics Program. RAND Arroyo Center, part of the RAND Corporation, is a federally funded research and development center sponsored by the United States Army.
- iv -
The Project Unique Identification Code (PUIC) for the project that produced this document is RAND10483. Questions or comments can be directed to the project leader and author Marc Robbins at [email protected] or by phone at 310/393-0411 extension 7362.
For more information on RAND Arroyo Center, contact the Director of
Operations (telephone 310-393-0411, extension 6419; fax 310-451-6952; email [email protected]), or visit Arroyo’s website at http://www.rand.org/ard.html.

- v -
Contents
Preface ......................................................................................... iii!
Figures ......................................................................................... vii!
Tables .......................................................................................... ix!
Summary ...................................................................................... xi!
Acknowledgments ......................................................................... xix!
Glossary ...................................................................................... xxi!
1. BACKGROUND ..................................................................... 5!
2. FACING FILL AND SCHEDULED TRUCK PERFORMANCE ..... 11!
3. SOURCES OF “LEAKAGE” FROM THE TRUCK NETWORK ..... 19!
4. ISSUES IN SCHEDULED TRUCK PERFORMANCE .................. 29!
5. POTENTIAL ACTIONS FOR STRENGTHENING/ EXPANDING THE TRUCK SYSTEM ....................................... 37!
Appendix: PARTICIPATION IN SCHEDULED TRUCK SERVICE, FY10 .................................................................................... 45!
Bibliography ................................................................................. 55!


- vii -
Figures
S.1. Scheduled Trucks as the Dominant Mode for CONUS Army Customers ................................................................ xiii!
S.2. Cost and Volume Breakout by Mode ...................................... xiv!
S.3. Comparative Responsiveness of Truck and Premium Air Modes by Army Post ...................................................... xvi!


- ix -
Tables
A.1. Percent of SDP Shipped Weight Moved by Truck for Posts with Scheduled Truck Service, FY10 ........................................ 46!
A.2. Major Unit Coverage by Scheduled Truck, FY10 ........................ 48!
A.3. Highest-Volume CONUS Locations with No Scheduled Truck Service .............................................................................. 54!


- xi -
Summary
Home station units depend upon a reliable distribution system to provide the supplies they need to train and prepare for possible deployments. Most of the focus of concern in the past decade has been on how forces deployed to theaters of combat operation have been supported by the global distribution system—understandably, for an Army engaged in two wars. But with forces returning home from Iraq, and with a drawdown anticipated to begin in Afghanistan after July 2011, along with the repositioning of forces in Europe and Korea to the continental United States (CONUS) as part of the Integrated Global Presence and Basing Strategy (IGPBS), support to Army forces in CONUS will be of increasing concern. In addition, as contingencies wind down, budgetary concerns are likely to be of increasing importance. The Department of Defense (DoD), and the Army, will be under increasing pressure to do more with less and will require a distribution system that helps maintain readiness and supports training goals with timely delivery of needed supplies, and does so at the lowest cost possible.
This documented briefing presents results of analysis done as part of an ongoing effort by RAND Arroyo Center to support the Army by identifying opportunities for improvements in the DoD distribution system. Arroyo has been working with the Army and its partners in the DoD global distribution system—including the Defense Logistics Agency (DLA), United States Transportation Command (USTC), and General Services Administration (GSA)—for more than fifteen years in some areas of distribution.
The cornerstone of support to forces in CONUS is the leveraging of Strategic Distribution Platform (SDP) storage via scheduled truck networks. SDPs are the central element of the DLA distribution concept, responsible for most storage of DoD-owned materiel at the wholesale level and replenishment of other DLA distribution depots, including Forward Distribution Points (FDPs) collocated with service repair depots, and Forward Distribution Depots

- xii -
(FDDs) located OCONUS to support deployed forces, especially for heavy, bulky items or where the FDD has a distinct performance advantage.
DLA’s distribution depot network currently features two SDPs at opposite sides of the country, at Susquehanna, Pennsylvania (DDSP) and San Joaquin, California (DDJC). The primary means of support to large-volume CONUS locations from these two SDPs is via scheduled truck.
The scheduled truck network linked to the two SDPs was developed by the Army and DLA (with analytical support from RAND Arroyo Center) under the Army’s Velocity Management initiative in the mid-1990s. This concept has four key elements:
• Maximum support from a customer’s assigned SDP. Customers are assigned to SDPs on a roughly geographical basis, with the Mississippi River as the rough dividing line (though central CONUS customers are sometimes switched between SDPs). DLA and the Army have agreed to the goal that the SDP will be the source for 85 percent of customer demands stocked in DLA depots.
• Leverage high fill rates via scheduled truck. Where volume and distance permit, customers will be supported from their assigned SDP via scheduled truck service, with the economically feasible maximum number of trucks per week. Higher fill rates from the SDP, achieved through better stockage strategies, increase the volume available to go by truck, lowering transportation costs and enabling greater truck frequency.
• Move all priorities via the truck. The new distribution paradigm replaced the previous model based on optimizing individual shipments (e.g., high priority to go by premium air, low priority by slower, cheaper modes). Truck efficiency and effectiveness resulted from lumping all cargo together, no matter its priority or size. Via a “one freight/all freight” concept, all cargo—no matter its size or priority—could achieve premium air-like responsiveness at a fraction of the cost.
• Synchronize movements through multiple stops. Scheduled truck service provides better synchronization and feedback mechanisms. By

- xiii -
building routes for multiple dropoffs, individual units on a post can be served directly by the truck; if schedules are done properly, the truck will arrive at a scheduled time, helping supply units plan operations better. Because the truck is on a schedule, units will be aware when the truck is delayed or does not come at all, and can communicate back to the SDP about problems with the trucking company.
Increasing the proportion of demand filled from a customer’s assigned SDP (the “facing fill” rate) facilitates expansion of scheduled truck usage, as Figure S.1 indicates. It also shows, however, a weakening of that tie in recent years, as the percentage of DDSP/DDJC shipments going via scheduled truck flattened after 2003 even as the facing fill at both SDPs increased. That is, the distribution network was not leveraging improvements in facing fill to reduce cost and improve responsiveness to the maximum extent.
Figure S.1 Scheduled Trucks as the Dominant Mode for CONUS Army Customers

- xiv -
Figure S.2 summarizes the present scale of scheduled truck coverage for major CONUS Army posts. Scheduled trucks dominate the volume moved by weight, accounting for 75 percent of pounds shipped from the two SDPs to these twenty major locations. However, many shipments are not moved via the scheduled truck. One result is an imbalance of costs: nonscheduled truck shipments account for 55 percent of transportation costs from the SDPs to these posts, even as they only account for 25 percent of shipment weight.
Figure S.2 Cost and Volume Breakout by Mode
Use of modes other than scheduled truck can occur for any of three reasons:
• “Facing fill” shortfalls: the demanded item is not issued from the customer’s supporting SDP.

- xv -
• “Leakage”: the supporting SDP issues the item but it does not go on the truck servicing the Army post.
• No truck service: there is no scheduled truck service from the SDP to the Army post.
One consequence of shortfalls in scheduled truck coverage, along with other issues in scheduled truck performance, is less responsiveness to customer needs, especially compared to alternatives like premium air services. Figure S.3 shows, for major Army posts, the difference between average response time (here measured from the time the materiel release order is produced until the shipment arrives at its destination) between premium air and scheduled trucks. Negative numbers indicate that trucks are more responsive, positive numbers that premium air is faster. In some cases, primarily those closest to the SDP, scheduled trucks outperform premium air, but in the majority of the cases they do not, in some cases by a considerable amount.
Strengthening the scheduled truck network will help both reduce costs and increase responsiveness. There are several steps that should be taken by the Army alone and in collaboration with its supply chain partners.
The Army currently has no policy guiding the use of this network. HQDA G-4 should provide such a policy. Since “leakage” from units not participating on an existing truck supporting their home station can increase overall costs and reduce effectiveness for their neighbors, the policy should call for all units on a post with scheduled truck service to receive their shipments via the truck unless an explicit waiver has been granted.
The policy should also call for better monitoring by the Army. The Army should designate a capable agency to develop metrics and produce recurrent reports on the health of the scheduled truck network. This would include facing fill metrics (based on the standard agreed to jointly by the Army and DLA), identification of posts and major locations not on the truck, and the amount of leakage on Army posts from units not participating in the truck network.

- xvi -
Figure S.3 Comparative Responsiveness of Truck and Premium Air Modes by Army Post
The Army should work closely with DLA and, as necessary, with process managers associated with USTC’s Defense Transportation Coordination Initiative (DTCI) to make necessary changes in the truck network.
Strengthening the scheduled truck network falls into both near-term and more ambitious long-term actions.
Near-term actions:
• Add new destinations to existing truck routes. Locations currently not served by trucks but which are located on or near currently existing routes may be added to increase the volume on the route and so reduce cost and/or increase the frequency.

- xvii -
• Add customers not on the truck at posts served by scheduled trucks. The Army needs to work with DLA and USTC to determine the reasons that units are not included on trucks and the process by which their participation is determined.
• Scrutinize reasons for using other shipping modes for customers mainly supported by scheduled trucks. While for most units served by trucks, this is not a significant problem, the Army should still work with DLA to determine the reasons for this type of “low level” leakage and to minimize its occurrence.
• Improve SDP processing times. Getting pulled shipments on the next departing truck should be a focus of DLA process improvement efforts, especially for high-priority requisitions.
These steps would likely have a moderate effect on scheduled truck comprehensiveness and performance. More significant improvements could be achieved by some more far-reaching changes. One might yield much greater volume on individual routes, lowering costs and improving responsiveness, while another could greatly shorten truck route distance, with the same effect.
Longer-term actions:
• Cross-dock non-SDP shipments onto scheduled trucks. In addition to SDP shipments, units receive deliveries via multiple shipping modes from GSA and direct from vendor, as well as other sources. Where feasible, it may be worthwhile to explore the possibility of routing shipments from these sources through the SDP and onto scheduled trucks. Not only could this reduce overall cost from the system point of view, but it would simplify processes for customers who, in the best case, would receive all their orders in a single delivery.
• Build capability of new regional SDPs to support local customers via scheduled trucks. BRAC recommendation-based laws established two new SDPs in central CONUS (Oklahoma City, Oklahoma) and the southeast (Warner-Robins, Georgia). The two are
- xviii -
slated to play less comprehensive roles than DDSP and DDJC, primarily focusing on resupplying Forward Distribution Depots in their regions collocated with service repair depots. If in the future resources were made available to facilitize these two as fully capable SDPs, with a target of 85 percent facing fill for their assigned regional customers, support to customers in their regions could be greatly improved. This would especially benefit central CONUS locations that, as shown in the main text, tend to have less frequent trucks with longer delivery times.

- xix -
Acknowledgments
This research project and RAND Arroyo Center’s continuing work on global distribution has benefited enormously from the strong and incisive support of LTG Mitchell Stevenson, Deputy Chief of Logistics, Headquarters Army (G-4). The author also wishes to express his gratitude for the support and efforts of LTG Stevenson’s staff, including Mark Averill, Director of the Force Projection and Distribution Directorate, his deputy Jack Welsh, and staff members Diana Nalli, Rob Saylor, and Steven Lord.
I am grateful to Leah Hornung and Jessica Yost at DLA Distribution and to LTC Jeff Gulick and Richard George at U.S. Transportation Command for their help. I also thank Tye Beasley, Chief, Defense Transportation Coordination Initiative (DTCI), and his staff, for providing insights about DTCI concepts and operation.
At RAND, Pat Boren’s management of databases and help in providing analytical assistance was invaluable. Jason Eng provided needed assistance in mapping and other data support issues. I wish to thank Pamela Thompson for her editorial help. The report’s reviewers—Keenan Yoho, Adam Resnick, and Ron McGarvey—made cogent and constructive points that I believe have strengthened the document and increased its clarity. Lastly, my gratitude goes to Art Lackey, Eric Peltz, and Ken Girardini for their welcome support and insights.


- xxi -
Glossary
BRAC Base Reconciliation and Closure Commission BSB Brigade Support Battalion CONUS Continental United States DDC Defense Distribution Center DDJC Defense Depot San Joaquin CA DDSP Defense Depot Susquehanna PA DLA Defense Logistics Agency DoD Department of Defense DSS Distribution Support System DTCI Defense Transportation Coordination Initiative EBS Enterprise Business System FDD Forward Distribution Depot FDP Forward Distribution Point GSA General Services Administration HQDA Headquarters, Department of the Army IGPBS Integrated Global Presence and Basing Strategy LIF Logistics Intelligence File LIW Logistics Information Warehouse OCONUS Outside the Continental United States RWT Requisition Wait Time SDDB Strategic Distribution Database SDP Strategic Distribution Platform USTC United States Transportation Command


- 1 -
Home station units depend upon a reliable distribution system to provide the supplies they need to train and prepare for possible deployments. Most of the focus of concern in the past decade has been on how forces deployed to theaters of combat operation have been supported by the global distribution system—understandably, for an Army engaged in two wars. But with forces returning home from Iraq and with a drawdown anticipated to begin in Afghanistan after July 2011, along with the repositioning of forces in Europe and Korea to the continental United States (CONUS) as part of the Integrated Global Presence and Basing Strategy (IGPBS), support to Army forces in CONUS will be of increasing concern. In addition, as contingencies wind down, budgetary concerns are likely to be of increasing importance. The Department of Defense (DoD), and the Army, will be under increasing pressure to do more with less and will require a distribution system that helps maintain readiness and supports training goals with timely delivery of needed supplies, and does so at the lowest cost possible.

- 2 -
The Deputy Chief of Staff of the Army for logistics tasked RAND Arroyo Center to investigate ongoing trends in distribution support to the Army, with particular focus on CONUS units, and to report on emerging issues and opportunities. This documented briefing focuses on one key element of that support: the performance of the scheduled truck network that has been a keystone of support to Army forces in CONUS. It is a revised version of a briefing given to a group of senior Army and DoD logistics leaders at RAND Arroyo Center’s annual “Logistics Day” on September 21, 2010.

- 3 -
This documented briefing has five sections. The next section provides an overview of the methodology and data used in this study and provides a brief historical overview of the development of the scheduled truck system. The next section shows performance from a historical point of view and examines current issues in more detail.
The third section examines the extent to which materiel is not being moved via scheduled truck, and the fourth section takes on issues in scheduled truck performance that may account for some of this “leakage.” The final section summarizes the results and offers recommendations for strengthening the system.


- 5 -
1. Background
This study was done as part of an ongoing effort by RAND Arroyo Center to support the Army by identifying opportunities for improvements in the DoD distribution system. Arroyo has been working with the Army and its partners in the DoD global distribution system—including the Defense Logistics Agency (DLA), United States Transportation Command (USTC), and General Services Administration (GSA)—for more than fifteen years in some areas of distribution.
Over the course of that work, Arroyo has assembled a rich and detailed database on distribution operations that forms the core resource for executing

- 6 -
the current work. The primary source is the Strategic Distribution Database (SDDB), a detailed history of all MILSTRIP-based1 distribution actions executed over the past ten years. In addition, the project used a 15-year archive of data from the Army’s Logistics Intelligence File (LIF), now part of the Army’s Logistics Information Warehouse (LIW), detailed databases on distribution activities executed by DLA from DLA’s Distribution Support System (DSS), and other sources as well.
Arroyo supplemented this analysis with support from subject matter experts in the Army, DLA’s Defense Distribution Center (DDC, now renamed DLA Distribution), and USTC’s Defense Transportation Coordination Initiative (DTCI), the effort through which much of CONUS transportation has been outsourced to a third-party logistics provider.
1 MILSTRIP is Military Standard Requisitioning and Issue Procedures.

- 7 -
The cornerstone of support to forces in CONUS is the leveraging of Strategic Distribution Platform (SDP) storage via scheduled truck networks. SDPs are the central element of the DLA distribution concept, responsible for most storage of DoD-owned materiel at the wholesale level and replenishment of other DLA distribution depots, including Forward Distribution Points (FDPs) collocated with service repair depots, and Forward Distribution Depots (FDDs) located OCONUS to support deployed forces, especially for heavy, bulky items or where the FDD has a distinct performance advantage.
DLA’s distribution depot network currently features two SDPs at opposite sides of the country, at Susquehanna, Pennsylvania (DDSP) and San Joaquin, California (DDJC). As a result of laws passed following recommendations of the Base Reconciliation and Closure Commission (BRAC), two more SDPs will be stood up by converting two existing depots at Oklahoma City, Oklahoma and Warner-Robins, Georgia; these two new SDPs are anticipated to have more limited roles than DDSP and DDJC, however.

- 8 -
The scheduled truck network linked to the two SDPs was developed by the Army and DLA (with analytical support from Arroyo) under the Army’s Velocity Management initiative in the mid-1990s.2 This concept has four key elements:
• Maximum support from a customer’s assigned SDP. Customers are assigned to SDPs on a roughly geographical basis, with the Mississippi River as the rough dividing line (though central CONUS customers are sometimes switched between SDPs). DLA and the Army have agreed to the goal that the SDP will be the source for 85 percent of customer demands stocked in DLA depots (called the “facing fill” or “gross fill rate” metric).3
• Leverage high fill rates via scheduled truck. Where volume and distance permit, customers will be supported from their assigned SDP via scheduled truck service, with the maximum number of trucks per week. Higher fill rates from the SDP, achieved through better stockage strategies, increase the volume available to go by truck, lowering transportation costs and enabling greater truck frequency.
• Move all priorities via the truck. The new distribution paradigm replaced the previous model based on optimizing individual shipments (e.g., high priority to go by premium air, low priority by slower, cheaper modes). Truck efficiency and effectiveness resulted from lumping all cargo together, no matter its priority or size. Via a “one
2 See, for example, John Dumond et al., Velocity Management: The Business Paradigm
That Has Transformed U.S. Army Logistics, Santa Monica, Calif.: RAND Corporation, MR-1108-A, 2001, and Define-Measure-Improve: The Change Methodology That Has Propelled the Army’s Successful Velocity Management Initiative, Santa Monica, Calif.: RAND Corporation, RB-3020, 2000.
3 Headquarters, United States Army G-4 and Headquarters, Defense Logistics Agency (DLA), Performance Based Agreement (PBA), May 12, 2008, p. 14.

- 9 -
freight/all freight” concept, all cargo—no matter its size or priority—could achieve premium air–like responsiveness at a fraction of the cost.
• Synchronize movements through multiple stops. Scheduled truck service provides better synchronization and feedback mechanisms. By building routes for multiple dropoffs, individual units on a post can be served directly by the truck; if schedules are done properly, the truck will arrive at a predictable time, helping supply units plan operations better. Because the truck is on a schedule, units will be aware when the truck is delayed or does not come at all, and can communicate back to the SDP about problems with the trucking company.
Over its first years, DLA through its Defense Distribution Center (DDC) component command had full responsibility for managing the scheduled truck network. In 2008, DDC began a partnership for joint management of the network with USTC under the Defense Transportation Coordination Initiative, an effort to “improve the reliability, predictability, and efficiency of Department of Defense (DOD) material moving within the Continental United States by all modes through long-term partnerships with a world-class coordinator of transportation management services.”4
4 http://www.transcom.mil/dtci/. Begun with USTC oversight, management of DTCI
has recently passed to a component command of USTC, the Military Surface and Distribution Command (SDDC), which oversees the third-party logistics management contract currently operated by Menlo Worldwide Government Services, Inc.


- 11 -
2. Facing Fill and Scheduled Truck Performance
We next look at historical and more recent trends in performance.

- 12 -
The Velocity Management initiative of the mid-1990s, with its emphasis on process mapping, collaborative work, and continuous improvement, led to dramatic improvements in requisition wait time (RWT)5 to Army customers in CONUS (as well as OCONUS). Over the past ten years, especially with the increased focus on supporting Army forces deployed to combat, RWT for CONUS units has shown at best a flat trend.6
5 See Dumond et al. (2001). Requisition wait time refers to the elapsed time from a
customer’s placing a requisition until that customer posts acknowledgment of receipt of the materiel. Since its main focus is on distribution processes and not supply availability, the RWT metric does not include time spent in backorder status (i.e., no stock was available to ship).
6 The increase in 2003 and into 2004 in the figure was mostly associated with wartime-related demand surges and their impact on DDSP pick, pack, and ship processes.

- 13 -
Much of the value achieved by Velocity Management, in terms of both responsiveness and cost, came from expanding the scheduled truck network. This chart shows the comparative benefits of using scheduled trucks. Using 2010 data for SDP support to the top 20 CONUS Army posts,7 it indicates costs and average RWT for the five major shipping modes used to fill customer demands. Scheduled trucks, at the far right, are cheaper than the less responsive modes (small package surface and less than truckload) while coming close to or exceeding the responsiveness of the far more expensive air-based distribution modes.
7 The top 20 CONUS Army locations by demand volume are Forts Hood, Bliss,
Bragg, Irwin, Lewis, Knox, Carson, Leonard Wood, Campbell, Polk, Benning, Stewart, Drum, Sill, Rucker, and Riley, along with Anniston Army Depot, Blue Grass Army Depot, Corpus Christi Army Depot, and Red River Army Depot. They account for 57 percent of shipments and 52 percent of weight demanded by all Army units in CONUS.

- 14 -
One sign of continuing improvement in distribution processes is seen in SDP fill rates for their assigned customers. As mentioned, the Army and DLA set a target of 85 percent customer fill of DLA-managed items from their assigned SDP; the figure above indicates that that is becoming a reality. It shows a 15-year trend in facing fill rates (that is, percent of shipments from DLA depots to customers issued from the assigned SDP) for DDSP and DDJC to the top twenty Army posts in CONUS. DDSP is already achieving the 85 percent mark, and DDJC, while still falling somewhat short, has shown continual progress. Facing fill improvements in the early days of Velocity Management came from manual processes to stock inventory in the right place and at the right depth. More recently, DLA’s new management information system, the Enterprise Business System (EBS), which came on line in 2007, has automated processes that manage SDP stockage levels better, resulting in higher facing fill without the need for manual intervention.

- 15 -
As noted before, SDP facing fill from DDSP is noticeably higher than that from DDJC. There are various reasons for this, including different demand bases (that affect the breadth and depth of stock that can be held) and the concentration of vendors in the eastern part of the United States (which can affect replenishment transportation costs and may contribute to more stock being held at DDSP). The result of this gap is that customers in different parts of the country receive different levels of support from their assigned SDPs. Currently, CONUS SDP support is split roughly at the Mississippi River, with resulting differences among major Army customers, as the figure above shows.

- 16 -
In order to balance workload between the two SDPs over time, DLA sometimes changes SDP assignments for central CONUS posts. That means an Army post can go from a very high SDP facing fill (from DDSP) to a substantially lower one (from DDJC), with the remainder made up from the other SDP. The above figure shows that pattern for Forts Hood, Riley, and Sill in central CONUS, where DDJC was the assigned SDP prior to 2005, then DDSP played that role through 2007, after which the SDP assignment reverted back.
Splitting the workload, and the distance from the central CONUS to either SDP, drives down the frequency of trucks. For example, in 2009, Fort Hood had somewhat more cargo moved via scheduled truck than did Fort Bragg (3.5 million pounds versus 3.3 million pounds) but only had 287 scheduled truck departures compared to 351 for Fort Bragg, and, more to the point, had 121 from DDSP and 166 from DDJC. The frequency of trucks per

- 17 -
week from either SDP was far lower for Fort Hood than for Fort Bragg, which received all its scheduled truck cargo from DDSP.

- 18 -
Higher facing fills facilitate the expansion of scheduled truck usage, as the figure above indicates. It also shows, however, a weakening of that tie in recent years, as the percentage of DDSP/DDJC shipments going via scheduled truck flattened after 2003 even as the facing fill at both SDPs increased. That is, the distribution network was not leveraging improvements in facing fill to reduce cost and improve responsiveness to the maximum extent.

- 19 -
3. Sources of “Leakage” from the Truck Network
This section attempts to identify the major sources of “leakage” from the scheduled truck system.

- 20 -
The chart above summarizes the present scale of scheduled truck coverage for major CONUS Army posts. Scheduled trucks dominate the volume moved by weight, accounting for 75 percent of pounds shipped from the two SDPs to these twenty major locations. However, for reasons to be discussed below, many shipments, especially small ones, are not moved via the scheduled truck. One result is an imbalance of costs: shipments by other than scheduled truck account for 55 percent of transportation costs from the SDPs to these posts, even as they only account for 25 percent of shipment weight.
Use of modes other than scheduled truck can occur for any of three reasons:
• Facing fill shortfalls: the demanded item is not issued from the customer’s supporting SDP.
• Leakage: the supporting SDP issues the item but it does not go on the truck servicing the Army post.
• No truck service: there is no scheduled truck service from the SDP to the Army post.

- 21 -
This chart gives an indication of the 55 percent of transportation costs incurred when using shipping modes other than scheduled truck for major Army posts served by scheduled truck. It indicates the effects of both “facing fill” shortfalls—trucks can’t be used because the fill comes from the “wrong” SDP that does not serve the post on a scheduled truck route—and “leakage”—there is a truck from the SDP to the post but the shipment goes via another mode.
For each SDP it shows the transportation costs incurred for cases where the SDP services an installation via scheduled truck for all shipments from either that SDP or the other one when the shipment goes via other modes.8 In the first column, posts with scheduled trucks only from DDJC, most (~$1.2M
8 For purposes of clarity, we exclude cases in which both SDPs ship via scheduled
truck to the same installations.

- 22 -
of the $1.3M) of the nonscheduled truck transportation costs are associated with facing fill shortfalls, that is, when shipments leave from DDSP rather than DDJC (there are additional costs associated with shipments from other distribution centers, but this chart is limited to shipments from the two main SDPs). The second column shows that for posts with scheduled trucks only from DDSP, leakage is as large a problem as facing fill.
For DDJC, there is relatively little leakage, but the lower facing fill for DDJC customers results in a relatively large proportion of shipments coming from DDSP. For DDSP, by contrast, facing fill is higher, so those costs are proportionally lower, but there are more cases of alternative shipping modes being used out of DDSP to installations served by scheduled trucks.

- 23 -
There is a considerable range across the major Army posts in terms of weight going via scheduled truck, for the two reasons just discussed. The percentage is especially high at locations with truck service from both SDPs—like Forts Sill and Riley (though less so at Fort Hood, which also gets DDSP and DDJC trucks). Most posts receive between 60 and 80 percent of total SDP-shipped weight via truck, with two of the top Army locations by weight (Blue Grass Army Depot and Corpus Christi Army Depot) not being served by SDP scheduled trucks at all.

- 24 -
As noted above, the leakage from scheduled truck routes primarily affects customers of DDSP. Another source of shortfalls in scheduled truck volume is when major Army posts and locations get no scheduled truck service at all. This chart illustrates the scope of both these effects. It shows total shipments by weight from DDSP to its top 15 Army recipients in FY10.9 It breaks total weight into that moved via scheduled truck and via other modes, and the percentage of total weight moved via scheduled truck. While some posts receive more than 90 percent of weight via the truck, the percentage varies from 70 to 90 percent or, in the case of Fort Polk, to under 50 percent. Two major Army customers of DDSP in the eastern half of CONUS—Blue Grass Army Depot
9 DDSP is not the assigned SDP for Forts Hood, Riley, Bliss, and Carson, even
though those posts are among DDSP’s top 15 Army recipients.

- 25 -
and Charleston10—are not served by scheduled truck, while two of DDSP’s largest 15 customers, Forts Bliss and Carson, are in the western part of CONUS and are also not served via truck.
10 Goose Creek, South Carolina, near Charleston, is the home of the Army
Sustainment Command’s Combat Equipment Base Afloat (CEBA) facilities.

- 26 -
The cost and responsiveness of the trucking network can be affected by this leakage. All else equal, the more volume that can be put on the truck route, the more frequently trucks can be sent, increasing responsiveness, or the lower the cost incurred. When a post is served by a truck but specific units or shipments are not included, the efficiency and effectiveness of the system is degraded. Similarly, when entire locations are not on a truck route, their volume is not aggregated with destinations on the same potential route that may be getting truck service, further limiting opportunities for increasing frequency or lowering cost (or both).
The chart above provides illustrations of the first type of leakage, where significant volumes of shipments to posts served by a scheduled truck are not on the truck, broken out by SDP across four Army posts. In the case of Fort Bragg, which had been getting trucks almost every day (until recent deployments led to a reduction in truck frequency) with next-day delivery, still almost 20 percent of the volume did not go via truck. At Forts Hood and Polk

- 27 -
there is much more leakage from the trucks coming from DDSP than from DDJC. Fort Knox shows a leakage similar to Fort Bragg; this missing volume no doubt contributes to the fact that there are only two trucks per week to support Fort Knox from DDSP.

- 28 -
In general, at these four posts, units are either entirely served by the truck or not; there is little evidence that there is leakage within a given unit. The chart above shows the largest units at the four. Among these top customers, there is one unit at each post not on the truck. Among the others, the amount of nonscheduled truck shipments is very small, with the noticeable exception of one unit at Fort Polk, where W8115U gets all high-priority requisitions via premium air, with low-priority shipments moved via scheduled truck.

- 29 -
4. Issues in Scheduled Truck Performance
This section examines performance aspects of the scheduled truck system, comparing it to premium air performance and analyzing components of the system, including truck frequency, how often shipments go on the next scheduled truck, and transit times.
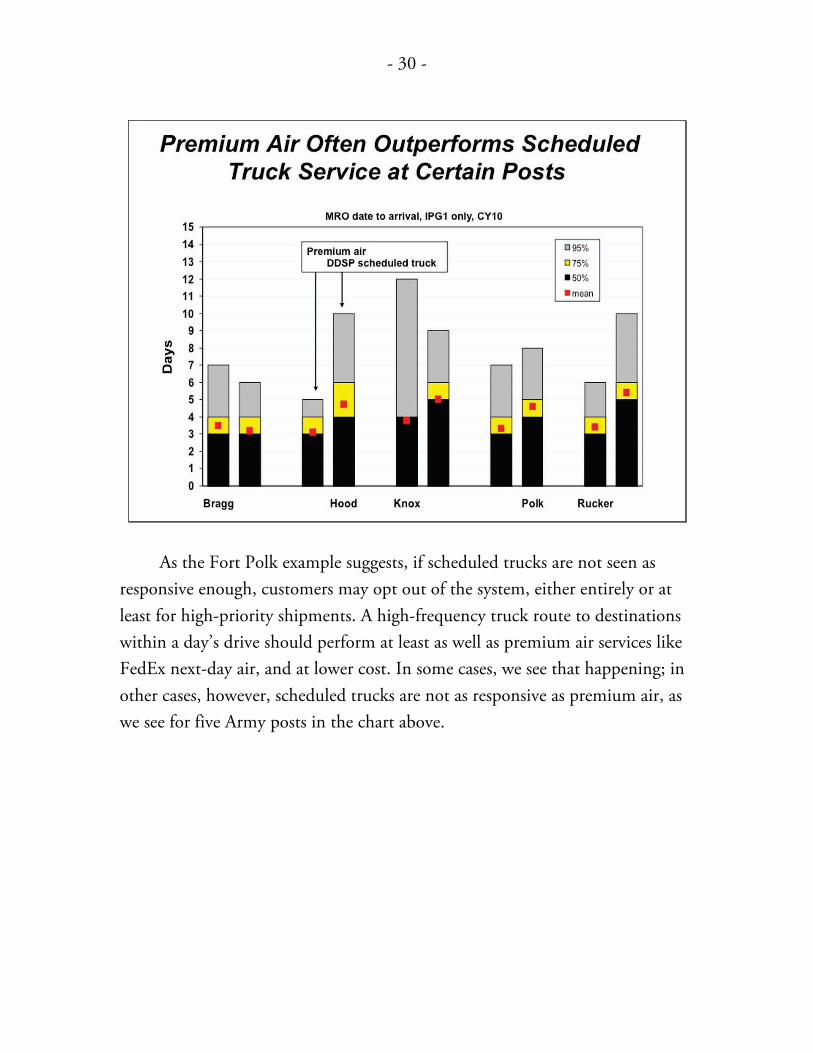
- 30 -
As the Fort Polk example suggests, if scheduled trucks are not seen as responsive enough, customers may opt out of the system, either entirely or at least for high-priority shipments. A high-frequency truck route to destinations within a day’s drive should perform at least as well as premium air services like FedEx next-day air, and at lower cost. In some cases, we see that happening; in other cases, however, scheduled trucks are not as responsive as premium air, as we see for five Army posts in the chart above.

- 31 -
This chart generalizes the illustration made on the previous chart. It shows for major Army posts the difference between average response time (here measured from the time the materiel release order is produced until the shipment arrives at destination) between premium air and scheduled trucks. Negative numbers indicate that trucks are more responsive, positive numbers that premium air is faster. In some cases, primarily those closest to the SDP, scheduled trucks outperform premium air, but in the majority of the cases they do not, in some cases by a considerable amount.

- 32 -
Scheduled truck responsiveness is driven primarily by three factors: the number of trucks departing each week, the time to drive to the location, and the SDP’s success in getting materiel onto the next scheduled truck as quickly as possible.
Truck frequency is largely driven by distance and volume moved. This figure attempts to relate those factors to truck route frequency in FY10. High volume and short distance can facilitate frequent departures, as illustrated by DDSP support to Fort Bragg. A destination not as close to DDSP as Fort Bragg, like Fort Benning, can have frequent deliveries if the route volume is increased by multiple stops; the Fort Benning route includes stops at Camp Lejeune and Cherry Point, North Carolina, resulting in higher frequency but necessitating a second driving day to reach Fort Benning. On the other hand, a relatively high-volume route, like the DDSP truck to Fort Riley (which also includes stops at Fort Sill and Tinker Air Force Base), only has two trucks per week due to the distance. In the middle is Fort Drum which, while very close to

- 33 -
DDSP, still gets only three trucks per week because of very low volume. Fort Hood truck frequency is driven both by distance and by fragmentation. It is very far from both SDPs and because its shipments are split between DDJC and DDSP, it only gets three trucks per week from the former and two from the latter.

- 34 -
Scheduled truck responsiveness is also affected by SDP processes, especially SDP success in pulling, packing, and processing materiel as quickly as possible to get it on the next departing truck. The chart above gives some indication of the variability in that success rate. It shows the percentage of shipments making the next scheduled truck for major truck routes. Generally, the fewer departures per week the greater the success rate, but this is not always the case. It shows that in general between 60 and 80 percent of shipments make the next truck, but several fall below 60 percent.

- 35 -
The last primary determinant of scheduled truck responsiveness is driving time from the SDP to the final destination. As the chart above indicates, there is considerable variability in average departure to arrival times, with the longest times coming for posts in central CONUS, and a relatively strong correlation with miles traveled.11
11 Fort Benning is the terminus of a multi-installation route from DDSP, with stops at
Camp Lejeune and Cherry Point, North Carolina before the truck proceeds, on its second day, to Benning.


- 37 -
5. Potential Actions for Strengthening/Expanding the Truck System
The final section summarizes the report and offers recommendations.

- 38 -
There are both near-term and more ambitious longer-term actions process owners in collaboration with their customers can take to strengthen and expand the scheduled truck network to both reduce its costs and increase its responsiveness.
Near-term actions:
• Add new destinations to existing truck routes. Locations currently not served by trucks but that are located on or near currently existing routes may be added to increase the volume on the route and so reduce cost and/or increase the frequency. There is a tradeoff between the number of stops along the way and route efficiency; if the volume added per stop is too low, it may not be worthwhile, especially if the requirement to stop substantially delays arrival for larger customers. An example of such an addition is given on the next chart.

- 39 -
• Add customers not on the truck at posts served by scheduled trucks. Units at truck-served Army posts should be supported by those trucks, both to save money and also to increase robustness (and potentially frequency) of service to the remaining customers on those posts. The Army needs to work with DLA and USTC to determine the reasons that units are not included on trucks and the process by which their participation is determined.
• Scrutinize reasons for using other shipping modes for customers mainly supported by scheduled trucks. For most units served by trucks, the percentage of their SDP shipments not on the truck tends to be fairly low. In rare cases, such as at Fort Polk, high-priority shipments do not go on the truck, whereas others do. Apart from those clear-cut cases, the Army needs to work with DLA to determine the reasons for this type of “low-level” leakage and work to minimize its occurrence.
• Improve SDP processing times. Getting pulled shipments on the next departing truck should be a focus of DLA process improvement efforts, especially for high-priority requisitions.
These steps would likely have a moderate effect on scheduled truck comprehensiveness and performance. More significant improvements could be achieved by some more far-reaching changes. One might yield much greater volume on individual routes, lowering costs and improving responsiveness, while another could greatly shorten truck route distance, with the same effect.
Longer-term actions:
• Cross-dock non-SDP shipments onto scheduled trucks. In addition to SDP shipments, units receive deliveries via multiple shipping modes from GSA and direct from vendors, as well as other sources. Where feasible, it may be worth exploring the possibility of

- 40 -
routing shipments from these sources through the SDP and onto scheduled trucks.12 Not only could this reduce overall cost from the system point of view, but it would simplify processes for customers who, in the best case, would receive all their orders in a single delivery. If the increased volume led to sufficient frequency, the cross-docked shipments from other sources might move more quickly than before. This may work better in some cases than others. For example, the two main GSA depots are located in close proximity to DDSP and DDJC and would incur limited extra travel time to ship via the SDPs. In other cases, such as for some direct vendor delivery items, the SDP may be too far away relative to the customer location.
• Facilitize new regional SDPs to support local customers via scheduled trucks. BRAC recommendation-based laws established two new SDPs in central CONUS (Oklahoma City) and the southeast (Warner-Robins). The two are slated to play less comprehensive roles than DDSP and DDJC, primarily focusing on resupplying Forward Distribution Depots in their regions collocated with service repair depots. If in the future resources were made available to facilitize these two as fully capable SDPs, with a target of 85 percent facing fill for their assigned regional customers, support to customers in their regions could be greatly improved. This would especially benefit central CONUS locations, which, as shown, tend to have less frequent trucks with longer delivery times.
12 This would entail routing shipments through the SDP consolidation and
containerization point (CCP) and then on to truck lanes. Currently, the CCP is not set up to sort shipments for CONUS destinations; doing so may require changes in management systems.

- 41 -
By adding customers or new stops on routes, the system can both lower costs and improve responsiveness via increased truck frequency. This chart illustrates possible improvements in the DDSP scheduled truck to Fort Knox, Kentucky.
DDSP currently operates two trucks per week to Fort Knox. About 20 percent of Fort Knox demand from DDSP is not on the truck, however, with most of that being ordered by the 201st Brigade Support Battalion, supporting the 3rd Brigade Combat Team, which stood up at Fort Knox in October 2009.
It is not clear why the 201st BSB did not get included on the truck, whether that was a conscious decision by that unit (possibly driven by responsiveness issues) or if the process managers did not respond to the new units standing up at Fort Knox last year. But it is clear that the low-frequency truck route does provide lower responsiveness than alternatives, such as premium air. For high-priority requisitions to Fort Knox, the time from

- 42 -
materiel release order at the depot to arrival on post averages six days for DDSP scheduled truck and three days for premium air.
Adding volume to the truck could result in increased frequency and narrow that gap. Including the 201st BSB, at 16 percent of total weight from DDSP to Fort Knox, would have a moderate effect and might lead to an extra truck per week. Of much greater impact would be to set up stops along the way of major Army customers that are not currently served by DDSP trucks. As the chart above shows, neither Blue Grass Army Depot nor the Kentucky National Guard Materiel Management Center, both in the vicinity of Lexington and en route to Fort Knox, are served by the truck, yet their combined volume exceeds the total volume currently going on that truck. Including those two destinations, as well as the 201st BSB, might justify increasing truck frequency from two to five trucks per week and eliminate most of the gap between premium air and scheduled truck responsiveness. This would have no adverse effect on deliveries to Fort Knox. Due to distance, the DDSP truck requires two days of transit time; the stops in the Lexington area could be made on the first transit day, with arrival at Fort Knox still occurring on the second day, as it does now.
Additional analysis would be required to evaluate other possible route additions and to weigh the benefits and drawbacks of adding new stops to existing routes. While most major Army locations are already served by trucks, there may still be possibilities for improvement. In addition to Fort Knox, the Charleston CEBA case would warrant looking into (possibly adding it as a stop to the once-per-week Fort Jackson, South Carolina truck). Removing Fort Benning from the route currently stopping first at Cherry Point/Camp Lejeune to one going direct to Fort Benning and then on to the Marine Corps operation at Albany, Georgia might yield more cost-effective and responsive performance. More possibilities may emerge with detailed analysis.

- 43 -
The scheduled truck network first implemented via Army/DLA cooperation in the mid-1990s is an undoubted success. Its continuity over the past 15 years, through times of major deployments, testifies to its inherent robustness.
The Army currently has no policy guiding the use of this network. HQDA G-4 should provide such a policy. Since leakage from units not participating on an existing truck supporting their home station can increase overall costs and reduce effectiveness for their neighbors, the policy should call for all units on a post with scheduled truck service to receive their shipments via the truck unless an explicit waiver has been granted.
The policy should also call for better monitoring by the Army. The Army should designate a capable agency to develop metrics and produce recurrent reports on the health of the scheduled truck network. This would include facing fill metrics (based on the standard agreed to in the Army/DLA PBA),
- 44 -
identification of posts and major locations not on the truck, and the amount of leakage on Army posts from units not participating in the truck network.
The Army should work closely with DLA and, as necessary, with process managers associated with USTC’s Defense Transportation Coordination Initiative (DTCI) to make necessary changes in the truck network, whether that includes new units coming on-line at CONUS posts or adding new locations to existing (or new) truck routes.
Finally, as discussed previously, more far-reaching changes could have a dramatic effect on DoD’s use of scheduled trucks. By implementing cross-docking ideas at the SDPs and routing most shippers’ packages through CCPs and onto scheduled trucks, the system might achieve much lower costs and increased responsiveness across the range of materials ordered by CONUS customers. Similarly, providing the resources to make the two new regional SDPs fully functional could yield a far stronger scheduled truck network, with additional cost and performance improvements.

- 45 -
Appendix: Participation in Scheduled Truck Service, FY10
This appendix gives information about scheduled truck coverage for CONUS posts, bases, and units in FY10 and serves to indicate areas for potential improvement, including reducing leakage by identifying units not supported by the truck on posts that are on a scheduled truck route and major posts and bases not currently served by scheduled trucks. More detailed analysis and collaborative efforts between process managers and stakeholders, including the units themselves, would be required to determine how to add additional units to existing truck routes, which posts and bases should be added to the scheduled truck network, and how and when routes should be realigned among participating locations.
Table A.1 shows participation in scheduled truck service by Army post, for those posts with truck service. Using information from DLA’s Distribution Support System (DSS) GBH files (which provide data on government bill of lading shipments), it shows the total weight shipped from the assigned SDP, or SDP with a truck to the post, the weight that went on the truck, and the percent of weight moved via scheduled truck, from highest percentage to lowest.13 This table illustrates the role of leakage in the scheduled truck network. A reduced percentage can come from units not participating in the truck service at all, from certain priorities being excluded, from individual shipments not being put on the truck for other reasons, and so forth.
13 The table excludes weight moved via full truckload (shipmode A). This typically
represents unique or one-time loads, often to a single consignee where a spike in volume allows ordering a single full truck to ship the items. Since these do not tend to represent recurrent demands, they do not represent a “leakage” from the scheduled truck service.

- 46 -
Table A.1 Percent of SDP Shipped Weight Moved by Truck for Posts with Scheduled Truck Service, FY10
Location
SDP
Scheduled Truck
Other Modes
Total
Percent via Sched Truck
Benning DDSP 889,945 38,528 928,473 96%
Irwin DDJC 855,550 43,319 898,869 95%
Bliss DDJC 681,761 43,423 725,185 94%
Lee DDSP 211,233 13,466 224,700 94%
Jackson DDSP 291,362 18,946 310,308 94%
Anniston DDSP 1,351,857 97,715 1,449,572 93%
Riley DDSP 496,136 36,181 532,317 93%
Lewis DDJC 1,307,411 95,451 1,402,862 93%
Sill DDJC 177,007 13,465 190,472 93%
Riley DDJC 440,851 37,232 478,083 92%
Huachuca DDJC 89,108 8,126 97,234 92%
Campbell DDSP 1,486,712 147,163 1,633,876 91%
Stewart DDSP 1,569,058 161,428 1,730,487 91%
Red River DDJC 740,523 80,246 820,769 90%
Drum DDSP 724,512 80,291 804,803 90%
Hood DDJC 1,122,121 130,898 1,253,020 90%
Carson DDJC 755,582 106,287 861,869 88%
Red River DDSP 2,202,021 371,337 2,573,358 86%
Bragg DDSP 1,988,328 366,619 2,354,947 84%
Polk DDJC 119,951 26,876 146,827 82%
Tobyhanna DDSP 39,555 10,333 49,888 79%
Sill DDSP 197,085 51,609 248,694 79%
Letterkenny DDSP 109,937 29,340 139,277 79%
Eustis DDSP 229,296 74,864 304,160 75%
Leonard Wood DDSP 375,444 126,131 501,575 75%
Hood DDSP 851,262 333,041 1,184,302 72%
Hood DDSP 580,879 236,902 817,781 71%
Rucker DDSP 288,202 124,102 412,304 70%
Knox DDSP 619,635 268,610 888,245 70%
Leonard Wood DDJC 35,783 33,730 69,514 51%
Polk DDSP 478,073 537,477 1,015,549 47%
Pickett DDSP 12,606 24,461 37,067 34%
SOURCE: DSS GBH files, FY10. Shipmode A (full truckload) volume excluded.

- 47 -
Table A.2 presents a DODAAC-level analysis by post to help identify whether or not individual units are included in scheduled truck service. Using numbers of shipments instead of weight, it shows, by post and by DODAAC, the number of shipments coming from each of the two SDPs and the percent of shipments going via scheduled truck. (When the SDP does not run a scheduled truck—such as DDJC to Fort Benning—all DODAACs will show a zero percentage in the column showing percent of shipments from the SDP going via truck.) In most cases, either virtually all or none of the DODAAC’s shipments will be on the scheduled truck. A zero indicates a candidate for future inclusion. A moderately high percentage may indicate some rules being applied that exclude certain shipments (such as high-priority demands). The last column on the right shows the FY10 transportation cost for shipments coming from the unit’s assigned SDP and using a mode other than scheduled truck (or, in the cases of Hood, Riley, and Sill, which get scheduled trucks from both SDPs, the transportation cost via nonscheduled truck modes from both SDPs). Total nonscheduled truck costs exceeded $2.1 million in FY10, with wide variation among DODAACs.

- 48 -
Table A.2 Major Unit Coverage by Scheduled Truck, FY10
Post
DODAAC
Unit
DDJC %
Sched Truck
DDSP %
Sched Truck
DDJC Total
DDSP Total
Cost From Modes
Other Than Truck
Benning W33BQ9 ISSD 0% 95% 573 6494 $12,026
Benning W33RQN MAINT 0% 92% 179 1306 $2,054
Benning W81PPN 598 OD 0% 98% 159 1863 $1,097
Benning W90C9N SUPPORT MNT 0% 98% 470 6410 $309
Benning W90DGG FLRC-Benning 0% 99% 525 7151 $1,232
Benning W90N90 ILSC MF BAE 0% 99% 1195 12604 $1,123
Benning W917WB 2-29 IN FLT 0% 96% 36 475 $69
Bliss W4546F 121 BSB 4BCT 96% 0% 1425 470 $2,971
Bliss W45NSU INST SUPPLY 98% 0% 10423 4126 $1,833
Bliss W45QML DOL 99% 0% 11800 3285 $1,774
Bliss W806D7 ECS 87 99% 0% 1534 270 $128
Bliss W80FTD 5-52 ADA 95% 0% 2346 1009 $2,459
Bliss W81THR 3-43 ADA 97% 0% 2361 1008 $1,332
Bliss W903FM 2-43 ADA 96% 0% 3669 1440 $7,185
Bliss W906FV CIF ISM 98% 0% 59 509 $3
Bliss W90FCQ ILSC HBCT MTL 99% 0% 3904 1176 $247
Bliss W90SLR 5 CSB 91% 0% 2598 1204 $1,384
Bliss W918SL TRNG BDE TM1 97% 0% 323 189 $138
Bliss W91B4W 125 BSB 3BCT 86% 0% 3988 2112 $13,763
Bragg W36GKH 364 CS 507CSG 0% 97% 703 6359 $5,869
Bragg W36LKH 407 BSB 2BCT 0% 82% 283 2779 $17,866
Bragg W36LKJ 82 BSB 3BCT 0% 96% 228 2664 $4,040
Bragg W36N0T 122 ASB 82CAB 0% 99% 421 3250 $3,526
Bragg W5J9M5 29 CS CO 0% 0% 186 1642 $16,698
Bragg W81PK5 MATES 1 0% 99% 128 2061 $643
Bragg W81YT4 SRA 0% 98% 4257 43827 $31,148
Bragg W9006A FLRC-Bragg EFT 0% 99% 1397 23622 $252
Bragg W900JH 1-7 ADA 0% 0% 446 3602 $37,165
Bragg W9024E USASOC SVC ELEM 0% 97% 55 516 $993
Bragg W904H6 188 BSB 0% 0% 333 2973 $40,051
Bragg W90N17 ECS 125 0% 99% 51 800 $80
Bragg W91KBP 3 SFG 0% 93% 212 1861 $3,262
Bragg W91KBQ 7 SFG 0% 91% 180 1528 $8,941

- 49 -
Post
DODAAC
Unit
DDJC %
Sched Truck
DDSP %
Sched Truck
DDJC Total
DDSP Total
Cost From Modes
Other Than Truck
Campbell W34GM2 IMMD 0% 99% 1306 12562 $5,854
Campbell W34GMT 305 CS 101SPT 0% 98% 962 8494 $11,149
Campbell W34TVH 801 BSB 4BCT 0% 98% 450 3876 $7,837
Campbell W34XC5 DOL 0% 96% 623 6749 $13,483
Campbell W34XYK 426 BSB 1BCT 0% 96% 166 1245 $1,991
Campbell W34XYL 526 BSB 2BCT 0% 98% 321 2666 $3,930
Campbell W80N5C 160 AVN RGT 0% 99% 1482 13188 $6,212
Campbell W813LX 563 ASB 159CAB 0% 98% 900 8201 $3,522
Campbell W813LY 96 ASB 101CAB 0% 98% 577 5001 $5,594
Campbell W81XB3 AVN LOG DIV 0% 99% 3962 43576 $19,105
Campbell W909AG FLRC-Campbell 0% 28% 1517 28325 $118,501
Campbell W91FGT DOL MNT 0% 100% 56 589 $0
Campbell W91LCR 5 SFG 0% 93% 200 2068 $3,026
Carson W51HUU DOL MNT 98% 0% 8169 2477 $2,058
Carson W51WKX 64 BSB 3BCT 98% 0% 709 663 $2,451
Carson W80BTZ 183 MNT NONDIV 98% 0% 7456 2992 $5,351
Carson W81RP5 DOL 99% 0% 955 240 $109
Carson W81RP6 DOL 99% 0% 1458 745 $517
Carson W81U1J 704 BSB 4BCT 99% 0% 512 11 $57
Carson W81UN9 MATES 1 0% 0% 693 178 $4,695
Carson W81XF9 4 CSB 1BCT 98% 0% 2334 1396 $1,128
Carson W81XGA 204 BSB 2BCT 98% 0% 6176 2649 $3,453
Carson W81YXR FLRC-Carson 98% 0% 16185 4442 $5,554
Carson W90C3P FCMF 99% 0% 831 146 $58
Carson W90KEL ECS 42 0% 0% 914 202 $3,542
Carson W90NAP ILSC MF BAE 99% 0% 3893 1074 $147
Carson W91FPV DOL MNT 98% 0% 15484 4266 $11,498
Carson W91KTT HBCT MFT LBE 93% 0% 1935 456 $427
Carson W91M23 10 SFG 19% 0% 1629 914 $30,755
Drum W16BEC DOL SUP MNT 0% 99% 631 9135 $2,359
Drum W806K8 MATES 1 0% 0% 112 1361 $12,301
Drum W810DR 514 BSB 10SB 0% 98% 313 2941 $7,518
Drum W81ALT 710 BSB 3BCT 0% 94% 241 3068 $5,466
Drum W81C01 277 ASB 10CAB 0% 96% 928 8809 $9,702
Drum W81GJX DOL AVIM 0% 98% 157 2170 $94
Drum W81W29 SRA MAIN STOR 0% 94% 149 2576 $389
Drum W90ADP 10 BSB 1BCT 0% 97% 284 2944 $3,082
Drum W90LY8 ECS 1 0% 0% 211 2778 $11,779
Drum W90PVU DOL MNT 0% 99% 687 11692 $189
Drum W916YB DOL AMCOM RESET 0% 99% 1260 16220 $5,607

- 50 -
Post
DODAAC
Unit
DDJC %
Sched Truck
DDSP %
Sched Truck
DDJC Total
DDSP Total
Cost From Modes
Other Than Truck
Eustis W26AL2 DOL MNT 0% 98% 323 3223 $4,280
Eustis W26RK4 DOL 0% 94% 432 4209 $5,308
Eustis W26RKT 558 TC 0% 97% 427 3425 $3,013
Eustis W81JBN AVN LOG SCH 0% 99% 163 1644 $37
Eustis W90U83 ECS 93 0% 0% 109 1314 $8,902
FtJacks W37N01 USAG Jackson 0% 98% 261 2881 $13,681
FtJacks W90N16 ECS 124 0% 0% 71 1215 $6,523
Hood W42SU8 27 CSB 97% 96% 6192 3820 $17,951
Hood W42UUE 404 ASB AVB 98% 0% 5293 2477 $114,854
Hood W4546G 615 ASB 1ACB 94% 97% 1362 614 $681
Hood W45CMN DOL MNT 96% 98% 7869 2313 $4,944
Hood W45GJ2 USAG Hood 0% 0% 11689 3982 $188,926
Hood W45J66 15 CSB 2BCT 98% 96% 3120 1462 $12,081
Hood W45J67 115 CSB 1BCT 97% 97% 2267 1000 $5,840
Hood W45NQ7 DOL CL IX 88% 92% 13211 6003 $26,074
Hood W45RNQ 3 ACR 98% 97% 5160 2705 $22,323
Hood W51WKY 4-3ACR 98% 0% 2769 1103 $37,097
Hood W5KA0V DOM MNT NMP 99% 96% 19155 7730 $316
Hood W806DY ECS 64 0% 0% 62 1011 $5,323
Hood W80XYJ 62 QM 98% 96% 8792 3903 $14,566
Hood W80Y1C AMCOM DM 99% 98% 3257 1132 $1,682
Hood W81CL8 MAINT DIV 98% 5% 9998 3615 $49,740
Hood W81E1D 215 CSB 3BCT 99% 97% 3186 1449 $3,514
Hood W81F5M MAINT DIV 99% 6% 1507 482 $7,910
Hood W81XF9 4 CSB 1BCT 93% 0% 1512 940 $40,300
Hood W904TH FLRC-Hood 99% 90% 57769 15391 $13,724
Hood W90CXK FLRC-Hood 99% 45% 7770 1914 $13,327
Hood W90GLR CECOM 100% 0% 2160 1639 $20,922
Hood W90JLH AMCOM OH58 RESE 99% 98% 3203 974 $249
Hood W90LWZ HBCT MFT 99% 99% 1642 629 $44
Hood W90ZTF 509 FSC 0% 2% 580 258 $6,061
Hood W912UB AMCOM AVN RESET 99% 0% 2552 855 $18,854
Hood W912UE AMCOM AVN RESET 99% 0% 3149 1153 $23,882
Hood W913TW AMCOM AVN RESET 99% 0% 4949 2583 $36,150
Hood W91E2E 2 ADA 93% 0% 2352 930 $23,925
Hood W91HC4 589 CSB FIRES 99% 95% 1030 484 $2,780
Hood W91TB4 1-44 AMD 90% 0% 3046 1253 $26,443
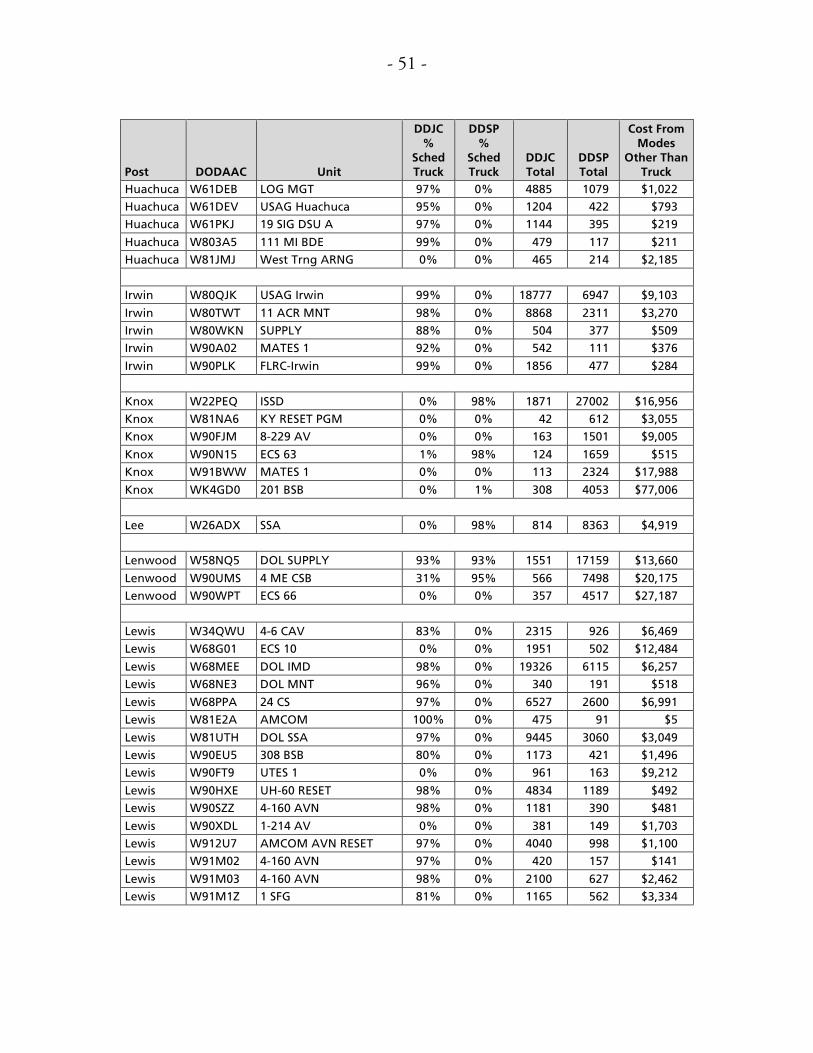
- 51 -
Post
DODAAC
Unit
DDJC %
Sched Truck
DDSP %
Sched Truck
DDJC Total
DDSP Total
Cost From Modes
Other Than Truck
Huachuca W61DEB LOG MGT 97% 0% 4885 1079 $1,022
Huachuca W61DEV USAG Huachuca 95% 0% 1204 422 $793
Huachuca W61PKJ 19 SIG DSU A 97% 0% 1144 395 $219
Huachuca W803A5 111 MI BDE 99% 0% 479 117 $211
Huachuca W81JMJ West Trng ARNG 0% 0% 465 214 $2,185
Irwin W80QJK USAG Irwin 99% 0% 18777 6947 $9,103
Irwin W80TWT 11 ACR MNT 98% 0% 8868 2311 $3,270
Irwin W80WKN SUPPLY 88% 0% 504 377 $509
Irwin W90A02 MATES 1 92% 0% 542 111 $376
Irwin W90PLK FLRC-Irwin 99% 0% 1856 477 $284
Knox W22PEQ ISSD 0% 98% 1871 27002 $16,956
Knox W81NA6 KY RESET PGM 0% 0% 42 612 $3,055
Knox W90FJM 8-229 AV 0% 0% 163 1501 $9,005
Knox W90N15 ECS 63 1% 98% 124 1659 $515
Knox W91BWW MATES 1 0% 0% 113 2324 $17,988
Knox WK4GD0 201 BSB 0% 1% 308 4053 $77,006
Lee W26ADX SSA 0% 98% 814 8363 $4,919
Lenwood W58NQ5 DOL SUPPLY 93% 93% 1551 17159 $13,660
Lenwood W90UMS 4 ME CSB 31% 95% 566 7498 $20,175
Lenwood W90WPT ECS 66 0% 0% 357 4517 $27,187
Lewis W34QWU 4-6 CAV 83% 0% 2315 926 $6,469
Lewis W68G01 ECS 10 0% 0% 1951 502 $12,484
Lewis W68MEE DOL IMD 98% 0% 19326 6115 $6,257
Lewis W68NE3 DOL MNT 96% 0% 340 191 $518
Lewis W68PPA 24 CS 97% 0% 6527 2600 $6,991
Lewis W81E2A AMCOM 100% 0% 475 91 $5
Lewis W81UTH DOL SSA 97% 0% 9445 3060 $3,049
Lewis W90EU5 308 BSB 80% 0% 1173 421 $1,496
Lewis W90FT9 UTES 1 0% 0% 961 163 $9,212
Lewis W90HXE UH-60 RESET 98% 0% 4834 1189 $492
Lewis W90SZZ 4-160 AVN 98% 0% 1181 390 $481
Lewis W90XDL 1-214 AV 0% 0% 381 149 $1,703
Lewis W912U7 AMCOM AVN RESET 97% 0% 4040 998 $1,100
Lewis W91M02 4-160 AVN 97% 0% 420 157 $141
Lewis W91M03 4-160 AVN 98% 0% 2100 627 $2,462
Lewis W91M1Z 1 SFG 81% 0% 1165 562 $3,334

- 52 -
Post
DODAAC
Unit
DDJC %
Sched Truck
DDSP %
Sched Truck
DDJC Total
DDSP Total
Cost From Modes
Other Than Truck
Riley W55GPJ DOL IMA 99% 98% 8444 2690 $8,314
Riley W55WNU MATES 1 94% 98% 6787 2554 $4,088
Riley W81WRD 101 CSB 1BCT 97% 96% 5248 2800 $14,607
Riley W81WRE 299 BSB 2BCT 98% 97% 3915 1794 $11,788
Riley W90889 170 MNT 94% 0% 2602 1017 $8,256
Riley W909K9 FLRC-Riley 96% 99% 17323 4081 $3,685
Riley W90A84 DOL 7-9 98% 97% 5216 1878 $2,472
Riley W90A87 DOL 2-3P-4 92% 97% 267 252 $1,011
Riley W90H50 GS MNT MATES 97% 99% 6322 2154 $2,428
Riley W90N9Z ILSC MF BAE 97% 97% 1638 417 $138
Riley W90WXM ECS 33 87% 99% 2658 405 $516
Riley W91ZLD 701 CSB 4BCT 95% 0% 507 169 $2,269
Riley WK4BNX 601 ASB CAB 90% 96% 2576 1241 $4,515
Rucker W31NWR USAG Rucker 0% 74% 313 3112 $40,209
Rucker W31NWY 1-13 AVN 0% 80% 5108 44451 $112,829
Rucker W80KG6 597 OD MNT 0% 59% 86 811 $5,833
Rucker W90N18 ECS 143 0% 99% 105 1284 $0
Rucker W91VS8 UTES 2 0% 90% 66 1010 $1,565
Sill W44DQ1 DOL SUP 99% 97% 29640 10210 $27,823
Sill W44KN3 168 BSB 95% 99% 3468 1540 $1,424
Sill W44VAM MATES 1 100% 0% 2961 1340 $8,126
Sill W806CN ECS 162 0% 0% 715 129 $5,446
Sill W81NMJ 3-2 ADA 81% 0% 1868 765 $16,072
Sill W90THB 382 RGT 98% 100% 727 224 $45
Sill WK4GAA 100 BSB 96% 98% 2619 1077 $4,003
Stewart W33DL5 DIV HQ 0% 97% 1005 7679 $5,459
Stewart W33K09 703 BSB 4BCT 0% 96% 506 4628 $12,764
Stewart W33KD9 AMCOM DM 0% 97% 61 634 .
Stewart W33NYN CONSOL PROP 0% 99% 1096 14347 $6,170
Stewart W33NYP AVN AIMI 0% 94% 1588 15229 $13,176
Stewart W33RBS 226 QM 3SUS 0% 97% 809 6087 $17,429
Stewart W33TLB 603 ASB 3CAB 0% 94% 71 431 $281
Stewart W80JTN MATES 1 0% 0% 94 2460 $22,552
Stewart W81R1C 3-160 AVN 0% 0% 300 2502 $16,880
Stewart W81U3U 26 BSB 2BCT 0% 96% 82 681 $1,302
Stewart W90727 W90727 0% 0% 51 601 $2,977
Stewart W90DGH FLRC-Stewart 0% 99% 2339 31647 $3,282
Stewart W90E5Y FMS 3 0% 0% 44 494 $9,983

- 53 -
Post
DODAAC
Unit
DDJC %
Sched Truck
DDSP %
Sched Truck
DDJC Total
DDSP Total
Cost From Modes
Other Than Truck
Stewart W90HXS CH-47 RESET 0% 98% 674 7388 $4,429
Stewart W90PJ2 MATES 1 0% 0% 17 543 $4,488
Stewart W912U5 AMCOM AVN RESET 0% 97% 293 2556 $2,925
Stewart W91JXQ CONSOL MNT 0% 99% 819 7859 $1,250
SOURCE: Strategic Distribution Database (SDDB), FY10.
Table A.3 provides information that may indicate possible candidates for future scheduled truck service. For FY10 weight data from the DSS files, it shows total weight by base or post and its assigned SDP14 for locations that are not currently served by a scheduled truck. It breaks volume out by small package and large shipment weights and the transportation costs for both, as well as the total cost. The table is limited to non-truck locations with at least 100,000 pounds of SDP shipments in FY10.
14 In most cases; the table also includes some high-weight post/secondary SDP
combinations if those might be possible candidates for scheduled truck service.

- 54 -
Table A.3 Highest-Volume CONUS Locations with No Scheduled Truck Service (minimum 100,000 pounds shipped from the SDP)
Post
SDP
Small Package Weight
Large Shipment Weight
Total
Weight
Small Package
Cost
Large Shipment
Cost
Total Cost
Charleston DDSP 85,521 944,186 1,029,707 $116,126 $173,999 $290,125
Carson DDSP 160,047 515,437 675,484 $157,890 $515,198 $673,088
Blue Grass DDSP 16,698 651,997 668,695 $18,955 $123,784 $142,739
Bliss DDSP 135,968 490,610 626,578 $123,264 $381,868 $505,131
KY W90JFF DDSP 3,494 613,178 616,672 $3,347 $121,393 $124,740
Corpus DDSP 132,673 342,578 475,251 $161,580 $260,675 $422,255
Shelby DDSP 125,684 345,675 471,359 $134,729 $176,609 $311,338
Limeston DDSP 51,438 319,273 370,711 $59,417 $157,837 $217,254
Hill DDSP 100,812 259,502 360,314 $111,216 $202,335 $313,551
Indiantown DDSP 95,412 199,544 294,956 $39,201 $27,541 $66,742
Hunter Ligget DDJC 46,869 225,034 271,903 $38,581 $32,835 $71,416
Atterbury DDSP 49,380 194,257 243,637 $62,836 $32,123 $94,959
McCoy DDSP 76,822 135,355 212,177 $71,423 $75,777 $147,200
Lackland DDSP 53,231 132,743 185,974 $49,538 $77,782 $127,319
Dix DDSP 81,673 92,098 173,771 $41,001 $36,107 $77,107
Hurlburt DDSP 69,973 97,159 167,132 $46,806 $64,653 $111,459
San Antonio DDSP 102,817 63,307 166,124 $170,042 $93,913 $263,955
IA W54CJX DDSP 65,423 96,257 161,680 $57,179 $71,693 $128,872
Seymour Johnson DDSP 57,271 95,849 153,120 $65,238 $36,561 $101,799
Tyndall DDSP 72,662 78,883 151,545 $51,794 $62,531 $114,324
Gordon DDSP 47,570 101,119 148,689 $40,465 $51,881 $92,346
Little Rock DDSP 75,817 69,940 145,757 $71,284 $50,070 $121,354
Corpus DDJC 24,023 117,062 141,085 $34,472 $122,537 $157,009
Andrews DDSP 55,643 75,887 131,530 $25,104 $18,261 $43,364
Belvoir DDSP 21,598 102,575 124,173 $10,980 $16,595 $27,575
OR W66MRR DDJC 32,735 75,981 108,716 $35,032 $39,199 $74,231
Barksdale DDSP 52,219 55,738 107,957 $62,035 $51,622 $113,657
OR W90AJG DDJC 572 102,521 103,093 $129 $29,047 $29,176
OH W24L9M DDSP 17,709 85,076 102,785 $9,095 $15,168 $24,263
Langley DDSP 29,959 71,972 101,931 $18,347 $16,436 $34,783
Shaw DDSP 35,057 66,776 101,833 $43,207 $25,970 $69,178
SOURCE: DSS GBH/MPH files, FY10.
NOTE: Excludes full truckload (shipmode A). Post locations from RAND-maintained DODAAC file. Tables includes Reserve/National Guard units (indicated with state and DODAAC). The table excludes most cases of secondary SDP shipment totals exceeding 100,000 pounds (e.g., DDSP to Fort Lewis).

- 55 -
Bibliography
Defense Logistics Agency, Military Standard Requisitioning & Issue Procedures (MILSTRIP) Manual. As of November 2010: http://www.dla.mil/j-6/dlmso/elibrary/manuals/milstrip/default.asp
Dumond, John, Define-Measure-Improve: The Change Methodology That Has Propelled the Army’s Successful Velocity Management Initiative, Santa Monica, Calif.: RAND Corporation, RB-3020, 2000. http://www.rand.org/pubs/research_briefs/RB3020.html
Dumond, John, et al., Velocity Management: The Business Paradigm That Has Transformed U.S. Army Logistics, Santa Monica, Calif.: RAND Corporation, MR-1108-A, 2001. http://www.rand.org/pubs/monograph_reports/MR1108.html
Headquarters, United States Army G-4, and Headquarters, Defense Logistics Agency (DLA), Performance Based Agreement (PBA), May 12, 2008.
USTRANSCOM, Defense Transportation Coordination Initiative (DTCI). As of November 2010: http://www.transcom.mil/dtci/