strategic & financial plan for value creation1).pdf · this document describes long-term trends...
TRANSCRIPT

1
STRATEGIC & FINANCIALPLAN FOR VALUE CREATIONFebruary 24, 2020

2
FORWARD LOOKING STATEMENTS
This document describes long-term trends and is not about the recently completed fiscal quarter.
This document contains forward-looking statements that involve risks, uncertainties and assumptions. If the risks or uncertainties ever materialize or the assumptions prove incorrect, actual results may differmaterially from those expressed or implied by such forward-looking statements and assumptions.
All statements other than statements of historical fact are statements that could be deemed forward-looking statements, including but not limited to any projections of net earnings, net earnings per share, free cashflow, operating profit, debt to EBITDA ratio, or other financial items; any statements of expectation or belief; any statements regarding HP’s long term plan, future strategy, potential future share repurchases, otherpotential returns of capital or any potential strategic transactions; any statements relating to the plans, strategies and objectives of management for future operations, including, but not limited to, our go-to-marketstrategy, the execution of restructuring plans and any resulting cost savings, including any projections of the amount, timing or impact of cost savings or restructuring or other charges, planned structural costreductions and productivity initiatives, net revenue or profitability improvements or other financial impacts; any statements concerning the expected development, performance, market share or competitiveperformance relating to products or services; any statements regarding current or future macroeconomic trends or events and the impact of those trends and events on HP and its financial performance; and anystatements of assumptions underlying any of the foregoing.
Risks, uncertainties and assumptions include factors relating to HP’s ability to execute on its strategic plan, including the recently announced initiatives, business model changes and transformation; execution ofplanned structural cost reductions and productivity initiatives; potential developments involving Xerox Holdings Corporation; HP’s ability to complete any contemplated share repurchases, other capital returnprograms or other strategic transactions; the need to address the many challenges facing HP’s businesses; the competitive pressures faced by HP’s businesses; risks associated with executing HP’s strategy, businessmodel changes and transformation; successfully innovating, developing and executing HP’s go-to-market strategy, including online, omnichannel and contractual sales, in an evolving distribution and resellerlandscape; successfully competing and maintaining the value proposition of HP’s products, including supplies; the impact of macroeconomic and geopolitical trends and events; the need to manage third-partysuppliers, manage HP’s global, multi-tier distribution network, limit potential misuse of pricing programs by HP’s channel partners, adapt to new or changing marketplaces and effectively deliver HP’s services;challenges to HP’s ability to accurately forecast inventories, demand and pricing, which may be due to HP’s multi-tiered channel, sales of HP’s products to unauthorized resellers or unauthorized resale of HP’sproducts; the protection of HP’s intellectual property assets, including intellectual property licensed from third parties; risks associated with HP’s international operations; the development and transition of newproducts and services and the enhancement of existing products and services to meet customer needs and respond to emerging technological trends; the execution and performance of contracts by HP and itssuppliers, customers, clients and partners; the hiring and retention of key employees; integration and other risks associated with business combination and investment transactions; the results of the restructuringplans, including estimates and assumptions related to the cost (including any possible disruption of HP’s business) and the anticipated benefits of the restructuring plans; disruptions in operations from systemsecurity risks, data protection breaches, cyberattacks, extreme weather conditions, medical epidemics or pandemics such as the novel coronavirus, and other natural or manmade disasters or catastrophic events; theimpact of changes in tax laws, including uncertainties related to the interpretation and application of the Tax Cuts and Jobs Act of 2017 on HP’s tax obligations and effective tax rate; the resolution of pendinginvestigations, claims and disputes; and other risks that are described in HP’s Annual Report on Form 10-K for the fiscal year ended October 31, 2019, and HP’s other filings with the SEC.
Certain financial information set forth in this document reflects estimates based on information available at this time. While HP believes these estimates to be reasonable, these amounts could differ materially fromamounts reported in HP’s Quarterly Reports on Form 10-Q for the fiscal quarters ended January 31, 2020, April 30, 2020 and July 31, 2020, Annual Report on Form 10-K for the fiscal year ended October 31, 2020,and HP’s other filings with the Securities and Exchange Commission. HP assumes no obligation and does not intend to update these forward-looking statements. HP’s Investor Relations website athttp://investor.hp.com contains a significant amount of information about HP, including financial and other information for investors. HP encourages investors to visit its website from time to time, as information isupdated, and new information is posted. The content of HP’s website is not incorporated by reference into this document or in any other report or document HP files with the SEC, and any references to HP’s websiteare intended to be inactive textual references only.

3
OTHER IMPORTANT INFORMATION
Important Information
This document is not an offer to purchase or a solicitation of an offer to sell any securities. If a tender offer or exchange offer is commenced, HP will file with the SEC a solicitation/recommendation statement onSchedule 14D-9. Any solicitation/recommendation statement filed by HP that is required to be mailed to stockholders will be mailed to HP stockholders. HP STOCKHOLDERS ARE ADVISED TO READ HP’sSOLICITATION/RECOMMENDATION STATEMENT ON SCHEDULE 14D-9 AND ANY OTHER RELEVANT DOCUMENTS FILED WITH THE SEC IF AND WHEN THEY BECOME AVAILABLE BEFORE MAKING ANY DECISION WITHRESPECT TO ANY EXCHANGE OFFER BECAUSE THEY WILL CONTAIN IMPORTANT INFORMATION. Stockholders may obtain free copies of the solicitation/recommendation statement on Schedule 14D-9 (when available),as well as any other documents filed by HP in connection with any tender offer or exchange offer, without charge at the SEC’s website at www.sec.gov.
HP intends to file a proxy statement with the U.S. Securities and Exchange Commission (the “SEC”) in connection with the solicitation of proxies for the 2020 Annual Meeting of Stockholders. Any definitive proxystatement and a white proxy card will be mailed to HP’s stockholders. HP STOCKHOLDERS ARE URGED TO READ ANY PROXY STATEMENT AND OTHER RELEVANT MATERIALS IF AND WHEN THEY BECOME AVAILABLEBECAUSE THEY WILL CONTAIN IMPORTANT INFORMATION. These and other SEC filings made by HP may be obtained (when available) without charge at the SEC’s website at www.sec.gov and at the investor relationssection of HP’s website at http://www.hp.com. In addition, investors and security holders will be able to obtain free copies of these documents from HP by directing a request to Investor Relations, 1501 Page MillRoad, Palo Alto, CA 94304, or by calling (650) 857-1501.
Certain information contained in this document and statements made orally during this presentation relates to or is based on publications and other data obtained from third-party sources. While we believe thesethird-party sources to be reliable as of the date of this presentation, we have not independently verified, and make no representation as to the adequacy, fairness, accuracy or completeness of, any informationobtained from such third-party sources. Permission to use quotes was neither sought nor obtained.
Certain Information Concerning Participants
HP and certain of its directors and executive officers may be deemed to be participants in the solicitation of proxies under the rules of the SEC. HP stockholders may obtain information regarding the names,affiliations and interests of HP’s directors and executive officers in HP’s Annual Report on Form 10-K for the year ended October 31, 2019, which was filed with the SEC on December 12, 2019, and its proxy statementfor the 2019 Annual Meeting of Stockholders, which was filed with the SEC on February 26, 2019. To the extent holdings of HP securities have changed since the amounts printed in the proxy statement for the 2019Annual Meeting, such changes have been or will be reflected on Statements of Change in Ownership on Form 4 filed with the SEC. These documents can be obtained free of charge from the sources indicated above.Additional information regarding the interests of these participants in any proxy solicitation and a description of their direct and indirect interests, by security holdings or otherwise, will also be included in the proxystatement to be filed by HP with the SEC in connection with the 2020 Annual Meeting, if and when it becomes available.
4
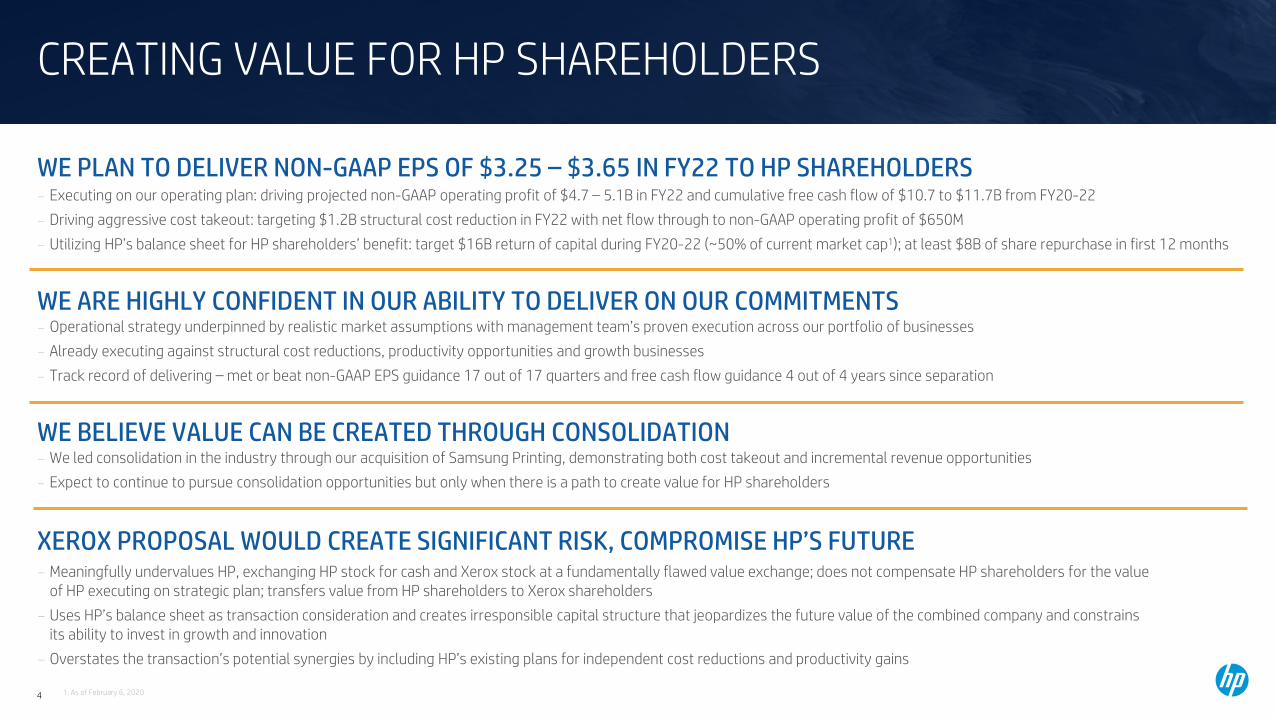
CREATING VALUE FOR HP SHAREHOLDERS
WE ARE HIGHLY CONFIDENT IN OUR ABILITY TO DELIVER ON OUR COMMITMENTS
WE PLAN TO DELIVER NON-GAAP EPS OF $3.25 – $3.65 IN FY22 TO HP SHAREHOLDERS
WE BELIEVE VALUE CAN BE CREATED THROUGH CONSOLIDATION
- Executing on our operating plan: driving projected non-GAAP operating profit of $4.7 – 5.1B in FY22 and cumulative free cash flow of $10.7 to $11.7B from FY20-22- Driving aggressive cost takeout: targeting $1.2B structural cost reduction in FY22 with net flow through to non-GAAP operating profit of $650M- Utilizing HP’s balance sheet for HP shareholders’ benefit: target $16B return of capital during FY20-22 (~50% of current market cap1); at least $8B of share repurchase in first 12 months
- Operational strategy underpinned by realistic market assumptions with management team’s proven execution across our portfolio of businesses - Already executing against structural cost reductions, productivity opportunities and growth businesses- Track record of delivering – met or beat non-GAAP EPS guidance 17 out of 17 quarters and free cash flow guidance 4 out of 4 years since separation
- We led consolidation in the industry through our acquisition of Samsung Printing, demonstrating both cost takeout and incremental revenue opportunities- Expect to continue to pursue consolidation opportunities but only when there is a path to create value for HP shareholders
- Meaningfully undervalues HP, exchanging HP stock for cash and Xerox stock at a fundamentally flawed value exchange; does not compensate HP shareholders for the value of HP executing on strategic plan; transfers value from HP shareholders to Xerox shareholders
- Uses HP’s balance sheet as transaction consideration and creates irresponsible capital structure that jeopardizes the future value of the combined company and constrains its ability to invest in growth and innovation
- Overstates the transaction’s potential synergies by including HP’s existing plans for independent cost reductions and productivity gains
XEROX PROPOSAL WOULD CREATE SIGNIFICANT RISK, COMPROMISE HP’S FUTURE
1. As of February 6, 2020

5
XEROX PROPOSAL CREATES SIGNIFICANT RISK & COMPROMISES HP’S FUTURE
FLAWEDVALUE EXCHANGE
IRRESPONSIBLECAPITAL STRUCTURE
TRANSFERS VALUE FROM HP SHAREHOLDERS
Values HP’s leading Print & Personal Systems business@ 7.0x P/E¹ - $59B revenue base ( 66% PS, 34% Printing) with
#1 or #2 position in PC or Print in 49 countries²
- FY’16-19 revenue growth of $10.5B withstrong earnings and cash flow growth
- Growth opportunities across geographiesand in new businesses
Values Xerox @ $37.68 – 9.4x P/E¹- Xerox revenue base of $9.1B, a decline of $1.7B
over last 3 years3
- Operating profit increased by only $22M4 despite $640M in gross savings in FY19
- Unclear long-term technology / supply roadmap
Utilizes HP balance sheet to fund transaction consideration- ~$15 of the $18.40 cash consideration / share
funded by HP cash and debt capacity
- Reduces HP shareholder participation to less than 50%, doubles Xerox shareholder participation to over 50%
Capital structure creates significantgoing concern risk- Proposed capital structure lacks understanding of HP’s working
capital dynamics
- Xerox Proposal Debt / EBITDA5: 4.5x
- Print Peers5: 1.2x
- PC Oriented Peers5: 1.5x
- No companies in S&P hardware index have Debt/EBITDA5 > 3.5 x
Reduces go forward capital return- Suspends buyback indefinitely
- Reduces dividends per share to HP shareholders by 79% from$0.70/share to $0.15/share6
1. Implied HP P/E based on Xerox’s proposal valuing HP at $24/share and the mid-point of HP’s FY22 guidance of $3.25 - $3.65. Xerox P/E based on XRX stock price as of February 6, 2020, and the XRX FY22 consensus estimate of $4.01.2. Data represents HP internal classification for total PC’s and Home + Office based on IDC 4Q19 reported3. Xerox as reported revenue of $10.8B in CY2016 and $9.1B in CY2019.4. Xerox operating profit excludes impact of $77M of one-time OEM fee in FY2019.5. Print peers include Epson, Canon, and Brother. PC oriented peers include Acer, Asus and Lenovo. Debt / FY2019 Non-GAAP EBITDA for S&P 500 Technology Hardware & Equipment Index. Peer calendarized to October FYE. XRX reflects Dec FYE financials.6. HP’s annual dividend per share of ~$0.70 calculated by annualizing quarterly FY20 dividends of ~$0.18 per share.HP’s PF dividend per share
of ~$0.15 calculated by multiplying the exchange ratio of 0.149x (as of 06-Feb-2020) by Xerox’s stated PF dividends per share of $1.00 per share.
Xerox $2B synergy estimates attempt to transfer value of HP cost actions- HP is already executing on our $1.2B
structural cost savings plan and more than $1B of ongoing productivity actions
- HP estimates potential synergies from a combination of ~$1B
HP private 5

6
TARGETING NON-GAAP EPS GROWTH OF 45% TO 63% FROM FY19 TO FY22
DELIVERINGVALUE
$3.25 – $3.65Non-GAAP EPS
(FY22)
$4.7 – $5.1B $10.7 – $11.7B
PROFITABLE GROWTH &STRONG FREE CASH FLOW
~$16B
ENHANCED CAPITAL RETURN & OPTIMIZE BALANCE SHEET
Projected non-GAAP Operating Profit FY22
Projected Cumulative Free Cash Flow(FY20-FY22)
Projected Cumulative Capital Return(FY20-FY22)
At least $8BProjected share repurchase in the first 12 months
following 2020 Annual Meeting of Stockholders

7
EXECUTIONAL EXCELLENCE UNDERSCORESOUR RELENTLESS FOCUS ON COST SAVINGS
FY20-FY22 STRUCTURAL COST REDUCTION & PRODUCTIVITY SAVINGS
Projected operating profit flow thru of ~$650M by FY22
Operating Model $400M
Business Units & Operations $280M
Service & Commercial Excellence $170M
Corporate Function $240M
Digitization $110M
Pricing and increased competitiveness
Ongoing ProductivitySavings
13-16% of Total HC HeadcountReduction
7,000 – 9,000Restructuring Gross
Run Rate Savings
$1.2B
Material cost reductions
Logistics network efficiency
Reduced third party spend
Consolidation of vendors
>$1.0B

8
CLEAR LINE OF SIGHT TO ~$650M IN NET FLOW THROUGH
Target Gross Savingsby Year-end
Transition from 3 regions to 1 Commercial office
Migration to R&D Centers of Excellence
Standardization of global processes (category planning & operations, sales operations, pricing, field sales motions)
Optimization of coverage
Software assets and Print applications portfolio consolidation - from 12 to 2
Enablement of lean product and process development
Growth of digital support services (e.g., bots, self-service, device self-healing) – increasing to 75% self-serviceInfrastructure / automated diagnostics to reduce support interventions
Standardized support levels
Location strategy: close sites
Operational business reporting and automation End to end business planning automation
Standardization of global HP reportingCreation of Reporting Center of Excellence
NA and EMEA Print business deployed onto new ERP platform Full ERP deployment, from 13 platforms to 1 (APJ, Mfg, Finance)
Core Print firmware – reduction of 5 platforms to 2
Location strategy: close sites
Consolidation of Marketing functions under CMO
Consolidation of R&D Management and Print CoEs
Enhancement of product quality to improve cost structure and customer experience
Call center consolidation
Expansion of outsourced services
Streamlining Marketing spend, events, and production agencies
Optimization of factory locations
End to end freight management optimization
Digital process enablement
Location strategy: close sites
FY20 FY21 FY22
40% Year 1 75% Year 2 100% Year 3
OperatingModel
BusinessUnits &
Operations
Service &CommercialExcellence
CorporateFunction
Digitize
Christoph SchellChief Commercial Officer
Vikrant BatraChief Marketing Officer
Tuan TranPresident, Imaging,Printing & Solutions
Alex ChoPresident of
Personal Systems
Antoine SimonnetHead of Supply Chain
Kim RiveraPresident, Strategy
& Business Management,Chief Legal Officer
Christoph SchellChief Commercial Officer
Vikrant BatraChief Marketing Officer
Kim RiveraPresident, Strategy
& Business Management,Chief Legal Officer
Steve FielerChief Financial Officer
Richard BaileyChief Transformation
Officer
OWNERS

9
Revenue growthat or above market
Operating profit
3.5 – 5.5%Grow OP $
CREATING VALUE BY ADVANCING LEADERSHIP IN PERSONAL SYSTEMS
LONG-TERMOPERATING MODEL
Growing TAM- Large & growing $330B+ TAM5
Improving mix- Increase mix in higher-engagement, higher-value segments
including attach, gaming ecosystem and device services
Innovation and execution- Innovate & reinvent computing experiences - Increase lifetime value of large installed base- Accelerate services & solutions
Cost reductions- Drive cost productivity & efficiency
Profitable share growth- Gain profitable share in higher value, premium segments
DRIVING OPERATINGPROFIT GROWTH
MARKET LEADERSHIP
PC ClientShare2
24%Share in
APJ3
#2Share in America
& EMEA3
#1
Net Promoter Score4
Consumer Premium PC
+14 pts
1. HP 2019 & 2016 10K Reported Financial Data2. HP Unit Share for HP CQ4’19 from IDC PCD WW Quarterly Tracker CQ4’19, inclusive of Desktop, Notebook,
Workstation, and excluding detachables. 3. IDC PCD WW Quarterly Tracker CQ4’19, inclusive of Desktop, Notebook, Workstation and excluding detachables.
Other OS includes MacOS, and unnamed others in IDC data. Other CPU includes Rockchip, Mediatek, Samsung, Qualcomm, Nvidia, VIA, Baikal and unnamed others
4. Consumer Premium NPS growth for Spectre devices. Based on registered user surveys via Medallia, Products shipped on CY19 vs CY18.
5. TAM based on HP internal analysis. Projections based on currently available data and estimates.
FY16 FY19
$1.2 $1.9
+18% CAGR
FY16 FY19
$29.9
$38.7
+9% CAGROperating Profit ($B)1Revenue ($B)1

10
CREATING VALUE BY ADVANCING LEADERSHIP IN PRINT
1. HP 2019 & 2016 10K Reported Financial Data2. Data represents HP internal classification for Office, Home and Graphics based on 19CQ4 IDC reported3. 3D Hubs Manufacturing Network 4. TAM based on HP internal analysis. Projections based on currently available data and estimates.
Large TAM- Large and stable $200B+ TAM4
- Growth in graphics / 3D
Increase Supplies share- Leverage Ink playbook to improve Share in Toner Supplies
Disrupt in industrial businesses- Graphics: Drive analog to digital transformation- 3D: Massive opportunity to transform manufacturing with
highly differentiated IP
Grow contractual- Grow Instant Ink & Managed Print Services
Reduced cost- Drive structural cost reduction across the business
Expand hardware margins- Improve hardware profitability & optimize portfolio to reduce
the number of unprofitable customers
Revenue growthat or above market
Operating profit
16 – 18%Grow OP $
Most used industrial3D printer
3D3
Office2
1#Graphics2
#1Home2
#1
FY16 FY19FY16 FY19
$18.1$20.1
$3.1 $3.2
+3% CAGR
+1% CAGR
LONG-TERMOPERATING MODEL
DRIVING OPERATINGPROFIT GROWTH
MARKET LEADERSHIPOperating Profit ($B)1Revenue ($B)1

11
OPTIMIZING BALANCE SHEET & MAINTAININGCOMMITMENT TO AGGRESSIVE CAPITAL RETURNS
COMMITTED TO AGGRESSIVE RETURN OF CAPITAL TO SHAREHOLDERS
UTILIZING BALANCE SHEET STRENGTH
- Target gross leverage ratio 1.5x - 2.0x Debt / EBITDA
- Deploy excess cash on balance sheet & utilize debt capacity
- Commitment to maintain investment grade rating & strong balance sheet
- Target ~$16B return of capital during FY20-22; at least $8B of share repurchase over first 12 months
- Target long-term return of capital of 100% of free cash flow, unless higher ROI opportunities emerge
- Increase total share repurchase authorization to $15B, previously authorized $5B in October 2019
- Grow dividend per share at least in-line with earnings
- Pursue disciplined, value-creating, accretive M&A

12
FY19 non-GAAP EPS Business contribution 75% CapitalReturn/Other
Operational FY22non-GAAP EPS
Increased Capital Return FY22 non-GAAP EPSOutlook
$2.90 – $3.10+/- $0.41
+/- $0.35
$3.25 – $3.65
+$650M OP dollars from structural cost reductionRoughly flat revenue in line with markets
No material change to tax rate or OI&E
75% return of capital
EXECUTING ON OUR VALUE CREATION PLANFY19 TO FY22 NON-GAAP EPS OUTLOOK
Incremental upfront share repurchaseHigher OI&E
100% return of capital
OPERATIONAL PLANExecuting on profitable growth and cash flow generation
INCREASED CAPITAL RETURN
$2.24(non-GAAP)
+/- $0.45
1
1. FY19 GAAP EPS was $2.07

13
HP HAS CONSISTENTLY DELIVERED ON COMMITMENTS
EXPERIENCED CAPITAL ALLOCATOR ACROSSCONSOLIDATION & OTHER TRANSACTIONS
CREATING NEW BUSINESSES
Streamlined portfolio in Print
Largest, most complex transaction at the time
GAAP EPS growth
DELIVERING CONSISTENT PERFORMANCEBY GROWING TOP AND BOTTOMLINE
DISCIPLINED CAPITAL RETURN
Revenue Growth Profit Growth
3D & Digital Manufacturing Gaming Instant Ink
Marketing Optimization Software Assets
Cumulative cash flow from op. (Last 3 years)
$12.9BCumulative free cash flow
(Last 3 years)
$11.5B
Capital returned to shareholders(Last 3 years)
$9.1BFY16 FY19
$48B $59B
Beat or metconsensus non-GAAP
EPS for 17/17of past quarters
45%
40% Non-GAAP EPS growth(FY16-FY19)
Accelerate disruption in A3 segment through acquisition
of printer business
Printing
2017Acquisition
2016Divestiture
2015Separation
$10.5B
Most used Industrial 3D Printer1
$0 $1Bin 18 months2
6M+subscribers
1. 3D Hubs Manufacturing Network2. HP Omen total revenue from launch in FYQ3’16 to FYQ4’17

14
EXECUTING ON OUR VALUE CREATION PLAN
OUR STRATEGY IS WORKINGAdvancing our leadership in Personal Systems & Print,
disrupting industrial businesses and transforming the way we work
We plan to delivernon-GAAP EPS of$3.25 – $3.65 in FY22
Additional value creation opportunity through consolidation
Experienced management team, highly confident in our ability to deliveron our commitments
14

15
SUPPLEMENTAL MATERIALS

16
EXECUTION ACROSS OUR PORTFOLIO OF LEADING BUSINESSES

17
39%PS Notebooks
HP IS A GLOBAL LEADER WITH A DIVERSE PORTFOLIO AND GLOBAL SCALE BUILT ON A PLATFORM OF STRONG IP AND INNOVATION
CREATING LONG-TERM SHAREHOLDER VALUE
MARKET LEADER WITHBROADER PORTFOLIO
RECOGNIZED LEADER SCALE & REACH
Market Leader#1 or #2
In Print or PC in 49 Countries2
22%Print
Supplies
12%Print
Hardware
27%PS Desktops
& Other
$59BFY19
Revenue
Optimized Supply Chain
Innovation & IP
27K+Patents1
Robust Ecosystem
250KChannel Partners1
1Printer per sec1
2PCs per sec1
#6
#1
#11
* Reprinted with permission from Barron’s, Newsweek and Wall Street Journal1. As of FY192. Data represents HP internal classification for total PC’s and Home + Office based on IDC 4Q19 reported

18
FY16 FY19 FY16 FY19
CREATING VALUE BY ADVANCINGLEADERSHIP IN PERSONAL SYSTEMS
MARKETLEADERSHIP
PERSONAL SYSTEMSGROWTH
KEY DRIVERSFOR GROWTH
Share inAPJ2
#2Share in America2
#1Share inEMEA2
#1
Revenue ($B)1
+9% CAGR
Operating Profit ($B)1
+18% CAGR
29.7% 28.4% 15.1%
TAM Growth+4.3% CAGR3
Innovation &Operational Excellence
50+ ‘Best of CES’ 2020 Awards4
Profitable share gain & mix+3.2% share gain in Premium5
$29.9
$38.7
$1.2$1.9
1. HP 2019 & 2016 10K Reported Financial Data2. HP Unit Share for HP CQ4’19 from IDC PCD WW Quarterly Tracker CQ4’19, inclusive of Desktop,
Notebook, Workstation, and excluding detachables. 3. TAM based on HP internal analysis, CY’19-’23. Projections based on currently available data and estimates.4. #1 award in ‘Product’ category, and not considering iPad as a PC. #1 of 206 brands in Computer Product
category based on the cumulative award points from 2016-20205. HP Unit Share, CQ4’19 vs. CQ4, 16, from IDC PCD WW Quarterly Tracker CQ4’19, inclusive of Desktop,
Notebook, Workstation, and excluding detachables. Premium: Commercial >$999, Consumer>$799.
19
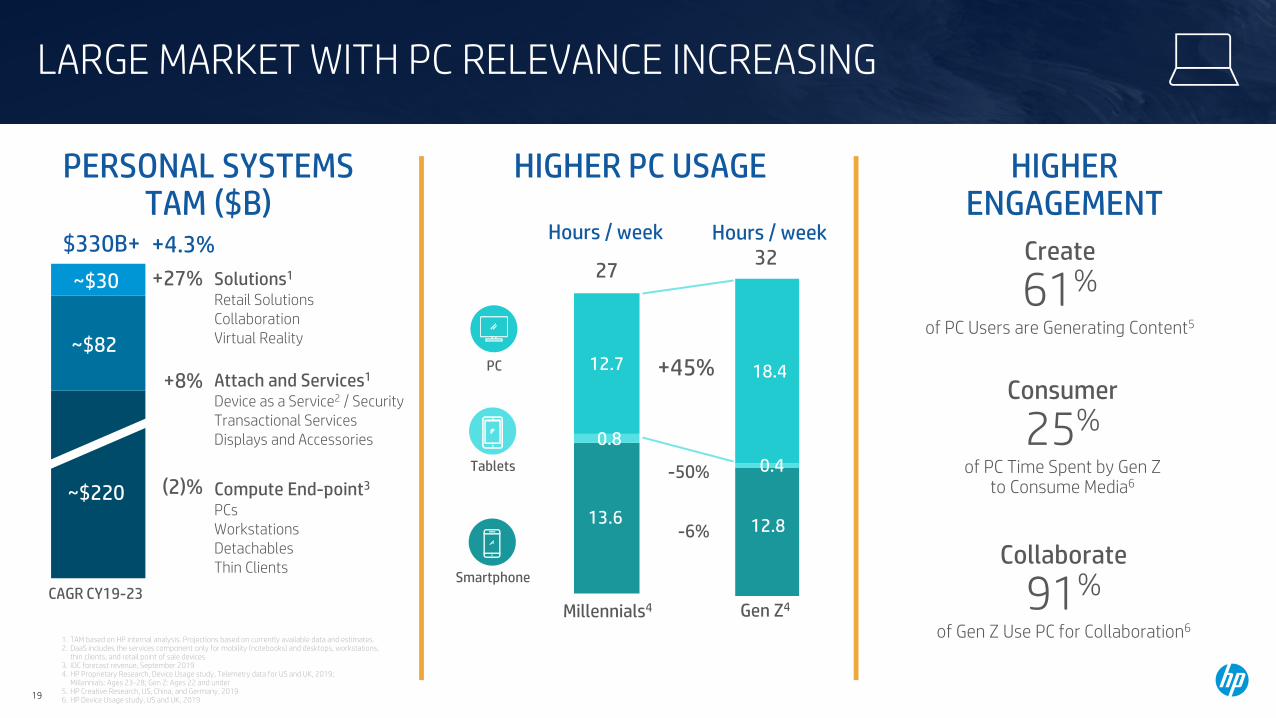
LARGE MARKET WITH PC RELEVANCE INCREASING
13.6
0.8
12.7
12.8
0.4
18.4
CAGR CY19-23
+4.3%$330B+
Gen Z4Millennials4
Tablets
Smartphone
PC
-6%
-50%
Solutions1
Retail SolutionsCollaborationVirtual Reality
~$30
~$82
~$220
Attach and Services1
Device as a Service2 / SecurityTransactional ServicesDisplays and Accessories
Compute End-point3
PCsWorkstationsDetachablesThin Clients
+27%
+8%
(2)%
+45%
HIGHER PC USAGEPERSONAL SYSTEMSTAM ($B)
1. TAM based on HP internal analysis. Projections based on currently available data and estimates.2. DaaS includes the services component only for mobility (notebooks) and desktops, workstations,
thin clients, and retail point of sale devices3. IDC forecast revenue, September 20194. HP Proprietary Research, Device Usage study, Telemetry data for US and UK, 2019;
Millennials: Ages 23-28; Gen Z: Ages 22 and under5. HP Creative Research, US, China, and Germany, 2019 6. HP Device Usage study, US and UK, 2019
Hours / week
27
Hours / week32
HIGHERENGAGEMENT
Create
61%of PC Users are Generating Content5
Consumer
25%of PC Time Spent by Gen Z
to Consume Media6
Collaborate
91%of Gen Z Use PC for Collaboration6
20
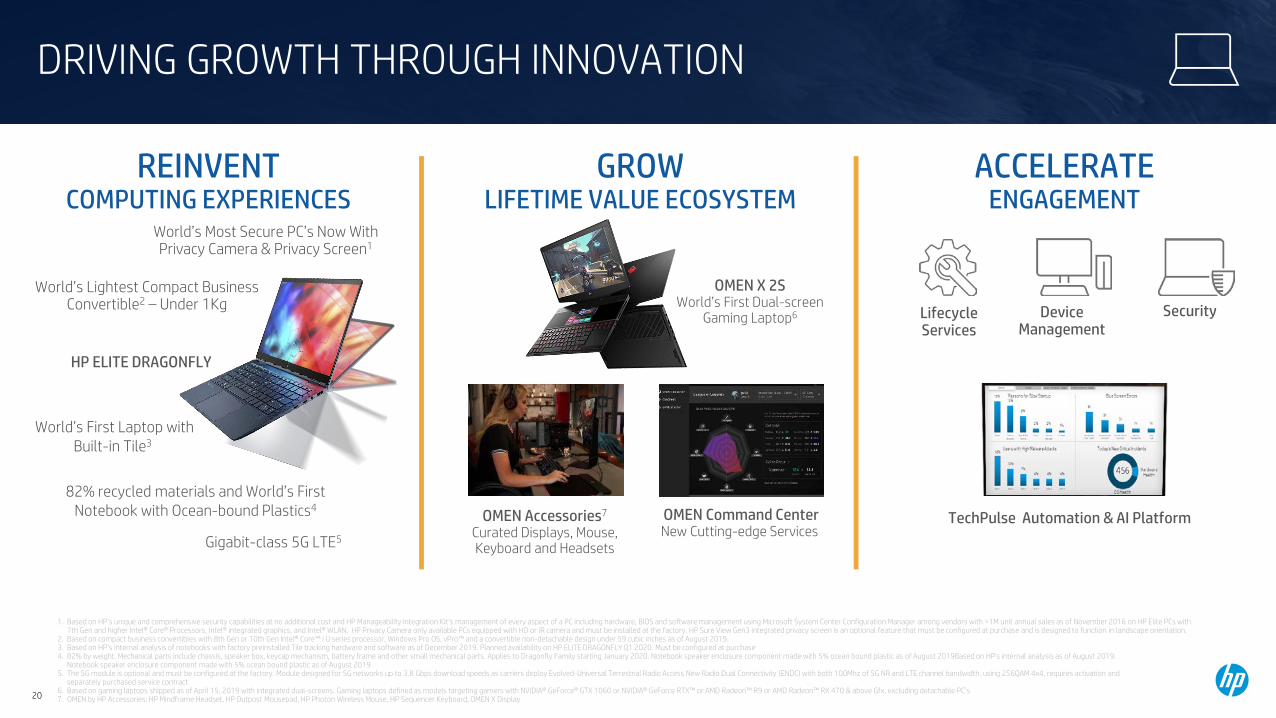
DRIVING GROWTH THROUGH INNOVATION
HP ELITE DRAGONFLY
82% recycled materials and World’s First Notebook with Ocean-bound Plastics4
World’s Lightest Compact Business Convertible2 – Under 1Kg
World’s Most Secure PC’s Now With Privacy Camera & Privacy Screen1
World’s First Laptop with Built-in Tile3
OMEN X 2SWorld’s First Dual-screen
Gaming Laptop6
OMEN Command CenterNew Cutting-edge Services
OMEN Accessories7
Curated Displays, Mouse, Keyboard and Headsets
TechPulse Automation & AI Platform
1. Based on HP’s unique and comprehensive security capabilities at no additional cost and HP Manageability Integration Kit’s management of every aspect of a PC including hardware, BIOS and software management using Microsoft System Center Configuration Manager among vendors with >1M unit annual sales as of November 2016 on HP Elite PCs with7th Gen and higher Intel® Core® Processors, Intel® integrated graphics, and Intel® WLAN. HP Privacy Camera only available PCs equipped with HD or IR camera and must be installed at the factory. HP Sure View Gen3 integrated privacy screen is an optional feature that must be configured at purchase and is designed to function in landscape orientation.
2. Based on compact business convertibles with 8th Gen or 10th Gen Intel® Core™ i U series processor, Windows Pro OS, vPro™ and a convertible non-detachable design under 59 cubic inches as of August 2019.3. Based on HP’s internal analysis of notebooks with factory preinstalled Tile tracking hardware and software as of December 2019. Planned availability on HP ELITE DRAGONFLY Q1 2020. Must be configured at purchase4. 82% by weight. Mechanical parts include chassis, speaker box, keycap mechanism, battery frame and other small mechanical parts. Applies to Dragonfly Family starting January 2020. Notebook speaker enclosure component made with 5% ocean bound plastic as of August 2019Based on HP's internal analysis as of August 2019.
Notebook speaker enclosure component made with 5% ocean bound plastic as of August 20195. The 5G module is optional and must be configured at the factory. Module designed for 5G networks up to 3.8 Gbps download speeds as carriers deploy Evolved-Universal Terrestrial Radio Access New Radio Dual Connectivity (ENDC) with both 100Mhz of 5G NR and LTE channel bandwidth, using 256QAM 4x4, requires activation and
separately purchased service contract6. Based on gaming laptops shipped as of April 15, 2019 with integrated dual-screens. Gaming laptops defined as models targeting gamers with NVIDIA® GeForce® GTX 1060 or NVIDIA® GeForce RTX™ or AMD Radeon™ R9 or AMD Radeon™ RX 470 & above Gfx, excluding detachable PC’s 7. OMEN by HP Accessories: HP Mindframe Headset, HP Outpost Mousepad, HP Photon Wireless Mouse, HP Sequencer Keyboard, OMEN X Display
Gigabit-class 5G LTE5
SecurityLifecycle Services
Device Management
GROWLIFETIME VALUE ECOSYSTEM
REINVENTCOMPUTING EXPERIENCES
ACCELERATEENGAGEMENT

21
LEVERAGING POSITION OF STRENGTH FOR CONTINUED GROWTH
SHARE IN HIGHERVALUE CATEGORIES
PC MARKET SHARE EVOLUTION
PC LANDSCAPE DIVERSIFYING: OS & CPU
1. IDC PCD WW Quarterly Tracker CQ4’19, inclusive of Desktop, Notebook, Workstation and excluding detachables. Other OS includes MacOS, and unnamed others in IDC data. Other CPU includes Rockchip, Mediatek, Samsung, Qualcomm, Nvidia, VIA, Baikal and unnamed others 2. HP Unit Share for HP CQ4’19 and Share Growth over CQ416 from IDC PCD WW Quarterly Tracker CQ4’19, inclusive of Desktop, Notebook, Workstation, and excluding detachables. Premium: Commercial >$999, Consumer>$799. Devices branded as Gaming by IDC. ‘Rest of PC’ excludes Gaming & Premium.3. Unit share data for HP CQ3’19 and share change over CQ316. HP internal analysis of purpose built POS systems from IHL Q3 POS Shipment Report4. Based on HP’s internal analysis of computing platforms including mobiles (Laptops, Convertibles, Detachables, Tablets, and Mobile WS) and desktops (including AiOs and workstations), RPOS, thin clients, purpose built for healthcare, VR non-gaming backpacks offering Windows, Linux, FreeDOS, Chrome, Android, Mac, iOS and Intel, AMD,
Qualcomm, Mediatek and ARM processors and excluding refurbished products, phones and servers based on competitors’ official publicly available websites as of Feb 4, 2020.
HP Under-indexed but Gaining ShareScale and Innovation Driving HP’s Growth(IDC PC Client Unit share1)
HP has Industry’s Broadest Computing Portfolio across CPU and OS4
(IDC PC Client Unit Mix1)
16.6%20.9%
23.6%
20192013 2016
HP Share Growth
HP UnitShare
Premium2 +3.2 pts 21.9%
Gaming2 +4.4 pts 11.4%
RetailPoint of Sale3 +5.8 pts 13.0%
Rest of PC2 +1.8 pts 25.7% 8% 8%
4% 6%
86%
20192016
87%
Chrome
Windows
Others
9%15%
90%
85%
0%
20160%
2019
AMD
Intel
Others

22
TAM growth
Innovation
Profitable share gain
Improved mix
Cost reduction
DELIVERING STRONG PERSONAL SYSTEMS PERFORMANCE
LONG-TERMOPERATING MODEL
FOUNDATION FOR VALUE CREATION
+
Revenue growthat or above market
Operating profit
3.5 – 5.5%Grow OP $

23
CREATING VALUE BY ADVANCING LEADERSHIP IN PRINT
PRINTGROWTH
GROW NEWOPPORTUNITIES
1. HP 2019 & 2016 10K Reported Financial Data2. Data represents HP Internal classification for Office, Home and Graphics based on IDC 4Q19 reported3. Managed Print Services defined as direct, indirect (partner MPS, channel MPS), support services and owned channel4. 3D Hubs Manufacturing Network
#1
MARKETLEADERSHIP
Office2
#1
Home2
#1
Graphics2
3D
Most used industrial3D printer4
SubscribersCreated and ScaledInstant Ink Business
6M+
FY16-FY19Managed
Print Services growth3
>60%
FY16 FY19FY16 FY19
$18.1
$20.1
$3.1 $3.2
+3% CAGR
+1% CAGR
Revenue ($B)1 Operating Profit ($B)1

24
PRINT MARKET IS LARGE AND STABLE
PRINT PAPER MARKET(TONS M)
PRINT MARKET OPPORTUNITY(REVENUE $B)
16.716.917.216.5 16.8 16.917.2 17.2 17.0 17.0 17.1 17.1 17.0 16.7 16.8
CY10CY20
CY24CY10
Office
CY20
Home
$206$211
CY24
Media
$213
Graphics
$213$205
$212 $210 $207 $205 $207 $206 $206 $206 $206 $207
Source: RISI Global 2018Source: HP Market Size analysis

25
EXECUTING A CONSISTENT STRATEGY
EVOLVINGMARKETPLACE
PRINT STRATEGY
HP private 25
Office market is flatHome market is declining
Growing Graphics & 3D
Emergence ofEverything as a Service
model
Imitation Suppliesexploiting market
inefficiency
- Execute ink share gain playbook in tonerIncrease Supplies share
- Continue to build on success in growingconsumer & commercial contractual businessGrow contractual
- Address market inefficiency by rebalancing system value towards hardware
- Reduce number of unprofitable customersOptimize system profitability
- Lead the analog to digital transformation in graphics
- Disrupt with 3D & Digital ManufacturingGrow Graphics & 3D
IncreaseSupplies Share
GrowContractual
Optimize System Profitability
Grow Graphics and 3D
26 Note: HP internal analysis
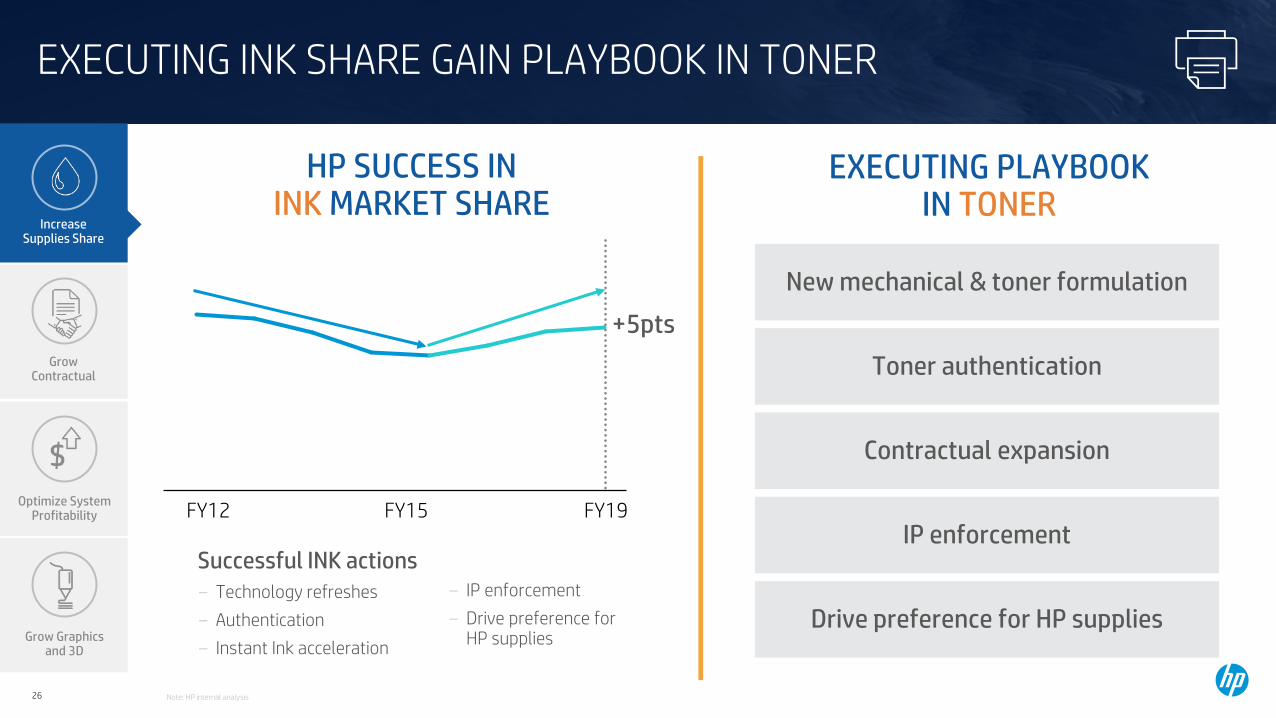
EXECUTING INK SHARE GAIN PLAYBOOK IN TONER
New mechanical & toner formulation
Toner authentication
Contractual expansion
IP enforcement
Drive preference for HP supplies
Successful INK actions - Technology refreshes- Authentication- Instant Ink acceleration
FY19FY12 FY15
- IP enforcement- Drive preference for
HP supplies
GrowContractual
Optimize System Profitability
Grow Graphics and 3D
+5pts
HP SUCCESS ININK MARKET SHARE
EXECUTING PLAYBOOKIN TONER
IncreaseSupplies Share

27
- Market leading innovator and disruptor4
- #1 in security5
1. HP Analysis, compared with traditional customers for Deskjet, Envy, Officejet customers2. For customers remaining enrolled after 12 months3. Managed Print Services defined as Direct, Indirect (partner MPS + channel MPS) + Support Services + Owned Channel4. Quocirca, PRINT2025: The journey to digital reinvention, Quocirca, Louella Fernandes, November 2019 (Second Edition)5. HP’s most advanced embedded security features are available on HP Enterprise-class devices with FutureSmart firmware 4.5 or above and is
based on HP review of 2018 published embedded security features of competitive in-class printers. For more information, visit: hp.com/go/printersecurityclaims6. HP Office Contractual revenue7. Company Annual Reports; Total company revenue change FY16-FY19, used as a proxy for contractual revenue growth
HP SUCCESS IN CONSUMER AND OFFICE CONTRACTUAL GROWTH
CONSUMER SERVICES:INSTANT INK
INSTANT INK SUBSCRIBER GROWTH
COMMERCIAL SERVICES:MANAGED PRINT SERVICES
>6M+Subscribers
3XFY16 vs. FY19
- 20% higher usage per customer1
- 20% longer printer life1
- >90% customer retention2
- Enabled by scaled cloud infrastructure
>60%6
FY16 – FY19 Contractual Revenue Growth
HP is Outperforming Xerox
-16%7
$2.8B3
FY19 RevenueGrow
Contractual
Optimize System Profitability
Grow Graphics and 3D
IncreaseSupplies Share

28
ADDRESS MARKET INEFFICIENCY & REDUCEUNPROFITABLE CUSTOMERS
Least profitable customers
Most profitable customers
Cust
omer
prof
itabi
lity
CUSTOMER PROFITABILITYSNAPSHOT
Opportunity- ~25% of customers are not profitable: they don’t buy HP supplies or they
use imitation supplies- By shifting more business to upfront, contractual, and optimized pricing
models, HP has an opportunity to evolve print business profitability- Strategy enabled by big data built on unique cloud infrastructure developed
over past 3 years
Customer choice- End to End System:
Rewards loyal customers that use HP Printer and HP Supplies - Flexible System:
Customers that want choice of Supplies pay full value for Hardware
Confidence- Customer research1: 8 of 10 customers believe End to End is a better value
vs. the traditional model, 3 of 10 competition print customers switch preference from competition to HP End to End
Focus on total system value- Customer choice with better value for loyal customers- Increased Hardware Gross Margin- Maximize system value
GrowContractual
Optimize System Profitability
Grow Graphics and 3D
IncreaseSupplies Share
~25%
UnprofitableCustomers
REDUCE MIX OF UNPROFITABLE CUSTOMERS BY 10 POINTS OVER 3 YEARS1. HP customer research, 2019.

29
Units
ARU
Hardware margin
NPV per unit
BUSINESS MODEL TRANSITION DRIVESPOSITIVE FINANCIAL IMPACT
Evolving business models with gradual transition towards higher system value units over next 3-5 years
Beyond FY22, units expected to growwith market
Increase Supplies share
PRINT BUSINESS PROFILE
GrowContractual
Optimize System Profitability
Grow Graphics and 3D
IncreaseSupplies Share

30
LEADING THE ANALOG TO DIGITALTRANSFORMATION IN GRAPHICS
Personalization Print on Demand
Short Time to Market
Security Features (Counterfeit)
Design & Technical Production
Signage & Decoration
General Commercial& Publishing3
Textiles4
Labels
Packaging5
0.5%
3.0%
4.0%
7.0%
>25.0%
9.0%
Digital TAM CAGR(CY19-23)2
DRIVING ANALOG TODIGITAL TRANSFORMATION
MARKET TRENDS & DRIVERS
HP LEADERSHIP LARGE (~$50B2) ANDGROWING OPPORTUNITY
#1
Large Format Design1
#1
Large Format Production1
#1
Digital Press Label and Packaging1
>10%Graphics Page Growth
(FY19Y/Y)
2. CY19-23 data are projections based on available data and estimates, Sept 20193. Includes mid range production and high volume production4. Textiles Includes: Soft signage, Fashion/Apparel, Direct To Garment (DTG),
Home Textiles (window blinds, bedding) 5. Packaging includes Corrugated, Flexible Packaging & Folding Carton
GrowContractual
Optimize System Profitability
Grow Graphics and 3D
IncreaseSupplies Share
1. Unit share - Data represents HP internal classification for Graphics based on IDC 4Q19 reported

31
DISRUPT WITH 3D & DIGITAL MANUFACTURING
GrowContractual
Optimize System Profitability
Grow Graphics and 3D
IncreaseSupplies Share
WE AREWINNING
TANGIBLE PROOFPOINTS
1. Thermoplastic printers with an ASP of $100,000-$500,000.Source: Context AM3DP 2019Q4 Report
2. 3D Hubs Manufacturing Network
Dental aligners
Partnering with leading auto manufacturer
Service provider:Multi-use plastic & metal parts
Alliance with leading industrial solutions company
Footwear
Material providers
DISRUPT INDUSTRIAL BUSINESSES
Most Used Industrial3D Printer2
50% Market Share inIndustrial Plastic1
10,000 Metal PartsMilestone with Volkswagen
3,000+ PatentsLeveraging 30+ years of
Innovation in Microfluidics
HP Digital ManufacturingNetwork Expansion
~$500BFuture TAM
Today’s TAM
32
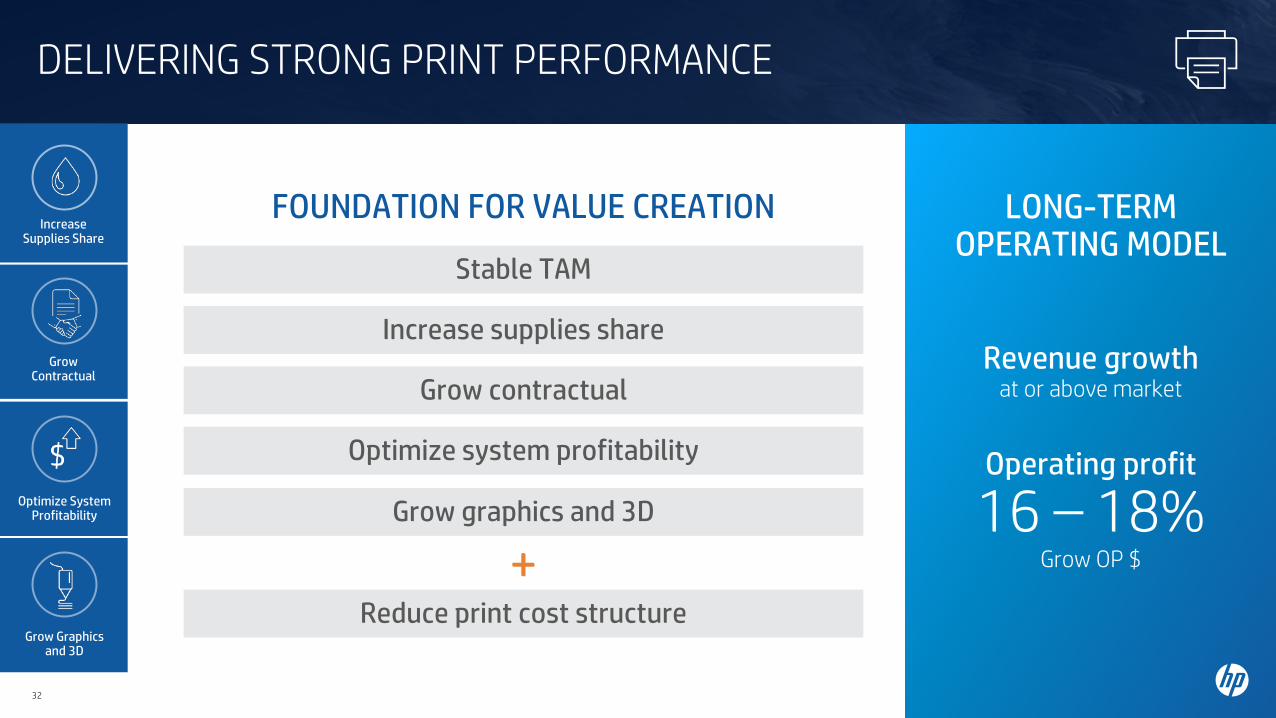
DELIVERING STRONG PRINT PERFORMANCE
LONG-TERMOPERATING MODEL
Revenue growthat or above market
Operating profit
16 – 18%Grow OP $
FOUNDATION FOR VALUE CREATION
Reduce print cost structure
Stable TAM
Increase supplies share
Grow contractual
Optimize system profitability
Grow graphics and 3D
+
IncreaseSupplies Share
GrowContractual
Optimize System Profitability
Grow Graphics and 3D

33
XEROX PROPOSAL CREATES SIGNIFICANT RISK & COMPROMISES THE FUTURE FOR HP SHAREHOLDERS

34
XEROX PROPOSAL CREATES SIGNIFICANT RISK & COMPROMISES HP’S FUTURE
FLAWEDVALUE EXCHANGE
IRRESPONSIBLECAPITAL STRUCTURE
TRANSFERS VALUE FROM HP SHAREHOLDERS
Values HP’s leading Print & Personal Systems business@ 7.0x P/E¹ - $59B revenue base ( 66% PS, 34% Printing) with
#1 or #2 position in PC or Print in 49 countries²
- FY’16-19 revenue growth of $10.5B withstrong earnings and cash flow growth
- Growth opportunities across geographiesand in new businesses
Values Xerox @ $37.68 – 9.4x P/E¹- Xerox revenue base of $9.1B, a decline of $1.7B
over last 3 years3
- Operating profit increased by only $22M4 despite $640M in gross savings in FY19
- Unclear long-term technology / supply roadmap
Utilizes HP balance sheet to fund transaction consideration- ~$15 of the $18.40 cash consideration / share
funded by HP cash and debt capacity
- Reduces HP shareholder participation to less than 50%, doubles Xerox shareholder participation to over 50%
Capital structure creates significantgoing concern risk- Proposed capital structure lacks understanding of HP’s working
capital dynamics
- Xerox Proposal Debt / EBITDA5: 4.5x
- Print Peers5: 1.2x
- PC Oriented Peers5: 1.5x
- No companies in S&P hardware index have Debt/EBITDA5 > 3.5 x
Reduces go forward capital return- Suspends buyback indefinitely
- Reduces dividends per share to HP shareholders by 79% from$0.70/share to $0.15/share6
1. Implied HP P/E based on Xerox’s proposal valuing HP at $24/share and the mid-point of HP’s FY22 guidance of $3.25 - $3.65. Xerox P/E based on XRX stock price as of February 6, 2020, and the XRX FY22 consensus estimate of $4.01.2. Data represents HP internal classification for total PC’s and Home + Office based on IDC 4Q19 reported3. Xerox as reported revenue of $10.8B in CY2016 and $9.1B in CY2019.4. Xerox operating profit excludes impact of $77M of one-time OEM fee in FY2019.5. Print peers include Epson, Canon, and Brother. PC oriented peers include Acer, Asus and Lenovo. Debt / FY2019 Non-GAAP EBITDA for S&P 500 Technology Hardware & Equipment Index. Peer calendarized to October FYE. XRX reflects Dec FYE financials.6. HP’s annual dividend per share of ~$0.70 calculated by annualizing quarterly FY20 dividends of ~$0.18 per share.HP’s PF dividend per share
of ~$0.15 calculated by multiplying the exchange ratio of 0.149x (as of 06-Feb-2020) by Xerox’s stated PF dividends per share of $1.00 per share.
Xerox $2B synergy estimates attempt to transfer value of HP cost actions- HP is already executing on our $1.2B
structural cost savings plan and more than $1B of ongoing productivity actions
- HP estimates potential synergies from a combination of ~$1B
HP private 34
35
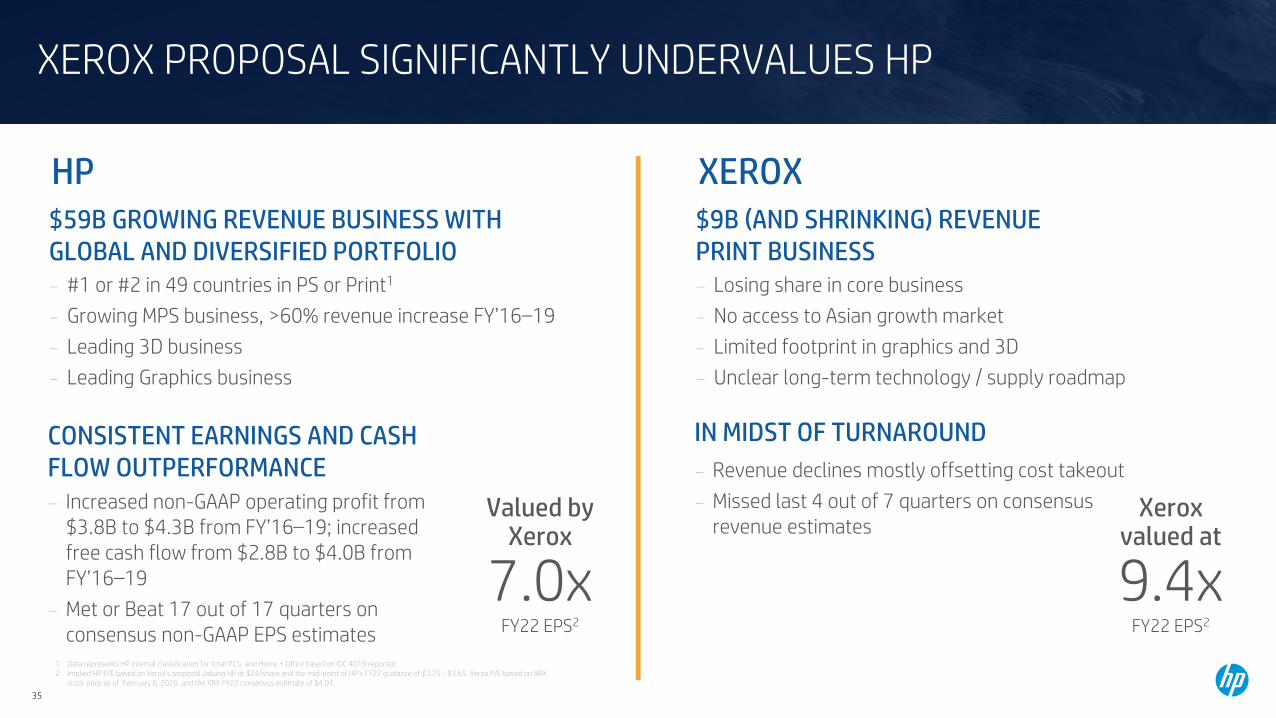
XEROX$9B (AND SHRINKING) REVENUEPRINT BUSINESS- Losing share in core business- No access to Asian growth market- Limited footprint in graphics and 3D- Unclear long-term technology / supply roadmap
IN MIDST OF TURNAROUND- Revenue declines mostly offsetting cost takeout- Missed last 4 out of 7 quarters on consensus
revenue estimatesXerox
valued at
9.4xFY22 EPS2
XEROX PROPOSAL SIGNIFICANTLY UNDERVALUES HP
HP$59B GROWING REVENUE BUSINESS WITHGLOBAL AND DIVERSIFIED PORTFOLIO- #1 or #2 in 49 countries in PS or Print1
- Growing MPS business, >60% revenue increase FY’16–19- Leading 3D business- Leading Graphics business
CONSISTENT EARNINGS AND CASHFLOW OUTPERFORMANCE- Increased non-GAAP operating profit from
$3.8B to $4.3B from FY’16–19; increased free cash flow from $2.8B to $4.0B from FY’16–19
- Met or Beat 17 out of 17 quarters onconsensus non-GAAP EPS estimates
Valued byXerox
7.0xFY22 EPS2
1. Data represents HP internal classification for total PC’s and Home + Office based on IDC 4Q19 reported2. Implied HP P/E based on Xerox’s proposal valuing HP at $24/share and the mid-point of HP’s FY22 guidance of $3.25 - $3.65. Xerox P/E based on XRX
stock price as of February 6, 2020, and the XRX FY22 consensus estimate of $4.01.

36
XEROX PROPOSAL ATTEMPTS TO UTILIZE HP BALANCE SHEET TO FUND ACQUISITION OF HP & CREATES SIGNIFICANT GOING CONCERN RISK
Note: Unless otherwise stated, financials reflected FYE October for HP and FYE December for Xerox. Xerox financials are adjusted to exclude one-time OEM license fee of $77M ($58M post-tax) in FY2019. 1 Calculated as fiscal year cash flow from continuing operations less capital expenditures.2. As of October 31st 20193. Print peers include Epson, Canon, and Brother. PC oriented peers include Acer, Asus and Lenovo. Debt / FY2019 Non-GAAP EBITDA for S&P 500 Technology Hardware & Equipment Index. All financials calendarized to October FYE.4. HP’s annual dividend per share of ~$0.70 calculated by annualizing quarterly FY20 dividends of ~$0.18 per share. HP’s PF dividend per share of ~$0.15 calculated by multiplying the exchange ratio of 0.149x (as of 06-Feb-2020) by Xerox’s stated PF dividends per share of $1.00 per share.
HP GENERATES 75 – 80%OF COMBINED COMPANY
EBITDA & FCF
77% 78%
23% 22%
FCF1EBITDA
$15 OF CASHCONSIDERATION PER SHARE
FROM HP BALANCE SHEET
HP IncrementalDebt Capacity @ 4.5x
HP Cash
~$5B
~$17B~$22B
4.5x
1.2x 1.5x
1.5x – 2.0x Debt / EBITDA more appropriate capital structure
Minimum cash to run complex global business with significantintra-quarter cash swings is greater than the $1B estimate proposed by Xerox
Xerox capital structure negatively impacts HP shareholder capital returns- Suspend buyback indefinitely- Reduce dividend per share to HP shareholders by 79% from $0.70 to $0.15 per share4
No companies in S&P IT hardware index3
with >3.5x Debt / EBITDA
4.5x DEBT / EBITDACREATES SIGNIFICANTGOING CONCERN RISK
Print PeersMedian3
Pro FormaCompany
PC OrientedPeers Median3
~$15= in cash per share
75%+= of cash
consideration

37
APPENDIX
38
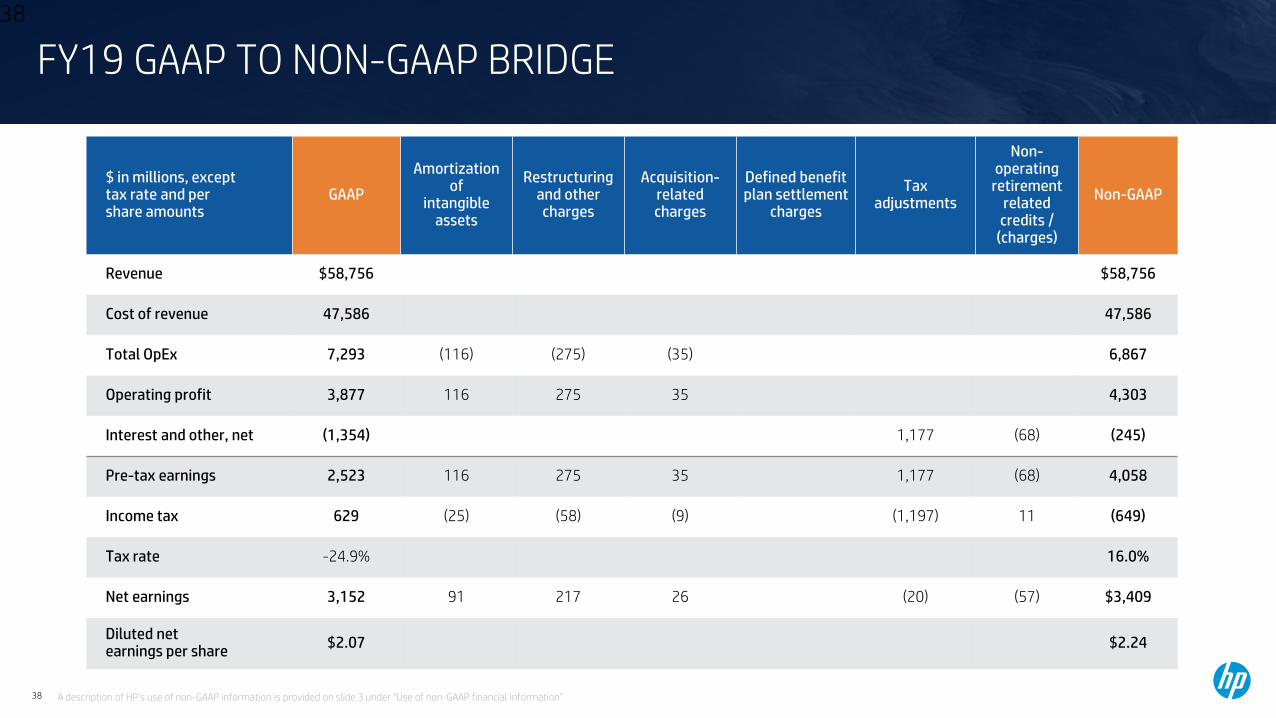
$ in millions, except tax rate and pershare amounts
GAAP
Amortizationof
intangible assets
Restructuring and other charges
Acquisition-related charges
Defined benefit plan settlement
charges
Taxadjustments
Non-operating
retirement related
credits /(charges)
Non-GAAP
Revenue $58,756 $58,756
Cost of revenue 47,586 47,586
Total OpEx 7,293 (116) (275) (35) 6,867
Operating profit 3,877 116 275 35 4,303
Interest and other, net (1,354) 1,177 (68) (245)
Pre-tax earnings 2,523 116 275 35 1,177 (68) 4,058
Income tax 629 (25) (58) (9) (1,197) 11 (649)
Tax rate -24.9% 16.0%
Net earnings 3,152 91 217 26 (20) (57) $3,409
Diluted netearnings per share $2.07 $2.24
FY19 GAAP TO NON-GAAP BRIDGE38
A description of HP’s use of non-GAAP information is provided on slide 3 under “Use of non-GAAP financial information”

39