strategic group identification using evolutionary computation
TRANSCRIPT

Expert Systems with Applications 37 (2010) 4948–4954
Contents lists available at ScienceDirect
Expert Systems with Applications
journal homepage: www.elsevier .com/locate /eswa
Strategic group identification using evolutionary computation
M.R. Martínez-Torres a,1, S.L. Toral-Marín b,*
a Escuela Universitaria de Estudios Empresariales, Avda, San Francisco Javier, s/n, 41018 Sevilla, Spainb Escuela Superior de Ingenieros, Avda, Camino de los Descubrimientos, s/n, 41092 Sevilla, Spain
a r t i c l e i n f o a b s t r a c t
Keywords:FranchisingStrategic groupsGenetic AlgorithmsEvolutionary computationPerformance
0957-4174/$ - see front matter � 2009 Elsevier Ltd. Adoi:10.1016/j.eswa.2009.12.019
* Corresponding author. Tel.: +34 954 48 12 93; faxE-mail addresses: [email protected] (M.R. Martínez
Toral-Marín).1 Tel.: +34 954 55 43 10; fax: +34 954 55 69 89.
This paper proposes to identify strategic groups among franchisors from a big set of franchisor variables.Genetic evolutionary computation was used to reduce a set of variables efficiently, and factor analysiswas used to make up the strategic groups. Franchise 500 was used as database. The results suggest boththat the general map of franchisor has changed since Carney and Gedajlovic’s study, and that genetic evo-lutionary computation is a valid way to extract knowledge from a huge set of data. This paper proposesuseful information for those retail firms considering internationalization via franchising. The originalityof this paper is in the use of Genetic Algorithm to discriminate the final set of variables to be used for theidentification of strategic groups instead of evaluating one by one the adequacy of each variable theoret-ically. The ability of evolutionary computation to create new knowledge is good to produce new insightsinto this topic.
� 2009 Elsevier Ltd. All rights reserved.
1. Introduction
Franchise strategy refers to the outcome of the decision tooperate and expand a business by franchising versus company-ownership (Chen & Ou, 2009; Falbe & Welsh, 1998).
Two major theoretical perspectives have been proposed toexplain patterns of company-ownership versus franchisee-owner-ship: Resource Scarcity and Agency Theory (Alon, 2001; Carney &Gedajlovic, 1991; Combs & Castrogiovanni, 1994; Combs, Ketchen,& Hoover, 2004; Michael, 2003; Newkirk & Lederer, 2006; Paik &Choi, 2007). Both theories should be analyzed, as they determinethe firm characteristics that are going to drive franchisors intostrategic groups.
Advocates of the strategic group concept argue that industrymembers can be classified into groups along key characteristics,such as strategy and structure (e.g., Hatten & Schendel, 1977). Ingeneral, firms within an industry that follow a similar approachor strategy have been termed strategic groups (Porter, 1980), andstrategic groups have been found to differ in performance(Ketchen, Thomas, & Snow, 1993). Opportunities are not evenlydistributed across an industry; some strategies offer better profitpotential than others. Firms may be tempted to change strategiesto exploit opportunities as they arise, but shifting to a new strate-gic group can be risky because the necessary investment can be
ll rights reserved.
: +34 954 48 7373.-Torres), [email protected] (S.L.
substantial and the perceived opportunities may be short lived(Patterson & Smith, 2003).
All firms do not adopt franchising for similar reasons, but rathergroups of firms share similar approaches (Carney & Gedajlovic,1991). If strategic groups exist among firms that franchise andthese groups differ in performance, examining all franchising firmsas a set cannot capture the true picture of the franchising–perfor-mance relationship (Combs et al., 2004).
The typical approach to strategic group identification consistsof collecting detailed industry data, and then identifying groupsthrough clustering or other grouping algorithms (Shanley &Peteraf, 2005; Sohn & Kim, 2008). The variables used to groupwill have much influence on the identified groups. A new per-spective is proposed in this paper. Instead of theoretically evalu-ating one by one the adequacy of each variable, a big set of themis used. Using an appropriate fitness function, an evolutionaryalgorithm will discriminate the final set of variables to be usedfor the identification, as well as the resulting strategic groups.We have used Genetic Algorithms (GA) for this purpose. One ofthe key advantages of evolutionary computation is its ability todiscover new knowledge. The evolving nature of the computationcan establish new relationships considered never before (Nanni &Lumini, 2009).
The next section is devoted to the theoretical perspectives tofranchising. Then, strategic groups and performance are intro-duced. After that, the evolutionary technique used in this paper(Genetic Algorithm) is shown: first, the basis of the methodologyis described, and then the particular application to the strategicgroup identification problem is detailed. The obtained results areillustrated later. Finally, some conclusions have been drawn.

M.R. Martínez-Torres, S.L. Toral-Marín / Expert Systems with Applications 37 (2010) 4948–4954 4949
2. Theoretical perspectives to franchising
Oxenfeldt and Kelly (1968) offered perhaps the first explanationof why the proportion of franchised outlets differs among franchi-sors. Under the Resource Scarcity view, franchisors use franchisingas a way to overcome constraints to growth, including a lack oftrained managers and a lack of financial capital (Doherty, 2007).Success requires financial, informational, and managerial re-sources, but these resources are hard to obtain in the short run(Dant, Kaufmann, & Paswan, 1992). The franchisee provides aninfusion of capital through fees and royalties and offers the franchi-sor (relatively) inexpensive growth. However, subsequent researchtended to focus on the fact that firms used franchising becausethey also needed human capital (Norton, 1968), managerial talent(Dant et al., 1992; Doherty, 2007; Falbe & Welsh, 1998), and localknowledge (Combs & Castrogiovanni, 1994).
Viewing franchising primarily as a means to access resources,a firm’s propensity to franchise varies over time. An implied tenetof Resource Scarcity Theory is the belief that the firm is morelikely to increase company-ownership of sites as franchisesystems mature and accumulate resources. This is precisely oneof the criticisms that the Resource Scarcity thesis has received.Combs and Castrogiovanni (1994) observed that in contrast tothe predictions of Resource Scarcity Theory, larger firms actuallyused more franchising in their development. They also found aweak negative relationship between the age of the franchisorand the use of franchising, and no relationship at all betweenthe growth of the franchisor and the use of franchising. Somecorporate giants as McDonald’s and Budget Rent-A-Car endorsethis asseveration.
The theory is also criticized by economists on the basis thatcapital can be raised more efficiently in the market. Although fran-chising may lower risk for the franchisor, it increases risk for thefranchisee (Rubin, 1978).
Agency Theory explains the organization of relationshipswhen one agent determines the work and another undertakesit (Mole, 2002; Shane, 1998). In franchising, the Agency Theoryperspective discusses it as the relationship between one party(the franchisor) depending on another party (the franchisee) toundertake some action on the franchisor’s behalf (Paik & Choi,2007). Franchising encourages franchisees to maximize effortbecause, as owners, they must devote their own capital to buildand operate outlets (Brickley & Dark, 1987). As a consequence,franchising lowers the cost of monitoring (Dant & Kaufmann,2003; Pizanti & Lerner, 2003). Managerial talent and local knowl-edge are also eased by franchising because of the franchisees’ riskto lose their upfront monetary investments if their outlets fail asa result of their own managerial inadequacies (Shane, 1998).Quite the opposite of the Resource Scarcity Theory, Lafontaineand Kaufman suggests that agency factors favour an increaseduse of franchising as a chain expands with maturity (Lafontaine& Kaufmann, 1994).
However, some agency problems are not solved by franchis-ing. There are some situations in which the franchisee may beinclined to shirk by under investing and free riding at theexpense of the chain’s reputation (Michael, 2000). Although mon-itoring cost can be decreased, transferring specific knowledge topotential franchisees can also be costly (Jensen & Meckling,1995).
Some authors have proposed a reconciliation of both theories.Martin and Justis (1993) found that short- and long-run incentivesto franchise differ. Whereas resource scarcity reasons to franchiseare most relevant for young franchisors seeking to expand, agencyreasons become increasingly relevant with maturity (Castrogiov-anni, Combs, & Justis, 2004).
3. Strategic groups and performance
Researchers have long suspected the presence within industriesof subgroups of firms whose behaviours and results differ fromthose of the broader industry (Lee, Lee, & Rho, 2002; Porter,1976, 1979). Currently, there are three theoretical perspectivesregarding strategic group formation: the industrial organization,strategy, and cognitive/behavioural perspectives (Hoyt & Sherman,2004).
The industrial organization perspective defines strategic groupsas persistent features of the industry structure that result from en-try and mobility barriers. Structural barriers impede new firmsfrom entering new industries (Audretsch, Houweling, & Thurik,2004). Firms may be tempted to change strategies to exploit oppor-tunities as they arise, but shifting to a new strategic group can berisky because the necessary investment can be substantial, and theperceived opportunities may be short lived (Wheeler, Ibeh, & Dim-itratos, 2008). Thus, firms generally choose not to change groupsbecause it is unclear whether the performance enhancementsgained will exceed the costs incurred (Mascarenhas & Aaker,1989). This is a consequence of the empirically determined recog-nition that single groups are separated by barriers which restrictthe strategic mobility of firms (Caves & Porter, 1977).
The strategy perspective is more internally focused and thus as-sumes that the firm’s management makes decisions to configureinternal resources, so as to establish a sustainable competitiveadvantage (Hirschsohn, 2008).
Finally, the cognitive perspective contends that strategic groupsare formed by managers who partition their environment to re-duce uncertainty and who possess bounded rationality (Peteraf &Shanley, 1997).
Based on strategic groups’ theory as well as the evidence linkingstrategic groups and performance, we expect that some strategicgroups among franchisors will have strategic profiles that are bet-ter suited to their environment than others. Nevertheless, identify-ing strategic groups involves more than just choosing initial groupsand data sources. The variables used to group will have much influ-ence on the identified groups. A detailed enumeration of nearly onehundred of such variables from prior studies has been detailed inKetchen et al. (1993). Even if we were only concentrated in franchi-sor studies, the number of possible variables or indicators is huge.Insufficient consideration has been given to determine which vari-ables are appropriate for the purpose of distinguishing strategicgroups.
To avoid this, instead of theoretically evaluating one by one theadequacy of each variable, a big set of them will be used in this pa-per. Using an appropriate fitness function, an evolutionary algo-rithm will discriminate the final set of variables to be used forthe identification, as well as the resulting strategic groups.
4. Methodology: Genetic Algorithms
To identify strategic groups, we must first identify the firmcharacteristics that are likely to drive franchisors into distinctivestrategic groups. We have used Genetic Algorithms (GA) for thispurpose. Genetic Algorithms (GA) have been used to solve a varietyof optimization problems, such as natural gas pipeline control,structural optimization, image registration, job scheduling, pathplanning, product design, etc. (Fisco, 2003; Goldberg, 1989; Leeet al., 2002; Li, Deng, & Luo, 2009).
A Genetic Algorithm is a computational abstraction of biologicalevolution which can be used to solve some optimization problems.The technique was first introduced by Holland (1975) for use inadaptative systems. It is an iterative process applying a series ofgenetic operators such us selection, crossover and mutation to a

Initial population(randomly generated)
P(0)
Individual fitnessesscalculation f(I) for current
Population P(t)
Reproduction(selection based on
Individual fitness f(I))
Corssover(selection based on
Individual fitness f(I))
Mutation(selection based on
Individual fitness f(I))
Initial population(randomly generated)
P(0)
Individual fitnessesscalculation f(I) for current
Population P(t)
Reproduction(selection based on
Individual fitness f(I))
Corssover(selection based on
Individual fitness f(I))
Mutation(selection based on
Individual fitness f(I))
Fig. 1. Iterative process of Genetic Algorithm.
Table 1Candidate variables for factor analysis.
Var. Description
Var01 No. of outlets 2005Var02 Increment of outlets from 2004 to 2005Var03 % of outlets located in US, 2005Var04 % of outlets located in US, 2004Var05 Average number of outlets opening per yearVar06 Average number of outlets opening per year since first franchiseVar07 Average investmentVar08 Standard deviation of investmentVar09 Average franchise feeVar10 Standard deviation of franchise feeVar11 Ongoing royalty feeVar12 Term of agreementVar13 Net worth requirementVar14 Cash liquidity requirementVar15 Number of employees per unitVar16 Franchises more than 1Var17 % of outlets franchised 2005Var18 % of foreign outlets franchised 2005Var19 Years since inceptionVar20 Years between inception and first franchiseVar21 Ranking Franchise 500, 2005Var22 Ranking Franchise 500, 2004Var23 Average investment/Term of agreementVar24 Average investment/Net worth requirementVar25 Average investment/Cash liquidity requirementVar26 % of outlets franchised in Canada, 2005Var27 Average investment/Average franchise feeVar28 Franchise departmentVar29 No of outlets franchised/Franchise departmentVar30 Foreign franchises/Franchise departmentVar31 (Franchise fee + ongoing royalty fee) * term of agreement
4950 M.R. Martínez-Torres, S.L. Toral-Marín / Expert Systems with Applications 37 (2010) 4948–4954
population of elements (Fig. 1). These elements, called chromo-somes or individuals, represent possible solutions to the problem.The initial population is randomly selected from the solution space.
Genetic operators combine the genetic information of the ele-ments to form new generations of populations. Each chromosomehas an associated fitness value which quantifies its value as a solu-tion to the problem. The chromosomes compete to reproducebased on their fitness values, thus the chromosomes representingbetter solutions have a higher chance of survival. The crossover in-volves two chromosomes whose portions are swapped. Selectionaccording to fitness combined with crossover gives the GA its evo-lutionary power. The GA uses an elitist strategy meaning that thebest individual is carried over to the next generation so that wecan only improve the solution over the course of the genetic opti-mization. GA follows the iterative scheme shown in Fig. 1. Thealgorithm stops when some stopping criterions are satisfied.
To successfully apply GA to solve a problem, it must be consid-ered the following items:
� Chromosomal encoding, how to represent possible solutions.� Fitness function selection. It must accurately represent the value
of the solution.� Parameter values selection (population size, number of itera-
tions, probabilities, etc.)
4.1. Genetic Algorithm application to strategic group identification
Prior studies about strategic group identification among fran-chisor have only considered a few numbers of variables. Forinstance, Carney and Gedajlovic (1991) considered thirteen
variables for Canadian franchisor strategic group identification,while (Castrogiovanni, Bennett, & Combs, 1995) just used twelvevariables for a similar study among US franchisors. Some otherstudies have replicated the former study in different countries(López & Ventura, 2001).
All of them have utilized factor analysis as the multivariate sta-tistic tool for strategic group identification (Hsia, Hsu, & Jen, 2009;Sohn & Kim, 2008). Conventional techniques such as multipleregressions suffer the inconvenience of some restrictions like theindependence of predictor variables or assumptions like linearrelationships between variables.
Factor Analysis is a way to fit a model to multivariate data toestimate just their interdependence. In the factor analysis model,the measured variables depend on a smaller number of unobserved(latent) factors. Because each factor may affect several variables incommon, they are known as ‘‘common factors”. Each variable is as-sumed to be dependent on a linear combination of the commonfactors, and the coefficients are known as loadings. Factor analysisis useful in identifying inter-relationships between variables whichare not directly observable, segmenting a sample into relativelyhomogeneous segments.
The estimated loadings from an unrotated factor analysis fit canusually have a complicated structure. The goal of orthogonal factorrotation is to find a parameterization in which each variable hasonly a small number of large loadings, i.e., is affected by a smallnumber of factors. The rotated factor analysis fit ensures factorsrepresent unidimensional constructs (Hsu, 2009).
Instead of using the same variables than Carney and Gedajlovic(1991) and Castrogiovanni et al., 1995 to replicate both studies, wepropose to use a big set of variables as possible candidates for fac-tor analysis. A total of 31 candidate variables have been consid-ered, and they will be applied for strategic group identification ofUS franchisors included in the Entrepreneur’s Franchise 500 sur-vey, January 2005. Table 1 details the variables used in this study.

Fig. 2. Fitness distribution over 30 generations of the genetic algorithm.
M.R. Martínez-Torres, S.L. Toral-Marín / Expert Systems with Applications 37 (2010) 4948–4954 4951
The objective of this work is to find the optimum subset of vari-ables from Table 1 leading to optimum strategic group identifica-tion. The obtained results will show if the thirteen variablesconsidered in previous studies are enough, or if it would be neces-sary to extend the number of considered variables to achieve a bet-ter representation of US franchisor groups. But the number ofpossibilities when working with such huge number of variablessuggests this problem is unapproachable if trying to explore allof them. The space of possible solutions is formed by231 = 2.1475e + 009 possibilities. That means that we would haveto perform 231 different factor analyses to completely explore thespace of possible solutions. In this kind of problems, evolutionarycomputation can perform a guided search of the optimum solutionwith lower computation cost than exploring one by one all thepossibilities.
In this task, Genetic Algorithm will be applied to perform theevolutionary search of the optimum solution. The first conditionto apply GA properly is a good selection of the chromosomalencoding, which should be valid and complete. Our chromosomalencoding is constituted by a 31 binary sequence in which onesare the variables that are going to be used in factor analysis andzeros represents variables that are going to be excluded from thisanalysis. Clearly, the encoding representation is complete, as the231 possibilities are able to be represented, and valid, as all of themcan be computed.
The next step is the fitness function selection. The fitness func-tion quantifies the suitability of each chromosome as a solution.Chromosomes with high fitness have more chance of being se-lected, passing their genetic material (via reproduction or cross-over) to the next generation. The fitness function provides thepressure for evolution towards a new generation with chromo-somes of higher fitness than the previous ones. The chromosomerepresenting the optimal solution should have the maximum fit-ness value for the solution space, and near optimal solutionsshould have high fitness values. In the context of strategic groupidentification by means of factor analysis, it is not possible to builda simple fitness function. Fitness function should be multi-objec-tive fitness function considering several parameters.
F ¼ c1Var þ c21n
Xk
i¼1
r2i þ c3Dist
This proposed fitness function consists of three parts.
� Explained variance (Var). Factor analysis results show theexplained variance by the considered factors (usually, thenumber of factors is given by the number of eigenvalues ofthe correlation data matrix bigger than 1). The explained vari-ance by the selected number of variables should be maximized.But it is not the unique parameter to be taken into account. A fit-ness function equal to the explained variance will tend to thetrivial solution of just considering one variable. This is due tothe fact that it is easier to explain the variance of a data set whenit is formed by a small number of data.
� Correlations between variables 1=nPk
i¼1r2i
� �. The average of the
sum of the squared correlation coefficients between variables isused as the second part of the fitness function. This part of thefitness function will tend by itself to the trivial solution of con-sidering the whole data set. It is the reverse strength to the pre-vious part of the fitness function.
� Number of factors. The third part of the fitness functionmeasures the distance (Dist) to the typical number of factor ofprevious studies about strategic group identification. A distantnumber from 5 groups is penalized, as this is a typical valueobtained en prior studies (Carney & Gedajlovic, 1991; Castro-giovanni et al., 1995).
C1, C2, and C3 are coefficients used to adjust the relative impor-tance of the three parts of the fitness function. The range of themis [0, 1], with the restriction of C1 + C2 + C3 = 1.
The final decision for GA application refers to parameter valuesselection. GA performance may be sensitive to certain parametervalues, particularly the population size, the frequency of operatorselection and the termination criterion. All of them vary consider-ably, and there is little or no documented justification for the selec-tion of them. Nevertheless, a high value for the population sizemay reduce this sensibility to GA parameters. In this paper, popu-lation size has been chosen equal to 10,000, with a 20% of repro-duction rate. The value of 10,000 is considered a good value toobtain richness genetic content. These values are typical in the lit-erature about GA (Cole, 1998; Goldberg, 1989).
5. Results
Beginning with an initial randomly generated population, GAhas converged after 30 generations, with an explained varianceof 82.8%, 20 variables and six factor (that means six eigenvalueshigher than 1).
Time required by genetic algorithm execution is 750 s(12.5 min). This value is much smaller than the alternative optionof exploring the whole solution space. Taking into account thateach factor analysis requires 2.5 ms, the 231 = 2.1475e+009 possi-bilities of the solution space would require more than 62 days,24 h a day.
The evolution of the genetic clustering algorithm is detailed inFig. 2. The initial population (generation 0) has a low fitness value,which indicates that the individuals of the population are far fromthe optimum. As the number of generations increase, the fitness ofindividuals within the population also increases, as the geneticalgorithm is biased towards the survival of genetic material con-tained within the individuals with high fitness function values.
The results from factor analysis using the set of variablesselected by the genetic algorithm are detailed in Table 2.
Although the number of eigenvalues higher than 1 is six, due tothe gap between the fifth and the sixth eigenvalue is preferable tochoose just five components or factors. Factor loadings with

Table 2Explained variance of resulting factor analysis.
Component Eigenvalues
Value Proportion of total variance Cumulative proportion
Var01 No. of outlets 2005 5127 25.636 25.636Var02 Increment of outlets from 2004 to 2005 4438 22.191 47.826Var03 % of outlets located in US. 2005 2391 11.953 59.780Var04 Average number of outlets opening per year 1861 9305 69.084Var05 Average number of outlets opening per year since first franchise 1561 7804 76.888Var06 Average investment 1189 5943 82.831Var07 Standard deviation of investment .984 4921 87.752Var08 Net worth requirement .608 3041 90.793Var09 Cash liquidity requirement .493 2464 93.257Var10 % of outlets franchised 2005 .367 1834 95.091Var11 % of foreign outlets franchised 2005 .271 1354 96.445Var12 Years since inception .198 .992 97.437Var13 Years between inception and first franchise .174 .870 98.307Var14 Ranking franchise 500, 2005 .107 .537 98.844Var15 Average investment/term of agreement .090 .451 99.295Var16 Average investment/net worth requirement .061 .307 99.602Var17 Average investment/cash liquidity requirement .035 .176 99.778Var18 % of outlets franchised in Canada, 2005 .027 .136 99.914Var19 No of outlets franchised/franchise department .013 .065 99.978Var20 Foreign franchises/franchise department .004 .022 100.000
Table 3Factor loadings obtained by the principal component method with Varimax rotation.
Component
1 2 3 4 5
Var01 No. of outlets 2005 .014 .794 .521 .054 .088Var02 Increment of outlets from 2004 to 2005 .019 �.074 .723 �.119 .068Var03 % of outlets located in US, 2005 .004 �.623 .187 �.084 �.583Var04 Average number of outlets opening per year �.027 .639 .666 �.022 �.156Var05 Average number of outlets opening per year since first franchise �.008 .567 .739 �.098 �.043Var06 Average investment .896 �.004 �.046 .344 .035Var07 Standard deviation of investment .936 �.012 �.031 .172 �.016Var08 Net worth requirement .177 8690E�05 �.088 .918 .074Var09 Cash liquidity requirement .148 .020 �.044 .907 .064Var10 % of outlets franchised 2005 .126 .025 .146 �.435 �.615Var11 % of foreign outlets franchised 2005 .098 .783 �.081 �.266 .229Var12 Years since inception .176 .224 .187 .062 .758Var13 Years between inception and first franchise .168 �.066 .158 �.107 .821Var14 Ranking franchise 500, 2005 �.036 �.300 �.686 �.146 �.233Var15 Average investment/term of agreement .903 �.007 �.105 .306 .049Var16 Average investment/net worth requirement .839 �.013 .077 �.227 .214Var17 Average investment/cash liquidity requirement .867 .005 .106 �.195 .054Var18 % of outlets franchised in Canada, 2005 .074 .201 �.281 �.362 .019Var19 No of outlets franchised/franchise department �.070 .826 .299 �.003 �.030Var20 Foreign franchises/franchise department �.047 .904 .028 .035 .012
4952 M.R. Martínez-Torres, S.L. Toral-Marín / Expert Systems with Applications 37 (2010) 4948–4954
varimax rotation are shown in Table 3. Each row represents thefactor loadings of each variable. Moving horizontally from left toright across the five loadings in each row, the highest loading hasto be identified. All the variables associated in this way with thesame factor are hypothesized to share a common meaning thatthe analyst should discover.
The interpretation of the rotation loadings leads to the resultingstrategic groups, represented by the different clusters identified(Table 4).
To facilitate the interpretation of these, Table 5 shows the meanvalue of the selected variables per each of the five factors.
Cluster 1 brings together variables related with investment. It ischaracterized by a high value of all the loadings and it can beresembled to the ‘‘expensive” group identified by Carney and Ged-ajlovic (1991). The identified group has anyway some differenceswith respect to the one they proposed, as they are not so conserva-tive. They exhibit a moderate rate of growth, according to var04.Expensive franchisors are primarily concerned with resource scar-
city, demonstrated by the high value of all the variables in whichinvestment is involved.
Cluster 2 refers to highly internationalized US franchisors.Var03, referring to the percentage of outlets located in US, showsa negative loading in Table 4, corresponding to a minimum valuein Table 5 when compared with the other factors. They are charac-terized by a great confidence on franchising as a way of minimizingthe agency cost. This conclusion is suggested by the high values ofthe ratios given by the number of outlets and the foreign outlets,and the size of franchise department (Var19 and Var20,respectively).
Cluster 3 is somewhat related with the previous one. They arealso very big franchisor, with a high rate of growth, but, as a differ-ence with the previous cluster, they are focused on domestic mar-ket. According to Table 5, var03 has the maximum value in cluster3, just the opposite than in cluster 2. Var14 also exhibit a negativeloading in Table 4. Var14 is the ranking 2005 in Franchise 500. Thelower this value is, the more stability and reliability the franchisor
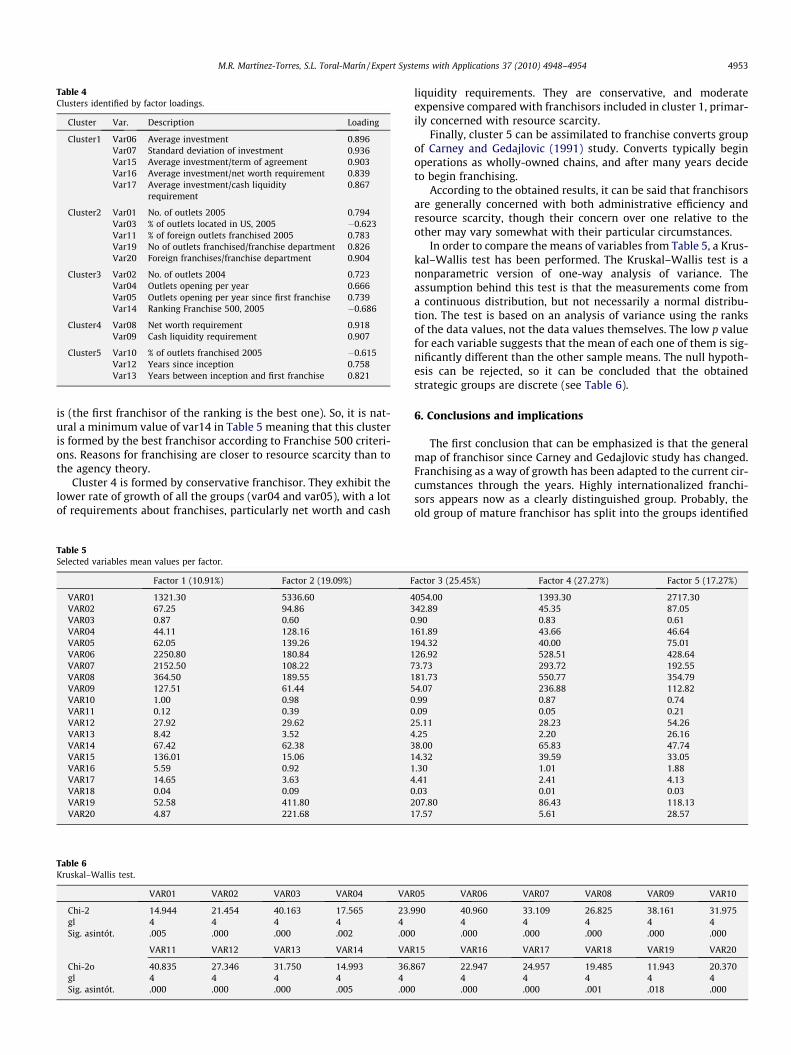
Table 4Clusters identified by factor loadings.
Cluster Var. Description Loading
Cluster1 Var06 Average investment 0.896Var07 Standard deviation of investment 0.936Var15 Average investment/term of agreement 0.903Var16 Average investment/net worth requirement 0.839Var17 Average investment/cash liquidity
requirement0.867
Cluster2 Var01 No. of outlets 2005 0.794Var03 % of outlets located in US, 2005 �0.623Var11 % of foreign outlets franchised 2005 0.783Var19 No of outlets franchised/franchise department 0.826Var20 Foreign franchises/franchise department 0.904
Cluster3 Var02 No. of outlets 2004 0.723Var04 Outlets opening per year 0.666Var05 Outlets opening per year since first franchise 0.739Var14 Ranking Franchise 500, 2005 �0.686
Cluster4 Var08 Net worth requirement 0.918Var09 Cash liquidity requirement 0.907
Cluster5 Var10 % of outlets franchised 2005 �0.615Var12 Years since inception 0.758Var13 Years between inception and first franchise 0.821
M.R. Martínez-Torres, S.L. Toral-Marín / Expert Systems with Applications 37 (2010) 4948–4954 4953
is (the first franchisor of the ranking is the best one). So, it is nat-ural a minimum value of var14 in Table 5 meaning that this clusteris formed by the best franchisor according to Franchise 500 criteri-ons. Reasons for franchising are closer to resource scarcity than tothe agency theory.
Cluster 4 is formed by conservative franchisor. They exhibit thelower rate of growth of all the groups (var04 and var05), with a lotof requirements about franchises, particularly net worth and cash
Table 5Selected variables mean values per factor.
Factor 1 (10.91%) Factor 2 (19.09%) F
VAR01 1321.30 5336.60 4VAR02 67.25 94.86 3VAR03 0.87 0.60 0VAR04 44.11 128.16 1VAR05 62.05 139.26 1VAR06 2250.80 180.84 1VAR07 2152.50 108.22 7VAR08 364.50 189.55 1VAR09 127.51 61.44 5VAR10 1.00 0.98 0VAR11 0.12 0.39 0VAR12 27.92 29.62 2VAR13 8.42 3.52 4VAR14 67.42 62.38 3VAR15 136.01 15.06 1VAR16 5.59 0.92 1VAR17 14.65 3.63 4VAR18 0.04 0.09 0VAR19 52.58 411.80 2VAR20 4.87 221.68 1
Table 6Kruskal–Wallis test.
VAR01 VAR02 VAR03 VAR04 VAR
Chi-2 14.944 21.454 40.163 17.565 23.9gl 4 4 4 4 4Sig. asintót. .005 .000 .000 .002 .000
VAR11 VAR12 VAR13 VAR14 VAR
Chi-2o 40.835 27.346 31.750 14.993 36.8gl 4 4 4 4 4Sig. asintót. .000 .000 .000 .005 .000
liquidity requirements. They are conservative, and moderateexpensive compared with franchisors included in cluster 1, primar-ily concerned with resource scarcity.
Finally, cluster 5 can be assimilated to franchise converts groupof Carney and Gedajlovic (1991) study. Converts typically beginoperations as wholly-owned chains, and after many years decideto begin franchising.
According to the obtained results, it can be said that franchisorsare generally concerned with both administrative efficiency andresource scarcity, though their concern over one relative to theother may vary somewhat with their particular circumstances.
In order to compare the means of variables from Table 5, a Krus-kal–Wallis test has been performed. The Kruskal–Wallis test is anonparametric version of one-way analysis of variance. Theassumption behind this test is that the measurements come froma continuous distribution, but not necessarily a normal distribu-tion. The test is based on an analysis of variance using the ranksof the data values, not the data values themselves. The low p valuefor each variable suggests that the mean of each one of them is sig-nificantly different than the other sample means. The null hypoth-esis can be rejected, so it can be concluded that the obtainedstrategic groups are discrete (see Table 6).
6. Conclusions and implications
The first conclusion that can be emphasized is that the generalmap of franchisor since Carney and Gedajlovic study has changed.Franchising as a way of growth has been adapted to the current cir-cumstances through the years. Highly internationalized franchi-sors appears now as a clearly distinguished group. Probably, theold group of mature franchisor has split into the groups identified
actor 3 (25.45%) Factor 4 (27.27%) Factor 5 (17.27%)
054.00 1393.30 2717.3042.89 45.35 87.05.90 0.83 0.6161.89 43.66 46.6494.32 40.00 75.0126.92 528.51 428.643.73 293.72 192.5581.73 550.77 354.794.07 236.88 112.82.99 0.87 0.74.09 0.05 0.215.11 28.23 54.26.25 2.20 26.168.00 65.83 47.744.32 39.59 33.05.30 1.01 1.88.41 2.41 4.13.03 0.01 0.0307.80 86.43 118.137.57 5.61 28.57
05 VAR06 VAR07 VAR08 VAR09 VAR10
90 40.960 33.109 26.825 38.161 31.9754 4 4 4 4.000 .000 .000 .000 .000
15 VAR16 VAR17 VAR18 VAR19 VAR20
67 22.947 24.957 19.485 11.943 20.3704 4 4 4 4.000 .000 .001 .018 .000

4954 M.R. Martínez-Torres, S.L. Toral-Marín / Expert Systems with Applications 37 (2010) 4948–4954
by clusters 2 and 3. The former has adopted franchising as a way ofinternationalization, while the latter is still confident in franchisingas a way to growth, primarily in US market.
The group ‘‘expensive and conservative” has been also split intotwo groups. Finally, convert franchisors remain the same.
The second conclusion is the application of evolutionary com-putation, particularly Genetic Algorithm, as a valid way to extractknowledge from a huge set of data. Replication of a previous studyis useful to confirm obtained results, but the inconvenience is thatreplication does not allow new insights in a particular topic. Theability of Genetic Algorithm to explore new relationships withina big amount of data allows exploring new solutions or new per-spectives in a particular theme, like the ones mentioned above.
References
Alon, I. (2001). The use of franchising by US – based retailers. Journal of SmallBusiness Management, 39(2), 1–12.
Audretsch, D. B., Houweling, P., & Thurik, A. R. (2004). Industry evolution. Diversity,selection and the role of learning. International Small Business Journal, 22(4),331–348.
Brickley, J. A., & Dark, F. H. (1987). The choice of organizational form: The case offranchising. Journal of Financial Economics, 18, 401–420.
Carney, M., & Gedajlovic, E. (1991). Vertical integration in franchise systems:Agency theory and resource explanations. Strategic Management Journal, 12(8),607–629.
Castrogiovanni, G. J., Bennett, N., & Combs, J. G. (1995). Franchisor types:Reexamination and clarification. Journal of Small Business Management, 33(1),45–54.
Castrogiovanni, G. J., Combs, J. G., & Justis, R. T. (2004). Toward a reconciliation ofresource and agency views on franchising. In Academy of management meeting,New Orleans, LA (pp. 1–7).
Caves, R. E., & Porter, M. E. (1977). From entry barriers to mobility barriers:Conjectural decisions and contrived deterrence to new competition. QuarterlyJournal of Economics, 91, 241–261.
Chen, F. L., & Ou, T. Y. (2009). Gray relation analysis and multilayer functional linknetwork sales forecasting model for perishable food in convenience store.Expert Systems with Applications, 36(3), 7054–7063.
Cole, R. M. (1998). Clustering with genetic algorithm. Ph.D. Dissertation, Universityof Western Australia.
Combs, J. G., & Castrogiovanni, G. J. (1994). Franchisor strategy: A proposed modeland empirical test of franchise versus company ownership. Journal of SmallBusiness Management, 32(2), 37–48.
Combs, J. G., Ketchen, D. J., Jr., & Hoover, V. L. (2004). A strategic groups approach tothe franchising–performance relationship. Journal of Business Venturing, 19,877–897.
Dant, R. P., Kaufmann, P. J., & Paswan, A. K. (1992). Ownership redirection infranchised channels. Journal of Public Policy and Marketing, 11(1), 33–44.
Dant, R. P., & Kaufmann, P. J. (2003). Structural and strategic dynamics infranchising. Journal of Retailing, 79, 63–75.
Doherty, A. M. (2007). The internationalization of retailing. Factors influencing thechoice of franchising as a market entry strategy. International Journal of ServiceIndustry Management, 18(2), 184–206.
Falbe, C. M., & Welsh, D. H. B. (1998). Nafta and franchising: A comparison offranchisor perceptions of characteristics associated with franchisee success andfailure in Canada, Mexico, and the United States. Journal of Business Venturing,13, 151–171.
Fisco, J. H. (2003). Optimal dispersion of R&D activities in multinationalcorporations with a genetic algorithm. Research Policy, 32, 1381–1396.
Goldberg, D. A. (1989). Genetic Algorithm – in Search, Optimization and MachineLearning. Addison-Wesley Publishing Company, Inc.
Hatten, K. J., & Schendel, D. E. (1977). Heterogeneity within an industry: Firmconduct in the US brewing industry, 1952–1971. Journal of Industrial Economics,26, 97–113.
Hirschsohn, P. (2008). Regulating the ‘Animal Spirits’ of entrepreneurs? Skillsdevelopment in South African small and medium enterprises. InternationalSmall Business Journal, 26(2), 181–206.
Holland, J. (1975). Adaptation in natural and artificial systems. Ann Arbor, MI:University of Michigan Press.
Hoyt, J., & Sherman, H. (2004). Strategic groups, exit barriers and strategy decisionconstraints in high-tech companies. Management Research, 15, 237–247.
Hsia, T.-C., Hsu, Y.-L., & Jen, H.-L. (2009). A factor analysis based selection process forpredicting successful university color guard club members. Expert Systems withApplications, 36(2), 2719–2726.
Hsu, L.-C. (2009). Forecasting the output of integrated circuit industry using geneticalgorithm based multivariable grey optimization models. Expert Systems withApplications, 36(4), 7898–7903.
Jensen, M. C., & Meckling, W. (1995). Specific and general knowledge andorganizational structure. Journal of Applied Corporate Finance, 8, 4–18.
Ketchen, D., Thomas, J., & Snow, C. (1993). Organizational configurations andperformance: A comparison of theoretical approaches. Academy of ManagementJournal, 36, 1278–1313.
Lafontaine, F., & Kaufmann, P. (1994). The evolution of ownership patterns infranchise systems. Journal of Retailing, 70(2), 97–113.
Lee, J., Lee, K., & Rho, S. (2002). An evolutionary perspective on strategic groupemergence: A Genetic algorithm-based model. Strategic Management Journal, 23,727–746.
Li, X., Deng, Z., & Luo, J. (2009). Trading strategy design in financial investmentthrough a turning points prediction scheme. Expert Systems with Applications,36(4), 7818–7826.
López, M. B., & Ventura, J. (2001). Grupos estratégicos en las franquicias españolas:Características básicas. Economía Industrial, 340, 163–176.
Martin, R., & Justis, R. (1993). Franchising, liquidity constrains and entry. AppliedEconomics, 25, 1269–1277.
Mascarenhas, B., & Aaker, D. A. (1989). Mobility barriers and strategic groups.Strategic Management Journal, 10, 475–485.
Michael, S. C. (2000). The effect of organizational form on quality: The case offranchising. Journal of Economic Behavior and Organization, 43, 295–318.
Michael, S. C. (2003). First mover advantage through franchising. Journal of BusinessVenturing, 18, 61–80.
Mole, K. (2002). Business advisers’ impact on SMEs: An agency theory approach.International Small Business Journal, 20, 139–162.
Nanni, L., & Lumini, A. (2009). A genetic encoding approach for learningmethods for combining classifiers. Expert Systems with Applications, 36(4),7510–7514.
Newkirk, H. E., & Lederer, A. L. (2006). Incremental and comprehensive strategicinformation systems planning in an uncertain environment. IEEE Transactionson Engineering Management, 53(3), 380–394.
Norton, S. (1968). An empirical look at franchising as an organizational form. Journalof Business, 61, 197–217.
Oxenfeldt, A. R., & Kelly, A. O. (1968). Will successful franchise systems ultimatelybecome wholly-owned chains? Journal of Retailing, 44(4), 69–83.
Paik, Y., & Choi, D. Y. (2007). Control, autonomy and collaboration in the fast foodindustry. A comparative study between domestic and international franchising.International Small Business Journal, 25(5), 539–562.
Patterson, P. G., & Smith, T. (2003). A cross-cultural study of switching barriers andpropensity to stay with service providers. Journal of Retailing, 79, 107–120.
Peteraf, M., & Shanley, M. (1997). Getting to know you: A theory of strategic groupidentity. Strategic Management Journal, 18, 165–186.
Pizanti, I., & Lerner, M. (2003). Examining control and autonomy in the franchisor–franchisee relationship. International Small Business Journal, 21(2), 131–159.
Porter, M. (1976). Interbrand choice, strategy and bilateral market power. Cambridge,MA: Harvard University Press.
Porter, M. (1979). The structure within industries and companies’ performance.Review of Economics and Statistics, 61, 214–227.
Porter, M. (1980). Competitive strategy. New York: Free Press.Rubin, P. H. (1978). The expansion of firms. Journal of Political Economy, 81(4),
936–949.Shane, S. (1998). Explaining the distribution of franchised and company-owned
outlets in franchise systems. Journal of Management, 24, 717–739.Shanley, M., & Peteraf, M. (2005). Balancing theory and technique: Methodological
issues in strategic groups research. Research Methodology in Strategy andManagement, 2, 65–92.
Sohn, S. Y., & Kim, Y. (2008). Searching customer patterns of mobile service usingclustering and quantitative association rule. Expert Systems with Applications,34(2), 1070–1077.
Wheeler, C., Ibeh, K., & Dimitratos, P. (2008). UK export performance research.International Small Business Journal, 26(2), 207–239.