strategic human resource management and corporate … · strategic human resource management and...
TRANSCRIPT

Modern Economy, 2019, 10, 311-333 http://www.scirp.org/journal/me
ISSN Online: 2152-7261 ISSN Print: 2152-7245
DOI: 10.4236/me.2019.101021 Jan. 23, 2019 311 Modern Economy
Strategic Human Resource Management and Corporate Performance
Xiao Wang
Jinan University, Guangdong, China
Abstract
It is essential for success to build an organization filled with good, talented, well-trained people, which is also the center of human resource management. The author combined the complex network with human capital to solve the problems. The author employed fuzzy synthetic evaluation method to figure out the Euclidean distance between different departments in ICM, and then built the human capital network of various departments. Based on the Lya-punov stability theory, the author described the dynamic process of human capital in ICM. Through establishing the dynamic complex network model of human capital, the author drew the conclusion that the next two years’ budget of recruiting and training is 34.22σ when the annual churn rate goes to 18%. By Pajek programming, the author used the visualization tools to simulate the staff flow. Through establishing the dynamic simulation model of the staff turnover, the author reached the position’s integrity condition of ICM when the job churn rate is 25% and 35%, respectively. Then the author explained the costs caused by high turnover rates and the indirect effects of high churn rates. The author simulated the change of position’s integrity degree of junior managers and experienced supervisors in the next two years. The author concluded that the HR health of the organization is below the expectation. In addition, the author made sensitivity analysis on the 7 factors of human capital value and consequently drew that the amount of employees of each hierarchy has the greatest influence on human capital value. At last, to make further discussion on the model, the author estab-lished the multilayer complex network model including flow, trust, influence and friendship.
Keywords
Human Resource Management, ICM, Corporate Performance, Dynamic Complex Network, Fuzzy Synthetic Evaluation
How to cite this paper: Wang, X. (2019) Strategic Human Resource Management and Corporate Performance Modern Economy, 10, 311-333. https://doi.org/10.4236/me.2019.101021 Received: October 29, 2018 Accepted: January 20, 2019 Published: January 23, 2019 Copyright © 2019 by author(s) and Scientific Research Publishing Inc. This work is licensed under the Creative Commons Attribution International License (CC BY 4.0). http://creativecommons.org/licenses/by/4.0/
Open Access
X. Wang
DOI: 10.4236/me.2019.101021 312 Modern Economy
1. Introduction
In 2005 the European Commission (2005) explicitly stated that ‘‘well developed human resources in R & D are the cornerstone of advancement in scientific knowledge, technological progress, enhancing the quality of life, ensuring the welfare of European citizens and contributing to Europe’s competitiveness’’. This acknowledgement derives from already existing EU research policies. With the coming of information and knowledge period, human capital is dominating the direction and process of the company. Therefore, there is a problem to be solved. How can we ensure the steady accumulation of human capital in the continuous development of the company? The accumulation of human capital can be done in two ways. On the one hand, each person’s intelligence and skills will improve in economic activities without the pressure of production. On the other hand, we can accumulate the human capital through learning-by-doing in work, attending training courses, having foreign exchange learning. In contem-porary society, when employees take part in the company, plenty of companies will use the second way to improve their skills. So how do we manage human capital in organizations?
By acknowledging this situation,more and more scholars study human capital through the following four aspects. With regular and random networks being considered, an agent model has been introduced to investigate the influence of the agents’ social network [1]. By overcoming the traditional fragmentation of specific research field, the case of the Theme Teams has been analyzed to devel-op the researchers’ human capital [2]. A brief overview of human capital re-search that summarizes its evolution and current areas of emphasis has been first demonstrated [3]. Consequently, it is necessary to generalize “traditional” net-work theory by developing a frame work and associated tools to study multilayer systems in a comprehensive fashion [4].
We find no empirical analysis of the relationship for human capital and mul-tilayer networks. However, we can study the relationship between them from the following four aspects.
1) We need to calculate the human capital of each department in ICM. And through the objective link of human capital, we can establish the network model based on the human capital.
2) Based on Question one, we need to establish a mathematical model to de-scribe the dynamic process of human capital network. The dynamic process consists of organizational churn and direct and indirect effects on the organiza-tion’s productivity. Next, we analyze our organization’s budget requirements for talent management in terms of σ for both recruiting and training over the next 2 years through the dynamic model.
3) By using the dynamic model in Question two, we can study whether ICM can sustain position’s integrity rate of 80% or not when the annual churn rate for all positions reaches 25%? How about churn rate of 35%? And we analyze the costs of these higher turnover rates and the indirect effects caused by these high

X. Wang
DOI: 10.4236/me.2019.101021 313 Modern Economy
churn rates. 4) We should simulate the impact on the junior managers and experienced
supervisors when churn rate arrives at 30%. And then we have to explain the impact of the HR health condition of the organization in that situation to the ICM HR supervisor.
2. The Overall Analysis of the Problem
Building an organization filled with good, talented, well-trained people is one of the keys to success. In order to achieve this, an organization not only needs to recruit and hire the best candidates, but also they need to retain good people, keep them properly trained and place them in proper positions, and eventually target new hires to replace those leaving the organization. All members in the team play a specific role. Therefore, the departure of individuals from an organ-ization leaves important informational and functional components missing that need to be replaced.
Through analysis, we can know that there is an objective link among em-ployees. So we can construct a complex network model to study the impact on the entire complex relationship network system of ICM when staff turnover oc-curs. What’s more, we can take advantage of large complex network analysis tool to dynamically analyze and deal with the whole complex network model. And we can eventually give advice to the human resource management of ICM.
At last, we show our research ideas through this flow chart (Figure 1).
3. Symbol Descriptions (Table 1)
Table 1. Variables and definitions.
Number Parameter Meaning
1 a Total cost of company’s paying for employees
2 b The value of the employees’ returning to the company
3 x Human capital value
4 ijn The amount of employees of the j department within i floor
5 m Median time to recruit (months)
6 As Average annual salary rate for given lever
7 Mc Median cost of recruitment
8 At Average annual training cost
9 ijα Employees’ satisfaction rate of the j department within i floor
10 β The satisfaction rate of the company
11 δ Churn rate of the employees
Chart source: organize by the author.
4. Human Capital Network Model of ICM Organization
4.1. The VP Branch to Demonstrate the Complex Network
For question one, to make it easier to demonstrate the method of building a

X. Wang
DOI: 10.4236/me.2019.101021 314 Modern Economy
Figure 1. The flow chart of the analysis of problems. Chart source: organize by the au-thor. complex network, we select a branch of ICM including each level department as an example, so that we can analyze the general situation of human capital net-work in ICM. We define the total cost of company’s paying for employees, aver-age annual salary rate of employees and the value of the employees’ returning to the company, and then we build their interrelationships to calculate the human capital value.
4.2. The Calculation of Each Department’s Human Capital Value
4.2.1. Definition of the Human Capital Value We believe that companies will pay a certain costs when hiring employees. Be-sides, we also need to spend some expenditure on training, education, health care and other related investment items in order to make employees give better service to our company. This part of expense together with recruitment cost forms the total cost of company’s spending on employees. Employees in differ-ent positions will produce different values. A part of the values will feed back to employees themselves, while the rest of the values will return to our company. It is worth mention that the part of values returning to company should be greater than the total cost of company’s paying for employees to ensure the input-output regulations, which is shown in Figure 2.
According to the mentioned above, we can obtain the relational expression below.
The return of employees + Average annual salary = Human capital
For simplicity, we set b As x+ = that b a> . We define two rates to represent the employees’ satisfaction rate and compa-
ny’s satisfaction rate.
ijAsx
α = ( )1,2,3,4,5; 1,2,3,4,5,6,7i j= = ,

X. Wang
DOI: 10.4236/me.2019.101021 315 Modern Economy
Figure 2. The allocation of human capital. Chart source: organize by the author.
Among the equation, i represents the order of hierarchy, j represents the order
of department in the floor of i.
b aa
β −= ,
when employees are not satisfied with their present condition in our company, they will possibly leave the company. So, employees’ satisfaction can be expressed as follows,
1ijα δ= − .
According to the relationships above, the human capital value can be ex-pressed as follows,
1ij
ij
ax
α βα+
=−
.
4.2.2. The Assumption of the Position Status of Each Department We assume that we have already known the position status of each department in the hierarchical structure example (rigid structure mentioned in the title) we have selected just now.
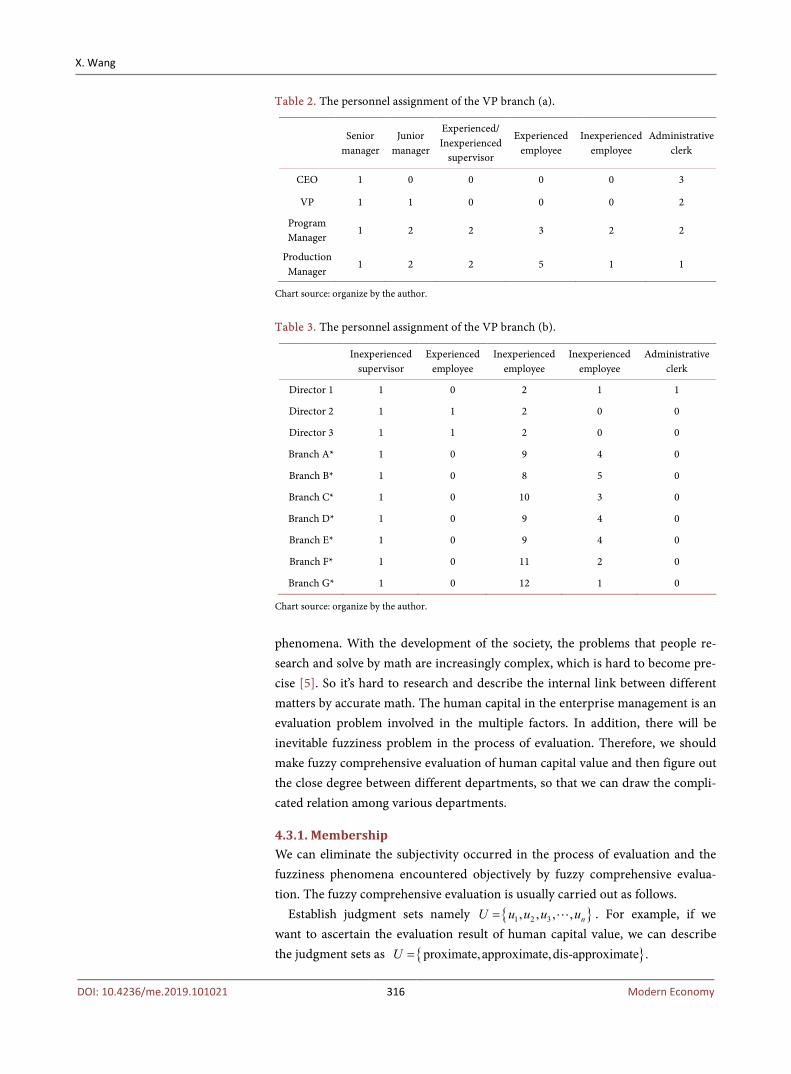
In modern society, we pursue for maximizing the work efficiency and minim-ize the cost of human capital investment in the enterprise, so the setting of posi-tion in each department is relatively stable. Combining with the actual business administration science, we make reasonable assumptions on the quantity of posi-tion of departments in each hierarchy of the selected branch, which is showed as Table 2 and Table 3.
We will figure out the human capital value of each department in the selected branch based on the calculation formula of the human capital value.
As for the calculation of a, we should combine with Table 1 in the title, and convert the time cost on the recruitment into opportunity cost measured by money, which can be shown as follows,
12ijAsa n m Mc At = × × + +
.
4.3. Fuzzy Synthetic Evaluation Model of Euclidean Distance’s Calculation
Fuzzy mathematics is the mathematics researching and treating with fuzziness
X. Wang
DOI: 10.4236/me.2019.101021 316 Modern Economy
Table 2. The personnel assignment of the VP branch (a).
Senior
manager Junior
manager
Experienced/ Inexperienced
supervisor
Experienced employee
Inexperienced employee
Administrative clerk
CEO 1 0 0 0 0 3
VP 1 1 0 0 0 2
Program Manager
1 2 2 3 2 2
Production Manager
1 2 2 5 1 1
Chart source: organize by the author.
Table 3. The personnel assignment of the VP branch (b).
Inexperienced
supervisor Experienced
employee Inexperienced
employee Inexperienced
employee Administrative
clerk
Director 1 1 0 2 1 1
Director 2 1 1 2 0 0
Director 3 1 1 2 0 0
Branch A* 1 0 9 4 0
Branch B* 1 0 8 5 0
Branch C* 1 0 10 3 0
Branch D* 1 0 9 4 0
Branch E* 1 0 9 4 0
Branch F* 1 0 11 2 0
Branch G* 1 0 12 1 0
Chart source: organize by the author.
phenomena. With the development of the society, the problems that people re-search and solve by math are increasingly complex, which is hard to become pre-cise [5]. So it’s hard to research and describe the internal link between different matters by accurate math. The human capital in the enterprise management is an evaluation problem involved in the multiple factors. In addition, there will be inevitable fuzziness problem in the process of evaluation. Therefore, we should make fuzzy comprehensive evaluation of human capital value and then figure out the close degree between different departments, so that we can draw the compli-cated relation among various departments.
4.3.1. Membership We can eliminate the subjectivity occurred in the process of evaluation and the fuzziness phenomena encountered objectively by fuzzy comprehensive evalua-tion. The fuzzy comprehensive evaluation is usually carried out as follows.
Establish judgment sets namely { }1 2 3, , , , nU u u u u= . For example, if we want to ascertain the evaluation result of human capital value, we can describe the judgment sets as { }proximate,approximate,dis-approximate .U =
X. Wang
DOI: 10.4236/me.2019.101021 317 Modern Economy
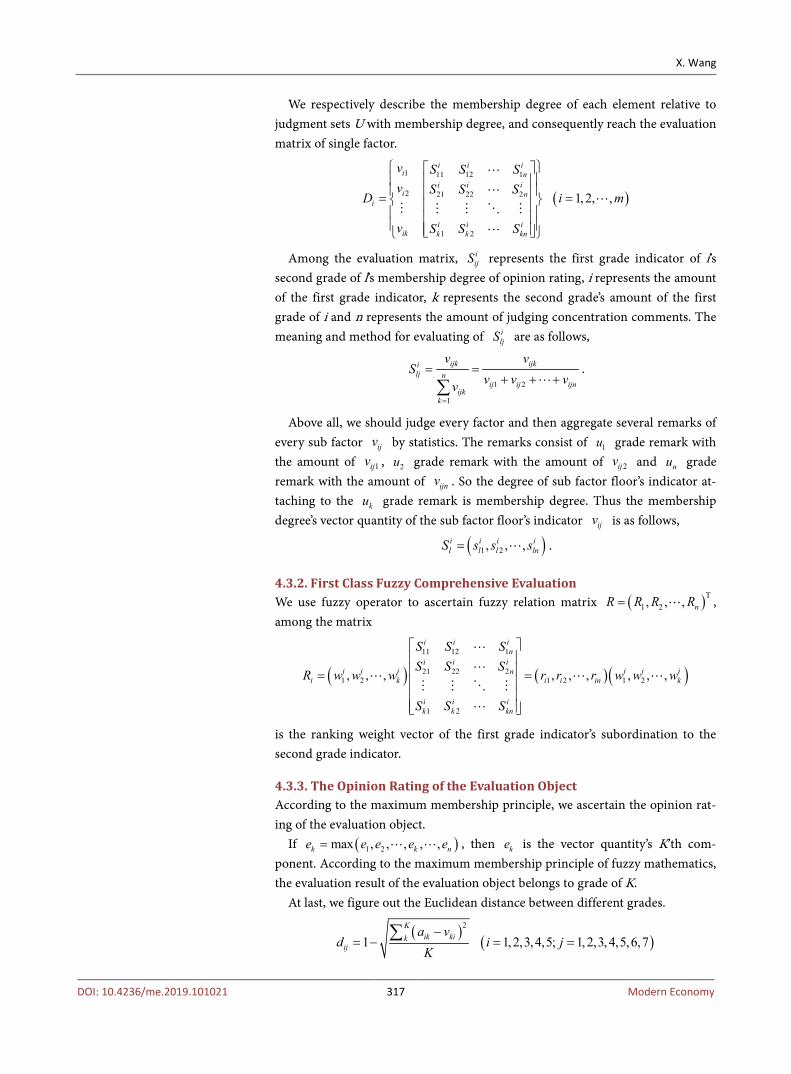
We respectively describe the membership degree of each element relative to judgment sets U with membership degree, and consequently reach the evaluation matrix of single factor.
( )
1 11 12 1
2 21 22 2
1 2
1, 2, ,
i i ii n
i i ii n
i
i i iik k k kn
v S S Sv S S S
D i m
v S S S
= =
Among the evaluation matrix, iijS represents the first grade indicator of i’s
second grade of l’s membership degree of opinion rating, i represents the amount of the first grade indicator, k represents the second grade’s amount of the first grade of i and n represents the amount of judging concentration comments. The meaning and method for evaluating of i
ljS are as follows,
1 2
1
ijk ijkilj n
ij ij ijnijk
k
v vS
v v vv=
= =+ + +∑
.
Above all, we should judge every factor and then aggregate several remarks of every sub factor ijv by statistics. The remarks consist of 1u grade remark with the amount of 1ijv , 2u grade remark with the amount of 2ijv and nu grade remark with the amount of ijnv . So the degree of sub factor floor’s indicator at-taching to the ku grade remark is membership degree. Thus the membership degree’s vector quantity of the sub factor floor’s indicator ijv is as follows,
( )1 2, , ,i i i il l l lnS s s s= .
4.3.2. First Class Fuzzy Comprehensive Evaluation We use fuzzy operator to ascertain fuzzy relation matrix ( )T
1 2, , , nR R R R= , among the matrix
( ) ( )( )11 12 1
21 22 21 2 1 2 1 2
1 2
, , , , , , , , ,
i i in
i i ii i i i i in
i k i i in k
i i ik k kn
S S SS S S
R w w w r r r w w w
S S S
= =
is the ranking weight vector of the first grade indicator’s subordination to the second grade indicator.
4.3.3. The Opinion Rating of the Evaluation Object According to the maximum membership principle, we ascertain the opinion rat-ing of the evaluation object.
If ( )1 2max , , , , ,k k ne e e e e= , then ke is the vector quantity’s K’th com-ponent. According to the maximum membership principle of fuzzy mathematics, the evaluation result of the evaluation object belongs to grade of K.
At last, we figure out the Euclidean distance between different grades.
( ) ( )2
1 1,2,3,4,5; 1,2,3,4,5,6,7K
ik kikij
a vd i j
K−
= − = =∑

X. Wang
DOI: 10.4236/me.2019.101021 318 Modern Economy
From the calculation of steps mentioned above, we obtain the close degree basing on the human capital value of selected various department, the tidied re-sults is showed as Table 4.
4.4. The VP’s Branch Network of Human Capital
We establish the fuzzy synthetic evaluation model to calculate Euclidean distance. Besides, by the programming of Pajek, we use the powerful visualization tools to build three-dimensioned reference frame. We can see it clearly as follows (Figure 3).
5. Dynamic Complex Network Model of Human Capital
In the first task, we have established the human capital network model. For en-terprises, human capital flows into the (I), through the (II) and outflows (III) of three kinds of main forms. We can see this process in the model below (Figure 4).
In this model, the ICM and its individuals have experienced three stages all the process. ICM has the right to fire employees. Individuals also have rights to be a member of ICM. But for ICM staff, when their satisfaction is lower than a certain value, they have the right to choose to leave. At this time, the churn rate for all positions will rise. As is known to us, it is not easy to estimate the interpersonal relationship. When people leave for other jobs, other employees will be influ-enced. It will cause higher staff turnover rate and reduce the efficiency of organiza-tion. Therefore, human capital network can be described as a dynamic process, Table 4. The Euclidean distance of staff offices.
Staff office Euclidean distance Staff office Euclidean distance
CEO 0.7265
Director 1 0.7024
VP Branch A*
Program manager 0.8784
Director 2 0.5948
VP Branch B*
Program manager 0.7963
Branch A* 0.7962
Production manager Branch B*
Program manager 0.6027
Branch C* 0.8793
Director 2 Branch B*
Production manager 0.6482
Branch C* 0.8804
Director 1 Branch D*
Director 2 0.8981
Branch C* 0.6795
Director 1 Branch G*
Director 2 0.8346
Branch D* 0.7352
Director 3 Branch G*
Director 3 0.8175
Branch B* 0.7196
Director 1 Branch G*
Chart source: organize by the author.

X. Wang
DOI: 10.4236/me.2019.101021 319 Modern Economy
Figure 3. The VP’s Branch network of human capital. Chart source: organize by the au-thor.
Figure 4. The human capital flow process.
we can build dynamic complex networks to study the flow of the organization, and the effects of the flow on the efficiency of organization.
5.1. Time-Varying Complex Dynamical Network Model and Preliminaries
In this section, we consider a complex dynamical network consisting of N nonli-nearly coupled different nodes, with each node being an in -dimensional ( )1,2, ,i N= dynamical system [6]. The proposed time-varying dynamical network is described as,
( ) ( ) ( ) ( ) ( )( ) ( )1
N
i i i ij i i j j i j i i ijj i
x f x c t H x x x G x uϕ ϕ=≠
= + − +∑ ( )1,2, ,i N= (1)
where ( )T
1 2, , , ,ii
n mi i i in ix x x x u= ∈ℜ ∈ℜ are the state vector and the control
input of node i, respectively. For 1,2, ,i N= , ( ) ini if x ∈ℜ are sufficiently
smooth nonlinear vector fields, ( ) 1: in ni ixϕ ℜ →ℜ are sufficiently smooth non-
linear vector mappings, ( ) 1in ni iH x ×∈ℜ and ( ) in m
i iG x ×∈ℜ are continuous nonlinear function matrices. Denote ( ) ( )( )ij N N
C t c t×
= as the outer coupling

X. Wang
DOI: 10.4236/me.2019.101021 320 Modern Economy
configuration matrix (OCCM) representing the coupling strength and the topo-logical structure of the network (1) at time t, in which ( ) 0ijc t ≠ if there is a connection from node i to node j ( )j i≠ , otherwise ( ) ( )0ijc t j i= ≠ , and all the coupling coefficients ( )( ), 1, 2,. ,ijc t i j N= are bounded, that is, there ex-ists a positive constant δ such that
( )ijc t δ≤ , (2)
where δ is called as the coupling coefficients common bound. Assumption 1. Consider the parameters given in the time-varying network
(1). Without loss of generality, the first node is taken as the reference node. There exist N state feedbacks ( ) ( ) ( )1,2, ,i i i i i iu x B x v i Nα= + = satisfying
( ) ( ) ( ) ( )( ) ( )( ) ( )( ) ( )( )1 1 1i i
i i i i i i i i i i i ii
xf x G x x f x G x x
xϕ
α ϕ ϕ α ϕ∂
+ = +∂
(3)
( ) ( ) ( ) ( )( ) ( )( )1 1i i
i i i i i i i ii
xG x B x G x B x
xϕ
ϕ ϕ∂
=∂
, (4)
where
( ) ( ) ( )1
11, 2, , ; 1, 2, ,i
i i ik ii
i ij n n
x xj n k n
x xϕ ϕ
×
∂ ∂= = = ∂ ∂
is the Jacobi matrix with dimension 1 in n× , ( )i ixα are m-dimensional smooth nonlinear mappings and ( )i iB x are m m× invertible smooth nonlinear func-tion matrices.
Remark 1. It is not difficult to find the state-feedback controllers ( ) ( )i i i i i iu x B x vα= + satisfying (3) and (4). Firstly, for the given ( )i ixϕ and
( )i iG x , and the invertibility of ( )i iB x and ( )( )1 i iB xϕ , we can find the com-patible ( )i iB x ; ( )( )1 i iB xϕ and ( )( )i i iG xϕ satisfying (3). Then, substituting
( )( )i i iG xϕ into (4), the suitable ( )i ixα and ( )( )i i ixα ϕ can be obtained. In general, many controllers iu can satisfy (3) and (4).
5.2. Exponential Synchronization for the Time-Varying Network
In real-world networks, although it is often difficult to obtain the exact informa-tion about coupling coefficients, it is easy to get the coupling coefficients com-mon bound. Hence, the objective of this section is to synthesize appropriate de-centralized state-feedback controllers ( )1,2, ,iu i N= for network (1), which guarantee the network (1) can realize exponential synchronization [7].
For simplicity, denote ( )i i iy xϕ= and the synchronous errors between node i and node j be as follows,
( ) ( ) ( ), 1, 2, ,ij i i j j i je x x y y i j Nϕ ϕ= − = − = . (5)
Assumption 1. The coupling coefficients common bound is available, that is, the parameter δ in (2) is known.
The time-varying complex dynamical network (1) can achieve global expo-nential synchronization with the following decentralized state-feedback control-

X. Wang
DOI: 10.4236/me.2019.101021 321 Modern Economy
lers,
( ) ( )i i i i i iu x B x vα= + , (6)
( )( )( ) ( )( ) ( ) ( )( )( ) ( )1 1
1 1 12i i i i i R i i i iv B x x k G x xϕ α ϕ δ η ϕ ϕ− − = − − +
. (7)
where 1,2, ,i N= , ,k η ∈ℜ are both designing positive constants. Proof. For simplicity, notice that ( ) ( ) 0ii i i i ie x xϕ ϕ= − = . We can get the er-
ror dynamics for the networks (1) with controllers (5) and (7) as follows.
( ) ( )
( ) ( ) ( ) ( ) ( ) ( ) ( ) ( )
( )( ) ( ) ( ) ( ) ( ) ( )
( )( ) ( )( ) ( )( ) ( )( )( )( ) ( ) ( )( )
( )( )
1
11
1 1 1 1
11
1
j ji iij i j
i j
Ni i
i i i i i i i i i i i ij i i j jji
Nj jij j j j j i i i i i i i
jj
i i i i i i i i i
N
ij i i j jj
i i
xxe x x
x x
xf x G x x G x B x v c H x x
x
xf s c H x s G x x G x B x v
x
f x g x x x v
f s c H x x s
f x
ϕϕ
ϕα δ ϕ
ϕδ α
ϕ ϕ α ϕ β ϕ
δ ϕ
ϕ
=
=
=
∂∂= −
∂ ∂
∂ = + + + ∂
∂ − + + + ∂
= + +
− + −
=
∑
∑
∑
( ) ( )( ) ( )( ) ( )T1 1 1
1.
N
i i i i i i ij i i jj
f s d g x g x e c H x eϕ ϕ δ=
− + + ∑
(8)
where , 1, 2, ,i j N= . Choose the Lyapunov functional candidate as,
( )2T
1 2 2
Nii i
i i
d de eV
k=
+ = +
∑ . (9)
Then, with Equation (8), the time derivative of ( )V t along the trajectories of error dynamics (9) is
( )
( )( ) ( )( )( ) ( )
( )( ) ( )( ) ( ) ( )
T
1 1
T T T1 1
1 1T T 2 T
1 1
T T T1 1 1
1
2
2 2
N Ni
i i ii i i
N N
i i i i i i i ii i
N Ni i i i i i ij j j
i j
N
i n i i i i i i i i ii
d dV e e d
k
e e d e g x g x e
e H x H x e c e e
c Ne I dg x g x H x H x e
µ ϕ ϕ
δ
δ δµ ϕ ϕ
= =
= =
= =
=
+= +
≤ −
++
≤ + − +
∑ ∑
∑ ∑
∑∑
∑
(10)
According to Equation (5) and Equation (10), it can be deduced that 0V < .
5.3. Numerical Example
The Hindmarsh-Rose (HR) dynamical system is a well-known model of neuron-al activity [8], which can exhibit rich firing behaviors [7]. In what follows, we consider a network with N = 10 different-dimensional HR neurons, where the dynamics of each uncontrolled isolated node is as follows,

X. Wang
DOI: 10.4236/me.2019.101021 322 Modern Economy
( )( )12 11
1 1 1 11 13 1 12
11 12 13
a x xx f x x x c x
x x bx
− = = − + −
, ( )
( )2 1 4
1 3 2 2
1 2 3
1 3 4
5
, 2
arctan
arctan
i i i
i i i
i i i
i i ii i i
i
i i
a x x xx x c xx x bxx x dxx f x
x
x +
− + − + −
+= =
.
where a, b, c, d are the constant parameters that govern the dynamics of the neural system. The variable 1ix is a voltage associated to the membrane poten-tial, variable 2ix although in principle associated to a recovery current of fac-tions has dimensions of voltage, variable 3ix is a slow adaptation current asso-ciated to slow ions, variable 4ix represents an even slower process than 3ix variable, respectively.
In order to estimate costs reasonably, we consider hired employees as inflow of human capital in the dynamic network. Then, we allocate the recruitment of personnel according to the original proportion of the various positions. The churn rate of ICM is 18%. Owing to the time-varying complex dynamical net-work model and exponential synchronization model, the organization’s recruit-ment rate is 8.6%. Combined with the organization of the ICM position configu-ration status, we can get the recruitment of staff situation as follows.
Combined with Table 1 and Table 5, we can calculate ICM recruitment and training budgets of 34.22σ.
6. Dynamic Simulation Model of the Staff Turnover
6.1. Assumption and Reasonable Explanation of the Model
• There will be job vacancy due to the employee turnover. Under the circums-tances, ICM prefers to recruit new staff whose professional ability is similar with the ones leaving the company from the outside in order to keep the ser-vice behavior of work group in ICM as steady as possible.
Explanation Staff turnover of every enterprise is inevitable and the loss of staff is bound to
bring job vacancies. There are usually two methods to fill the job vacancy, exter-nal recruitment and promotion of internal employees. The external recruitment has the advantage of being able to hire experienced employees in given position, so that the new employees can involve themselves in this position quickly.
Meanwhile, the department’s schedule can also operate normally according to Table 5. The number of staff recruitment.
Level of position
Senior manager
Junior manager
Experienced/ Inexperienced
supervisor
Experienced employee
Inexperienced employee
Administrative clerk
Quantity 1 2 4 10 12 3
Chart source: organize by the author.
X. Wang
DOI: 10.4236/me.2019.101021 323 Modern Economy
the previous work pace. But we will take some risks if we promote internal cadres. Because the internal promoted employees are usually inexperienced in a new po-sition and whether he can reach the work efficiency of previous employee or not is unknown. Only from work efficiency’s point of view, it will reduce the work efficiency of the departments and increase the risk of turnover to replace the va-cant position with internal promoted employees.
Based on the assumption mentioned above, the integrity of the staff is only re-lated to staff turnover rate named ν and hiring rate named µ .
6.2. The Specific of Full Status for Positions
On the basis of human capital’s dynamic complex network model, we use the vi-sualization tools of Pajek to make analogue simulation on selected research ob-ject’s human capital flow condition [9].
6.2.1. The Simulation Result When the Changing Rate Is 25% We study whether the research object can maintain position integrity of 80% when the churn rate of the employees reaches 25%.
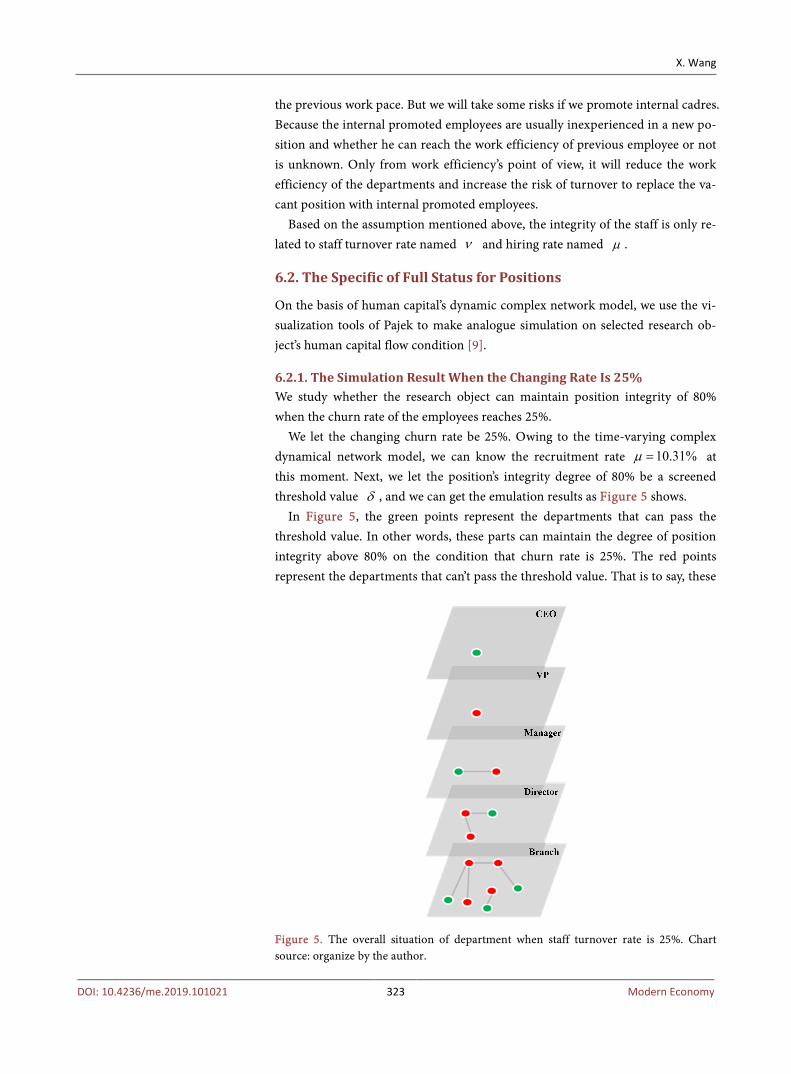
We let the changing churn rate be 25%. Owing to the time-varying complex dynamical network model, we can know the recruitment rate 10.31%µ = at this moment. Next, we let the position’s integrity degree of 80% be a screened threshold value δ , and we can get the emulation results as Figure 5 shows.
In Figure 5, the green points represent the departments that can pass the threshold value. In other words, these parts can maintain the degree of position integrity above 80% on the condition that churn rate is 25%. The red points represent the departments that can’t pass the threshold value. That is to say, these
Figure 5. The overall situation of department when staff turnover rate is 25%. Chart source: organize by the author.

X. Wang
DOI: 10.4236/me.2019.101021 324 Modern Economy
parts can’t maintain the degree of position integrity above 80% when the churn rate is 25%.
From Figure 5, we can reach the research object’s condition of position integr-ity when the churn rate is 25%, which is shown as Table 6.
6.2.2. The Simulation Result When the Changing Rate Is 35% We study whether the research object can maintain position integrity of 80% when the changing churn rate of the employees is 35%.
When the changing churn rate is 35%, according to the time-varying complex dynamical network model, we can know the recruitment rate 14.66%µ = . Be-sides, we let threshold value δ be 80%. By the visualization tools of Pajek, we get the emulation results as Figure 6 shows.
In a similar way, we can reach the research object’s condition of position inte-grity when the churn rate is 35%, which is showed as Table 7.
Compared with Table 6, the research object can almost not maintain its posi-tion integrity of 80% when the churn rate is 35%. We can see that the degree of position integrity is lower with the higher churn rate of human capital. At such a high churn rate of employees of 35%, most of the departments of ICM can’t guarantee its degree of position integrity above 80%, in which case we may think the human resource condition of ICM is very unhealthy at this moment.
6.2.3. The Bad Influence of High Staff Changing Churn Rate on Enterprise From above analysis, the high staff churn rate is of great harm to an enterprise and has a direct effect on the following points:
1) Affecting the staff morale of ICM. The departure of an employee will affect
Figure 6. The overall situation of department when staff turnover rate is 35%. Chart source: organize by the author.

X. Wang
DOI: 10.4236/me.2019.101021 325 Modern Economy
Table 6. The overall situation of department when staff turnover rate is 25%.
Over 80% CEO, Program manager, Director 1, Director 3, Branch B, Branch C, Branch E, Branch F
Under 80% VP, Production manager, Director 2, Branch A, Branch D, Branch G
Chart source: organize by the author.
Table 7. The overall situation of department when staff turnover rate is 35%.
Over 80% Director 2, Branch G
Under 80% CEO, VP, Production manager, Program manager, Director 1, Director 2, Branch A to Branch F
Chart source: organize by the author.
the morale of several employees because the departed one tends to make negative remarks about the enterprise in public.
2) Increasing the operating costs of ICM. With the departure of the former employees, there must be some new employees needed, which will invisibly in-crease the recruitment costs and training costs. At the same time the efficiency and job performance of newcomers are low, which makes the operating costs high all the time.
3) Influencing the team efficiency of ICM. Human resource shortages caused by employee churn will directly affect the team efficiency of ICM.
4) Affecting the long-term development of ICM. High rate of staff churn will certainly lead to a decline in the overall level of enterprise’s talent, and conse-quently lead to the decline of enterprises’ competitiveness. And the decline of the enterprise’s competitiveness is bound to affect the long-term development of the enterprise.
6.3. The Direct and Indirect Costs of High Turnover Rate
The high churn rate of staff will certainly bring a high rate of staff turnover and the high turnover rate is bound to increase the cost of human resources. So we can roughly divide this costs into direct costs and indirect costs:
6.3.1. Direct Costs of High Turnover Rate 1) Recruitment costs mainly include: the preparation, screening resumes, in-
terviewing costs, the cost of preparation for hiring and handling the recruitment procedures etc.
2) Training costs mainly include: pre-post training preparation, training mate-rials, training management costs etc.
3) Costs that internal staff to fill job vacancies mainly include: the cost of in-ternal staff to fill job vacancies, additional overtime working costs, the costs that executives coordinate to complete the work etc.
4) Costs during the new employees adapting to the position. When employees come to a new position, there must be an adjustment period. And in this period, the enterprise still needs to pay wages, which undoubtedly increases the enter-prise’s costs.

X. Wang
DOI: 10.4236/me.2019.101021 326 Modern Economy
6.3.2. Indirect Costs of High Turnover Rate 1) Costs caused by the flagging morale. The departure of one staff will make
the other staff to leave the company like domino. What’s more there will be a process of consideration before they leave the job. During the process, employees will inevitably look for colleagues to discuss and naturally affect the emotion of other employees, which will reduce the efficiency of team cooperation.
2) Costs caused by the lack of reserve forces of enterprise. The frequent staff churn makes it difficult to select the middle managers because of the lack of tal-ents, thereby making the enterprise unable to fill the middle-level position va-cancies inside if they select senior personnel from the mid-level position, which will cause a shortage of talent. Eventually it will influence the echelon building of enterprise.
3) Costs caused by the leaks of important secrets. These important secrets are about technology, loss of customer resources, the re-use of management methods etc.
7. The Simulation Model of ICM’s Staff Flow
7.1. Assumption and Reasonable Explanation of the Model
• Due to the employee turnover, ICM fill the job vacancy only by promoting internal employees without external recruitment.
For this assumption, we try to consider ICM as a completely closed system and there is the output but no input of the human capital in this system. So we can better research and analyze the flow condition of internal human resources in ICM. • The internal promotion of ICM is in strict accordance with rigid structure of
position, that is to say, the position of the upper hierarchy can only be re-placed by the position of lower hierarchy just adjacent to the upper one, and there is no Great promotion.
As we all know, the condition of the Great promotion is relatively rare in reali-ty. There are certain obstacles among hierarchical structures of enterprise. The obstacles can be divided into ability obstacle, experience obstacle and communi-cation. The bigger the hierarchical span is, the more obviously the obstacles per-form, which is the objective law existed in enterprise management. Therefore the assumption is relatively close to reality.
For example, the vacant position, senior manager can only be replaced by the lower position or experienced supervisor. In addition, when the employee turn-over occurs, the vacant position will be soon filled with personnel qualified to promote. This process doesn’t cost any time and it continues until no second-string employees can be promoted.
7.2. The Simulation Model of Integrity Degree for Junior Managers
7.2.1. The Status Quo of ICM ICM is now facing a serious problem. ICM recognizes that middle managers (ju-
X. Wang
DOI: 10.4236/me.2019.101021 327 Modern Economy
nior managers, experienced supervisors, inexperienced supervisors) often feel stuck in their jobs with little opportunity to advance, causing them to leave the company when they find a comparable or better job. These mid-level positions are critical ones that unfortunately suffer high turn-over (twice the average rate of the rest of the company) and seem to need filling all the time. This is the main cause of high churn rate and lower recruitment rate of middle managers at present. Hence we select 5 junior managers and 15 experienced supervisors as object to research.
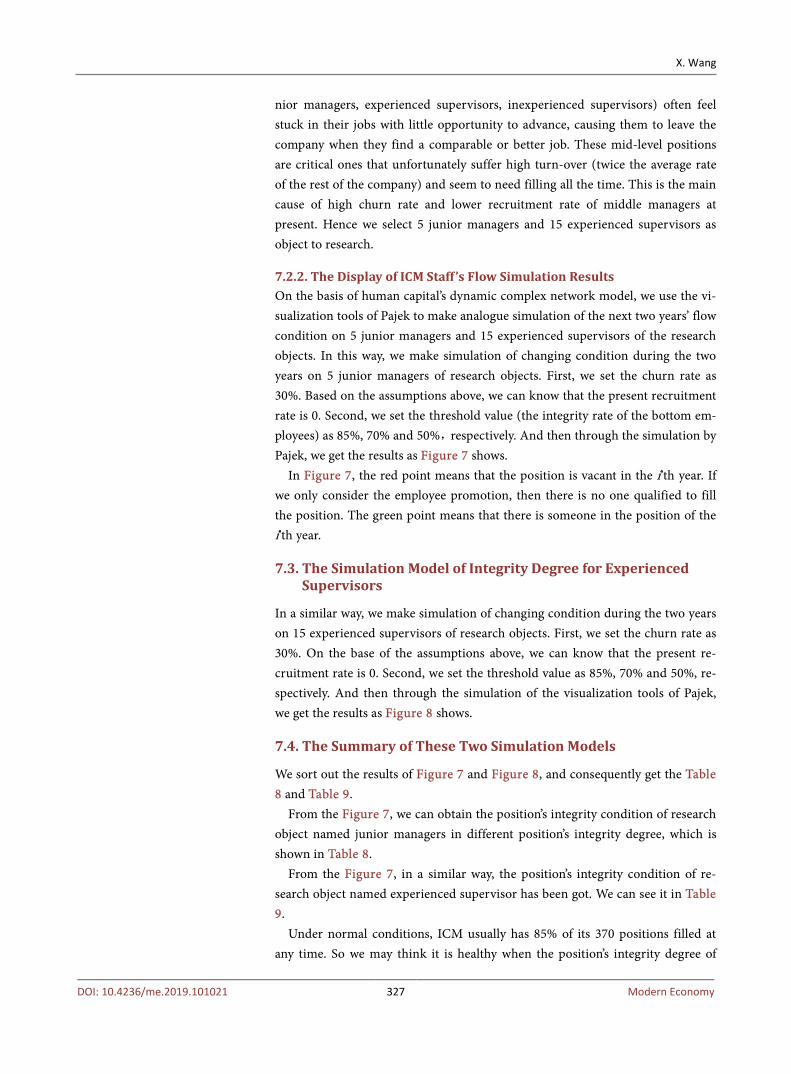
7.2.2. The Display of ICM Staff ’s Flow Simulation Results On the basis of human capital’s dynamic complex network model, we use the vi-sualization tools of Pajek to make analogue simulation of the next two years’ flow condition on 5 junior managers and 15 experienced supervisors of the research objects. In this way, we make simulation of changing condition during the two years on 5 junior managers of research objects. First, we set the churn rate as 30%. Based on the assumptions above, we can know that the present recruitment rate is 0. Second, we set the threshold value (the integrity rate of the bottom em-ployees) as 85%, 70% and 50%,respectively. And then through the simulation by Pajek, we get the results as Figure 7 shows.
In Figure 7, the red point means that the position is vacant in the i’th year. If we only consider the employee promotion, then there is no one qualified to fill the position. The green point means that there is someone in the position of the i’th year.
7.3. The Simulation Model of Integrity Degree for Experienced Supervisors
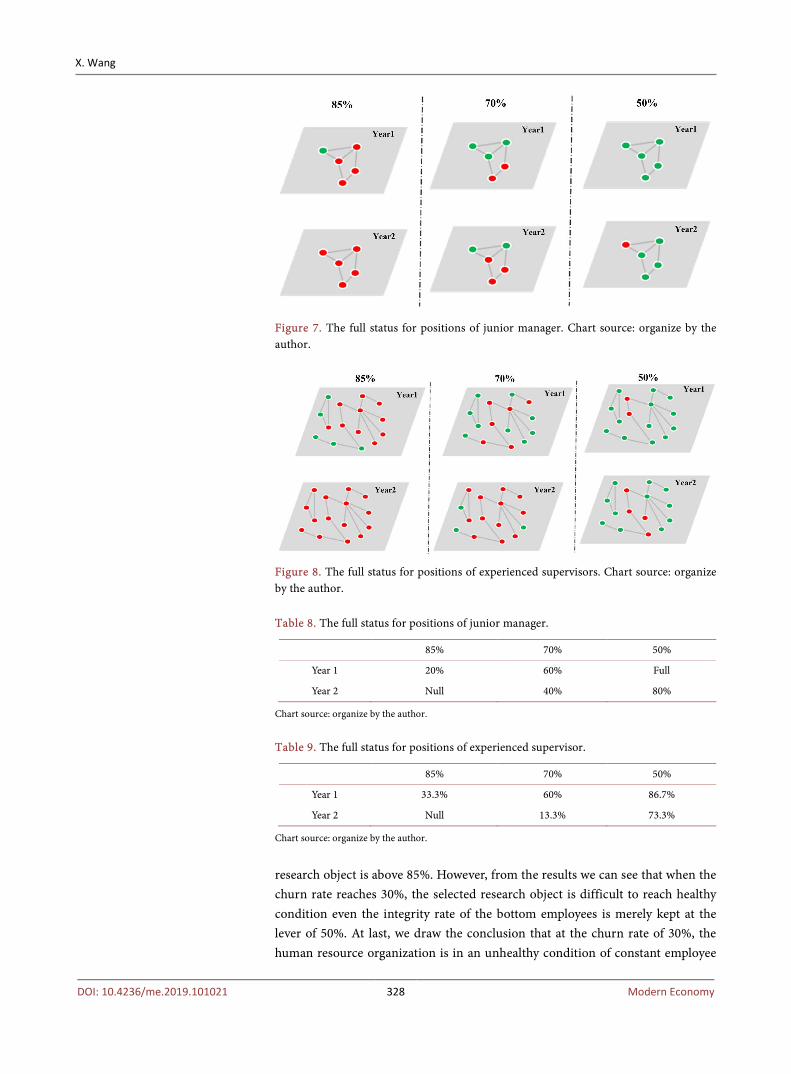
In a similar way, we make simulation of changing condition during the two years on 15 experienced supervisors of research objects. First, we set the churn rate as 30%. On the base of the assumptions above, we can know that the present re-cruitment rate is 0. Second, we set the threshold value as 85%, 70% and 50%, re-spectively. And then through the simulation of the visualization tools of Pajek, we get the results as Figure 8 shows.
7.4. The Summary of These Two Simulation Models
We sort out the results of Figure 7 and Figure 8, and consequently get the Table 8 and Table 9.
From the Figure 7, we can obtain the position’s integrity condition of research object named junior managers in different position’s integrity degree, which is shown in Table 8.
From the Figure 7, in a similar way, the position’s integrity condition of re-search object named experienced supervisor has been got. We can see it in Table 9.
Under normal conditions, ICM usually has 85% of its 370 positions filled at any time. So we may think it is healthy when the position’s integrity degree of
X. Wang
DOI: 10.4236/me.2019.101021 328 Modern Economy
Figure 7. The full status for positions of junior manager. Chart source: organize by the author.
Figure 8. The full status for positions of experienced supervisors. Chart source: organize by the author. Table 8. The full status for positions of junior manager.
85% 70% 50%
Year 1 20% 60% Full
Year 2 Null 40% 80%
Chart source: organize by the author.
Table 9. The full status for positions of experienced supervisor.
85% 70% 50%
Year 1 33.3% 60% 86.7%
Year 2 Null 13.3% 73.3%
Chart source: organize by the author.
research object is above 85%. However, from the results we can see that when the churn rate reaches 30%, the selected research object is difficult to reach healthy condition even the integrity rate of the bottom employees is merely kept at the lever of 50%. At last, we draw the conclusion that at the churn rate of 30%, the human resource organization is in an unhealthy condition of constant employee
X. Wang
DOI: 10.4236/me.2019.101021 329 Modern Economy
turnover without recruitment from the outside.
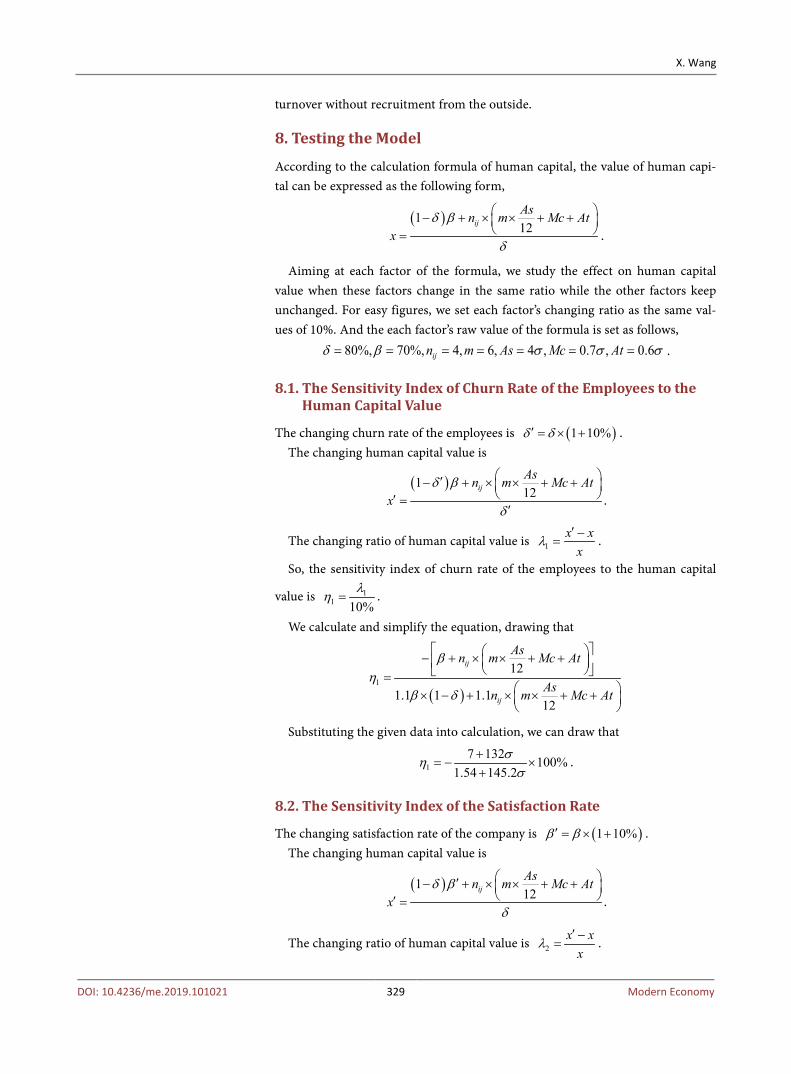
8. Testing the Model
According to the calculation formula of human capital, the value of human capi-tal can be expressed as the following form,
( )112ijAsn m Mc At
xδ β
δ
− + × × + + = .
Aiming at each factor of the formula, we study the effect on human capital value when these factors change in the same ratio while the other factors keep unchanged. For easy figures, we set each factor’s changing ratio as the same val-ues of 10%. And the each factor’s raw value of the formula is set as follows,
80%, 70%, 4, 6, 4 , 0.7 , 0.6ijn m As Mc Atδ β σ σ σ= = = = = = = .
8.1. The Sensitivity Index of Churn Rate of the Employees to the Human Capital Value
The changing churn rate of the employees is ( )1 10%δ δ′ = × + . The changing human capital value is
( )112ijAsn m Mc At
xδ β
δ
′− + × × + + ′ =′
.
The changing ratio of human capital value is 1x x
xλ
′ −= .
So, the sensitivity index of churn rate of the employees to the human capital
value is 11 10%
λη = .
We calculate and simplify the equation, drawing that
( )1
12
1.1 1 1.112
ij
ij
Asn m Mc At
Asn m Mc At
βη
β δ
− + × × + + = × − + × × + +
Substituting the given data into calculation, we can draw that
17 132 100%
1.54 145.2σησ
+= − ×
+.
8.2. The Sensitivity Index of the Satisfaction Rate
The changing satisfaction rate of the company is ( )1 10%β β′ = × + . The changing human capital value is
( )112ijAsn m Mc At
xδ β
δ
′− + × × + + ′ = .
The changing ratio of human capital value is 2x x
xλ
′ −= .

X. Wang
DOI: 10.4236/me.2019.101021 330 Modern Economy
So, the sensitivity index of the satisfaction rate value is 22 10%
λη = .
We calculate and simplify the equation, drawing that 21.4 100%
1.4 132η
σ= ×
+.
8.3. The Sensitivity Index of the Other Five Factors
In a similar way, we can obtain that the sensitivity index of the amount of em-ployees of each hierarchy to the human capital value
34488 100%
1.4 132σησ
= ×+
.
The sensitivity index of median time to recruit (months) to the human capital value is
480 100%
1.4 132ση
σ= ×
+.
The sensitivity index of employees’ average annual salary rate for given lever to the human capital value is
580 100%
1.4 132ση
σ= ×
+.
The sensitivity index of median cost of recruitment to the human capital value is
628 100%
1.4 132ση
σ= ×
+.
The sensitivity index of average annual training cost to the human capital val-ue is
724 100%
1.4 132ση
σ= ×
+
8.4. The Comparison of the Sensitivity Index’s Absolute Value
Comparing their absolute value, we can obtain that
3 1 4 5 6 7 2η η η η η η η> = > > .
That is to say, the amount of employees of each hierarchy has greatest influ-ence on human capital value, while the satisfaction rate of the company has the least influence. Besides, the median time to recruit has the same influence as employees’ average annual salary rate on human capital value. It’s clear that the sensitivity index of churn rate of the employees is a negative number. But the other factors’ sensitivity indexes are all positive number. It suggests that the in-crease of employees’ churn rate will reduce the human capital value. However, the other factors’ influence on the human capital is positive.
In combination with the results above, we can draw the conclusion that: to maximize the human capital value, we should mainly focus on distribution of every lever’s quantity of employees carefully. What’s more, we should also try to

X. Wang
DOI: 10.4236/me.2019.101021 331 Modern Economy
reduce company’s churn rate of the employees, allocate the recruiting time and employees’ average annual salary rate reasonably, and plan recruitment costs as well as employees’ average annual salary rate properly. To achieve the required goal of human capital value, we can make the same change on the recruitment time or the employees’ average annual salary rate.
9. Final Conclusion
Through setting up the dynamic complex network model of human capital, the author draw the conclusion that the next two years’ budget of recruiting and training is 34.22σ when the annual churn rate goes to 18%. Through establishing the dynamic simulation model of the staff turnover, the author reached the posi-tion’s integrity condition of ICM when the job churn rate is 25% and 35%, re-spectively.
Then the author explained the costs caused by high turnover rates and the in-direct effects of high churn rates. The author simulated the change of position’s integrity degree of junior managers and experienced supervisors in the next two years. The author concluded that the HR health of the organization is below the expectation.
In addition, the author made sensitivity analysis on the 7 factors of human capital value and consequently drew that the amount of employees of each hie-rarchy has the greatest influence on human capital value.
10. Limitations and Further Discussion of the Model
How to connect our Human Capital network with other layers of organizational network such as information flow, trust, influence and friendship?
We have an idea. We know that different employees have different relationships in ICM. This
kind of relationship can be formatted, on the base of several levels such as in-formation flow, trust, influence and friendship etc. As the human resources de-partment of ICM, we have the ability to collect the interpersonal networks at different levels and we can let each employee provide their personal networks at different levels, whose form is shown in Figure 9.
Figure 9 shows the relationships of an employee in ICM at different levels such as information flow, trust, influence and friendship [4].
By analyzing the interpersonal relationship plate at different levels provided by each employee, we can aggregate the relationships among all the employees in ICM so that we get the interpersonal networks at every level of the whole ICM, as is shown in Figure 10.
In Figure 10, different colors of board represent the interpersonal networks at different levels of all employees [4]. At each level such as friendship, we assume that the employee 1 has contact with the employee 2 so we link this two with a solid line. At different levels such as the friendship and trust, we assume that the employee 1 and the employee 2 have a relation in the friendship. In the trust level,

X. Wang
DOI: 10.4236/me.2019.101021 332 Modern Economy
Figure 9. The personal networks at four main levels. Chart source: organize by the au-thor.
Figure 10. The personal networks at four main levels. Chart source: organize by the au-thor the employee 1 still has connection with the employee 2. Under such circums-tances, we will link the employee 1 and the employee 2 at different levels with a dotted line. Thus we can get a three-dimensional interpersonal relationship network of all employees in ICM at different levels. By doing this, not only can we clearly see the interpersonal relationships among employees at each level, but we can also observe the interpersonal relationships of all the staff in ICM at dif-ferent levels from the three-dimensional point of view.
But the model the author built is lack of practicality to some extent especially when facing different companies and organizations. The author didn’t have enough consideration for organizational diversity.
However, the author can define that the solid line represents strong relation while the dotted line link represents weak relation. When the staff turnover oc-curs, it is bound to have an impact on interpersonal relationship network related

X. Wang
DOI: 10.4236/me.2019.101021 333 Modern Economy
to him. How it affects the others? The effect is strong or weak? We can all ana-lyze these problems by the network.
Conflicts of Interest
The author declares no conflicts of interest regarding the publication of this pa-per.
References
[1] Martins, T.V., et al. (2009) Network Effects in a Human Capital Based Economic Growth Model. Physica A, 388, 2207-2214. https://doi.org/10.1016/j.physa.2009.02.006
[2] Pozzi, F., Bottino, R.M. and Persico, D. (2014) Enhancing Human Capital in TEL Research: A Case Study from the STELLAR Network of Excellence. Computers in Human Behavior, 31, 425-431. https://doi.org/10.1016/j.chb.2013.10.062
[3] Fagan, J. and Ployhart, R.E. (2015) The Information Processing Foundations of Human Capital Resources: Leveraging Insights from Information Processing Ap-proaches to Intelligence. Human Resource Management Review, 25, 4-11. https://doi.org/10.1016/j.hrmr.2014.09.003
[4] Kivela, M., Arenas, A., Barthelemy, M., Gleeson, J.P., Moreno, Y. and Porter, M.A. (2013) Multilayer Networks. Journal of Complex Networks, 2, 203-271. https://doi.org/10.1093/comnet/cnu016
[5] Wu, D.T. and Li, D.F. (2004) Shortcomings of Analytical Hierarchy Process and the Path to Improve the Method. Journal of Beijing Normal University (Natural Science), 40, 265-267.
[6] Zhang, L.L., Wang, Y.H. and Wang, Q.Y. (2015) Synchronization for Time-Varying Complex Dynamical Networks with Different-Dimensional Nodes and Non-Dissipative Coupling. Communications in Nonlinear Science and Numerical Simulation, 24, 64-74. https://doi.org/10.1016/j.cnsns.2014.12.012
[7] Zhang, L.L., Wang, Y.H., Wang, Q.Y., Wang, Q.R. and Zhang, Y. (2013) Synchro-nisation of Complex Dynamical Networks with Dynamics of Nodes via Decentra-lised Dynamical Compensation Conrollers. International Journal of Control, 86, 1766-1776. https://doi.org/10.1080/00207179.2013.796525
[8] Hrg, D. (2013) Synchronization of Two Hindmarsh-Rose Neurons with Unidirec-tional Coupling. Neural Networks, 40, 73-79. https://doi.org/10.1016/j.neunet.2012.12.010
[9] de Nooy, W., Mrvar, A. and Batagelj, V. Exploratory Social Network Analysis with Pajek. https://www.docin.com/p-1774451668.html