strategic implication of a segmentation and positioning
TRANSCRIPT

c'r,21G11C ilffiffLi11D CAITHCON ©IF A
EIGM-Emmrsaal AN 23EMONIEG MODIL W© ULM EDMITE MICCA\N CAD CW2MT KEE:11G tl\MA rflr GO
CC CCCD:M OundwilnaulfirnEolotz= G la I
'aunclliaff2 Ke. gi'OD22,60

CONTENTS TOPIC PAGE
CHAPTER 1 : AN INTRODUCTION 1 - 3
1.1 Marketing Approaches Over Time 3 - 7
1.2 Statement of the Problem 7 - 8
1.3 Objectives of the Study 8 - 9
1.4 Methodology 9 - 10
1.5 Demarcation of the Study 10
1.6 Chapter Outline 10 - 11
CHAPTER 2 : MARKET SEGMENTATION, TARGETING AND 12 POSITIONING AS RELATED TO THE SOUTH AFRICAN GOLD MINING INDUSTRY
2.1 How gold Mines Purchase Explosives 13 -16
2.2 The Nature of Explosives Purchasing 16 - 17
2.2.1 Understanding Individual Behaviour 17 - 20
f.
2.2.2 Motivating Behaviour 20 - 22
2.2.3 The Buyer Decision Making Process 22 - 25
2.3 Market Segmentation 25 - 26
2.3.1 Market Segmentation Approaches Reviewed 26 - 29
2.3.2 Difficulties in Segmenting the Narrow Reef Explosives Market 29 - 31
2.4 A Segmentation Approach for this Study 31 - 36
2.5 Targeting Market Sectors 36 - 38
2.6 Product Positioning 38 - 41

TOPIC PAGE
CHAPTER 3 : DEVELOPMENT OF A SEGMENTATION MODEL 42
3.1 First Step - Define the Business Environment 42
3.1.1 Who is the Customer 43 - 47
3.1.2 Where are the Mines Located 47 - 48
3.1.3 What product is going Where? 48 - 49
3.1.4 What Market Needs Exit? 49 - 53
3.1.5 How can the Gold Explosives Market be Quantified? 53 - 56
3.1.6 Who Competes for the Market? 56 - 57
3.1.7 What Physical and Cultural Environment Exist in Gold Mines? 57 - 58
3.2 Second Step - Understanding Buyer Behaviour 58 - 63
3.3 Third Step - Identify the Base Variables and Segment the Market 63
3.3.1 Identification of the Base Variables 63 - 66
3.3.2 Segmenting the Market r.
66 - 69
3.4 Final Step - Verify the Result 69 - 70
CHAPTER 4 : TARGETING, POSITIONING AND STRATEGIC IMPLICATION 71
4.1 Business Strengths and Market Attractiveness in Relation to Market Segments 71 - 72
4.1.1 Market Attractiveness Versus the Market Position 72 - 76
4.1.2 Economical/Technological Needs Versus Capability 76
4.1.3 Competitive Position Versus Market Interaction 76 - 77
4.1.4 Market Targeting 77 - 82

TOPIC
4.2 Product and Service Positioning
4.2.1 Product Positioning in Market Sector A
4.2.2 Product Positioning in Market Sector B
4.2.3 Product Positioning in Market Sector C
4.2.4 Product Positioning in Market Sector D
PAGE
82 - 84
84 - 85
85 - 87
87 - 88
88 - 90
4.3 A Corporate Image 90
CHAPTER 5 : CONCLUSION AND RECOMMENDATIONS 91
5.1 A Summary 91
5.1.1 Study Objectives Reviewed 91 - 92
5.1.2 The Segmentation Model, Targeting and Positioning 92 - 95
5.2 Conclusion 95 - 96
5.3 Recommendations 96 - 97
BIOGRAPHY 98 - 99
FIGURES
Figure 2.1 : The Gold Mine Supply 14
Figure 2.2 : Individual-Behavioural Framework (Gibson et al, 1994: 99) 17
Figure 2.3 : A graphic comparison of the Maslow and Hertzberg motivational theories 21
Figure 2.4 : The stages of decision making ( Bateman and Zeithaml, 1990: 90) 24

Figure 2.9 :
Figure 3.1 :
Figure 3.2 :
Figure 3.3 :
Figure 4.1 :
Figure 4.2 :
Figure 4.3 :
Figure 4.4 :
Figure 4.5 :
Figure 4.6 :
Figure 4.7 :
PAGE
Major potential bases for segmentation according to the nested approach (Bingham and Raffiled, 1990: 202) 27
Dayle and Saunders industrial market segmentation model focusing on product benefits (Eckles, 1990 : 126) 28
The variable filtering approach to market segmentation 32
Implication of alternative positions within the Market Attractiveness/ Competitive Position Matrix (Walker et al, 1992: 197) 37
Strategic competitive positions for the U.S. Heavy-Duty Truck Market as measured by Return on Investment (Walker et al., 1992,305)
40
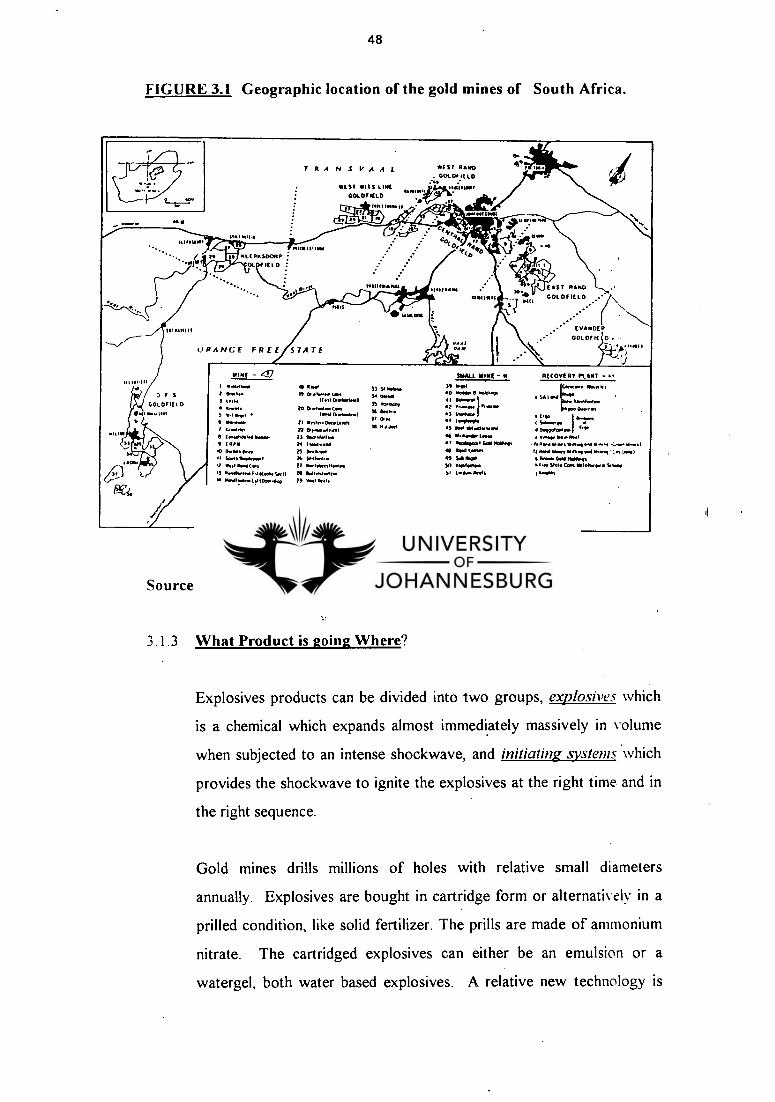
Geographic location of the gold mines of South Africa 48
Effect of cost and revenue for low and high cost producers 53
The gold explosives market as defined by operational excellence and affordability 67
Matching market attractiveness to company competitiveness (Size, Price, Technology, Presence and Life are considered) 73
The strategic implication cells of the Walker matrix (Figure 2.8) to be consulted for guidance in Market Segment A 78
The strategic implication cells for Walker consultation of the matrix for Market Segment B 79
The strategic implication cells for Walker consultation of the matrix for Market Segment C 80
The strategic implication cells for Walker consultation of the matrix for Market Segment D 81
Product Position Space matrix with product positions in Market Sector A 85
Product Position Space matrix with product positions in Market Sector B 86
TOPIC
Figure 2.5 :
Figure 2.6 :
Figure 2.7 :
Figure 2.8 :
TOPIC PAGE
Figure 4.8 : Product Position Space matrix with relative product positions in • Market Sector C
88
Figure 4.9 : Product Position Space matrix with relative product positions in Market Sector D
89
Figure 5.1 : The Market Segmentation Model explaining Explosives buyer behaviour in the Gold Narrow Reef Market
93
TABLES
Table 1 : Mining Houses and Associated Mines 2
Table 2.1 : Pros and Cons of using groups to make decisions (Bateman and Zeithaml, 1993 : 97) 25
Table 2.2 : Motivational Score Card 34
Table 3.1: Annual Number of holes drilled which serves as quantification for the explosives market 55
Table 3.2 : Relative Market Share of Explosives Companies in South Africa 56
Table 3.3 : Operational and Performance variables describing the Gold Mines of South Africa. 59
Table 3.4 : Relative importance of filters with regard to motivation of buying behaviour 64
Table 4.1 : Market Attractiveness and Business Strengths to be considered in targeting a market segment 72
Table 4.2 : The size of Segments A,B,C and D measured in million holes drilled annually, with the life of mine also indicated 74
Table 4.3 : The major product groups offered in the Gold Narrow Reef Market 83
Table 5.1 : Attractiveness and Competitive factors considered in market targeting 94
APPENDIX 1: SENIOR MINING PEOPLE PLOTTING THEIR MINES IN THE MARKET FIELD

CHAPTER 1
AN INTRODUCTION
INTRODUCTION
When the first 51 gold diggers settled in 1885 at Kromdraai west of where
Johannesburg would develop in later years, the foundation was set for a synergistic
growth between the narrow reef gold industry and an industrial complex supplying the
gold mines of equipment and commodities necessary to unlock the riches of the earth.
Although the South African industrial development largely resulted from the mining
industry, the latter was saved many times by the innovativeness and ingenuity of the
mining supplier industry (Anon, 1986:5). For example, improved hoist rope
technologies helped to reach the deeper lying reefs, sequential firing facilitated higher
mining rates and the cyanide beneficiation process allowed gold recovery to continue
when the state of the art technologies of the time failed to do so.
Today the South African Gold Mining Industry is in a mature stage, but still produces
almost 500 tons of gold annually, about 40 % of annual world production. The gold is
mined from deep narrow reefs, extending spatially over large areas and dipping
between 10° and 30°. The rock sufrounding the gold bearing reefs is typically hard but
strong allowing mining at great depths. However, the high quartz content of the rock
makes it highly abrasive on steel mining tools, one of the major factors inhibiting full
mechanization of the mining process. Mining is still conducted by labour intensive drill
and blast techniques. The pneumatic rock drills are hand held, although air legs are
assisting in forward pressure. Explosives are inserted by hand or pneumatic means.
Broken rock is removed by electric driven rope scraper winches and trammed by rail to
vertical ore-pass systems which collects all broken rock at shaft bottom to be hoisted
to surface.
There are currently 33 large operating gold mines owned by or associated with six
mining houses. Roughly one third of these mines are old and marginal with large
infrastructures to be maintained resulting in mining operations being far from the

2
shafts. The remaining mines can be divided into two groups; those that are established
with a 10 to 25 year life of mine left, or those established with new mines to be
developed from current mine infrastructure. These mines have life of mine
expectancies of over 25 years. Table I provides a summary of the mines with their life
expectancies (Von Below, 1996:17).
TABLE I : Mining Houses and Associated Mines
MINING HOUSE
••:mi[xs::::: - I.i.opyriort,::::: ANNUAL ootp: - - - • • : ::PROD(TONS): •
LIFE OF ::: - 'MINE
Amgold (Anglo Elandsrand Carltonville 15,4 20+ American) Freegold Welkom 92,7 20
Vaal Reefs Orkney 66,2 30+ Western Deep Levels Carltonville 35,8 30
Anglovaal Hartebeestfontein Stilfontein 25,2 10 Loraine Allanridge 6;6 5+ E T Cons Barberton 3,2 11
Goldfields Deelkraal Carltonville 6,6 19 Drie Cons Carltonville 50,6 25+ Kloof Randfontein 43,5 24
JCI HJ Joel Welkom 4,1 16+ Randfontein Randfontein 23,0 25+ Western Areas Randfontein 17,3 65+
Gengold Beatrix ..• Welkom 14,6 20 Kinross c' Evander 8,5 16 Leslie Evander 2,4 6 St Helena Welkom 5,3 7 Winkelhaak Evander 8,8 10 Fairview Barberton 1.5 -
Randgold Blyvooruitzicht Carltonville 4,0 11 Buffelsfontein Stilfontein 8,9 17 Doornfontein Carltonville 3,7 - Durban Deep Roodepoort 2,0 24 ERPM Germiston 8,2 6 Grootvlei Boksburg 2; 5 16 Harmony Virginia 20,1 9 Unisel Welkom 4,2 22 West Wits Randfontein 3,7 6 Stilfontein Stilfontein 0,6 -
Other Benoni Benoni 2,0 19 Cons Modder Boksburg 1,5 12 Knights Springs 1,3 25 Lindum Springs 1,7 7
Source : Von Below : 1996, 17

3
Three major explosives companies supply explosives products to the narrow reef gold
mining market, but other local and foreign suppliers are distributing explosives
products in association with these major suppliers or try to enter the market
independently. The major suppliers are AECI Explosives Limited (AEL), Sasol Mining
Explosives (SMX) and Bulk Mining Explosives (BME). SMX and BME are wholly
owned subsideries of Sakil Limited and Omnia Limited respectively. AEL, however, is
a joint venture between Imperial Chemical Industries Plc and AECI Limited.
This study is an attempt to segment the gold mining industry in relation to explosives
requirements in order for AEL to target and position itself successfully in a market
they still dominate but has been losing market share over the last ten years.
1.1 MARKETING APPROACHES OVER TIME
Until recently, AEL was effectively the only supplier of explosives to the South
African Gold Mining Industry and therefore monopolistic in nature. Right from
the origins of the gold industry, the old Transvaal Government discouraged
competition to maintain some control over the mining activities on the
Witwatersrand. The mining rush attracted foreigners in such numbers that it
became a threat to the Old Transvaal Boer Republic. Only one dynamite
concession was granted to Edouard Lippert, a cousin of Alfred Beit (Anon,
1986:12). Explosives manufacturing started at Modderfontein close to
Johannesburg and operated effectively as a monopoly. In reaction, Cecil John
Rhodes started an explosives company in Somerset West near Cape Town. In
later years these two companies amalgamated to form the African Explosives
and Chemical Industries. This amalgamation maintained AECI as a monopoly,
a situation that persisted until Sasol Mining Explosives was formed in the early-
eighties.
As the only supplier of Explosives products in South Africa, AECI had an
explosives supply agreement with the Chamber of Mines. All supply
requirements were expected to be met. In the nineteen eighties competition in

5
❑ Differentiated Market Strategy
(Mid-Eighties to early Nineties)
The mines became less tolerant to companies such as AECI which was
inflexible in their product offering and which harboured inefficiencies due to the
monopolistic nature of their business. At the time Sasol Industries became
interested in the fertilizer and explosives industries in order to develop a market
for the large volumes of ammonia produced as a by-product of the synthetic
fuel process. Sasol Mining Explosives started in 1985 and soon AECI started
losing market share, especially in mines associated with the Gold Fields mining
group. Sasol Mining Explosives entered the market with a low pricing policy.
AECI reacted by differentiation of its explosives products and marketing mix
and succeeded in obtaining a premium. The differentiation was based on the
nitro glycerine range of products which were extremely popular in the narrow
reef market due to its strength and forgiving nature in conditions of low
operational discipline. AECI was still the only supplier of blasting accessories,
that is detonators, fuse and igniter cord and was the only supplier which could
offer a full blasting system, that is both explosives and initiating systems.
Differentiation from its competitors was also achieved through high service
levels which included a welt trained and competent sales force. Better technical
advice was offered, better blast design using software developed in conjunction
with ICI was included in the service package. Central bargaining with the
Chamber of Mines was discontinued by the mines in 1985, which resulted in
centralised mining house price negotiations where a pricing structure designed
for each mining house and based on different discounts from the National Price
List was annually re-negotiated.
Market sectors were roughly arranged according to mining house with the
belief that some mining houses were more interested in technical and other
services while others were only interested in low priced explosives
commodities. In practice, however, high service levels were given to all mines
at all times. In 1993, ICI obtained a majority share of the explosives interest of

6
AECI, and the formation of a joint venture between AECI and ICI was formed
and called AECI Explosives Limited. AECI Explosives Limited stopped
producing water based explosives which was not ICI technology, but these
prOducts are still toll manufactured by a new player, Dantex Explosives on
behalf of AEL. Meanwhile, in first world countries, ICI discontinued the
manufacture of nitro glycerine based explosives, mainly due to the
environmental hazards of the manufacturing process and the physiologic effect
these explosives have on mine workers.
Dispite these changes to its micro environment, AEL still operated as if it were
all things to all customers. In addition to the water gel and nitro glycerine
explosives, water based emulsion explosives, which is an ICI technology, was
manufactured. In 1994, a huge accidental explosion in the nitro glycerine
manufacturing plant occurred, 11 AEL employees were killed. It was decided
to discontinue the manufacture of nitro glycerine explosives and to expand the
emulsion technology to replace it.
Competitors reacted to the way AEL differentiated on the basis of service
levels. They started to develop and grow their technical competence. AEL
attempted to reduce overl4ad cost, and reduced the sales force in 1995. During
1996, little difference could be detected between AEL and SMX technical
service. BME decided in 1995 to enter the underground explosives market and
erected a manufacturing plant near Fochville in the West Rand region and are
now trying to enter the market by undercutting both AEL and SMX on price.
AEL, dispite the intense competition, still succeeded in maintaining a high
market share in explosives. AEL also acts as the price setter, where SMX and
BME adjust prices accordingly. However, the intense price struggle lowered
margins of packaged explosives products to such an extent that a loss is
currently made on these products.
AEL still dominates the initiating system market, but companies specializing in
initiating systems from the international arena entered the market recently in

7
association with local competitors. For example, Ensign Bickford entered the
market in association with SMX and Famesa in association with BME.
The basis on which AEL differentiated itself has thus been eroded away by
recent events in the market place and it became clear that a more concentrated
market strategy is required to maintain market share and retain and improve
profitability.
❑ A More Concentrated Marketing Strategy Required
(Early Nineties to Current)
With the competitive edge being lost in the market to competitors who are
copying the service and marketing approach AEL is following, it became
necessary to readjust the strategy. It is too expensive to try and service all
market segments, since some market sectors might exist where these activities
only adds cost without earning a premium. Currently, AEL realises changes are
required and is looking for a credible segmentation model which will allow
clear and decisive focus in the market. The objective will be to stabilise market
share in the face of increased competition by serving selected markets best
suited to the company's infrastructure, technology and culture. It is important
to maintain a large market share, as economy of scale ensures price
competitiveness. Large investment will also be decided on the basis of the
segmentation. New technologies currently in an introductory phase, can
potentially replace the older technologies if clear markets exist. To summarise,
AEL is currently in stage of creative chaos, where it is clear change is required,
but it is not clear what the direction should be.
1.2. STATEMENT OF THE PROBLEM
Many variables exist that influence buyer behaviour in the narrow reef gold
mining market. Since some variables are real but subjective in nature, such as
the opinion and charisma of mine managers or influential individuals, it is
difficult to quantify and analyse them. The question is ? Which variables,
8
quantifiable or not, are more dominant in shaping buyer behaviour and how
should they be prioritised?
What is needed is a logical segmentation model which reflects true buyer
behaviour in order to shape future strategies in AEL so that the overall
company objectives can be met. Each segment should then be analysed and
considered regarding attractiveness in satisfying needs and the ability to add
value both to the customer and to AEL. It is also required to target market
segments and develop a marketing mix for them so that AEL is correctly
positioned to retain the markets it choose to compete in.
The problem is the failure to identify market areas of similar response
which are relatively stable and can be used to select areas where maximum
value can be added to the customer and to the company and can be used to
shape and define future direction.
1.3. OBJECTIVES OF THE STUDY
The following objectives have been set for this study: r.
- The establishment of a market segmentation model which will identify and
explain the basis of similarities and differences in buyer behaviour groups which
is sufficiently large and stable in order to focus future strategies.
- The interpretation of the segmentation model in the light of the strengths,
weaknesses, opportunities and threats of the company in order to target
markets best suited to the potential of the company.
- Development of strategies and positioning in the target markets to strengthen
the chance of success.

9
1.4 METHODOLOGY
Market segmentation can be either pre-determined or market-defined (Struhl,
1992:10). Pre-determined or a priori segmentation involves the collection of
available information of a market, selecting groups from a population and
finding-if they are segments. Market-defined or post hoc segmentation is more
objective and first consult the market and then analyse answers and survey
questions to predict marketplace responses.
The universe investigated here consists only of 33 user entities (the mines),
represented by 6 purchasing organizations (mining houses). Although hundreds
of people influence the decision making process, the physical realities of the
user environment, such as deep or shallow mines, low grade or high grade,
must logically be assumed the dominant factors that are driving human decision
making. A pre-determined process will therefore be followed. As much
information regarding operational variables, organizational demographics,
situational factors and purchasing approaches will be collected. The variables
will be prioritised and relationships will be sought for between the top variables
to be captured in a simple behavioural segmentation model. Prioritization will r.
be achieved by adjustment of McDonald and Dunbars's interrogative
segmentation technique. They developed a market segmention approach where
the current flow of product is plotted followed by interrogatory questions to
explain current product flow such as; Who buys? What is bought? Where?,
When? and How it is bought? (McDonald and Dunbar, 1995:1).
To ensure a reasonable coverage of possible variables that do influence buyer
decision making, Bonoma and Shapiro's nested approach will be followed for
identification of variables and then subjected to the McDonald and Dunbar
technique (Shapiro and Sviokla. 1992:72).
It is expected that two or three base variables will be identified, or variables so
dominant in influence that they can form the basis of the segmentation. Other

10
variable will be used as descriptor variables which provides depth of
understanding of a certain segment.
An attempt to varify the accuracy of the pre-determined segmentation exercise
will be made by interviewing consulting mining engineers and testing their
views on what is required from suppliers.
Perceptual mapping will be used to illustrate two-dimensionally the basis of
positioning, that can be technology, price, quality, distribution or service.
Adjustment in Company strategies will be recomended.
1.5 DEMARCATION OF THE STUDY
The study will focus on segmentation of the narrow reef gold mining
environment. Although the segmentation model has a wider application for all
suppliers to the gold mining industry, the study will focus on the supply of
explosives and initiating systems. Although hundreds of products are offered to
the gold mines, only the broad product groups will be considered, such as fuse
and ignitor cord, shocktube products etc.
The investigation will also be limited to South African gold mines, while a small
number of key consulting engineers and mine managers will be interviewed to
help verify the model.
1.6 CHAPTER OUTLINE
This study will consist of five chapters. Chapter 1 do constitute the scope and
methods of the study and contain an introduction, an explanation of marketing
approaches over time, a problem statement, objectives and a demarcation of the
study. Chapter 2 explore literature in search of techniques to assist in
segmenting targetting and positioning of business to business markets. The
theory is reviewed briefly and conceptually applied in order to test applicability.

11
The chapter concludes with a proposed methodology. Chapter 3 gives the
application of theory, namely the development of a segmentation model and
validation of the accuracy of the model, in other words, how well does the
segmentation model represent real life buyer behaviour. Validation is obtained
by a set of interviews, which also will serve as the foundation of decision
making to position AECI Explosives Limited in such a way that their objectives
can be met. In Chapter 4, sector targeting and positioning are considered. The
chapter also explore the strategic implications of the proposed positioning.
Finally, Chapter 5 summarise the major findings and recommendations as to
possible changes in strategic position of AECI Explosives Limited.
12
CHAPTER 2
MARKET SEGMENTATION, TARGETING AND POSITIONING
AS RELATED TO THE SOUTH AFRICAN GOLD MINING INDUSTRY.
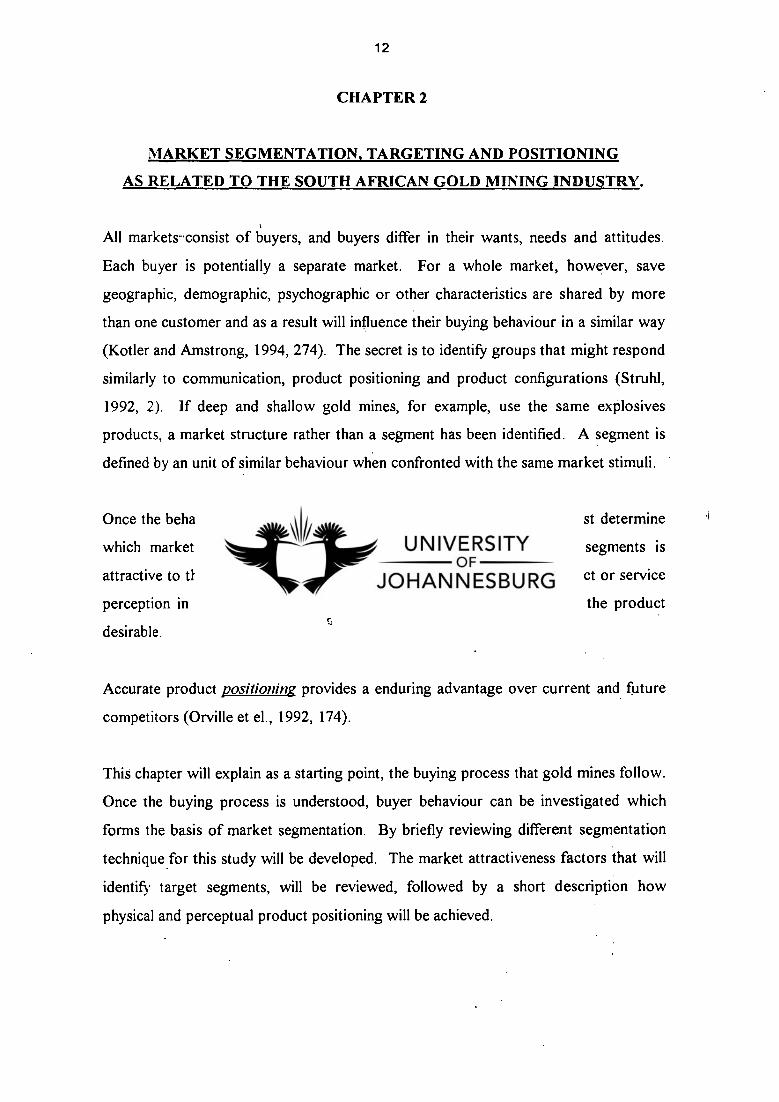
All markets•consist of buyers, and buyers differ in their wants, needs and attitudes.
Each buyer is potentially a separate market. For a whole market, however, save
geographic, demographic, psychographic or other characteristics are shared by more
than one customer and as a result will influence their buying behaviour in a similar way
(Kotler and Amstrong, 1994, 274). The secret is to identify groups that might respond
similarly to communication, product positioning and product configurations (Struhl,
1992, 2). If deep and shallow gold mines, for example, use the same explosives
products, a market structure rather than a segment has been identified. A segment is
defined by an unit of similar behaviour when confronted with the same market stimuli.
Once the behavioural or "segments" has been identified, the company must determine
which market segments they will focus their efforts and why these segments is
attractive to them. Once the targeting decision has been made, the product or service
perception in the customer mind must be designed so that he will find the product f.
desirable.
Accurate product positioning provides a enduring advantage over current and future
competitors (Orville et el., 1992, 174).
This chapter will explain as a starting point, the buying process that gold mines follow.
Once the buying process is understood, buyer behaviour can be investigated which
forms the basis of market segmentation. By briefly reviewing different segmentation
technique for this study will be developed. The market attractiveness factors that will
identify target segments, will be reviewed, followed by a short description how
physical and perceptual product positioning will be achieved.

13
2.1 HOW GOLD MINES PURCHASE EXPLOSIVES
The South African Gold Mining Industry developed from large mining finance
houses, formed by pioneers such as Cecil Rhodes, Barney Benarto, Alfred Beit,
Herman Eckstein and Joseph Robinson. Each financing house, or Mining
House, generally fully owns prospecting companies as subsidiaries. If a gold
prospect has potential, a mining company is created, initially fully owned by the
Mining House. As confidence grows, further capital is raised by rights issues.
The mining house retains a dominant share of the mine, securing a management
contract. These contracts are traditionally expensive, but maintains head office
expertise in the following fields: geology, mining, finance, training,
administration and human resource development. It also provides funding for
further expansion within the industry.
These management contracts were recently under pressure with the inflow of
foreign capital. Randgold reduced head office personnel to 60 people, while
Gengold also restructured and sold off their management contracts. All six
mining houses, however, make use of central bargaining for their mining
companies. r.
An existing trend is to decentralise contract administration and results in only
20 % of contracts administrated by head office for central bargaining [80 % of
the value]; the rest are negotiated by the individual mining companies
themselves. Explosives fall in the former category, but lower levels of
management are being enabled to increase their influence over the purchasing
decisions.
Figure 2.1 explains diagramatically the recurring buying process.

DECIDERS Mine Management is Informed - Evaluates agains criteria
BUYING ROLES Buying Process ricsigragadier
Individual Suppliers Applies for an
Price Increase
INFLUENCER Volume Price (Preceeding) X (New)
Central Purchasing Unit (Mining House)
Calculate effect of increase to Mines. Evaluate against Criteria Alternative supplier ratio's or product mixes are considered
INFLUENCER
DECIDER o o 5 Ot)
The Mine
BUYERS
Consults on-mines purchasers + stores
INFLUENCERS Consult middle management
Influenced and USERS presurised by
users
FIGURE 2.1 The Gold Milne Sappily
14
Supply on
Orders Received from on-mine
purchasing unit
Somme e Anon o AEL Internal Hies, 1996

15
The process can be broken down into the following steps: .
Step 1: All mines associated to a mining house combine their needs and task the
central purchasing unit to negotiate with the supplier on their behalf. The supplier uses
the previous year's volumes as a basis, multiply it by both the old and new unit prices
and calculate the increases. Unit prices are calculated from applying a discount to the
National List Price of the product. The proposal (almost a tender) is forwarded to the
central purchasing unit of the particular mining house. The supplier influences the
buying decision in various ways. First, the account managers, blasting engineers and
technical representatives ensure during the proceeding year that the explosives are used
correctly so that maximum value is obtained from the supply contract. This is achieved
through technical service, training and regular consulting. Secondly a promotions
policy that includes sports days, advertisements, tokens etc. maintains maximum
awareness amongst customers.
Step 2: The Central Purchasing Department takes the tender prices and after analysis
advises the individual mines how they will be affected and what could be done to
optimise their situation. For example, product mix or suppliers mix can be changed.
The supplier credibility and reliability of supply are examples of aspects the mine s,
management is advised on by central purchasing before a decision is made. The final
supplier mix is decided by the central purchasing department and acts therefore as both
an influencing and a deciding body. Their purchasing units mission is to obtain the
required goals and services at the required quality, specification and best price and so
contributes to the groups cost competitiveness (Anon, 1996,1)
Step 3: Mine Management considers the supply proposal and consults the on-mine
purchasing unit (the buyers), middle management and the users. Direct contact with
the supplier sales force provides them with further information. The actual users of the
product recently started playing a much more direct role through workshop forums in
influencing the buying decision. Safety implications and product stewardship plays as a
result, a much more important role in buyer decision making.

16
Step 4: After evaluating the value a supplier can add to the mines operation,
essentially balancing price benefits or needs satisfaction, the mine management makes a
decision. The buying decision is communicated to the central purchasing department.
Mine management, which can be the general manager, mine- or production manager
or a committee, is therefore the most powerful deciding centre.
Step 5: If the decision is not to buy, the central purchasing unit re-negotiate the terms
with the supplier. On rare occasions, if agreement cannot be reached, no supply
contract is agreed on. Mines can then still buy directly from the supplier, but usually at
National List Price. Alternatively, arbitration can be an option.
Step 6: If agreement is reached, a supply contract is compiled and signed by
representatives of both parties. The process repeats itself a year later, when the
supplier again gives notice for the price adjustment for the following yera.
2.2 THE NATURE OF EXPLOSIVES PURCHASING
To understand the nature of explosive purchase decision making, individual and
group behaviour needs to be understood .
The process is essentially a decision-making process through communication
between individuals and groups. The supplier tender is compiled by a work
group and communicated by a negotiation team (one or more individuals). The
evaluation and decision making is done on a consultative basis between a
management group and a central purchasing group. Individual charisma and
personality plays an important part in the decision making process. Groups
are made up of individuals and can be dominated by individuals. Groups,
formal or informal, acts as a powerful equaliser and a mechanism where
balanced views are generated in order to make decisions and satisfy needs.
(Gibson et al, 1994:311)

17
Buying behaviour is shaped by individual and group behaviour. Behavioural
patterns form the basis of segmentation. The logical starting point to
understand buyer behaviour is to study the psychological and motivational
factors of individuals and groups and how decision making for buying of
explosives is affected by these variables.
2.2.1 Illunders
raclignEllnndividuai Behaviour t ,
Various variables influence individual behaviour. Figure 2.2 is an useful
framework constructed by Gibson et el. grouping variables that
influence behaviour in two groups, environmental and individual.
MIGURIE 2.2 laglifiviidund- eheviiounall 1Frramewout
The FAIN 11'011111CM rile Indi% idu al BehaN ior. Outcomes
q \ H!!!!.. , .wd ,,L,11 , 1'r. ■ 111.111- , ,,, 1\ in: Performance - In' , dt.-.11.In Hui) II\ 1),,,i,.,21,,11n,1 I Junking plocc, , - Lang-term - ( )! : Ain ;111-culi ,tml..tur.. ....n.olirilit N ( I t11 muntcation - ShOrt-terM
l'(' I k. ■ '...• tnd , 11H. L2t, cption - I ,ilknIF Personal developmen - t ,...,,,icl.111 ,, , \ ilitli,k, - L. 1 q,n in,..2. Relations with othci-s - Rcv,..mid , ,in„ -.iiktion, - R._-,..lit Lt..---
1 2.i(11111.,2 ..,1p,IC ON
\..,-..:
c )b'r LA k anon!,
\ lo \ ,...mcnt Satisfaction
- I .,1/4.4 , 11t1MIL. ,
--.“,r1 \\()14,.
ROL L .
`-..•.
- I- in c; 1 k I - \ p,._ pc.r..k:
- 1_,Asure anti hoMlles
Source a Gibson et el e 1994, 99

18
How can these variables influence the behaviour of individuals on a
mine or a mining house purchasing department when buying explosives?
A few variables from Figure 2.2 are elaborated upon to illustrate the
point. Most definitions is taken from Gibson et el. The examples are
imaginary.
Abilities and Skills - Ability is a learned trait that permits a person to
do something mental or, physical. The explosives user might , have a
problem connecting up fuse and ignitor cord, since the products were
not designed considering the human ability to perceive spatial patterns
and manipulate the cord in a confined space. The product becomes
unpopular which is communicated to middle and finally senior
management.
Senior management's memory span, the ability to recall perfectly past
experience, might reject the claim. His ability to make comparisons
might allow him to consider other products and anticipate the
effectiveness and cost consequences of a change. r.
Race Age or Sex - The supplier attitude to human diversity is crucial.
If the negotiator of the Central Purchasing Department is a woman, and
the supplier negotiator is overly chauvinistic, she might influence mine
management not to buy. Both white and black races are users of
explosives products, and product names should be selected carefully not
to offend (e.g. if names are overly colonial, black races might feel
offended or perceive the company as "Afrikaans" or "English").
Perception - The process by which an individual gives meaning to the
environment. It involves arranging and interpreting various stimuli into
a psychological experience. Explosives suppliers must concentrate on
good and clear communication, so that stereotyping can be avoided and

19
a good perception of the need and desires of the customer can be built.
The user of explosives might perceive an explosive to be weak, but the
poor performance might be a consequence of too large a interhole
spacing.
Attitudes - Positive or negative feelings or a state of mental readiness
learned through experience to direct behaviour towards people, objects
and situations. A mine manager might feel inferior if an explosive
supplier continuously tell him the explosives are performing sub-optimal
in his mine due to inadequate discipline over drill crews. He might
decide to select a supplier who does not get involved in operational
matters, but only the supply of the commodity.
Values - The guidelines and beliefs an individual uses when
confronted with a situation in which a choice must be made. For
example, the Anglo American mine manager might believe that new
technology can only work if the workforce is convinced it is
appropriate. The human involvement value directed his behaviour.
Personality - The set of characteristics and tendencies that determine
commonalties and differences in people's behaviour. The manner in
which a person acts reflects his personality. It is influenced by
hereditary, cultural and social factors. The mining environment is
usually structured and disciplined, eliminating participative type
managerial personalities and change them to more autocratic thinkers.
It is possible that a mine manager with charisma can alone decide
singularly which explosive supplier is to be chosen and inform the mine
personnel that that is how it will be. Recent changes to the Labour Law
encourages joint decision making, and this behaviour is on the decline.
20
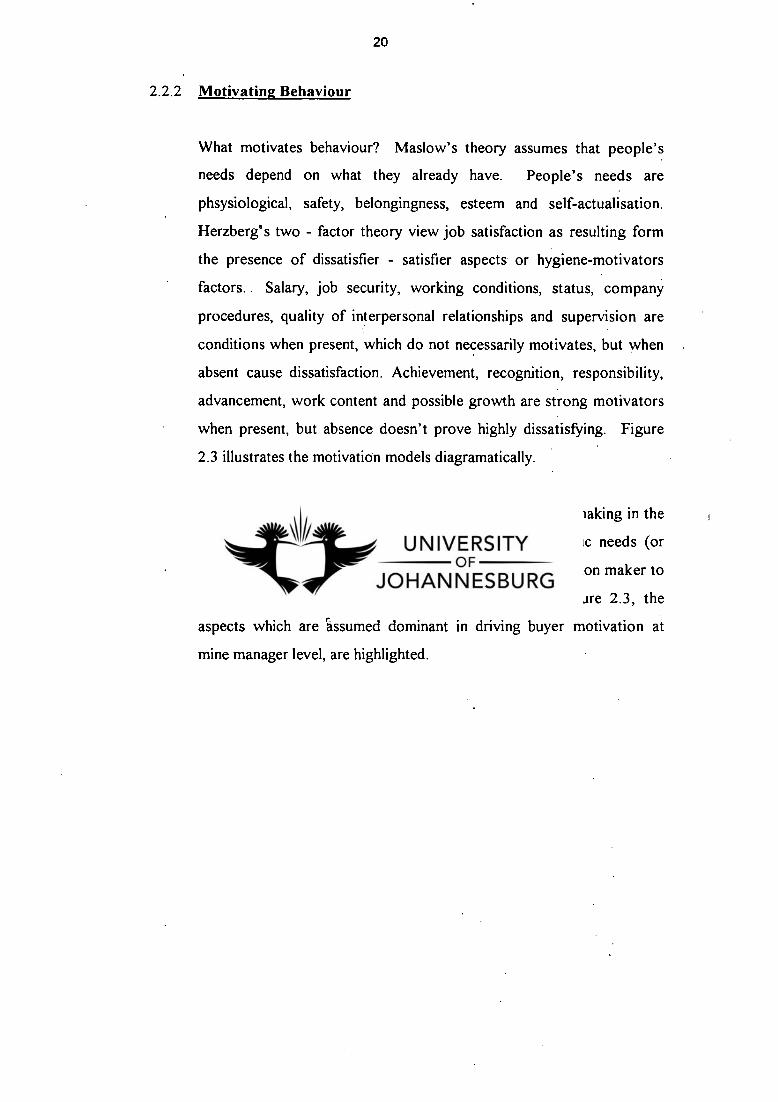
2.2.2 Motivating Behaviour
What motivates behaviour? Maslow's theory assumes that people's
needs depend on what they already have. People's needs are
phsysiological, safety, belongingness, esteem and self-actualisation.
Herzberg's two - factor theory view job satisfaction as resulting form
the presence of dissatisfier - satisfier aspects or hygiene-motivators
factors.. Salary, job security, working conditions, status, company
procedures, quality of interpersonal relationships and supervision are
conditions when present, which do not necessarily motivates, but when
absent cause dissatisfaction. Achievement, recognition, responsibility,
advancement, work content and possible growth are strong motivators
when present, but absence doesn't prove highly dissatisfying. Figure
2.3 illustrates the motivation models diagramatically.
What motivators or hygiene factors play a role in decision making in the
gold mining industry? Both higher order needs and basic needs (or
motivator hygienic needs) influence motivation of the decision maker to
buy or not to buy from an explosives supplier. In Figure 2.3, the
aspects which are assumed dominant in driving buyer motivation at
mine manager level, are highlighted.

Alk MOTIVATORS
HYGIENE CONDITIONS
QUALITY OF INTERPERSONAL RELATION SHIPS
MASLOW
SELF ACTUALIZATION
ESTEEM
EfIERTZSIERG
ACHIEVEMENT
ADVANCEMENT
GROWTH
BELONGINGNESS RESPONSIBILITY
JOB SECURITY
PHYSIOLOGICAL
WORKING CONDITIONS
SAFETY AND
SECURITY
21
FIGURE 2.3 A graphic comparison ofr the Maslow and Herzberg
motivational theories.
HIGHER ORDER NEEDS
V
BASIC NEEDS
Source a Co piled from Gibson et al , 11994: 1141
The buying process as shown in Figure 2.1, elevate§ mine managers as
the most prominent "decision makers". Currently, a third of the 33
gold mines are marginal with limited life spans. The career progression
prospects of mine managers becomes limited. Self actualisation by way
of career advancement can only happen if exceptional mine operational
or profit achievements are illustrated by these individuals. Managers
22
will be interested if the explosives company can contribute without
doubt to the productivity and efficiency of the mining process by
exposing him to improved or new technology, or new services that will
enhance his operation.
Recent political changes have reduced mine management's esteem in
the workplace. The up-liftment of less privileged people to participate
in decision making, changed an autocratic environment to a more
democratic environment. . Suppliers who listen carefully to mine
management's needs and address them, enhance his esteem.
Professional behaviour when dealing with mine management is
therefore critically important, and building a personal relationship to
enhance a sense of belonging. At the same time, the workforce needs
careful attention.
Job security, and in general safety and security, is absent in many mines.
That makes mine managers cost conscious, and again the survival of the
mining complex they manage is important drivers in motivating
behaviour. Suppliers who focus on partnering with mines to help f.
extend the life of mine or increase profitability by improving operational
excellence will address these needs and influence managers positively to
buy from them.
2.2.3 The Buyer Decision-Making Process
Decisions, as defined by Gibson et al., is a means to achieve some result
or to solve a problem. A decision is therefore an organisations'
response to a problem. Complex buyer decision-making models exist,
such as the Webster and Wind model, the Sheth model or the Choffray
and Lilien model, (Bingham and Raffield, 1990 : 120). These models
do not adequately describe the mine buying decision-making process
and are not expanded upon here. The fundamental philosophy

23
underlying these models is that organisational buying is a decision
making process carried out by individuals who interact with other
people within a formal organisational structure.
Bateman and Zeithaml describes six simple steps in decision making
which is shown in Figure 2.4. A necessary condition for a decision is a
problem (Gibson et al., 1994: 610). The decision maker is a problem
solver which selects from alternatives generated by advisors or himself.
What problems exist when deciding who to buy explosives from? The
answer is complex, but the extent of satisfying needs balanced against
price is the essence of the problem. Should alternative products be
used to obtain the same broken rock, or should other suppliers be use?
If other products or suppliers is considered, will the same effect
(sufficiently fragmented rock) be achieved?
r.

24
FIGURE 2.4 The stages of decision maildng
Source o Bateman and Zeithaml, 1990 a 90
In evaluating alternatives, the decision maker has some probabilistic
estimate or idea of the outcome of each alternative. That uncertainty is

25
called risk. A supplier which provides best satisfaction to needs,
reduces risk. Risk is a subjective concept. Decision makers vary
greatly in their propensity for taking risk. A decision maker with a low
aversion to risk defines a problem, generate alternatives and selects
solutions differently from a decision maker with a high aversion to risk.
Some decisions are made on gut feel with lower levels of logic
supporting the decision.
Decision making in groups such as task forces, committees and work
teams has complex group dinamics, but since individuals and groups in
an organisation is subjected to the same operational and cultural
influences, it is likely that groups decision making will follow the same
pattern of individual decision making. The pros and cons of group
generated decisions is summarised in Table 2.1.
TA 1:; LE 2.11 Pros End Cons oil' usfang groups to mike decisions
lPOTENTIIA,L ADVANTAGES EDOTENTIAL DISADVANTAGES
1. Large pool of information. 1. One person dominates.
2. More perspectives and approaches. Satisfycing.
Intellectual stimulation. 3. Groupthink.
4. People understand the decision. 4. Goal displacement
(winning the argument).
People are committed to the decision.
Source e Bateman Zeithanull, 1993 e 97
2.3 MARKET SEGMENTATION
Now that individual and group decision-making behaviour is better understood,
a methodology is needed to identify classes of simular behaviour amongst

26
buying decision makers in the mining industry. Segmentation, according to
Struhl, should follow from some sense that groups within the marketplace
might respond differently to alternative products and product related
communication. How can segments be identified, analysed and evaluated for
p6tential attractiveness?
2.3.1 Market Segmentation Approaches Reviewed
All segmentation approaches focus on either one of the following
characteristics; industry, customer organisation, customer decision
making and product benefits. Macro segmentation devides the market
into sub-groups based on the characteristics of the customer
organisation or industry (such as usage rates, product mix etc.). Micro
segmentation focuses on characteristics of the buyer decision making
process (where is the buying power, attitudes towards products or
vendors etc.). Some of segmentation methodologies are reviewed
namely: the nested approach, a product benefit approach and a product
flow approach.
The Nested Approach
The nested approach stresses the degree. of difficulty to identify and
obtain information in order to evaluate different criteria (Bingham and
Raffield, 1990: 201). Possible criteria on which segmentation can be
based, is arranged in layers or nests with the outer nest representing
criterial information easiest to obtain and assess. Increasingly more
complex criteria forms inner nests. Five nests, or segmentation criteria
groups are arranged as a nested hierarchy. Moving from the outer to
the inner, the groups of criteria are: demographics, operating variables,
customer purchasing approaches, situational factors and personal traits
of the buyers (Shapiro and Sviolela, 1993: 74). Figure 2.5 sets out the
major potential bases for segmentation.

Organizational demographics
Industry
Company size
Location
Operati t g variables
0 Technology
® User-nonuser status
® Customer capabilities
(financial)
Purchasing approaches
o Organization of DMU
o Purchasing policies
© Purchasing criteria
Situational factors
0 Urgency
o Application
Size of order
Personal characteristics
® Motivation
® Buyer-seller dyad
o Risk perceptions
27
FIGURE 2,5. Major potential bases for segmentation according to
the nested approach
General,
observable
(Macro)
(Intermediate)
Specific,
subtle
(Micro)
Somme o Bingham and Raffled, 1990: 202

Validating the
Strategy
Follow-up
Develop a Positioning
Strategy
Decide "How" it will
Compete
Develop the Marketing Mix
Product Design, Technical
Support, Service, Channels
Distribution, Promo, Pricing
28
ilDroduct merit Approach
Basic old-line industries such as mining, metals, forestry products and
chemicals are forced into survival strategies in the Western World due
to overcapacity and reduced order frequency resulting from fierce
global competition. These industries are in search of growing niche
markets, specialising in "value added" speciality products that requires
totally unfamiliar skills to meet user needs (Eckles, 1990: 126). Figure
2.6 sets out the product benefit approach schematically, as developed
by Dayle and Saunder and reported by Eckles.
FIGURE 2.6 Daylle End Saunders industriall market segmentation
=dell Tocusing on product benefits
Defining Objectives Determine Market Evaluate Attractiveness Select Target
Segments of Alternative Segments Market(s)
3-5 Yr.
Planning Horizon Segment by Produc Size, Growth Rates Focused Strategy
Market Benefits-not Competitor's Goals Toward Specific
Financial Customer Seller's Capabilities Goals
Source Eckles, 1990: 126

29
Re-Examination of Product Flow
McDonald and Dunbar developed an a priori segmentation approach
whereby a 'benefits list' is arrived at by plotting the product flow from
the original to the final user. Final product usage is evaluated by asking
questions.
Who buys? - to determine the profits of different buying groups
What is bought, where, when and how? - to determine frequencies,
methods of purchase and location of use.
Why is it bought? - Understand what each market segment lives to
achieve.
All micro segments that displays similarities are brought together and
final segments are then checked for sustainability, reachability and
compatibility with the company.
r.
2.3.2 Difficulties in Segmenting the Narrow Reef Explosives Market
The Narrow Reef Gold Mines historically used nitro-glycerine based
explosives and the fuse and ignitor cord initiating system in all rock
breaking situations. Today many alternatives are available, like
pneumatically pumpable prilled ammonium nitrate products, emulsion
and watergel cartridged explosives, shocktube and electronic initiating
systems. A benefit of one technology over the other, however is easily
obscured by the multitude of variables that . need to harmonize to deliver
the best result. For example, if the drilling pattern is perfectly drilled
but the rock formation changed somewhat but not observed by the
crew, the result might be disappointing. If a better blast is achieve, but
temporarily scraping cannot take place due to full ore passes, the
30
benefit of a good blast is negated. The variation in performance levels
of all required services and activities to advance a face, makes
measurement of benefits difficult in an underground situation. Due to
the labour intensive nature of the process, performance is highly
dependant on how well the labour force is. motivated and performing in
the dangerous, dark, confined and hot humid conditions in which they
operate.
For this reason, many mines uses the same product mix providing them
simplicity. What is expected from a segmentation exercise is not only
identifying current behavioural similarities or differences, but also future
behavioural patterns. Most mines currently use fuse and ignitor cord
initiation systems. Who will change to shocktube, when will they
change and why? These answers are difficult to obtain in a environment
where benefits are be obscured in high background noise of operational
performance variability.
Another problem is the size of the . population within which
segmentation is tried to be achieved. There are only 33 buying entities, f.
and all information recording is structured around these entities. For
example, financial reporting to shareholders is done on a company
basis, that is on mine level. For particular sub-unit of a mine, like a
shaft complex, enough information to enable meaningful segmentation
might be impossible to obtain. Some distortion is associated when
using the mines as the individual population entities. Freegold or Vaal
Reefs, for example, is a union of more than one mines, while other
entities might be small in comparison.

31
2.4 A SEGMENTATION APPROACH FOR THIS STUDY
As explained above, product flow and product benefit segmentation approaches
will not adequately uncover what a particular mine wants to achieve. The
nested approach involves all macro and micro environmental aspects in a
logical fashion, but how these factors are prioritised to expand the dominant
decision leading variables remains a problem. Since the outer nests are more
visible due to easier accessable information, these nests might receive more
attention and distort the answer. Instead of starting at the outer nest and
working inward, the approach will here be to view the nests from the most
inner nest, namely the person making the decision. He sees the solution
through these nests, but the nests influence the decision makers view of the
solution and can therefore be compared with filters allowing less or more
illumination of the solution. Same base variables will lead the decision maker
stongly, which can be compared with a non-shaded filter allowing clear vision
of the solution. Other variables are less influencial, and are dark shaded filters,
only suggesting the solution to the decison maker.
The base variables dictate behaviour, while the others serves as discriptive
variables which help in identifying and differentiating the segments. Figure 2.7
illustrates the concept diagramatically.

32
FIGURE 2,1 The vganiablle Mitering approach to market segmentation
How do the `Decider' behave? How do he
o choose to solve sq" the Problem?
How can the intensity of these filters be determined? The best way is asking
the decison maker what he sees? Anticipate how a reasonable individual will
answer questions regarding his environment, his situation and how
demographics and purchasing styles influences him.
The McDonald and P unbar approach can be adjusted easily to accomodate this
approach expanded upon here. Four steps should be followed. First, a
business definition is obtained to set the scene. Secondly, the customer and
how he behaves in this environment is investigated. Thirdly, the base variables
are identified and the segmentation takes place. A segmentation model is then
compiled. The final and fourth step is to verify the validity of the model by
testing a saMple in each segment and check whether the behaviour corresponds
to what was anticipated.

33
Step 1 : Defining the Business Environment
The segmentation process will start by defining the gold industry and
giving a'business definition.
Define the market and map the product flow. The following questions
are asked;
Who are the customers?
Where are the customers situated?
What product is going where?
An understanding of what problems exist in the industry and what needs
are satisfied by explosive suppliers are investigated. Questions asked
are;
What are the market needs?
How can the market be quantified?
A description of other suppliers and their objectives;
Who are the other suppliers?
What are their strengths and weaknesses?
What strategies are they following?
r.
Step 2 : Seeking an Understanding of Buyer Behaviour in this
Environment
Now that the market needs are better understood, the likely behaviour of the
`decision maker' can be anticipated. The questions the buyer is asking in order
to reduce risk (the filters) are considered next.
How is productivity or efficiency influenced by the decision?
How affordable is the solution offered by the supplier?
What policies and direction is my mining group following?
What is my Central Purchasing Department telling me and what is the
suppliers, users and other influencers telling me?
34
The first three questions will appeal to the safety and security needs of the
decision maker, in other words what will best secure survival for his mine or
optimise the mine as an investment vehicle? The latter two questions appeal to
the deciders selfesteem, in other words how the mining house sees him and do
they approve of his actions so that he can progress or advance to self
actualization.
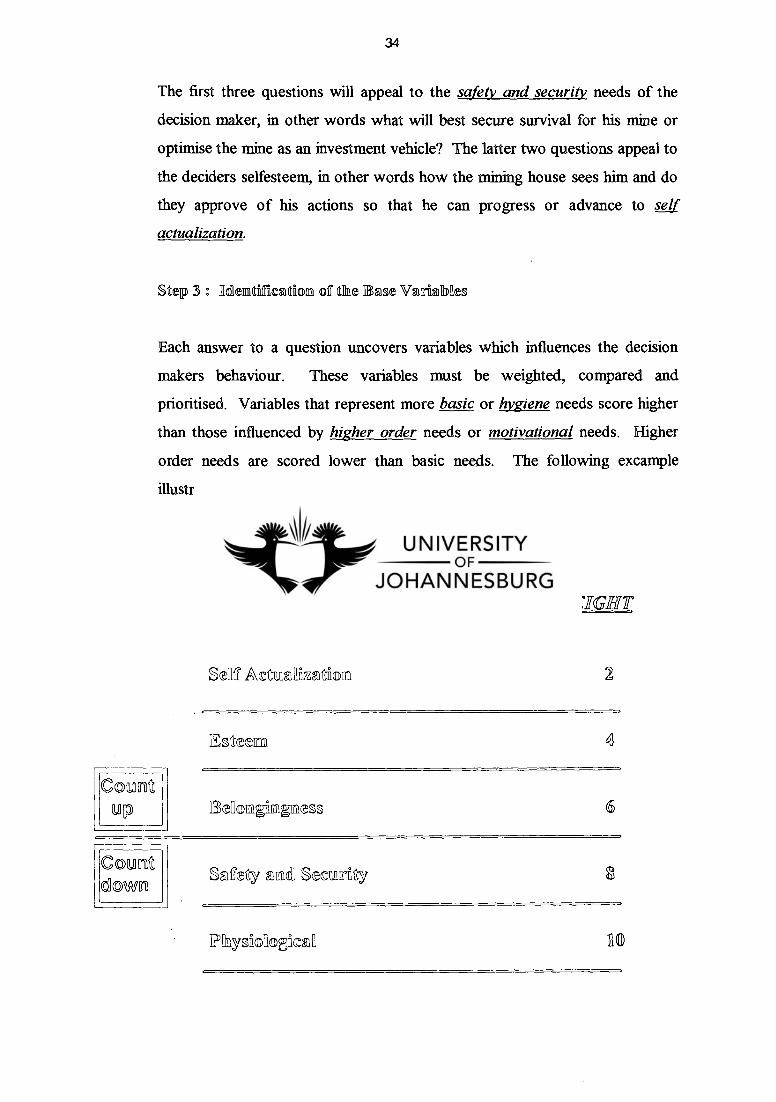
Step 3 o Ilelemitilfrication of the sine VarinNes
Each answer to a question uncovers variables which influences the decision
makers behaviour. These variables must be weighted, compared and
prioritised. Variables that represent more basic or hygiene needs score higher
than those influenced by higher order needs or motivational needs. Higher
order needs are scored lower than basic needs. The following excample
illustrates:
TA ILE 2.2 Motivational! Rowe Cant
MASLOW NEEDS WEIGHT
SellT Actazaztfioun 2
app 6
0
HI
Count down
Szfecy Secu11147
IPhyslolloecza

35
Question
How is productivity or efficiency influenced by the decision'?
A
How productive is the mine?
- Mine productivity very low.
How seriously is efficiency influencing the ultimate success of the mine?
- Mine can close as a result.
If it is improved, what does it mean to the decider, more profits (Esteem),
surviving the mine (safety and security) or both?
- Mine will survive, manager will have a job and will be considered for a
head-office job.
Condandon
Decision making to improve efficiency appeals most to Safety and Security
needs followed by Esteem. From Table 2.2 :
Score = (Surviving the Mine) + (Possible promotion) and have a job
= (Safety/Security + Physiological) + (Esteem + Self Actualization)
= (8+10) + (4+2)
= 18+6
= 24
The two top scoring needs will be used to segment the market and will act as
base variables.
36
Step 4 : Varify the Result
The objective of the segmentation process is to divide the market into groups
with simular needs or demands which results in similar behaviour. To varify
the segments, descripter variables can be used to test the correctiveness of the
behavioural expectation of a segment.
It is also necessary to select one or two samples from each segment and present
the model to these customers. If model prediction and customer expectation
correspond the market segments can be assumed accurately defined.
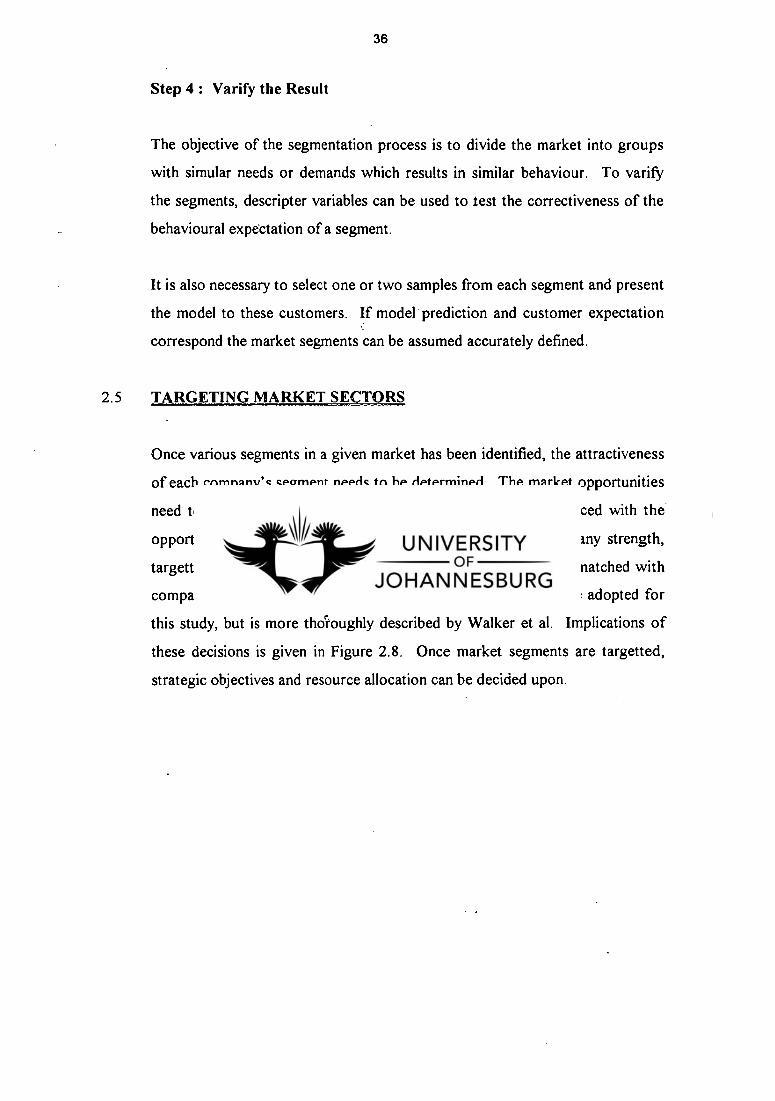
2.5 TARGETING MARKET SECTORS
Once various segments in a given market has been identified, the attractiveness
of each company's segment needs to be determined. The market opportunities
need to be identified, and the business strengths should be balanced with the
opportunities. Sectors where the opportunities match the company strength,
targetting comes naturally. Market attractiveness factors can be matched with
company strengths in matrix format, a methodology which will be adopted for
this study, but is more thdioughly described by Walker et al. Implications of
these decisions is given in Figure 2.8. Once market segments are targetted,
strategic objectives and resource allocation can be decided upon.

37
IFIfGURE 2.e kokplIfievatiofin oTsalltermiztive posfitto s wfithfha the Magket
Attrzetfiverness/Competitfive Ftsfitioral MeatIriLq
COMPETITIVE POSITION
Steil
Medium
Weak
llifyh
Medium
zz
E
Lc
.. • DESIRABLE . POTENTIAL TARGET `Pmtect p&dtion - • ;
- .. ;
- Inve3t in grow n row' rat ' maximum di3tible rcie . • .
,,. Cancentiabe on inMattjinin,n-trength .
.. D ESIRABLE • POTENTIAL TARGET . lleaveXt. to build , .
- Challenge for I .-eadel7ihip •
-' Build selectively mi'atrengths . - ReMfoice vulnerable areas' . . . ... . .
, . , / . • Build selectively
- Specialize around limited strengths - Seek ways to overcome weaknesses - Withdraw if indications of
sustainable growth are lacking
3
, . DESIRABLE POTENTIAL TARGET Baffd idectivelY ,
- - • , ; . • ._ ..-ais. riPhasizoPtorliamlitYbi: ulcr;•-1-sif'
prochictivity . - • ' - Build up ebilify to counter. ,
crmped:lion
..1-
•
-.
Manage for earnings
- Protect existing strengths - Invest to improve position
only in areas where risk is low
5 United expansion on- harvest
- Look for ways to expand without high risk; otherwise, minimize investment and focus operations
6
Protect and refocus
- Defend strengths - Seek ways to increase current
earnings without speeding market's decline
7 Manage for earnings
- Protect position - Minimize investment
$ Divest
- Sell when possible to maximize cash value
- Meantime, cut fixed costs and avoid further investment
9
Sotuarree a WsallIken- et all, 1992: 197
The following attractiveness factors should be considered for the marketing of
explosives:
Differentiation possibilities
Market gaps
Distribution
Investment Intensity
Technology
Industry Capacity
Competive Structure
Price
Business strength factors are:
Relative market share

38
Product/service differentiation
- Distribution
Capacity utilization
- Technological posision
- Salesforce
- Financial capaCity
Advertising
2.6 PRODUCT POSITIONING
A product position is the place the product occupies in the consumers mind
relative to competing products (Kotler and Armstrong, 1994: 258). It is the
perception of the customer as to how well the product offering is performing
relative to competitor offerings in satisfying needs in the targetted market
segments. The emphasis falls on identifying and stressing the competitive
advantage, which is based on quality, service or actual value added.
The products, services, sales personnel, and the company's image are all
aspects which can be used to differentiate, in the mind of the customer. One
way to assess a product offering in relation to competitor offerings is to
compare physical products characteristics (Walker et al, 1992: 205). For
example, the physical behaviour of emulsion explosives are different from
watergel explosives, but is used in the same environment. The high Velocity of
Detonation of Emulsions can be used to position the latter as a product that
does not break up the hanging wall. Physical positioning can be useful, but
does not provide a complete picture of reality, since ultimately, positioning
takes place in customers minds.
Walker et al. goes so far to state that "Many customers often do not want to be
bothered by information about a product's physical characteristics; they are
not buying these physical properties but rather the benefits they provide". The
consumer buys on what a product does rather than what it is. To return to the
39
comparison of emulsions and watergels, emulsions might be perceived as
"weak" explosives, nevermind the physical characteristics that might prove the
contrary. If the cusomer wants a 'strong' explosives, he will not buy
emulsions. Perceptual product positioning will be viewed in this study as the
more important to determine. The following methodology as suggested by
Waler et al, will be followed:
First, competitor offerings will be identified. The set of determinant attributes
which defines the borders of the possible perceptual space of a product is then
determined. Analize where products are 'positioned' currently and the
intensity of the position in the customers minds. Determine the customers most
preferred combination of determinant attributes in relation to market segment
needs, and select a positioning or repositioning strategy.
Product positioning and market strategy is interwoven. Positioning of
explosives products in the gold mining industry must be done with a realiation
that a mature market exists. Total volume is slowly declining, replacement
ptirchasers rather than first time buyers account for most of the volume. The
major objective is therefore to hold existing customers and to sustain a
competitive advantage thattwill sustain customer loyalty. Positioning in such a
market can only resolve around achieving and sustaining a lower delivered cost,
a perceived product quality or technological benefit or a customer service
superiority.
Evidence suggests that the ability to sustain a high level of differentiation or
maintaining a low cost position delivers success in a "mature" market. Walker
et al reports on a study by William K.Hall in 1980 comparing relative success,
measured in terms of 'Return On Investment' of seven heavy duty truck
suppliers in the U.S.A. Figure 2.9 shows Paccar and Ford to be the ROI
leaders, as indicated by the dark shaded area. Paccar offerred the most
differentiated product in terms of good performance, while Ford offered the
lowest relative delivered cost.

Rel
ativ
e pe
rfor
man
ce
High
Average
Low
% = ROI
White Motor 4.7
Ftprti 26
40
Figure 2,9 Strategic competitive positions for the U.S. Heavy-Duty
Truck Market as measured by Return on Investment
High
Average Relative delivered cost
Low
Source e WaIllker et ➢ 1992,305
Since SMX and BME has already stong perceptive positions as low price'
suppliers, AEL must focus on 'Value Added' approaches. However,
explosives systems has many sub-units, each viewed as a product. These
separate products must each be investigated and positioned to deliver the
overall supplier position in the customers mind.
The next chapter will be devoted to the development and validation of a
segmentation model, the first step in understanding market needs. A
subsequent chapter will be devoted to product postioning and market strategy.
Thompson and Strickland puts forward the following sentence as a
Competitive Strategic Principle! "Successful companies invest aggressively in

41
creating sustainable competitive advantage, for it is the single most dependable
contributer to above average profitability".

42
CHAPTER 3
DEVELOPMENT OF A SEGMENTATION MODEL
Although the South African Gold Industry can simplistically be defined as 33 or so
mines managed by six- mining groups, a closer look opens a profusion of a possible
segmentation criteria that easily baffles efforts to identify true behavioral groups that
illustrates similar buying behaviour.
The Variable Filtering segmentation technique developed and discribed in the previous
chapter, allows a structured analysis of the environment the industry operates in and
exposes at the same time a multiple possible variables that might define buying
behavioural segments. The segmentation method however, are focussed and highly
directed. By answering the five questions a buyer/decision maker would ask, a pattern
imediately emerges which allow market groups to fall into logical positions.
The four steps in the process are:
Step 1 : Define the business environment
Step 2 : Seek understanding of buyer behaviour in this environment
Step 3 : Identify and select the base variables
Step 4 : Varify the result
3.1 STEP 1 : DEFINE THE BUSINESS ENVIRONMENT
Important here is to establish an understanding of who the customers are,
where they situated, what product is currently going where, what the real
market needs are, how the market can be quantified and who the explosives
suppliers are? Each aspect is investigated separately.

43
3.1.1 Who is the Customer?
The 33 gold mines are listed in Table 1.1. in chapter 1. Also indicated,
is the mining house the mine is associated with. Since the mining house
manage the mine, the mine managers behaviours are influenced by the
cultures and the views that the mining houses represent. Four aspects
are of particular importance. First, how important are the workforce in
trying to achieve objectives. Does the mining house develop and
mature people, or do they view unions and workers as a negative
necesaty. Secondly, what role does technology play in future planning.
If cost is everything, new technology will be a low priority. If new
technology is viewed as a gateway to improved performance, it is likely
to be tried, and more importantly, the people will have a seriousness in
making new technology work. Thirdly, how are suppliers viewed by
these mining houses? Are they viewed fundamental to the success of
their operations and as a result willing to partner, or do they focus on
their own buyer power and view suppliers as parasites that puts strain
on margins that are already under stress. Finally, how do they evaluate
product and services required in the mining process. Is price the
dominant criteria, di does energy exist to establish value obtained, value
added, as the discriminator. Based on interviews conducted with six
consulting engineers, one from each mining house and summarised in
Appendix I, the following short descriptions of the six mining houses
were arrived at:
An2lo American (Gold Division)
Anglo envisage developing the deep lying reefs south of Western Deep
Levels and the deeper areas of Vaal Reefs in the future. They would
like to be the ultra-deep mining experts. With above average
operational excellence they would like to save the Free State marginal
mines. Anglo central purchasing offered their buying power to improve

44
AEL's input cost. Amgold is eager to partner fully for mutual benefit.
Attitudes are as follows:
Workforce: Positive but strict. Want labour to feel jointly
responsible . Willing to train and develop.
Technology: Look actively at better technology and are
willing to try new things.
Suppliers: Willing to partner.
Value/Cost: Willing to be persuaded of value. Are not only
cost driven.
Randgold
They cancelled the management contracts and reduced head office to 60
people. They are very cost conscious and would like to be seen as the
experts in turning around marginal mines with a no-nonsense approach. r.
Attitudes are as follows:
Workforce: Try to improve productivity while maintaining good
labour relations. Organise stope crews in small
business units. Thinking of higher skilled stope workers.
Technology: Willing to try, but cost pressures limit experimentation.
Economy of scale is most important.
Suppliers: They pressure for a 0 % annual increase, or should be
convinced that there will be a productivity improvement
equal to the price increase. •

45
Value/Cost: Cost focused, but potential is there for partnering for
maximising value.
JCI
JCI are developing the South Deep mine from Western Areas. Their
mines represent all mining conditions namely, deep and shallow, thin
and thick reefs or good and bad hanging wall conditions. Purchasing is
interested in one supplier instead of administering a multitude of
suppliers, but they are cost focussed. Attitudes are as follows:
Workforce: Good labour relations. Leading in concept of
productivity linked to salary increases.
Technology: Traditionally leading in technology, (failed trackless
mining experiment changed that somewhat)
Suppliers: Interested in a single supplier..
Value/Cost: Cosf focused, but willing to experiment with
new technology.
Genkold
Gengold's approach to productivity is to retain only newer high grade
mines, and sell off marginal mines. They would like to have world class
operations with a much reduced, but more productive, workforce.
Attitudes are as follows:
Workforce: Willing to invest and develop the workforce.
Would like to increase blasting cycles and reduce
number of people.

46
Technology: Traditionally not interested in new technology, but signs
are there that they would like to move to shocktube or
EDD's.
Suppliers: Do not like a close partnership. Very critical and hard to
satisfy. They feel they can do things better
and suppliers have little to offer.
Value/Cost: Very cost driven in central bargaining, but can be
persuaded. They advocate efficiency based pricing .
Goldfields
With their high grade mines, they can afford new technology, but at the
same time are very cost conscious. Mines are generally less efficient
due to high profit margins resulting from higher than industry average
grades. Attitudes are as follows:
Workforce: Lots of labour problems, as illustrated recently
at Driefontein. Have a strained relationship with the
workforce.
Technology: Move easily to a new technology, but do not
gain the full benefit due to discipline or lack of
excellence.
Suppliers: Have an aggressive approach. Not easily willing
to partner. Maintain an adverse relationship with
suppliers.
Value/Cost: Make majority of decisions on cost.
47
A mgovaal
Anglovaal is developing new and deeper mines from Loraine. The new
project is called Target, but Sun and Oribi will be developed at a later
stage. They want to be world class, highly productive and are very
interested in new technology. However, their purchasing decisions are
now made at production manager level, while the administration
manager on the mine also influences decisions. Attitudes are as follows:
Workforce: Labour relations are strained due to an older style
or approach to management.
Technology: Very interested in newer technology for the new
deep mine projects. Very interested in rapid cycling on
all their mines.
Suppliers: Tend to play suppliers off against each other.
Do not partner easily.
Value/Cost: Cost-dnven, but look at value too.
3.1.2 Where are the Mines Located?
The gold mines are situated in a golden arc stretching in the south from
Welkom in the Free State through the West Rand, Johannesburg, East
Rand and ending in the Evander area. Figure 3.1 is a map of the mines,
showing 51 mines, many of which are small or not operating any more.
lase ruse
"44ga 001t1111111010
AL IL PILSOORP
lar FIELD
•
4.
ORANGE FREE STATE
VINE -
I •.4411••• i 0■ •••1• 1 INN
awns
I •••,, • 4 ".'.n 1 frosiors
TRANSVAAL
NEST WITS LINE
Nola inr. 1 16•11.7"444,4'
GOLDFILD, .4/
1141bb' 00;:rmItIIIIN
O
Aftil Apr "alg. MINNA 110
USN RN
11NN
.1011011•
liftp
..04 VAII
IF ST RAND
GOLDI1t ID
ML1636611
0 CoN600040 I.... 13 04..1.414.• 46 41.6•NIN leo" 4 644440••• A•41 1 I a•so t• 1440,.40 • I 11•014.1.1 GNI NPIrqs , Is Pro Noes WINN osol Um, s(..osos ....a
OuNo• INN t3 ONPooN 40 Red L•Nel IT Ift..1 66.6n 4146,4.4116...1 .:,... ,..•1 II SosP011osaspoorl 16 50.41e4..• 01 So• ONO • &M• N GNI 11010•Ns It INN INN CON tr PosIoN•00•ON• SO 00•1004. • IN* SION Can 6141.16.0.<• •ry
IS ..41...101topieSso1 to 0.11•NN.N. SI Tod* Reels 1 0`9.4%
N Poo0aNN• I 0101•••Nots t9 POO KINN
SON.' SO I swat 4001sO1d O..,
IS 1.0.m MN, SI .1.• INN INN
4 ONS0NNI 0101111.44.1 a • II I.• to I••ss S••* tow 0 PO •0 44 40 too
1.4.0. 1. Mosel
AI 111441 If Do ••••••• Ow
11 NI 0•14.1.1
30 0.0..- Co. SION 0.0.000
il •N00. Nett...01 EP IINN•NrINNI
33 91 NON* 3. URN/
35 ........, 31 06.... 31 0 re 36 P./ Jorl
1!... 4104.1 ••losnoltes
NI
IWO .1111
14.4 N611
N.
N
a No
till. o' E•ST RAND
GOLDFIELD ...•
••• (VANDER
• GOLDFIELD •
1 4
111
D
GOLDFIELD
1.•M NO
MALL MINE -
RECOVERY PLANT - a.
44 1•••••••• 3 440 161.1••••••0
I S....4.44 I 4% 4 Deppeencw• "
lo 010 0p.m
34 RON 10 N40••• II •ANA,
2 Persou } 0 • 00.
1 ••■••••• 41 WM.*
SLIM "."
LUN..cemo•lb.N.1
Ph•olePt
P ONos
s•
OO
48
FIGURE 3.1 Geographic location of the gold mines of South Africa.
Source : Landman, 1997: 7 40:
3.1.3 What Product is going Where?
Explosives products can be divided into two groups, explosives which
is a chemical which expands almost immediately massively in volume
when subjected to an intense shockwave, and initiating systems which
provides the shockwave to ignite the explosives at the right time and in
the right sequence.
Gold mines drills millions of holes with relative small diameters
annually. Explosives are bought in cartridge form or alternatively in a
prilled condition, like solid fertilizer. The prills are made of ammonium
nitrate. The cartridged explosives can either be an emulsion or a
watergel, both water based explosives. A relative new technology is

49
pumpable explosives, a liquefied emulsion pumped through a hose pipe
into the blast hole.
Initiating systems consist of three technologies, namely Fuse and Ignitor
Cord, Shocktube and Electric Detonation. Fuse and ignitor cord is the
oldest but most widely used system in the South African gold mines
while the shocktube system is the standard for underground mines in
the rest of the developed world Electronic delay detonator systems are
new on the market.
Fuse and ignitor cord represents 95 % of the current market, shocktube
4,7 % and electronic delay detonator and other systems only 0,3 %.
Shocktube appeared in narrow reef mining ten years ago, but a general
stoping product was introduced only a year ago. As a result the current
shocktube users can be viewed as early adopters, while the electronic
detonator users are innovators. The challenge is to predict where the
growth will be what the extent of the growth will result from the new
products.
It is also observed that 65 % of the market is prilled ammonium nitrate
while the rest use cartridge explosives. It appears that large mines uses
prilled ammonium nitrate, while small volume mines use cartridge only.
Again, few product variations are used, and high homogeneousness do
not reveal clear segments. The challenge is to predict which mines will
experiment with newer technologies such as repumpable explosives and
what volumes can be expected to be sold in future.
3.1.4 What Market Needs Exist?
The market buys broken rock reliably provided at the right time,
quantity and fragmentation by explosives at a price commensurate to
the perception of the value received.
50
Breaking Rock
Explosive technology is still the most cost effective technology for gold
mines to break rock. The Chamber of Mines through COMRO,
developed the impact breaker technology . (hammering) to do stoping.
Five machines were in operation at the Kloof Gold Mining Company,
but have recently been discontinued.
Mining houses who are interested in extending their workings into
deeper areas (Anglo Gold, JCI and Anglovaal) show active interest in
non-explosive alternatives for the future. Anglo Gold is pursuing
diamond wire cutting, which delivers a smooth undisturbed hanging
wall resulting in increased safety. The Sunburst technology which uses
a chemical propellant to break out a cone of rock when released. into a
short hole, has also attracted attention.
Over the five year planning horizon, these technologies are unlikely to
have a huge impact on explosive usage. It should however be seen as a
threat, since little money is generally spent by mining companies
themselves to impr6ve drilling and blasting.
Explosive rock breaking, in the form of short hole drilling,
perpendicular to the face is envisaged to be the dominant rock breaking
method for the next five years. Parallel long hole drilling will start to
impact in deeper areas in 1999 to 2001.
Perception of Costs
Gold mines get deeper or grades are reduced in older mines, which
effect the revenue and the operating cost of there mines. Gold mine
profits are calculated as follows:

51
Profits = [Revenue] - [Cost]
[Gold Produced oz x $/oz x R/$] -
[Capital + Working Cost]
The mine has no control over
Price $/oz and
Exchange Rate R/$
The gold produced is affected by uncontrollable geological factors and
impacts on the stability of the revenue.
The Rand/Dollar exchange rate adjusts every 12 to 18 months (like the
jump from the R3,60/$ to the R4,40/$ range early in 1996). Revenue is
thus only adjusted every 12 to 18 months.
However, cost continuously increase with inflation. Inflationary
expectations are as follows:
1997 10%
1998 8 %
1999 6 %
2000 4 %
2001 4 %
Currently, revenue is ± R48,750/kg. Cost varies between
R30 000 and R45 000/ton. For some mines, inflation will put the mine
in a loss making situation, before the 18 month Rand currency stability
period is over. See Figure 2 for an explanation.

52
The only controllable variable, is the cost and effectiveness of cost
application (productivity). Gold Mines look at suppliers to reduce cost.
AEL will be ,under pressure to contain increases at or below the
inflation rate. Therefore, it is critical that AEL focusses attention on
the effectiveness of cost and not on unit cost. Explosives must be
measured' in terms of the value addition in the total value chain. This is
the real challenge for AEL, to change blasting and purchasing culture
from a cost based one to a value driven one.
Superior value can only be created if operational excellence exists in
AEL.
The following will be required as a given:
Reliability (supply and products)
- Quality
- Responsiveness
Safety
- Innovativeness r.
and partnering with the mine to:
- Improve productivity
- Measurement
- Skills Transfer
in order to optimise operations.

70.0
60.0
50.0 EC
40.0 CD
30.0
20.0
10.0 -
0.0 Dec '96
'Revenue
Dec '97 Dec '98 Dec '99 Dec '00 Dec'01
53
FIGURE 3.2 Effect of cost end Tevenne Tor Ilow gond high cost
producers.
Somme o Lgandunain, 1996 o 8
3.1.5 How Can the Gelid lEmpflosives Mantet he Quantified?
The market is best quantified by the number of holes drilled per annum,
since for every hole drilled, an initiating unit is required with about 500
to 800 grams of explosives.
To quantify the market, the correct annual number of holes needs to be
estimated per mine plus the growth or decline of the number of holes in
the next five years. The average gold ?Jude to which mines mine, can
influence the number of holes drilled. If the grade is expected to be
lower, but total production stays constant, more holes will be drilled
and vice versa. Productivity improvements might influence the number
of holes drilled, for example, if longer holes are drilled. The tons
broken by a hole, might go up resulting in less holes drilled. The
number of detonators sold in 1996 is used as an indication of the
number of holes drilled. Number of holes in the future is determined by

54
predicting the growth or decline of hoisted tons and devided it by the
tons a single hole break on that specific mine. The hoisted tons are
taken as 5 % less than milled tons to adjust for surface addition to mills,
and then grown 30 % for underground development. Table 3.1.provides
more details. These aspects are expanded upon:
Gold Grade's influence on number of holes drilled
Gold grade (g/ton) is expected to remain constant. The
establishment of younger mines will increase grade by 1 to 2
g/ton, reducing hoisted tons and consequently reducing holes
drilled by 1%. Large marginal mines will mine lower grades in
greater volumes to achieve economy of scale (making the huge
infrastructures work).
Productivity Improvements
Theoretically, each stope panel can be blasted 24 times a month.
The industry average is 10 to 12 . It is expected that the f.
number of siope panels will be reduced by 30 %, but each stope
panel will be blasted 20 times a month. More stope turnarounds
will occur as mines look for high grade areas, or mine old
marginal or isolated blocks. On average, no impact on the
number of holes is expected.
Tons to hole ratio
Tons hoisted is calculated by subtracting 5 % of tons milled to
adjust for heap treatment and 30% material from development is
allowed for. Therefore,
Number of holes = Milled Tons x 0,95 x 1.3
Blasthole per Ton

55
TABLE 3.1
• Blast holes per ton of Rock Hoisted
The number of holes drilled is determined by the number of
detonators sold over the last year (in the form of fuse,
shocktube or electric systems) divided by 1996 hoisted tonnage
figures. Hoisted tons (95 % of milled tons) provides the
required ratio. The ratio is assumed constant over the planning
horison.
Annual Number of holes drilled which serves as quantification for the explosives market.
MINE TONS PER
TONS HOISTED (millions)
HOLES (millions)
COMMENTS
HOLE 1996 1998 2001 1996 1998 2001 Freegold 1.82 27.05 21.80 18.66 14.88 11.99 10.26 Gold falls 102 to 70/-31%/R206m cap Vaal Reefs 1.70 15.81 15.80 16.00 9.29 9.29 9.41 Drop old #s/start new #s/R380m cap Drie Cons 1.64 6.42 6.70 6.50 3.91 4.08 3.96 Projects to enter deeper/R227m cap Kloof 2.21 6.05 6.00 6.10 2.74 2.72 2.76 30 Moz reserve/R133m cap WDL 1.96 7.90 8.00 8.00 4.03 4.08 4.08 Shaft deepening/extention/R168m cap Hartebeesfontein 1.51 5.93 6.00 5.90 3.93 3.98 3.91 Mine life at current prod = 10 year Randfontein 2.26 8.77 8.70 8.90 3.88 3.85 3.94 13 Moz res/R61m cap/25 year life Harmony 1.89 8.15 7.60 6.80 4.31 4.02 3.60 9 years ,life/7.4 Moz/RG look for call Western Areas 1.34 3.21 3.60 6.00 2.40 2.69 4.49 South Deep/57 Moz/R285m cap Elandsrand 1.13 2.72 2.90 3.00 2.40 2.56 2.65 Platform for new expan/22 year life Beatrix 0.86 2.84 2.80 2.60 3.31 3.27 3.03 Young/Shallow/R97 cap/20 year Buffelsfontein 5.93 4.69 4.60 4.20 0.79 0.78 0.71 Low grade/17 year/good managem Winkelhaak 1.14 1.73 1.65 ;1.55 1.51 1.45 1.36 Up grade/10 year/Low cap R17m Kinross 1.05 1.98 1.80 (:,1.70 1.89 1.72 1.63 Up grade/16 year/R36m cap ERPM 1.99 4.08 3.00 2.40 2.04 1.50 1.20 Low grade/6 year/2 Moz Deelkraal 1.53 1.48 1.49 1.30 0.97 0.97 0.85 AAC takeover/19 year/R53m cap Loraine • 0.99 1.98 2.20 3.00 2.00 2.22 3.03 Low res/Target platform/Sun?/5 year St Helena 1.22 0.99 0.89 0.60 0.81 0.73 0.49 Low res/1.4 Moz/7 year/Good Manage Unisel 1.07 0.86 0.90 0.90 0.81 0.84 0.84 6.1g/t /22 year/3.2 Moz/Econ Scale HJ Joel 0.69 0.86 1.20 1.30 1.26 1.75 1.90 Turn around/R70m cap/Dinamic Man Blyvooruitzicht 3.05 2.72 2.80 2.90 0.89 0.92 0.95 1.8 g/t /2.8 Moz/Econ scale/Doornfon West Wits 1.72 0.37 0.30 0.20 0.22 0.17 0.12 5 year/2.3 g/t /2.6 Moz/New Manage Doornfontein 3.72 1.61 1.50 1.20 0.43 0.40 0.32 Low grade/synergy with Blyvoor ET Cons 0.68 0.37 0.40 0.40 0.55 0.59 0.59 High grade/11 year/16% prod growth Grootvlei 0.82 0.62 0.70 0.70 0.75 0.85 0.85 Shallow/ 5.4 g/t /25% prod growth Leslie 1.19 0.49 0.44 0.40 0.42 0.37 0.34 6 year/low cap/-10% decline Durban Deep 2.80 1.36 1.35 1.35 0.49 0.48 0.48 1.3 g/t /6.4 Moz/R32m cap/24 year Benoni 0.00 1.90 1.60 0.00 0.00 0.00 19 year/no cap/-32% prod growth Lindum 0.00 0.00 0.40 0.00 0.00 0.00 Low res/prod decline/7 year Cons Modder 1.88 0.49 0.40 0.20 0.26 0.21 0.11 Loss making/12 years Barberton 0.40 0.12 0.10 0.09 0.31 0.25 0.23 10.9 g/t /high cost Knights 4.69 0.60 0.10 0.00 0.00 0.00 Dump operation Oryx 0.28 0.25 1.00 1.00 0.87 3.52 3.52 New Mine/World class Stilfontein 0.86 0.40 0.00 0.00 0.00 0.00 Mine closed/Dump reclamation
Source : Landman, 1996: 6

56
3.1.6 Who Competes for the Market ?
Table 3.2 summarizes the market share history since 1994 and predicts
market share for 1997. The major competitors for AECI Explosives
Limited are Sasol Mining Explosives (SMX), Bulk Mining Explosives
(BME), Dantex and Altech.
TABLE 3.2 Relative Market Share of Explosives Companies in
South Africa
COMPANY BULK PEX IS
199 6
1997 1994 1995 1996 1997 1994 1995 1996 1997
AEL 100 100 75 71 69 68 95 93 91 91 SMX 0 0 24 26 26 26 4 5 7 7 BME 0 0 0 0 2 3 1 1 1 3 DANTEX 0 0 1 3 3 3 0 0 0 0 ALTECH 0 0 0 0 0 0 0 1 1 1
Source : Landman, 1996: 11
Sasol Mining Expri•sives (SMX) entered the market in 1986. They
increased market share to a current 28 - 30 % level with Watergel
cartridged explosives (Explogel). Their low density ANFO (Expanfo)
is of particular interest to the mines.
Ensign Bickford of South Africa operates in association with SMX.
They sell shocktube products (Easy Stoper) and initially held 100 % of
the market. With the AECI Handidet entering the market, the market
expanded, but their share was probably reduced to 35 % of the market.
Dantex Explosives are producing the Tovex range of watergels with
MMAN sensitisation (Du Port Technology). Although only a small
percentage of the market is serviced directly by Dantex (6.8% Gold),
they do toll manufacturing for AEL (constituting 10 % of AEL's
57
explosive sales). They are particularly successful in niche markets such
as smooth blasting (Tovex Barrel) and the underground coal market is
dominated by them. They sell small quantities of detonators, bought
from UEE in Spain, to the local mining industry.
Bulk Mining Explosives (BME) recently entered the cartridged market.
They produce at a new site near Fochville, in the middle of the West
Rand region. They will produce between 100 and 300 thousand cases a
year of emulsion based product with chemical gassing and will be priced
at the bottom end of the market.
SMX has a cheap ammonia supply, since ammonia is produced in
abundance as a by-product from the Sasol synfeul process. Internal
transfer pricing can be manipulated, putting SMX in a good position to
undercut market prices. However, they offer increasingly good service
but is under attack from BME as being differentiated on pirce.
BME buys ammonium nitrate form Sasol, but specialises in very
effective and cheap conversion. BME undercuts both AEL and SMX f.
with price. SMX and BME talked about a possible merger in 1995, but
agreement could not be reached. This triggered a fierce rivalry amongst
these two companies.
AEL, although having some product ranges which are lowest priced in
the market, it tries to differentiate on value adding activities and earn a
premium in the market. AEL is still viewed as a partner that originated
with the gold Mining Industry, thus knowing it well and leading in
understanding it's problems. If it does not adjust quickly in offering
value packages that fits customer needs well, it will loose this position.

58
3.1.7 What Physical and Cultural Environment Exist in
Gold Mines ?
The South African Gold Mines are the deepest mines in the world.
Most operations are between 1 800 and 3 300 m below surface, but
shallower and deeper mines exist.
The mines are extremely hot, and central and localised air cooling is
done extensively. The organisational structures are rigid with a large
semi-skilled workforce doing drilling, cleaning and installation of
services. Middle management oversees men and material transport, and
looks after safety. The thin reefs provide confined spaces to work in.
Difficult human conditions exists, like heat, communication in different
languages, cultural differences and skills differences which make for a
stressful environment.
3.2 STEP 2 : UNDERSTANDING BUYER BEHAVIOUR
Table 3.3 list the major gold mines with some performance and operational
variables to indicate relative to other mines how a specific mine performs. For
example, Free Gold mills 18,8 million tons annually while Leslie only mills 0,4
million tons annually. The scale difference will result in different buyer
behaviour on these mines, since for the former many needs are represented and
for the latter the localised nature of a small volume results in a single simplistic
set of needs.

X Cl eN
Adv
ance
Le
ss
kNe
Ore
C 0 CD C O CD 0 0 C C 0 0 0. C O 0 0 0
O O 0 0 C C C> 0 0 C C 0 0 0 C O 0 0 0
O
<-4 eN 0 0 00 CV C".,C to et 00 00 en eN el en eN rn eN
N 00 00 C 00 0 N N .4* ,C) --r et tr) Os C rkt .rt - C O 0. 00 .-J• 00
00 ••■1
N 00 eN N tr, Y 4-) r- N -r ■.0 Vl r r-- r- r-- -r eN CV en -7 .rr eN
rn
CO
•
O
O
•
8 G. G. U u U C UUUUU 0. U U UUUUU J U
too
T.
eel o
0 ca. c.) U UUUUU 0. U U U U 0. U U U 2 0. C.> U U 0.
0 00 kr •r.) 00 00 (N rkl tr) - •r) 0 C C. - N C> kb kr) hi C> = 00 '0> X X -r kr-, .r, ..-; C.> eN - hi -. -, - - -. h‘l (*-4 kN (--1 est - e:',1 - est .-. -• •-• en -*
la to S.
i. :4,d CI
C ) C ,- 6 0 C to 7-4 trl
cg est trt rg I--- OC r- N kr) eV -t en I-- en 0 -- kb X ‘.0 Cs X hi et kb Cs 00 0 en -- tri kJ:: (N -r ._.,
0.> - -t rn X X 6 - 4 ,--- tri a: - re vi 4 rsi a: S t-- t--i si si oC r- .--. a: re, .-. si oc 4 si C o 2 re) r-- 4 in x r- ‘a - N N el en en eN 1 - hi en . --.
....
r.:
•
"..:
en kr, -1' hl - - , --. - hl 1
tr) -r -I* r•-• -, X N
eN .a 4 N C'. WI en - VD - kb en 00 -1 hl '.0 WI 0, ..iii S. - 0 `0 eq in. -r. - o: S ...- . -, t--4 a: 4 - oO -- , -t•
■ 1 I ...-. -.. ..... 4.2 en r.... -; eN
C..- 4 6 rei %;..-: si 6 -■ -0 o Cd 7: r;-; in eN iN r-- en rn -, -4* en --. - - I - tr) I (11 CD c,..
tr) .15 .'
.....• . ..-. ,, I
CV ..0 1... •-• if; (--. sc r-- ..-: so 0 4 ,4-. 4 s co est a, rn a, --, cn hi -r C> en 0 r-- r-- N 0 tr, CV sC. c-1 ir)
4. C...) -. ',-;•• CV N- X T 4 0; 06 e-si .6 4 a: 06 re: re; S si r-- ot; si a: 6 a: S .ci 6 4 oc .;:-. re ,__,
CA
MI ,..., 00 t--- s.D. - - Os est r et -r .11 --. VD <N 0 C ON N h.) tr. N N rn N - -4- tr) rn 0 00 I-- - -1- CL. -• c") . --. -- IN en rst - - - tN eN - •-• eN eV •-• (N -. hi <-4 hi - en (--/ <-4 - - r..)
C (r) ...... .:E. 0 = .... ■ (..) ..., 0 'a 1... CO ■..0 Cs (-‘1 C C V> 00 kb 00 en, en hl en en in N. cn C. en X kb kb 00 Os 00 -I- N M- kb OC N -r rn "C:1 e si eV r ^ . %.0 -I tr; to oci .a-. .c; tr; .6 oc 6 a: r-i tr; 6 a rsi si tr; ■t:i. - cpc S c.; 4 6 -- .r: 00 Is
6.) a) Cs r-. re. •-e- en ,1• en ON - 00 c:, r-- re) -• 4 as ON r- '''r *0 r- eNI eV .et s.0 kr-) rn k0 OC OC - en
= .-. cn ad -. eV -r rn tN hi -. .-. eN en CV ,--. rkl eN •-• eN -, (N (--1 e*-4 .--t et ht CV ,_, ,_, _,
a) c..) t.. :-- e1,
t c
r. 124 o . id
CV C.4 eV C-- ■::: CV en C> V:) ‘..0 eN en --. en WI sC en s.0 - ,• 00 ∎0 00 sC et 0 Vil C., r- C Cs r- 0, :-.. -r kr) xi in tr, rn en '.0 eN k-,/ eN V., kr) ht kr *I' kb kb kr. -, - esi C' in '0 - C ri") ..4. C C 0 Cid .21 CJ C 0
;••
RI U
E a)
t:G L., La c-, oc r‘t as -r X .--. k.0 ■.0 CV en 00 ,t stp en eV sC 00 S C, CV en en en in et .--. 0 0 -7 -' DC el N.
- rsi u-, ..-4, ..:.- .1* it--- sb eN (--1 rsl rn •-• --. en - --. 0 C ..0 rkl O- 0 0 O- c 0 0 .0 r^. 0 0 . .
0 -0 ̂0 10 *0 V '0 -0 -0 0 - 0 - - 0 17) 75 7; o O 15 .z3 O -0 -0 -0 - "0 -0 -
< 0 -..= o.0 000.000na-eC0e10 =Wit:LOCI:001M 0 0 _
❑
_ ti) = -Es .to .00 .0. CO .g 0a lb -tO V 1:3 .-A. -0 caa "0 C.> C..) C) Cl) 01)
V) t...o E -0 CO CO _ CO CO CO c CO CO = =c-) CO.5(j ..c -c - CO
U., C > 0 o a a.) ci. (1.1 (I) M. LI, > f...)
(.) < < <0C4000.7-:t 6) ,2 ,--:_agg(t.,) ,260e5 5 5 0 0
'u tn .z. at c
c•
▪
c 0 ■-, -o •a.5 ,.. •1:1 15 a) c)
c
▪
e
-
6 ., 4t C CC vs -0 .... CO ‘-4 (4
. 2-- .' g 2 '.12.- C-) 0.) -0 8
•
0 c o 7: = o a
0 = 'a'' E I-- x . -- c„ ,.... ..= „, c 0 t .... 0 0 01) ,.... _I c,
.0 .. i cg ; ....G 6 ... c,_t. ._ ,;.; u 72 8 lg 4 . is 0 ..0 ,,, 2 F, , 4:9 z
0 cm ... o .... v, 0 V tg = la 01 z ..̀42 ....,=, .._., .11.1 8 c) 8 a. '..CO = c b.. c 0 a .c) 0 r 0 0 0 , ...._.- ..... = 0 0 , = 0 . 0 , .= c.„-:, E.' cc: i. U., > 0 ±- c = LL.1 co al 5 LI] A -a (7) ::: co A ill (!"7 -1 A co :3 0 al 0 'tip
E
TA
BL
E 3
.3
60
Although the operational variables differ greatly, the assessment methodology
the customers follows is the same. In other words, although the answers are
different, the questions are the same. The same filters are used, but different
pictures are percieved. The following criteria are affecting buyer behaviour:
FILTER 1 flow is productivity or efficiency influenced by
the decision ?
Contrast Freegold who does 8,5m 2/man/month and Elandsrand
who does 30m2/man/month. The decision-maker at Elandsrand
will want to know if doing business with the supplier in question
will maintain his high performance, or even improves it. Can
technologies be offered that will help sustain or improve the
performance?
Freegolds decision-maker on the other hand, would not be
interested in new technology, since he knows that with current
technology, his workforce can improve a lot, and due to
operational factors, the maximum benefit from the current
technology fs not obtained. He knows that a new technology
will most likely not improve performance, since the workforce
are not even maximising the benefits of the technology they are
currently using.
Mines with a low face advance, low square meter per man ratio
or a high labour input to output ratio would rather stick to
current technology, technology like fuse and ignitor cord.
Mines with greater operational excellence will buy new
technology to improve their performance.

61
FILTER 2 How affordable is the solution offered by the supplier ?
The decision-maker will also ask how affordable the product
are? If Driefontein Consolidated Mines are compared with
Deelkraal mine, the former makes R262,3 million a year
compared to the R14,1 million loss the latter achieves.
Huge risk exists for the decision maker at Deelkraal. If a new
technology is tried, but does not succeed, his bottom line will
look even worse. He would need to be convinced that the
higher cost will be recovered and more benefit obtained by
switching. This mine will for obvious reasons not be on early
adaptor. On the other hand, the Driefonteins will experience
little financial risk and if the extra cost for the new technology
doesn't outstrip the benefits, little impact will be felt.
At the same time, Deelkraal will be very sensitive to price levels
and price increases of the current technology, but the
Driefontein Mines will be less so. r.
FILTER 3 How suitable is the suggested product to my situation?
The decision-maker for Harmony Gold Mine where 8,7 million
tons is hoisted, and 4,3 million holes are drilled annually, .might
feel a switch from one supplier to the next is risky. Service
levels might deteriorate. He might also be concerned about the
ability of the new supplier to supply the product on time in full,
thus reliably produce and deliver the large volumes required.
He might also consider whether the product is imported or
made locally, and judge the risk of moving to a product that was
not conceived and developed in local mines.

62
The West Wits decision-maker, also a Randgold mine, only
hoist 0,37 million tons of rock annually which is achieved by
drilling only 216 000 holes. Providing this small volume from a
foreign country is not that difficult, therefore the ability to
supply these volumes is not that critical. He will therefore
switch much easier. One retired shiftboss can assist him in
training his people and he does not require the ability to train
thousands of people at once to realise a successful
tranformation.
FILTER 4 What policies and direction is the mininggroup following?
The decision-maker at Elandsrand, an Anglo American mine,
knows that deeper reserves exists to the south of his mine and
that Anglo's Gold Division has stated that they will access it..
To be to do so, they need to develop people, "mining
techniques and mining practices. It would make sense to
partner with a supplier who can offer service, training, new
technology and has a willingness to adjust product to suit needs
in order to prepare for this challenge.
On the other hand the decision-maker at Driefontein, a Gold
Fields mine, has only one challenge; increase efficiency of the
mine to make an even larger profit. Suppliers are viewed as
profit takers and are easily chopped and changed. The
psychology is: we can pay, if the supplier cannot deliver, try
the next one. Reasons why delivery cannot be realised is seen as
a problem for the supplier only, not as a potential problem over
the longer term for the mine itself.

63
FILTER 5
What is the Central Purchasing Department telling the
mine and what is suppliers, users and other influencers
Lain?
If the culture is highly autocratic, decision-making is very
centralised.- On the other hand, some general managers rely
totally on his advisors to tell him, what to do and in the process
gives no direction. Vision and leadership are strong tools to
direct not only the decision maker, but also the users of the
product.
3.3 STEP 3 : IDENTIFY THE BASE VARIABLES AND SEGMENT
THE MARKET
In this section, the base variables are identified and the segmentation is done.
3.3.1 Identification of the base Variables
Table 2.2 in the _previous chapter is used to judge the relative f.
importance of the filters in directing behaviour. Relative scores is
assigned according to the influence a filter might have on decision
making. The scores are summarised in Table 3.4. Motivation for these
scores is given below.
FILTER 1 How is productivity or efficiency influenced by
decision?
For marginal mines, efficiency improvements can save
the mine and save a general managers job.

64
TABLE 3.4 Relative importance of filters with regard to motivation of buying
behaviour
MOTIVATOR SCORE FILTER 1 FILTER 2 FILTER 3 FILTER 4 FILTER 5
Self Actualization 4 4 - 4 4 -
Esteem 5 5 5 5 5 5
Belongingness 6 - - - 6 6
Safety and Security 7 7 7 7 — - 8 .
Physiological 8 8 8 - - -
TOTAL SCORE 29 24 20 16 15 19
His safety, security and physiological needs are
addressed. If he improves productivity and efficiency he
drives his standing in the company, and esteem and self-
actualization are satisfied.
Score = (Self Actualization + Esteem) (Safety +
Physiological)
= (4 + 5) + (7 + 8) f.
= 24
FILTER 2 How affordable is the solution offered by the
supplier?
The emphasis on price in decision-making is a natural
reaction if a mine is under threat to close. Value
appreciation needs harder work to quantify. The
decision maker is driven by survival. Safety and
physiological needs are addressed. He might brag to
some extent about the price 'he achieved and which will
boost his esteem, but it is not viewed as a* strong
motivator.

65
Score = (Esteem) + (Safety + Physiological)
= (5) + (7 + 8)
=20
FILTER 3 How suitable is the suggested product to the
situation ?
The decision-maker fears that his judgement might be
questioned if the supplier performs sub-optimally. It is
unlikely that the operation will grind to a total halt, thus
safety and security needs motivates him less strongly.
Esteem will be hurt if he is seen to have made the wrong
decision which will negatively effect promotion
possibilities. Self Actualization is in danger.
Score = (Self Actualization + Esteem)' + (Safety)
= (4 + 5) + (7)
= 16
FILTER 4 What policies and direction are my mining group
following?
Clearly, the dicision-makers esteem and self-
actualization plays a role, since he would like to play by
the rules to be seen as the right man for future jobs in his
group.
Score --(Self Actualization + Esteem + Belongingness)
= (4 + 5 + 6)
=15

66
FILTER 5 What is the central purchasing department s
suppliers and users saving?
Esteem and belongingness needs motivate behaviour in
this instance. A clever deal might help to perform better,
thus give better returns -to shareholders. The better
performance of the mine will enhance the mine managers
status amongst shareholders. The mines life might be
extended, which addresses the survival instinct.
Score = (Esteem + Belongingness) + (Safety)
= (5 + 6) + (8)
= 19
From Table 3.4 it can be seen that the dominant filters are filters one
and two with repective scores of 24 and 20. These two base variables
are used to segment the market. Operational excellence and
productivity are the most dominant influencing variables in decision
making for buying explosives, while affordability is the second most
influencial.
3.3.2 Segmenting the Market
The two concepts, operational excellence and affordability, are the
two variables that should be contrasted. Any attempt to quantify these
variables are difficult, since measured and reported variables does not
fully describe the concept. However, of all the variables listed in Table
3.3, m2/man/month best represents operational excellence and
grams/ton best represents affordability.
Plotting these variables against each other creates a two dimentional
field which represents the market place. Figure 3.3 illustrates

42 30- 28-
•
24 -111 n
co x 18 - _ U E 16- TS -Po 14 - c 12 -
. 10 16 8 6 - Q. 4 - (0 2 -
0
C
7.7
8.4
4?inSV.
®8.19.7
0.0 1.0 2.0 3.0 4.0 5.0 6.0 7.0 8.0 9.0 10.0 11.0
Affordability Wit)
Mine hluoviber
MOrge Name
Grade
WM
Centares per man
32 Knights 0.3 34 Stilfontein 0.9 10 28 Benoni 0.9 22 West Wits 1.6 27 Durban Deep 1.7 15 21 Blyvooruitzicht 2.0 12 15 ERPM 2.2 15 12 Buffelsfontein 2.5 14 33 Oryx 2.6 7 Randfontein 3.3 15 29 Lindum 3.7 8 Harmony 3.9 17 30 Cons Modder 4.0 17 Loraine 4.3 17
1 Freegold 4.6 9 25 Grootvlei 4.9 13 2 Vaal Reefs 5.1 18 6 Hartebeesfontein 5.2 18 16 Decikreal 5.6 13 26 Leslie 5.6 14 13 Win kelhaak 5.6 16 14 Kinross 6.0 16 18 St Helena 6.1 17 20 HJ Joel 6.1 14
11 Beatrix 6.4 27 9 Western Arszcz 6.6 14 5 WDL 6.6 15 10 Elandsrand 7.7 30 4 Kleof 3.9 12
24 ET Cons 9.6 3 Orb Cons 9.7 12
31 3zitszrtan 10.9 19 Unisel 23 Doomfontein
67
FIGURE 3.3 The gold explosives min ket s (Relined by openfationall emeellience
and zifordab' Your seg emits off' the wfiattet Es suRper-emposed.

68
The productivity variable m 2/man/month is influenced by depth of mine
and geological conditions, but is overall a good indicator of how a mine
succeeds in doing things productively. Although there is not a straight
line relationship between grade and profit, nevertheless a strong
relationship exists and grams/ton are a good indicator of revenue. A
mine mining are at 3 grams/ton must mine four times the volume before
the revenue of a 12 grams/ton mine is achieved.
If 15 m2/man/month is used as a barrier between operationally average
and exceptional mines, and 5g/t as a barrier between mines with high
and low affordability, then four market segments, delineated as
segments A, B, C and D can be recognized.
Segment A is a market where operational excellence is average while
affordability is low. The market will be cost driven, since high risk
s exists :.in delivering maximum benefit a new technology can offer.
Since margins are narrow, higher cost of a new technology can reduce
or eradicate profits, representing an unacceptable financial risk. For
replacing suppliers of current technology, a cheaper product without
service can open margins on the short term.
Market Segment B represents mines that have comfortable margins but
low or average operating excellence. Operational risk is high but
financial risk is low if a new technology is considered. However, new
technology will not likely deliver sudden improvements in operational
excellence and extra cost might outstrip the benefits experienced. This
market will more easily move to new technology but might be as easily
disappointed in it. Replacing suppliers of current technology is
beneficial to the mine if a price benefit is obtained and will deliver short
term growth in margins. This market will not likely be supplier loyal.

69
Market Segment C has high financial risk due to the low grades but
above average operational effectiveness. They will be late adopters or
laggards regarding new technology, because the lead in obtaining full
benefit from current technology will be left for others to prove. This
market is likely to be loyal to suppliers of current technology, if that
supplier helps to sustain the above normal performance they achieve.
Market Segment D performs above average operationally, and enjoys
low financial risk. This market will be early adapters or a early majority
and any new technology should first be aimed at this market.
3.4 FINAL STEP - VARIFY THE RESULT
Some mines where behaviour is well understood are selected to test the model.
The mines falling under Segment A are experienced by AEL as mines with high
competitor activity using conventional technology. For example, West Wits
uses SMX explosives and BME (Famesa) fuses.
Two mines in this segment illustrate greater supplier loyalty and can viewed as
exceptions. That is Freegold and Randfontein Estates. Both derived great
price benefit from the centrally negotiated contracts Anglo American and JCI
have with AEL.
Kloof and Driefontein are in Segment B, both rich mines but supplied by all the
explosives suppliers. They are very price concious, but tries new technology,
such as shocktube, easily. The buyer behaviour experience with these mines
and the presence of all suppliers confirms the nature of Segment B.
Harmony Gold Mine, representing Market Segment C, shows high supplier
loyalty, uses conventional technology and require high levels of maintenance
service but no paid-for service such as continued blasting training schools etc.
They are early adoptors of shock-tube, but converted only 6,6 % of their

70
requirement to shocktube product suitable for high angled stopes. Only about
6 % of their stopes has a high dip, where it is concluded that the technical
benefit are overwhelming in favour of shocktube." The fact that they converted
five years ago and never changed back to fuse, confirms Segment C behaviour.
Elandsrand Gold Mine leads the industry regarding productivity, producing
30m2/man/month. They are supplier loyal but try new product from all
suppliers. They use new technology, like shocktube most successfully.
Elandsrand was a early adopter of shocktube and converted the mine almost
100 % to it. Beatrix, Vaal Reefs and Hartebeestfontein, all mines in this
segment, illustrates simular behaviour.
When the consulting engineers of JCI, Goldfields, Anglo American, Anglovaal
and Rand Gold, were interviewed (see Apendix I) they were exposed to the
market field as defined by operational excellence and affordability. All
spontaneously nominated one of their mines and positioned it correctly in one
of the four segments. It is taken as a confirmation of the validity of the
segmentation model.
f.
What is required now is targeting and positioning of product and services in
these four market segments so that the strategy pursued by AEL can be
successfully realised.

71
CHAPTER 4
TARGETING, POSITIONING AND STRATEGIC IMPLICATION
Market strategies and market programmes a company can only be determined and
-developed if it is clear in which market a company wants to concentrated effort. Two
aspects facilitates targetting of markets; market attractiveness and competitive
strengths of the company. Market attractiveness defines factors that makes it desirable
to enter a market and is more forward looking than business strengths. Competitive
strengths are business strengths, which if understood well, indicates the position a
product must achieve in the market to be successful.
Once the market segments to be entered are identified, a value package is designed
directed at each segment. The value package is different combinations of product
service and price offered to that market.
This chapter first analyses the market segments for attractiveness and business
strengths in order to target, then investigates which value packages need to be offered
for each segment. f.
4.1 BUSINESS STRENGTHS AND MARKET ATTRACTIVENESS IN
RELATION TO MARKET SEGMENTS.
Three factors are considered here as criteria to select market segments to
target, namely market characteristics, economical/technological conditions and
competitive position.
Table 4.1 shows the factors that makes a market attractive for an explosives
supplier, but also the business strengths accompanying that factor.

72
TABLE 4.1 Market Attractiveness and Business Strengths to be
considered in targetting a market segment.
ATTRACTIVENESS BUSINESS STRENGTHS -
(Where to go) ,
COMPETITIVE POSITION
(Where to start from)
Market Characteristics Position in Market
Size ? .
Life of Mine (growth) ?
Market Gaps ?
Can high volume be provided ?
Life of current market ?
How quick can be moved ?
Economical and Technological Capability
Investment intensity ?
Capacity for change in customer ?
Ability to invest ?
Ability to convert a market ?
Competitive Position Interaction ,
Number/Size of Competitors ?
Price sensitivity ?
Size/Stability of Market Share ?
Price'Competitiveness ?
Source : Walker et al, 1992: 182
For each market segment, the attractiveness for and strengths of AEL will be
judged and ranked. Attractiveness is either /ow, (L), reasonable (R) or high
(H), while business strengths are weak (W), average (A) or strong (S). Figure
2.8 in chapter 2 shows possible interpretations of combinations of the degree of
market attractiveness and business strengths. Obviously, if a market is highly
attractive and a company's business strength is strong regarding that aspect,
the segment should be a desirable target market. Figure 2.8 will be refered to
regularly in this chapter and is called the "Walker motive" after the authors.
4.1.1 Market Attractiveness versus the Market position
A large market will be attractive to AEL, since economy of scale is vital
for a high volume low margin business such as explosives to be
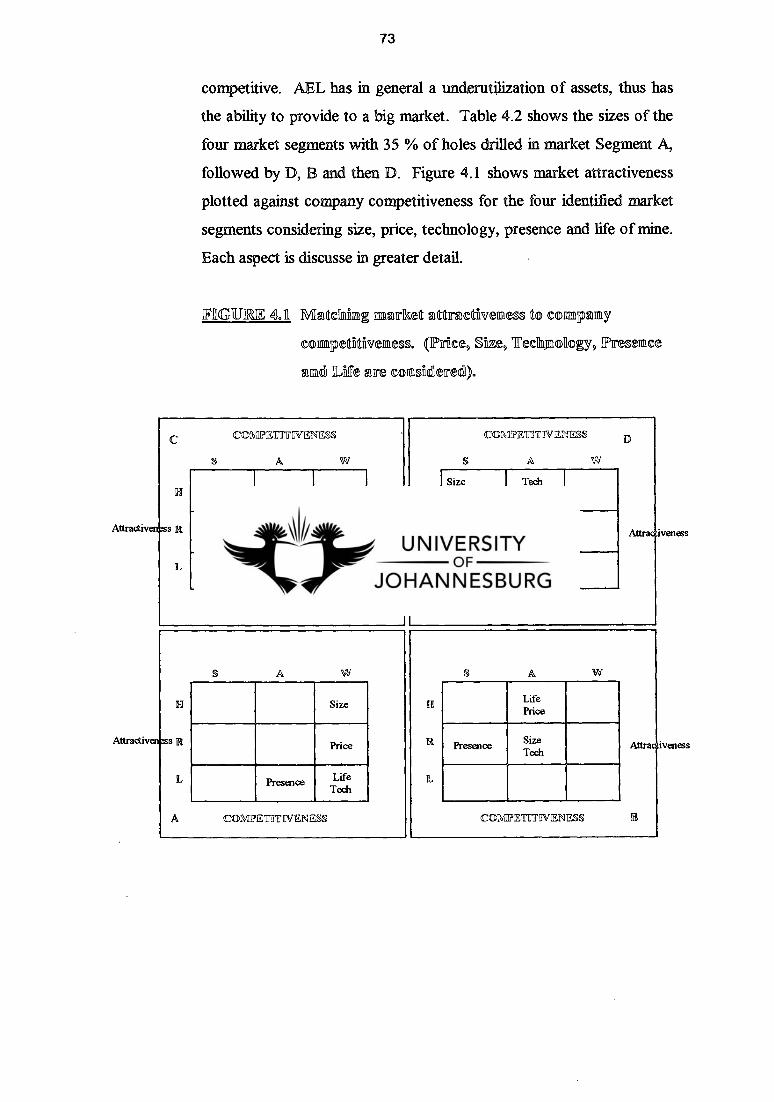
C CC:lagig=1V2NESS
S A W
COMITEIITTWENMS
S A W
El
..s R
L
Presence la
R
L
Size Presence
Tech Price
Attract Life Tech Price
Life Size
S A W S A W
H Life Price
H Size
R Presence Size Tech
Attrac Less R Price
L L Presence Life Tech
COMMTIrirNENE.% B A CO ?2: inns NENESS
Attractiv
AtAractiv
iveness
veness
73
competitive. AEL has in general a underutilization of assets, thus has
the ability to provide to a big market. Table 4.2 shows the sizes of the
four market segments with 35 % of holes drilled in market Segment A,
followed by D, B and then D. Figure 4.1 shows market attractiveness
plotted against company competitiveness for the four identified market
segments considering size, price, technology, presence and life of mine.
Each aspect is discusse in greater detail.
FIGURE 4.11 Mattellatumg meutet ettirEctfiveratess to conagamly
competitiveness. grace, Slize, 'Irechjnollogy, alesellnee
amid Lfille sm comb:Rend).

74
TABLE 4.2 The size of Segments A,B,C and D measured in
million holes drilled annually, with the life of mine
also indicated. The table has been compiled from
own records and from records of Huyshamer Stalls
SEGMENT A SEGMENT B SEGMENT C SEGMENT D
No of Holes
(mill)
corn No of Holes
(mill) .
com No of Holes
(mill)
corn No of Holes
(mill)
com
14,876 FG 24 4,095 DCON 28 4,310 HARM 13 9,522 VR 33
3,878 REGM 28 2,515 KL 25 2,066 LR 4 4,687 HBF 10
0,792 BUF 8 3,935 WDL 30 0,870 ORYX 20 2,400 ELR 24
2,044 ERPM 5 2,403 WAGM 68 3,312 BX 19
1,347 BLYV 17 1,082 DLK 19 0,810 ST HEL 6
0,216 WW 8 1,515 WIN 8
0,801 GV 8 1,890 KIN 16
0,416 LES 7 ' 1,261 JOEL 23 '.
0,485 DURD 25 0,601 ETC 19
0,263 CMOD 17
0,312 BAR 10
25,430 14 19,297 1 26 7,246 12 20,731 18
35,0 % 11 26,5 % 9 10,0 % 3 28,5 % 5
Source : Compiled from Woolley, 1996: land Landman, 1996: 81
The size of Segment A makes it highly attractive. However, two mines
in Segment A are big, namely Freegold Consolidated and Randfontein
Estates. These mines can be serviced well by AEL, but the rest of the
mines are marginal, scattered all over the Witwatersrand and producing
comparitively low volumes. AEL business strengths are weak in this
segment with Freegold and Randfontein as the exceptions. They are
currently 100 % AEL customers. Should they be targetted and their
operational efficiencies be lifted to elevate them into Segment C,

75
Segment A will reduce to only 9,2 % of the market while Segment C
will contribute 48,5 % of the market. According to Figure 2.8, the
combination of high attractiveness plus.. weak competitiveness means
selective building. One will specialize on Freegold and Randfontein and
withdraw from the other mines in Segment A.
Segment B represents 26,5 % or over a quarter of the market, and are
as a result quite attractive. For AEL, some mines in this segment are
geographically difficult to service, that is Kinross, Winkelhaak and ET
Cons. All other mines can easily be reached, resulting in average
competitiveness. The implication is a market to be managed for
earnings, protecting existing strengths but invest in areas where risk is
low.
The size of segment C is small and thus possesses low attractiveness,
but these mines are highly servicable since they are close to the
Freestate distribution hub and AEL are strongly competitive in other
respects. The market should be protected and refocussing should be
done.
The size of Segment D has high attractiveness at 28,5 % of the market,
and a strong competitive position to supply and service them exists.
Collectively, these mines are natural targets for AEL.
Regarding the life of the mines, Segment B is highly attractive with life
of mines of 26 years, but AEL has average. competitiveness in Segment
B. Low attractiveness in Segment A exists with a weak competitive
position apart, from Freegold and Randfontein Estates. Segment C has
the lowest life expectancy, but AEL has a strong competitive position in
the market since these mines take large volumes from AEL and is close
to the Freestate distribution hub, an area solely service by AEL.

76
Currently the mines in Segment D have a reasonable life expectancies,
but. AEL has a strong competitive position.
4.1.2 Economical/Technological needs versus Capability
Market -Sectors B and D, as explained elsewhere, are attractive
regarding new technology due the lower economic or financial risk.
Segment . B has reasonable attractiveness, since it can afford new
technology but stand the chance to be disillusioned. AEL has the ability
to supply in volume and to introduce the product with high support, but
recent experience shows these abilities need to be improve further.
Segment D is highly attractive for introducing new technology, but
average competitiveness exists. Segment A has low attractiveness for
new ?technology combined with a weak competitive ability 'by AEL to
convert, due to the small and geographically scatterred nature of these
mines. Segment C is reasonably attractive for introducing new
technology, but behaves as a late majority, first allowing others to try
before they convert. AEL has a strong competitive position in this
market with a high market share and a high geographic presence. The
relative positions are indicated graphically in Figur 4.1.
4.1.3 Competitive Position versus Market Interaction
Two factors are considered here, price and presence. If the market is
very price sensitive using price levels as the major criterion in buyer
decision making, the market has a low attractiveness to AEL. If mines
are close to distribution hubs, and take product on large scale, AEL has
a better ability to compete. High competitive activity is experienced in
the near West Rand, less so in the Klerksdorp area with almost no
competitors in the Freestate.

77
Segment A are very price orientated and AEL has a weak position to
compete, since many mines take low volumes, with Freegold and
Randfontein as exceptions. Segment C are reasonably price sensitive
and AEL can compete strongly. In both Segments B and D, financial
risk is low resulting in highly attractive markets, but AEL's competitive
position is average regarding price.
Market presence essentially means the level of experience in providing
the market. If a market is likely to appreciate what AEL stands for, it
has high attractiveness, and if AEL can satisfy the expected needs easily
compared to competitors it has a strong competitive position. Segment
A has low supplier loyalty and thus low attractivenss, and AEL has only
an average competitive position. In Segment C, however, a strong
ability to provide has been experienced and high loyalty makes the
market highly attractive. Segment B has high expectations and is thus
only reasonable attractiveness, while AEL has a strong competitive
ability to satisfy needs. In Segment D, the market is highly attractive
and AEL has a strong competitive ability to satisfy needs.
4.1.4 Market Targetting
When a relative large market share exists, as is the case with AEL, it
can be expected that more than one market segment will be attractive to
invest in. Segmentation then leads the strategist to design different
value offerings to the different markets in order to successfully address
needs in these segments.
From the analysis above, one deduce that of the four market segments
identified, three are attractive to AEL, that is Segments B, C and D,
while Segment A looks less attractive. What is the strategic
implication?

78
If the market attractiveness/competitive position motive of Walker et al
as shown in Figure 2.8 is studied and applied, the following implications
come to light:
Market Segment A
Figure 4.2 reproduces Segment A of Figure 4.1 in greater detail with
the matrix blocks (originating from Figure 2.8) numbered. locks 3,6,8
and 9 should be interpreted in Figure 2.8 in order to understand the
strategic implication of the analysis. These blocks suggest selective
activity, to seek specialization around the limited strengths, but to
harvest, manage for earnings and finally to divest. Freegold and
Randfontein are the exceptions, and will be targetted.
IFIIGUIRE 402 The striategfic fimplIficsitiion cells off the WsallIker
mgateix (1Figum 2.) to he consulted iron. guridgannce nnn
Mantet Segment A
COMPETITIVE POSITION
STRONG
AVERAGE
WEAK
HIGH
REASONABLE
LOW
.-- -/,97//
7 ,
Indicated once
Indicated twice
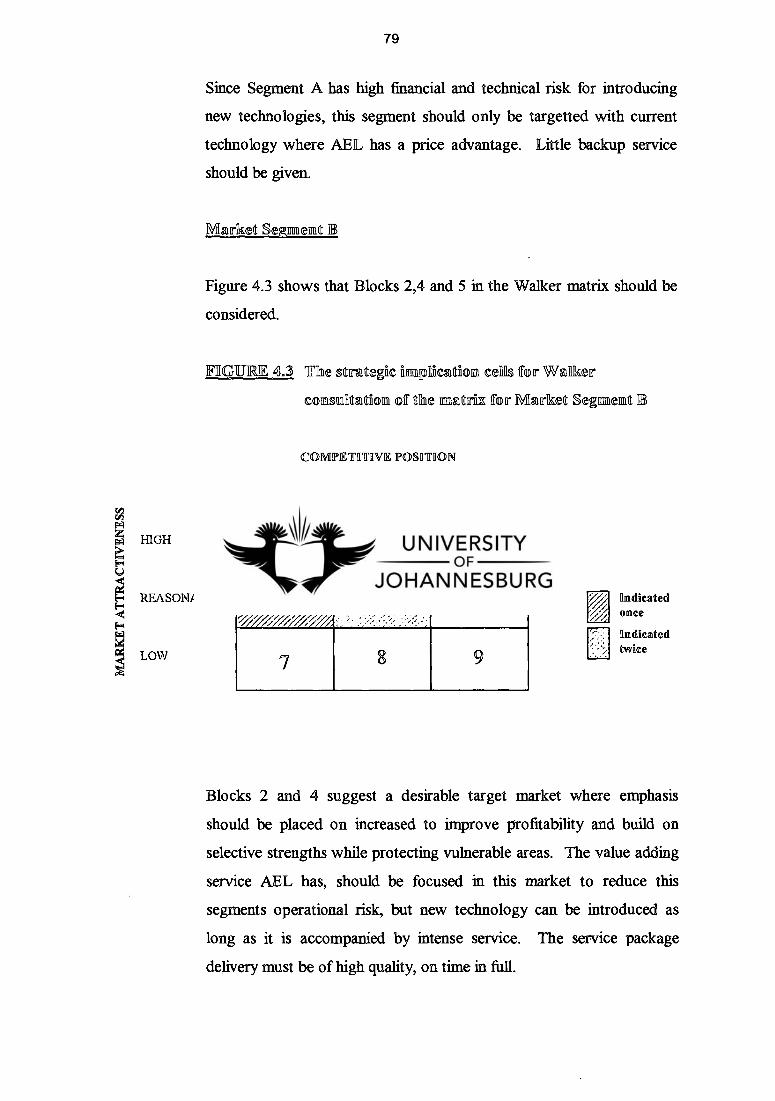
79
Since Segment A has high financial and technical risk for introducing
new technologies, this segment should only be targetted with current
technology where AEL has a price advantage. Little backup service
should be given.
Market Segment
Figure 4.3 shows that Blocks 2,4 and 5 in the Walker matrix should be
considered.
FIGURE 4.3 'The strategfic limp lificatiion cells Tor Walker
consultation off the matrfa TOT Market Segment
COMPETITIVE POSITRON
STRONG AVERAGE WEAK
HIGH
REASONABLE
LOW
,....:-,,
7 8 9
I/% Indicated once
Indicated twice
Blocks 2 and 4 suggest a desirable target market where emphasis
should be placed on increased to improve profitability and build on
selective strengths while protecting vulnerable areas. The value adding
service AEL has, should be focused in this market to reduce this
segments operational risk, but new technology can be introduced as
long as it is accompanied by intense service. The service package
delivery must be of high quality, on time in full.

cal
HIGH
REASONABLE
F.1
LOW
80
MaRiot Segment C
As is shown in Figure 4.4, cells 1,4 and 7 of the Walker matrix are
applicable.
IFIGURE 4.4 The strategic i plication eels frorr co
stalitsition off the 1 1
w.laken. mzerim for Man-ket Segment C
COMPETITIVE POSITION
STRONG
AVERAGE
WEAK
/
//1/// ///, / / 2 3 / /77 4,
• 8 9
Indicated once
Indicated twice
It is indicated as a desirable market where current strengths should be
maintained and protected. This market should be serviced well, but not
with value adding services that are charged for. Prices should be
competitive but not necessary the lowest, current technology must be
protected, benefits maximized while new technology should only be
introduced if its benefits has been proved beyond doubt elsewhere.

, . , „. ,. ..>
,
3
7 ,,,,,,,
4 A/
/ 4 6
7 8 9
co) rad
HIGH
REASONABLE
LOW
Ito is' icated once
lindicoted twice
81
Market Segment D
Figure 4.5 indicates this as a highly desirable market with Walker matrix
cells 1,2 and 5 to give strategic guidance.
IFIIGU1RJ 4.5 The strategic fimplliesatfion cells from the Waker
matriz to give gnficilaimIce b Market Segment D
COMPETUTWIE IPOSMON
STRONG
AVERAGE
WEAK
The market should be invested in and strengths should be maximized
while vulnerable areas should be reinforced. Value added services can
be charged for and should be designed to sustain high levels of
performance New technology should first be introduced in this market
and should be supported by a high service presence during conversion.
Quality levels should be high and product deliver on time in full.
In conclusion, Segments B, C and D are targeted in full, while Segment
A will not be serviced and only price competitive products will be
offered.
82
4.2 PRODUCT AND SERVICE POSITIONING
To offer the right value package to each segment, the product determinants
that drives behaviour in each segment needs to be identified. Plotting two or
three of the most important decision determinants against each other, a
"product space" is created within which a position can be shown . Each axis
represents a continuum along which the determinant increase or decrease. For
example, for perceived 'expensiveness' one product can be positioned to the
left of a horizontal line, meaning it is viewed as inexpensive, while another to
right is viewed as expensive.
The total set of product and service offerings by a company to market
segments, including the way market communication is done, collectively
represents the image of the company in the market place. Thus, doing business
with AEL, SMX, BME or Dantex relates to different buyer experiences for the
customer, even if the same product range is bought. In the end, a corporate
image accross all market segments exists, therefore value packages targetted at
the different segments must all be consistent with the overall image in the
market.
The positioning process followed here will be as follows.(Walker et al; 2: 208):
Identify the Market Segments major determinants
Determine own and competitiors product location in the product space
Determine the customers most preferred combination of determinant
attributes
Examine the fit between market preference and product position
Select a positioning or re-positioning strategy and consider consistancy
with the overall coporate image.
Since a large quantity of product variations, within a product range exists, like
sizes, lengths, strengths, etc. single product ranges are grouped together as

83
shown in Table 4.3. More focus is put on perceptual positioning rather than
physical product positioning, however, where physical product features are a
determinant, it is- considered. Each Market Segment is considered separately.
Since the behavioural base variables are affordability and operational
excellence, the horizontal axis will highlight some or other particular discriptive
attribute of affordability, while the horizontal axis will highlight a discriptive
attribute associated with operational excellence. The degree of intensity of the
attribute is indicated on the continuim as high or /ow , low to the left of the
horizontal continuim line and to the bottom of the vertical continuim line.
TABLE 4.3 The major product groups offered in the Gold Narrow
Reef Market
PRODUCT GROUP , I SUPPLIER AND TRADE NAMES
PRO-
DUCT
AEL
-
SMX BME DANTEX ALTECH I '
Fuse and Ignitor Cord F/IC Stopefuse - Famesa - -
Durafuse Fuse
$topeline •
Shocktube Systems SS Handidets EZ-Stoper - - -
Tunnelmaster
Nonel Reef
Assemblies
Electronic Delay Detonators EDD Bishop - - - Electrodet
Cardinal
Cartridge Explosives CE Powergel Emex Megamite Tovex -
Energex Explogel
Magnum
Ammonium Nitrate/Fuel Mix ANFO Anfex
LDA
Expanfo , - -
F/IC - Fuse/Ignitor Cord SS- Shock Tube EDD - Electronic Delay Detonator
CE - Cardtridged Explosives AN - Ammonium Nitriate Fuel Oil

84
4.2.1 Product Positioning in Market Sector A
L
Market Sector A is price concious and operates at lower efficiencies,
since the cost orientation prevents them from spending much on
employee development. The descriptive attributes that are most
important in this market is expensiveness and technological
placability. Expensiveness, that is a price• orientation, is the attribute
linked to affordability and plotted horizontally,- The robustness of the
technology selected and it's forgiveness when used by a non-trained or
less developed workforce, forms the vertical continuim. Figure 4.6
plots the product space.
Product positions for some AEL and competitor products are shown in
the figure. The customer most preferred, combination is the upper left
area of the product space. Clearly, AEL can only compete with
Stopefuse and Stopline. Since the market is not targeted, no strategic
shifts will be attempted to better serve the market other than
communicating to the market that AEL fuse is robust and cheap and
easy to use. r.

Market (Customer) preferred attribute combination
Low Technollogicsi
High
° Handidets
AEL - Red SMX - Blue BME - Green Dantex -
'4f-Plf;
xpanfo
Anfex ° Do-a:arse LOA
Low
Ex Powargel
amite
amesa Fuse
85
FIGURE 4.6 Product lIposition Space nactrin wfitl>n produnct
positio s fin Market Sector A.
High
Source e Anon o AEL Internal Files, 1996
4.2.2 Prod anct IPositiouning n¢p Market Sector It
The mines in Segment B have high technological expectancies from
their selection of explosives products. This market feel they can pay for
whatever is required, therefore expect the product to work faultless and
to show an immediate difference in their operational performance, even
if they don't invest much in training or developing their people to use
that technology. A supplier is expected to do the training and
development and must make the technology work. They can even be
convinced to pay for service, but will be demanding in expecting proof
of what benefit was obtained. Price is linked to product and supplier
performance If these mines feels product/supplier output is high, high
prices can be obtained.

Pewoz-ge.: Meganite
• Handidets ---- High
Market (Customer) preferred attribute combfiErnation
Low Supplbler/Produet Owl, ant
AEL - Red SMX - Blue BME - Green Dantex -
High
86
The product space is thus formed by a price placability continuum
(horizontal) and a supplier output continuim (vertical) as shown in
Figure 4.7.
1FI[GURE 4.7 IProduct PosMon Slince mmtrav veith product
posh-Ions nnn M rket Sector
Source : Auomi : METE Ihtertmall Hes, 11996
It can be seen that many products of AEL are attractive, such as
Handidets, Stopefuse and Magnum. Products that are less forgiving,
such as Powergel is not recieved as being competitive. It is clear why
intense competition is felt in this market.
AEL is targeting this market and should try to position their products in
the upper right quarter of the product space matrix. The ability of AEL
to convert the market successfully to Shocktube, for example, should

87
be percieved superior to that of other suppliers. The ability to sustain
high performance from products should be perceived higher than with
other-suppliers. That will move Powergel and Handidets well into the
upper right quarter of the matrix, providing a good strategic fit for AEL
to be successful! in this market. A technological range of products on
offer, will also strengthen AEL's position in this market.
4.2.3 Product Positioning in Market Sector C
The operational performance of the mines in this market sector is high.
They need to sustain the performance, and appreciate strong product
support from suppliers. Should a new technology promise a step
change in performance, and is well proven elsewhere, the suppliers
ability to convert the market sucessfully will provide a strong advantage
for that supplier. The product space matrix is formed by affordability as
the horizontal continuum, meaning if service levels is low, the product
must be very cheap, but for higher service levels, higher prices will be
paid. The appropriateness of the technology, that is the track record,
the risk to make it work well, is forming the vertical continuum. r.
Newer technologies are viewed as highly appropriate but not
affordable. AEL's Stope-, Durafuse, Stopeline, Anfex LDA and
Powergel all fit this market well. Many competitor products can
replace them, and only the service levels and supply proximity keeps
this market for AEL. Since this market is targetted, these strengths
needs to be expanded even more. The ability of AEL to provide
appropriate technology and the track record of making it work, thus
low risk during conversions, needs to be percieved as far superior to
that of competitors.

Magnum EZ - Stoper
Handidets ° NRA's
owergei
High
Market (Customer) preferred attribute cornIbination
Low Servieefreellwollogicall Appropriateness
AEL - Red SMX - Blue BME - Green Dantex -
88
FIGURE 4.8 Product Position Space matrix wit ➢n relative product
positions Tor Market Segment C
High
Sounrce o Anon o ARIL Interne IFilles, 1996
4.2.4 Product Positioning in Market Sector ID
This market views price in the light of the value provided rather than
price itself The horizontal continuum of the product space is thus
value delivery, but technological ability forms the vertical continuum.
The high level of performance results in a good chance that new
technology will provide the intended benefit, thus delivering the value
even at high cost.
A good strategic fit exists between AEL's products and the need in this
market. AEL should be percieved as leading the market in trouble free
conversion, access to new technologies and the ability to provide in

1 High
Impact Breaker
MSL initiation system
Low Vallane
High
Meganite
Famesa Fuse
Market (Customer) preferred attribute combination
Low TeehnolloRitc2311 AlMility
AEL - Red SMX - Blue BME - Green Dantex -
89
large volumes when requested. Services should be perceived as market
leading and should provide sustained high performance
FIGURE 49 In-oduct 1Posiitiio1 Since vyntIln rellEtive product posfitlorms TOR"
Motet Sector ID
1 A non-explosive rock breaker
2 A electric detonator system with an electronic timing allocator
Source a Amiomi e AIEL Enntermisall 1Files, 19%
AEL need not be seen as necessary leading in technology or being first,
but should be perceived as the company providing the best value once a
new technology is introduced and support it with the best service
backup available. AEL should be seen as the logical partners for now
and for the future.

90
4.3 A CORPORATE IMAGE
From the analysis above, it is revealed that many AEL products are positioned
well in their target markets but in others repositioning is required. The
question is, can a consistent corporate image be maintained while different
perceptions are aimed at in different market sectors.
Market Segment B expects high supplier output when the price asked is higher.
and vice versa. Market Sector. C expects service commenturate with their
needs. Sector D expects service to sustain and improve their performance
levels. New technology is welcome in all three market sectors, but
expectations are different. Segment B expects the technology to uplift their
operations with little own input, Segment C expects the technology to be well
proven carrying low risk while Segment D expect new technology to support
their search for excellence.
The common denominator is servicability, the ability to partner with the
customer and help him to overcome his problems. Another common factor is
the need to have access to new technology without too high a risk of failure of r.
such conversion attempts. AEL needs to be perceived as understanding best
the needs of the market, providing the best service and having the ability to
provide intense backup if required. " Partnering with AEL provides best value
should be the clear picture in customers minds.

91
CHAPTER 5
CONCLUSION AND RECOMMENDATIONS
5.1 A SUMMARY
5.1.1 Study Objectives Reviewed
Until the mid-eighties, AECI Explosives Limited (AEL) was the
single supplier of explosive and initiating products to the South
African mining industry. In order to satisfy the industries needs,
an undifferentiated marketing strategy was followed. All needs
were satisfied by a single marketing mix based on a
comprehensive range of products.
With competition entering the market in the mid-eighties,
differentiation was achieve by offering nitro-glycerine based'
products, initiating systems and high service levels supported by
a well trained and competent sales force. Competitors slowly
improved service, slowly closing the differentiation gap. They
also entered into alliances with international explosives
companies, opening venues to supply initiating systems in this
market.
For AEL to stay competitive, the relative large market share still
achieved needs to be stabilized. This will assure the right of
scale which provides price competitiveness. To target
resources, understanding of buyer behaviour is required. What
is needed is a logical segmentation model to shape future
strategy and company objectives. Thus, markets of similar
buyer behaviour must be identified, areas of maximum chance of
adding value selected and targeted. To achieve this, three
objectives have been set for this study:

92
Develop a market segmentation model explaining
similarities and differences in buyer behaviour groups.
Interpret the segmentation model in the light of
strengths, weaknesses, opportunities and threats to AEL
in order to target segments.
Develop strategies and position AEL in the target
markets.
5.1.2 The Segmentation Model, Targeting and Positioning
Chapter 2 provides theoretical background on the explosives
purchasing process, explaining it as a decision-making process
by individuals and groups. Individual and group behaviour are
reviewed and contrasted to. current segmentation approaches,
namely the "Nested Approach", "Product Benefit Approach"
and "Re-examination of Product Flow Approach". Non of these
puts the decision-maker, the decision-making process and the
resultant buyer behaviour central.
A segmentation approach for this study is developed, starting at
the inner nests and working outward, the most 'inner nests'
being the decision-maker. The macro end micro environmental
aspects influencing his behaviour is regarded as filters, heavy
filters representing limited behaviour influence and low filtering
being the dominant influencers.
In Chapter 3 a segmentation model is develop according to the
proposed segmentation approach. In the process, the
customers, their location, the product taken, market needs and
the nature of the physical and cultural environment are

CMI,CitM)ol% c higgag pooh
.(-(1°4,0DTo.DG OD qGm011oudovo
S e2,ment A (price/cost)
(mg,roivinid
(.'r60[1* ,fiCsOol)pg(opoo))
Affordsbillity
'Increased Supplifier Loyslity
,.
:tx.
Op
erat
iona
l Exc
elle
nce
93
explained. Four segments are identified, which contrast
Operational Excellence and Affordxbilligy, which represents
erational Risk and Financial Risk respectively.
FIGURE 5.1 The Man- et Seg ipentation Modell exp nning
Explosives buyenr beh in the Gold Nan row Red
Man•cet
Increased technology sophistllestion
<1-1 IFfinsncllsil Risk
Segment A has both high financial and operational risk and is in
essence a price/cost market. Segment has low financial but
high operational risk, representing a market easily convertible to
newer technologies (early adopters) but requiring support not to
be disillusioned. Segment C has high financial but low
operational risks, which breeds supplier loyalty but are laggards
in technology conversion. Segment D have both low financial
and operational risk and illustrates supplier loyalty combined
with early majority behaviour in technology transfer.

94
Chapter 4 attempt to target the market segments best suited to
AEL, position and strategies. Business strengths and
weaknesses are investigated. Table 5.1 summarise the factors
considered.
TA ILE 5.11 Attractiveness and Competitive facton
considemi man•ket tarrgeting
ATTRACTIVENESS
COMIIDIVIETIVENESS,
Market Characteristics
Economic and Technological
Competitive Position
Position in Market
Capability
Interaction
Sourrcebile 401 concienseail, p 71
Market segments B, C and D are targeted as a result, offering
segments which requires high services levels, requires new
technologies and illustrating potential supplier loyalty. Segment
A suggest a disinvestment strategy for AEL.
Product Positioning strategies were reviewed next (chapter 4),
suggesting ways to move product and service perceptions in the
targeted markets to obtain maximum advantage for AEL.

Customer Vaal Reefs
0 Modell
'Western beep Levels
Free Gol
AP " ':NDIX I SIEN MIVIING TILOTTIING 711--H11
MIINIEE 1IN MAJR=r
Ian Cocker 11 - Technical Dfirector e Aull© Goal
Operational Risk
-4111—mmingsmmo IFinzradz11 llsk
ernard Swznepoell - zrITDOITIly
perztollull isk
Customer
0 Modell
Ffinzzicizlrisk

Operationall Risk 1 Customer
0 mode
peration Risk
1 CusttLmer
0 Modell
SENIOR MINING FIEOFILIE 711..407717NC- 'THEM, 1Tll--111E, MARKTIT
Thys Lottrens - Consulting Mining Engineer -
Fina el fl 'isk 7111it'■,44',11", 14.234,5411Rtill
Pieter K. o inson - Consulting Mining Engin :°er o Gengoid
Fi anthil Ris

95
5.2 CONCLUSION
In Chapter 1 it is stated that so many variables influence the explosives
buyer decision making process in the gold mining industry that
segmentation is found to be problematic. As a result, areas in the
market where the strengths of AEL will maximise value are difficult to
identify, resulting in inefficient resources allocation, consuming both
AEL's and customer value.
This study achieved a logical segmentation and identified stable market
segments. These segments are placed in a logical behavioural
segmentation model. Four segments were identified. The common
variables in all these segments are the degree of operational risk and
financial risk. The first segment (segment A) experiences both high
operational and high financial risk resulting in a price sensitive market.
The second ,segment (segment B) has high .operational but low, ,price.,
sensitive but support intensive market. Segment C represents low
operational but high financial risk, resulting in a market that is price
aware but appreciates value. Finally, Segment D contains low risk in
both areas, a market demanding new technology and successful, easy
conversion of one technology to another with high supplier support.
Targeting of segments were also achieved. All segments interest to
AEL, but with different approaches. The following segments were
identified with a summary of the needs in that segment:
Segment A - Low prices with little support (do it yourself)
Segment B - Provide old and new technology with service that target
skills upliftment.

96
Segment C - Sustain high performance of current technology with
good maintenance service. During conversion only
product related skills are transferred since other ability
is already high.
Segment D - New technology should be offered with continual value
enhancing service.
Segments B, C, and D, are targeted in full, while Segment A will only
be serviced if a product or service produced for other segments
accidentally also satisfy Segment A.
5.3 RECOMMENDATIONS
In order to achieve and maintain market dominance in market segments
B to D, the following strategies are recommended:
In Segment B product output must be emphasised, and service
should be designed focusing on measurement of benefits and J;
good training in application of products. Longer term
productivity enhancing services can be offered, and price should
support these extra activities. Promotion should convey
product benefits, but the service link involved to deliver benefits
should also be advertised.
The design of Product maintenance services, with the ability to
expand service to skills transfer intensive backup during
technology conversions, is recommended. Success of newer
technologies in other segments should be promoted in this
segment.
Products and services should focus on improving an already

•
97
good efficiency on productivity level in this market. Service
should be highly proac6e, identifying areas where a different
methodology or technology will improve performance or
enhance profits. Technological ability should be promoted
strongly in this market, combined with the capacity to support
conversion and sustain benefits such new technology can offer.
Only price competitive technologies should be offered in
Segment A, with reactive service backup, giving attention only
if product problems exists with a customer. This market can
thus be serviced from by the market force that look after
segments B and D. Segment C only requires a ton staff, calling
on the other resources over short periods of intensive activity.
Finally, it is recommended that an overall promotions policy
should be established, in order to communicate the right
message to the right market segment, and to understand which
channels methods and media will deliver these messages best to
the targeted segments. Overall, a unified image of a high
service provkler backed by good products and priced to ensure
maximum mutual value creation, should be established and
maintained. Thus, employee selection, sales force ability and
training should be in balance with the expectation of high
performance for the customer captured in the promise AEL is
representing as a supplier.

98
BIOGRAPHY
ANON., 1986. Johannesburg eenhonderd jaar. Chris van Rensburg Uitgewer.
327 p.
ANON., 1996. Gengold purchasing policy and procedures manual. 20 p.
ANON, 1996. Analysis of working results, October - December 1996.
Chamber of Mines of South Africa. 8 p.
ANON, 1996. AEL Internal Files
BATEMAN T.S. and ZEITHAML C.P., 1993. Management, function and
strategy. Irwin. 662 p.
' T` BRUCE N. ,(Ed), 1996. Top companies, Supplement to .the - FiriancialiMail, ,
June 28 1996, 462 p.
BINGHAM F.G. and RAFFIELD B.T., 1990. Business to business marketing
management. Irwin. 744 p.t.'
CHAN., 1995. South African mineral industry • 1994/95. Department of
Mineral and Energy Affairs. 216 p.
CRAVERS D.W., 1987. Strategic marketing. Second Edition. Irwin. 679 p.
DE BRUYN H.E.C. and KRUGER S, 1994. Strategiese besteur wekboek.
Entrepro. 260 p.
ECKLES R.W, 1990. Business marketing management, marketing of business
products and services. Prentice-Hall International. 488 p.

99
GIBSON J.L., IVANCEVICH J.M. and DONNELLY J.H., 1994.
Organizations, behaviour, structure and process. Eighth Edition. 802 p.
HUYSHAMER STALS PROPRETY LIMITED. 44 P.
KOTLER P. and ARMSTRONG G., 1994. Pirnciples- of marketing. Sixth
Edition. Prentice-Hall, International, Inc. 692 p.
LANDMAN G.V.R , 1996. AEL Gold Strategy Plan. 90 p.
McDONALD M. and DUNBAR I., 1995. Market segment master. Brochure.
4 p.
STRUHL S.M., 1992. Market segmentation, and introduction and review.
Marketing Research Technique Series, American Marketing Association. 83 p.
SHAPIRO B.P. and SVIOKLA J.J. editors., 1993. Seeking Customers. A
Harvard Business Review Book. 343 p.
r.
THOMPSON J.L., 1993. Strategic management, awareness and change.
Second edition. Chapman and Hall. 757 p.
THOMPSON A.A. and STRICKLAND A.J. 1992 Strategic management:
concepts and cases. Sixth Edition 117 p.
VON BELOW A. (Dr), 1996. SA gold mining. Huyshamer Stals Proprietary
Limited, 30 p.
WALKER 0.C., BOYD H.W. and LARRECHE J., 1992. Marketing strategy,
planning and implimentation. Irwin. 503 p.
WOOLLEY D., 1996, South African gold mining quarterly.