strategic incentive systems: a theoretical and empirical ... · operatively, avoiding cut-throat...
TRANSCRIPT

Strategic Incentive Systems: A Theoretical and Empirical Investigation of
Managerial Incentives and Competitive Interaction
A dissertation presented by Govert Vroom
to INSEAD faculty in partial fulfillment of the requirements for the degree of
PhD in Management
June 2005
Dissertation Committee:
Javier Gimeno (chair) Karel Cool
Xavier Vives Peter Zemsky

i
Acknowledgements
This dissertation is the result of six years of study, which passed by very rapidly.
Somebody correctly observed, “You’ve been one of these relatively trouble-free
students...” The purpose of these acknowledgements is to briefly explain why
that was the case.
When Marjolein Bloemhof and I were doing our MBA at Boston University,
the idea to become an academic came up and was supported by many faculty
members. Rather than emphasizing the inherent difficulties in doing a doctoral
program, they encouraged me to seriously prepare the program applications, and
provided me with sound advice, thus inspiring sufficient self-confidence to finalize
the year-long application process. The BU faculty members who helped me most
were Alison Kirby-Jones, Michael Riordan, and Michael Shwartz.
The first two years of PhD coursework at INSEAD were interesting and
stimulating, thanks to the committed faculty, including, among others, Erin
Anderson, Laurence Capron, Karel Cool, Yves Doz, Charlie Galunic, Javier
Gimeno, Hubert Gatignon, Bruce Kogut, Tom Mannarelli, Mary O’Sullivan, Subi
Rangan, Tim Van-Zandt, Xavier Vives, Enver Yucesan, Peter Zemsky, and
Maurizio Zollo. My class mates also contributed significantly to my learning:
Costas Lioukas, Evrim Günes, Ilker Yoney, Jonghoon Bae, José Luis Peydro, Odi
Triakaliotis, Konstatin Korotov, Svenja Sommer, Vini Onyemah, and Zhixing
Xiao. Thank you for your friendship, insights, and for the nice parties we had
together.
After my first two years at INSEAD, I spent the fall semester at the Kellogg
School of Management, where I attended some extra classes and started thinking
about the topic of my dissertation. I would like to thank Paolo Fulghieri and
Mary O’Sullivan, in their roles of INSEAD PhD Dean and Strategy PhD
Coordinator, for supporting my visit to Kellogg. I am also very grateful to the
Kellogg faculty for their friendly hospitality: Jim Dana, Kathy Spier, Dan

ii
Spulber, and Jim Rogerson, among others. I would particularly like to thank my
friend, Francisco Ruiz-Aliseda, at that time a Kellogg student, now a member of
INSEAD’s Economics and Political Science Department: his advice and
suggestions directly led to what ultimately became my dissertation.
Javier Gimeno served as my dissertation chair. His help, advice, suggestions,
and encouragement in shaping my dissertation was simply remarkable. Without
ever imposing his own opinion, he guided me through many moments of doubt,
apprehension, and impatience, and brought me exciting moments of insight,
enthusiasm, and reassurance. Our weekly meetings were enjoyable and congenial;
we enjoyed pushing each other to further understanding. Javier’s support for me
became legendary once the job market started. Several faculty from other schools
commented on the limitless endorsement Javier gave me; I hope that I will be
able to live up to the expectations he has of me.
My committee members have consistently supported me, giving me advice
and wise words of consolation, whenever I had doubts about what I was doing.
Peter Zemsky always had his door open to listen and to give advice. While he
was visiting the Wharton school, Peter helped me prepare my first article for
submission, meticulously reviewing each individual sentence with me over the
telephone. Karel Cool and Xavier Vives have been instrumental in the
development of my dissertation by ensuring that my ideas were convincing and
that they fitted the existing literature. I am very grateful to all my committee
members for their constant support and guidance over the past four years.
I would like to thank all the other people who have made my life so enjoyable
at INSEAD and Fontainebleau during these years, either by advising on the
content or the process of doing a PhD, by engaging in long and, most probably,
futile discussions about everything ranging from international politics to the PhD
life, by lending me their coffee card, by putting up with me as an office mate, or
simply by being nice friends: Sumitro Banerjee, Neil Brisley, Marco Ceccagnoli,

iii
Olivier Chatain, Jean Cropper, Laurens Debo, Gareth Dyas, José Miguel Gaspar,
Oliver Gottschalg, Johanna Mair, Arzu Ozoguz, Ludo Phalippou, Michele Plu,
Metin Sengul, Jung-Chin Shen, Julie Urda, Michael Yaziji, and Yu Zhang,
among many others. I am also grateful for the courteous and professional
assistance from the Doriot library, the INSEAD bar, the Strategy Department
secretaries, Faculty Affairs, Havas Voyages, and the PhD Office. I would like to
thank my brother Roderick for helping me whenever needed and for his constant
interest in my progress, which provided an encouragement to continue and finish
my dissertation. Financial support from INSEAD and the Sasakawa Foundation
is gratefully acknowledged.
I dedicate this dissertation with love to my parents, who helped me through
school, to my wife, Marjolein, who came with me to France and who participated
most closely in this dissertation, and to our children, Olivier and Laura, who
hold the future.

iv
Abstract
Competitive strategy has typically dealt with firms as if they consist of unitary
actors, while, in fact, individual managers within the firm may have different
interests. My dissertation addresses this shortcoming by exploring whether and
how internal firm characteristics — such as compensation schemes, organizational
structure, and ownership form — affect managerial incentives, which, in turn,
affect how firms compete. An idea central to the dissertation is that delegation of
authority within the firm can be used as a strategic commitment device.
The theoretical part of the dissertation uses a game-theoretical model to
explore the relationship between organizational design and the intensity of
rivalry. Previous studies have found that firms may use their organizational
design to commit to behaving aggressively if competition takes place in strategic
substitutes. This typically leads to a prisoner’s dilemma in which firms behave
too aggressively and industry profits decline. In this study, I show that the
interaction between multiple elements of organizational design, i.e., compensation
schemes and organizational structure, may lead to endogenous heterogeneity in
incentives and a reduction, rather than an increase, in the intensity of rivalry.
This is an important finding because it shows how firm heterogeneity can solve
the fore mentioned prisoner’s dilemma.
The empirical part of the dissertation uses a proprietary dataset of the Texas
hotel industry to empirically investigate how ownership forms affect managerial
incentives and pricing in different competitive contexts. I explore how the
difference in ownership form between franchised and company-owned units
influences the incentives of the managers who take the day-to-day decisions that
constitute interfirm rivalry. I show that chains with company-owned units may
restrict decision-making of local units as a credible commitment device to
maintain high prices. Furthermore, I show that the payment of royalty fees
reduces the net available revenues of franchisees, which provides an incentive to
increase the price they charge to customers. By elucidating the competitive
consequences of ownership, this study allows firms to take these consequences
into consideration when determining the ownership structure of local units.

v
Table of Contents
1 Introduction . . . . . . . . . . . . . . . . . . . . . . . . . . . . . . . . . . . . . . . . . . . . . 1
2 Literature Review . . . . . . . . . . . . . . . . . . . . . . . . . . . . . . . . . . . . . . . . . 8
2.1 Theoretical Strategic Incentives Literature. . . . . . . . . . . . . . . . . . . . . . . 8
2.2 Empirical Strategic Incentives Literature . . . . . . . . . . . . . . . . . . . . . . . . 16
2.3 Conclusion and Definitions . . . . . . . . . . . . . . . . . . . . . . . . . . . . . . . . . . 18
3 Theoretical Investigation of Managerial Incentives and
Competitive Interaction . . . . . . . . . . . . . . . . . . . . . . . . . . . . . . . . . . . .
21
3.1 Introduction . . . . . . . . . . . . . . . . . . . . . . . . . . . . . . . . . . . . . . . . . . . . 21
3.2 Model . . . . . . . . . . . . . . . . . . . . . . . . . . . . . . . . . . . . . . . . . . . . . . . . . 26
3.3 Analysis . . . . . . . . . . . . . . . . . . . . . . . . . . . . . . . . . . . . . . . . . . . . . . . 30
3.3.1 Endogenization of Organizational Structure . . . . . . . . . . . . . . . . . . 31
3.3.2 Endogenization of Compensation Systems: CC-subgame . . . . . . . . . 33
3.3.3 Continuum of Solutions in Salas Fumás. . . . . . . . . . . . . . . . . . . . . 36
3.3.4 Comparing Salas Fumás with Fershtman and Judd . . . . . . . . . . . . 36
3.3.5 Endogenization of Compensation Systems: DD-subgame . . . . . . . . . 38
3.3.6 Endogenization of Compensation Systems: DC-subgame . . . . . . . . . 41
3.3.7 Solution of the Overall Model . . . . . . . . . . . . . . . . . . . . . . . . . . . . 46
3.4 Discussion and Conclusion . . . . . . . . . . . . . . . . . . . . . . . . . . . . . . . . . . 49
4 Empirical Investigation of Managerial Incentives and Competitive
Interaction. . . . . . . . . . . . . . . . . . . . . . . . . . . . . . . . . . . . . . . . . . . . . . .
54
4.1 Introduction . . . . . . . . . . . . . . . . . . . . . . . . . . . . . . . . . . . . . . . . . . . . 54
4.2 Research Design . . . . . . . . . . . . . . . . . . . . . . . . . . . . . . . . . . . . . . . . . 56
4.3 Theory Development . . . . . . . . . . . . . . . . . . . . . . . . . . . . . . . . . . . . . . 60
4.3.1 Ownership Forms and Competitive Behavior . . . . . . . . . . . . . . . . . 60
4.3.2 Strategic Incentives Theory . . . . . . . . . . . . . . . . . . . . . . . . . . . . . 61
4.3.3 Context: Multiunit Organizations . . . . . . . . . . . . . . . . . . . . . . . . . 64
4.3.4 Effect of Ownership Form in Multiunit Organizations on

vi
Competitive Behavior . . . . . . . . . . . . . . . . . . . . . . . . . . . . . . . . . 65
4.4 Empirical Setting. . . . . . . . . . . . . . . . . . . . . . . . . . . . . . . . . . . . . . . . . 71
4.4.1 History . . . . . . . . . . . . . . . . . . . . . . . . . . . . . . . . . . . . . . . . . . . . 71
4.4.2 Cost Structure . . . . . . . . . . . . . . . . . . . . . . . . . . . . . . . . . . . . . . 71
4.4.3 Competition. . . . . . . . . . . . . . . . . . . . . . . . . . . . . . . . . . . . . . . . 72
4.4.4 Ownership Form . . . . . . . . . . . . . . . . . . . . . . . . . . . . . . . . . . . . . 72
4.4.5 Pricing Policy . . . . . . . . . . . . . . . . . . . . . . . . . . . . . . . . . . . . . . . 74
4.4.6 Texas Hotel Industry . . . . . . . . . . . . . . . . . . . . . . . . . . . . . . . . . . 74
4.5 Field Study . . . . . . . . . . . . . . . . . . . . . . . . . . . . . . . . . . . . . . . . . . . . . 75
4.5.1 Introduction . . . . . . . . . . . . . . . . . . . . . . . . . . . . . . . . . . . . . . . . 75
4.5.2 Hotel Industry . . . . . . . . . . . . . . . . . . . . . . . . . . . . . . . . . . . . . . 76
4.5.3 Competition . . . . . . . . . . . . . . . . . . . . . . . . . . . . . . . . . . . . . . . . 77
4.5.4 Sales Force Management . . . . . . . . . . . . . . . . . . . . . . . . . . . . . . . 82
4.5.5 Commitment in Multiunit Organizations . . . . . . . . . . . . . . . . . . . . 85
4.5.6 Conclusion . . . . . . . . . . . . . . . . . . . . . . . . . . . . . . . . . . . . . . . . . 90
4.6 Statistical Analysis . . . . . . . . . . . . . . . . . . . . . . . . . . . . . . . . . . . . . . . 91
4.6.1 Sample . . . . . . . . . . . . . . . . . . . . . . . . . . . . . . . . . . . . . . . . . . . . 91
4.6.2 Dependent Variable . . . . . . . . . . . . . . . . . . . . . . . . . . . . . . . . . . . 94
4.6.3 Independent Variables . . . . . . . . . . . . . . . . . . . . . . . . . . . . . . . . . 95
4.6.4 Estimation . . . . . . . . . . . . . . . . . . . . . . . . . . . . . . . . . . . . . . . . . 97
4.6.5 Results . . . . . . . . . . . . . . . . . . . . . . . . . . . . . . . . . . . . . . . . . . . . 97
4.7 Discussion and Conclusion . . . . . . . . . . . . . . . . . . . . . . . . . . . . . . . . . 103
5 Conclusion . . . . . . . . . . . . . . . . . . . . . . . . . . . . . . . . . . . . . . . . . . . . . . . 109
Appendices. . . . . . . . . . . . . . . . . . . . . . . . . . . . . . . . . . . . . . . . . . . . . . . . 114
Appendix A. Classification of Empirical Strategic Incentives Literature . . . . . . 114
Appendix B. Proofs of Propositions. . . . . . . . . . . . . . . . . . . . . . . . . . . . . . . . 117
Appendix C. List of Interviewees of Field Study. . . . . . . . . . . . . . . . . . . . . . . 125
Appendix D. Brands Operating Both Franchised and Company-Owned Hotels 127
Appendix E. Two Examples of Company-Owned and Franchised Hotels . . . . . 128
References . . . . . . . . . . . . . . . . . . . . . . . . . . . . . . . . . . . . . . . . . . . . . . . . . 129

1. Introduction
This dissertation investigates competition between firms; more specifically, it exam-
ines the antecedents of the intensity of competition. While competition is one of
the most fundamental aspects of our economy, it is also one of the most difficult
phenomena to fully understand. Why do some firms, under certain circumstances,
compete head-to-head, sacrificing profits, seemingly to improve their position vis-
à-vis their competitors, while, in other circumstances, firms appear to behave co-
operatively, avoiding cut-throat competitive behavior? This dissertation aims at
exploring whether organizational characteristics internal to the firm, such as the
organizational structure, the compensation systems in use, and the ownership form,
affect the intensity of competition.
Consider an example from a recent issue (May 24, 2005) of Wall Street Journal,
which discusses the growing intensity of rivalry in the Nordic telecommunications
industry.
Telenor ASA said it would spend around US$1 billion to buy high-speed Internet-
service providers in Sweden and Denmark to strengthen its existing Nordic
operations and gain access to the fast growth of broadband services in the re-
gion. Analysts said the move could intensify rivalry in the already competitive
Nordic markets. All three incumbents — Telenor, TeliaSonera, and TDC — saw
domestic fixed-line revenue fall last year as prices slipped and as consumers
increasingly used mobile phones to make calls.
Next, consider the following contrasting example in the same newspaper.
In the US, makers of so-called rigid packaging — think soda cans and beer bottles
— have been on a roll. (...) The secret is pricing power. Rigid packaging is
dominated by a relative handful of players, who are disciplined about limiting
capacity.
These examples show the extent to which industries can differ in their intensity of
competition, significantly impacting their profitability. The reason why the intensity
1

of competition is so different from one industry to another is often subtle and only
partially understood.
The theoretical reasoning in this dissertation is highly influenced by the field
of game theory. Cournot (1838, “Recherches sur les Pincipes Mathématiques de la
Théorie des Richesses”) and Bertrand (1883, “Théorie Mathématique de la Richesse
Sociale”) introduced economic tools that allowed thinking about strategic interac-
tion: the effect of one firm’s actions on other firms’ profits and actions. The study
of industrial organization applied these economic tools to the investigation of the
rivalry between firms operating in the same industry (e.g., Bain, 1956; Tirole, 1988;
and Vives, 1999).
The strategy field’s central concern is firm performance. One of the earliest
contributions to the strategy field is what is now called the “design school” (e.g.,
Selznick, 1957; Chandler, 1962; Andrews, 1971) using the SWOT analysis to ensure
the fit between the firm (its strengths and weaknesses) and its environment (the
opportunities and threats). Within the strategy field, the “positioning school” (e.g.,
Porter, 1980) highlights the importance of the intensity of rivalry as one of the
five forces shaping industry attractiveness.1 Another important contribution to the
strategy field is the “strategic groups literature” (e.g., Hatten and Schendel, 1977),
which shows that not only industry membership but also strategic similarity are
important explanatory variables of the intensity of rivalry and firm profitability.
The “resource-based view”, finally, underlines the importance of firm heterogeneity
and its impact on firm profitability (Lippman and Rumelt, 1982; Wernerfelt, 1984;
Dierickx and Cool, 1989).
This dissertation draws on the above-mentioned literatures in its attempt to fur-
ther the understanding of the forces that drive the intensity of competition. By
linking internal firm characteristics with interfirm rivalry, this dissertation connects
competition-oriented fields such as game theory, industrial organization, the posi-
tion school, and the strategic-groups literature, with strategy fields that specifically
pay attention to the internal firm organization, such as the design school and the
1In this dissertation, the terms competition and rivalry are used interchangeably.
2

resource-based view.
In many industries, firms with different organizational design characteristics
(such as ownership forms, reward systems, and organizational structures) compete
head-to-head in the product market. In banking, for example, for-profit banks com-
pete with not-for-profit credit unions. In the hotel industry, independent hotels
compete with company-owned and franchised units of hotel chains. In higher edu-
cation, private and public institutions openly compete for students and faculty.
Competition among different organizational forms has been primarily the subject
of organizational theories, such as transaction cost economics, agency theory, organi-
zational ecology, contingency theory, etc. In general, these theories propose adapta-
tion and selection mechanisms whereby some organizational forms gain advantages
over others. Yet, these theories have often glossed over how organizational forms
may interact in oligopolistic competitive contexts. The arguments about competi-
tive selection often assume a “perfect competition” context, where the intensity of
rivalry is exogenously determined, and only superior efficiency determines the com-
petitive success of organizational forms. The argument has been that competitive
selection is determined by “economizing” rather than “strategizing” (Williamson,
1991). The strategic interactions among organizational forms have been ignored.
Yet, oligopolistic competitive situations are common, either because of industry
consolidation and the ensuing high concentration (e.g., in airframes or software), or
because competition is localized among few units in a narrow geography or product
niche (e.g., among airlines or hotels). In an oligopolistic context, each firm’s orga-
nizational design characteristics affect the way it competes, and thus may change
the competitive context faced by other organizations. In situations of oligopolis-
tic competition, competitive outcomes may not be determined by efficiency alone,
but also by how the organizational forms influence competitive postures and com-
petitive interactions. Organizational forms represent commitments to particular
strategic objectives or means of competing, since they may visibly restrict manage-
ment choices and influence the responses of rivals. Some examples discussed in the
literature include:
3

• Firms may commit to particular competitive strategies by delegating decisionsto managers whose incentive systems are based on different strategic objec-
tives. For example, firms who delegate competitive decisions to managers
driven by market share objectives may be more committed to market dom-
inance than firms with financial objectives, and may outperform financially-
driven rivals (Fershtman and Judd, 1987). Chain-owned hotels may delegate
competitive decisions to professional managers whose incentives are different
from those of owners of independent hotels.
• Organizations may create horizontally- or vertically-related divisions to shiftthe incentives of divisional managers and influence their competitive behav-
ior. For example, firms that create internal competition among units or di-
visions may be more resilient against entry and external competition than
other firms more concerned about self-cannibalization (Baye, Crocker, and Ju,
1996; Christensen, 1997; Galunic and Eisenhardt, 1996). Firms that delegate
vertically-interrelated pricing decisions to managers of different divisions may
commit to less aggressive competitive behavior (because of double marginal-
ization) than firms where decisions are integrated.
This dissertation examines the competitive behaviors of firms with different or-
ganizational forms. Interest in the effects of organizational forms (reward systems,
organizational structures) on oligopolistic competitive behavior began in industrial
organization in the mid-1980s (Fershtman and Judd, 1987; Sklivas, 1987; Vickers,
1985). Since then, a large body of formal game-theoretical modeling has accumu-
lated in economics. Yet, empirical evidence illustrating the various competitive be-
haviors of firms with different organizational forms has been lacking. Thus, despite
the intense theoretical effort in economics, the empirical validity and relevance of
these theories remain to be determined. Empirical examination is a requirement for
the widespread adoption of this perspective by strategy and organizational theory
scholars.
This dissertation attempts to bridge the typical emphasis of strategy researchers
4

on market structure, competitive dynamics, and competitive advantage with an
interest in organizational forms that is central to organizational theory. The study
tries to advance an alternative mechanism to explain the differential performance
and survival of different organizational forms. More specifically, this dissertation
analyzes, both theoretically and empirically, the interaction between organizational
design and ownership characteristics, managerial incentives, and product-market
competition.
According toWebster’s NewWorld Dictionary of the American Language (1964),
an incentive (noun) is something that incites action; a stimulus; an encouragement
(“incentive” comes from incinere: to sing). In the context of this dissertation, it will
be argued that incentives are shaped by compensation systems, organizational struc-
ture, and ownership forms. Incentives, in turn, potentially affect managerial action,
and, consequently, firm behavior.2 Firm behavior, subsequently, affects competition
and, therefore, determines the intensity of rivalry among market participants. Thus,
the role of managerial incentives in the context of this dissertation can be depicted
as follows (Figure 1.1):
• compensation• organization• ownership
managerialincentives
firmbehavior
product-marketcompetition
intensityof rivalry
managerialactions
Figure 1.1 Causal link from organizational characteristics to intensity of rivalry.
Managerial incentives are a theoretical construct that link organizational charac-
teristics with managerial actions. Compensation systems, organizational structure,
and ownership affect the payoffs of the manager, which encourages certain actions
rather than others. The value of introducing the incentives concept is that it high-
lights the idea that organizational characteristics drive actions indirectly through
their effect on managerial payoffs, rather than directly.
A feedback loop from rivalry to incentives could exist if it is assumed that firms
take the effects on competition into consideration when designing their managerial
2Firm behavior is defined as the subset of managerial actions that commit the firm vis-à-vis itsenvironment, for example, through input contracts or through prices posted.
5

incentives. Thus, the feedback loop is based on the endogeneity of incentives to
their anticipated effects on competition and performance. In other words, realizing
the effect of incentives on competition, firms may shape their managers’ incentives
so as to benefit from the competitive effect of the incentives. The feedback loop is
expected to be most salient in oligopolistic contexts, in which strategic interaction
is most relevant.
Obviously, many other factors, not included in the figure above, influence com-
pensation schemes, organizational structure, and ownership on the one hand, and
the intensity of rivalry on the other. These factors, such as corporate strategy, ef-
ficiency and effectiveness considerations, agency concerns, industry characteristics,
and regulatory environment, are treated as exogenously determined. The focus and
boundaries of this study can therefore be depicted as follows (Figure 1.2):
corporatestrategy
agencyconsiderations
efficiency,effectiveness
industrycharacteristics
regulatoryenvironment
organizationalform
organizationalform
incentives & rules
incentives & rules
competitivebehavior
competitivebehavior
Figure 1.2 The focus and boundaries of this dissertation.
The interaction between incentives and competition is the focus of this disser-
tation, while the influences that lie outside the rectangle are considered exogenous
to this study. The solid arrow from incentives to competition signifies the causal
link between these two concepts, while the dashed line in the opposite direction
represents the feedback loop, which endogenizes organizational characteristics.
The behavioral assumption of the actors used in this study is economic ratio-
nality. Actors, i.e., owners, managers, etc., are assumed to act as if they rationally
maximize their utility function. Consequently, while acknowledging the potential
importance of psychological or sociological aspects of managerial incentives, this
dissertation does not elaborate on them.
6

This dissertation is structured as follows. A review of the theoretical and empir-
ical literature on the strategic role of managerial incentives is included in Chapter
2. Chapter 3 contains a theoretical investigation of strategic incentives theory, ex-
ploring the interaction between organizational design and competitive interaction.
In Chapter 4, an empirical test of strategic incentives theory is carried out, using
data from the Texas hotel industry to examine the link between ownership forms
and competitive behavior. Chapter 5 provides a conclusion and discussion.
7

2. Literature Review
In this chapter, the literature on strategic incentives is reviewed. The theoretical
and empirical literatures are explored in turn.
2.1. Theoretical Strategic Incentives Literature
First, we discuss three papers that are considered the seminal articles in this litera-
ture. Then, we briefly discuss the subsequent literature, focusing on various aspects
of strategic incentives, such as compensation schemes, ownership, and organizational
structure. Gimeno, Dial and Sengul (2001) provide a comprehensive review of the
strategic incentives literature. They show that this theory has relevance not only for
economic theory but also for management scholars and practitioners by providing
the possibility to create a competitive advantage.
Seminal papers. The seminal papers in the strategic incentives (also called
strategic delegation) literature are Fershtman and Judd (1987), Sklivas (1987), and
Vickers (1985) (hereafter referred to as FJSV). These authors show that firms that
compete in imperfectly competitive product markets may want to provide their man-
agers with incentives that are different from those aimed at achieving pure profit
maximization. More specifically, depending on the strategic nature of the product-
market competition, they may want to provide overly aggressive or overly soft in-
centives, benefiting from the strategic effect these incentives have on competition.
In other words, firms use incentives as a strategic commitment device.
Fershtman and Judd (1987), in their article “Equilibrium Incentives in Oligopoly”,
develop a two-stage model, with two firms. In the first stage, the firm owner deter-
mines the compensation scheme assigned to its manager. This scheme is a weighted
average of firm profits and sales. In the second stage, managers compete on the
product market. Competition can take either the form of strategic complements
(price competition) or strategic substitutes (quantity competition). Fershtman and
Judd show that, in equilibrium, owners incentivize their managers to produce more
than in a one-stage game if product-market competition takes place in strategic
8

substitutes, and to produce less if competition takes place in strategic complements.
In terms of the incentive scheme introduced by Fershtman and Judd, incentivizing
to produce more is achieved by putting a positive weight on sales, while a negative
weight on sales would provide the incentive to produce less. Defining aggressiveness
as the amount of output produced, one can restate the main conclusion of Fershtman
and Judd: the strategic use of incentive systems makes firms behave more aggres-
sively in the case of strategic substitutes and less aggressively in the case of strategic
complements.
The intuition behind this result is relatively simple and analogous to the Stack-
elberg reasoning. In the case of strategic complements, firm i wants to commit to
a high output, because this will decrease the output of firm j — because of strategic
substitutability — and firm i will benefit from a decrease in the output of firm j. In
the case of strategic complements, the opposite happens. Firm i wants to commit
to a high price (i.e., low output), because this will increase the price of firm j, which
is beneficial to firm i.
The effect of strategic incentives can be understood by analyzing the reaction
functions of the managers in the second stage of the game (adapted from Fershtman
and Judd). The one-stage and second-stage reaction curves are depicted in Figure
2.1.
C
q1
q2
A B
Figure 2.1 Incentives shift the managers’ reaction curves.
From the above figure, it can be seen that if firm 1 uses strategic incentives, while
firm 2 does not, firm 1’s output increases and firm 2’s output decreases (moving
from A to B). Thus, in this asymmetric case, firm 1’s profits increase, while those
9

of firm 2 decrease. However, if both firms use strategic incentives, they increase their
output and, therefore, both firms’ profits decrease. This is a typical example of the
prisoner’s dilemma that occurs in the case of strategic substitutes. Firms would be
better off not using strategic incentives, but it is in each firm’s individual interest
to use strategic incentives, whether the rival uses strategic incentives or not.
Although Fershtman and Judd is the most cited of the three FJSV papers, Vick-
ers (1985) was, in fact, the first paper published developing a strategic incentives
model. Vickers introduces a model in which the incentive scheme is a weighted
average of profits and output, rather than sales. The main conclusion (“more ag-
gressiveness in substitutes, less aggressiveness in complements”) also holds in the
Vickers setup. Interestingly, Vickers links strategic incentives with a number of ideas
that are followed up by subsequent research: relative performance evaluation (e.g.,
Salas Fumás, 1992), horizontal divisionalization (Faulí-Oller and Giralt, 1995), and
vertical integration (Chapter 3 of this dissertation). Vickers also discusses an inter-
esting implication of strategic incentives. If managers are incentivized to maximize
an objective function that differs from normal profit maximization, do firms behave
“as if they were seeking rationally to maximize their expected returns” (Friedman,
1953, p. 21)? Empirically, when one observes firm actions, one in fact analyzes
managers’ decisions. Vickers introduces the following terminology to explain this
paradox. The author distinguishes between the expression “x is a u-maximizer”
and “x maximizes u”. The first refers to x’s disposition, intention, or objective,
while the second refers to the effect or result that x tends to bring about (Vickers,
1985, pp. 138-139). Vickers notes that “in games, it is almost always the case that
u-maximizers do not maximize u”. In the case of strategic incentives, one could say
that even if the owner is a profit maximizer, the firm’s actions (as observed by an
outsider) may not show behavior that is expected from a profit maximizer.
Following the seminal work of FJSV, a large number of theoretical articles have
been published that apply the basic idea of strategic incentives theory on a number of
specific areas (Gimeno, Dial, and Sengul count 148 citations of Fershtman and Judd,
1987, by June 2001). Here, we briefly review the major contributions the literature
10
has made regarding three main concepts that are of interest for the theoretical and
empirical studies this dissertation encompasses: compensation schemes, ownership,
and organizational structure.
Compensation schemes. Compensation schemes used in the strategic incen-
tives literature include the weighted average of profits and sales or output, as in
FJSV, and relative performance evaluation, as discussed by Nalebuff and Stiglitz
(1983), Vickers (1985), Salas Fumás (1992), Faulí-Oller and Giralt (1995), Miller
and Pazgal (2002), among others. The basic idea that sets relative performance
evaluation apart from absolute performance evaluation is that the performance of
the manager is compared to the performance of another unit. This other unit could
be another division or department of the same firm (Faulí-Oller and Giralt, 1995),
a specific competitor, or a peer group or industry average (Salas Fumás, 1992).
Agency theory proposes a rationale for using relative performance evaluation by
arguing that it reduces the noise in the firm’s performance through the removal of
shocks that are common to the industry. To accomplish the beneficial effect of noise
reduction, the weight placed on the industry performance should be negative.
Relative performance evaluation is comparable to a weighted average of profits
and sales/output in the sense that it allows the owner to make the manager more
or less aggressive (more aggressive is defined, in accordance with the above, as
producing more output). More specifically, if the weight on the unit of comparison
is negative, the manager is incentivized to increase output, because increasing output
damages the competitors, which increases the relative performance. Agency theory
predicts the weight on rivals’ profits to be negative, but in principle, a positive
weight is possible, too. In the latter case, the manager is incentivized to maximize
industry profits (as well as firm profits), which obviously lowers the firm’s output.
It is not surprising that the fundamental conclusion of strategic incentives holds in
the case of relative performance evaluation: the strategic use of relative performance
evaluation makes firms behave more aggressively in the case of strategic substitutes
and less aggressively in the case of strategic complements (Salas Fumás, 1992).
An interesting aspect of compensation schemes is that the type of compensation
11

scheme used determines the specific way in which a firm’s owner can shift the man-
ager’s reaction curve. The traditional scheme of a weighted average of profits and
sales/output moves the reaction curve in or out but does not change the slope of the
reaction curve. In contrast, the use of relative performance evaluation allows the
owner not only to change the intercept but also the slope of the manager’s reaction
curve. Other compensation schemes, in which the degree of control by the owner
increases further, also exist. Miller and Pazgal (2001) define a class of games in
which the owner has unrestricted, independent control over the manager’s reaction
curve, which means that the owner can independently determine the slope and the
intercept of the reaction curve. These authors show that the degree of control is
positively related to the number of equilibria (as the degree of control rises, a mul-
tiplicity of equilibria occurs). An extreme case of response function manipulation is
input control, in which the incentive is geared to taking a particular input choice.
This is equivalent to a horizontal or vertical response function. This case is de-
scribed by Fershtman, Judd and Kalai (1991), who conclude that all price-output
combinations satisfying the demand function are equilibria.
The main conclusion of increasing aggressiveness in strategic substitutes (and
decreasing aggressiveness in strategic complements) could thus be reversed by giv-
ing the owner a high degree of control over the manager’s reaction curve. Indeed,
Fershtman, Judd and Kalai show that perfect (noncooperative) collusion can be
achieved in their case, which means a complete reversal of the standard aggressive
outcome in strategic substitutes. In Chapter 3, we analyze the occurrence of the
same phenomenon — decreased intensity of rivalry rather than the expected increase
in rivalry in strategic substitutes — in a different context.
Ownership. Ownership affects who is the residual claimant, and therefore it
affects managerial incentives. For example, vertically integrating versus separating
two firms that have a supplier-buyer relationship affects the incentives of the resid-
ual claimants (Williamson, 1985). The vertical integration/separation literature is
substantial, including such literatures as transaction cost economics and distribution
channels (see, for example, Coughlan, Anderson, Stern, and El-Ansary, 2001). Ver-
12

tical integration/separation has been studied in a strategic (i.e., oligopoly) context
by, among others, Bonanno and Vickers (1988), Coughlan and Wernerfelt (1989),
McGuire and Staelin (1983), and Moorthy (1988). Vertical separation is found to
have a softening effect on the intensity of rivalry. This is caused by the occurrence of
double marginalization, i.e., consecutive members of the distribution chain sell above
marginal costs, which drives up the price the final customer pays (Tirole, 1988, p.
174). Moorthy shows that firms may benefit from vertical separation (i.e., a man-
ufacturer uses an independent sales channel) if, and only if, products are demand
substitutes and competition takes place in strategic complements, or vice versa. To
explore the intuition, let us focus on the first possibility (strategic complements). If
firm i decentralizes, price i increases (due to double marginalization). Since compe-
tition takes place in strategic complements, in equilibrium, price j will also increase.
An increase of price j will benefit firm i because products are demand substitutes.
Note that prices increase, confirming the main strategic incentives conclusion of
softening in the case of strategic complements.
Organizational Structure. Vertical relationships in a strategic context have
been studied most notably within the industrial context, i.e., vertical integration and
separation, determined by firm ownership, rather than within the firm. However,
organizational structure also affects managerial incentives to the extent that division
or department managers are made responsible and are compensated for the divisional
or departmental performance. Chapter 3 illustrates an exception to this, as it studies
vertical decentralization within the firm. Another example of the study of strategic,
vertical relationships within the firm is Alles and Datar (1998). These authors
discuss the strategic use of transfer pricing within the firm. Transfer pricing is
typically associated with vertical decentralization, because accountability can only
be established if departments pay a transfer price for the services they enjoy or
products they buy from other departments. Alles and Datar let the CEO choose
the transfer price. Note that this is different from the vertical separation case, in
which there is obviously no CEO who determines the transfer price that maximizes
overall chain profits. In fact, in the Alles and Datar article, by determining the
13

transfer price, the CEO shapes the incentives of the sales manager, equivalently to
FJSV, who shape the manager’s incentives by changing the compensation scheme.
It is no surprise, therefore, that the main strategic incentives conclusion holds in
the Alles and Datar case: when competition takes place in strategic complements,
transfer prices are set above marginal costs, increasing the market price and, thus,
decreasing the intensity of rivalry.
The strategic effect of horizontal decentralization has been studied by, among
others, Faulí-Oller and Giralt (1995) and Sengul (2001). Faulí-Oller and Giralt study
two competing firms that each consist of two separate product divisions (i.e., hori-
zontal decentralization). They show that the firm provides cooperative incentives if
there are significant economies of scope, while competitive incentives are provided
in the case where the strategic effect overshadows the economies of scope (competi-
tion takes place in strategic substitutes). Sengul endogenizes divisionalization. He
argues that horizontal divisionalization increases the intensity of competition and
decreases the likelihood of new entry into the industry.
Strategic incentives and agency theory. Strategic incentives theory and
agency theory both analyze the role of managerial incentives in organizations. Using
an economic perspective, both theories study the behavior of managers (agents,
players) within the organization and how their behavior is influenced by incentives.
Incentives are used to make managers behave in a way desired by the firm’s owner.
These two theories, however, differ in an important number of ways. In agency
theory, incentives are used as a tool to align the interests of principals and agents
(i.e., firms and managers). Agency theory explores the trade-off between interest
alignment and risk sharing. In other words, profit incentives increase not only
interest alignment but also the risk for the — normally — risk-averse agent. As
such, uncertainty plays a crucial role in agency theory. Moreover, in agency theory,
information is asymmetric, because the principal does not observe the agent’s effort.
However, agency theory ignores competitive interaction between firms. It focuses
on the organization, and treats it as if it were the whole universe.
In contrast, in strategic incentives theory, incentives are not used to align inter-
14

ests between owners and managers in the same way as they are in agency theory.
In general, incentives are not directed at profit maximization, but in fact steer the
manager away from pure profit maximization, making him either more aggressive
or more cooperative than a pure profit-maximizing agent would be.3 Generally,
strategic incentives models do not allow for uncertainty, there is no asymmetric
information or moral hazard, and there are no effort costs. Strategic incentives
theory thus ignores the agency problem, while agency theory ignores competitive
interaction.4
Obviously, without any uncertainty, the strategic use of incentives would not be
possible. As Fershtman and Judd state, “if we had no uncertainty about the ex post
state of the market, then our analysis would be unconvincing since there would be
no justification for ignoring quantity- or price-indexed contracts that would force
the usual Cournot and Bertrand outcomes” (1987, p. 930). At the same time,
uncertainty is typically not modeled in the strategic incentives literature, while it is
a crucial ingredient in any principal-agent model.
In contrast to this general rule, some articles dealing with strategic incentives
have allowed for uncertainty, thus combining the strategic incentives and agency
theories. Aggarwal and Samwick (1999) add uncertainty to a typical strategic in-
centives model to show that the main features of strategic incentives also hold in
the presence of agency problems. Other work that incorporates uncertainty in the
strategic incentives context include Bhardwaj (2001), Hermalin (1994), and Salas
Fumás (1992). Interestingly, Hermalin shows that the agency problem may lead to
heterogeneity in incentives with which managers are provided. In Chapter 3, we
analyze heterogeneity in incentives in a different context.
3It could be argued that agency theory and strategic incentives theory look at two incentivedimensions that are orthogonal. Agency theory considers fixed pay versus performance dependentpay (“aggressive” or “high-powered” could be used to mean performance dependent). Strategicincentives theory considers incentives that move away from profit maximization, for example basedon relative performance, or profits and sales (“aggressive” means more competitive than pure profit-maximization).
4Gimeno, Dial, and Sengul (2001) provide a conceptual framework that links incentives, effi-ciency, competitive interaction, and performance. They argue “we would expect efficiency consid-erations to be limiting factors in the pursuit of strategic delegation” (p. 25).
15

Strategic incentives and commitment. A key idea in strategic incentives
theory is that incentives are used as strategic commitments. Besanko, Dranove, and
Shanley (2000) argue that there are three necessary conditions for commitments to
have a strategic effect: visibility, understandability, and credibility/irreversibility.
Thus, incentives may not have a strategic effect if they are unobservable, not un-
derstood, or easily reversible. Whether this is true empirically, obviously depends
on the specific situation. The observability of compensation contracts is confirmed
in the literature (for example, Slade, 1993). The observation of ownership and or-
ganizational structure does not seem problematic. Moreover, Katz (1991) argues
that even unobservable contracts allow for the strategic use of delegation, because
of the observability of the agents’ actions. We argue that organizational structure
and compensation systems are embedded in the organization, and, therefore, not
easily reversible.
2.2. Empirical Strategic Incentives Literature
The empirical evidence on the strategic effect and use of incentive systems has
been scant, with an emphasis on some of the hypotheses mentioned above, while
others have been ignored (see also Gimeno, Dial, and Sengul, 2001). As described
in the Introduction, the main focus of strategic incentives theory is the interaction
between incentives and competition in two ways: from incentives to competition (do
incentives affect competition?), and the feedback loop from competition to incentives
(is the strategic effect taken into account, i.e., do competitive characteristics shape
incentives?). Here, we briefly review the main findings of the empirical literature,
specifying whether the link is from incentives to competition, or the other way
around. To our knowledge, no paper has yet simultaneously studied both links.
For a classification of the empirical strategic incentives literature, please refer to
Appendix A.
Compensation schemes. The (empirical) interest in compensation schemes
originates from fields other than strategic incentives theory. Agency theory, for
instance, has prompted a continuing interest in compensation schemes and manage-
16

rial incentives. For example, Gibbons and Murphy (1990), Janakiraman, Lambert,
and Larcker (1992), Aggarwal and Samwick (1999), Chopin (1999), Joh (1999) all
empirically assess the existence of relative performance evaluation as a managerial
incentive system. The conclusions are mixed: some assert that relative performance
is used in managerial compensation, while others assert the opposite. Only a few,
however, explicitly study compensation in a strategic context. For example, Ag-
garwal and Samwick, and Joh find that the relative performance parameter (the
weight µ placed on the industry performance) depends on concentration, linking
competitive characteristics with compensation schemes (µ decreases as concentra-
tion increases). As far as we know, there is no empirical evidence of the reverse
link, from compensation to rivalry (e.g., relative performance evaluation increases
the intensity of rivalry and decreases prices). This is remarkable because, arguably,
the effect of compensation schemes through managerial incentives on competition
is at the heart of strategic incentives theory. One may thus say that the core of
strategic incentives remains yet untested. One of the objectives of this dissertation
is to propose a study that fills this empirical gap.
Ownership and channel structure. In the industrial organization literature,
there is a long tradition of studying vertical control and its impact on competition,
market power, market foreclosure, social welfare, etc. (see, for example, Tirole,
1988). It is not surprising, therefore, that there are several empirical studies deal-
ing with the link between channel structure and competition. Lafontaine and Slade
(1997) review this literature. Graddy (1997) and Kalnins and Lafontaine (1996)
study fast-food franchise chains, Shepard (1993) and Slade (1998b) study the retail
gasoline industry, while Slade (1998a) studies the beer market (pubs) in the UK.
Several of these studies find (some) support for the assertion that vertical separation
increases retail prices. This effect could be attributed to strategic incentives theory:
vertical separation is used as a strategic device to commit to high prices with the
objective of encouraging rivals to increase their price, too. However, the simple fact
that prices are higher when vertical separation is compared with vertical integration
does not necessarily imply that incentives are used in a strategic manner. Double
17

marginalization may increase retail prices, even in the absence of strategic inten-
tions (Tirole, 1988, p. 174). Contrasting company-owned outlets with independent,
vertically separated outlets thus amounts to introducing a wholesale price that is
above marginal cost, which naturally has an increasing effect on the retail price.
In the research design of the study that is proposed here, we aim at avoiding the
compound of strategic incentives effects and double marginalization.
Kalnins and Lafontaine (1996) study the reverse link: how do competitive char-
acteristics affect integration/separation? They conclude that franchising is used for
reasons other than those proposed by strategic incentives theory. Slade (1998b)
explores the link from demand characteristics to vertical control: the difference
between own- and cross-price elasticity positively affects the likelihood of vertical
separation. This could be interpreted as evidence of the competition-incentives link,
because the strategic benefit from vertical separation is positively correlated with
this difference.
Organizational structure. Articles that address organizational structure gen-
erally do not link it with competition. For example, Hill, Hitt, and Hoskisson (1992)
analyze the fit between diversification strategy and organizational design. A notable
example is a study of the movie industry by Corts (2001). This author finds that
companies that release two movies in the same season take the negative externality
(risk of cannibalization) into consideration, whether the movies are produced by the
same or different divisions within the same company. Thus, in this case, division-
alization does not affect managerial behavior — there is no supporting evidence for
strategic incentives theory.
2.3. Conclusion and Definitions
The literature on strategic incentives is appealing because it connects the study of
the inside of the firm (organizational theory and organizational economics) with a
study of the outside of the firm (competitive strategy). Research during the past
15 - 20 years has created a strategic incentives literature that expands the idea of
using organizational characteristics to commit strategically to a broad variety of or-
18

ganizational characteristics and industrial settings. However, we conclude that the
literature generally focuses on one specific characteristic, such as compensation or
organizational structure, and, thus, ignores a possible interaction between organiza-
tional characteristics. In the next chapter, we aim to contribute to the literature by
investigating this interaction, while discussing topics that have been raised in this
section, such as heterogeneity in incentives, and degree of control. We will show
that the interaction of organizational characteristics may reverse the outcome, de-
creasing the intensity of rivalry rather than increasing it, as is expected in the case
of strategic substitutes.
Relative to the theoretical literature, empirical research has been sparse. There
is some evidence of the use of compensation schemes that deviate from profit-
maximization, but it is not sure whether this is for strategic or other reasons. Also,
there is evidence that vertical separation affects pricing decisions, but this might,
in some cases, be explained by non-strategic double marginalization. In Chapter 4,
we conduct an empirical test of strategic incentives theory that addresses these and
other concerns.
For clarity, we will list below definitions of some of the key concepts, in the list
below, that are used in this study.
• Complements/substitutes. A game is characterized by strategic comple-
ments (substitutes) if the equilibrium action of player j moves in the same
(opposite) direction, given a change in player i’s actions. The reaction curve
is upwards (downwards) sloping in the case of strategic complements (sub-
stitutes). Cournot (quantity) competition generally constitutes an example
of competition in strategic substitutes. Price competition with differentiated
goods can be either strategic complements or substitutes, depending on the na-
ture of the goods. If the goods are product substitutes, the actions are generally
complements, and, if the goods are complements, the actions are substitutes.
• Decentralization/centralization. Decentralization is delegation of author-ity to (partially) independent units within the firm (either horizontal, i.e.,
19

divisions, or vertical, i.e., departments). Centralization is defined as the situ-
ation in which no delegation of authority takes place.
• Incentives. Stimulus that influences (managerial) actions. For example,
compensation schemes affect the payoffs managers obtain in conjunction with
a certain course of action. Therefore, compensation schemes shape managers’
incentives.
• Intensity of rivalry. The intensity of rivalry is a mapping from concentrationto (elasticity-adjusted) price-cost margins (“toughness of price competition”,
Sutton, 1991, p. 9). For example, given a certain level of concentration, the
intensity of rivalry increases as prices decrease, volumes increase, etc.
• Soft/aggressive. Incentives are called aggressive (soft) if they encourage
behavior that increases (decreases) the intensity of rivalry. (Also, the terms
cooperative and competitive are used).
20

3. Theoretical Investigation of Managerial Incentives and Com-
petitive Interaction
3.1. Introduction
In this chapter, we study the relationship between firms’ organizational design and
interfirm rivalry. Specifically, we explore how the inside of the firm–its actors,
organization, and compensation systems–and the outside of the firm–product-
market competition between rivals in the same industry–are interrelated. The
objective of this study is to better understand both the forces shaping rivalry and
those shaping organizational design.
A stream of economic research, referred to as strategic incentives theory, has
examined how managerial incentives affect competitive interaction. The seminal
papers in this field are Fershtman and Judd (1987), Sklivas (1987), and Vickers
(1985). Typical strategic incentives models consist of a two-stage game. In the first
stage, firms determine some element of the organizational design, e.g., the man-
agers’ compensation schemes or the organizational structure; in the second stage,
managers compete in an imperfectly competitive product market.5 Organizational
design serves as a commitment device, credibly binding the firm to more or less
aggressive behavior. The main conclusion from this stream of research critically de-
pends on the nature of competition. When firms choose output and, hence, choices
are strategic substitutes, the firm wants to motivate its manager to be more ag-
gressive and to increase output in order to decrease the output of rival firms. In
contrast, when managers choose prices and, hence, choices are strategic comple-
ments, the firm wants its manager to be less aggressive and to increase the firm’s
price, which, in turn, leads rival firms to increase their prices. While the intensity of
rivalry thus diminishes in the case of strategic complements, in the substitutes case,
5The literature may use different terms for what we call firms. Fershtman and Judd (1987)use the term owners, distinguishing them from managers. Agency theory usually uses the termsprincipal and agent. Finally, in the organizational literature, the entity that determines structureand incentives is usually described as the head office. We will use the more neutral word, firm,and have a body in mind that cares about firm profits and sets the organizational structure andthe managerial incentives.
21

the strategic use of organizational design leads to a prisoner’s dilemma; both firms’
desire to commit to high output results in excessive aggressiveness and reduced firm
and industry profits.
In their seminal paper, Fershtman and Judd (1987) explore the case in which
managers’ compensation is based on a weighted average of profits and sales. In stage
1, the firm determines the relative weight on profits and sales. Stage 2 is a Cournot
quantity game. The authors show that firms, in equilibrium, provide a positive
weight on sales, thus making managers behave more aggressively, i.e., sell more
products at a lower price. A central notion in this stream of research, dating back
to Schelling (1960), is that firms may gain from distorting their managers’ incentives
relative to profit maximization because of its effect on strategic interaction.
The effect of structure on managerial behavior has been studied mostly in the
context of channel structure, rather than organizational structure (e.g., McGuire
and Staelin 1983, Moorthy 1988, Bonanno and Vickers 1988). In the first stage, two
firms choose whether to sell their products through retailers (separation) or market
the products themselves (integration). In the case of separation, firms subsequently
set a wholesale price. In the last stage, retailers compete in strategic substitutes
or complements. Because of double marginalization, vertical separation effectively
increases prices, decreases output, and, hence, softens competition. However, in the
case of strategic substitutes, vertical integration generally dominates separation,
because firms prefer to commit to being aggressive.
A potential shortcoming of the extant literature is that each paper studies com-
pensation systems or organizational structure in isolation. Arguably, this may result
in misleading conclusions, because firms typically make decisions about both their
managerial remuneration system and their organizational structure. If the interac-
tion between compensation systems and structure is nontrivial, the combination of
these two organizational features may generate unexpected results.
Consider, for example, the electronics company, Philips. Between 1970 and 2000,
this company went through seven large restructuring processes, changing from na-
tional organizations, via a matrix organization, to global product divisions. These
22

structural modifications were followed by changes in the responsibility and account-
ability of the organization and the implementation of different performance incentive
systems. While many other examples are known of large organizations that have
changed their organizational structure and compensation systems, such as IBM,
Chrysler, and BP, organizational design involves choices about both structure and
incentives in virtually all business organizations.
The questions that are addressed in this chapter are the following. How does the
combination of organizational structure and compensation systems affect competi-
tion, and how does competition affect these two elements of organizational design?
Does a multifaceted organizational design create the opportunity to avoid the pris-
oner’s dilemma that occurs when either structure or remuneration systems are stud-
ied in isolation? Does the simultaneous endogeneity of structure and compensation
systems lead to firm homogeneity, as suggested in previous research, or does it en-
courage firms to differentiate their organizational form, resulting in firm heterogene-
ity? In this chapter, we explore these specific questions while acknowledging that
many other factors such as organizational complexity and bounded rationality–not
modeled in this chapter–affect the optimal design of business organizations.
To further our understanding of the relationship between the inside and the out-
side of the organization, we develop a model in which both organizational structure
and managerial compensation systems are endogenized. In the model, two firms
first determine whether their organizational structure is vertically centralized or
decentralized, i.e., whether the production and marketing departments are treated
as a single profit center or as two distinct profit centers, having the autonomy to
make operating decisions (Williamson, 1985). Subsequently, firms choose whether
to use relative performance evaluation as a basis for their managerial remunera-
tion system. Relative performance evaluation is a compensation scheme in which
the performance of the manager is compared to an external benchmark by placing
a–typically negative–weight on the rivals’ profits (see, for example, Holmström,
1979, in an agency context, and Salas Fumás, 1992, and Miller and Pazgal, 2001,
in a strategic incentives context). Some form of relative performance evaluation, or
23

competitor orientation, is used frequently as an objective in compensation schemes.
For example, the use of external benchmarks in the case of executive compensation
is well documented (Aggarwal and Samwick, 1999). The use of market share objec-
tives is also considered a competitor-oriented compensation scheme, because it is a
function not only of the sales of the own firm, but also of the sales of rival firms.
Market share is one of the most commonly used objectives for sales organizations
(see, e.g., Dalrymple and Cron, 1995; Kaplan, 1996). An example of a firm that has
used competitor-oriented objectives for business unit managers is General Electric,
which used the mantra “number 1 or number 2” for individual businesses.6 In the
third stage of the model, the production and marketing departments negotiate the
transfer price used to establish the performance of each profit center. This stage ob-
viously only takes place if the decentralized structure is implemented. The last stage
of the model is Cournot quantity competition. Thus, the model is a non-repeated
multi-stage game with simultaneous moves.
We find that the interaction of organizational structure and compensation sys-
tems is nontrivial and may reverse previously found results. While centralization
typically dominates decentralization in strategic delegation games, in the equilib-
rium of this model at least one firm is decentralized. If the production department
has enough bargaining power for there to be sufficient double marginalization, this
decentralization softens competition to such an extent that profits are higher, not
lower, than Cournot profits. Moreover, otherwise identical firms may choose different
organizational designs, leading to asymmetric subgame-perfect equilibria: one firm
chooses to decentralize, and places a negative weight on rivals’ performance, while
its centralized rival uses a positive weight. This endogenous firm heterogeneity is
associated with a further diminished intensity of rivalry, approaching the maximum
industry profits, despite the perfectly noncooperative setting. Thus, even though
organizational structure and managerial reward systems may each, in isolation, have
6Another example of the use of competitor-oriented objectives for middle-level managers is thehotel industry, where sales managers of hotel establishments are typically rewarded based on the“Revenue per Available Room Index”, which is calculated in comparison with the other hotels inthe same market (based on the Smith Travel Research STAR report).
24

a detrimental effect on firms’ profits, the combination of these two elements of or-
ganizational design may actually increase profits.
A way to understand the underlying mechanism of this study is by examining the
quasi-reaction curves of the managers when they compete in the final stage of the
game. More specifically, one may explore how firms influence managerial behavior
through the manipulation of managers’ reaction curves. In the literature, many
different degrees of control over reaction curves have been identified and studied.
On the one hand, there is very limited, or no, control over the reaction curves
in studies such as Fershtman and Judd (1987), Salas Fumás (1992), or standard
Cournot. On the other hand, studies such as Fershtman, Judd, and Kalai (1991)
and Miller and Pazgal (2001) investigate the characteristics of delegation games in
which firms have far less restricted control over managers. Miller and Pazgal study
games in which the firm can independently control the reaction function’s slope and
intercept. They show that any solution, e.g., the collusive outcome, to the demand
system is an equilibrium of such a game. By allowing managers’ actions to depend
on both their own and on their rivals’ compensation schemes, Fersthman, Judd, and
Kalai also find an equilibrium that yields the collusive outcome.
This study is motivated by both streams of research. Organizational designs
that are composed of two elements rather than a single one confer more control
over managers’ behavior. While choices of organizational structure and remunera-
tion systems increase the level of control, they do not allow firms to independently
set reaction curves, as will be explained in detail below. This study thus focuses on
how different elements of organizational design may extend the control over manage-
ment. At the same time, by distinguishing between organizational decisions taken
centrally and decentrally, the study also highlights the limits of this control. For
example, whereas the firm in this model determines organizational structure and
compensation schemes, decisions about the transfer price and output quantity are
taken decentrally and may or may not be in line with the firm’s direct objectives.
Moreover, the use of decentralization and transfer pricing creates an internal con-
flict, and, thus, inefficiencies from the firm’s point of view. The strategic use of these
25

organizational inefficiencies lies at the heart of this study. The present study well
complements another recent theoretical paper that examines the deliberate design
of organizational inefficiencies (Balasubramanian and Bhardwaj, 2004). These au-
thors conclude that “the firm’s resulting profits in this setting of [internal] conflict
can be higher than those obtained when the decisions of the managers are perfectly
coordinated” (p. 489).
This chapter is organized as follows. In Section 3.2, we introduce the model.
Section 3.3 contains an analysis, a discussion, and some special cases of the model.
The results are discussed in Section 3.4. The proofs of the propositions are included
in the appendices.
3.2. Model
There are two firms, indexed i = 1, 2. The stages of the model are as follows.
In stage 1, the firms simultaneously decide whether to centralize (Oi = C) or to
decentralize (Oi = D). The outcome of this stage determines whether transfer
pricing (stage 3) takes place. In stage 2, the firms determine the weight µi placed on
relative performance in the marketing managers’ contracts. In stage 3, if the firm
is decentralized, a transfer price wi is determined through negotiations between the
production and marketing managers. In stage 4, the marketing managers set the
output quantity qi. The market price P of the homogenous good is determined by
the total output quantity Q = q1+ q2 and market demand. Inverse demand is given
by P = a− bQ, a > 0, b > 0. The production costs of firm i are given by cqi, where,
for simplicity, c = 0. The stages of the model are depicted in Figure 3.1.
owner:organizational
structure Oi
owner:incentivesystem µi
production /marketing:
transfer price wi
marketingmanagers:output qi
1 2 3 (optional) 4 t→
Figure 3.1. Stages of the model.
We provide some additional information and notation for each stage.
26

Stage 1. Decentralization is modeled as vertical separation in production and
marketing departments, rather than horizontal separation in product divisions. This
choice allows us to draw insights from and contribute to both the vertical integra-
tion/separation and the strategic incentives literatures. If the organizational struc-
ture is centralized, i.e., the production and marketing departments are combined
and managed by the same manager, no transfer pricing takes place. The organiza-
tional structure thus affects the marginal costs as perceived by the manager who
decides the market quantity. While the perceived marginal costs equal the transfer
price in the case of decentralization, in the case of centralization the perceived and
actual marginal costs do not differ.
Stage 2. Following Salas Fumás (1992), the incentive contract for the marketing
managers of firm i = 1, 2 has the following form:7
IMi = πMi + µiπj.
Here, πMi are the profits of the focal marketing department, πj (j 6= i) are the profits
of the rival firm, and µi ∈ < is the weight put on the rival’s profits.8 Departmentalprofits are defined as follows: πMi = (P − wi)qi and πPi = (wi − c)qi (thus, πMi +
πPi = πi). For simplicity, the production manager has a contract based on absolute
performance, rather than relative performance (i.e., IPi = πPi ).
A positive value for µi is expected to make marketing manager i less aggressive,
i.e., set a smaller output quantity, because he or she is rewarded for an increase in the
rival’s profits. In the extreme case, if all firms in an industry could credibly commit
7Following Fershtman and Judd (1987), one could write a manager’s reward scheme as ADi +
BDi I
Di for some constants AD
i , BDi , where B
Di > 0 and the superscript D stands for the respective
department (P = production, M = marketing). Since the manager is risk-neutral and efforts arenot modeled in this paper, he or she maximizes IDi , regardless of the value of A
Di and BD
i .8As a matter of definition, the unit of comparison for the performance of each marketing de-
partment could be either the rival firm as a whole, or the rival marketing department specifically.This choice does not affect the incentives of the manager, because marketing manager i maximizesπMi +µMi πj , where πj could be defined either as qjP −qjc or qjP −qjwj . Since qj , c, and wj are alltreated as constants when marketing manager i solves the optimization problem, both expressionsyield the same outcome. The outcome of the game is thus independent of this choice. In thepresent model, the marketing department’s performance is compared to the performance of therival firm as a whole, which facilitates the analysis of the model.
27

to setting µi = 1, the collusive outcome, in which industry profits are maximized,
would be attained. A negative value for µi obviously has the opposite effect, because
the reward increases as the rival’s profits decrease. Finally, µi = 0 would lead to
an incentive that is equal to absolute performance evaluation, putting no weight on
the performance of other firms in the industry. While agency theory has provided a
rationale for using relative performance evaluation to reduce the effect of common
noise (e.g., Holmström, 1979), this study focuses on the effect of these schemes on the
manager’s behavior in competition, as proposed by Salas Fumás (1992). We explore
relative performance evaluation with external benchmarks, whereas Faulí-Oller and
Giralt (1995) study internal comparison between product divisions.
Stage 3. Because the production and marketing departments are at the same
time autonomous and mutually dependent, transfer pricing is necessary to determine
the profitability of each department and to achieve accountability. A widely used
practice to determine transfer prices is through negotiation (Kaplan and Atkinson,
1998; Vaysman, 1998). While the bilateral bargaining game is not explicitly mod-
eled, it is assumed that the production department receives a fraction α ∈ [0, 1] ofthe surplus, leaving a fraction 1− α for the marketing department (Van Mieghem,
1999).
The lower bound of the bargaining outcome is given by the minimum transfer
price that is acceptable to the production department, which are the marginal costs
of production. The maximum transfer price that is acceptable to the marketing
department would in theory be the transfer price at which the marketing department
would make zero profits. However, it is Pareto inefficient to increase the transfer
price to a level higher than what would maximize the production department’s
profits. Consequently, the upper bound of the bargaining outcome is given by the
transfer price that maximizes the production department’s profits.
The transfer price of firm i is thus assumed to be
wi = αwoi + (1− α)c,
28

where α is an exogenously given parameter, which is equal for both firms, and woi is
the transfer price that maximizes the profits of production manager i. If both firms
are decentralized, woi is determined as the Nash equilibrium of the simultaneous move
by the production managers. If only one firm is decentralized, woi is determined as a
the maximum of a single-player optimization problem. If a firm is centralized, this
stage is omitted (i.e., the transfer price is equal to marginal costs).
The exogenous parameter α can be interpreted as the relative bargaining power
of the production department vis-à-vis the marketing department (Van Mieghem
1999).9 If α = 1, the production manager has all the bargaining power and sets
a transfer price that will maximize the production department’s profits. If α = 0,
all the bargaining power resides at the marketing department, which then pays a
transfer price equal to marginal costs. Note that this latter case is equivalent to cen-
tralization. The bargaining parameter α could thus be interpreted as a continuous
measure of the degree of decentralization.
Whereas Alles and Datar (1998) study transfer prices that are determined by
the CEO, in our case transfer prices are thus set in a decentralized fashion. Kaplan
and Atkinson (1998) acknowledge that decentrally-negotiated, linear transfer prices
may lead to a suboptimal level of output from the firm’s point of view. Dual-rate
transfer prices (two-part tariffs) could solve this problem, but, according to Kaplan
and Atkinson, are rarely used in practice. This study explores whether these internal
inefficiencies could soften oligopolistic competition to the benefit of the focal firm.
Stage 4. Marketing manager i chooses output qi to maximize IMi = πMi + µiπj.
The sequence of the modeling stages reflects the time horizon of the decisions
that are made at each stage. In most cases, the choice of organizational structure
represents a long-term decision, as costly to reverse as a major bricks and mortar
investment. The design and implementation of a managerial compensation system
represents a medium-term decision, which may be changed more often than the
9The relative bargaining power of the production and marketing departments could be seen asdepending on the value added of each department in the value chain. Another, complementary,perspective is to assert that bargaining power depends on the administrative heritage of the com-pany (Bartlett and Ghoshal, 1989). While, in some companies, production traditionally plays amore important role, in other companies marketing, historically, is more dominant.
29

organizational structure. Note that a change in the organizational structure gener-
ally necessitates a restructuring of compensation schemes, while the opposite is not
true. Transfer prices are typically determined once a year, while output decisions
are short-term decisions that are taken on a day-to-day basis.
The model used in this chapter is a game of complete information. We as-
sume, for example, that incentive contracts can be observed by all the involved
parties. Whether this is true empirically obviously depends on the specific situa-
tion. In studying strategic incentives in the gasoline industry, Slade (1993) argues
that incentive contracts are observable, and could, therefore, be used as a strategic
commitment device. Moreover, even if information is incomplete, our results may
still hold. Katz (1991) studies a principal-agent model with unobservable contracts,
and concludes that these contracts may have commitment value in spite of their
unobservability.
3.3. Equilibrium Analysis
In this section, we first analyze the case in which organizational structure is endog-
enized but compensation systems are treated as exogenously given (Section 3.3.1).
Then, we endogenize the compensation system for exogenously given organizational
structures (Sections 3.3.2 - 3.3.6). Finally, we present and discuss the overall so-
lution to our model, endogenizing both organizational structure and compensation
systems (Section 3.3.7).
Separately analyzing the special cases of our model allows us to link the present
model to the existing literature, to create a benchmark with which the solution
of the overall model can be compared, and to provide intuition for the building
blocks of the model. Moreover, in some specific real-life situations, special cases of
our model may be more applicable than the overall model. As mentioned earlier,
the choice of organizational structure represents a long-term decision, while the
compensation system could be modified in the medium term. Whereas strategic
consequences of organizational design are the focus of this study, many operational
rather than strategic considerations may influence the choice of organizational form.
30

Thus, when evaluating different compensation schemes, senior management may
take the existing organizational structure in certain circumstances as given.
3.3.1. Endogenization of Organizational Structure
Throughout this section, we assume that there is no relative performance evaluation,
i.e., µi = 0.10 Two firms choose whether to be centralized or to be decentralized,
in which case the marketing department pays a negotiated transfer price to the
production department. The outcome of this game could be that both firms are
centralized (denoted OiOj =dCC, where the superscript “b” signifies that µi = 0),both are decentralized (denoted dDD), or that one firm is decentralized, while the
other is centralized (denoted dDC). Equilibrium values are denoted throughout this
chapter with the superscripts OiOj, where i represents the focal firm and j the rival
firm.11
The question we address here is as follows. How does the choice of organizational
structure affect the market outcome, specifically in terms of firm profitability?
Proposition 3.1. Suppose that there is no relative performance evaluation, i.e.,
µ1 = µ2 = 0.
(i) Two decentralized firms have profits that are higher than those of two central-
ized firms, for 0 < α ≤ 1.
(ii) There is a unique value of α ∈ (0, 1), such that two decentralized firms attainthe collusive outcome, absent explicit coordination.
(iii) The subgame-perfect equilibrium of this case is that both firms are centralized
(CC), eliminating the softening effect of decentralization.
10This special case of our model can be seen as a reinterpretation of the study of vertical integra-tion and separation by, among others, McGuire and Staelin (1983), Bonanno and Vickers (1988),and Moorthy (1988). Our case is different in that we consider vertical separation within a firm(called vertical decentralization), as opposed to vertical separation between firms.11For example, qCD is the equilibrium output quantity of a centralized firm with a decentralized
competitor. Further, bqCD is the equilibrium output quantity of a centralized firm competing witha decentralized firm, in the absence of relative performance evaluation.
31

It is well-known that vertical separation creates a negative externality (double
marginalization) that reduces output. The positive effect on price is confirmed in a
number of empirical studies (discussed in Lafontaine and Slade, 1997). This effect
also holds in our situation of vertical decentralization within a firm. We now discuss
the possible cases (dCC, dDD, and dDC) in turn.
If both firms are centralized, transfer pricing does not take place, the value of α
is not relevant, and the standard Cournot outcome obtains for all α. If both firms
are decentralized and α = 0 (i.e., the sales manager has all the bargaining power),
the transfer price is equal to marginal costs and, therefore, decentralization does not
affect the incentives of the sales manager. Consequently, similar to thedCC case, thestandard Cournot outcome obtains. However, as α gets larger (i.e., the bargaining
power of the production manager, relative to the marketing manager, increases),
the transfer price becomes larger, which inflates the marginal costs as perceived by
the marketing manager, and output decreases. Since the industry output in the
standard Cournot context is larger than the monopoly output, the output reduction
caused by decentralization has a positive effect on industry and firm profitability.
In fact, there exists a value for α (denoted by bα), such that, when both firms aredecentralized and α = bα, industry profitability is maximized (each firm obtains halfof the monopoly profits). For bα < α ≤ 1, the reduction effect is so large that theindustry output is less than the perfectly collusive output, and profitability declines
(remaining, nevertheless, larger than standard Cournot).
If one firm is decentralized, while the other is centralized, the centralized firm
obtains profits that are higher than those of the decentralized firm; the decentralized
firm’s output reduction benefits the centralized firm, while hurting the decentralized
firm. As α increases, the difference between the centralized and decentralized firms’
profits increases.
Solving the special case that µi = 0 by backwards induction shows that each firm
wants to centralize, independent of the structure of the rival (indeed, bπCD > bπDD andbπCC > bπDC for 0 < α ≤ 1). Centralization is thus the dominant strategy, anddCC isthe subgame-perfect equilibrium. The general conclusion of the strategic incentives
32

literature–increased aggressiveness in the case of strategic substitutes–thus holds
in this special case of our model. We find that firms choose to be centralized,
although decentralization could increase profits up to the level of perfect collusion.
The intuition behind this result is that firms want to commit to aggressive behavior
knowing that this will soften the rival’s behavior, given the substitutes nature of
competition. However, since both firms simultaneously decide to centralize, industry
and firm profits decline relative to the decentralization case. This is an example of
the well-known prisoner’s dilemma. In the absence of explicit collusive agreements,
firms cannot avoid a mutually detrimental outcome.
3.3.2. Endogenization of Compensation Systems: CC-subgame
We now endogenize compensation systems, while treating the organizational struc-
ture as given. In this section, we discuss the situation in which both firms are
centralized. This section thus considers a subgame of the overall model (referred to
as the CC-subgame). Section 3.3 deals with the case that both firms are decentral-
ized (the DD-subgame). The case in which one firm is decentralized while the other
is centralized (the DC-subgame) is discussed in Section 3.4. Hence, the question
addressed in this section is as follows. How does the use of relative performance
evaluation affect the market outcome?
Proposition 3.2. Suppose that both firms are centralized.
(i) In the continuum of solutions that are subgame-perfect equilibria, the incentive
parameter used satisfies the following expression:
µ1 = −1 + µ21− 3µ2
, with µi <1
3.
(ii) The use of relative performance evaluation increases industry output and de-
creases industry profits, relative to the standard Cournot outcome.
The model in this section is equivalent to the special case of the model in Salas
Fumás (1992) where managers are assumed to be risk neutral. An effective way
33

to understand the intuition of this result is by examining a graph in which the
managers’ (quasi-)reaction curves and the firms’ isoprofit curves are depicted (Figure
3.2). In the figure, the standard Cournot outcome (point C) is compared to the
outcome that obtains when firms can use relative performance evaluation for their
managers (point S).
0.00
0.05
0.10
0.15
0.20
0.25
0.30
0.35
0.40
0.45
0.50
0.00 0.05 0.10 0.15 0.20 0.25 0.30 0.35 0.40 0.45 0.50 0.55 0.60 0.65 0.70 0.75 0.80
q1
q245o
R2
R1R1’
π1
S
π2
R2’
C
Figure 3.2. Relative performance evaluation increases equilibrium output.
R1 and R2 are the standard, downward-sloping Cournot reaction curves. The
use of relative performance evaluation rotates the manager’s reaction curve around
the intersection with the firm’s own quantity axis. The use of relative performance
evaluation with µi < 0 makes the managers’ reaction less sensitive to changes in the
rival’s output (i.e., R01 is steeper than R1 and R02 is flatter than R2). The reason
for this is that as qj increases firm j becomes more vulnerable to firm i’s actions,
providing the incentive to firm i’s manager to increase output, which partially offsets
the standard negative relationship between qi and qj in Cournot competition. The
managers’ reaction curves are given by the following expression:
Ri : qi(qj;µi, α) =a
2b− 12(1 + µi)qj.
34

Note in Figure 3.2 that in point S firm i has rotated Ri in such a way that, at the
intersection of R0i and R0j, R
0j is tangent to firm i’s isoprofit curve, which ensures that
the profits of firm i are maximized, given R0j.12 In the unique symmetric solution
to the CC -subgame (point S), µ1 = µ2 = −13 and the equilibrium output is larger
than in Cournot. This result confirms the conventional wisdom that firms that are
competing in strategic substitutes have the incentive to make their managers more
aggressive.
As pointed out by Salas Fumás (1992), apart from the symmetric equilibrium
depicted in Figure 3.2, there are also asymmetric equilibria in which (µi, µj) =
(−1, 0). In this case, Rj and R0j coincide, while Ri is zero sloped with regards
to its own axis, because the positive relative performance effect exactly offsets the
standard negative Cournot effect, given that the sum of the weights on πi and πj
equals zero (IMi = πi − πj). As µi < −1, Ri becomes upward sloping: the relative
performance effect dominates the standard Cournot effect. Thus, the use of relative
performance evaluation makes it possible that the game changes from competition
in strategic substitutes to competition in strategic complements.
Salas Fumás (1992) shows that (µi, µj) = (−1, 0) yields the Stackelberg outcomewith firm i being the leader. The total industry output Q and profits Π are the
same in the described symmetric and asymmetric solutions: Q = 3a4b, Π = 3a2
16b. In
Appendix B, we show that there is in fact a continuum of solutions, as stated in
Proposition 3.2., in which Q = 3a4b.
In summary, while relative performance evaluation (at least in theory) creates
the potential for firms to collude through positively weighing the rival’s profits in
the manager’s objective function, in equilibrium at least one of the firms provides a
negative weight on the profits of the rival firm. Relative to standard Cournot with-
out relative performance evaluation, industry output increases and industry profits
decrease. Hence, equivalent to the case discussed in Section 3.3.1, endogenizing
12The profits of Firm 1 (2) increase in the southeast (northwest) direction. The isoprofit curvesare zero sloped with regards to their own axis when they intersect the Cournot reaction curve:since reaction curves depict the optimal value of qi given qj , a change in qi without changing qjlowers πi.
35

compensation systems leads to a prisoner’s dilemma, decreasing each firm’s profits.
3.3.3. Continuum of Solutions in Salas Fumás
Salas Fumás (1992) mentions the unique symmetric equilibrium and two asymmetric
equilibria. (These asymmetric equilibria are characterized by µi = 0 and µj = −1,resulting in qi = a
4band qj = a
2b). However, it turns out that there is a continuum of
asymmetric solutions. Each point on the line q1+q2 =3a4bis an equilibrium (positive
qi imposes µi <13). In the figure below, one can verify that for each point on the
line q1 + q2 =3a4bthe isoprofit curve Πi is tangent to the reaction curve Rj (for
i 6= j = 1, 2), which is the condition for the existence of an equilibrium.
0.10
0.15
0.20
0.25
0.30
0.35
0.40
0.45
0.50
0.01 0.07 0.13 0.19 0.25 0.31 0.37 0.43 0.49 0.55 0.61 0.67 0.73 0.79
q1
q245o
R2
R1
π1
R2’
R2’’
Asymmetric Nash equilibrium
q1 + q2 = C
Figure 3.3 Continuum of solutions in Salas Fumás set up.
3.3.4. Comparing Salas Fumás with Fershtman and Judd
The Cournot-Nash equilibrium in the Fershtman and Judd (1987) setting is more
aggressive than the one in the Salas Fumás setting. The equilibrium quantity in
Fershtman and Judd is qFJi = 2a5b(Fershtman and Judd, 1987, p. 932), while the
equilibrium in Salas Fumás equals qSFi = 3a8b(see Appendix B). Geometrically, one
36

can easily verify why qSFi < qFJi . Note, for example, that the rotation due to relative
performance evaluation makes RSF2 flatter than RFJ
2 . In equilibrium, Rj must be
tangent to the isoprofit curve of Firm i. Note also that the slope of Firm 1’s isoprofit
curve decreases as one moves down the 45o line toward the Cournot equilibrium (at
which point the slope equals 0). Thus, the fact that RSF2 is flatter than RFJ
2 results
in a simultaneous move Cournot-Nash equilibrium which is closer to point C. In
Figure 3.4, the two equilibrium are compared.
0.10
0.15
0.20
0.25
0.30
0.35
0.40
0.45
0.50
0.01 0.07 0.13 0.19 0.25 0.31 0.37 0.43 0.49 0.55 0.61 0.67 0.73 0.79
q1
q245o
R2
R1 R1’
π1
Salas Fumas
π2
R2’’
Fershtman & Judd
R1’’
R2’
Figure 3.4 Fershtman & Judd versus Salas Fumás.
The economic interpretation of the ordering of qSFi and qFJi is as follows. Note
first that one must distinguish between a level and a slope effect of incentive schemes.
Both Fershtman and Judd’s and Salas Fumás’ incentive schemes increase the level
of aggressiveness. However, while the Fershtman & Judd incentive scheme does not
affect the slope of the reaction curve, Salas Fumás’ incentive scheme does. Specif-
ically, R1 becomes steeper and R2 becomes flatter under Salas Fumás. The slope
of the reaction curve could be interpreted as the manager’s sensitivity to the com-
petitor’s action. This means that, while the Salas Fumás incentive scheme makes
37

the managers more aggressive on average (level effect), the managers become less
sensitive to their competitor’s move (slope effect). The diminished sensitivity is the
result of two opposing effects of the competitor’s action. The first is the standard
strategic substitutes effect: as the action of the competitor increases, the optimal
action of the focal firm decreases. However, this effect is partially offset by the in-
troduction of relative performance evaluation. The manager gets rewarded not only
for increasing its own profits, but also for decreasing the rival’s profits. As the com-
petitor increases its output, it pays off more to hurt the competitor by increasing
one’s own output quantity. (In other words, the increase of the competitor’s output
makes the competitor more vulnerable to the focal firm’s actions). This second ef-
fect offsets part of the first effect, which makes the managers less sensitive to their
rival’s actions. The smaller sensitivity in the case of relative performance evaluation
explains why qSFi < qFJi .
3.3.5. Endogenization of Compensation Systems: DD-subgame
While decentralization makes firms behave less aggressively, decreasing output, rel-
ative performance evaluation (with µi < 0) has the opposite effect: it encourages
managers to behave more aggressively, increasing output. In this section, we analyze
the net effect of these two opposite forces. Is the effect of decentralization stronger,
reducing output, or does the belligerent effect of relative performance evaluation
prevail over decentralization, increasing output?
Proposition 3.3. Suppose that both firms are decentralized. The unique symmetric
subgame-perfect equilibrium is characterized as follows:
(i) If α = 0, the equilibrium is equal to the equilibrium of the CC-subgame.
(ii) As α increases from 0 to 1, µDD decreases monotonically from −13to −1.53,
wDD increases monotonically from 0 to 0.56a, qDD decreases monotonically
from 3a/8b to 0.30a/b, and πDD increases monotonically from 3a2/32b to
0.120a2/b.
38

(iii) There exists an αo ∈ [0, 1] such that if and only if α > αo, firm profits exceed
the profits in standard Cournot (πDD > πCournot).
The stages of the DD-subgame, discussed in this section, are as follows. First,
the owners simultaneously set the incentive contracts IMi for the marketing managers
by choosing µi. Subsequently, the production and marketing managers bargain over
the transfer price wi ≥ 0. Finally, the marketing managers determine the outputquantity that is put on the market qi ≥ 0.13We explore the intuition of this subgame in a similar graph as above. For sim-
plicity, we focus on firm 1’s profits and firm 2’s reaction curves. The reaction curves
at the last stage of the game are as follows:
Ri : qi(qj;wi, µi, α) =a− wi
2b− 12(1 + µi)qj.
While the incentive parameter µi rotates the reaction curves as before, the transfer
price shifts the intercept. In Figure 3.5 below, point S is the symmetric equilibrium
when two firms compete using relative performance evaluation but no decentraliza-
tion (CC-subgame). The points D, C, and E are equilibria in the DD-subgame for
different values of α.
13For a specific range of α, apart from the unique symmetric solution, there are also asymmetricsolutions. Even if these solutions form an equilibrium in the DD-subgame, they do not constitutea subgame-perfect equilibrium of the overall game. The (symmetric and asymmetric) solutions tothe DD-subgame are provided in Appendix B Section 3. The determination of the subgame-perfectequilibrium of the overall game is discussed in Appendix B Section 5.
39

0.00
0.05
0.10
0.15
0.20
0.25
0.30
0.35
0.40
0.45
0.50
0.00 0.05 0.10 0.15 0.20 0.25 0.30 0.35 0.40 0.45 0.50 0.55 0.60 0.65 0.70 0.75 0.80
π1
R2D
R2S
R2C
R2E
E
R2
q1
q245o
R1
S
C
D
Figure 3.5 DD-subgame equilibria for different values of α.
If α = 0, the transfer price is equal to marginal costs and decentralization does
not affect the incentives of the manager. Therefore, the equilibrium is equal to
the equilibrium of the CC-subgame (point S). For larger values of α, the impact
of transfer pricing increases, and the intercept of the reaction curve moves to the
origin.
How does the optimal value for the incentive parameter change as α increases?
Given the negative slope of R1, if µ2 would not change, the equilibrium would shift
in the southeast direction (i.e., q1 increases and q2 decreases). This would obviously
lower firm 2’s profits. By further decreasing µ2, firm 2 is able to shift the outcome
back in the northwest direction, increasing its profits. However, since the decrease
in µ2 has decreased the slope of R2, the equilibrium will fall at point D, rather than
at point S.14 Thus, the decrease in µ2 only offsets part of the output reducing effect
of decentralization and transfer pricing. Compared to the case in which both firms
14In equilibrium, the slope of R2 must be equal to the slope of firm 1’s isoprofit curve. Decreasingµ2 changes the slope of R2 toward zero as explained above. The slope of the isoprofit curve is givenby: ∂q2∂q1
|π1=C = 1−q2−2q1q1
, which changes toward zero if one moves over the 45o line in the directionof point C. (Note that in the Cournot Nash equilibrium the slope of each firm’s isoprofit curve iszero).
40
are centralized (CC-subgame), decentralization (DD-subgame) increases profits.
For larger values of α, the softening effect of decentralization further increases.
We denote αo the value of α for which πDD(α) equals the Cournot profits. If α =
αo, the total effects of decentralization and relative performance evaluation exactly
balance each other out. The equilibrium obtained is the Cournot outcome (point C),
µi = −1, and the slopes of the reaction curves are zero. For values of α larger thanαo, the softening effect of decentralization outweighs the aggressive effect of relative
performance evaluation and profits are larger than the profits that are attained in
standard Cournot (πDD > πCournot).
In summary, πDD(α) increases monotonically in α, with πDD(0) = πCC , πDD(α) <
πCournot for 0 < α < αo and πDD(α) > πCournot for α > αo.
3.3.6. Endogenization of Compensation Systems: DC-subgame
In Sections 3.2 and 3.3, we have discussed the cases where the firms are either both
centralized or decentralized. The case where one firm is decentralized (firm 1), while
the other is centralized (firm 2), is analyzed in this section. The questions we address
here are as follows. What compensation systems are adopted by the centralized and
decentralized firms? What is the market outcome?
Proposition 3.4. Suppose that one firm is centralized, while the other is decentral-
ized. The unique subgame-perfect equilibrium is characterized as follows.
(i) The centralized firm uses a compensation system that makes the manager be-
have less aggressively (µCD > 0). The decentralized firm uses a compensation
system that makes the manager behave more aggressively (µDC < 0).
(ii) Industry profits are maximized, i.e., total profits equal the monopoly profits
(πDC + πCD = πM).
(iii) The decentralized firm’s profits weakly exceed those of the centralized firm
(πDC ≥ πCD for 0 < α ≤ 1 with the equality holding if and only if α = 1).
41

The stages of this subgame are as follows. First, both firms determine the in-
centive contract IMi for the marketing managers by choosing µi. Second, firm 1’s
production and marketing managers bargain over the transfer price w1, while there
is no transfer pricing in firm 2 (equivalently, one can state w2 = c). Finally, the
marketing managers determine the output quantity.
Solving this subgame by backward induction yields the following expressions for
optimal output quantities in the last stage:
qDC =a− 2w1 − µ1
b(3− µ1 − µ2 − µ1µ2),
qCD =a+ w1 − aµ2 + µ2w1b(3− µ1 − µ2 − µ1µ2)
.
Since only one firm is decentralized, the second stage involves a one-firm optimization
problem, rather than a two-firm Nash equilibrium. The negotiated value of the
decentralized firm’s transfer price is given by: wDC = αa4(1 − µ1). Substituting
qDC , qCD, and wDC in the profit functions and solving the first order conditions
simultaneously yields the following expressions of the optimal incentive parameters:
µCD = 1; µDC = −4− α
α.
Substituting these values in the above expressions yields:
wDC = a,
qDC =a
4b(2− α),
qCD =a
4bα.
Thus, the total industry output and the market price for 0 < α ≤ 1, is given byQDC = a
2b= QM and PDC = 1
2a = PM , where the superscript M denotes the
monopoly outcome. If one firm is centralized and the other decentralized, in equi-
librium and independent of the division of bargaining power, the industry attains
the collusive or monopoly outcome. Thus, in an environment that is perfectly non-
42

cooperative and that is expected to make firms aggressive, tacit collusion occurs and
industry profits are maximized.
The firms’ equilibrium profits are given by πDC = a2
8b(2 − α) and πCD = a2
8bα.
The division of the industry profits between the two firms thus depends on the
parameter α. If α = 1, i.e., if the production manager has all the bargaining power,
profits are split evenly between the two firms: πDC = πCD = a2
4b. As α decreases, the
decentralized firm can set a more aggressive incentive structure and still compel the
centralized firm to behave in a collusive fashion: πDC > πCD.
The equilibrium of the DC-subgame is surprising. While prior research shows
that firms competing in strategic substitutes typically provide aggressive incentives
to their managers, we find that the centralized firm sets µCD = 1, which implies that
the manager of firm 2 is incentivized to maximize industry profits, rather than firm
profits. This compensation scheme rotates the manager’s reaction curve inward, as
shown in Figure 3.6. In contrast, the decentralized firm provides a highly aggressive
compensation scheme with µ1 < −1, which means that R1 is upward sloping. Inthe figure, two equilibria are shown. Point M represents the equilibrium for α = 1,
while point N depicts the equilibrium for 0 < α < 1. In both points M and N , the
perfectly collusive outcome is obtained. In point M , the collusive profits are shared
evenly, whereas the decentralized firm obtains more profits than the centralized firm
in point N .
43

0.00
0.05
0.10
0.15
0.20
0.25
0.30
0.35
0.40
0.45
0.50
0.00 0.05 0.10 0.15 0.20 0.25 0.30 0.35 0.40 0.45 0.50 0.55 0.60 0.65 0.70 0.75 0.80
π1
R2’
q1
q245o
R1’
M
C
R2
R1 R1’’
N
π2
Figure 3.6 DC-subgame for different values of α.
As can be seen from the figure, for different values of α R01 rotates around the
origin, while R02 does not depend on α. While the particular form of these reaction
curves may seem surprising, they are the logical consequence of simple assumptions,
such as decentralization, transfer pricing, and relative performance evaluation. To
understand the intuition, we discuss the ability of the firms to control the managers’
reaction curves. It will turn out that while firms in this model have more degrees
of freedom than in most previous research (i.e., organizational structure and com-
pensation schemes), there are still significant limitations to the level of control firms
have over their managers, which plays an important role in the determination of the
outcome.
When the firms determine the compensation schemes, i.e., µ1 and µ2, they foresee
the effect on transfer pricing and, ultimately, output decisions. Substituting the
equilibrium value of the decentralized firm’s transfer price (wDC = αa4(1− µ1)) into
44

the reaction curves yields the following expressions:
R1 : q1(q2;µ1, α) =a
2b− α(1− µ1)
a
8b− 12(1 + µ1)q2,
R2 : q2(q1;µ2, α) =a
2b− 12(1 + µ2)q1.
The effect of µ1 and µ2 on the slope of the reaction curves is as before. Note that a
negative value of µ1 decreases the intercept ofR1. Decreasing µ1 will, ceteris paribus,
shift market share from the centralized to the decentralized firm, which will induce
the production manager to increase the transfer price, which in turn decreases the
intercept. Changes in µ1 thus affect both the intercept and the slope of R1, while
the centralized firm can only manipulate the slope of R2.
It is clear from Figure 3.6 that the centralized firm cannot increase its profits
by changing µ2, given R01. A change in µ2 would rotate R2, which would shift the
equilibrium to a lower isoprofit curve. From the figure, it seems that the decentral-
ized firm would be able to profitably change µ1. However, it turns out that, for
given α between 0 and 1, the effect of a change in µ1 on the intercept would exactly
offset the effect on the slope, evaluated at the intersection with R2. For example, if
α = 1 and q2 =a4b, q1(q2;µ1, α) =
a4b(point M) independently from µ1. The same
holds for any other value of 0 < α < 1 (e.g., point N). In other words, given the
specific effect of µ1 on both the intercept and the slope of R1, the decentralized firm
is indifferent in its choice of µ1. However, in order to preclude the centralized firm
from defecting, only one value of µ1 is possible in equilibrium (i.e., µDC = −4−αα).
The equilibrium value of the decentralized firm’s transfer price is given by wDC =
a for 0 < α ≤ 1, where the demand parameter a equals the market choke price. Itseems unlikely that a transfer price that is as high as the choke price allows for
positive output by firm 1. However, the market price could be lower than the
transfer price without forcing firm 1 to shut down, because the incentive of the
marketing manager could be negative, i.e., IMi ∈ <. The participation constraint ofthe marketing manager requires that AM
i + BMi IMi be larger than, or equal to, the
reservation value of the manager, but does not impose restrictions on IMi .Moreover,
45

the use of relative performance evaluation makes firm 1’s marketing manager care not
only about the profits of firm 1, but also about the profits of firm 2. In particular,
since µDC < 0 for 0 < α ≤ 1, shutting down would benefit the rival firm, and
therefore diminish the compensation of the marketing manager of firm 1.
In Sections 3.3.2 - 3.3.6, we have discussed the three distinct subgames of the
overall model. In the next section, the subgame-perfect equilibrium of the overall
game, i.e., endogenizing both compensation systems and organizational structure,
is discussed.
3.3.7. Solution of the Overall Model
In the first stage of the overall model, the firms simultaneously determine the orga-
nizational structure, before the compensation schemes, transfer prices, and output
quantities are established. Given the optimal actions in the latter stages, one can
describe the first stage choices in a 2 x 2 matrix, containing the four subgames (CC,
DD, DC, and CD). The Nash equilibrium of this game constitutes the subgame-
perfect equilibrium of the overall game. The payoffs are summarized in the following
table.
Centralization Decentralization
Centralization (πCC , πCC) (πCD, πDC)
Decentralization (πDC , πCD) (πDD, πDD)
Table 3.1 Stage 1 firm payoffs.
The questions we address are as follows. If two competing firms simultaneously
establish first their organizational structure and second their compensation systems,
what structures and systems do they use? How does their choice affect the market
outcome?15
15For ease of exposition, we restrict the characterization of the subgame-perfect equilibrium tosymmetric strategies on the off-equilibrium path in the DD- and CC-subgames, without imposingsymmetry restrictions on the equilibrium subgame itself. The full, unrestricted characterization ofthe equilibrium is included in Appendix B Section 5.
46

Proposition 3.5. There exist a pair of values (αo, α∗) satisfying the property that
0 < αo < α∗ < 1, such that the subgame-perfect equilibrium outcome of the game
in which both organizational structure and compensation systems are endogenized is
characterized as follows.
Equilibrium outcome:
(i) If 0 < α < α∗, both firms are decentralized and use a negative incentive
parameter (µDD < 0).
(ii) If α∗ < α ≤ 1, one firm is decentralized and uses a negative incentive parame-ter (µDC < 0), while the other firm is centralized and uses a positive incentive
parameter (µCD > 0).
Equilibrium profits:
(iii) If 0 < α ≤ αo, both firms attain profits lower than, or equal to, standard
Cournot (π∗i ≤ πCournot).
(iv) If αo < α ≤ 1, both firms attain profits higher than standard Cournot (π∗i >πCournot).
We determine for each subgame whether it comprises a subgame-perfect equilib-
rium of the overall game. The CC-subgame does not constitute a subgame-perfect
equilibrium, because at least one firm in the CC-subgame would want to defect to
the DC-subgame, i.e., choose decentralization rather than centralization, because
πDC > πCC ∀α.The DD-subgame has a unique symmetric equilibrium and may have up to
four asymmetric solutions (i.e., µ1 6= µ2), depending on α (see Appendix B). The
asymmetric solutions can never constitute a subgame-perfect equilibrium of the
overall model, because, for 0 < α ≤ 1, the less aggressive firm (which has profits
smaller than the more aggressive firm) could always increase its profits by defecting
to the DC-subgame (πCD > πDDL ).
47

We define α∗ as the value of α for which the profits of the centralized firm in the
DC-subgame equal those of the symmetric DD solution, i.e., πCD(α∗) = πDD(α∗).
For 0 < α ≤ α∗, the symmetric solution to the DD-subgame constitutes a subgame-
perfect equilibrium of the overall model, because then πDD ≥ πCD. For α∗ ≤ α ≤ 1,the DC- and CD-subgames are subgame-perfect equilibria (πCD ≥ πDD).
The following figure shows how the profits of both firms in the equilibrium of
the overall model vary with parameter α.
α
π
0 1
collusion
standard Cournot
πDD
αo α*
DD DC
πCC
πCD
πDC
Figure 3.7 Equilibrium profits of the overall model.
Propositions 3.1 - 3.2 suggest that profits decrease if firms use a single element
of organizational design as a strategic commitment device. This is consistent with
previous research that consistently finds that, in the case of competition in strate-
gic substitutes, endogenizing organizational structure or compensation systems in
isolation increases firm aggressiveness and decreases profits. In contrast, we show
that endogenizing both organizational structure and compensation systems softens
competition and increases firm profits for αo < α ≤ 1. In the situation discussedin this study, the ubiquitous prisoner’s dilemma of strategic incentives is solved.
Moreover, if the effect of decentralization is sufficiently important, otherwise identi-
cal firms choose different organizational structures and compensation schemes, i.e.,
endogenous firm heterogeneity arises.
48

3.4. Discussion and Conclusion
The internal organization of a firm and the compensation schemes used for its man-
agement affect the incentives that guide managers’ decisionmaking. While previous
research has focused largely on internally-oriented decisionmaking, this chapter ex-
plores the effect of organizational design on decisions that directly influence product-
market competition. In this study, we aim to elucidate how internal characteristics
of firms, i.e., their organizational structure and compensation systems, affect the
interaction between firms.
One of the main conclusions of the strategic incentives literature is that the
strategic use of organizational design makes firms overly aggressive if they compete
in strategic substitutes. This finding is based on the notion that organizational
design is used as a commitment device, permitting the firm to benefit from its rivals’
reactions. One problem with these studies, however, is that organizational features
are studied in isolation, i.e., neglecting a possible interaction between them. This is
potentially misleading because firms typically face multiple, possibly interdependent,
decisions about their organizational design, such as the organizational structure and
reward systems.
In our model, organizational structure and compensation schemes are studied
simultaneously. Firms choose whether they operate in a centralized or in a ver-
tically decentralized form, i.e., delegating operational decisions to production and
marketing departments. Moreover, firms decide whether to use absolute or rela-
tive performance evaluation. In this setting, we show that the interaction between
organizational structure and compensation systems is nontrivial. Indeed, we find
that simultaneous determination of organizational structure and compensation sys-
tems may enable firms to tacitly collude and achieve the perfectly collusive outcome,
despite the noncooperative setting.
Firm heterogeneity is an important phenomenon in the strategy literature and,
to some extent, in the economics literature. For example, Hermalin (1994) aims
to find an answer to the question, “why otherwise identical firms choose different
incentives for their managers” (p. 518). One of our findings is that identical firms,
49

for certain parameter values, choose to be different. If the bargaining power of
the production department, in determining the transfer price that the marketing
department pays, is large enough, in equilibrium, one firm is centralized, while the
other is decentralized. Moreover, the centralized firm uses an incentive scheme that
encourages cooperation between the firms, while the decentralized firm encourages
its manager to compete fiercely.
It is interesting to note that the effect of the organizational structure, in the
asymmetric equilibrium, is opposite to that of the incentive schemes. Decentraliza-
tion, because of double marginalization, makes firms less aggressive, which is coun-
teracted by the aggressive incentive scheme with which the manager is provided.
Similarly, the firm with the more aggressive centralized structure has a softening
compensation arrangement. Indeed, in the extreme case where the production de-
partment has all the bargaining power, these effects cancel each other out, leading
to equal division of the collusive profits.
Another noteworthy facet of our model is that firm heterogeneity and perfor-
mance are positively associated: both firms’ profits are larger if the firms are struc-
tured differently than if they are similar in terms of organization and compensation
systems. The decreasing effect of various forms of differentiation on competition has
previously been established, for example product differentiation (Hotelling, 1929),
strategic dissimilarity (Gimeno andWoo, 1996), and differentiation of organizational
form, size, and therefore resource dependence (McPherson, 1983). To our knowl-
edge, a decreasing effect of organizational differentiation per se, i.e., heterogeneity
in organizational structure and managerial incentive schemes, on the intensity of
rivalry has otherwise not been established. This could be an interesting avenue for
future research.
The concurrence of organizational differentiation and diminished intensity of ri-
valry could be compared to a phenomenon that often occurs in competitive sailing.
Two boats sailing close to each other spoil each other’s wind exposure, slowing
down both vessels. If one boat tags–one firm chooses a different organizational
structure–the negative externality is removed. Subsequently, both boats may tag
50

again, sailing over different boards–firms use different incentive schemes–but aim-
ing for a common windward destination. In the end, the boats may reach the same
destination, but more rapidly than if they had chosen to sail similar routes. The use
of different organizational structures and incentive schemes may reduce competition
and increase profits, without necessarily benefiting one firm more than the other.
This study can be seen as a first attempt to build a mid-range theory of the in-
teraction between multifaceted organizational design and interfirm competition, po-
sitioned between the stream that limits attention to one element of organizational
design, such as Fershtman and Judd (1987), and the stream that explores unre-
stricted, independent-control delegation games, such as Miller and Pazgal (2001).
In this study, specific assumptions have been made about the elements of orga-
nizational design studied and the timing and information structure of the game.
Obviously, many other assumptions could be made to explore the generalizability of
our results in other multidimensional delegation games.
For example, the present model consists of a noncooperative, extensive game
with simultaneous moves. Alternatively, one may wonder what results would obtain
if cooperative, i.e., collusive, behavior were assumed, for example in stage 3, while
owners and marketing managers compete noncooperatively. It turns out that the
results are very similar whether noncooperative or cooperative behavior is assumed
in stage 3. The value of α∗, which delimits the DD-subgame from the DC-subgame,
is slightly less in the case of collusion between production managers than in the case
of noncooperative Nash equilibrium in this stage.
Another generalization of the model is to introduce asymmetry between the two
firms. For example, one may let the relative bargaining power of the production and
marketing departments differ for each firm, i.e., α1 6= α2 ∈ [0, 1]. In Figure 3.8, theequilibrium outcome of the overall model is depicted as a function of α1 and α2.
51

DC-equilibrium
α1
α2
0
1
1
undeter-mined
α1 = α2
un-deter-mined
π* < πCournot
DD-equilibrium
π* > πCournot
DD-equilibrium
Figure 3.8 The overall solution for α1, α2 ∈ [0.1].The DC-equilibrium obtains in the northeast region of the graph, while the DD-
equilibrium obtains in the remainder of the parameter space (except for a region
where the values of α are very different and the equilibrium is undetermined). In
the shaded area, the equilibrium profits in the overall game exceed those of standard
Cournot.
Other generalizations of the model could encompass the inclusion of more than
two firms, the modeling of other compensation schemes, or the study of price rather
than quantity competition. It is possible, although not sure, that the heterogeneous
equilibrium is not obtained if competition is modeled between more than two firms.
It seems, however, that the softening effect of decentralization will obtain in that
more general setting, because it relies on the very general double marginalization
effect. The use of other compensation schemes may lead to different results. A cru-
cial aspect of relative performance evaluation is that its use rotates reaction curves,
which is not the case in the profit-cum-sales setup of Fershtman and Judd (1987).
To the extent that other competitor-oriented compensation schemes, such as market
share incentives, rotate reaction curves, results similar to those found in this study
are to be expected when these schemes are used. Studying quantity competition was
particularly interesting in this model because it showed that organizational design
may dampen competition even in a situation that typically leads to overly aggressive
52

behavior. However, it would be valuable also to explore the effect of multifaceted
organizational design on price competition, which may lead to very different results.
Future research should further explore the relationship between multifaceted
organizational design and product-market competition. The use of different, and
potentially more general, assumptions could establish under what conditions the
main contributions of this study hold: endogenous firm heterogeneity and collusive
outcomes in a noncooperative context.
53

4. Empirical Investigation of Managerial Incentives and Com-
petitive Interaction
4.1. Introduction
Over the years, competitive strategy research has examined the dynamics of com-
petitive interaction, including market entry and exit, price rivalry, and other forms
of competitive engagement. This research typically depicts firms as unitary actors:
it is the firm that makes competitive decisions about the nature and intensity of
competitive behavior, with the objective of optimizing firm performance. This view
downplays the heterogeneity of internal organization within most firms. In most
organizations, competitive decisions are delegated to managers whose incentives
may be imperfectly aligned with the interests of the organization as a whole. For
example, with the growth of multiunit and multidivisional organizations in many
sectors of the economy, units operated by owner-managers may compete head-to-
head with units operated by professional managers of multiunit organizations. In
some situations, firms may even delegate competitive decisions to external inde-
pendent agents, dealers or franchisees, while their competitors delegate these same
decisions to managers inside the firm. Unfortunately, competitive strategy research
has not sufficiently explored the competitive interaction among firms with diverse
organizational forms.
Delegation of competitive decisions requires a parallel consideration of the design
of incentive and control systems. Incentive and control systems determine which de-
cisions or tasks are delegated, the limits of the delegated authority, and what the
explicit and implicit incentives are for the decision-maker. Inside an organization,
managerial incentives may be shaped by managerial compensation schemes, expec-
tations of career progression, span of control, administrative rules, organizational
structure and culture, and other organizational characteristics. Differences in in-
centive systems among organizations may lead to different competitive behaviors,
and may affect the outcome of competitive interactions. For example, managers
who receive incentives based on market share objectives may act more aggressively
54

in their market than those with strict financial goals (Gupta and Govindarajan,
1984). Managers may be rewarded for adhering to a corporate-wide pricing policy
or encouraged to adapt prices to local market conditions. Managers with incentives
based on unit performance rather than firm-level performance may be more willing
to engage in competitive actions that may cannibalize other revenue sources of the
firm (Christensen, 1997; Chandy and Tellis, 1998). When competitive decisions are
delegated to external agents, like franchisees or dealers, the explicit and implicit
incentives in the relationship determine the influence of the firm over these external
agents. Since these external agents are residual claimants, they have discretion over
those actions not explicitly contracted with the firm, and have strong incentives to
focus on their own performance.
Some organizational theories, such as transaction cost economics, agency the-
ory, organizational ecology, and contingency theory, have examined the outcomes
of competition among organizational forms. Usually, these theories propose adap-
tation and selection mechanisms whereby more efficient organizational forms are
selected by the environment. Yet, these theories have often glossed over how orga-
nizational forms may interact in oligopolistic competitive contexts. The argument
has been that competitive selection is determined by “economizing”, rather than
“strategizing” (Williamson, 1991). When the intensity of rivalry is exogenously
given, only superior efficiency determines the competitive success of organizational
forms. However, when organizational forms interact in oligopolistic competitive
settings, the organizational choices of a firm affect its competitive actions, the in-
tensity of competitive interactions in the market, and, ultimately, the performance
outcomes. Consideration of the strategic competitive effects of organizational forms
is important for understanding their ultimate performance, yet this dimension has
been largely ignored in the existing literature.
This study contributes to the literature by examining the effects of a particular
dimension of economic organization, ownership form, on the competitive behavior
of firms. We define ownership form as the allocation of ownership rights to the var-
ious activities that compose a firm’s extended value chain. Our research examines
55

whether the ownership form used by multiunit organizations has an effect on the
competitive behavior of organizational units in their local market. Multiunit orga-
nizations, ranging from multiunit retail chains to multi-divisional or multinational
corporations, are important to the economy (Greve, 2003), and have considerable
shares in some industries, like restaurants, retail, hotels, and auto services (Ingram
and Baum, 1997). These organizations may differ in the ownership form of their
units. For example, the local competitive activities of soft-drink companies are car-
ried out by bottlers, yet some bottlers are fully-owned by soft-drink companies, while
others are partially owned, and still others are independently owned. Multinationals
may have units that are fully-owned, joint ventures, or managed by independent for-
eign agents under contract. Retail chains may have units that are company-owned or
franchised. Here, we focus on the latter case, as we examine the effect of ownership
form of hotel units on their competitive behavior in their local market.
This chapter is the first to empirically investigate how incentive divergence,
caused by ownership forms, affects competitive behavior across different compet-
itive contexts. We test our hypotheses on a unique dataset that includes virtually
all hotels in Texas from 1997 to 2002, competing in over 800 local markets. The panel
data allow us to examine the relationship between ownership forms and competitive
behavior across a wide variety of competitive contexts, while controlling for alterna-
tive explanations and sources of unobserved heterogeneity. A better understanding
of the competitive consequences of ownership forms would allow firms to design orga-
nizations that are more effective at credibly carrying out their competitive strategy.
Moreover, in contrast with the current emphasis on efficient organizational design,
our view would allow firms to use ownership forms that effectively balance efficiency
and strategic benefits.
4.2. Research Design
As concluded in Chapter 2, the empirical investigation of strategic incentives theory
is scant. Three fundamental ideas are proposed by the theoretical development of
strategic incentives that form the basis for the specific hypotheses that will be tested:
56

1. Do managerial incentives affect product-market competition? More specifi-
cally, under what circumstances do incentives affect competition and in what
ways, exactly?
2. Do firms take the effect of incentives on competition and performance into
account, i.e., does a feedback loop exist? (In Figure 1.2, this feedback loop
is represented by a dashed line connecting competition back to organizational
form).
3. Do managerial incentives, mediated by competition, affect performance? More
specifically, under what circumstances will incentives improve profitability?
The purpose of this empirical study is to address, at least partially, these three
fundamental questions. Given the objective of this study, the following structural,
heterogeneity, availability, and significance requirements that have to be dealt with.
1. Structural requirements
1.1. Product-market competition. Competition must take place in the form of an
oligopoly. In a monopoly or perfectly competitive situation, strategic interac-
tion does not occur, and strategic incentives theory is thus not applicable.
1.2. Product homogeneity. The product must be sufficiently homogeneous to make
cross-market price comparison possible. For example, using supermarket data
could be difficult, because product-mix effects may mask the strategic incen-
tives effect. (Firm-fixed effects could partially alleviate this problem if we
obtain longitudinal data).
2. Heterogeneity requirements
2.1. Heterogeneity in incentives. Heterogeneity (variance) is necessary to obtain
significant results that can either confirm or invalidate the predictions of the
tested theory. Heterogeneity may arise from the following sources: (1) fran-
chise fee (independent — franchised — company-owned), (2) ownership/governance
57

issues (profit maximizing versus mutual ownership, independent versus company-
owned), (3) (executive) compensation schemes, and (4) organizational struc-
ture (transfer pricing, divisional structure, double marginalization).
2.2. Heterogeneity in competition. There should be enough variance in prices. A
regulatory authority should not determine prices.
3. Data availability requirements
3.1. Competition data. First preference: price. Other options: entry/exit, quan-
tity, product “location”, cannibalization (time between releases), etc. Com-
petition data is generally perceived as being relatively sensitive; firms often
do not want their competitors to be aware of all their moves. Regulation of
the industry may be helpful to ensure the existence and public availability of
competition data.
3.2. Incentives data. Incentives data, such as compensation, is perceived as being
even more sensitive than competition data, because of its private (personal)
character. It may therefore be very difficult to obtain managerial incentives
information from multiple companies that are in direct competion. An alter-
native is to gather information about franchising, ownership, organizational
structure, and to infer managerial incentives from these data. As a further al-
ternative, executive compensation data for top-level managers can be obtained
relatively easily.
4. Significance requirements
4.1 Localized competition. For significant results, we need to obtain data from 50
or more markets. Localized competition would be optimal because the similar
markets can be compared. Examples of localized competition are gas stations,
hotels, and restaurants. Examples of competition that is not localized are
financial instruments such as stock markets, and global oligopolies such as the
aircraft industry.
58

4.2. Longitudinal data. Significance can be improved if we obtain data over mul-
tiple periods, assuming enough inter-period heterogeneity.
In the light of the above-described data requirements, four alternative data-
gathering methods are compared and evaluated: industry specific, cross sectional,
compensation consultants, and survey approach.
1. Industry-specific approach. Examples of industries that seem suitable for
empirically testing strategic incentives theory include car retailing, hotel in-
dustry, banking, video rental, and the cellular industry. Benefits: industry-
specific data allows for specific controls, and an appropriate setting can be
chosen. Drawback: generalizability.
2. Cross-sectional approach. A cross-sectional approach would make use of
public sources such as Compustat, CRSP, Forbes, ExecuComp, etc. The com-
pensation of top-level companies that are listed on the stock market is publicly
known. Benefit: data availability is good (cheap, easy). Drawback: it may
be difficult to theoretically link executive compensation and product-market
competition. This is specifically true for large, diversified companies (note
that most companies that are listed on the stock market are diversified). Data
about branch managers is typically not available. The banking industry may
be an exception to this rule, because of regulation.
3. Obtain data from compensation consultants. Consulting firms, such
as Hay Consultants, systematically gather data about management compen-
sation. Benefit: these data tend to be fine-grained and available both from
top-level and middle management. If the data cover multiple industries, the
results could be more generalizable than in the case of the industry-specific ap-
proach. The data may be costly to acquire. Drawback: it is not sure that the
data that are available identify specific companies in specific markets (without
this, it is not possible to link incentives data to compensation data). To study
competitive interaction, we need to obtain compensation data of firms that
compete in the same market.
59

4. Survey approach. A survey could be sent to several companies competing
in the same industry, requesting compensation data for middle and top man-
agement, but also including other items such as perceptions about competitors
and competition. Benefit: in the case of gathering primary data, we can struc-
ture the survey in such a way that it is tailored to the specific needs of this
study. Drawback: it may be difficult to obtain access to companies, especially
if these companies are direct competitors.
We have explored the above-described methods, using different information sources
and focusing on different industries. We have found that an industry-specific ap-
proach, using the Texas hotel industry as a setting, was most promising in terms of
satisfying the identified requirements.
4.3. Theory Development
4.3.1. Ownership Forms and Competitive Behavior
Ownership may affect competitive behavior to the extent that ownership shapes the
incentives of managers that take competitive decisions. Ownership could relate both
to vertical relationships, i.e., regarding upstream suppliers and downstream buyers,
and horizontal relationships, i.e., regarding various units supplying similar goods in
the different local markets or segments.
Economics has studied how vertical ownership forms affect competitive behav-
ior. For example, Spengler (1950) argues that a vertically integrated monopolist
charges a lower price than two vertically adjacent monopolists. The reason is that
the downstream monopolist purchases the goods at a margin above costs and thus
applies a profit margin on top of the margin at which the goods were purchased.
This results in an accumulation of margins, referred to as double marginalization.
In the absence of competition, double marginalization will increase the price for the
end consumer to an inefficiently high level. This effect occurs in any situation in
which both firms have some form of market power. There has been ample empirical
support for this argument. For example, Muris, Scheffman, and Spiller (1992) find
60

that consumer prices were higher for systems of independent bottlers than in the
case of integrated soft-drink bottlers.16
Differential competitive behavior depending on the horizontal ownership form
emerges if some form of spillover exists. Spillovers are present if the behavior of
one unit affects another unit, in terms, for example, of its reputation or demand.
Examples of this phenomenon include both negative and positive demand spillovers.
A low price at one unit could increase demand, not only for that unit but also for
other units that belong to the same chain (positive demand spillover). Alternatively,
a low price at one unit could cannibalize demand of other closely located units that
are perceived as substitutes (negative demand spillover). In the case of indepen-
dently owned units, the spillover is treated as an externality, while the spillover
effect is internalized in the case of multiunit ownership, where the same owner owns
both units. The presence of demand spillovers consequently creates a difference in
competitive behavior depending on the unit ownership (Lafontaine, 1999).
Another spillover that may affect competitive behavior is free riding. The quality
reputation of a single unit could affect the reputation of the chain as a whole, which
is internalized if the units belong to the same owner, but treated as externality
if that is not the case (see, for example, Martin, 1988). Agglomeration effects
between closely located establishments are discussed in Chung and Kalnins (2001).
In conclusion, both vertical and horizontal ownership changes could potentially affect
the competitive behavior of individual units.
4.3.2. Strategic Incentives Theory
The value of commitment as a way of strategically influencing one’s competitors has
been a crucial topic of research in competitive strategy and game theory (see, for
example, Ghemawat, 1991). A commitment that is both observable and irreversible
limits the action space of an actor, which affects the payoffs of its rivals and, ulti-
mately, the optimality of its rivals’ reaction possibilities. In game theory, Stackelberg
games show how a leader can use commitment to benefit from the strategic reaction
16For a review of the determinants and effects of vertical integration, see Perry (1989).
61

of the follower (Fudenberg and Tirole, 1991).
Commitment can take many forms. Schelling (1960) discusses the use of delega-
tion of authority to an agent as a means to credibly commit to a certain course of
action. He provides the example of a negotiation in which one party sends a dele-
gated agent as opposed to participating personally in the negotiation. By choosing
an “irrational” agent, a rational player could credibly commit to an action that
would otherwise not be credible. Therefore, the strategic use of delegation creates
the possibility to influence the reaction of competitors in ways which would otherwise
not be possible.
Vickers (1985) explores the implications of the concept of strategic delegation for
the theory of the firm. He points out that while owners are typically assumed to have
profit maximizing incentives, the same does not necessarily hold for the managers
who populate a firm. The presence of delegation within firms could allow them to
benefit from strategic effects that would otherwise not be possible. In sum, Vickers
argues that “the separation of ownership and control of a firm may be a good thing
for the owners, because non-profit-maximizing managers may earn higher profits
than would profit-maximizers” (p. 139).
The idea of strategic incentives within the boundaries of the firm has subse-
quently been modeled formally by Fershtman and Judd (1987) and Sklivas (1987).
In these game-theoretical models, in the first stage, owners determine the incentive
schemes of their managers, and in the second stage, managers compete in a product
market. These papers show that the optimality of the incentives provided in the
first stage critically depends on the nature of strategic interaction in the second
stage. Two different, and in many respects opposite, forms of strategic interaction
can be distinguished. In the first one, firms have an incentive to commit to aggres-
sive behavior, because that would preempt the competitors. In the second, it is
beneficial for firms to commit to accommodating behavior, because that would lead
to an accommodating response from the competitor.
A typical example of a competitive context which encourages aggressive behavior
is investment in production capacity. If the size of a market is limited, the optimal
62

investment of a newly entering firm is negatively related to the already existing ca-
pacity. Thus, aggressive behavior leads to preemption. Incumbent firms can take
advantage of this by investing at high levels of capacity, which will reduce the new
capacity invested by the entrant, or even completely deter entry. Fershtman and
Judd (1987) and Sklivas (1987) show that owners will encourage their managers to
behave aggressively and invest extensively to discourage investment by their com-
petitors.
Price competition in differentiated goods without significant threat of new entry
is a typical example of a situation in which actions do not move in the opposite,
but in the same direction. A price decrease originated from a competitor should be
followed by a price decrease of the focal firm to avoid a significant loss of market
share. Likewise, a price increase by a competitor increases the residual demand
of the focal firm, which induces the focal firm to increase its price, too. Thus,
accommodation is followed by accommodation and aggressiveness by aggressiveness.
Standard oligopoly theory shows that prices in the case of price competition in
differentiated goods are typically lower than the monopoly prices that maximize firm
profits (Vives, 1999). This means that firms could increase their profits if they were
able to raise prices collectively. However, each firm individually has the incentive to
lower prices to capture a larger share of the market. Promising to increase prices
is not credible because of each firm’s individual incentive to renege on this promise.
If a firm were able to commit to increase its price — or equivalently to refrain from
discounting — its competitors would be expected to follow and increase their prices
too. This strategic reaction would increase the profits of the focal firm. Thus, in
the case of price competition in differentiated goods, firms would want to commit
to setting high prices with a view to increasing the average industry price.
While Fershtman and Judd (1987) and Sklivas (1987) focus on the strategic use
of incentives within the firm, strategic incentives theory is not limited to incentives
that reside within the boundaries of the firm. Bonanno and Vickers (1988) examine
the strategic effect of changes in incentives due to vertical integration and separation.
The next section discusses how strategic incentives theory applies to ownership forms
63

in the context of multiunit organizations.
4.3.3. Context: Multiunit Organizations
In this chapter, we hypothesize about how strategic incentives theory applies to mul-
tiunit organizations. Multiunit organizations, which have recently been discussed
extensively (e.g., Ingram and Baum, 1997; Greve and Baum, 2001; Greve, 2003) are
defined as organizations, such as restaurants, hotels, retail chains, and multination-
als, that operate in multiple markets through several distinct units. One reason for
this enlarged research interest may be the realization of the rapidly growing impor-
tance of this kind of organization. Ingram and Baum (1997) suggest that “chains
will eventually come to dominate every service industry that is characterized by
some direct contact between customers and organization” (p. 69). Greve and Baum
(2001) point out that multiunit organizations are not only prevalent in service indus-
tries, but are also frequent in the manufacturing sector. Another important reason
for the surge in research interest in multiunit organizations is the challenge this
organizational form poses for conventional theory. Greve (2003) points out that the
multiunit form highlights the shortcomings of theories that are based on the premise
of organizations as unitary actors in a unitary environment. Multiunit organizations
face an interesting interplay between cross-unit learning and competitive behavior.
Moreover, as noted by Greve, multiunit organizations have more strategic choices
than other organizational forms.
The relevant literature on multiunit organizations can broadly be divided into
two groups. The first is concerned with the question of what the benefits and draw-
backs of multiunit organizations are in comparison with single unit organizations. In
their study of the Manhattan hotel industry, Ingram and Baum (1997) examine the
benefits and drawbacks of chain affiliation. They argue that chains can improve the
local unit’s competitive situation by providing resources, reputation, and market
power. Ingram (1996) highlights the tension for multiunit organizations between
consistency for the chain as a whole and local adaptation. He suggests that the
multiunit organization form can solve the problem of free riding through a credible
64

commitment to superior quality levels.
The second stream of research on multiunit organizations is focused on the dif-
ferences between ownership forms within the multiunit organization, i.e., the choice
between company-owned and franchised units. This choice is affected by the differ-
ential characteristics of these two ownership forms regarding the ability to monitor
local managers and the incentive for local managers to free ride on brand-name
capital and firm specific assets (e.g., Bergen, Dutta, and Walker, 1992; Brickley
and Dark, 1987). Another argument for the use of franchising is that the relative
ease of obtaining franchisee labor and capital facilitates rapid growth for starting
firms (e.g., Combs, Michael, and Castrogiovanni, 2004). The relationship between
the franchisor and franchisee is governed in a franchising contract. The contract
typically specifies the fees the franchisee should pay, including an initial fee, and
royalty, marketing, and reservation fees. In a traditional franchise, the franchisor
sells a (semi-)finished good to the franchisee, while in the case of business format
franchising, the franchisee obtains the right to use the franchisor’s trade name and
business plan.
In sum, competition among multiunit organizations as a distinct type of orga-
nizations that recently received heightened attention in the organizational theory
literature, provides an interesting context for a study of the relationship between
ownership form and competitive behavior. Another theoretical mechanism, which
has not yet received sufficient scholarly attention, linking ownership form and com-
petitive behavior, focuses on the effect of ownership form on the commitment to
particular competitive responses. The application of strategic incentives theory is
discussed in the next section.
4.3.4. Effect of Ownership Form in Multiunit Organizations on Compet-
itive Behavior
Strategic commitment through ownership form. Multiunit organizations
generally operate in local markets in retail or service industries in which goods are
65

differentiated and the main dimension of competition is pricing.17 As described
above, in this context firms can increase their profits by committing to set high
prices. The main difficulty is developing a credible commitment mechanism that
signals an irreversible change in the degrees of freedom for the focal firm.
Ownership form in multiunit organizations is a means to create a strategic com-
mitment device because it affects managerial incentives and is both observable and
costly to reverse. However, the ownership forms multiunit organizations may use
— franchising and corporate ownership — differ significantly in the way they affect
competitive behavior.
The franchising ownership form entails a full and contracted delegation of author-
ity to the local unit, i.e., the franchisee. While the brand owner can impose certain
guidelines aimed at guaranteeing a consistent level of quality throughout the chain,
the franchisor cannot require specific competitive behavior from the franchisee. In
the United States, this autonomy is well anchored in legal contexts prohibiting the
franchisor to interfere in the competitive behavior of the franchisee.18
In light of this, the imposition of a royalty fee is the only way to influence the
competitive behavior of the local unit. In a variety of industrial contexts, franchised
units have been found to set higher prices than company-owned units, arguably
due to double marginalization (see Lafontaine and Slade, 1997, for a review of this
literature). This effect holds both in the case of traditional franchising, where the
franchisee purchases a (semi-)finished good from the franchisor, and in the case of
business format franchising, where the franchisee pays a royalty fee for the use of
a trademark. In the latter case, it is crucial to note that royalty fees are typically
a percentage of revenues rather than a percentage of profits (Lafontaine and Shaw,
17Multiunit organizations also operate in manufacturing industries in which capacity is crucialto competition. The possibility to apply strategic incentives theory to understand the relationshipbetween ownership form and competitive behavior is not limited to the case of price competition.In the case of capacity competition, the logic of strategic incentives theory is the same, but theprovided incentives would be the opposite. For simplicity and because price competition seems tobe the most important competitive context for multiunit organizations, we limit the discussion tothis case.18See Lafontaine (1999) for a discussion of the position of the US Supreme Court regarding resale
price maintenance in the franchising context.
66

1999). While the payment of a fee that is a percentage of revenues distorts compet-
itive behavior in the same way as double marginalization does, the payment of a fee
based on profits would not (Schmidt, 1994).
The royalty fee, however, is an imperfect tool of influence for several reasons.
First, instead of being able to dictate exactly the price a franchisee should charge
customers, the precise effect of the royalty fee may depend on exogenously given
factors that determine whether its imposition results in the desired price level or not.
Second, the franchisor only captures part of the price increase, while the franchisee
captures the remainder. Finally, while the optimal level of royalty fees would be
contingent on the competitive context, they are the same for all franchisees, and
therefore cannot adjust to local competitive circumstances.19
A fundamental difference between company-owned and franchised units is the
autonomy of the management at the local level. While franchisees have full auton-
omy over their competitive behavior, corporate headquarters of a chain are free to
decide what level of autonomy is given to managers of local units. The corporate
office could decide to let local managers operate relatively freely, while obviously
respecting the quality standards that define the brand, or it could decide to provide
strict rules and guidelines detailing not only operational procedures but also com-
petitive actions such as pricing. The choice of the degree of granted autonomy and
the possibility to shape the incentives of the local manager create the opportunity
to use this delegation relationship in a strategic manner.
The optimal incentive scheme with which the manager of a company-owned unit
is provided, should reflect the local competitive context, i.e., ex ante adaptability,
while it should be irreversible once in place, i.e., ex post rigidity. The incentive
scheme should reflect the local competitive context because demand and supply
characteristics jointly determine optimal competitive behavior and, ultimately, the
optimal incentive scheme. Ex post rigidity is necessary because the commitment
would otherwise not be credible.
19To prevent franchisors from treating franchisees in an “unfair” way, the US Trade Commissionadopted a national disclosure standard in 1995, based on the Uniform Franchise Offering Circular,issued by the International Franchise Association (Dailey, 1998).
67

Anecdotal evidence seems to indicate that the administrative policies that govern
the relationship between corporate headquarters and unit managers are indeed ex
ante adaptable and ex post rigid. (Please refer to Section 4.5 for the main findings
of a field study that addressed these issues). Chains typically develop a pricing
policy within which local managers have to operate.20 There is some suggestion that
uniformity of prices across company-owned units could be beneficial for the chain as
a whole, but empirical research shows that franchisors do not try to achieve wholly
uniform prices across their company-owned units (Lafontaine, 1999).21 Corporate
headquarters habitually use annual budgets in which detailed information is included
about price levels for different products and the quantity of the output. These
budgets are decided upon after some form of negotiation with the local units. The
obligation to act according to the described administrative system, consisting of
a pricing policy and an annual budget, significantly restricts the local manager’s
autonomy. This restriction is not easily changed because of the costs of implementing
this administrative system. Moreover, for reputational reasons within the firm,
headquarters have an incentive not to renege on the internal contract.
Within a local market, the providers of similar products and services generally
know one another relatively well (Ingram and Roberts, 2000). This means that they
are typically aware of their local rivals’ competitive behavior and the agreements
and policies that govern their actions. However, direct observability of the incentive
contract is not a necessary condition. Katz (1991) shows that unobservable contracts
can typically also serve as commitment.22
The next subsections develop hypotheses that explore the effect of strategic in-
centives and royalty fees on pricing behavior.
20Interviews with managers of local company-owned units and corporate managers responsiblefor pricing seem to indicate that local conditions in terms of demand and competition are takeninto account when the pricing policy is put in place.21Lafontaine (1999) studies pricing at fast-food restaurants, which could be considered as rela-
tively homogeneous goods. As goods become more heterogeneous, the ability and desirability tocharge uniform prices further decreases.22More precisely, Katz (1991) shows that unobservable contracts can be used as commitment in
the presence of moral hazard and risk-averse agents, or in the presence of asymmetric information.He argues that this is typically the case.
68

Effect of strategic incentives on competitive pricing. In a setting of price
competition with differentiated goods, an optimal incentive would encourage the
local units to keep prices relatively high and refrain from discounting. Providing
such an accommodating incentive would result in an increased price level for the
focal firm and encourage a similar response from the direct competitors.
The benefit of commitment, however, depends on the extent to which strategic in-
teraction plays a significant role in a given market. As the number of firms in a mar-
ket increases and the market concentration decreases, strategic interaction decreases
and the benefit of strategic commitment dissipates. In a market with a large num-
ber of competitors, communication and coordination become more difficult, which
decreases the potential gain of commitment (Stigler, 1964). In the extreme case
of perfect competition, there is no strategic interdependence, and firms would not
set incentives that induce accommodation. Thus, the price premium resulting from
strategic delegation increases as the market becomes more concentrated.
The ex ante adaptability to local circumstances and ex post rigidity of the rela-
tionship between the corporate level and the manager of the company-owned unit
allow chains with company-owned units to benefit from strategic delegation. Be-
cause of the full autonomy of franchised units regarding their pricing behavior,
these units cannot credibly commit to setting high prices. The difference in the
governance mechanism between franchised and company-owned units leads to the
following hypothesis.
Hypothesis 4.1 The price difference between company-owned units and fran-
chised units is positively related with market concentration.
Effect of royalty fees on competitive pricing. Because of double marginal-
ization, royalty fees provide the incentive to franchisees to increase the price charged
to the end customer. Schmidt (1994) shows theoretically that this distortion should
directly depend on the magnitude of the royalty fees. Royalty fees are a percentage
of revenues and could, therefore, either be interpreted as costs or as a decrease in
revenues. The following figure shows that, if residual demand is downward slop-
69

ing, the payment of a revenue-based royalty fee decreases the output quantity and
increases the price.
occupancy
MC
MR non-franchise
MRfranchise
qFR q*
residualdemand
PFR
P*
pricenon-franchisefranchise
AB
Figure 4.1 Decrease in marginal revenues increases price.
The ability to increase price, however, depends on the competitive context. In
the extreme case of perfect competition in the final market, where no individual
firm has any market power, the market price is given and the cost structure may
affect survival chances but not pricing behavior. Tirole (1988) explains that the
markup depends on both the elasticity of demand and the degree of substitutability
with competing products. The markup is zero in the case of perfect competition,
i.e., perfect substitutability, while it is maximal in the case of monopoly, i.e., no
substitutability. The extent to which franchised firms can pass on the royalty fees
thus critically depends on the competitive context. This leads to the following
hypotheses.
Hypothesis 4.2a The price charged by franchised units is positively associated
to the royalty fees these units pay.
Hypothesis 4.2b The sensitivity of the price charged by franchised units to
the royalty fees is positively associated with market concentration.
70

4.4. Empirical Setting
4.4.1. History of the Hotel Industry
The first record of hotel industry activity dates back to 2000 BC, when inns in
Babylonia were obliged by regulation to register their inn-keeping activity.23 The
first US hotel was the City Hotel in New York, which was established in 1794, and
comprised 73 rooms. In the 1950s, mobility in the US increased significantly and
the motel concept caught on. Kemmons Wilson established the Holiday Inn chain in
1952. Reportedly, he was unhappy with the large variance in hotel quality on trips
with his family. He aimed at building a “modern hotel” that would offer travelers
the certainty of a good quality hotel. Wilson managed to build a national chain,
using franchising as a way to expand rapidly. This approach would revolutionize
the industry. In the 1980s and 1990s, some large companies, such as Marriott and
Accor, introduced a differentiated multi-brand approach. For example, Accor uses
in France six different brand names, each targeted at a different segment: Formule
1, Etap Hotel, Ibis, Novotel, Mercure, and Sofitel. The 1990s were characterized
by merger and acquisition activity, leaving the industry with a few key multi-brand
hotel companies that now control most recognized brands.
4.4.2. Cost Structure
The hotel industry is relatively capital intensive, with significant investments in real
estate and equipment. Operating costs could be divided roughly in one-third for
direct room costs and two-thirds general costs (interview with Vice President of a
hotel corporation). According to a study by De Roos and Rushmore (2000), 30 -
50% of the room expenses are variable when a one-year horizon is used. Hotels often
have a restaurant and a bar. This study, however, focuses on the room activity of
hotels.
23The paragraph on the history of the industry is based on Rushmore and Baum, 2002.
71

4.4.3. Competition
The hotel industry is characterized by local competition, i.e., hotels compete di-
rectly with those that are located in the same area, but not with hotels that are
located in a completely different part of the country or state (Baum and Mezias,
1992).24 Hotels differ both in terms of their quality (e.g., star rating) and their loca-
tion. Therefore, hotel services are goods that are differentiated both vertically and
horizontally. In this study, we focus on the short-run competitive dynamics between
hotel establishments, where the capacity of each hotel is taken as given, and where
competition therefore takes place in terms of quality and price.25
4.4.4. Ownership Form
The ownership form of individual establishments in the hotel industry plays an
important role in this study, because we infer the incentives of the local establishment
manager from the ownership form. Hotel establishments can be one of any of the
following forms:
• Independent hotels — The owner/manager operates the hotel under its ownname.
• Company-owned hotels — The manager operates the establishment, which isowned by the company that also owns the brand name.
• Franchised hotels — The franchisee owns the establishment, but pays a franchisefee for the use of the brand name and other services.26
24Location could be defined in various ways. Baum and Mezias (1992) determine the exactlocation of hotels in Manhattan using the numbering of streets and avenues. Chung and Kalnins(2001) use the five-digit zip code as a definition of the local market. Conlin and Kadiyali (1999)use both the city level and the country level as a market definition.25The formal way to represent the competitive interaction in the hotel industry is in a differen-
tiated Bertrand price competition model with capacity constraints, controlling for quality (Vives,1999).26In traditional franchising, the upstream producer sells to the downstream retailer. In contrast,
with business format franchising such as is the case of the hotel industry, the franchisor does notprovide a physical product but a brand name, marketing support and other services in exchangefor an initial fee and, typically, a percentage of revenues.
72

• Hotels under management contract — The establishment owner contracts outthe management of the establishment to a third party.
Independent hotels. The independent hotel represents the comparison bench-
mark in this study. We assume that the manager/owner of an independent hotel
has the objective to maximize its own profits, because the manager is the residual
claimant. In this study, we analyze whether managers of company-owned hotels and
franchised hotels have incentives that differ from the pure profit-maximization in-
centives the manager/owner of the independent hotel has, and how these incentives
are reflected in their competitive behavior.
Company-owned hotels. In contrast to independent hotels, we consider es-
tablishments owned and managed by the company that also owns the brand name.
Most of the brand owners in the hotel industry operate some or a considerable
number of establishments themselves. For example, Motel 6 operates 85% of the
establishments that use its brand name, the remainder being franchised.
We examine whether and how the incentives of managers that run these company-
owned establishments might differ from the incentives of independent owner/managers.
The hotel managers’ rewards typically reflect a broad range of performance objec-
tives for the establishment and the organization. Even if part of their reward is based
on the performance of their establishments, these managers do not act as residual
claimants, thus creating the possibility of the strategic use of their incentives.
Franchised establishments. Franchising has become very popular in the US
hotel industry since the concept was adopted in the early 1950s. For example,
Comfort Inn comprises close to 1,700 franchised hotels. In the US hotel industry,
the offerings of most franchisors are known (Rushmore and Lee, 2002), because US
legislation requires franchisors to have uniform franchise offerings for all franchisees.
The uniformity of franchise offerings leaves little room for strategic play
with franchise fees. At the same time, the franchise fee itself changes the manager’s
incentives from those of an independent hotel manager. The franchise fee in the hotel
industry typically consists of an initial fee (usually based on the number of rooms
of the hotel), a royalty fee (usually based on the gross room revenues), a share in
73

the corporate marketing costs, a fee for revenue directly generated by the franchisor,
and miscellaneous fees for services such as software or training (Rushmore and Lee,
2002).
Management contract. In some cases, the establishment owner does not man-
age the establishment. This happens most frequently in the case of large hotels that
are owned by a (real estate) investment company, which outsources the manage-
ment of the establishment to the hotel corporation that also provides the branding
of the hotel. While there are some differences between this ownership form and the
company-owned form, in terms of incentives these two forms resemble each other
most, because they are both managed by a professional manager.
4.4.5. Pricing Policy
The pricing policies used range from very simple “one price fits all” to sophis-
ticated revenue management systems used by large hotels and hotel companies.
Owner/managers of franchised hotels may obtain general advice about pricing poli-
cies from the franchisor. Legally the franchisor may not influence pricing decisions
taken by the franchisee. In the case of company-owned hotels, the head office typi-
cally sets pricing policies, and delegates actual pricing decisions, such as discounting,
to the hotel manager who is better aware of local demand characteristics. From in-
terviews with industry participants, it seems that the level of discretion for the local
managers is relatively restricted — they operate within strict rules and guidelines of
the head office. (A more detailed description is included in Section 4.5).
4.4.6. Texas Hotel Industry
The Texas state government requires all properties exceeding US$16,600 quarterly
room revenues to report these revenues on a quarterly basis. This has allowed
consultants and researchers to use this public information (e.g., Chung and Kalnins,
2001, Conlin and Kadiyali, 1999, and Conlin, 2003). In Texas, approximately 3,500
hotel establishments compete in nearly 500 local markets, characterized by the five-
digit zip code (Chung and Kalnins, 2001). The total size of the Texas hotel industry
74

is approximately US$4 billion, growing at an annual rate of 7% for the ten years
through to 2001. The average occupancy rate in the Texas hotel industry is between
55 and 60%.27
4.5. Field Study
4.5.1. Introduction
As part of the dissertation, a field study was conducted. The purpose of the field
study was to test the validity of some assumptions that underlie the theoretical de-
velopment, to refine understanding of the hotel industry, and to verify the validity
of our conclusions. Some examples of tested assumptions include whether competi-
tion is correctly characterized as strategic complements and whether competition is
perceived as a local phenomenon. The understanding of the hotel industry included
phenomena such as the value chain, customer segments, competitive strategies, pric-
ing and other policies, organizational forms, etc. Finally, we discussed the conclu-
sions of our empirical study of strategic incentives with some market participants to
verify the face validity of our findings.
Between 2002 and the beginning of 2005, we spoke with approximately 25 in-
dustry participants, including, among others, managers of company-owned hotels,
owners of franchised hotels, top-level and mid-level managers of hotel corporations,
academics with an expertise in the hotel industry or yield management, consultants,
and the research director of the American Hotel & Lodging Association.
The remainder of this section is structured as follows. We first discuss some
characteristics of the hotel industry, its participants, and customers. This is followed
by a description of the competitive and pricing strategies and practices that are used
in this industry. We then discuss sales force management and internal organization of
different ownership forms. Moreover, we depict how some industry participants think
about the ability of company-owned establishments to commit to price leadership.
Finally, we provide some conclusions from this field study. A list of the interviewees
27The statistics on the Texas hotel industry are obtained from the Texas Hotel PerformanceFactbook, Source Strategies Inc.
75
and their organizations (made anonymous) is included in Appendix C.
4.5.2. Hotel Industry
What customer segments and product groups should be distinguished? What distribu-
tion channels are used? What is the influence of the internet on the hotel industry?
Interviewees typically distinguish contract business from transient business. The
contract business includes, among others, group travel, conventions, and annual
contracts. Transient business could either be with or without a specific price agree-
ment (for example, AAA membership discount). Various distribution channels can
be distinguished, such as travel agencies, operators, travel internet websites such as
Expedia and Travelocity, the hotel establishment website, and the corporate website.
Hotel corporations are currently trying to achieve rate consistency, guaranteeing the
best price on their own hotel establishment or corporate website.
Some interviewees argue that the internet makes competition more intense: “The
internet can make you more aggressive. You can kick out a competitor by being $5
cheaper.” (John, franchisee/owner of three hotels in Dallas, Texas). This franchisee
explained that his hotels can be found on 126 websites. He spends a significant of
his time checking the websites. “I have personal connections to make sure that I get
favorable exposure on the internet.”
Which kinds of ownership can be distinguished? Which parts of the value chain
are typically owned together?
The value chain can be characterized as consisting of the following elements: (1)
brand ownership, (2) ownership of the establishment, and (3) management of the
establishment. A typical independent hotel is owned and management by the same
entity (value chain ownership could be written as AAA, which signifies that the
same company owns the brand, owns the establishment, and manages the hotel).
A typical franchised hotel is characterized as ABB: a hotel corporation A owns
the brand, while the franchisee owns the establishment and manages the unit. A
company-owned hotel is generally characterized as AAA: the hotel corporation owns
the brand, the hotel establishment, and manages the hotel through a professional
76

manager. A managed hotel is owned by a third party (typically an investment fund),
but managed by the hotel corporation (characterized as ABA). The four ownership
forms described above cover most of all hotel establishments. Some exceptions
exists, for example a hotel that is owned by an investment company but managed
by a third party (ABC).
Some hotel corporations focus on franchising and do not own or manage prop-
erties (e.g., hotel corporation #1). Other corporations own most properties or own
some brand that are predominantly company-owned and some brand that are both
company-owned and franchised (e.g., hotel corporation #4). Still other hotel cor-
porations have all three branded ownership forms: company-owned, managed, and
franchised (e.g., hotel corporation #5).
The management of managed and company-owned hotels is relatively similar
“to ensure consistency in the product” (Peter, franchising department of US hotel
corporation). The typical management fee for managed establishments at this cor-
poration is a two-tier fee structured as follows: the first tier is a percentage (e.g.,
3%) of total (not only room) revenues. The second tier is a percentage (e.g., 10%)
of the net cash flow (net operating income minus debt service minus 12% preferred
owners returns on equity). The second tier is referred to as “the incentive” and is
capped.
The manager of a large, upscale hotel that is managed but not owned by the
hotel corporation describes the difficulties of the managed ownership as follows. This
hotel is owned by four investors. The manager, Jack, meets with them each month
to talk about the business and to convey his perception of the market. He feels
as “a circus acrobat who holds a rope that is pulled by two elephants in opposite
directions”. Jack reports officially to the hotel corporation, but also “unofficially”
to the owners.
4.5.3. Competition
Who are perceived as direct competitors? Do the managers/owners know their local
competitors? Do establishments compete in direct rivalry with their local rivals, or
77

do they compete in terms of “independent” competitive actions?
Most interviewees agree that competition is a local phenomenon. “Our compet-
itive set consists of the 6 hotels that are not more than 4 miles from this hotel”
(Matthew, sales manager of a large, upscale company-owned hotel). The manager
of another upscale hotel, Jack, argues that large, branded hotels normally ignore in-
dependent hotels. “They do not impact the local competitive situation. They have
their constant share of loyal customers and we ignore those. However, if there is low
market occupancy, the importance of the independents increases. Now, the inter-
national hotels want to fill their capacity with the customers that typically would
choose the independent hotel. The international hotels are willing to cut the price
to convince these customers to come to their hotel.”
Many hotels use benchmark information from Smith Travel Research (STAR
report). This report provides the average rate of the competitive set on a weekly
basis. Hotel managers seem to know their competitor well. “We call them once
and a while. Sometimes we ask them to do us a favor.” (Matthew, sales manager
company-owned hotel) “I know my competitors personally. We send each other
overflow customers.” (John, franchisee/owner of three hotels). John adds, “I talk
with my competitors, I check the internet, I shop around: I want to know what
competition is doing.”
While hotel managers know their competitors well and are typically aware of their
moves, it seems that this information is not always directly incorporated in pricing.
Matthew, sales manager of an upscale company-owned hotel, argues “Although I
need to be aware of what the competitors are doing, the competitors’ price doesn’t
really matter. If the direct competitor drops its price, we typically do not react the
first week. If the market share stays constant, we do not react to the price change.
If the market share decreases, we lower our rates for transient, retail customers.”
In the lower segments (budget and economy) rivalry seems to be more direct.
“Due to the lack of differentiation in the lowest segment, there is a high sensitivity to
each other’s price.” (Paul, VP Pricing large hotel corporation) From the interviews,
it seems that managers of franchised hotels are more aware of rival’s prices than
78

managers of company-owned hotels.
What kinds of price policies are implemented in different kinds of hotels? Do
individual customers negotiate the price?
Pricing policies differ per the segment (budget, economy, midscale, upscale, and
luxury) and per individual company. Below, some typical comments about pricing
policies are described.
Nicolas, Vice President of a European hotel corporation, explains that pricing
policies differ per segment. “Our budget brands only have one price. The economy
brand has ten prices. Our midscale brand has 40-50 prices, while our upscale brand
has 100-200 prices. Of the economy brand customers 90% pays the rack rate; 60%
for the midscale brand, 40% for our upscale brand, and only 4% of the luxury brand
customers pay the rack rate. Pricing at the luxury brand could be characterized as
‘luxury’ or ‘image’ pricing. After a large renovation, we once doubled the luxury
brand’s rack price, which positively affected customers’ perceived service quality.”
Competitor-orientation seems to be especially prevalent in the policy stage, and
less prevalent in the competition stage. “When we determine the pricing policy, we
look at the competitors and we want to be x% cheaper than the competitors for
the same perceived value.” (Paul, VP Pricing hotel corporation) The determination
of the pricing policy is relatively similar for independent hotels: “Determining the
basic rate for a room is done in comparison with other hotels that are in the same
and are comparable in quality. The day-to-day price of competitors is not taken
into account.” (Charlotte, manager of an upscale independent hotel)
The price is also determined in relation with costs. Charlotte, manager of an
upscale independent hotel, said that rooms have a minimum price, which is based on
average total costs (including depreciation), under which a hotel room would not be
sold. This minimum price could be used if the hotel is half empty and the manager
believes that it could help attract additional customers. It is interesting to note
that sunk costs, such as depreciation, are taken into account in the determination
of the minimum price. Charlotte provided two reasons for including sunk costs
(which inflates the minimum price). She first pointed out that the restaurant is not
79
profitable, so the hotel needs to compensate for that. Second, she pointed out that
it was part of a commercial policy. This hotel would not drop the prices too much
because that would hurt credibility and equity, both between customers, and over
time periods. Furthermore, there is also a luxury-pricing element: if the hotel is
priced too low, then customers may think that there are quality problems.
Price levels react to demand conditions. “In periods of weak demand, the ho-
tel will allot rooms to discount brokers, who in turn sell the rooms for up to 50%
less.” (Charlotte, manager of an independent hotel) Chris, revenue manager, ex-
plains “Competition is a day-by-day phenomenon. If demand is high, there is a
capacity constraint, and direct rivalry is weak. If demand is low, there is more price
dispersion, because some establishments are willing to go low, while others are not.”
Some establishment provide discounts to individual customers who want to nego-
tiate, other establishments do not. “We do not allow fading (i.e., discounting at the
door) for the units we own.” (Paul, VP Pricing large hotel corporation, about low-
est segment) Individual discounts seem to be more prevalent in the higher segments
(upscale and luxury). Moreover, it seems that independent hotels are more willing
to fade than company-owned establishments: “If a customer comes in and asks for a
good price on a weekday with the hotel being half empty, the person at the reception
has the right to charge the weekend rate (20 % discount). Also, it has happened
that a family with children gets a second room for free, taking into account the fact
that the whole family stays for dinner in the restaurant.” (Charlotte)
It seems that the hotel industry is less competitive than, for example, the airline
industry. Chris, revenue manager of a large hotel corporation, points out that “There
seems to be a general understanding in the industry, that prices should be kept high
for non-price sensitive customers. It is better to maximize the ADR (average daily
rate) than to maximize RevPar (revenues per available room).” He adds that “It is
best not to respond to decreases in competitor’s prices. They will sell out early: one
competitor less in the market.”
Most interviewees agreed that the average price in the market is below the opti-
mal, or monopoly, price. In other words, increasing the average market price (e.g.,
80

through collusion, which obviously is illegal) would increase industry and establish-
ment profits. Moreover, the idea that, normally, the best response to a price cut is
a price cut and the best response to a price increase is a price increase (strategic
complements) was also well accepted.
Some interviewees argued that it is important to keep prices relatively stable over
time. Matthew, sales manager company-owned hotel, pointed out, “Rate integrity
(i.e., avoiding large differences in rates over time) helps at creating long-term value
for the brand.” Other interviewees also noted that they kept their prices relatively
stable over time.
What are the yield management procedures and systems in place? Is there a
difference between the use of these systems between small and large hotels, franchised
and company-owned hotels?
Yield management, or revenue management, techniques, including software, are
introduced in the hotel industry some years ago. Large hotel corporations have
regional yield managers who typically operate as internal consultants. They provide
advice but do not have operational responsibility. Some of the larger hotels may have
a yield manager who is dedicated to the establishment. Matthew, sales manager
of a large, upscale company-owned hotel, explains, “I use the yield management
system to determine the minimum available rate. Sales people do not use the yield
management system.” Charlotte, the manager of a relatively small independent
hotel notes that “Proper yield management as it is done in the airline industry
is not possible for small hotels such as ours.” Another possible reason that yield
management is not as well spread as in the airline industry is that “Customers will
not accept price differences in the hotel industry as they do in the airline industry.
Daily yielding is therefore less possible.” (Paul, VP Pricing of a hotel corporation)
Does competition takes place between individual hotel establishments or between
hotel corporations?
It seems that competition in the hotel industry takes place at many levels. This
dissertation focuses on the direct competition between local rivals. This implicitly
treats the capacity of hotel rooms as exogenously given. Moreover, it does not pay
81

specific attention to competition between hotel corporations. Nicolas, Vice President
of a European hotel corporation, described the interplay between competition on
the local and corporate level. “We changed our operating structure. Originally,
each chain was managed by a regional (and national) manager. Now, a regional
manager manages three chains. The reason behind this restructuring was to decrease
cannibalization between the different brands that belong to our group.”
4.5.4. Sales Force Management
What is the discretion of the company-owned hotel manager for pricing? Who
decides what in terms of pricing policy and actual price setting in the case of a
company-owned establishment?
The degree of delegation and the authority to set prices autonomously varies
depending on the hotel segment, the hotel size, and other dimensions. Pricing in
the budget segment of large hotel corporations is typically organized centrally. “In
the lowest segment, if an establishment wants to change price (for example as a
response to competition), they should call the territory manager, who should call
me, and I decide for all hotels in the US. In the segment slightly above, the manager
may change the price him- or herself, but informs the territory manager, who will
inform us. We may decide to interfere.” (Paul, VP Pricing large hotel corporation)
The authority to set prices is more delegated for midscale and upscale estab-
lishments. Nicolas, Vice President of hotel corporation, explains that “Nationally
a pricing policy is developed per brand. Moreover, the regional manager adjusts
or specifies this policy, regarding regional differences. Finally, the establishment
manager is the one that ultimately decides, keeping within the broader policies, and
consulting higher management. Note, however, that the discretion of local manage-
ment is relatively small. We are very prudent with giving local management too
much pricing discretion. In fact, local management is closely monitored and gets an
award if it correctly follows the revenue management system’s recommendations.”
Managers and sales managers of company-owned hotels agree that they do not
have complete freedom in setting prices. Matthew, sales manager of a company-
82

owned hotel, explains that “My possibility to play with rates is limited because of
the minimum flow-through requirement.” The flow-through is defined as the gross
profits per dollar revenue. In the same vein, Stephan, room department manager
of a company-owned hotel, adds “Even if a company owned hotel basically can set
its own prices, it still has to play by the corporate rules and stay within a certain
bandwidth.”
The sales managers, in turn, tend to closely monitor the salespeople. Matthew
clarifies: ““In the sales meeting, each morning, we discuss all open contracts. Sales-
people have to explain the rate offered in terms of needs and values (customer needs
and establishment values). Giving a discount because the competitor gave a discount
is unacceptable.” Probably as a result of the close supervision and the existence of
subtle rules, Matthew notes that salespeople do not tend to be too aggressive. “They
tend to be careful, sometimes too careful.” The same close involvement is noted in
the case of an independent hotel: “As the owner of three franchised hotels, I am
very involved in everything that happens at each hotel. Every morning, I have sales
meetings at each hotel.” (John, franchisee/owner of three hotels).
What is the discretion of the franchisee for pricing? Who decides what in terms
of pricing policy and actual price setting in the case of a franchised establishment?
The franchisor cannot dictate the consumer price to the franchisee, because that
would be considered price fixing, or resale price maintenance, which is not allowed
by law. In the words of Sarah, who works at the franchising department of a hotel
corporation, “The chain will provide guidelines for the price the franchisee can charge
to customers (a range). This ‘target’ price range depends on things like the brand,
location, etc. However, if business is slow, the hotel owner can decide to provide
discounts. The franchisee is free to do that”.
What are the objectives for hotel managers or sales managers?
Although some interviewees mention the use of profit objectives, it seems that
the typical objectives are provided in terms of occupancy rates, prices, or market
share. Matthew, sales manager of a company-owned hotel, explains that “As a sales
manager, my first responsibility is to gain market share. I am not responsible for
83

profits.” Nicolas, Vice President of a hotel corporation, argues that “First, man-
agement should try to maximize the occupancy rate. Then, if occupancy of 80% is
reached, management should try to maximize the average room rate. This is to be
applied on daily occupancy and room rates.”
What compensation systems (bonuses, incentives) are used?
The interviews have surveyed both the US and the European situation. The
use of bonuses has been used probably longer in the US than in Europe, but most
managers and sales managers get some variable compensation based on performance.
For example, Olivier, general manager of a company-owned hotel in France, explains
that “All personnel get rewarded on a fixed annual pay plus a relatively small vari-
able pay based on objectives. The objective for our hotel includes multiple items
such as the score on a quality survey, gross profits, and regional gross profits.” Re-
gional gross profits includes the profits of other hotels that are located in the same
region, which may be of the same or another brand that belongs to the same hotel
corporation. Nicolas, Vice President of the same hotel corporation, describes the
systems precisely: “The general manager of one of our hotels receives a fixed salary
plus 15% if the GOP (gross operating profit) budget is achieved, plus 15% if the
GOP budget is significantly surpassed, plus 15% based on the total sales of the
region, plus 15% based on general quality items. Department managers get a fixed
salary plus a 15% bonus based both on the GOP of the hotel, and specific quality,
management, or sales target. Other employees may receive a bonus based on GOP,
and a 6% bonus based on two or three personal objectives.”
Charlotte, the general manager of an independent hotel in France describes their
compensation system as follows: “The owner periodically decides to give a bonus
(between 500 euro and one complete monthly salary), based on exceptional perfor-
mance. The bonus could be linked to high revenues, high occupancy (e.g., 94% in
September last year, while maintaining a good price level), low costs, quality, etc.
The bonus is highly subjective.”
The situation in the US is relatively similar. Matthew, sales manager of a US
company-owned hotel, tells us “My bonus is based on (1) gross operating profits,
84

(2) customer satisfaction, (3) market share, and (4) the “flow through” (i.e., gross
operating profits per dollar revenue).”
4.5.5. Commitment in Multiunit Organizations
How do managers of company-owned units differ from owners of franchised units?
How do the incentives differ between managers of company-owned units and fran-
chisees? Does the mindset differ between CO and FR managers?
Franchisees face different constraints than managers of company-owned units.
Matthew, sales manager of a company-owned hotel, argues “Franchisees are more
involved in day-to-day decision making. If there is a tough month, they may be more
aggressive, because they need business to pay the bills. Management of company-
owned hotels is more decoupled.” Ben, senior VP Franchising of a hotel corpora-
tion, provides another reason why the incentives of franchisees differ from those of
the managers of company-owned units: “Franchisees are more short-term focused
because they can exit the brand, either by selling or by repositioning the establish-
ment. We are committed to our brand, because we have not exit strategy.” Paul,
VP Pricing of the same company, adds: “Franchisees are short-term oriented, eager
to increase when demand is strong, and willing to decrease when demand is weak.
”Franchisees will probably not agree that they are short-term oriented. For exam-
ple, John, the owner of three franchised hotels, explains “Our business is derived
mainly from conventions, which means that contracts dominate transient business.
We therefore have to have a long-term time horizon of 3-5 years.”
Most interviewees agree that company-owned hotels have a longer time horizon
franchised or independent hotels. One interviewer, however, argued that company-
owned hotels are under more time pressure: “When markets are down (low demand
and occupancy), privately owned and operated hotels may decide to maintain their
pricing structure to wait and see when the market will pick up again. The sharehold-
ers of the large hotel operators, however, put pressure on management to gain market
share even if markets are down. Thus, they effectively force managers to lower their
price. The likelihood to engage into a price war is thus larger for company-owned
85

establishments than for independent properties.” (Jack, area manager).
The risk profile of the owner of a typically small franchised hotel is most probably
different from the risk profile of a large hotel corporation. “An investor could take
risks that an individual would not be willing to take. We can take more risks: it is
not our money.” (Matthew, sales manager company-owned hotel)
Do the pricing policies, discount practices, etc. differ depending on whether the
hotel is company-owned or franchised? Are there other differences between CO and
FR units in terms of customer segments, costs, management practices, or quality
levels?
Most interviewees agree that prices at company-owned hotels are more stable
than prices at franchised hotels, although different explanations are being offered.
Paul, VP Pricing of a hotel corporation, argues “Because franchisees have a shorter
time horizon, their prices fluctuate more, depending on demand. We believe that it
is better to be consistent, to ask a fair price for the quality you offer.” Paul adds,
“Sometimes franchisees will charge too much, which is bad for the brand. Also,
franchisees sometimes give too much discounts. Discounting is like a drug: it is very
difficult to brake the habit.” Chris, revenue manager, concurs: “Franchisees react
more violently to economic swings.” Franchisees seem to agree with this viewpoint.
John, owner of three franchised hotels, argues “If you are not full and you have a
low cost structure, you can go low to attract more customers.”
Another reason for price consistency could be the top down fashion in which
pricing is implemented at corporations with company-owned units, which creates a
certain rigidity in itself. Paul, VP Pricing, states that “Pricing is clearly top down.
Therefore, there is more consistency and rigidity than in franchise pricing.”
Jack, area manager, does not see a difference in the behavior between company-
owned and franchised units. “How individuals evaluate the market depends on their
personal market feeling. In principle, all these managers face the same market and
the same decisions. If one of our managers makes poor pricing decisions, he gets
fired. If the owner of a franchised property makes poor pricing decisions, he gets
bankrupt.”
86

Nicolas, VP of a hotel corporation, discusses the changes that occur if an in-
dependent hotel becomes franchised. He argues that the percentage GOP of an
independent hotel is quite similar to the percentage GOP of a franchised hotel. The
main difference is that the turnover increases due to the franchise (“the turnover of
an independent hotel is 20% less than turnover of a franchised hotel”). This is not
primarily due to a higher occupancy rate, but mostly to a higher average room rate.
Independent hotels generally price lower, too low according to Nicolas. Independent
hotels are not aware of national/international trends. For example, independents
will be very reluctant to increase the price significantly during a world cup or other
event. Nicolas: “The result is that franchised hotels and company-owned hotels may
have up to 50% higher rates, and still attain 100% occupancy.”
Company-owned and franchised units differ in other perspectives, such as size.
“Franchised units are typically much smaller than company-owned units.” (Ben,
senior VP Franchising). The reason for this difference is that hotel corporations
generally prefer to manage the larger establishments within the same brand them-
selves, because of the complexity.
Interviewees make different arguments for why the costs of either franchised or
company-owned units are higher. Ben, senior VP Franchising, argues that franchised
units may have higher costs than company-owned units: “Franchisees may provide
extra amenities to the customers in an aim to be customer friendly. This could drive
up costs and prices, which always decreases profitability.” Chris, revenue manager,
takes the opposite stand: “Franchised units may have less costs because they are less
well maintained.” Nicolas, VP of a European hotel corporation, describes the effect
on the cost structure of changing ownership form from independent to franchised:
“The discretionary cost structure of independent, franchised, and company-owned
hotels is relatively similar. A franchised hotel will decrease its costs related to
branding, promotions, sales, and advertising. Also, due to shared purchases, the
costs of amenities may slightly decrease. At the same time, the franchised hotel will
increase some costs that are related to the quality of the hotel, directly affecting the
brand image. Compared to a company-owned hotel, an independent hotel may save
87

some money by using (unpaid) family members etc.”
Finally, Jack described how customer satisfaction dropped when an establish-
ment changed from being company-owned to franchised. “Why did the satisfaction
drop? New management is not familiar with the procedures that are part of the
brand. Moreover, employee morale fell. The new owner has fired some of the over-
head employees and other personnel feared to be fired next. In the past 16 months,
the hotel has had 4 different general managers.”
Does it happen that a specific establishment plays the role of price leader? What is
the effect of that on competition and performance? Is it more feasible for a manager
of a CO unit to commit to setting a high price than for a franchisee or for the owner
of an independent hotel?
There was widespread agreement that price increases could lead to higher profits.
Some interviewees referred in this respect to a recent article by Professor Enz, who
was also interviewed (Enz, Canina, and Lomanno, 2004). It should be noted that
not only explicit collusion, which is illegal, could achieves this; also, tacit or implicit
collusion, for example resulting from repeated interaction, could lead to cooperative
behavior. Although many interviewees agreed that collectively raising prices would
increase profits, most did not see this happen in reality. Paul, VP Pricing, complains:
“It is not sure that competitors will follow if you raise your price. People don’t play
fair. Competition is as uncontrollable as the weather.” Matthew, sales manager,
agrees: “Collusion and price setting doesn’t work. Someone will always renege.
There is no commitment.” Paul, VP Pricing, sees the same problem: “It is difficult
to commit to being a price leader, because eventually somebody will always undercut
you.” However, Paul adds that price leadership is more likely in an economic upturn
situation than in a downturn market.
Nicolas, Vice President, was more positive about the possibility that an estab-
lishment plays the price leader role. Nicolas suggested even that in a market where a
number of independent and franchised hotels compete fiercely prices could increase
following the entry of one more — company-owned — hotel. “After entry, we set a
relatively high price and show that the market can bear the higher price. Often, but
88

not always, our competitors pick this up and increase their prices, too.” This suggest
that this company is able to credibly commit to a high price, which has a positive
effect on the rivals due to the strategic complementarity of the industry. Nicolas ex-
plains that “We know what a typical hotel, depending on its size and brand, should
do in terms of prices, occupancy, and costs. If a hotel is not successful, it is decided
whether to close or rebrand the hotel.” Apparently, lowering the price to attract
additional customers is not considered a feasible option.
When does a hotel corporation choose for company-ownership and when for fran-
chising a particular establishment?
Different reasons have been given to decide whether to own or to franchise.
Size has been mentioned before: “Larger hotels are preferably company-owned,
because the management of large hotels becomes very complex. Big hotels, with
more than 200 rooms are only managed by us.” (Nicolas) Another criterion seems
to be the market potential. Paul, VP Pricing, explains: “We often use franchising
in secondary or tertiary markets as a supplement to our primary markets, where we
have company-owned units. It is easier to expand in less successful markets through
franchising.”
When one looks at this question from the perspective from an individual estab-
lishment, the following establishment life cycle has been suggested: “The normal
life cycle of a property is as follows: starts independent, becomes a franchise, and
then become a company-owned property.” (Stephan, room manager). One may add
that this seems to focus on the first part of the life cycle. Older hotels could be-
come franchised hotels of a lower segment, and possibly even independent hotels at
a certain point in time.
Ben, senior VP Franchising, argues that it is valuable to have both company-
owned and franchised units in a chain: “A rival hotel corporation only has franchised
units. The corporation was more interested in just maximizing revenues, rather than
building a brand. Now, these brands have lost their good reputation.”
Finally, a franchisee explains how typically a franchise is granted to a franchisee.
“The franchisee acquires the location and then submits a plan of intent and the
89

franchisor then decides if it is suitable and gives the ok. Remember, the franchisee
is taking all the risks. The franchisor gets a contract signed with all bindings and
then comes out ahead. The franchiser allows the franchisee to build or renovate a
property. They then ask that you abide by all rules and quality standards. If the
franchisee does not do this, he will be revoked and the name taken away. So the
franchiser is always ahead of the franchisee.” (Raj, the owner of a franchised hotel)
4.5.6. Conclusion
The interviews that have been summarized in this section have added value to this
dissertation by testing some of the assumptions that underlie the theoretical frame-
work used, by refine the understanding of the specific practices and circumstances
of the hotel industry, and by verifying the face validity of the theoretical develop-
ment described in this dissertation. On many topics, there seemed to be agreement
among most industry experts. For example, most interviewees agreed that while
collectively raising prices would increase firm profits, this is very difficult to realize
in daily practice. Putting explicit collusion aside, the repeated interaction appar-
ently does not lead to tacit collusion. Most probably, this could be explained by a
lack of common knowledge. Although everybody may agree that raising prices would
benefit all, each individual manager may not know that everybody knows: “Someone
will always renege.” At the same time, mechanisms seem to be in place to avoid
excessive rivalry. Internal processes and procedures in combination with industrial
norms and values seem to dampen rivalry. Examples that confirm this argument are
the use of costs that are higher than marginal costs as a basis for pricing decisions
and the frequent mention that firms should not automatically follow a rival’s price
decrease.
Most interviewees also agree that the incentives and mindsets of franchisees are
different from those of managers of company-owned establishments. While some
industry participants believe that these differences “should” not affect managerial
behavior, most industry experts agree that incentives ultimately influence behavior,
which means that company-owned units may compete differently from franchised
90

units. Our core argument that company-owned hotels are better able to commit to
playing the price leadership role is confirmed by some of our informants, although it
must be stated that other informants find it difficult to develop a coherent argument
about this topic. It seems that industry participants generally find it difficult to
link ownership forms, managerial incentives, and competitive behavior, which is not
surprising given the novelty of this topic.
From the interviews, it has become clear that hotel corporations use different
methods to influence managerial behavior. These methods could be characterized
as either relying on financial incentives, rewarding specific outcomes, or relying on
procedures and control processes that directly influence behavior through fiat. Ex-
amples of the first mechanism are bonuses on market share or gross operating profits,
while examples of the second include sales meetings and generally accepted prac-
tices. From the interviews, it seems that the second mechanism is more important
in its influence on managerial behavior than the first, both in the European and
American context. The following quote confirms this assertion: “Local management
is closely monitored.”
4.6. Statistical Analysis
4.6.1. Sample
The empirical setting of this study is the hotel industry. The hotel industry is
characterized by local competition, i.e., hotels compete directly with establishments
that are located in the same area, but not with hotels that are located in a completely
different part of the country or state (Baum and Mezias, 1992). Hotel services are
differentiated goods that differ both in terms of their quality and their location.
We focused on the short-run competitive interaction between hotel establishments,
where the capacity of each hotel is taken as given, and competition therefore takes
place in terms of quality and price.
Several studies have considered the benefits and drawbacks of chain organiza-
tion in the hotel industry. For example, Ingram and Baum (1997), Chung and
Kalnins (2001), and Canina, Enz, and Harrison (Forthcoming) explored agglomer-
91

ation spillovers in hotel chains. Ingram (1996) argued that chain organization can
solve the problem of commitment to quality. Other studies have explored the differ-
ence in behavior between company-owned and franchised units. Conlin (2003), for
example, showed that competition between franchised units is fiercer than between
company-owned units, because franchisees do not consider how their pricing behav-
ior affects demand of other units. Kalnins (2003) showed that the entry of franchised
units in a market decreases the revenues of the incumbent hotels of the same chain,
while the entry of company-owned units increases revenues of incumbents.
The data we used was from the Texas hotel industry. Because of the large
size of the Texas market, the heterogeneity of the state in terms of rural and urban
regions, and the availability of reliable data, the Texas hotel market is well suited for
empirical research. The two primary sources of data we used are a hotel tax file we
obtained from the State of Texas Comptroller’s Office and the Source Strategy Inc.
database. The former database has been used among others by Chung and Kalnins
(2001). The latter database has been used in previous studies such as Conlin and
Kadiyali (2002) and Conlin (2003).28
All hotels in Texas with room revenues exceeding $16,300 per quarter are required
to report revenues on a quarterly basis to the State of Texas Comptroller’s Office.
The Comptroller’s Office makes this data publicly available. This dataset included
the hotel name, the location of the hotel, the name and address of the owner, the
number of rooms available, and the quarterly revenues. The Source Strategy Inc.
database included the same hotels and reports with the same periodicity. The data
comprised the name of the hotel, the brand name if the hotel belonged to a chain,
its location (town and zip code), the average quarterly occupancy rate, price, and
revenue per available room.29 The final dataset spanned 24 quarters (1997 through
28Conlin (2003) studies how ownership affects competition between two establishments of thesame brand. Because chains with company-owned units maximize joint profits, while franchiseesmaximize the profits of their single unit, company-owned units are expected to compete less ag-gressively with other company-owned units of the same brand, than franchised units with otherfranchised units of the same brand. This study is not focused on competition between units of thesame brand, but on competition between units independent of their brand.29The average room price (average daily rate), the occupancy rate, and the average revenue per
available room are the three most commonly used performance indicators in the hotel industry. The
92

2002) and contained 77,257 observations. This dataset provides unique research
opportunities because it contains fine-grained longitudinal competition data as well
as detailed data at the establishment level.
We defined the local market as the zip code area in which a focal hotel is situated.
This is in line with Chung and Kalnins (2001) in a study of the Texas hotel industry.
In Texas, approximately 3,500 hotel establishments compete in more than 800 local
markets. During the time period of our sample, 1997-2002, the number of hotels
in Texas grew by 5 percent annually. Franchising grew from 30 to 34 percent by
the end of 2002. The number of company-owned units grew slightly, from 13 to
15 percent. Independent hotels formed 57 percent in 1997, and 51 percent in 2002.
The number of hotels per zip code in our sample ranged from 1 to 54. The number
of markets in which only one establishment operated (monopoly markets) equaled
2 percent. In 57 percent of the markets, between 2 and 10 hotels operated. In 41
percent of the markets, more than 10 properties were present.
We limited our analysis to hotels that belonged to a chain (company-owned and
franchised hotels). This reduced our sample to 36,668 observations. Comparing
chains, consisting of company-owned and franchised hotels, with independent hotels
is difficult because of the importance of the brand reputation that the chains have
built. Moreover, while quality data for chains were publicly available, the same
data were not available for independent hotels, which would have made it even more
difficult to compare chains with independents.30 Obviously, market measures, such
as the average occupancy rate or the market concentration, included all hotels in
the market.
We used brand dummies, rather than segment dummies, because within-segment,
across-brand differences are significant in the hotel industry. For example, a large
business hotel such as Westin is in many respects different from a niche hotel such
as Four Seasons, even if both are in the luxury segment. Each brand belongs to only
relationship between these three measures is as follows: revenue per available room = occupancy× average room price.30Some hotel tour books, such as the one published by the American Automobile Association,
report a “star” rating, but these turn out to cover only 15 percent, or less, of the hotels in Texas(Chung & Kalnins, 2001).
93

one segment.
Some brands chose to have only company-owned or franchised units. In these
cases, it was impossible to distinguish between the brand effect and the ownership
effect. To be able to distinguish brand effects from ownership effects, we therefore
limited our analysis to those brands that contained both franchised and company-
owned units. This reduced our sample to 12,144 observations. Out of the 82 hotel
brands that were in business in Texas, 28 brands operated both franchised and
company-owned hotels.31 Controlling for brand and limiting our focus on those
that had both franchised and company-owned units allowed us to identify the effect
of ownership form changes within the same brand. Appendix D contains a list of
the included brands, including information about the market segment, the average
price per room, the percentage company-owned and franchised, the royalty fee, and
the number of units in Texas. Appendix E shows examples of company-owned and
franchised hotels of the same brand.
4.6.2. Dependent Variable
Price per room per night. The dependent variable was the average price for
a hotel room. We used the natural log of the price, because price followed an
approximate lognormal distribution. This variable was inversely related to our main
concept of interest, the intensity of rivalry. The price measure was an average for
each hotel establishment for each period. In reality, the price per night in a hotel
room usually fluctuates according to the length of the stay, the size of the room, the
day of the week, or the season. Because our variable was average per three-month
period, it did not capture these price differences. We do not believe that this data
limitation systematically biased our findings.
31We defined a brand as belonging to this category if at least 5 percent of its units are franchisedand at least 5 percent are company-owned.
94

4.6.3. Independent Variables
Ownership form. The main independent variable was ownership form. We created
a dummy variable for franchised establishments (1 if franchised, 0 if not franchised).
The company-owned ownership form was the omitted variable. We determined
whether a unit was franchised or company-owned in a certain quarter, based on the
brand name, the owner address, and information from the Directory of Hotel and
Lodging Companies (2003).32
Market concentration. The most common used measure of market concen-
tration is the Herfindahl index, which is defined as the sum of the squared shares
of the participants in a given market. We calculated the Herfindahl index based on
the capacity share (number of rooms) of all firms in the market, including the focal
firm.
Royalty fees. The Hotel and Motel Magazine annually published a Franchising
Supplement (1997-2002), which included detailed information about the franchising
fees per brand. We included a variable royalty fee, which indicated the royalty fee
per brand as a percentage of revenues. Franchise fees were relatively stable during
the period of observation (Lafontaine and Shaw, 1999). Moreover, changes in the
fees were reflected only in the new contracts that were signed after the change took
place. We therefore included average franchise fees per brand over the six-year time
period.
Control variables. Because our data is a panel of multiple hotels from mul-
tiple chains, observed across multiple markets, at multiple periods, we used fixed
effects to control for sources of heterogeneity that we could not explicitly observe.
First, we included dummy variables for each period (year and quarter) to control
for unobserved seasonal and macroeconomic trends in the Texas economy. Second,
we included fixed effect dummies for the brands in the sample. These dummies
controlled for the average quality, reputation, and hotel profile of hotels within a
32The Directory of Hotel & Lodging Companies provides the address (town and state) wherethe chain is situated. All hotels, whose owner is located in that town, are assumed to be company-owned. All other chain hotels are assumed to be franchised.
95

given brand. Our use of brand dummies provides a superior control for unobserved
differences than previously used quality segment dummies. The brand dummy was
based on the brand name for each establishment/period combination as reported in
the Strategy Source Inc. database. We cross-checked the brand code with the hotel
name reported by the Comptroller’s Office. Finally, we included fixed effect dum-
mies for each physical establishment. These dummies accounted for the differences
in hotel location and stable hotel characteristics, such as hotel size.
Establishment dummies were also helpful to account for potential endogene-
ity of ownership form. It is possible that chains select ownership forms based on
characteristics of the establishment or location. If that is the case, the estimates
of ownership form might suffer from self-selection bias (Hamilton and Nickerson,
2003). Self-selection bias would result if unobservable characteristics that were rel-
evant in the choice of ownership form also influenced the competitive behavior of
the establishment. Statistically, that bias would be reflected on a correlation be-
tween unobservable establishment characteristics and the ownership form variable.
The self-selection problem can be addressed by examining the Hausman test asso-
ciated with the fixed establishment effects, because the Hausman statistic explicitly
tests whether the observed variables are correlated with the unobserved sources of
heterogeneity.
In addition to the above fixed effects, we controlled for time-varying conditions
of supply and demand affecting each particular establishment. To control for supply
variations, we included the logarithm of market capacity, defined as the total number
of rooms of all establishments in the market. To control for market-specific demand
shocks, we included the mean occupancy rate in the local market, defined as the
percentage of occupied rooms by the establishments in the market, excluding the
focal firm. This exclusion was necessary to avoid potential endogeneity, because the
firm’s own occupancy might be influenced by its price.
96

4.6.4. Estimation
Our model consisted of a reduced-form price equation for each establishment, and
was estimated using a panel regression. The functional form can be written as:
log(price)it = xitβ + Zitγ + αi + θc(i) + τ t + it,
where xit are the independent variables of interest, Zit are the control variables,
αi are the establishment fixed effects, θc(i) are the brand effects, and τ t are the period
effects.
4.6.5. Results
The final sample constituted an unbalanced panel of 630 establishments (either
company-owned or franchised) observed over a maximum of 24 periods, totaling
12,069 observations. There were 6,106 observations of franchised hotels, and 5,963
observations of company-owned hotels. We compared the variables for these groups
using univariate t-tests between the two groups. The univariate comparisons showed
that franchised hotels tended to have higher prices and revenue per available room.
Franchised hotels operated in markets with slightly lower average capacity, and in
markets where their rivals tended to have higher mean occupancy, but the own-
ership forms did not differ in the average concentration in their markets. Table
4.1 presents descriptive statistics, including means and both the overall and the
within-establishment standard deviations and correlations.
Variable Mean Min Maxoverall within (1) (2) (3) (4) (5) (6) (7)
(1) ln(Price) 4.14 .41 .08 3.01 5.33 .62 -.01 -.09 .01 .20 .08(2) ln(RevPar) 3.68 .50 .20 1.44 5.00 .91 .01 .03 .02 .41 -.08(3) Ownership form (Franchise) .51 .50 .16 .00 1.00 .27 .22 .00 -.08 .03 -.01(4) Market Concentration .02 .17 .05 -.16 .80 -.19 -.17 -.01 .04 -.28 -.71(5) Franchise * Royalty Fee .00 .39 .08 -1.56 .86 .07 .06 .00 -.06 -.02 -.01(6) Mean Occupancy in Market .58 .13 .08 .00 .90 .25 .34 .03 -.49 .02 -.04(7) ln (Market Capacity) 6.87 .91 .14 3.56 9.01 .44 .38 -.03 -.75 .11 .35
Std. Dev. Correlations
Table 4.1 Descriptive statistics.
To avoid multicollinearity between main effects and interaction effects, and to
facilitate interpretation, the interacting variables (market concentration, royalty fee)
97

were centered on their respective means (.19 and 4.56 percent, respectively) (Aiken
and West, 1991). The Pearson correlations confirmed that franchised establishments
charged higher prices. Price was positively correlated to market capacity and mar-
ket occupancy, and negatively to market concentration. However, these bivariate
correlations were not particularly indicative of actual effects, given the significant
correlations between multiple variables and the effects of unobserved heterogeneity.
Table 4.2 presents the results of our analysis. Because ownership form is a policy
variable, we were concerned that it would systematically correlate with characteris-
tics of the chain, the market, or the establishment. Accordingly, before testing our
hypotheses, we examined whether the effect of ownership form on pricing behavior
was robust to the inclusion of several fixed effects. Models 1, 2, and 3 examine the
effect of ownership form on pricing after controlling for relevant observed and unob-
served effects. The effect of franchise on price was positive and significant when only
controlling for market occupancy, market supply, and period effects. Yet, the vari-
able turned negative and significant when controlling for brand fixed effects. This
result indicates that some hotel chains that were more prone to franchising were
also more likely to charge higher prices. Examination of Appendix D corroborates
that, at least in the Texas hotel industry, large chains in the economy segment were
more likely to rely on company-owned establishments (e.g., Motel 6, Red Roof Inn,
Studio 6), while some large chains in the upscale and luxury segments were more
likely to use franchised establishments (e.g., Doubletree, Sheraton).
98

99
Table 4.2 Regression Results a
Model 1 2 3 4 5 6Dependent Variable ln(Price) ln(Price) ln(Price) ln(Price) ln(Price) ln(Price)
Sample All All All All All All
Market Definition ZIP Code ZIP Code ZIP Code ZIP Code ZIP Code ZIP Code
Ownership form (Franchise) .22 *** -.02 *** -.01 + -.01 -.01 .00(.01) (.00) (.00) (.00) (.00) (.00)
Market Concentration .20 *** .19 *** .18 ***(.02) (.02) (.02)
Franchise*Market Concentration -.10 *** -.08 *** -.07 **(.02) (.02) (.02)
Franchise*Royalty Fee .03 *** .03 ***(.01) (.01)
Franchise*Royalty Fee*Market Concentration .11 ***(.03)
Mean Occupancy in Market .29 *** .12 *** .15 *** .19 *** .19 *** .19 ***(.03) (.01) (.01) (.01) (.01) (.01)
ln (Market Capacity) .18 *** .07 *** -.05 *** -.01 + -.01 * -.02 *(.00) (.00) (.01) (.01) (.01) (.01)
Constant 2.5554 3.7401 4.3598 4.0719 4.0886 4.1037(0.0296) (0.0261) (0.0390) (0.0553) (0.0555) (0.0556)
Fixed Effects: Period Effects YES YES YES YES YES YES Brand Fixed Effects NO YES YES YES YES YES Establishment Fixed Effects NO NO YES YES YES YES
Observations 12 069 12 069 12 069 12 069 12 069 12 069Establishments 630 630 630 630 630 630TSS 1 983 1 983 1 983 1 983 1 983 1 983RSS 1 419 322 59 59 58 58R2 .2841 .8375 .9703 .9705 .9705 .9705R2 (within) .2492 .2537 .2546 .2553RMSE .3433 .1637 .0719 .0717 .0716 .0716Log-Likelihood -4 209 4 740 14 993 15 030 15 037 15 043Log-Likelihood (null) -6 226 -6 226 13 264 13 264 13 264 13 264F-value 183.80 *** 1168.61 *** 108.15 *** 104.78 *** 102.47 *** 100.22 ***Degrees of freedom (26, 12042) (53, 12015) (35, 11404) (37, 11402) (38, 11401) (39, 11400)R2 (within) .2492 .2537 .2546 .2553Lagrange multiplier test 76 838 *** 74106 ***Hausman Test 222.53 *** 2041.77 *** a †: p < .1, *: p < .05, ** p < .01, ***: p < .001.

Model 3 includes fixed effects for establishments, and the relationship between
franchise form and pricing remained negative, but only weakly significant. Longitu-
dinal changes in ownership form for a specific establishment were a necessary con-
dition to ensure statistical power for the estimation of ownership effects in the fixed
effects model. Over the six years of observation, 15.8 percent of the establishments
in our sample changed ownership form, which means that they moved from being
franchised to being company-owned, or vice versa. Therefore, we inferred that the
marginal statistical significance was not due to problems of statistical power. The
results suggest that the strongly significant negative effects found in model 2 might
be due to unobserved differences between properties. It appears that, within a given
chain, franchised units were associated with unobserved establishment characteris-
tics (mainly about the property itself or its surrounding market) that explained their
lower price. Chains might retain as company-owned establishments either the more
expensive properties or those properties with the most attractive market locations.
This interpretation was confirmed by industry executives, who reported that chains
prefer to own the larger, more luxurious properties of a brand because of the com-
plexity of managing these properties. The rejection of the null hypothesis in the
Hausman test confirmed that sources of unobserved heterogeneity were correlated
with the observed variables in the model. We interpreted these results as consistent
with self-selection in the choice of ownership form.
Models 4 to 6 include the test of the hypotheses. Hypothesis 4.1 suggests that
company-owned units increase their prices more than franchised-units when mar-
ket concentration increases. Model 4 includes the effects of market concentration,
and the interaction of market concentration with franchise form. Because company-
owned properties were the omitted category, the results indicated a positive effect
of market concentration on log-prices of company-owned facilities (slope: .20, p <
.001). For franchised units, the effect was determined by the sum of the coeffi-
cients (slope: .20 + (— .10) = .10, p < .001). The interaction term represented
the difference between the concentration-price slopes for company-owned and fran-
chised establishments. The difference is negative and statistically significant (— .10,
100

p <.001), in support of Hypothesis 4.1. The evidence suggests that company-owned
units were more likely to raise prices than franchised units when market concen-
tration increased and strategic interactions became most salient. Figure 4.2 depicts
the relationship between concentration and price for company-owned and franchised
units.
$54
$56
$58
$60
$62
$64
$66
$68
0,05 0,15 0,25 0,35 0,45 0,55 0,65 0,75 0,85 0,95
Herfindahl index
Price
company-ownedunits
franchisedunits
Figure 4.2 Price difference increases as concentration increases.
Hypothesis 4.2a suggests that higher royalty fees to franchised units would be
passed on to customers in the form of higher prices, as expected by double marginal-
ization arguments. Model 5 adds a variable for royalties. The variable was centered
on the mean of 4.56 percent for franchised units, and was set to 0 for company-owned
establishments. The coefficient on the royalty fee was equal to .03 (p < .001), which
suggests that a 1 percent point increase in the royalty is associated with a 3.1 per-
cent increase in the price charged to customers.33 The results confirm Hypothesis
4.2a.
The insignificance of the franchise dummy in model 5 suggests that franchised
and company-owned units did not price differently at the average level of the royalty
33This percentage is calculated as follows: e.0313 − 1 = 3.1%.
101

fee (4.56 percent). The royalty fees ranged from 3 to 5.4 percent in the sample (1.56
below the mean to .86 above the mean), and the predicted price effects therefore
ranged from 4.7 percent below the mean to 2.7 percent above. Extrapolating the
results outside the range of data suggests that an imaginary franchised hotel with
0 percent royalty fee would price 14.7 percent below a comparable company-owned
hotel.34 Therefore, the distortion of price associated with royalty fee is important,
even though the mean levels tend to equalize.
Finally, Hypothesis 4.2b suggests that the franchisor’s ability to pass on increases
of royalty fees to customers was limited in more competitive markets. The positive
interaction in model 6 between the royalty fee and market concentration (.11, p <
.001) confirmed the hypothesis. The sensitivity of prices to royalty fees is plotted in
Figure 4.3 for firms at different concentration levels. As the market becomes more
competitive, passing the royalty fee on to customers becomes less feasible. In higher
concentration markets, however, higher royalty fees result in even higher customer
prices.
$50
$52
$54
$56
$58
$60
$62
$64
$66
3% 4% 5% 6%Royalty fee
Price highconcentration
averageconcentration
lowconcentration
Figure 4.3 Price as a function of royalty fee at different levels of concentration.
34e−.0050−4.56∗.0313 − 1 = 14.7%.
102

4.7. Discussion and Conclusion
While traditional research in competitive strategy treats the firm as if it consists of
a unitary actor, in this dissertation, we explore how the inside of the firm affects the
way it competes vis-à-vis its competitors. We have developed arguments that link
ownership forms with managerial incentives and competitive behavior. The results
are generally supportive of our hypotheses. We find that company-owned hotels
are better able to adjust their pricing to the competitive conditions, and may serve
as price leaders in more concentrated markets. Strategic incentive theory suggests
that such price leadership behavior would be effective in encouraging competitors to
follow with higher prices. Influencing competitive decision-making after delegation
to franchisees is more difficult, because chains do not have direct control over the
end-consumer price. Franchisors are prohibited by antitrust regulation to directly
influence franchisees’ competitive decisions. While royalty fees may be used to
indirectly affect pricing, this mechanism is shown to be limited because it cannot
be adjusted to local competitive circumstances. Franchisors cannot discriminate
among franchisees with royalty fees. While increasing royalty fees could benefit the
chain in markets with high concentration, in more competitive markets increased
fees would hurt the franchisee, because the increase in costs could not be passed on
to customers. This condition would limit franchisors’ ability to use royalty fees as a
competitive commitment mechanism.
We carried out several robustness checks for the empirical model (Models 7,
8, and 9 in Table 4.3). First, we examined whether the differential price effect of
company-owned and franchised units was due to monopolistic or oligopolistic pricing.
Theory suggests that the credibility of strategic incentives should be particularly im-
portant in oligopolistic contexts because in these situations the strategic interaction
is most salient. Because of their ex post rigidity in pricing policies, company-owned
units are able to credibly commit to price leadership, while franchised units may
not. Raising prices in monopoly situations does not require competitive credibility,
since it does not involve competitive interactions. Model 7 presents the results for
the analysis using a restricted sample that eliminates cases where establishments
103

were the only hotel in the ZIP-code market. The predicted slopes of market concen-
tration on the log of price were .12 and .00 for company-owned and franchised units,
respectively. By eliminating monopoly markets, the slopes of both ownership forms
are smaller than in the main model (Model 6), as would be expected by the restric-
tion of range in the independent variable. However, the difference of the slopes is
now greater than in the main model, and the slope of the franchised units becomes
insignificant. This result underscores the inability of franchised units to raise prices
under oligopolistic conditions.
Next, we explored the robustness of our geographical market definition by using a
distance-based definition of the market. We geocoded the address of each hotel using
web-based EZLocate geocoding services. We then defined the relevant market by the
establishments within a radius of two miles from the focal unit. The average number
of establishments within a two-mile radius market was approximately equal to that
within a ZIP-code market. The results (Model 8) with this market definition were
largely consistent with those of the previous model. The difference of slope between
ownership forms remained significant. The royalty fee maintained a significant effect
on price. However, the royalty fee effect on pricing appeared to be unrelated to
market concentration. In general, the slopes of concentration and price were higher
than in previous models.
104

105
Table 4.3 Additional Regression Results a
ModelDependent Variable
Sample
Market Definition
Ownership form (Franchise) .00 .00 .00 .01(.00) (.00) (.00) (.01)
Market Concentration .18 *** .12 *** .41 *** .65 ***(.02) (.03) (.07) (.07)
Franchise*Market Concentration -.07 ** -.12 *** -.26 *** -.20 ***(.02) (.03) (.06) (.06)
Franchise*Royalty Fee .03 *** .03 ** .02 * .03(.01) (.01) (.01) (.02)
Franchise*Royalty Fee*Market Concentration .11 *** .09 * .03 .66 ***(.03) (.04) (.09) (.09)
CO: Concentration => log (price) .18 .12 .41 .65
FR: Concentration => log (price) .11 .00 .15 .45
Fixed Effects: Period Effects YES YES YES YES Brand Fixed Effects YES YES YES YES Establishment Fixed Effects YES YES YES YES
Observations 12 069 11 808 11 721 11 808Establishments 630 619 615 619TSS 1 983 1 934 1 902 2 892RSS 58 57 55 322R2 .9705 .9707 .9710 .8887R2 (within) .2553 .2630 .2789 .2900RMSE .0716 .0713 .0706 .1700Log-Likelihood 15 043 14 762 14 776 4 510Log-Likelihood (null) 13 264 12 960 12 860 2 488F-value 100.22 *** 102.00 *** 109.75 *** 116.76 ***Degrees of freedom 39, 11400) (39, 11150) (39, 11067) (39, 11150)R2 (within) .2553 .2630 .2789 .2900Lagrange multiplier test 74106 ***Hausman Test 2041.77 ***
6 7 8 9log (Price) log (Price) log (Price) log (RevPar)
All Monopoly hotels excluded
Monopoly hotels excluded
Monopoly hotels
excludedZIP Code ZIP Code 2-mile radius ZIP Code
a †: p < .1, *: p < .05, ** p < .01, ***: p < .001.

Our interpretation of the results has been that company-owned units actually
benefited from increasing prices in the presence of high concentration. A price equa-
tion by itself is not sufficient to substantiate the performance effect of the observed
competitive behavior. It is possible that company-owned units that raise prices in
more concentrated markets may actually lose occupancy and revenues. An addi-
tional way to triangulate our intuition is to use a measure of revenue per available
room, since revenue per available room is affected by both price and occupancy. An
increase in price that results in a significant decrease in occupancy may lead to a
reduction of the revenue per available room. This is why revenue per available room
is used frequently by industry participants as a summary indicator of hotel perfor-
mance. Model 9 shows the results of an analysis where revenue per available room is
the dependent variable in a sample that excludes monopoly observations. The result
indicates that company-owned units obtain higher revenues per available room in
more concentrated markets than franchised units. This finding suggests that price
increases by company-owned units indeed lead to increased performance. Interest-
ingly, franchised units also benefited — albeit to a lesser extent than company-owned
units — from higher performance in concentrated markets, even though they did not
appear to raise prices (Model 7). This positive performance effect might be ex-
plained by an increase in occupancy due to company-owned units increasing prices
in markets where franchised units competed with company-owned establishments.
With this chapter, we aim to contribute both to the theoretical and empirical
literatures that explore the relationship between firm characteristics, incentives, and
interfirm rivalry. While there has been ample theoretical treatment of strategic
incentives theory, the empirical evidence of this theory has been scant. Two notable
exceptions are Slade (1998b) and Aggarwal and Samwick (1999). Slade finds that
the likelihood of vertical separation in gasoline stations increases as the benefit of
separation through strategic delegation increases. Aggarwal and Samwick find in a
cross-sectional study of companies that are listed on a stock exchange that the weight
placed on rivals in the executive compensation scheme decreases as concentration
increases. This finding is interpreted as evidence for strategic incentives theory. In
106

this study, we show that chains may provide company-owned units with incentives
to soften competition, confirming strategic incentives theory. With this analysis,
we hope to improve the balance between theoretical and empirical contributions of
strategic incentives theory.
One way to understand our results is to compare themwith the following metaphor.
In the well-known legend, Ulysses sailed the seas with his sailors. When they ap-
proached the Sirens, Ulysses ordered his sailors to tie him onto the mast of the
ship and to put wax in their own ears to avoid being tempted by the songs of the
Sirens. By doing so, Ulysses managed to steer away from the Sirens and continue
his journey. Equivalently, by tying the hands of managers, one may be able to make
them resist the short-term temptations of the market and achieve a more profitable
outcome.
Lafontaine and Slade (1997) cite six prior studies that find that franchised out-
lets charge a higher price than company-owned outlets. Two studies deal with gaso-
line stations (Barron and Umbeck, 1984; Shepard, 1993), two with fast-food chains
(Lafontaine, 1995; Graddy, 1997), one with pubs (Slade, 1998a), and one with soft-
drink bottlers (Muris et al., 1992). By way of contrast, in our study, we find that
in more oligopolistic contexts, company-owned units price higher than franchised
units, leading to the conclusion that ownership form has differential effects under
different competitive contexts. With the present chapter, we hope to contribute to
the above literature by quantifying the double marginalization effect and separating
it from other reasons that potentially affect the price charged to customers. The
availability of royalty fee data provides the unique opportunity to accurately mea-
sure double marginalization and control for the distortion that results from it. We
show that the price distortion that results from double marginalization is directly
proportional to the level of royalty fees in franchising. Moreover, we find evidence
that the royalty fee/price distortion decreases as competition becomes more intense.
The direct generalizability of our findings is limited to industries in which both
franchised and company-owned establishments operate. Moreover, the direction of
the strategic incentives effect is contingent on the nature of the industry as one
107

based on price competition among differentiated offerings. The hypotheses may not
extend to other industry settings where competition focuses on capacity or invest-
ment preemption, and where an aggressive preemptive strategy is more appropriate.
However, the general finding that characteristics of the firm affect competition be-
tween firms may be more broadly applicable. This study has focused on ownership
of the firm as one characteristic that affects managerial incentives. Before one can
conclude that in general “the inside matters for competition”, future research should
study other firm characteristics, such as compensation schemes and organizational
structure, and their effect on inter-firm rivalry.
This chapter starts exploring the effect of managerial incentives on rivalry. We
examine how market concentration influences the strategic effect of incentives. It
would be valuable to refine this investigation by examining competitive responses
among rivals. Using a structural econometric model, one could verify whether the
assumption of strategic complementarity is justified and whether strategic pricing
achieves its intended price response and performance effect.
108

5. Conclusion
By studying how the inside of the firm–organizational characteristics, such as com-
pensation systems, organizational structure, and ownership form–affect the outside
of the firm–product-market competition between firms that operate on the same
market–this dissertation has tried to link the competitive strategy and organiza-
tional theory literatures. By doing so, we hope to contribute to the understanding
of the internal functioning of business organizations and the rivalry between these
organizations. The purpose of the literature review (Chapter 2) is to determine
the current state of the theoretical and empirical strategic incentives literature–the
theory that explores the link between managerial incentives and product-market
competition in oligopolistic situations. We conclude that the existing literature,
while growing and maturing in its approximately 20 years of existence, displays at
least two significant shortcomings. First, the theoretical strategic incentives litera-
ture has studied elements of organizational design, ignoring the possible interaction
between these elements. This could be a significant limitation, because, as we know,
the organizational design of business firms always consists of multiple elements, such
as compensation systems and organizational structure. Second, we conclude that
the empirical strategic incentives literature is scant. Very few empirical studies have
explored the interaction between organizational characteristics and product-market
competition, and the findings of these studies are far from conclusive. Chapter 3
aims at contributing to the management literature by addressing the first weakness,
while Chapter 4 addresses the second limitation of the existing literature.
In Chapter 3, a game-theoretical study of the effect of organizational design on
the intensity of rivalry is carried out. Rather than focusing on one element of organi-
zational design in isolation, this study explores the interaction of two organizational
design features: compensation systems and organizational structure. By increasing
the richness of the study, as compared to the existing literature, we hope to bring
the exploration closer to reality. The study provides a number of interesting and
surprising results. First, the study shows that otherwise identical firms may endoge-
109

nously choose different organizational designs. In other words, firms do not choose
the single “optimal” design that they agree maximizes profits, but each firm chooses
a unique organizational design, although both firms are identical ex ante. This is
an important finding because one of the strategy field’s core tasks is to explain firm
heterogeneity. Second, we show that organizational design could be used as a means
to decrease the intensity of rivalry. Previous research has repeatedly shown that, if
firms compete in strategic substitutes, they have a tendency to commit to aggressive
behavior, which may lead to a prisoner’s dilemma in which excessive rivalry drives
diminished industry and firm profitability. In contrast, in Chapter 3 we show that
multidimensional organizational design permits firms to avoid this overly aggressive
behavior, increasing industry and firm profits.
Chapter 4 conducts an empirical investigation of managerial incentives and inter-
firm rivalry. In the context of the Texas hotel industry, we explore how ownership
forms affect managerial incentives, which, in turn, influence competition between
hotel establishments. We compare the functioning of two different kinds of owner-
ship forms: franchised and company-owned establishments. The core argument in
this chapter is that the decentralization or delegation, which takes place in the case
of corporations with company-owned establishments, allows these corporations to
commit to playing the role of local price leaders, which dampens competition and
increases profits. Franchised units, in contrast, do not have the same decentral-
ization: the owner, or residual claimant, is also the manager of the establishment.
While the owner of the franchised firm may want to refrain from discounting, the
incentive to undercut competitors is too strong: a temptation the owner cannot
resist. In Chapter 4, we thus hope to show that ownership forms can be used to
manage rivalry and increase profitability.
While Chapters 3 and 4 contain the same subject matter, i.e., dependent variable,
namely competition and more precisely, the intensity of rivalry, the chapters differ in
their methodology, theoretical versus empirical, and in their independent variables,
organizational design versus ownership form. The main connecting theme, however,
is the study of the relationship between internal organizational characteristics and
110

external competitive behavior. We hope that each chapter, in its own way, has
contributed to the edification of this relationship.
This dissertation, obviously, has its limitations. Although the theoretical study in
Chapter 3 brings strategic incentives theory one step closer to organizational designs
that are used in reality, the specific assumptions of the game-theoretical model–the
use of relative performance evaluation and vertical decentralization–remain idiosyn-
cratic. It would be valuable to conduct further research that studies the relationship
between multidimensional organizational design and product-market competition.
This future research could entail both different and more general assumptions. A
possible limitation of Chapter 4 is that it focuses on equilibrium situations, i.e., ex-
amining average firm behavior under different circumstances. Investigating out-of-
equilibrium situations would allow a better understanding of actions and reactions,
focusing on specific moves by firms and the countermoves these incite from direct ri-
vals. Another worthwhile subject to examine are the antecedents of ownership form.
More specifically, it would be interesting to determine whether, or under what cir-
cumstances, firms take the anticipated effect of ownership choice into account when
they decide which ownership form to use in a specific setting. Finally, it would be
valuable to explore how corporate divisionalization affects individual unit behavior.
Many hotel corporations operate multiple brands. Do units of different brands that
belong to the same corporation behave as if they are owned independently, or do
these units take the effect of their own behavior on these units into account?
The concept of incentives plays a fundamental role in this dissertation. During
the work on this dissertation, my understanding of this concept has evolved. A
specific treatment of this concept could be valuable as it simultaneously explains
the focus and boundaries of this dissertation and provides insight in the learning
process of its author. At the very beginning of the dissertation, the center of interest
was the idea of relative performance: the desire to be better than others, perceived
as more important than absolute performance. I was advised to use this concept
not as a primitive, i.e., a property that is (assumed) part of the economic agent
right from its conception, but as an instrument used to control economic agents.
111

In other words, I was advised to study relative performance evaluation as an in-
centive mechanism. When writing the dissertation proposal, I defined an incentive
as something that incites action; a stimulus; an encouragement. I distinguished
compensation systems, such as relative performance evaluation, from the incentives
these systems create.35 Also other elements of organizational design, such as or-
ganizational structure, and ownership forms, in my definition, affect (managerial)
incentives. Managerial incentives can thus be seen as a theoretical construct, the
idea that people make economically rational decisions. When developing the em-
pirical study, I came to the realization that managerial incentives are not “difficult
to observe”, but plainly unobservable, a theoretical construct. Thus, each empirical
study of strategic incentives involves the identification of an observerable construct
that arguably affects managerial incentives. While compensation schemes might
be “more directly” linked to managerial incentives, compensation schemes, owner-
ship forms, or any other observed variable remain an antecedent of incentives, not
incentives themselves. One might wonder whether this theoretical construct is a
necessary constituent of the presented studies. Could we discuss the direct effect of
organizational design and ownership form on competitive interaction, without the
mediating effect of managerial incentives? Perhaps this is possible, but the use of
incentives as a mediating variable allows the use of internally coherent, economic
reasoning, linking different elements of organizational form with managerial behav-
ior. Finally, through the field study, I recognized that both compensation systems
and control through fiat affect managerial incentives. From my knowledge of the
theoretical strategic incentives literature, I implicitly expected that strategic dele-
gation always involves the use of compensation systems, for example variable pay
linked to a sales or relative performance objective. However, control through fiat
or rules obviously also affects managerial behavior. One may consolidate these two
mechanisms by realizing that fiat is not very different from compensation based on
objectives: “You get fired if you do x; you will get your salary if you do y.” The
35This use of the word incentives is thus different from the usage of this word in sales forcemanagement, where incentives are bonuses, typically linked with the achievement of a specificgoal.
112

evolvement of my thinking and understanding of the role of incentives has deepened
my comprehension of strategic incentives theory.
This dissertation is dedicated to the study of the intensity of competition, and
the role organizational characteristics play in determining this intensity. As argued
in the Introduction, the determinants of the intensity of competition are often subtle
and only partially understood. This dissertation hopes to make a modest contribu-
tion to this intricate matter by elucidating the relationship between organizational
characteristics, managerial incentives, and competitive interaction.
113

114
6. Appendix A. Classification of Empirical Strategic Incentives Literature (p. 1) Authors Industry Data Dependent
variables Independent variables
Conclusion Classifi-cation
Aggarwal, Samwick, ’99 J of Fin
cross-sectional
ExecuComp, Census of Manufacturers
compensation πi, πj, concentration, interaction terms
β positive on average, but decreases as concentration increases
I-b, II-a,b c, m y
Chevalier, ’95 AER
super-market
trade journals, CRSP, WSJI
stock prices, entry, expansion
financial leverage (LBOs)
LBO ⇒ more leverage ⇒ less competition ⇒ stock price of competitors increase
I-c, II-a,c g x
Chopin, ’99 book chapter
cross-sectional
Forbes compensation πi, sales, cost, cost x (market share, var., covar.)
29% (+), 14% (-) weight on sales, rest mainly on profits; no confirmation of theoretical model
I-b h (x)
Corts, ’01 JEMS
movies trade journals time between product introductions
joint distributor/ producer/division
movies from same producer (even different divisions) and distributor are released further apart
I-a, II-d x
Gibbons, Murphy, ’90 ILRR
cross-sectional
Forbes, Compustat, CRSP
compensation firm/industry/ market rate of return
CEOs are evaluated relative to the market and (albeit less) the industry
I-b c
Graddy ’97 JBES
fast-food survey price data, census
price race, income, ownership, costs
support for price discrimination on race; some support for lower price CO vs. FR outlets
I-d, II-a m x
Hill, Hitt, Hoskisson, ’92, OrgSci
cross-sectional
survey, Compustat ROA relatedness, inte-gration, decentr., control, incentives
fit between diversification strategy & org. design (internal cooperation vs. competition) improves performance
I-a,b b, f
Janakiraman, et al., ’92 JAR
cross-sectional
Forbes, Compustat, CRSP
compensation accounting ROE, stock return
not much support for RPE — only weak form RPE when using stock returns
I-b c
Classification: Please refer to index table below. Letters in parentheses signify that the construct or link is dealt with theoretically but not empirically.

115
6. Appendix A. Classification of Empirical Strategic Incentives Literature (p. 2, continued) Authors Industry Data Dependent
variables Independent variables
Conclusion Classifi-cation
Joh, ’99 RES
cross-sectional (Japan)
Japanese Development Bank
compensation change in firm and industry performance
µ is positive, but decreases as concentration increases or industries grow fast
I-b c, m y
Kalnins, Lafontaine, ’96 NBER
fast-food restaurants
Texas Sales Tax Permit Holder, geographic zip code
multiple ownership distance, similarity, contiguity
franchising is not strategic delega-tion device, but minimization of costs and reliance on expertise
I-d a y
Kovenock, Phillips, ’95 AER
cross-sectional
LRD recapitalization productivity, concentration, demand
debt is a disciplinary instrument, leverage is strategic variable in concentrated markets
I-c, II-a,b c, m x, y
Lafontaine, Slade, ’97, JIE
lit review : retail contracting
appendix: agency model including strategic interaction
I-d, II-a c, d x, y
Lyandres SSRN Wp
cross-sectional
ExecuComp, Compustat
(1) firm/industry leverage, (2) compensation
no of firms, size (log sales), age, (2) leverage
leverage depends on competitive-ness (-), size, age (+); leverage, compensation are substitutes
I-b,c, II-b,e d y
Shepard ’93 RAND
gasoline census of stations collected by Lundberg Inc.
price ownership, station characteristics
supports agency theory, some evidence that decentralization-vertical separation increase price
I-d, II-a c x
Slade ’98 JLEO
gasoline personal data gathering (previous paper)
likelihood of vertical separation (delegate pricing)
difference between own and cross price elasticity
large elasticity difference ⇒ separation creates market power ⇒ higher likelihood to separate
I-d i y
Slade ’98 Econ J
beer Nielsen, UK stats price, profit margin ownership, control: beer type, firm
untying the tied bars increased prices, support for strategic delegation
I-d, II-a m, x

116
6. Appendix A. Classification of Empirical Strategic Incentives Literature (p. 3, continued) I-a organizational structure a efficiency, effectiveness ⇒ firm characteristics I-b incentive systems b corporate strategy ⇒ firm characteristics I-c financial leverage c agency theory ⇒ firm characteristics I-d ownership d firm size = output quantity ⇒ firm characteristics I-e culture e business strategy ⇒ firm characteristics II-a price competition (Bertrand) f firm characteristics ⇒ performance II-b quantity competition (Cournot) g competition ⇒ performance II-c entry, exit II-d product introduction h market share ⇒ x II-e concentration m industry characteristics ⇒ competition x firm characteristics ⇒ competition y competition ⇒ firm characteristics
firm characteristics:- organizational structure- incentive systems- financial leverage
competition:- price, quantity- entry, exit- product intro- concentration
corp.strategy
efficiency,effectiveness
performance performance
industrycharacteristics
agencytheory
a
b
c
x
y
f g
m
I II
III
firmsize
businessstrategy
marketshare
demandelasticity
d
e
h i

7. Appendix B. Proofs of Propositions
7.1. Proof of Proposition 3.1
Proposition 3.1 deals with the case that µi = 0. This special case consists of three
stages, with owner i choosing first the organizational structure Oi. Subsequently,
if the organization is decentralized, transfer price i is determined by negotiation.
Finally, marketing manager i chooses the quantity qi to sell. We solve the game by
backwards induction. Equilibrium values are denoted with a superscriptb . First,we discuss the equilibria of the three distinct subgames: dDD,dCC, anddDC. Subse-
quently, we determine the subgame-perfect equilibrium of this special case.
Assuming OiOj = DD, the optimal output quantity is given by
bqDDi =
a− 2wi + wj
3b.
The transfer price that maximizes the production department’s profits is equal to13a. Therefore, after bargaining the transfer price paid by the marketing department
equals bwDDi = 1
3aα. Substituting bqDD
i and bwDDi into the profit expression yields
bπDDi =
a2
81b(3 + 2α)(3− α), 0 < α ≤ 1.
Assuming OiOj = CC, firms would attain the standard Cournot profits denotedbπCCi , which equals a2
9b. It is easy to verify that bπDD
i > bπCCi for 0 < α ≤ 1. Moreover,note that bπDD
i reaches a maximum at α = bα = 34, being bπDD
i = a2
8b, which equals
half the monopoly profits. This completes the proof of first and second parts of
Proposition 3.1.
Assuming OiOj = DC, the equilibrium output quantities are given by
bqDC =a− 2wD
3b,
bqCD =a+ wD
3b.
The transfer price that maximizes the production department’s profits is equal to 14a,
117

which results in a paid transfer price after bargaining of bwDC = 14aα. SubstitutingbqDC , bqCD and bwDC into the profit expression yields
bπDC =a2
72b(4 + α)(2− α),
bπCD =a2
144b(4 + α)2.
Now, it is easy to verify that bπCD > bπDDi and bπCCi > bπDC for 0 < α ≤ 1. Thus,
centralization is the dominant strategy, anddCC is the unique SPE. This completes
the proof of the third part of Proposition 3.1. ¤
7.2. Proof of Proposition 3.2
Proposition 3.2 deals with the case that OiOj = CC, allowing µi ∈ < (the CC-
subgame). This subgame consists of two stages, with owner i choosing first the
parameter µi, and then manager i choosing the quantity qi to sell. We solve the
game by backwards induction, starting with the marketing manager’s optimization
problem. Marketing manager i faces the following incentive scheme:
IMi = πi(qi, qj) + µiπj(qi, qj), i 6= j = 1, 2.
The first order condition in stage 2 yields the following expression for qi as a function
of µi and µj:
qCCi (µi, µj) =a
b
µi − 1µiµj + µi + µj − 3
.
The first order condition in stage 1 yields a continuum of solutions:
µCCi =µj + 1
3µj − 1.
The second order condition is satisfied for µi <13. This completes the proof of the
first part of Proposition 3.2.
Total industry output is independent of the value of µi, because as µi increases
(decreases) in equilibrium µj decreases (increases), completely offsetting the effect of
118
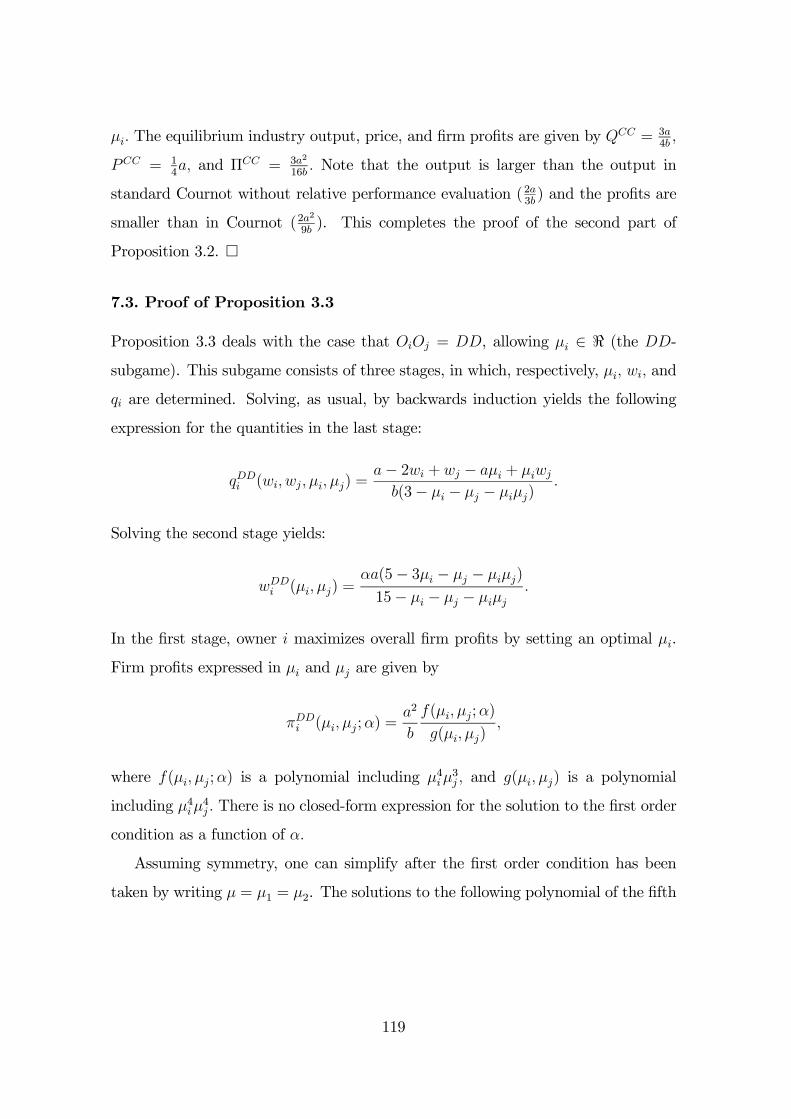
µi. The equilibrium industry output, price, and firm profits are given by QCC = 3a
4b,
PCC = 14a, and ΠCC = 3a2
16b. Note that the output is larger than the output in
standard Cournot without relative performance evaluation (2a3b) and the profits are
smaller than in Cournot (2a2
9b). This completes the proof of the second part of
Proposition 3.2. ¤
7.3. Proof of Proposition 3.3
Proposition 3.3 deals with the case that OiOj = DD, allowing µi ∈ < (the DD-
subgame). This subgame consists of three stages, in which, respectively, µi, wi, and
qi are determined. Solving, as usual, by backwards induction yields the following
expression for the quantities in the last stage:
qDDi (wi, wj, µi, µj) =
a− 2wi + wj − aµi + µiwj
b(3− µi − µj − µiµj).
Solving the second stage yields:
wDDi (µi, µj) =
αa(5− 3µi − µj − µiµj)
15− µi − µj − µiµj.
In the first stage, owner i maximizes overall firm profits by setting an optimal µi.
Firm profits expressed in µi and µj are given by
πDDi (µi, µj;α) =
a2
b
f(µi, µj;α)
g(µi, µj),
where f(µi, µj;α) is a polynomial including µ4iµ3j , and g(µi, µj) is a polynomial
including µ4iµ4j . There is no closed-form expression for the solution to the first order
condition as a function of α.
Assuming symmetry, one can simplify after the first order condition has been
taken by writing µ = µ1 = µ2. The solutions to the following polynomial of the fifth
119

degree provide the optimal values for µ:
(3− 2α+ α2)µ5 + (−11 + 16α+ α2)µ4 + (−58 + 36α+ 10α2)µ3
+(306− 384α+ 98α2)µ2 + (−297 + 606α− 299α2)µ− 135− 144α+ 189α2 = 0.
This polynomial yields five solutions, of which four can be deleted (for 0 < α ≤ 1),because they are either imaginary or yield negative w, q, or P. Again, given that α
is unknown (even if restricted to a value of between 0 and 1), there is no explicit,
general solution for this polynomial. However, solving numerically for specific values
of α is possible.
If α = 0, the condition becomes 3µ5 − 11µ4 − 58µ3 + 306µ2 − 297µ − 135 = 0,which can be written as:
3(µ+ 5)(µ+1
3)(µ− 3)3 = 0,
yielding three solutions: −5, −13, 3. The second order condition does not hold for
µ = −5 and µ = 3, so that only µ = −13is a solution for α = 0. Note that this
solution is identical to the symmetric solution of the CC-subgame. This confirms
our finding because the DD-subgame with α = 0 is mathematically identical to the
CC-subgame. This completes the proof of the first part of Proposition 3.3.
If α = 1, the condition becomes µ5+3µ4− 6µ3+10µ2+5µ− 45 = 0. This yieldsthree real solutions (−4.62, −1.53, and 1.67) and two complex solutions. The firstsolution (−4.62) results in negative values for q, which is not possible by assumption.The third solution (1.67) produces negative values for the transfer price w, which
is not possible by assumption. The second solution (−1.53) is admissable (secondorder condition holds, and q, w, and P are positive).
We have numerically calculated the solutions to the above polynomial (assuming
symmetry) for 100 values of α between 0 and 1. The results show that there is a
unique symmetric solution to the DD-subgame. The incentive parameter decreases
monotonically from µDD = −13(α = 0) to µDD = −1.53 (α = 1). The transfer price
increases from wDD = 0 (α = 0) to wDD = 0.56a (α = 1). The output quantity of
120

each firm decreases monotonically from qDD = 3a8b(α = 0) to qDD = 0.30a
b(α = 1).
Profits increase monotonically from πDD = 3a2
32b(α = 0) to πDD = 0.12a
2
b(α = 1).
Thus, as α increases, the transfer price increases, which reduces output because of
double marginalization, which, in turn, is partially offset by a decreasing µ. Overall,
the output quantity decreases in the direction of the monopoly or collusive output,
increasing firm and industry profits (for ease of reference, denote firm profits in the
symmetric DD-case as πDD−si ). This completes the proof of part two of Proposition
3.3.
If α = αo = 23, µDD = −1, wDD = a
3, qDD = a
3b, and πDD = a2
9b= πCournot.
Since πDD increases monotonically in α, πDD > πCournot if and only if α > αo. This
completes the proof of the third part of Proposition 3.3. ¤For completeness, we analyze the general case of this subgame in which sym-
metry is not assumed. Numerically solving the DD-subgame without assuming
symmetry yields asymmetric solutions for specific ranges of parameter values and
the same symmetric solutions that are discussed above. Two asymmetric solutions
are dismissed because they yield negative values for qi and wi. Four asymmetric
solutions remain for which the second order condition is satisfied, and qi, wi, and P
are positive. These solutions exist only if α > α0, where α0 = 0.86. Two of these
solutions yield high profits for one firm and low profits for the other firm; denote
these profits as πDDH and πDD
L , respectively. The other two solutions yield very high
profits for one firm (approaching the monopoly profits) and very low profits for the
other firm (approaching 0); denote these as πDDHH and πDD
LL , respectively.36 The val-
ues for the asymmetric solutions to the DD-subgame are as follows. πDDH decreases
(monotonically) from 0.22a2
b(α = α0) to 0.18a
2
b(α = 1), πDD
L increases from 0.02a2
b
(α = α0) to 0.06a2
b(α = 1), πDD
HH increases from 0.23a2
b(α = α0) to 0.25a
2
b(α = 1),
and πDDLL decreases from 0.01a
2
b(α = α0) to 0 (α = 1). As shown in Appendix B
Section 5, the asymmetric solutions of the DD-subgame do not constitute SPEs of
the overall game.
36Since each firm can either have the high or low profits, this makes a total of four equilibriumsolutions.
121

7.4. Proof of Proposition 3.4
Proposition 3.4 deals with the case that OiOj = DC, allowing µi ∈ < (the DC-
subgame). This subgame consists of three stages, in which, respectively, µi, wD,
and qi are determined. In Section 3.4, the DC-subgame is discussed in relative
detail, so that the discussion here will be brief.
In equilibrium, the incentive parameters are as follows: µDC = α−4αand µCD = 1.
Thus, for 0 < α ≤ 1, µDC < 0 and µCD > 0, which completes the proof of the first
part of Proposition 3.4.
Industry profits are equal to a2
4bindependent of α, which equals the monopoly
profits. This proves the second part of Proposition 3.4.
The profits of the decentralized firm are given by πDC = a2
8b(2 − α), which de-
creases in α. The profits of the centralized firm are given by πCD = a2
8bα, which
increases in α. Thus, if 0 < α < 1, πDC > πCD. If α = 1, the profits of both firms
are equal to a2
8b. This completes the proof of the third part of Proposition 3.4. ¤
7.5. Proof of Proposition 3.5
The SPE of the overall game is determined by comparing the equilibrium profits
of the four subgames (CC, CD, DC, and DD). In Section 3.5, each subgame is
evaluated as a candidate for the SPE. A subgame is SPE (for a certain value of α) if
there is no unilateral deviation possible that increases the payoff of a player. Here,
we follow the same structure and provide some details that have been omitted in
Section 3.5.
The CC-subgame does not constitute an SPE. Note that πCC−s < πDC ∀α,which precludes CC−s (the symmetric solution to the CC-subgame) to be an SPE.Moreover, since πCCL < πCC−s < πDC ∀α, asymmetric solutions to the CC-subgamecannot be an SPE, either.
Asymmetric DD-subgames do not constitute an SPE. Note that πDDLL < πDD
L <
πCD ∀α, which means that the firm that obtains low profits in the asymmetric
DD-subgame could increase its payoffs by defecting to DC.
For low enough α (α < α∗ = 0.95), DD − s is an SPE, because πCD < πDD−s,
122

which means that defecting to DC would not increase the firm’s profits. For α > α∗,
DD − s does not constitute an SPE.
Whether theDC- andCD-subgames constitute SPEs depends on the off-equilibrium
path strategies, i.e., the strategies that are related to the DD- and CC-subgames.
For simplicity, we first restrict the equilibria on the off-equilibrium path to being
symmetric. Now, we explore whether the decentralized (centralized) firm has an
incentive to defect to the CC− s- (DD− s)-subgame. Recall that πCD < πDD−s for
α < α∗ and πCD > πDD−s for α > α∗, and πDC > πCC−s ∀α. Consequently, if theoff-equilibrium path strategies are symmetric, DC is an SPE for α > α∗.
However, if the centralized firm could obtain high or very high profits (remember
that there are two pairs of asymmetric solutions) in the asymmetric DD-subgame,
this would increase its profits, and therefore DC (for α > α∗) would not be an SPE.
The same reasoning holds if the decentralized firm could obtain high profits in
an asymmetric CC-subgame, with the understanding that the CC-subgame has a
continuum of asymmetric solutions, rather than two pairs of asymmetric solutions.
The equilibrium value for µ1 (implying µ2), such that πDC = πCCH , is given by
µ1 =2α−32α−1 (µ1 is the incentive parameter in the CC-subgame of the firm that was
decentralized in the DC-subgame). For example, when α = α∗, µ1 =2α∗−32α∗−1 = −1.22
implies that πDC = πCCH . The DC-equilibrium can only be an SPE if µ1 >2α−32α−1 in
the equilibrium of the CC-subgame. As α increases, this restriction becomes more
strict, until at α = 1, µ1 must be larger than −1. In conclusion, the DC-equilibrium
is an SPE of the overall game for α > α∗, provided that the decentralized firm inDC
is not too aggressive in the off-equilibrium CC-subgame. Note again that symmetry
in the CC-subgame, i.e., µ = −13, is sufficient, but not necessary, to avoid the risk
of defecting to CC.
Finally, consider the possibility that the defecting firm would obtain low rather
than high asymmetric profits in the DD-subgame. In this case, DC could also be
an SPE for α0 < α ≤ α∗. This would happen if the centralized firm obtained low
or very low profits in the DD-subgame (πDDLL < πDD
L < πCD) and the decentralized
firm obtained not too high profits in the CC-subgame, i.e., if µ1 >2α−32α−1 , as before.
123

To summarize, the CC-subgame and asymmetric DD-subgame are not SPEs
of the overall game. The symmetric solution to the DD-subgame constitutes an
SPE, iff α < α∗, without any restrictions on the off-equilibrium path strategies.
The DC- and CD-subgames are SPEs for α > α∗, iff the off-equilibrium strategies
in the DD-subgame yield low, very low, or symmetric profits for the firm that is
centralized in DC/CD, and the off-equilibrium strategy in the CC-subgame of firm
D satisfies µ1 >2α−32α−1 . The DC- and CD-subgames are SPEs for α0 < α < α∗, iff
the off-equilibrium strategies in the DD-subgame yield low or very low profits for
firm C, and the off-equilibrium strategy in the CC-subgame of firm D satisfies µ1 >2α−32α−1 . Thus, for α < α0, the SPE is unique (DD−s), for α0 < α < α∗, three equilibria
exist (DD − s, DC, and CD), and for α > α∗, two equilibria exist that are each
other’s mirror image (DC and CD).
Assuming symmetry on the off-equilibrium path, the formulation of the SPE is
simpler: DD − s is an SPE for 0 < α < α∗ (first part of Proposition 3.5) and DC
and CD are equilibria for α∗ < α ≤ 1 (part two of Proposition 3.5), without furtherrestrictions. Recall, from Section 3.3, that we denote αo = 2
3the value of α for which
πDD(α) equals the standard Cournot profits. Note that, if 0 < α ≤ αo, DD−s is theunique equilibrium and the industry profits are lower than, or equal to, the standard
Cournot profits (i.e., ΠDD−s ≤ ΠCournot). This completes the proof of the third part
of Proposition 3.5. If αo < α ≤ 1, DD− s and DC/CD are equilibria. In this case,
ΠDD−s > ΠCournot and the industry profits in the DC- and CD-subgames are larger
than standard Cournot profits, independent of α. Thus, the use of decentralization
and relative performance evaluation in combination increases profits iff α > αo. This
completes the proof of the fourth part of Proposition 3.5. ¤
124

125
8. Appendix C. List of Interviewees for Field Study (p. 1) Person
Function Organization Topics How Date
Ben Senior VP Franchise hotel corporation 4, USA pricing, CO vs. FR, price leadership, franchising strategy, cost structure
person dec-04
Bill General Manager upscale company-owned hotel, Albania
pricing, CO vs. FR person mar-04
Caroline Revenue Manager East & Central Europe
hotel corporation 5, Europe yield mgt, competition, pricing policy person may-04
Cathy Enz Professor Cornell Hotel School competition, yield mgt, franchising, difference between ownership forms
person aug-04
Charlotte General Manager upscale independent hotel, France
pricing, yield mgt cost structure, compensation, pricing
person person
oct-02 nov-02
Chris Revenue Manager West Europe
hotel corporation 5, Europe CO vs. FR, competition, yield mgt, price discrimination
person jan-05
Gordon Principal hotel consultancy, Texas competition, ownership forms, customer segments, development
person apr-04
Heather Director of Finance, Europe
hotel corporation 5, Europe competition, pricing, compensation, cost structure
person may-04
Ioanna Popescu
Assistant Professor INSEAD
yield/revenue mgt person jan-03
Jack Area Manager East-Europe
hotel corporation 5, Europe mgt contract, CO vs. FR, ownership forms, pricing, competition
person mar-04
Jenny Franchising Department
hotel corporation 2, USA pricing phone nov-02

126
8. Appendix C. List of Interviewees for Field Study (p. 2, continued) Person
Function Organization Topics How Date
Jim Accounting Department
hotel corporation 1, USA franchise fees phone may-04
John Owner, franchisee economy franchised hotel sales force mgt, competition, market segments, franchise fees,
person email
dec-04
Laura Manager midscale company-owned hotel 3, France
organization person dec-02
Lydia Research Director American Hotel & Lodging Association Info Center
difference between ownership forms, franchising, brand segments
phone email
sep-03
Matthew Sales & Marketing Manager
upscale company-owned hotel, Texas
pricing, competition, compensation, sales force mgt, CO vs. FR
person dec-04
Nicolas Vice President hotel corporation 4, Europe cost structure, competitive strategy, pricing, compensation, incentives
person feb-03
Olivier General Manager economy company-owned hotel 2, France
cost structure, budgeting person nov-02
Paul VP Pricing & Information Systems
hotel corporation 4, USA pricing, branding, competition, economic cycles, price leadership
person dec-04
Peter Franchising Department
hotel corporation 5, USA mgt contract, ownership forms phone nov-03
Raj Owner, Manager
economy franchised hotel, Texas
expansion through franchising, location choice
phone email
nov-03
Robert Franchising Department
hotel corporation 3, USA pricing, franchise fees, incentives phone nov-02
Sarah Franchising Department
hotel corporation 1, USA pricing (franchisor vs. franchisee) phone nov-02
Stephan Room Department Manager
upscale company-owned hotel 1, France
pricing, difference between ownership forms
person oct-02

127
9. Appendix D. Brands Operating Both Franchised and Company-Owned Hotels
SegmentBrand Abbr. Brand
Price US$
Occupancy rate
Capacity (rooms)
Royalty fee
Perc. FR
Perc. CO
Nr of hotels
1 CTRYH Country Hearth Inn 50.55 55.4% 42 4.00% 28% 72% 81 MTL 6 Motel 6 36.95 64.7% 110 4.00% 14% 86% 951 REDRF Red Roof Inns 44.62 60.1% 129 4.48% 24% 76% 281 SHONE Shoney's Inns & Suites 50.56 55.0% 98 3.50% 33% 67% 71 STUD6 Studio 6 35.69 66.3% 131 5.00% 17% 83% 62 BAYMT Baymont Inns & Suites 49.58 57.2% 105 5.00% 21% 79% 102 CANDL Candlewood Hotels 59.52 63.5% 121 4.75% 13% 87% 112 HAMPT Hampton Inns & Suites 66.68 66.0% 105 4.00% 91% 9% 612 MAINS Mainstay Suites 61.59 55.0% 80 4.50% 72% 28% 42 SLEEP Sleep Inns 53.32 55.9% 84 4.50% 60% 40% 92 TOWNP Town Place Suites 68.66 60.1% 106 5.00% 62% 38% 52 WELLS Wellesley Inn & Suites 53.64 56.4% 124 4.50% 15% 85% 73 DCLUB Club Hotel by Doubletree 72.41 59.0% 190 3.88% 61% 39% 43 HARVE Harvey Hotels 82.33 61.2% 314 4.52% 31% 69% 53 HOLID Holiday Inn 68.58 61.2% 214 5.04% 83% 17% 784 AMSTE AmeriSuites 76.82 63.3% 127 5.00% 22% 78% 154 COURT Courtyard by Marriott 87.86 70.0% 137 5.42% 58% 42% 374 CROWN Crowne Plaza Hotels 76.85 62.4% 278 5.00% 37% 63% 64 HOMEW Homewood Suites by Hilton 100.53 65.5% 103 4.00% 69% 31% 164 RADIS Radisson 79.72 59.2% 272 4.00% 87% 13% 144 RESID Residence Inn by Marriott 98.95 72.6% 110 4.96% 59% 41% 294 STAYB Staybridge 88.48 60.2% 111 5.00% 20% 80% 34 WYNDH Wyndham Hotels & Resorts 110.05 61.0% 404 5.00% 36% 65% 85 DBLST Doubletree Suites 131.99 73.0% 269 3.94% 54% 46% 25 DOUBL Doubletree 108.02 67.7% 374 3.94% 86% 14% 65 EMBAS Embassy Suites 113.12 69.2% 224 4.00% 45% 55% 165 OMNI Omni Hotels 112.87 64.0% 363 3.00% 11% 89% 95 SHERA Sheraton Hotels/Inn/Resorts 97.01 61.6% 308 5.00% 73% 27% 10
Legend. Average price in US$ per night per room. Segments: (1) economy, (2) mid-scale without food and beverage, (3) midscale with food and beverage, (4) upscale, and (5) upper upscale. Percentage franchised/company-owned: average number of units in Texas that are company-owned/franchised divided by the total number of units for the same chain.

128
10. Appendix E. Examples of Company-Owned and Franchised Hotels
Fig 1. Company-owned hotel Fig 2. Franchised hotel Red Roof Red Roof New Loop 410 US Highway 90 San Antonio, Texas San Antonio, Texas Average price (1997-2002): US$ 45 Average price (1997-2002): US$ 40

129
References
[1] Aggarwal, R. K., & Samwick, A. A. 1999. Executive compensation,
strategic competition, and relative performance evaluation: Theory and
evidence. Journal of Finance, 54(6): 1999-2043.
[2] Aiken, L. S., & West, S. G. 1991. Multiple regression: Testing and
interpreting interactions. Newbury Park: Sage Publications.
[3] Alles, M., & Datar, S. 1998. Strategic transfer pricing. Management
Science, 44(4): 451-461.
[4] Andrews, K. R. 1971. The Concept of Corporate Strategy. Homewood, IL:
Dow Jones-Irwin.
[5] Bain, J. 1956. Industrial Organization. New York: Wiley.
[6] Balasubramanian, S., & Bhardwaj, P. 2004. When Not All Conflict Is Bad:
Manufacturing-Marketing Conflict and Strategic Incentive Design.
Management Science, 50(4): 489-503.
[7] Barron, J. M., & Umbeck, J. R. 1984. The Effects of Different Contractual
Arrangements: The Case of Retail Gasoline Markets. Journal of Law &
Economics, 27(2): 313-328.
[8] Bartlett, C. A., & Ghoshal, S. 1989. Managing Across Borders: The
Transnational Solution. Boston, MA: Harvard Business School Press.
[9] Baum, J. A. C., & Mezias, S. J. 1992. Localized competition and
organizational failure in the Manhattan hotel industry, 1898-1990.
Administrative Science Quarterly, 37(4): 580-604.
[10] Baye, M. R., Crocker, K. J., & Ju, J. 1996. Divisionalization, Franchising,
and Divestiture Incentives in Oligopoly. American Economic Review, 86(1):
223-236.
[11] Bergen, M., Dutta, S., & Walker, O. C., Jr. 1992. Agency Relationships in
Marketing: A Review of the Implications and Applications of Agency and

130
Related Theories. Journal of Marketing, 56(3): 1-24.
[12] Bertrand, J. 1883. Théorie Mathématique de la Richesse Sociale. Journal
des Savants: 499-508.
[13] Besanko, D., Dranove, D., & Shanley, M. 2000. Economics of Strategy. New
York, NY: John Wiley & Sons Inc.
[14] Bhardwaj, P. 2001. Delegating Pricing Decisions. Marketing Science, 20(2):
143-170.
[15] Bonanno, G., & Vickers, J. 1988. Vertical Separation. Journal of Industrial
Economics, 36(3): 257-265.
[16] Brickley, J. A., & Dark, F. H. 1987. The choice of organizational form: The
case of franchising. Journal of Financial Economics, 18(2): 401-420.
[17] Canina, L., Enz, C. A., & Harrison, J. S. Forthcoming. Agglomeration
Effects and Strategic Orientations: Evidence from the U.S. Lodging
Industry. Academy of Management Journal.
[18] Chandler, A. D., Jr. 1962. Strategy and Structure: Chapters in the History
of the Industrial Enterprise. Cambridge, MA: MIT Press.
[19] Chandy, R. K., & Tellis, G. J. 1998. Organizing for radical product
innovation: The overlooked role of willingness to cannibalize. Journal of
Marketing Research, 35(4): 474-487.
[20] Chopin, M. C. 1999. Executive Compensation in Oligopolies: Sales, Profit,
and Pay, Advances in Applied Microeconomics, Vol. 8: 101-122. Greenwich,
CT: JAI Press Inc.
[21] Christensen, C. M. 1997. The innovator’s dilemma: when new technologies
cause great firms to fail. Boston, Mass.: Harvard Business School Press.
[22] Chung, W., & Kalnins, A. 2001. Agglomeration Effects and Performance: A
Test of the Texas Lodging Industry. Strategic Management Journal, 22(10):
967-986.

131
[23] Combs, J. G., Michael, S. C., & Castrogiovanni, G. J. 2004. Franchising: A
Review and Avenues to Greater Theoretical Diversity. Journal of
Management, 30(6): 907-932.
[24] Conlin, M. 2003. The Effect of Franchising on Competition: An Empirical
Analysis. Working Paper.
[25] Conlin, M., & Kadiyali, V. 1999. Capacity and Collusion: An Empirical
Analysis of the Texas Lodging Industry. Working Paper.
[26] Conlin, M., & Kadiyali, V. 2002. Entry Deterrence Capacity in the Texas
Lodging Industry. Working Paper.
[27] Corts, K. S. 2001. The Strategic Effects of Vertical Market Structure:
Common Agency and Divisionalization in the US Motion Picture Industry.
Journal of Economics & Management Strategy, 10(4): 509-528.
[28] Coughlan, A. T., Anderson, E., Stern, L., & El-Ansary, A. I. 2001.
Marketing Channels. Upper Saddle River, NJ: Prentice Hall.
[29] Coughlan, A. T., & Wernerfelt, B. 1989. On Credible Delegation by
Oligopolists: A Discussion of Distribution Channel Management.
Management Science, 35(2): 226-239.
[30] Cournot, A. 1838. Recherches sur les Principes Mathématiques de la
Théorie des Richesses. New York: Macmillian (English edition).
[31] Dailey, M. J. 1998. Franchise rules you should know. Journal of
Accountancy, 186(3): 57-61.
[32] Dalrymple, D. J., & Cron, W. L. 1995. Sales Management: Concepts and
Cases (5th ed.). New York: Wiley.
[33] De Roos, J. A., & Rushmore, S. 2000. Hospitality Valuation Software: Hotel
Market Studies, Financial Projections, and Valuations; Operating and Use
Guide, second edition ed. Mineola, NY: Hotel Valuation Software Inc.
[34] Dierickx, I., & Cool, K. 1989. Asset Stock Accumulation and Sustainability
of Competitive Advantage. Management Science, 35(12): 1504-1511.

132
[35] Directory of Hotel & Lodging Companies. 2003. Washington, DC: American
Hotel & Lodging Association.
[36] Enz, C. A., Canina, L., & Lomanno, M. 2004. Why Discounting Doesn't
Work: The Dynamics of Rising Occupancy and Falling Revenue among
Competitors. Cornell Center for Hospitality Research Report, 4(7): 6-25.
[37] Faulí-Oller, R., & Giralt, M. 1995. Competition and Cooperation Within a
Multidivisional Firm. Journal of Industrial Economics, 43(1): 77-99.
[38] Fershtman, C., & Judd, K. L. 1987. Equilibrium Incentives in Oligopoly.
American Economic Review, 77(5): 927-940.
[39] Fershtman, C., Judd, K. L., & Kalai, E. 1991. Observable Contracts:
Strategic Delegation and Cooperation. International Economic Review,
32(3): 551-559.
[40] Friedman, M. 1953. The Methodology of Positive Economics, in Essays in
Positive Economics (Ch. 1). Chicago: University of Chicago Press.
[41] Fudenberg, D., & Tirole, J. 1991. Game theory. Cambridge, Mass.: MIT
Press.
[42] Galunic, D. C., & Eisenhardt, K. M. 1996. The Evolution of Intracorporate
Domains: Divisional Charter Losses in High-technology, Multidivisional
Corporations. Organization Science, 7(3): 255-282.
[43] Ghemawat, P. 1991. Commitment: the dynamic of strategy. New York: Free
Press.
[44] Gibbons, R., & Murphy, K. J. 1990. Relative Performance Evaluation for
Chief Executive Officers. Industrial & Labor Relations Review, 43(3): 30-51.
[45] Gimeno, J., Dial, J., & Sengul, M. 2001. Designing Incentive Systems That
Shape Competitive Interaction. Paper presented at the Strategic
Management Society Conference, San Francisco.
[46] Gimeno, J., & Woo, C. Y. 1996. Hypercompetition in a Multimarket
Environment: The Role of Strategic Similarity and Multimarket Contact in

133
Competitive De-escalation. Organization Science, 7(3): 322-341.
[47] Graddy, K. 1997. Do fast-food chains price discriminate on the race.
Journal of Business & Economic Statistics, 15(4): 391-401.
[48] Greve, H. R. 2003. Why are there so many multiunit organizations?
Strategic Organization, 1(1): 109-115.
[49] Greve, H. R., & Baum, J. A. C. 2001. Introduction: A multiunit,
multimarket world, Multiunit Organization and Multimarket Strategy, Vol.
18: 1-28.
[50] Gupta, A. K., & Govindarajan, V. 1984. Business Unit Strategy,
Managerial Characteristics, and Business Unit Effectiveness at Strategy
Implementation. Academy of Management Journal, 27(1): 25-41.
[51] Hamilton, B. H., & Nickerson, J. A. 2003. Correcting for endogeneity in
strategic management research. Strategic Organization, 1(1): 51-72.
[52] Hatten, K. J., & Schendel, D. E. 1977. Heterogeneity within an Industry:
Firm Conduct in the U.S. Brewing Industry, 1965-71. Journal of Industrial
Economics, 26(2): 97-113.
[53] Hermalin, B. E. 1994. Heterogeneity in Organizational Form - Why
Otherwise Identical Firms Choose Different Incentives For Their Managers.
Rand Journal of Economics, 25(4): 518-537.
[54] Hill, C. W. L., Hitt, M. A., & Hoskisson, R. E. 1992. Cooperative Versus
Competitive Structures In Related and Unrelated Diversified Firms.
Organization Science, 3(4): 501-521.
[55] Holmström, B. 1979. Moral hazard and observability. Bell Journal of
Economics, 10(1): 74-91.
[56] Hotel & Motel Magazine. 1997-2002. Franchising Supplement.
[57] Hotelling, H. 1929. Stability in Competition. The Economic Journal,
39(153): 41-57.

134
[58] Ingram, P. 1996. Organizational form as a solution to the problem of
credible commitment: The evolution of naming strategies among U.S. hotel
chains, 1896-1980. Strategic Management Journal, 17(Evolutionary
Perspectives on Strategy): 85-98.
[59] Ingram, P., & Baum, J. A. C. 1997. Chain affiliation and the failure of
Manhattan hotels, 1898 - 1980. Administrative Science Quarterly, 42(1): 68-
102.
[60] Ingram, P., & Roberts, P. W. 2000. Friendships among competitors in the
Sydney hotel industry. American Journal of Sociology, 106(2): 387-423.
[61] Janakiraman, S. N., Lambert, R. A., & Larcker, D. F. 1992. An Empirical
Investigation of the Relative Performance Evaluation Hypothesis. Journal
of Accounting Research, 30(1): 53-69.
[62] Joh, S. W. 1999. Strategic managerial incentive compensation in Japan:
Relative performance evaluation and product market collusion. Review of
Economics and Statistics, 81(2): 303-313.
[63] Kalnins, A. 2003. An Empirical Analysis of Territorial Encroachment
within Franchised and Company-Owned Branded Chains. Working Paper.
[64] Kalnins, A., & Lafontaine, C. 1996. The Characteristics of Multi-Unit
Ownership in Franchising: Evidence from Fast-Food Restaurants in Texas.
National Bureau of Economic Research, Working paper No. 5859.
[65] Kaplan, R. S., & Atkinson, A. A. 1998. Advanced Management Accounting.
Upper Saddle River, NJ: Prentice Hall.
[66] Kaplan, R. S., & Norton, D. P. 1996. The Balanced Scorecard. Boston,
MA: Harvard Business School Press.
[67] Katz, M. L. 1991. Game-Playing Agents: Unobservable Contracts as
Precommitments. Rand Journal of Economics, 22(3): 307-328.
[68] Lafontaine, F. 1995. Pricing Decisions in Franchised Chains: A Look at the
Fast-Food Industry. National Bureau of Economic Research, Working

135
paper #5247.
[69] Lafontaine, F. 1999. Franchising Versus Corporate Ownership: The Effect
on Price Dispersion. Journal of Business Venturing, 14(1): 17-34.
[70] Lafontaine, F., & Shaw, K. L. 1999. The dynamics of franchise contracting:
Evidence from panel data. Journal of Political Economy, 107(5): 1041-1080.
[71] Lafontaine, F., & Slade, M. E. 1997. Retail contracting: Theory and
practice. Journal of Industrial Economics, 45(1): 1-25.
[72] Lippman, S. A., & Rumelt, R. P. 1982. Uncertain imitability: an analysis of
interfirm differences in efficiency under competition. Bell Journal of
Economics, 13(2): 418-438.
[73] Martin, R. E. 1988. Franchising and Risk Management. American
Economic Review, 78(5): 954-968.
[74] McGuire, T. W., & Staelin, R. 1983. An Industry Equilibrium Analysis of
Downstream Vertical Integration. Marketing Science, 2(2): 161-191.
[75] McPherson, M. 1983. An Ecology of Affiliation. American Sociological
Review, 48(4): 519-532.
[76] Miller, N., & Pazgal, A. 2002. Relative Performance as a Strategic
Commitment Mechanism. Managerial & Decision Economics, 23(2): 51-68.
[77] Miller, N. H., & Pazgal, A. I. 2001. The equivalence of price and quantity
competition with delegation. RAND Journal of Economics, 32(2): 284-301.
[78] Moorthy, K. S. 1988. Strategic Decentralization in Channels. Marketing
Science, 7(4): 335-355.
[79] Muris, T. J., Scheffman, D. T., & Spiller, P. T. 1992. Strategy and
Transaction Costs: The Organization of Distribution in the Carbonated Soft
Drink Industry. Journal of Economics and Management Strategy, 1: 83-128.
[80] Nalebuff, B. J., & Stiglitz, J. E. 1983. Prizes and incentives: towards a
general theory of compensation and competition. Bell Journal of
136
Economics, 14(1): 21-43.
[81] Perry, M. K. 1989. Vertical Integration: Determinants and Effects. In R.
Schmalensee, & R. D. Willig (Eds.), Handbook of Industrial Organization,
Vol. I. Amsterdam: Elsevier Science Publishers.
[82] Porter, M. E. 1980. Competitive Strategy: Techniques for Analyzing
Industries and Competitors. New York: Free Press.
[83] Rushmore, S., & Baum, E. 2002. Growth and Development of the Hotel-
Motel Industry. The Appraisal Journal, 70(2): 148-162.
[84] Rushmore, S., & Lee, W. D. 2002. 2001 Hotel Franchise Fees Analysis
Guide. New York, NY: HVS International.
[85] Salas Fumás, V. 1992. Relative Performance Evaluation of Management.
International Journal of Industrial Organization, 10(3): 473-489.
[86] Schelling, T. C. 1960. The strategy of conflict. Cambridge,: Harvard
University Press.
[87] Schmidt, T. 1994. An Analysis of Intrabrand Competition in the Franchise
Industry. Review of Industrial Organization, 9(3): 293-310.
[88] Selznick, P. 1957. Leadership in Administration: A Sociological
Interpretation. New York: Harper & Row.
[89] Sengul, M. 2001. Divisionalization: Strategic Effects of Organizational
Structure. Paper presented at the Strategic Management Society
Conference, San Francisco.
[90] Shepard, A. 1993. Contractual form, retail price, and asset characteristics in
gasoline retailing. RAND Journal of Economics, 24(1): 58-77.
[91] Sklivas, S. D. 1987. The Strategic Choice of Managerial Incentives. Rand
Journal of Economics, 18(3): 452-458.
[92] Slade, M. E. 1993. Strategic Motives for Vertical Separation: Evidence from
Retail Gasoline. University of British Columbia Discussion Paper No. 93-

137
12.
[93] Slade, M. E. 1998a. Beer and the tie: Did divestiture of brewer-owned
public houses lead to higher beer prices? Economic Journal, 108(448): 565-
602.
[94] Slade, M. E. 1998b. Strategic Motives for Vertical Separation: Evidence
From Retail Gasoline Markets. Journal of Law, Economics & Organization,
14(1): 84-113.
[95] Spengler, L. 1950. Vertical Integration and Anti-trust Policy. Journal of
Political Economy, 58: 347-352.
[96] Stigler, G. J. 1964. A Theory of Oligopoly. Journal of Political Economy,
72: 44-61.
[97] Sutton, J. 1991. Sunk Cost and Market Structure: Price Competition,
Advertising, and the Evolution of Concentration. Cambridge, MA: MIT
Press.
[98] Texas Hotel Performance Factbook. 1997-2002. San Antonio, TX: Source
Strategies, Inc.
[99] Tirole, J. 1988. The Theory of Industrial Organization. Boston, MA: MIT
Press.
[100] Van Mieghem, J. A. 1999. Coordinating Investment, Production, and
Subcontracting. Management Science, 45(7): 954-971.
[101] Vaysman, I. 1998. A model of negotiated transfer pricing. Journal of
Accounting & Economics, 25(3): 349-385.
[102] Vickers, J. 1985. Delegation and the Theory of the Firm. Economic
Journal, 95(Supplement): 138-147.
[103] Vives, X. 1999. Oligopoly Pricing: Old Ideas and New Tools. Cambridge,
MA: MIT Press.
[104] Wall Street Journal. 2005. Global Business Briefs: Telenor ASA. May 24:

138
A4.
[105] Wall Street Journal. 2005. Rigid-Packaging Firms Are on a Roll. May 24:
M5.
[106] Wernerfelt, B. 1984. A Resource-Based View of the Firm. Strategic
Management Journal, 5(2): 171-181.
[107] Williamson, O. E. 1985. The Economic Institutions of Capitalism. New
York, NY: Free Press.
[108] Williamson, O. E. 1991. Strategizing, Economizing, and Economic
Organization. Strategic Management Journal, 12(Winter): 75-94.