strategic outline business case (redacted to omit
TRANSCRIPT
A582 South Ribble Western Distributor
Strategic Outline Business Case
(Redacted to omit commercially sensitive information – April 2020)
| Rev 1.0 (Redacted)
July 2019
Lancashire County Council
Strategic Outline Busi ness C ase
i
A582 South Ribble Western Distributor
Project No: B2327FT6
Document Title: Strategic Outline Business Case
Document No.:
Revision: Rev 1.0
Date: July 2019
Client Name:
Client No: Lancashire County Council
Project Manager: Sergey Makov
Author: Mohsen Zare
File Name: P:\B2000000\B2327FT6 - A582 Business Case\3 JC Tech Work\3.1 Transportation\3.1.2
Reports\09 - SOBC\B2327FT6 - A582 SOBC - Rev1.0 -26072019.docx
Jacobs U.K. Limited
1 City Walk
Leeds, West Yorkshire LS11 9DX
United Kingdom
T +44 (0)113 242 6771
F +44 (0)113 389 1389
www.jacobs.com
© Copyright 2019 Jacobs U.K. Limited. The concepts and information contained in this document are the property of Jacobs. Use or copying of
this document in whole or in part without the written permission of Jacobs constitutes an infringement of copyright.
Limitation: This document has been prepared on behalf of, and for the exclusive use of Jacobs’ client, and is subject to, and issued in accordance with, the
provisions of the contract between Jacobs and the client. Jacobs accepts no liability or responsibility whatsoever for, or in respect of, any use of, or reliance
upon, this document by any third party.
Document history and status
Revision Date Description By Review Approved
0a 12/07/2019 Working Draft MZ DF SM
1 26/07/2019 Final Draft for submission JC SM SM
ii
Contents
1. Introduction ............................................................................................................................................... 1
1.1 Background ................................................................................................................................................. 1
1.2 Scope .......................................................................................................................................................... 1
1.3 Purpose of Document ................................................................................................................................. 3
1.4 Document Structure .................................................................................................................................... 3
2. Scheme History and Scheme Description .............................................................................................. 4
2.1 Introduction ................................................................................................................................................. 4
2.2 Scheme History ........................................................................................................................................... 4
2.3 Scheme Description .................................................................................................................................... 6
3. The Strategic Case .................................................................................................................................... 8
3.1 Introduction ................................................................................................................................................. 8
3.2 Understanding the Current Situation .......................................................................................................... 8
3.2.1 Introduction ................................................................................................................................................. 8
3.2.2 Existing Network and Transport Services ................................................................................................... 9
3.2.3 Travel Demand and Patterns .................................................................................................................... 11
3.2.4 Journey Times, Congestion and Reliability ............................................................................................... 17
3.2.5 Accidents................................................................................................................................................... 31
3.2.6 Air Quality.................................................................................................................................................. 32
3.3 Understanding the Future Situation .......................................................................................................... 34
3.3.1 Introduction ............................................................................................................................................... 34
3.3.2 Future Housing and Business Growth ...................................................................................................... 34
3.3.3 Future Traffic Growth ................................................................................................................................ 36
3.3.4 Infrastructure provision in the Central Lancashire Highways and Transport Masterplan and Preston
City Deal and beyond ................................................................................................................................ 38
3.3.5 Impact of Not Intervening .......................................................................................................................... 39
3.4 Establishing the Need for Intervention ...................................................................................................... 40
3.5 Scheme Objectives ................................................................................................................................... 42
3.6 Policy Review and Strategic Fit ................................................................................................................ 43
3.6.1 Introduction ............................................................................................................................................... 43
3.6.2 National Policy .......................................................................................................................................... 44
3.6.3 Sub-national Policy ................................................................................................................................... 48
3.6.4 Local Policy ............................................................................................................................................... 51
3.6.5 Summary of Strategic Fit .......................................................................................................................... 53
3.7 Option Identification and Selection ........................................................................................................... 55
3.7.1 Introduction ............................................................................................................................................... 55
3.7.2 Option Generation ..................................................................................................................................... 56
3.7.3 Initial Sift.................................................................................................................................................... 57
3.7.4 Secondary Sift ........................................................................................................................................... 59
3.8 Internal and External Business Drivers ..................................................................................................... 61
3.9 Constraints and Key Risks ........................................................................................................................ 62
3.10 Synergy with other Schemes .................................................................................................................... 63
iii
3.11 Stakeholders and Consultation ................................................................................................................. 65
3.12 Summary and Conclusion ......................................................................................................................... 67
4. Economic Case ....................................................................................................................................... 69
4.1 Introduction ............................................................................................................................................... 69
4.2 Options Assessed ..................................................................................................................................... 69
4.3 Methodology ............................................................................................................................................. 69
4.3.1 Overview ................................................................................................................................................... 69
4.4 Overall Appraisal Assumptions ................................................................................................................. 71
4.4.1 Use of traffic model ................................................................................................................................... 71
4.4.2 Appraisal Period ........................................................................................................................................ 71
4.4.3 Discounting and Units of Accounts ........................................................................................................... 71
4.4.4 Uncertainty and Sensitivity Tests .............................................................................................................. 71
4.5 Scheme Cost for Economic Appraisal ...................................................................................................... 71
4.6 Monetised Benefits (‘Established’ Impacts) .............................................................................................. 72
4.6.1 Introduction ............................................................................................................................................... 72
4.6.2 Transport Economic Efficiency Benefits ................................................................................................... 72
4.6.3 Changes in Indirect Tax Revenues ........................................................................................................... 74
4.6.4 Changes in Accident Numbers ................................................................................................................. 74
4.6.5 Change in Noise, Air Quality and Greenhouse Gases ............................................................................. 74
4.6.6 Analysis of Monetised Costs and Benefits (AMCB) Table ........................................................................ 75
4.7 Monetised Benefits (‘Emerging’ and ‘Indicative’ Impacts) ........................................................................ 75
4.7.1 Introduction ............................................................................................................................................... 75
4.7.2 Wider Impacts ........................................................................................................................................... 76
4.7.3 Journey Time Reliability ............................................................................................................................ 76
4.7.4 Dependent Development .......................................................................................................................... 77
4.8 Summary of Monetised Costs and Benefits.............................................................................................. 77
4.9 Non-Monetised Benefits ............................................................................................................................ 78
4.9.1 Analysis of Non-monetised Impacts ......................................................................................................... 78
4.9.2 Environmental – Landscape ..................................................................................................................... 78
4.9.3 Environmental – Townscape..................................................................................................................... 79
4.9.4 Environmental – Historic Environment ...................................................................................................... 79
4.9.5 Environmental – Biodiversity .................................................................................................................... 79
4.9.6 Environmental – Water Environment ........................................................................................................ 79
4.9.7 Social – Physical Activity .......................................................................................................................... 79
4.9.8 Social – Journey Quality ........................................................................................................................... 80
4.9.9 Social – Severance ................................................................................................................................... 80
4.10 Distributional Impacts ................................................................................................................................ 80
4.11 Appraisal Summary Table......................................................................................................................... 80
4.12 Value for Money Statement ...................................................................................................................... 81
4.12.1 Value for Money Categorisation ............................................................................................................... 81
4.12.2 Switching Values ....................................................................................................................................... 81
iv
5. Financial Case ......................................................................................................................................... 83
5.1 Assumptions ............................................................................................................................................. 83
5.2 Base Costs Methodology .......................................................................................................................... 84
5.3 Sunk Costs and Costs to Produce Outline Business Case ...................................................................... 86
5.4 Risk ........................................................................................................................................................... 87
5.5 Inflation...................................................................................................................................................... 87
5.6 Expenditure Profile .................................................................................................................................... 88
5.7 Funding Arrangements ............................................................................................................................. 88
5.8 Conclusion ................................................................................................................................................ 89
6. Commercial Case .................................................................................................................................... 90
6.1 Introduction ............................................................................................................................................... 90
6.2 Procurement Method ................................................................................................................................ 90
6.2.1 Scheme Design Development .................................................................................................................. 90
6.2.2 Statutory Processes .................................................................................................................................. 91
6.2.3 Construction Strategy ............................................................................................................................... 92
6.3 Contract Strategy ...................................................................................................................................... 92
6.3.1 Contract Options ....................................................................................................................................... 92
6.4 Procurement Programme.......................................................................................................................... 93
6.4.1 Scheme Programme ................................................................................................................................. 93
6.5 Payment Mechanism ................................................................................................................................ 93
6.6 Pricing Framework .................................................................................................................................... 93
6.7 Contract Length ........................................................................................................................................ 93
6.8 Contract Management .............................................................................................................................. 94
6.9 Risk Allocation .......................................................................................................................................... 94
6.10 Conclusion ................................................................................................................................................ 94
7. Management Case .................................................................................................................................. 95
7.1 Introduction ............................................................................................................................................... 95
7.2 Governance .............................................................................................................................................. 95
7.2.1 High Level and Steering Governance ....................................................................................................... 95
7.2.2 Project Governance Structure................................................................................................................... 96
7.2.2.1 Scheme development stage ..................................................................................................................... 96
7.2.2.2 Strategy During Construction and Beyond ............................................................................................... 97
7.2.2.3 Forward Delivery Structure ....................................................................................................................... 97
7.3 Evidence of Successful Project Delivery .................................................................................................. 97
7.4 Assurance ................................................................................................................................................. 98
7.4.1 Funding Guarantees ................................................................................................................................. 98
7.4.2 External Views on Business Case ............................................................................................................ 98
7.4.3 Value for Money ........................................................................................................................................ 98
7.4.4 Monthly Update to Project Board .............................................................................................................. 98
7.5 Delivery Programme ................................................................................................................................. 99
7.6 Risk Management ..................................................................................................................................... 99
7.6.1 Risk Management Strategy....................................................................................................................... 99
v
7.6.2 SRWD Risk Register ................................................................................................................................. 99
7.7 Communications and Stakeholder Management .................................................................................... 100
7.7.1 Stakeholders ........................................................................................................................................... 100
7.7.2 Consultation ............................................................................................................................................ 101
7.7.3 City Deal Communications and Marketing Strategy ............................................................................... 102
7.7.4 Approach ................................................................................................................................................. 102
7.7.5 Audiences ............................................................................................................................................... 103
7.8 Monitoring and Evaluation ...................................................................................................................... 103
7.9 Benefit Realisation Plan .......................................................................................................................... 104
7.10 Conclusion .............................................................................................................................................. 104
Appendix A. Scheme Drawings
Appendix B. A582 Business Case Option Assessment Report – June 2019
Appendix C. A582 Road Widening Consultation Report - May 2015
Appendix D. Draft Central Lancashire Transport and Highways Master Plan Consultation Report - March 2013
Appendix E. Economic Assessment Report – July 2019
Appendix F. CLHTM Local Model Validation Report– April 2019
Appendix G. Addendum to CLHTM Local Model Validation Report – July 2019
Appendix H. Traffic Forecasting Report – July 2019
Appendix I. Appraisal Summary Table – July 2019
Appendix J. Distributional Impacts
Appendix K. Cost Estimate
Appendix L. A582 Risk and Issue Log
Appendix M. A582 Scheme Programme (July 2019)
Appendix N. A582 Organogram
Appendix O. A582 Governance Structure
Appendix P. City Deal Strategic and Operational Governance
Appendix Q. A582 Stakeholder Management Plan
vi
List of Figures
Figure 1.2-A: South Ribble Western Distributor- Scheme Route ............................................................................. 2 Figure 2.3-A: Extent of the A582 South Ribble Western Distributor Upgrade Scheme (including upgraded
junctions) .................................................................................................................................................................. 7 Figure 3.2-A: Existing highway and rail network in South Ribble and Preston ...................................................... 10 Figure 3.2-B: Bus services between South Ribble and Preston ............................................................................ 11 Figure 3.2-C: Strategic Movements through Central Lancashire........................................................................... 12 Figure 3.2-D: Top Inbound Travel Movements to Work into Preston and South Ribble ....................................... 13 Figure 3.2-E: Top Outbound Travel Movements to Work from Preston and South Ribble ................................... 13 Figure 3.2-F: Internal drivers of traffic movements within the Preston City Region............................................... 14 Figure 3.2-G: Modelled one-way AADT flows in the 2013 base year on the highway network in South Ribble, with
point flow locations from Table 3.2-iii ..................................................................................................................... 16 Figure 3.2-H: Arterial routes used for Trafficmaster Journey Time and Average Speed analysis ........................ 18 Figure 3.2-I: AM Peak Hour average speeds in South Ribble ............................................................................... 19 Figure 3.2-J: PM Peak Hour average speeds in South Ribble .............................................................................. 19 Figure 3.2-K: Journey Times Northbound and Southbound along the A582 in AM and PM peak hours and Inter-
peak period ............................................................................................................................................................ 20 Figure 3.2-L: Journey Times Northbound and Southbound along the A59 in AM and PM peak hours and Inter-
peak period ............................................................................................................................................................ 20 Figure 3.2-M: Journey Times Northbound and Southbound along the A6 in AM and PM peak hours and Inter-peak
period ..................................................................................................................................................................... 21 Figure 3.2-N: Journey Times Northbound and Southbound along the B5254 in AM and PM peak hours and Inter-
peak period ............................................................................................................................................................ 21 Figure 3.2-O: Average Speeds Northbound on A582 in AM and PM peak hours and Inter-peak and Off-peak
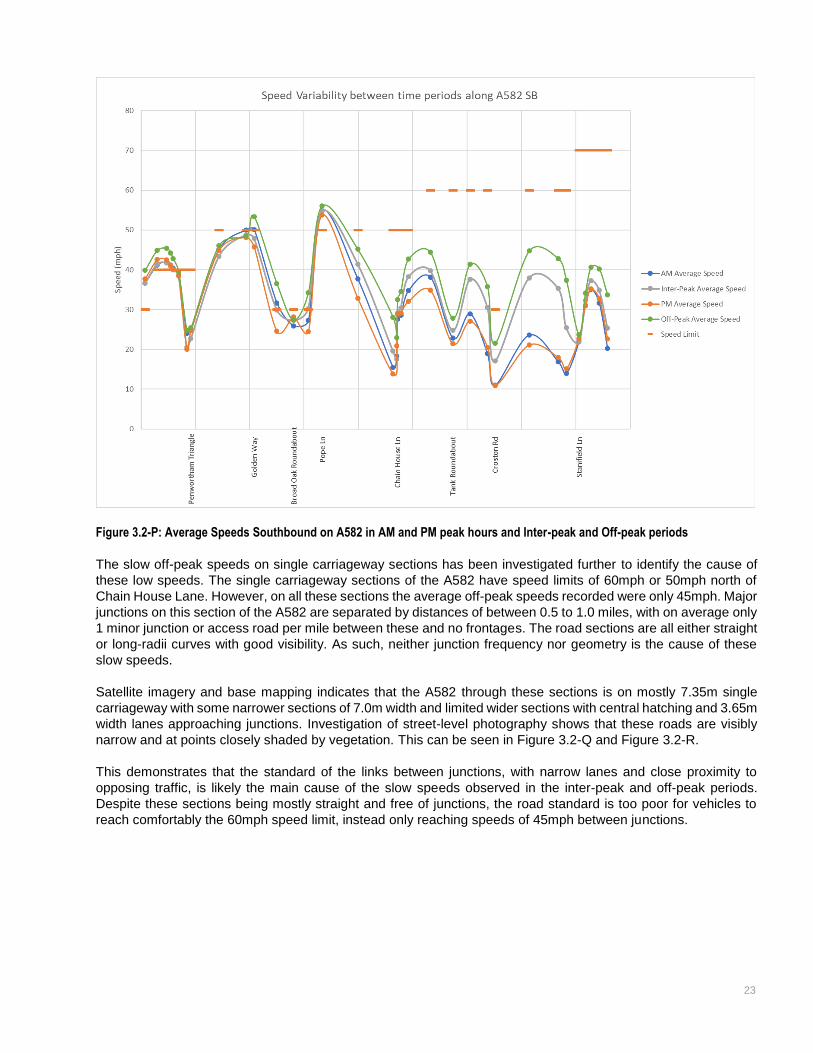
periods .................................................................................................................................................................... 22 Figure 3.2-P: Average Speeds Southbound on A582 in AM and PM peak hours and Inter-peak and Off-peak
periods .................................................................................................................................................................... 23 Figure 3.2-Q: Street level imagery of A582 Farington Rd (Point 1 from Table 3.2-iii/Figure 3.2-G) ...................... 24 Figure 3.2-R: Street level imagery of A582 Penwortham Way North (Point 4 from Table 3.2-iii/Figure 3.2-G) .... 24 Figure 3.2-S: A582 and B5254 routes between Stanifield Ln and Penwortham Triangle ..................................... 25 Figure 3.2-T: AM Peak hour daily speed variability in Northbound direction along the A582. .............................. 27 Figure 3.2-U: Inter-peak period daily speed variability in Northbound direction along the A582........................... 28 Figure 3.2-V: AM Peak hour daily speed variability in Northbound direction along the B5254. ............................ 29 Figure 3.2-W: Origins, destinations and likely routes of local traffic observed using the SRN to access Preston 31 Figure 3.2-X: Comparison of observed accidents with predicted accidents based on COBALT national average
accident rates ......................................................................................................................................................... 32 Figure 3.2-Y: AQMAs in South Ribble and the locations of the CHLTM Schemes. .............................................. 33 Figure 3.3-A: Future housing and employment growth sites in South Ribble in vicinity of the A582. ................... 35 Figure 3.3-B: Forecast AM Peak Hour flow increases from 2013 to 2037. ........................................................... 36 Figure 3.3-C: Forecast PM Peak Hour flow increases from 2013 to 2037. ........................................................... 37 Figure 3.7-A: Potential routes/locations of initial options ....................................................................................... 57 Figure 3.7-B: Sifting Criteria results of Initial Sift ................................................................................................... 58 Figure 3.7-C: Initial Sift results for option packages .............................................................................................. 60 Figure 3.7-D: Secondary Sift results for option packages ..................................................................................... 60 Figure 3.9-A: Environmental and Heritage constraints in vicinity of the A582 scheme corridor ............................ 62 Figure 3.10-A: City Deal and other proposed future transport interventions in the SRWD study area ................. 64 Figure 3.11-A: Support for Preston City Deal schemes registered during the Central Lancashire Highways and
Transport Masterplan consultation (March 2013) .................................................................................................. 66 Figure 4.3-A: Value for Money Assessment Process ............................................................................................ 70 Figure 5.6-A: Expenditure profile of outturn costs to scheme opening ................................................................. 88 Figure 7.2-A: SRWD governance structure ........................................................................................................... 96 Figure 7.7-A: Stakeholder Mapping ..................................................................................................................... 101
vii
List of Tables
Table 2.2-i: Completed junction improvements along the A582 corridor shown in Figure 2.3-A ............................. 6 Table 3.2-i: Method of travel to work for all working age usual residents (16 – 74) in employment (Census 2011)
............................................................................................................................................................................... 15 Table 3.2-ii: Car Ownership (Census 2011) ........................................................................................................... 15 Table 3.2-iii: Modelled AADT and max hourly flows against typical link Capacity and Congestion Reference Flows
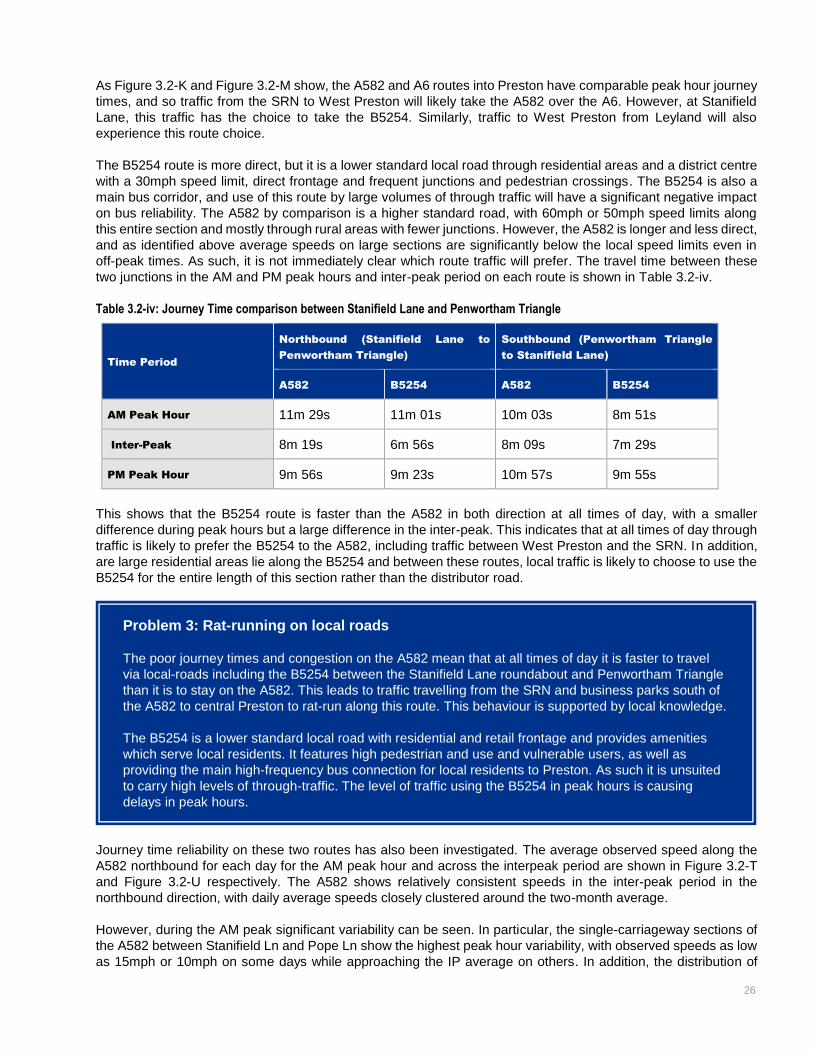
on key routes in South Ribble at locations shown in Figure 3.2-G ........................................................................ 17 Table 3.2-iv: Journey Time comparison between Stanifield Lane and Penwortham Triangle ............................... 26 Table 3.3-i: Current planning and delivery status of strategic and major development sites ................................ 35 Table 3.3-ii: Forecast AADT and max hourly flows on key routes in South Ribble at locations shown in Figure
3.2-G ...................................................................................................................................................................... 37 Table 3.7-i: Initial Options List ................................................................................................................................ 56 Table 3.7-ii: Option Packages and their constituent options .................................................................................. 59 Table 4.5-i:Present Value of Costs (2010 prices, discounted to 2010) ................................................................. 72 Table 4.6-i: Transport Economic Efficiency Benefits (2010 prices, discounted to 2010) ...................................... 73 Table 4.6-ii: Environmental Benefits (2010 prices, discounted to 2010) ............................................................... 74 Table 4.6-iii: AMCB Table for A582 South Ribble Western Distributor (£000s) .................................................... 75 Table 4.7-i: Transport Economic Efficiency Benefits (2010 prices, discounted to 2010) ...................................... 76 Table 4.7-ii: Journey Time Reliability Benefits (2010 prices, discounted to 2010) ................................................ 76 Table 4.8-i: Summary of Economic Assessment Results (2010 prices, discounted to 2010) ............................... 78 Table 5.2-i: Base costs of SRWD scheme in 2019 prices ..................................................................................... 85 Table 5.3-i: Spend to date (sunk costs) and further spend to get to Outline Business Case ................................ 86 Table 5.3-ii: Development funding sought from DfT and Local funding to meet further spend to OBC ................ 87 Table 5.4-i: Risk associated with each scheme element in 2019 prices ............................................................... 87 Table 5.5-i: Inflation associated with each scheme element and Outturn Costs ................................................... 88 Table 5.7-i: Funding sources to support outturn scheme capital costs ................................................................. 88 Table 5.8-i: Combined costs for each scheme element ......................................................................................... 89 Table 6.2-i: Delivery Team Roles Distribution ........................................................................................................ 91 Table 6.4-i: Procurement Milestones ..................................................................................................................... 93 Table 7.5-i: Key Programme Milestones ................................................................................................................ 99

1
1. Introduction
1.1 Background
Lancashire County Council (LCC) is seeking MRN funding to enhance economic growth and housing provision
through the delivery of a significant road improvement scheme on the A582 in South Ribble to the south of Preston.
The A582 South Ribble Western Distributor (SWRD) is identified in the Transport for the North’s (TfN) Investment
Programme as one of the schemes to be delivered before 2027, which will contribute towards delivery of the pan-
Northern objectives of the TfN Strategic Transport Plan.
It is also the last of the four major highway schemes identified in the Preston, South Ribble and Lancashire City
Deal, agreed with Government in September 2013 to deliver transformative, nationally significant levels of housing
and employment growth in the Preston City Region (comprising the City of Preston, the Borough of South Ribble
and the Borough of Fylde).
It is a key component of the programme of measures set out in the Central Lancashire Highways and Transport
Masterplan (CLHTM) that collectively will support the scale of development set out in the approved Central
Lancashire Core Strategy (covering the City of Preston, the Borough of South Ribble and the Borough of
Chorley) and will mitigate its impact on the transport network.
1.2 Scope
The SRWD scheme comprises 5.2km of upgrades to the existing A582 between Stanifield Land and Broad Oak
Roundabout to widen the road from the existing single carriageway to a two-lane dual carriageway with solid
concrete central reservation barrier, 500m narrow widening from Dual 2-lane to Dual 3-lanes on the westbound
carriageway between South Rings Roundabout and Stanifield Lane and 250m widening from dual 2-lane to dual
3-lanes on the northbound carriageway between the M65 Terminus Roundabout and South Rings Roundabout.
The scheme will provide access to Cuerden Strategic Employment Site and will introduce improvements to the
junctions at A582/Croston Road, B5254/A59/A582 Penwortham Triangle and the M56 Terminus Roundabout to
accommodate increased traffic on the A582 corridor and de-prioritise the B5254 at Penwortham Triangle.
The scheme will improve travel between the Strategic Road Network (SRN), employment and housing
development sites in South Ribble and Preston city centre. It will also facilitate provision of a north-south bus and
active travel corridor along B5254 which will subsequently be delivered through Preston’s Transforming Cities
Fund shortlist allocation.
2
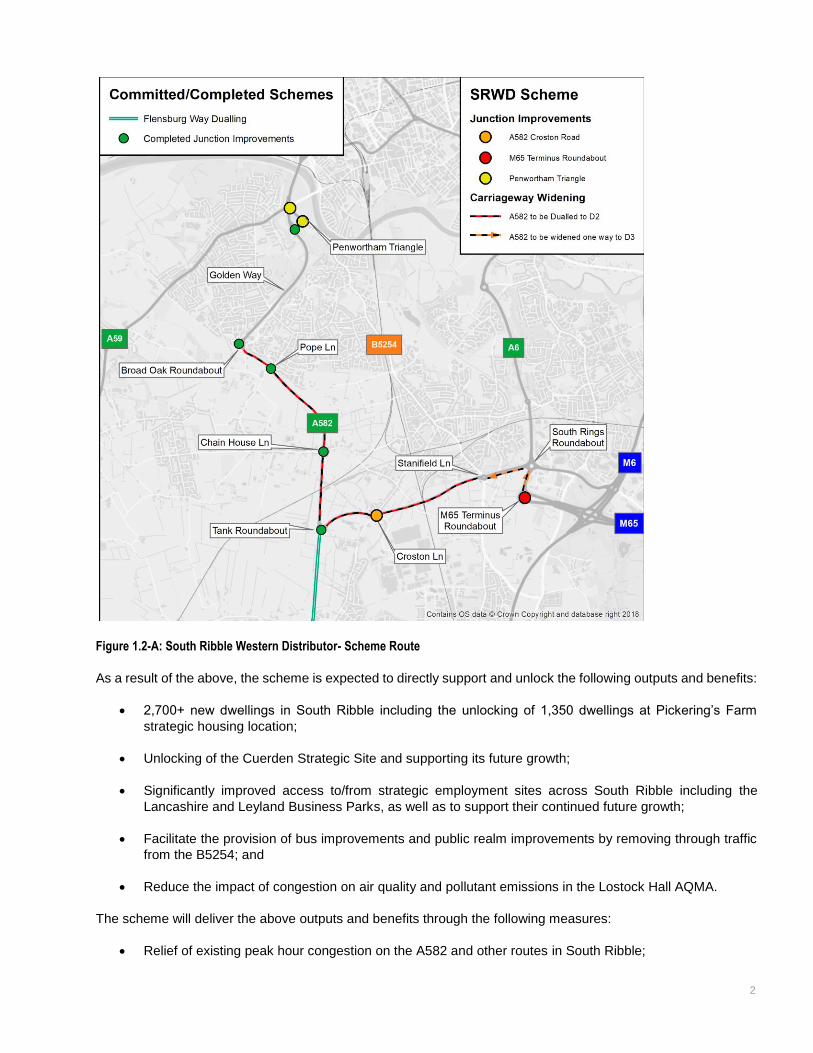
Figure 1.2-A: South Ribble Western Distributor- Scheme Route
As a result of the above, the scheme is expected to directly support and unlock the following outputs and benefits:
2,700+ new dwellings in South Ribble including the unlocking of 1,350 dwellings at Pickering’s Farm
strategic housing location;
Unlocking of the Cuerden Strategic Site and supporting its future growth;
Significantly improved access to/from strategic employment sites across South Ribble including the
Lancashire and Leyland Business Parks, as well as to support their continued future growth;
Facilitate the provision of bus improvements and public realm improvements by removing through traffic
from the B5254; and
Reduce the impact of congestion on air quality and pollutant emissions in the Lostock Hall AQMA.
The scheme will deliver the above outputs and benefits through the following measures:
Relief of existing peak hour congestion on the A582 and other routes in South Ribble;
3
Upgraded road infrastructure with sufficient capacity to support traffic generated by new housing and
employment growth; and
Provision of access to the Cuerden Strategic Site from the M65 Terminus Roundabout as an integral part
of the scheme.
Together, and facilitated through the SRWD scheme, the above outputs will ensure that Preston and Lancashire
remain a key part of the Northern Powerhouse and continue to play a pivotal role in the long-term sustainability of
the North’s economy.
It should be noted that the Flensburg Way Improvements are considered part of the SRWD in the City Deal
programme. Therefore, it will be procured and delivered alongside the A582 improvements as one project.
However, given that the Flensburg Way is not part of the MRN and due to different funding arrangements for the
purpose of this business case the cost and benefits associated with Flensburg Way Improvements have not been
included in the Value for Money assessment of the scheme or the Financial Case.
1.3 Purpose of Document
This document represents the Strategic Outline Business Case for the South Ribble Western Distributor preferred
option.
It has been developed in line with the Investment Planning Guidance for the Major Road Network (MRN) and
Large Local Majors Programmes and follows the structure mandated by the Department for Transport’s (DfT)
Transport Business Case guidance to establish whether the scheme is:
Supported by a robust case for change that fits with wider policy objectives (the Strategic Case);
Demonstrates value for money (the Economic Case);
Financially affordable (the Financial Case – accounting analysis);
Commercially viable (the Commercial Case – procurement issues); and
Achievable (the Management Case – deliverability assessment).
1.4 Document Structure
The remainder of the document is structured as follows:
Chapter 2: Scheme History and Scheme Description
Chapter 3: The Strategic Case
Chapter 4: The Economic Case
Chapter 5: The Financial Case
Chapter 6: The Commercial Case
Chapter 7: The Management Case

4
2. Scheme History and Scheme Description
2.1 Introduction
The Central Lancashire Highways and Transport Masterplan (CLHTM) was adopted in March 2013. It sets
out the County Council’s priorities for future investment in highways and transport across Central Lancashire in
the context of ambitious economic growth plans set out in the Central Lancashire Core Strategy.
The schemes identified in the CLHTM to be delivered in the period to 2026 are:
Preston Western Distributor (PWD);
A6 Broughton Bypass;
Penwortham Bypass; and,
A582 South Ribble Western Distributor (SRWD) upgrade.
The identified schemes are expected to enable planned new development to go ahead, achieve marked
improvements for local communities and their environment and allow significant complimentary improvements to
sustainable travel infrastructure.
Delivery of these schemes is essential to resolving current and future problems and issues that could otherwise
result in widespread congestion on the highway network and missed opportunities to develop Central Lancashire’s
economy. Of the four schemes, the Broughton Bypass has been completed, the Penwortham Bypass is under
construction and the PWD has received regulatory and planning consent with an expected start of works in the
autumn of 2019. The SRWD will be the last of these four schemes to be delivered, and is required to unlock the
full extent of economic growth in Central Lancashire
The A582 is part of the Major Road Network (MRN), defined by the Department for Transport (DfT) as the most
economically and regionally important ‘A’ roads that sit between the SRN and local road networks. Investment in
the MRN is identified as a priority for the DfT, with significant funding available through the new National Roads
Fund from April 2020. As the North of England’s Sub-National Transport Body, Transport for the North (TfN) is
responsible for prioritising this investment in the MRN in the North of England.
The A582 South Ribble Western Distributor upgrade has been identified in TfN’s Investment Programme as a
scheme for delivery before 2027. It will support the delivery of the Pickering’s Farm, Heatherleigh and Moss Side
Test Track housing sites, delivering a regionally significant level of housing growth of over 2,700 dwellings. In
addition, it will enable the delivery of nationally significant business development at the Cuerden Strategic Site
and the Lancashire and Leyland Business Parks, which together with other strategic employment sites in Preston
represent a key economic centre in the advanced manufacturing prime capability for both Lancashire and the
Northern Powerhouse Economy, as identified in TfN’s own Independent Economic Review (IER).
The history and key elements of the scheme are detailed in the subsequent sections of this chapter.
2.2 Scheme History
It has been evident over many years that the existing transport network serving South Ribble and Preston is
becoming increasingly congested, despite a range of improvements and sustainable travel measures that have
been introduced. Recognising the issue, the Central Lancashire local authorities agreed to fund a transport
strategy and masterplan to study traffic flows on the transport network. This would facilitate a more comprehensive
and strategic analysis of how the area’s transport network functions and the potential alternatives to satisfying
current and future traffic demands.
5
This study brought into particular focus the preparation of the Central Lancashire Core Strategy and the scale and
distribution of new housing to be accommodated as part of the area’s development strategy. The strategic
development areas identified in the plan, along the A582/B5254 in South Ribble and in North West Preston,
prompted the County Council, as Transport and Highway Authority, to conclude that simply relying on
improvements to the existing network would be insufficient to accommodate the anticipated increase in travel
demand.
Instead, substantial additional transport infrastructure would be required to serve the new development and growth
in the wider area. The County Council undertook to develop a solution to support the area’s growth and deliver
the Core Strategy.
As a result, Central Lancashire was the first area in the county to have a Highways and Transport Masterplan (the
CLHTM) put in place. The masterplan was identified in the Central Lancashire Core Strategy as a means for
highway and transport implications to properly inform and influence Lancashire’s development and growth and
provide a sound basis to determine transport investment priorities.
Supporting the development of the CLHTM, consideration was given to what measures to improve travel on the
existing road network could provide a level of relief sufficient to resolve existing problems and serve future demand
from proposed development and growth in the area. Numerous measures were identified across the area and
across all modes of travel, but these assessments made it clear that even with a major programme of sustainable
transport improvements these would not have the necessary impact. Indeed, these measures would not
compensate for even modest traffic growth between the preparation of the CLHTM in 2013 and 2026.
It became apparent through independent technical assessment underpinning the CLHTM that the current transport
network serving Preston and South Ribble simply does not have enough spare capacity to allow significant
changes to improve bus journey times and enhance public realm to encourage walking and cycling. This led the
masterplan to conclude that significant additions to existing highway infrastructure, of a scale and location to
support the area’s strategic development sites, would be needed to support the development aspirations of Central
Lancashire.
Accepting that there is no choice but to create new highway capacity to serve new development, consideration
was given through the masterplan exercise to the extent and routes for an enhanced distributor road network for
South Ribble. The CLHTM identified two schemes to contribute to the delivery of this enhanced distributor road
network; completion of the Penwortham Bypass and SRWD, in addition to the already committed A582 Golden
Way dualling, and a Cross Borough Link Road which will be delivered by developers as part of the completion of
allocated development sites in line with South Ribble Local Plan policy A2 (adopted July 2016).
Since this initial identification, a preferred scheme for the SRWD has been consulted on and adopted, and whilst
alternative extents and alignments were considered, the constraints within the scheme area and requirements for
the scheme restricted the number of alternative options for the route. Following full consideration of the comments
and suggestions made as part of the public consultation exercise in February-March 2015, the preferred route for
complete dualling of the existing A582 corridor was adopted and the corridor protected in September 2015.
Following the adoption of the preferred route for the scheme which limits development in the area that would affect
the scheme, the County Council started work on a planning application.
In preparation for the scheme, the County Council has completed a number of interventions in support of the
SRWD in the form of improvements to junctions along the A582 corridor to provide early capacity enhancements.
These have been future-proofed for delivery of the complete dualling of the route. Their completion dates are
shown in Table 2.2-i.
6
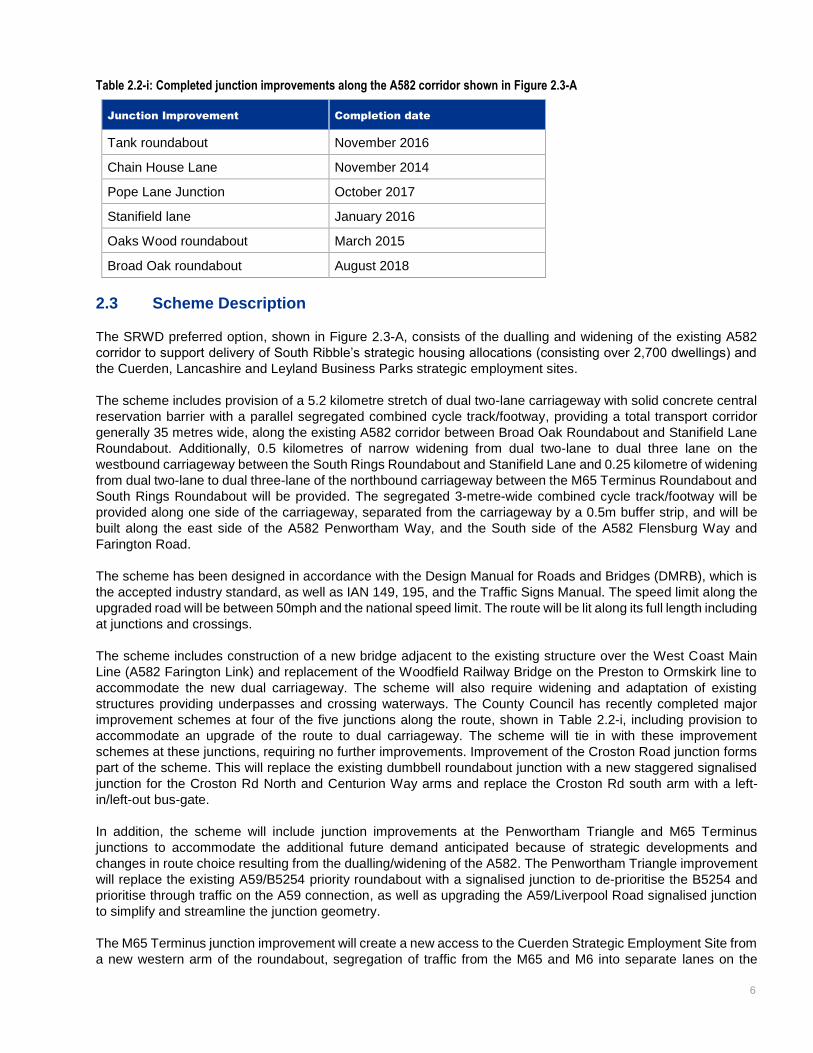
Table 2.2-i: Completed junction improvements along the A582 corridor shown in Figure 2.3-A
Junction Improvement Completion date
Tank roundabout November 2016
Chain House Lane November 2014
Pope Lane Junction October 2017
Stanifield lane January 2016
Oaks Wood roundabout March 2015
Broad Oak roundabout August 2018
2.3 Scheme Description
The SRWD preferred option, shown in Figure 2.3-A, consists of the dualling and widening of the existing A582
corridor to support delivery of South Ribble’s strategic housing allocations (consisting over 2,700 dwellings) and
the Cuerden, Lancashire and Leyland Business Parks strategic employment sites.
The scheme includes provision of a 5.2 kilometre stretch of dual two-lane carriageway with solid concrete central
reservation barrier with a parallel segregated combined cycle track/footway, providing a total transport corridor
generally 35 metres wide, along the existing A582 corridor between Broad Oak Roundabout and Stanifield Lane
Roundabout. Additionally, 0.5 kilometres of narrow widening from dual two-lane to dual three lane on the
westbound carriageway between the South Rings Roundabout and Stanifield Lane and 0.25 kilometre of widening
from dual two-lane to dual three-lane of the northbound carriageway between the M65 Terminus Roundabout and
South Rings Roundabout will be provided. The segregated 3-metre-wide combined cycle track/footway will be
provided along one side of the carriageway, separated from the carriageway by a 0.5m buffer strip, and will be
built along the east side of the A582 Penwortham Way, and the South side of the A582 Flensburg Way and
Farington Road.
The scheme has been designed in accordance with the Design Manual for Roads and Bridges (DMRB), which is
the accepted industry standard, as well as IAN 149, 195, and the Traffic Signs Manual. The speed limit along the
upgraded road will be between 50mph and the national speed limit. The route will be lit along its full length including
at junctions and crossings.
The scheme includes construction of a new bridge adjacent to the existing structure over the West Coast Main
Line (A582 Farington Link) and replacement of the Woodfield Railway Bridge on the Preston to Ormskirk line to
accommodate the new dual carriageway. The scheme will also require widening and adaptation of existing
structures providing underpasses and crossing waterways. The County Council has recently completed major
improvement schemes at four of the five junctions along the route, shown in Table 2.2-i, including provision to
accommodate an upgrade of the route to dual carriageway. The scheme will tie in with these improvement
schemes at these junctions, requiring no further improvements. Improvement of the Croston Road junction forms
part of the scheme. This will replace the existing dumbbell roundabout junction with a new staggered signalised
junction for the Croston Rd North and Centurion Way arms and replace the Croston Rd south arm with a left-
in/left-out bus-gate.
In addition, the scheme will include junction improvements at the Penwortham Triangle and M65 Terminus
junctions to accommodate the additional future demand anticipated because of strategic developments and
changes in route choice resulting from the dualling/widening of the A582. The Penwortham Triangle improvement
will replace the existing A59/B5254 priority roundabout with a signalised junction to de-prioritise the B5254 and
prioritise through traffic on the A59 connection, as well as upgrading the A59/Liverpool Road signalised junction
to simplify and streamline the junction geometry.
The M65 Terminus junction improvement will create a new access to the Cuerden Strategic Employment Site from
a new western arm of the roundabout, segregation of traffic from the M65 and M6 into separate lanes on the

7
approach to the junction, and signalisation of the roundabout to improve safety. The junction improvements will
take place within Lancashire County Council’s highway ownership but will involve some alterations to the approach
which includes Highway England’s network. Highways England have been consulted and are supportive of the
proposed highway changes.
Figure 2.3-A: Extent of the A582 South Ribble Western Distributor Upgrade Scheme (including upgraded junctions)
A complete drawing of the scheme is provided in Appendix A.
8
3. The Strategic Case
3.1 Introduction
The Strategic Case determines whether or not an investment is needed, either now or in the future. It demonstrates
the case for change – that is, a clear rationale for making the investment; and strategic fit – how an investment
will further the aims and objectives of Lancashire County Council (LCC), the Lancashire Local Enterprise
Partnership (LEP), Preston City Region Local Authorities and Government and sub-national bodies.
More specifically, and in line with Green Book guidance, the Strategic Case should:
Specify the business need for a project;
Set the context and identify a series of investment aims;
Assess the investment aims against what LCC, the LEP and Government wants to achieve as a whole;
Determine the case for change and the strategic fit iteratively as the business case develops, supported
by robust evidence and identifying key risks and constraints; and
Identify main stakeholder groups and account for their views.
The strategic case for the South Ribble Western Distributor (SRWD) scheme is discussed in detail under the
following sub-headings
Understanding the Current Situation
Understanding the Future Situation
Establishing the Need for Intervention
Scheme Objectives
Policy Review and Strategic Fit
Option Identification and Selection
Internal and External Business Drivers
Constraints and Key Risks
Synergy with other Schemes
Stakeholders and Consultation
Summary and Conclusion
3.2 Understanding the Current Situation
3.2.1 Introduction
This section of the Strategic Case aims to develop an understanding of the current transport situation in South
Ribble and identify any transport related problems that justify the need for a transport intervention.

9
3.2.2 Existing Network and Transport Services
The A582 is one of three main arterial ‘A road’ routes in South Ribble, the others being the A6 and A59, which
together provide the main access routes between settlements in South Ribble, the SRN and the three main access
points to the Preston urban area, the main economic and urban centre of Central Lancashire. The study area for
the A582 scheme takes in these three A roads around the main settlements in South Ribble, as well as major local
routes, up to the three accesses to Preston across the River Ribble, although the scheme is expected to have
wider impacts on travel patterns across Central Lancashire.
The Preston urban area is bounded by the M55 to the north, the M6 to the east and the River Ribble to the South.
South Ribble district comprises a number of smaller settlements. To the north of the district between the A59 and
M6 the settlements of Penwortham, Lostock Hall and Bamber Bridge form suburbs of Preston, separated from the
main urban area to the north by a green corridor along the south bank of the River Ribble and bounded to the
south by the A582. South of the A582 are the settlements of Leyland and Moss Side between the Ormskirk Branch
rail line to the west and the M6 to the east. A greenbelt corridor south of the A582 separates these settlements
from Lostock Hall. To the eastern and western ends of the district are rural areas with smaller dispersed
settlements.
Preston and South Ribble are well connected to the SRN, being served by four motorways:
M61 – Preston to Manchester (via Chorley and Bolton) accessed at J9;
M65 – Preston to Colne via (Blackburn, Accrington and Burnley) accessed at J1;
M55 – Preston to Blackpool (via Kirkham) accessed at J1; and
M6 – for travel north and south towards Scotland and the Midlands accessed at junctions 28, 29, 31, 31a
(southbound access and northbound exit only) and via M55 J1.
There are three key ‘A’ roads in South Ribble of varying standards. These are;
A59 – Liverpool to Preston. Single carriageway 60mph from the southern edge of the district to the south
end of the Longton Bypass, with dual carriageway 70mph for the Longton Bypass, subsequently dropping
to 40mph dual carriageway between the north end of the Longton Bypass and Howick Cross and finally
becoming a 30mph urban single carriageway through Howick Cross and Penwortham to central Preston.
A6 – Chorley to Preston, via the M65 J1 / M6 J29 junction. Bypasses Lostock Hall and Bamber Bridge.
Dual carriageway 50 – 70mph between the M65 and River Ribble, dropping to 30mph single carriageway
at the edge of the Preston urban area.
A582 – Penwortham to M65 J1, mostly single carriageway 60mph with limited dual carriageway 50mph
through Penwortham. The A582 serves to connect the settlements in the north of the district to the SRN.
Aside from this, the area is primarily served by ‘B’ roads and local roads of varying standards, particularly the
B5254 which runs parallel to the A582 between Stanfield Lane and the Penwortham Triangle through Lostock
Hall. The existing highway network is shown in Figure 3.2-A.
10
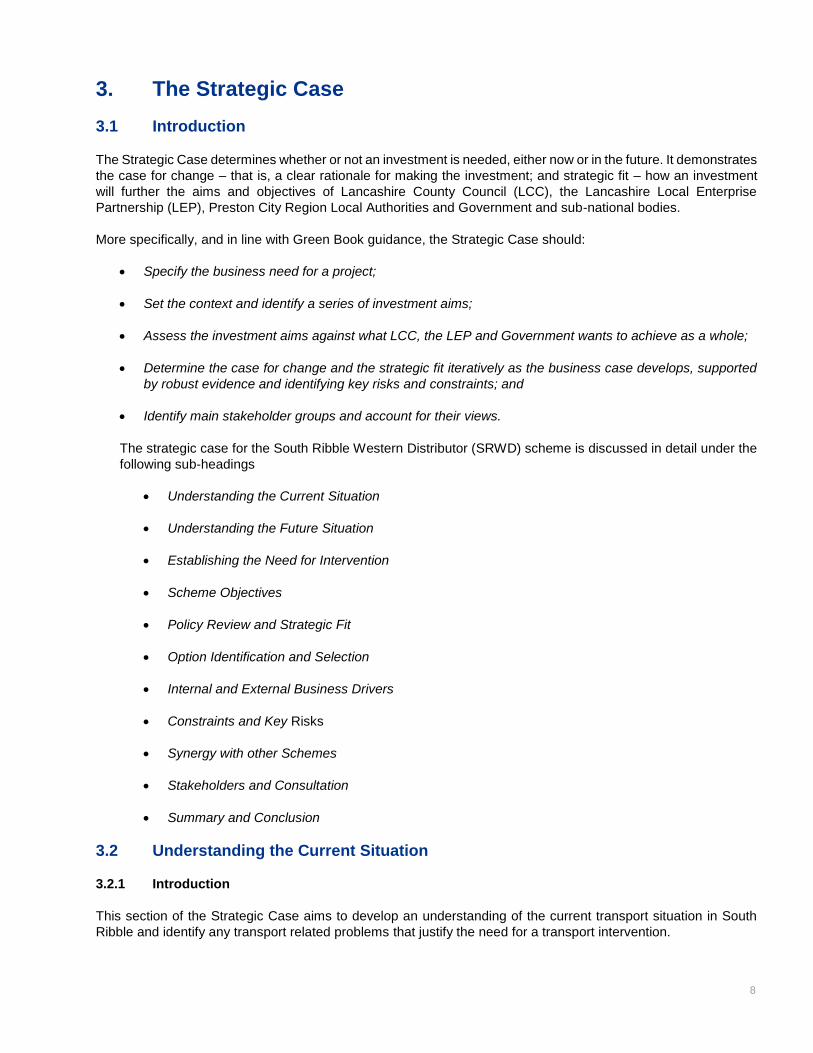
Figure 3.2-A: Existing highway and rail network in South Ribble and Preston
South Ribble is connected to Preston by two rail lines, shown in Figure 3.2-A, with Leyland station on the West
Coast Main Line and Lostock Hall and Bamber Bridge on the Preston – Blackburn line. There are three trains per
hour between Leyland and Preston, and one train per hour from Lostock Hall and Bamber Bridge to Preston
increasing to two trains per hour during peak times. All services in South Ribble are run by the Northern Rail
franchise.
Bus services in South Ribble are similarly limited. The most frequent service to Preston from South Ribble is the
no. 111 from Moss Side via Leyland, with a service provided every 12 minutes. Only two other services provide a
bus frequency to Preston at least every 20 minutes – the no. 3 from Penwortham, and the no. 125 from Bolton via
Bamber Bridge. In addition, the 109 from Chorley via Leyland and Lostock Hall provides a service every 30
minutes. A further four services provide an hourly service to Preston, with the remainder of the services in the
area being one-per-day school services. As Figure 3.2-B shows, significant portions of South Ribble are not served
by buses providing a service to Preston every 30 minutes.

11
Figure 3.2-B: Bus services between South Ribble and Preston
3.2.3 Travel Demand and Patterns
Figure 3.2-A below highlights the key strategic movements in Central Lancashire as identified in the Central
Lancashire Transport Masterplan (CLTM). This shows a significant non-motorway element through South Ribble
along the corridors served by the A59 and A582.
12
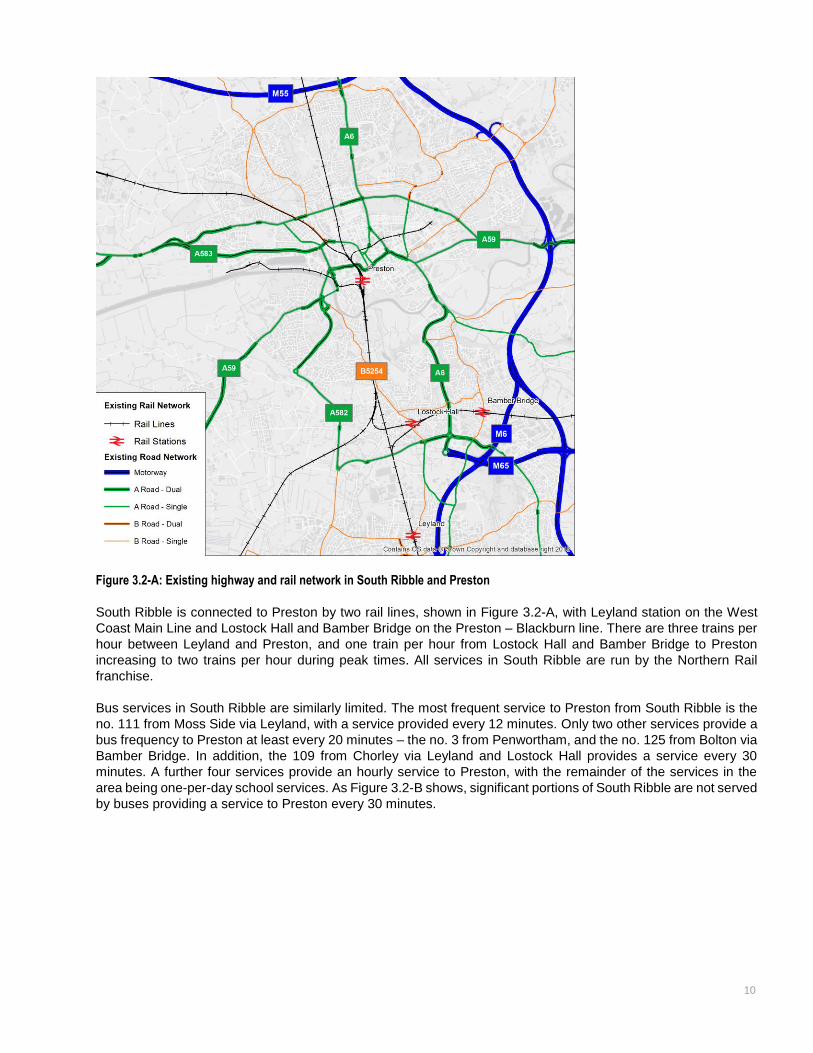
Figure 3.2-C: Strategic Movements through Central Lancashire
As the Preston city region, which includes employment sites in South Ribble, is a major employment hub the city
acts as a large net importer of labour from across Lancashire as well as driving significant internal movements.
According to 2011 Census Journey to Work data, there is a net total inflow of 16,580 commuting trips to Preston
and South Ribble combined, while there are 70,236 commuting trips within and between the two districts.
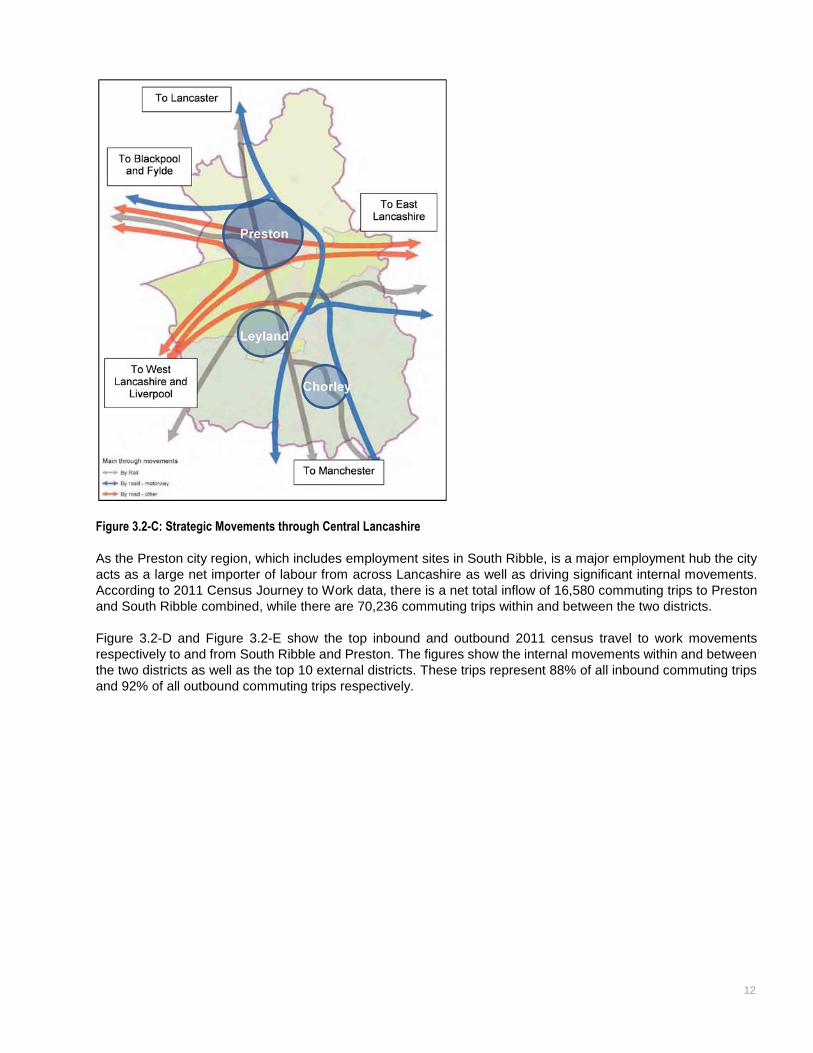
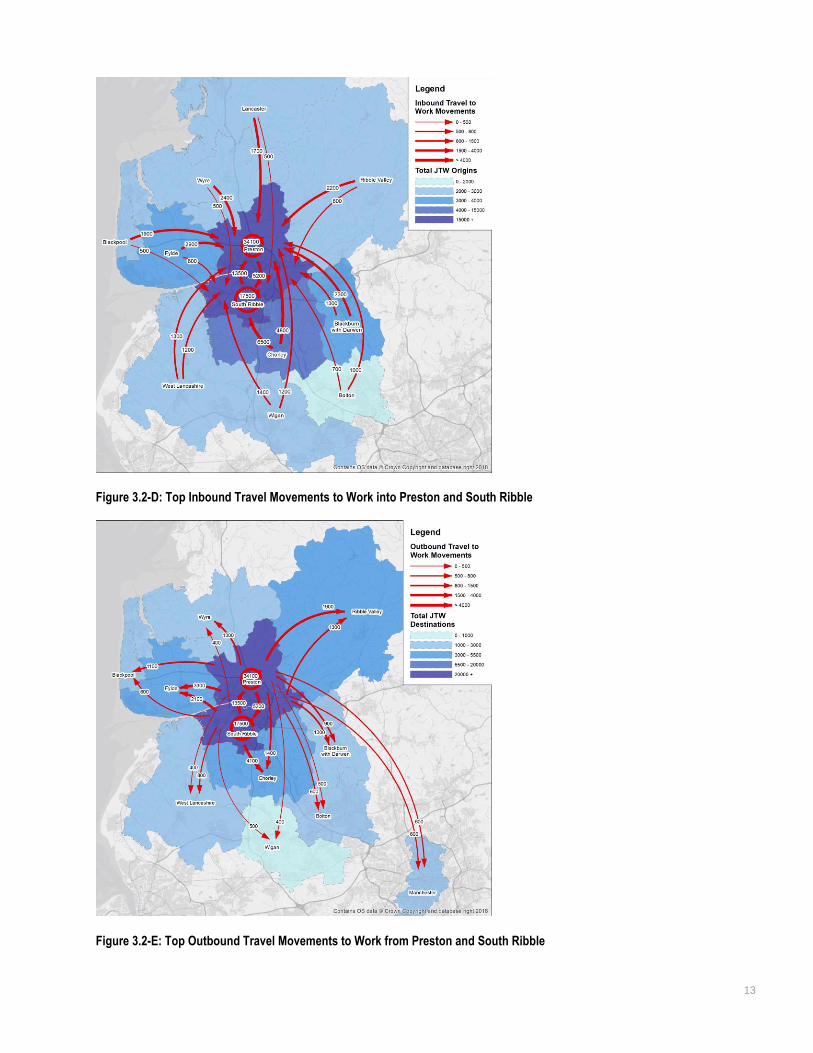
Figure 3.2-D and Figure 3.2-E show the top inbound and outbound 2011 census travel to work movements
respectively to and from South Ribble and Preston. The figures show the internal movements within and between
the two districts as well as the top 10 external districts. These trips represent 88% of all inbound commuting trips
and 92% of all outbound commuting trips respectively.
13
Figure 3.2-D: Top Inbound Travel Movements to Work into Preston and South Ribble
Figure 3.2-E: Top Outbound Travel Movements to Work from Preston and South Ribble
14
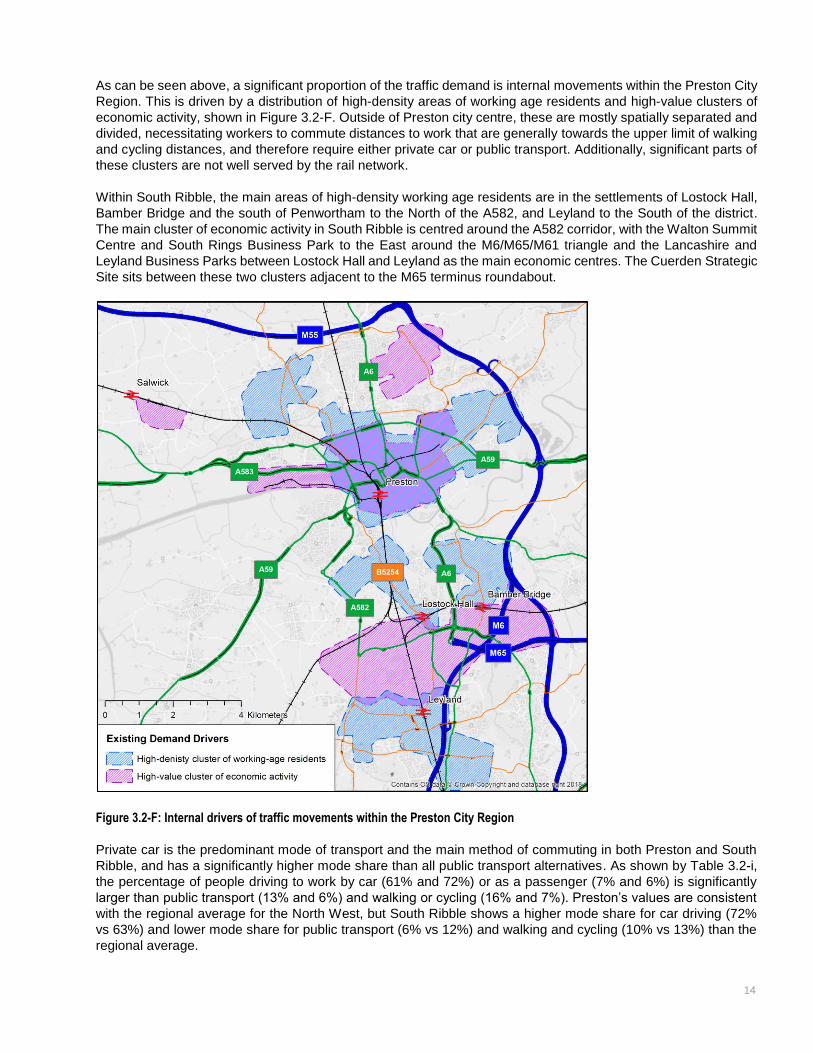
As can be seen above, a significant proportion of the traffic demand is internal movements within the Preston City
Region. This is driven by a distribution of high-density areas of working age residents and high-value clusters of
economic activity, shown in Figure 3.2-F. Outside of Preston city centre, these are mostly spatially separated and
divided, necessitating workers to commute distances to work that are generally towards the upper limit of walking
and cycling distances, and therefore require either private car or public transport. Additionally, significant parts of
these clusters are not well served by the rail network.
Within South Ribble, the main areas of high-density working age residents are in the settlements of Lostock Hall,
Bamber Bridge and the south of Penwortham to the North of the A582, and Leyland to the South of the district.
The main cluster of economic activity in South Ribble is centred around the A582 corridor, with the Walton Summit
Centre and South Rings Business Park to the East around the M6/M65/M61 triangle and the Lancashire and
Leyland Business Parks between Lostock Hall and Leyland as the main economic centres. The Cuerden Strategic
Site sits between these two clusters adjacent to the M65 terminus roundabout.
Figure 3.2-F: Internal drivers of traffic movements within the Preston City Region
Private car is the predominant mode of transport and the main method of commuting in both Preston and South
Ribble, and has a significantly higher mode share than all public transport alternatives. As shown by Table 3.2-i,
the percentage of people driving to work by car (61% and 72%) or as a passenger (7% and 6%) is significantly
larger than public transport (13% and 6%) and walking or cycling (16% and 7%). Preston’s values are consistent
with the regional average for the North West, but South Ribble shows a higher mode share for car driving (72%
vs 63%) and lower mode share for public transport (6% vs 12%) and walking and cycling (10% vs 13%) than the
regional average.
15
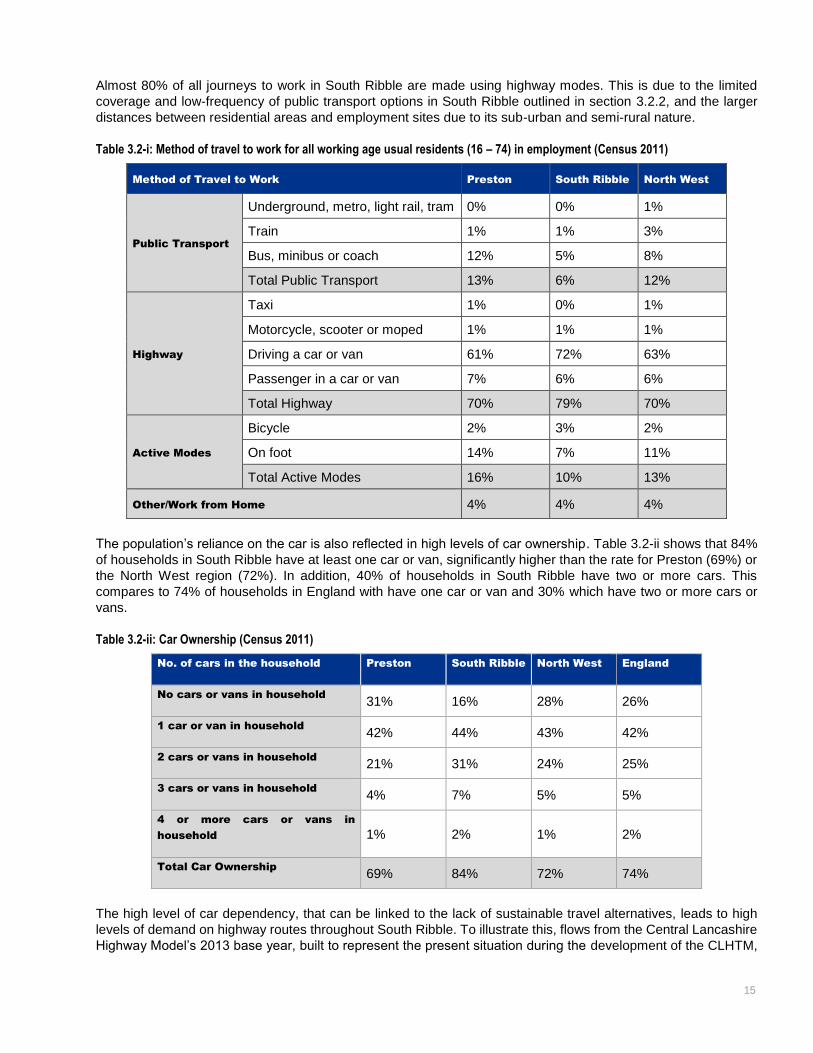
Almost 80% of all journeys to work in South Ribble are made using highway modes. This is due to the limited
coverage and low-frequency of public transport options in South Ribble outlined in section 3.2.2, and the larger
distances between residential areas and employment sites due to its sub-urban and semi-rural nature.
Table 3.2-i: Method of travel to work for all working age usual residents (16 – 74) in employment (Census 2011)
Method of Travel to Work Preston South Ribble North West
Public Transport
Underground, metro, light rail, tram 0% 0% 1%
Train 1% 1% 3%
Bus, minibus or coach 12% 5% 8%
Total Public Transport 13% 6% 12%
Highway
Taxi 1% 0% 1%
Motorcycle, scooter or moped 1% 1% 1%
Driving a car or van 61% 72% 63%
Passenger in a car or van 7% 6% 6%
Total Highway 70% 79% 70%
Active Modes
Bicycle 2% 3% 2%
On foot 14% 7% 11%
Total Active Modes 16% 10% 13%
Other/Work from Home 4% 4% 4%
The population’s reliance on the car is also reflected in high levels of car ownership. Table 3.2-ii shows that 84%
of households in South Ribble have at least one car or van, significantly higher than the rate for Preston (69%) or
the North West region (72%). In addition, 40% of households in South Ribble have two or more cars. This
compares to 74% of households in England with have one car or van and 30% which have two or more cars or
vans.
Table 3.2-ii: Car Ownership (Census 2011)
No. of cars in the household Preston South Ribble North West England
No cars or vans in household 31% 16% 28% 26%
1 car or van in household 42% 44% 43% 42%
2 cars or vans in household 21% 31% 24% 25%
3 cars or vans in household 4% 7% 5% 5%
4 or more cars or vans in
household 1% 2% 1% 2%
Total Car Ownership 69% 84% 72% 74%
The high level of car dependency, that can be linked to the lack of sustainable travel alternatives, leads to high
levels of demand on highway routes throughout South Ribble. To illustrate this, flows from the Central Lancashire
Highway Model’s 2013 base year, built to represent the present situation during the development of the CLHTM,
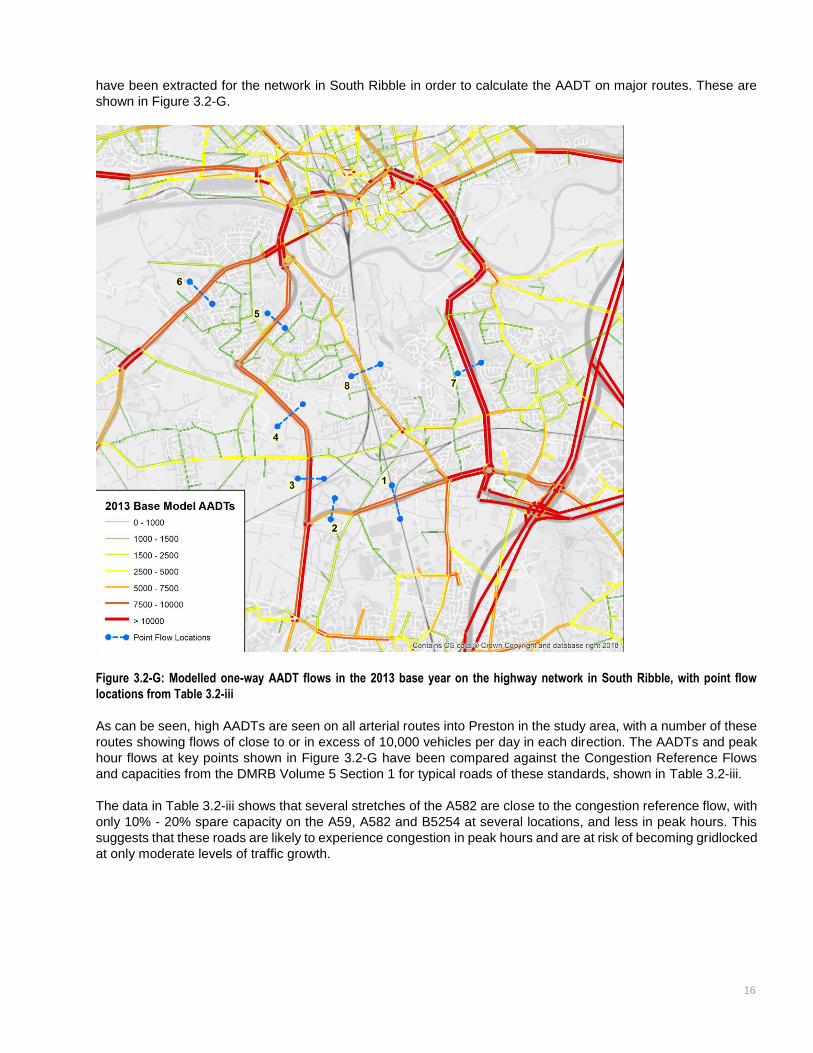
16
have been extracted for the network in South Ribble in order to calculate the AADT on major routes. These are
shown in Figure 3.2-G.
Figure 3.2-G: Modelled one-way AADT flows in the 2013 base year on the highway network in South Ribble, with point flow
locations from Table 3.2-iii
As can be seen, high AADTs are seen on all arterial routes into Preston in the study area, with a number of these
routes showing flows of close to or in excess of 10,000 vehicles per day in each direction. The AADTs and peak
hour flows at key points shown in Figure 3.2-G have been compared against the Congestion Reference Flows
and capacities from the DMRB Volume 5 Section 1 for typical roads of these standards, shown in Table 3.2-iii.
The data in Table 3.2-iii shows that several stretches of the A582 are close to the congestion reference flow, with
only 10% - 20% spare capacity on the A59, A582 and B5254 at several locations, and less in peak hours. This
suggests that these roads are likely to experience congestion in peak hours and are at risk of becoming gridlocked
at only moderate levels of traffic growth.
17
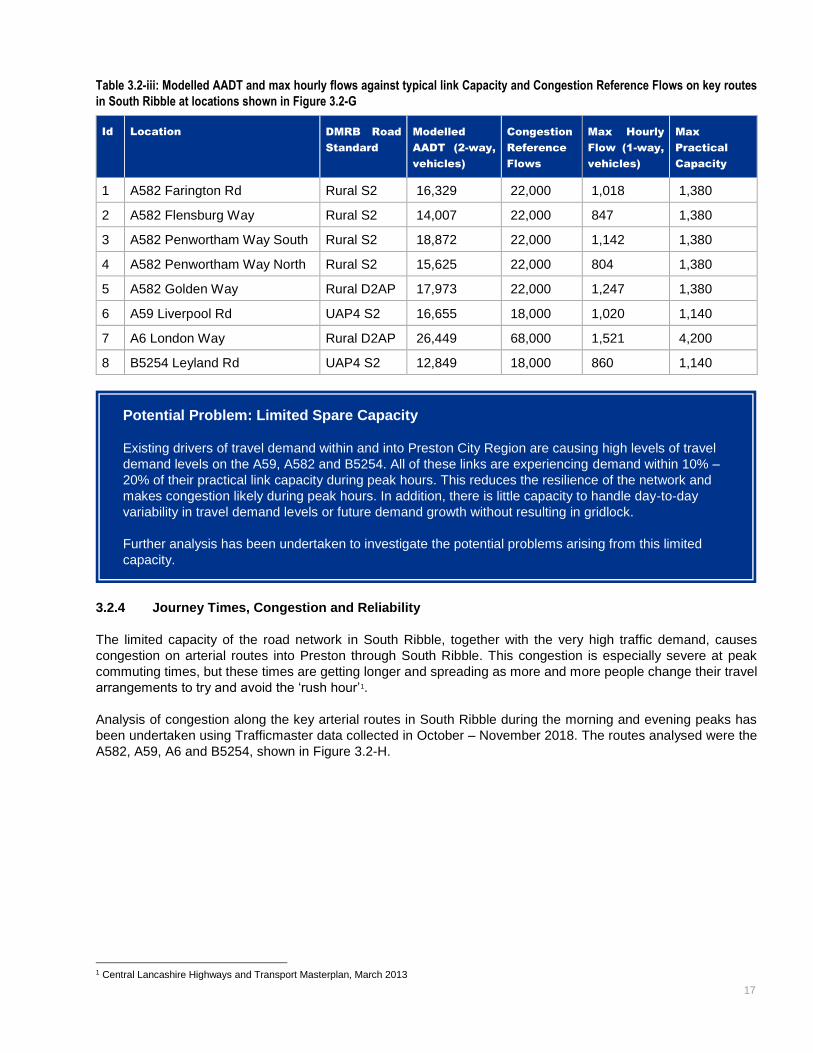
Table 3.2-iii: Modelled AADT and max hourly flows against typical link Capacity and Congestion Reference Flows on key routes
in South Ribble at locations shown in Figure 3.2-G
Id Location DMRB Road
Standard
Modelled
AADT (2-way,
vehicles)
Congestion
Reference
Flows
Max Hourly
Flow (1-way,
vehicles)
Max
Practical
Capacity
1 A582 Farington Rd Rural S2 16,329 22,000 1,018 1,380
2 A582 Flensburg Way Rural S2 14,007 22,000 847 1,380
3 A582 Penwortham Way South Rural S2 18,872 22,000 1,142 1,380
4 A582 Penwortham Way North Rural S2 15,625 22,000 804 1,380
5 A582 Golden Way Rural D2AP 17,973 22,000 1,247 1,380
6 A59 Liverpool Rd UAP4 S2 16,655 18,000 1,020 1,140
7 A6 London Way Rural D2AP 26,449 68,000 1,521 4,200
8 B5254 Leyland Rd UAP4 S2 12,849 18,000 860 1,140
3.2.4 Journey Times, Congestion and Reliability
The limited capacity of the road network in South Ribble, together with the very high traffic demand, causes
congestion on arterial routes into Preston through South Ribble. This congestion is especially severe at peak
commuting times, but these times are getting longer and spreading as more and more people change their travel
arrangements to try and avoid the ‘rush hour’1.
Analysis of congestion along the key arterial routes in South Ribble during the morning and evening peaks has
been undertaken using Trafficmaster data collected in October – November 2018. The routes analysed were the
A582, A59, A6 and B5254, shown in Figure 3.2-H.
1 Central Lancashire Highways and Transport Masterplan, March 2013
Potential Problem: Limited Spare Capacity
Existing drivers of travel demand within and into Preston City Region are causing high levels of travel
demand levels on the A59, A582 and B5254. All of these links are experiencing demand within 10% –
20% of their practical link capacity during peak hours. This reduces the resilience of the network and
makes congestion likely during peak hours. In addition, there is little capacity to handle day-to-day
variability in travel demand levels or future demand growth without resulting in gridlock.
Further analysis has been undertaken to investigate the potential problems arising from this limited
capacity.

18
Figure 3.2-H: Arterial routes used for Trafficmaster Journey Time and Average Speed analysis
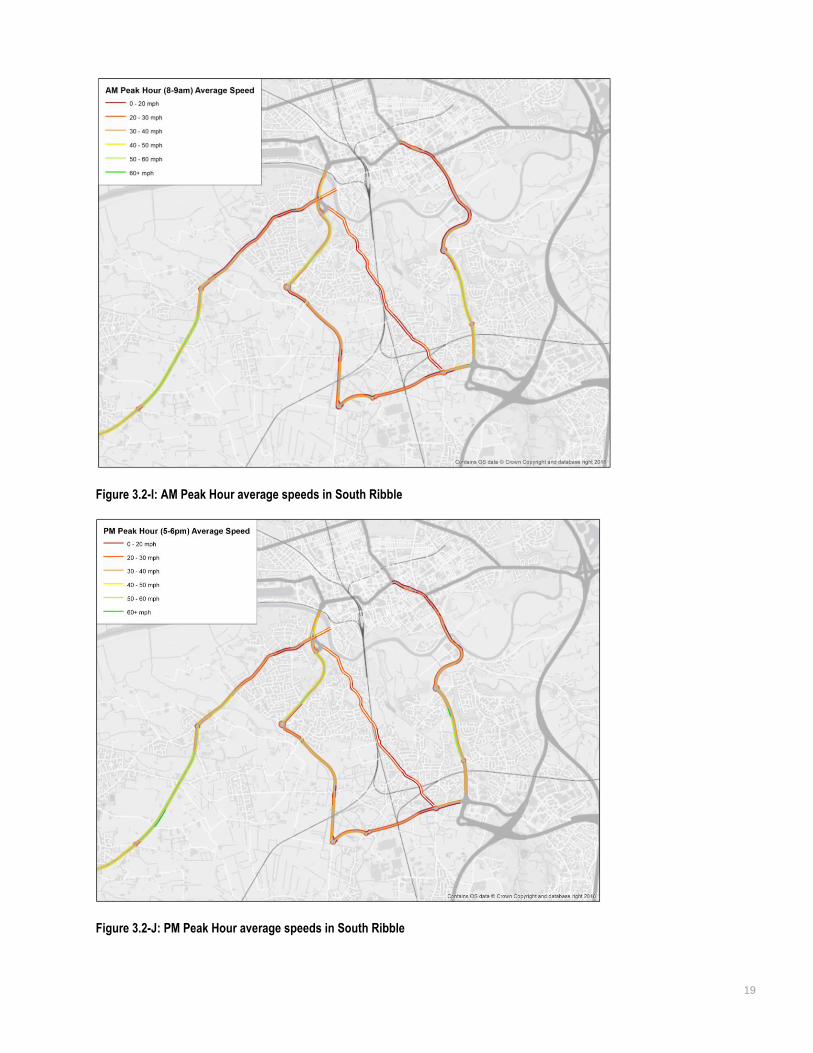
Analysis of the AM and PM peak hour speeds, shown in Figure 3.2-I and Figure 3.2-J, on these routes shows
significant congestion on all routes. A number of sections show average speeds below 20mph and most of the
single-carriageway sections of the A582 show average speeds below 30mph despite a speed limit of 60mph. Slow
speeds are also seen on the northern sections of the A59 and A6. In contrast, the dual carriageway sections of
the A582 on Golden Way, as well as on the southern sections of the A6 and A59, show speeds in the 40 – 60
mph range (except on approaches to junctions, indicating some queuing).
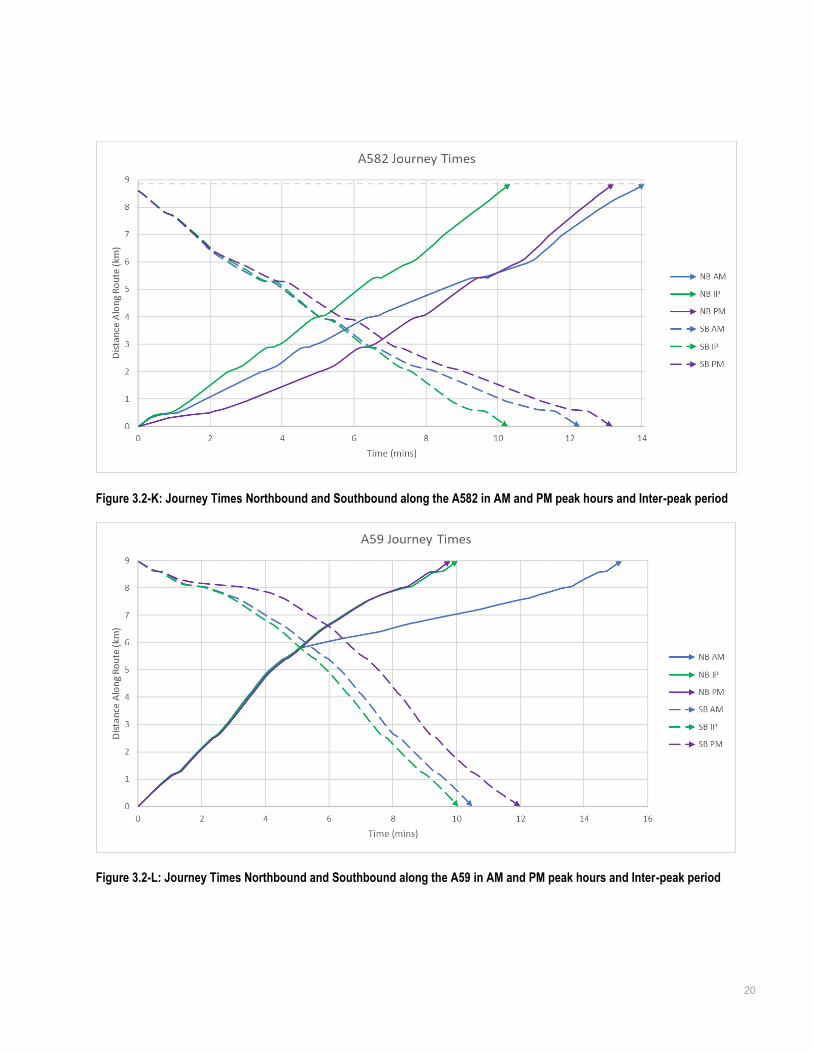
In addition to the average speeds, the average end to end journey times along the four routes have been analysed
for the AM and PM peak hours and the inter-peak period. These are shown in Figure 3.2-K, Figure 3.2-L, Figure
3.2-M and Figure 3.2-N. Both the A59 and A6 show a strong tidal component, with Northbound journey times
significantly longer in the AM peak than the inter-peak period, and Southbound journey times longer in the PM
peak, but with the counter-tidal direction relatively unimpeded. This indicates that delays on these routes are
primarily dominated by the commuting flows into and out of Preston.
The A582 and B5254 however show significant delays in both northbound and southbound directions in both peak
periods compared to the inter-peak, although the delay is stronger in the tidal direction. This suggests that in
addition to commuter traffic to Preston, these routes are being impacted by additional peak hour traffic, likely to
the strategic employment sites in South Ribble such as the Lancashire and Leyland Business Parks. It also
suggests that the routes as a whole are less capable of handling peak hour levels of traffic, with the greater
numbers of side roads and junctions likely contributing to the congestion.
Although the A582 is a slower route between the SRN at M6 J29/M65 J1 and central Preston, than the A6 in the
interpeak and in the counter-tidal direction in the peak hours, in the tidal direction in both peaks (northbound in
AM peak, southbound in PM peak) the journey times along both routes are comparable, despite the A6 route
being significantly more direct. This indicates that during the peak hours, both routes will be utilised by traffic
travelling between the SRN and Preston, and that trips from some employment sites will prefer the A582.
19
Figure 3.2-I: AM Peak Hour average speeds in South Ribble
Figure 3.2-J: PM Peak Hour average speeds in South Ribble
20
Figure 3.2-K: Journey Times Northbound and Southbound along the A582 in AM and PM peak hours and Inter-peak period
Figure 3.2-L: Journey Times Northbound and Southbound along the A59 in AM and PM peak hours and Inter-peak period
21
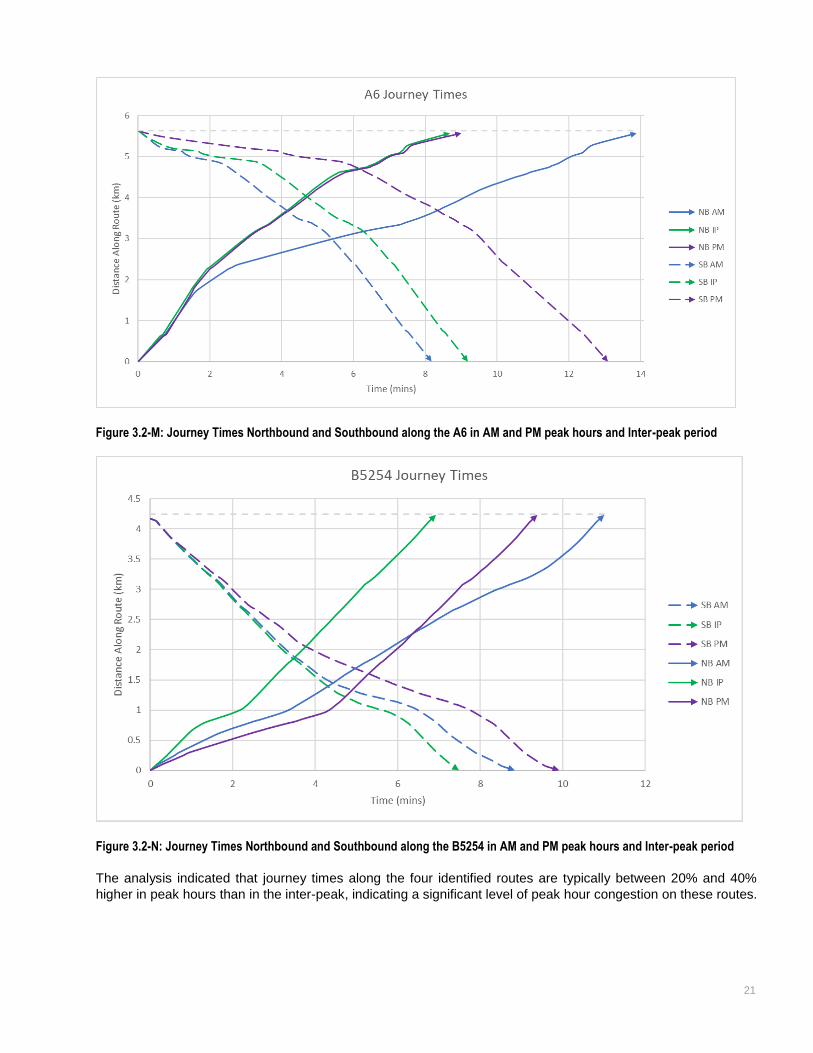
Figure 3.2-M: Journey Times Northbound and Southbound along the A6 in AM and PM peak hours and Inter-peak period
Figure 3.2-N: Journey Times Northbound and Southbound along the B5254 in AM and PM peak hours and Inter-peak period
The analysis indicated that journey times along the four identified routes are typically between 20% and 40%
higher in peak hours than in the inter-peak, indicating a significant level of peak hour congestion on these routes.
22
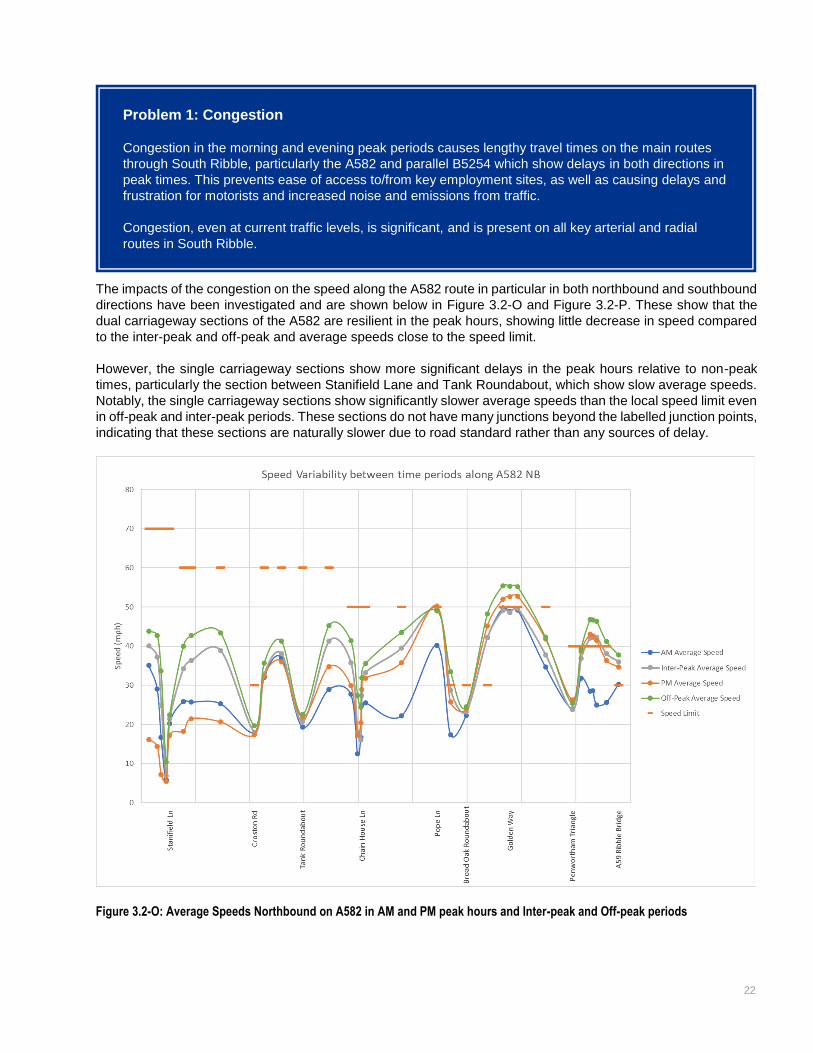
The impacts of the congestion on the speed along the A582 route in particular in both northbound and southbound
directions have been investigated and are shown below in Figure 3.2-O and Figure 3.2-P. These show that the
dual carriageway sections of the A582 are resilient in the peak hours, showing little decrease in speed compared
to the inter-peak and off-peak and average speeds close to the speed limit.
However, the single carriageway sections show more significant delays in the peak hours relative to non-peak
times, particularly the section between Stanifield Lane and Tank Roundabout, which show slow average speeds.
Notably, the single carriageway sections show significantly slower average speeds than the local speed limit even
in off-peak and inter-peak periods. These sections do not have many junctions beyond the labelled junction points,
indicating that these sections are naturally slower due to road standard rather than any sources of delay.
Figure 3.2-O: Average Speeds Northbound on A582 in AM and PM peak hours and Inter-peak and Off-peak periods
Problem 1: Congestion
Congestion in the morning and evening peak periods causes lengthy travel times on the main routes
through South Ribble, particularly the A582 and parallel B5254 which show delays in both directions in
peak times. This prevents ease of access to/from key employment sites, as well as causing delays and
frustration for motorists and increased noise and emissions from traffic.
Congestion, even at current traffic levels, is significant, and is present on all key arterial and radial
routes in South Ribble.
23
Figure 3.2-P: Average Speeds Southbound on A582 in AM and PM peak hours and Inter-peak and Off-peak periods
The slow off-peak speeds on single carriageway sections has been investigated further to identify the cause of
these low speeds. The single carriageway sections of the A582 have speed limits of 60mph or 50mph north of
Chain House Lane. However, on all these sections the average off-peak speeds recorded were only 45mph. Major
junctions on this section of the A582 are separated by distances of between 0.5 to 1.0 miles, with on average only
1 minor junction or access road per mile between these and no frontages. The road sections are all either straight
or long-radii curves with good visibility. As such, neither junction frequency nor geometry is the cause of these
slow speeds.
Satellite imagery and base mapping indicates that the A582 through these sections is on mostly 7.35m single
carriageway with some narrower sections of 7.0m width and limited wider sections with central hatching and 3.65m
width lanes approaching junctions. Investigation of street-level photography shows that these roads are visibly
narrow and at points closely shaded by vegetation. This can be seen in Figure 3.2-Q and Figure 3.2-R.
This demonstrates that the standard of the links between junctions, with narrow lanes and close proximity to
opposing traffic, is likely the main cause of the slow speeds observed in the inter-peak and off-peak periods.
Despite these sections being mostly straight and free of junctions, the road standard is too poor for vehicles to
reach comfortably the 60mph speed limit, instead only reaching speeds of 45mph between junctions.

24
Figure 3.2-Q: Street level imagery of A582 Farington Rd (Point 1 from Table 3.2-iii/Figure 3.2-G)
Figure 3.2-R: Street level imagery of A582 Penwortham Way North (Point 4 from Table 3.2-iii/Figure 3.2-G)
25
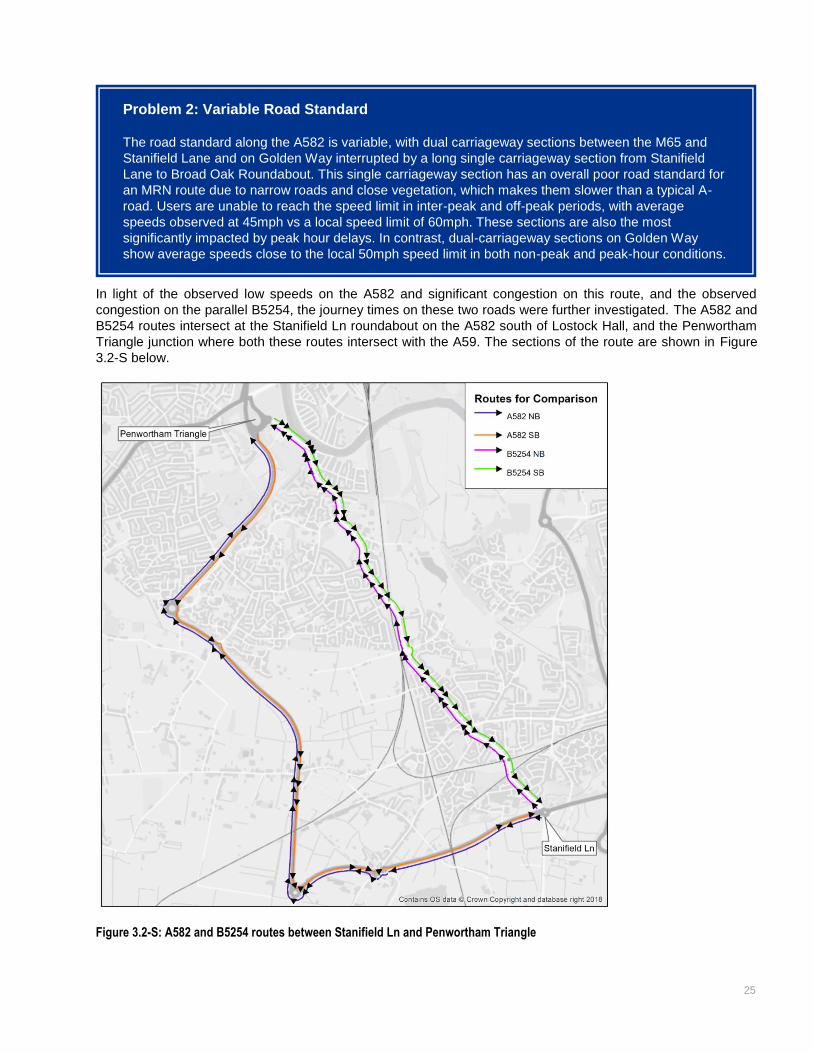
In light of the observed low speeds on the A582 and significant congestion on this route, and the observed
congestion on the parallel B5254, the journey times on these two roads were further investigated. The A582 and
B5254 routes intersect at the Stanifield Ln roundabout on the A582 south of Lostock Hall, and the Penwortham
Triangle junction where both these routes intersect with the A59. The sections of the route are shown in Figure
3.2-S below.
Figure 3.2-S: A582 and B5254 routes between Stanifield Ln and Penwortham Triangle
Problem 2: Variable Road Standard
The road standard along the A582 is variable, with dual carriageway sections between the M65 and
Stanifield Lane and on Golden Way interrupted by a long single carriageway section from Stanifield
Lane to Broad Oak Roundabout. This single carriageway section has an overall poor road standard for
an MRN route due to narrow roads and close vegetation, which makes them slower than a typical A-
road. Users are unable to reach the speed limit in inter-peak and off-peak periods, with average
speeds observed at 45mph vs a local speed limit of 60mph. These sections are also the most
significantly impacted by peak hour delays. In contrast, dual-carriageway sections on Golden Way
show average speeds close to the local 50mph speed limit in both non-peak and peak-hour conditions.
26
As Figure 3.2-K and Figure 3.2-M show, the A582 and A6 routes into Preston have comparable peak hour journey
times, and so traffic from the SRN to West Preston will likely take the A582 over the A6. However, at Stanifield
Lane, this traffic has the choice to take the B5254. Similarly, traffic to West Preston from Leyland will also
experience this route choice.
The B5254 route is more direct, but it is a lower standard local road through residential areas and a district centre
with a 30mph speed limit, direct frontage and frequent junctions and pedestrian crossings. The B5254 is also a
main bus corridor, and use of this route by large volumes of through traffic will have a significant negative impact
on bus reliability. The A582 by comparison is a higher standard road, with 60mph or 50mph speed limits along
this entire section and mostly through rural areas with fewer junctions. However, the A582 is longer and less direct,
and as identified above average speeds on large sections are significantly below the local speed limits even in
off-peak times. As such, it is not immediately clear which route traffic will prefer. The travel time between these
two junctions in the AM and PM peak hours and inter-peak period on each route is shown in Table 3.2-iv.
Table 3.2-iv: Journey Time comparison between Stanifield Lane and Penwortham Triangle
Time Period
Northbound (Stanifield Lane to
Penwortham Triangle)
Southbound (Penwortham Triangle
to Stanifield Lane)
A582 B5254 A582 B5254
AM Peak Hour 11m 29s 11m 01s 10m 03s 8m 51s
Inter-Peak 8m 19s 6m 56s 8m 09s 7m 29s
PM Peak Hour 9m 56s 9m 23s 10m 57s 9m 55s
This shows that the B5254 route is faster than the A582 in both direction at all times of day, with a smaller
difference during peak hours but a large difference in the inter-peak. This indicates that at all times of day through
traffic is likely to prefer the B5254 to the A582, including traffic between West Preston and the SRN. In addition,
are large residential areas lie along the B5254 and between these routes, local traffic is likely to choose to use the
B5254 for the entire length of this section rather than the distributor road.
Journey time reliability on these two routes has also been investigated. The average observed speed along the
A582 northbound for each day for the AM peak hour and across the interpeak period are shown in Figure 3.2-T
and Figure 3.2-U respectively. The A582 shows relatively consistent speeds in the inter-peak period in the
northbound direction, with daily average speeds closely clustered around the two-month average.
However, during the AM peak significant variability can be seen. In particular, the single-carriageway sections of
the A582 between Stanifield Ln and Pope Ln show the highest peak hour variability, with observed speeds as low
as 15mph or 10mph on some days while approaching the IP average on others. In addition, the distribution of
Problem 3: Rat-running on local roads
The poor journey times and congestion on the A582 mean that at all times of day it is faster to travel
via local-roads including the B5254 between the Stanifield Lane roundabout and Penwortham Triangle
than it is to stay on the A582. This leads to traffic travelling from the SRN and business parks south of
the A582 to central Preston to rat-run along this route. This behaviour is supported by local knowledge.
The B5254 is a lower standard local road with residential and retail frontage and provides amenities
which serve local residents. It features high pedestrian and use and vulnerable users, as well as
providing the main high-frequency bus connection for local residents to Preston. As such it is unsuited
to carry high levels of through-traffic. The level of traffic using the B5254 in peak hours is causing
delays in peak hours.

27
observations over this spread is quite uniform on the single-carriageway sections, without any significant
clustering. However, on the dual carriageway section, a much tighter spread of speeds is seen with most
observations tightly clustered around the two-month average, with only a few outlier days recording speeds
significantly below the average. A similar pattern is seen in the southbound direction and the PM peak.
This shows that the single carriageway sections of the A582 experience a journey time reliability problem, in
addition to their overall congestion problem. Although average speeds are typically in the 20-30mph range on
these sections, speeds as low as half of this are fairly common, while other days show no significant delay over
uncongested conditions. Given that there is a consistent spread in the data with a lack of notable outliers, it is
unlikely that incidents are the cause of this variability. Therefore, as each point represents the average peak hour
speed on one day derived from multiple users’ data it is also unlikely that this variability is caused by slow moving
traffic, although this could be a factor on single-carriageway sections where overtaking is not possible. This
indicates that the congestion on the A582 is highly variable between different days and journey times are not
dependable. This poses a particular problem for commuters and business users, particularly goods vehicles, which
rely on dependable journey times to meet schedules.
Figure 3.2-T: AM Peak hour daily speed variability in Northbound direction along the A582.

28
Figure 3.2-U: Inter-peak period daily speed variability in Northbound direction along the A582.
The speed variability on the B5254 was also investigated and it showed a similar pattern. In the inter-peak, daily
speeds are tightly clustered around the two-month average. However, during peak times, significant variability is
seen, as shown in the northbound direction for the AM peak in Figure 3.2-V. Speeds as low as 3mph are seen on
certain days on some sections, indicating that standstill traffic is a regular occurrence. However, on other days
speeds are approaching the 30mph speed limit, indicating little to no delay.
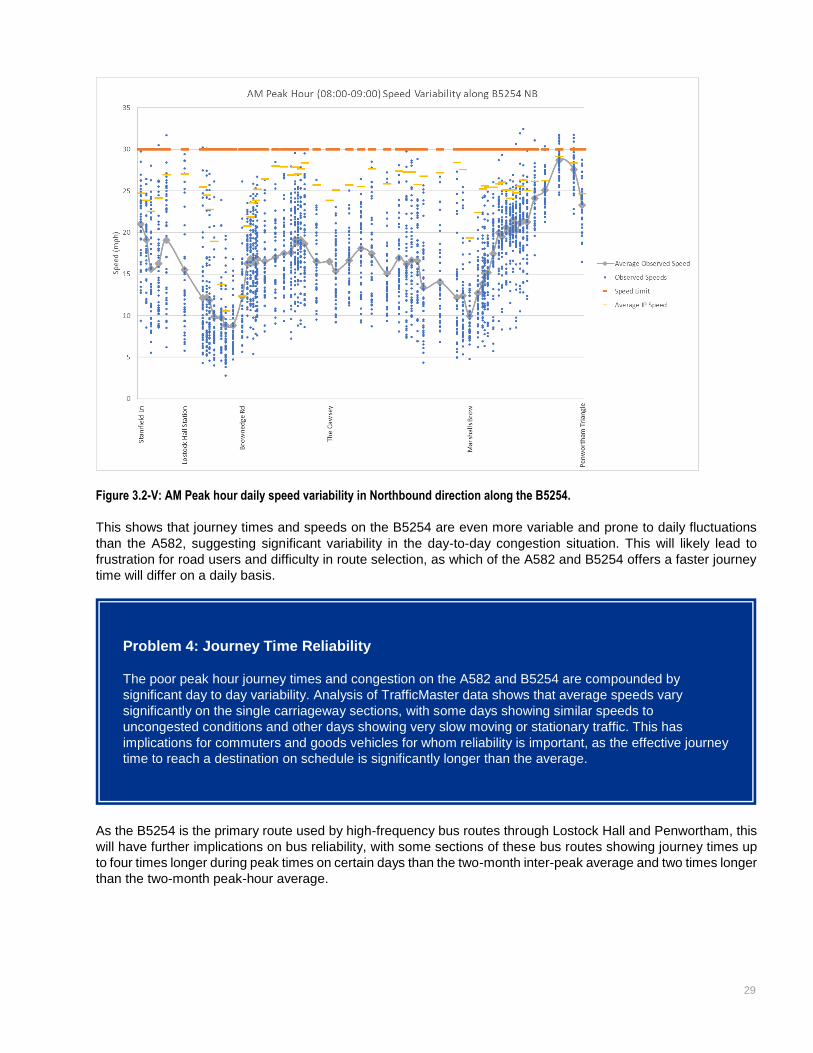
29
Figure 3.2-V: AM Peak hour daily speed variability in Northbound direction along the B5254.
This shows that journey times and speeds on the B5254 are even more variable and prone to daily fluctuations
than the A582, suggesting significant variability in the day-to-day congestion situation. This will likely lead to
frustration for road users and difficulty in route selection, as which of the A582 and B5254 offers a faster journey
time will differ on a daily basis.
As the B5254 is the primary route used by high-frequency bus routes through Lostock Hall and Penwortham, this
will have further implications on bus reliability, with some sections of these bus routes showing journey times up
to four times longer during peak times on certain days than the two-month inter-peak average and two times longer
than the two-month peak-hour average.
Problem 4: Journey Time Reliability
The poor peak hour journey times and congestion on the A582 and B5254 are compounded by
significant day to day variability. Analysis of TrafficMaster data shows that average speeds vary
significantly on the single carriageway sections, with some days showing similar speeds to
uncongested conditions and other days showing very slow moving or stationary traffic. This has
implications for commuters and goods vehicles for whom reliability is important, as the effective journey
time to reach a destination on schedule is significantly longer than the average.
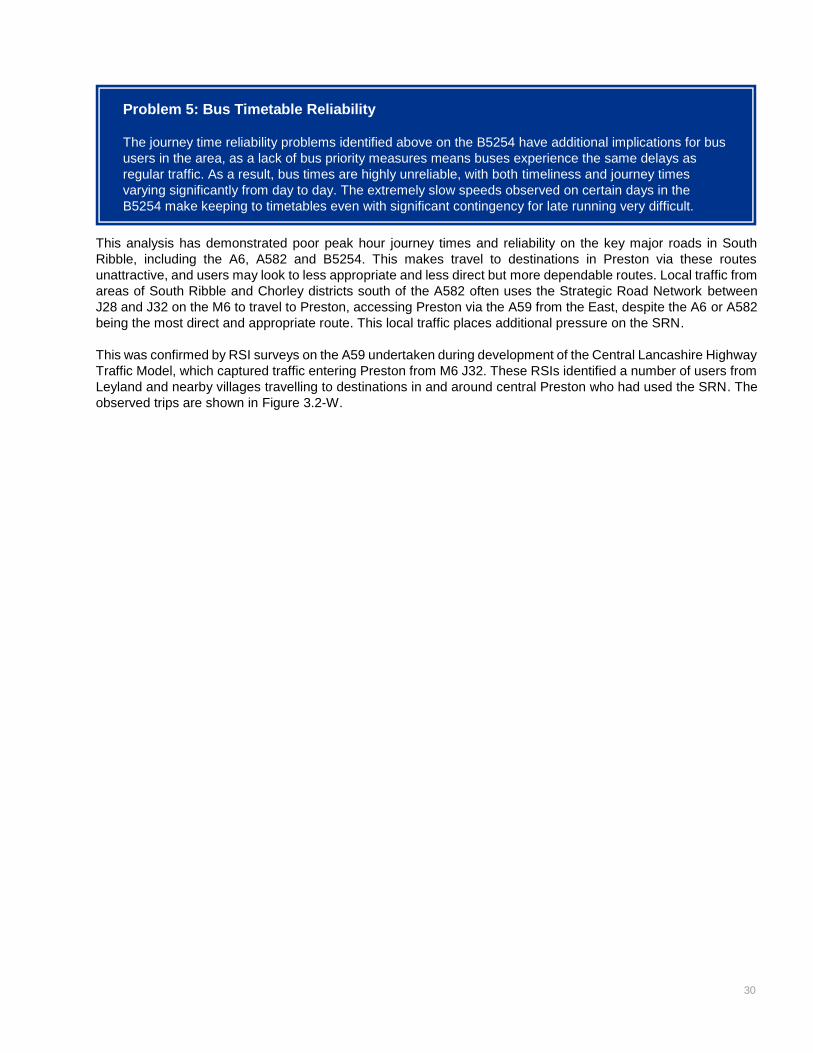
30
This analysis has demonstrated poor peak hour journey times and reliability on the key major roads in South
Ribble, including the A6, A582 and B5254. This makes travel to destinations in Preston via these routes
unattractive, and users may look to less appropriate and less direct but more dependable routes. Local traffic from
areas of South Ribble and Chorley districts south of the A582 often uses the Strategic Road Network between
J28 and J32 on the M6 to travel to Preston, accessing Preston via the A59 from the East, despite the A6 or A582
being the most direct and appropriate route. This local traffic places additional pressure on the SRN.
This was confirmed by RSI surveys on the A59 undertaken during development of the Central Lancashire Highway
Traffic Model, which captured traffic entering Preston from M6 J32. These RSIs identified a number of users from
Leyland and nearby villages travelling to destinations in and around central Preston who had used the SRN. The
observed trips are shown in Figure 3.2-W.
Problem 5: Bus Timetable Reliability
The journey time reliability problems identified above on the B5254 have additional implications for bus
users in the area, as a lack of bus priority measures means buses experience the same delays as
regular traffic. As a result, bus times are highly unreliable, with both timeliness and journey times
varying significantly from day to day. The extremely slow speeds observed on certain days in the
B5254 make keeping to timetables even with significant contingency for late running very difficult.
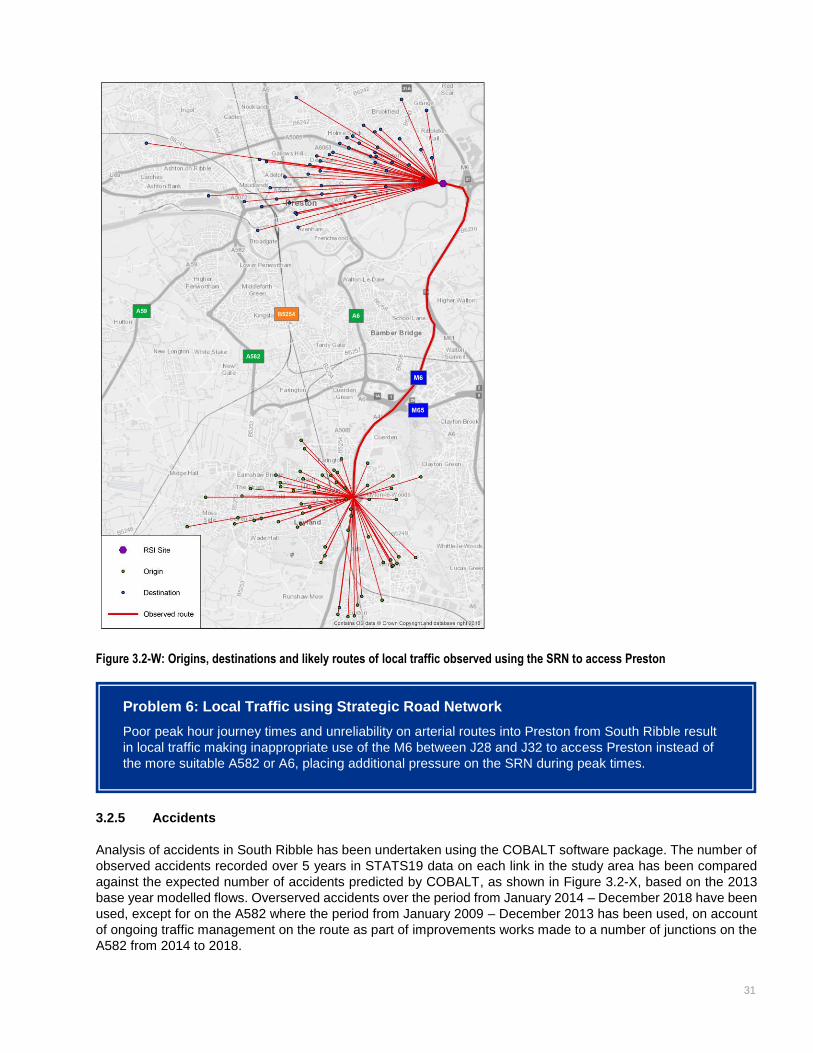
31
Figure 3.2-W: Origins, destinations and likely routes of local traffic observed using the SRN to access Preston
3.2.5 Accidents
Analysis of accidents in South Ribble has been undertaken using the COBALT software package. The number of
observed accidents recorded over 5 years in STATS19 data on each link in the study area has been compared
against the expected number of accidents predicted by COBALT, as shown in Figure 3.2-X, based on the 2013
base year modelled flows. Overserved accidents over the period from January 2014 – December 2018 have been
used, except for on the A582 where the period from January 2009 – December 2013 has been used, on account
of ongoing traffic management on the route as part of improvements works made to a number of junctions on the
A582 from 2014 to 2018.
Problem 6: Local Traffic using Strategic Road Network
Poor peak hour journey times and unreliability on arterial routes into Preston from South Ribble result
in local traffic making inappropriate use of the M6 between J28 and J32 to access Preston instead of
the more suitable A582 or A6, placing additional pressure on the SRN during peak times.
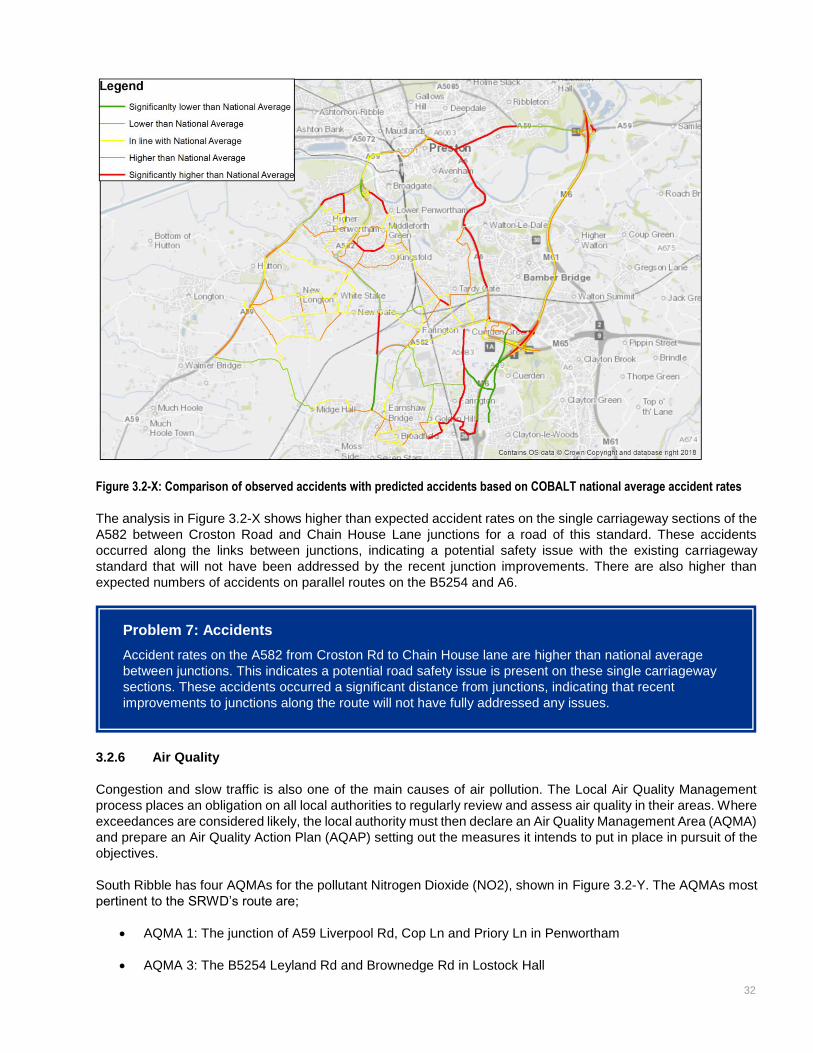
32
Figure 3.2-X: Comparison of observed accidents with predicted accidents based on COBALT national average accident rates
The analysis in Figure 3.2-X shows higher than expected accident rates on the single carriageway sections of the
A582 between Croston Road and Chain House Lane junctions for a road of this standard. These accidents
occurred along the links between junctions, indicating a potential safety issue with the existing carriageway
standard that will not have been addressed by the recent junction improvements. There are also higher than
expected numbers of accidents on parallel routes on the B5254 and A6.
3.2.6 Air Quality
Congestion and slow traffic is also one of the main causes of air pollution. The Local Air Quality Management
process places an obligation on all local authorities to regularly review and assess air quality in their areas. Where
exceedances are considered likely, the local authority must then declare an Air Quality Management Area (AQMA)
and prepare an Air Quality Action Plan (AQAP) setting out the measures it intends to put in place in pursuit of the
objectives.
South Ribble has four AQMAs for the pollutant Nitrogen Dioxide (NO2), shown in Figure 3.2-Y. The AQMAs most
pertinent to the SRWD’s route are;
AQMA 1: The junction of A59 Liverpool Rd, Cop Ln and Priory Ln in Penwortham
AQMA 3: The B5254 Leyland Rd and Brownedge Rd in Lostock Hall
Problem 7: Accidents
Accident rates on the A582 from Croston Rd to Chain House lane are higher than national average
between junctions. This indicates a potential road safety issue is present on these single carriageway
sections. These accidents occurred a significant distance from junctions, indicating that recent
improvements to junctions along the route will not have fully addressed any issues.
33
Both these locations currently experience high levels of congestion and demand as identified in section 3.2.3 and
3.2.4, with the B5254 in particular experiencing standing traffic and queuing throughout the length of this AQMA,
with the South Ribble LAQM Annual Status Report 2017 identifying that the annual mean Nitrogen Dioxide Level
is within 10% of the objective value. The LAQM Annual Status Report identified a slight general increase in NO2
levels at all monitoring locations since 2015.
Figure 3.2-Y: AQMAs in South Ribble and the locations of the CHLTM Schemes.
Although the scheme will not directly impact these AQMAs as it does not pass sufficiently close to them, there will
be indirect impacts due to changes in travel patterns. While these are not certain and will be quantified through
air quality modelling at the OBC stage, it is expected that the scheme will have a positive impact on AQMA 3 by
removing traffic from the B5254, as the upgraded A582 should be a more attractive route. The impact on AQMA1
is less certain, as significant changes in travel patterns in this area are expected upon completion of the
Penwortham Bypass, which combined with the improvements to Golden Way should cause a significant volume
to traffic to switch from using the A59 through AQMA 1 to the new route. The impact of the junction improvements
included in the SRWD scheme on AQMA 1 is likely to be significantly less than this affect.
Problem 8: Air Quality
Congestion on the B5254 is causing poor air quality in an Air Quality Management Area in Lostock Hall
(South Ribble AQMA 3) on this route around the junction between the B5254 and Brownedge Rd. The
South Ribble Local Air Quality Management Annual Status Report 2017 identified that annual mean
Nitrogen Dioxide levels in this AQMA were within 10% of their objective value, and the LAQM ASR
identified an increase in NO2 levels since 2015.
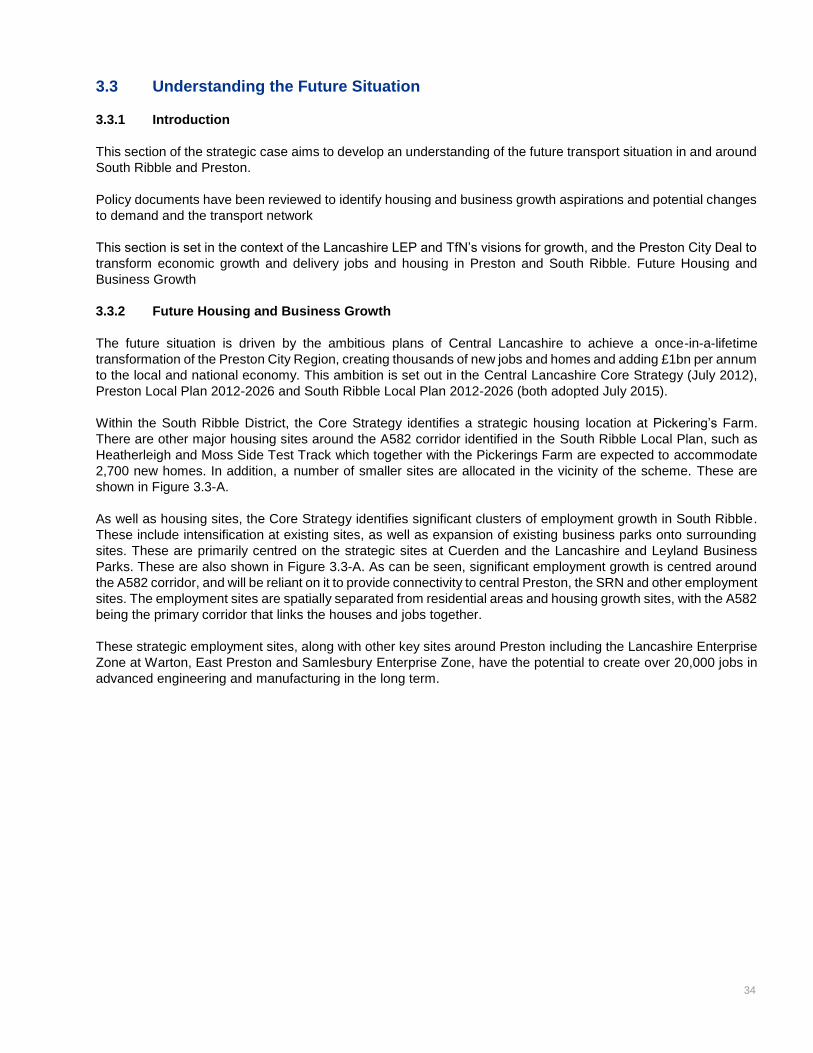
34
3.3 Understanding the Future Situation
3.3.1 Introduction
This section of the strategic case aims to develop an understanding of the future transport situation in and around
South Ribble and Preston.
Policy documents have been reviewed to identify housing and business growth aspirations and potential changes
to demand and the transport network
This section is set in the context of the Lancashire LEP and TfN’s visions for growth, and the Preston City Deal to
transform economic growth and delivery jobs and housing in Preston and South Ribble. Future Housing and
Business Growth
3.3.2 Future Housing and Business Growth
The future situation is driven by the ambitious plans of Central Lancashire to achieve a once-in-a-lifetime
transformation of the Preston City Region, creating thousands of new jobs and homes and adding £1bn per annum
to the local and national economy. This ambition is set out in the Central Lancashire Core Strategy (July 2012),
Preston Local Plan 2012-2026 and South Ribble Local Plan 2012-2026 (both adopted July 2015).
Within the South Ribble District, the Core Strategy identifies a strategic housing location at Pickering’s Farm.
There are other major housing sites around the A582 corridor identified in the South Ribble Local Plan, such as
Heatherleigh and Moss Side Test Track which together with the Pickerings Farm are expected to accommodate
2,700 new homes. In addition, a number of smaller sites are allocated in the vicinity of the scheme. These are
shown in Figure 3.3-A.
As well as housing sites, the Core Strategy identifies significant clusters of employment growth in South Ribble.
These include intensification at existing sites, as well as expansion of existing business parks onto surrounding
sites. These are primarily centred on the strategic sites at Cuerden and the Lancashire and Leyland Business
Parks. These are also shown in Figure 3.3-A. As can be seen, significant employment growth is centred around
the A582 corridor, and will be reliant on it to provide connectivity to central Preston, the SRN and other employment
sites. The employment sites are spatially separated from residential areas and housing growth sites, with the A582
being the primary corridor that links the houses and jobs together.
These strategic employment sites, along with other key sites around Preston including the Lancashire Enterprise
Zone at Warton, East Preston and Samlesbury Enterprise Zone, have the potential to create over 20,000 jobs in
advanced engineering and manufacturing in the long term.
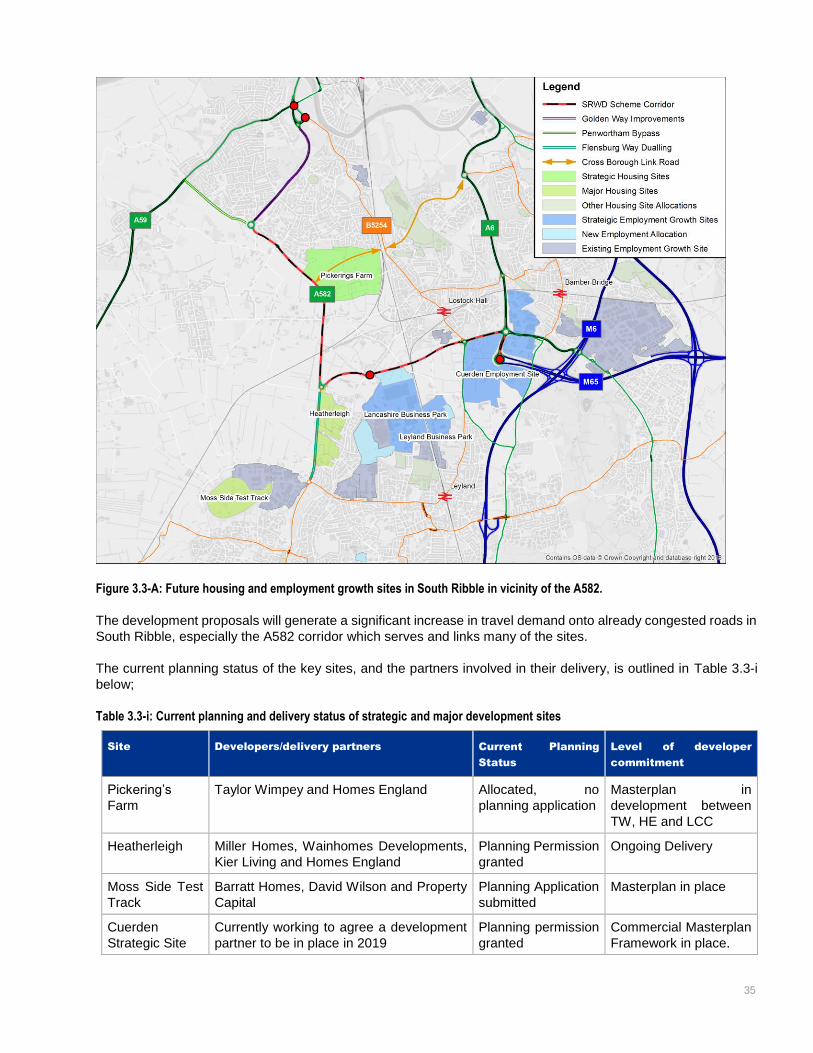
35
Figure 3.3-A: Future housing and employment growth sites in South Ribble in vicinity of the A582.
The development proposals will generate a significant increase in travel demand onto already congested roads in
South Ribble, especially the A582 corridor which serves and links many of the sites.
The current planning status of the key sites, and the partners involved in their delivery, is outlined in Table 3.3-i
below;
Table 3.3-i: Current planning and delivery status of strategic and major development sites
Site Developers/delivery partners Current Planning
Status
Level of developer
commitment
Pickering’s
Farm
Taylor Wimpey and Homes England Allocated, no
planning application
Masterplan in
development between
TW, HE and LCC
Heatherleigh Miller Homes, Wainhomes Developments,
Kier Living and Homes England
Planning Permission
granted
Ongoing Delivery
Moss Side Test
Track
Barratt Homes, David Wilson and Property
Capital
Planning Application
submitted
Masterplan in place
Cuerden
Strategic Site
Currently working to agree a development
partner to be in place in 2019
Planning permission
granted
Commercial Masterplan
Framework in place.
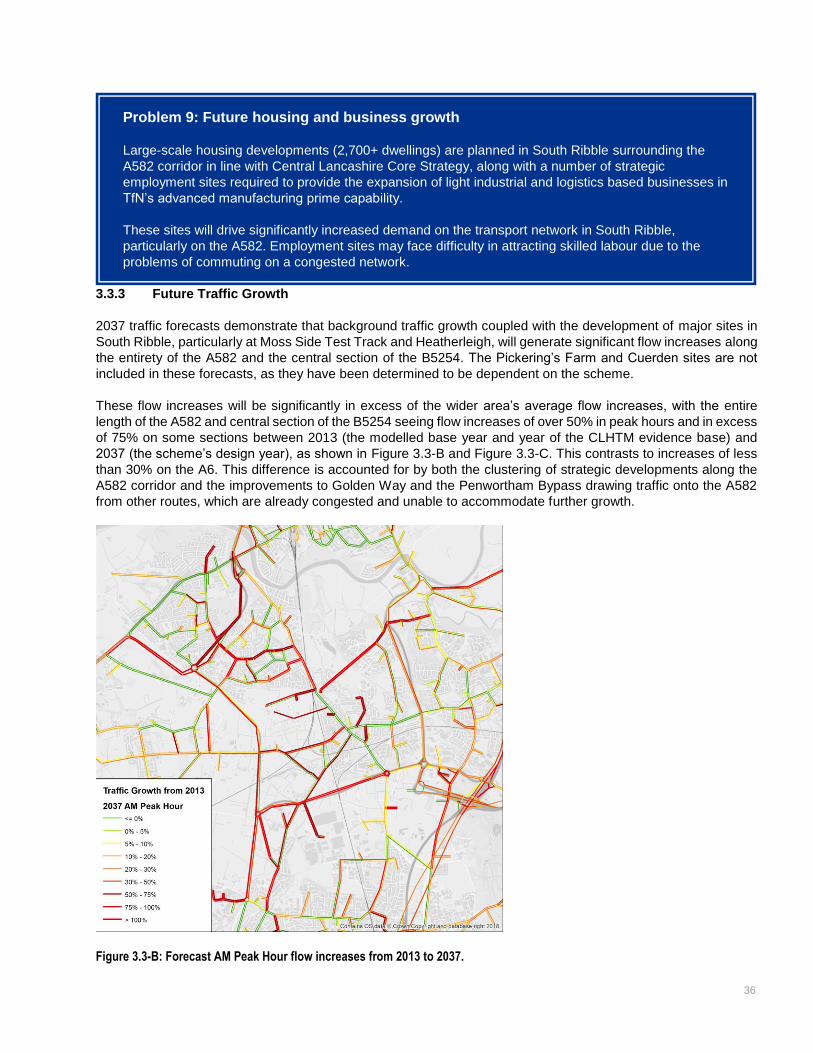
36
3.3.3 Future Traffic Growth
2037 traffic forecasts demonstrate that background traffic growth coupled with the development of major sites in
South Ribble, particularly at Moss Side Test Track and Heatherleigh, will generate significant flow increases along
the entirety of the A582 and the central section of the B5254. The Pickering’s Farm and Cuerden sites are not
included in these forecasts, as they have been determined to be dependent on the scheme.
These flow increases will be significantly in excess of the wider area’s average flow increases, with the entire
length of the A582 and central section of the B5254 seeing flow increases of over 50% in peak hours and in excess
of 75% on some sections between 2013 (the modelled base year and year of the CLHTM evidence base) and
2037 (the scheme’s design year), as shown in Figure 3.3-B and Figure 3.3-C. This contrasts to increases of less
than 30% on the A6. This difference is accounted for by both the clustering of strategic developments along the
A582 corridor and the improvements to Golden Way and the Penwortham Bypass drawing traffic onto the A582
from other routes, which are already congested and unable to accommodate further growth.
Figure 3.3-B: Forecast AM Peak Hour flow increases from 2013 to 2037.
Problem 9: Future housing and business growth
Large-scale housing developments (2,700+ dwellings) are planned in South Ribble surrounding the
A582 corridor in line with Central Lancashire Core Strategy, along with a number of strategic
employment sites required to provide the expansion of light industrial and logistics based businesses in
TfN’s advanced manufacturing prime capability.
These sites will drive significantly increased demand on the transport network in South Ribble,
particularly on the A582. Employment sites may face difficulty in attracting skilled labour due to the
problems of commuting on a congested network.
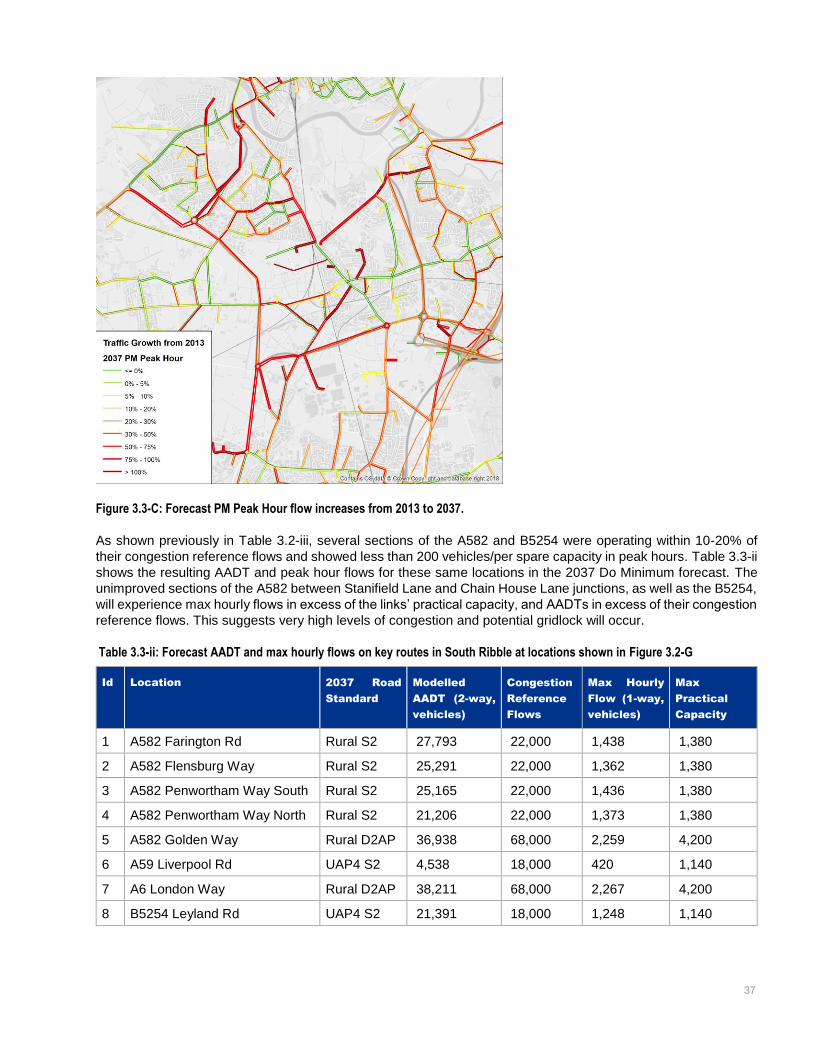
37
Figure 3.3-C: Forecast PM Peak Hour flow increases from 2013 to 2037.
As shown previously in Table 3.2-iii, several sections of the A582 and B5254 were operating within 10-20% of
their congestion reference flows and showed less than 200 vehicles/per spare capacity in peak hours. Table 3.3-ii
shows the resulting AADT and peak hour flows for these same locations in the 2037 Do Minimum forecast. The
unimproved sections of the A582 between Stanifield Lane and Chain House Lane junctions, as well as the B5254,
will experience max hourly flows in excess of the links’ practical capacity, and AADTs in excess of their congestion
reference flows. This suggests very high levels of congestion and potential gridlock will occur.
Table 3.3-ii: Forecast AADT and max hourly flows on key routes in South Ribble at locations shown in Figure 3.2-G
Id Location 2037 Road
Standard
Modelled
AADT (2-way,
vehicles)
Congestion
Reference
Flows
Max Hourly
Flow (1-way,
vehicles)
Max
Practical
Capacity
1 A582 Farington Rd Rural S2 27,793 22,000 1,438 1,380
2 A582 Flensburg Way Rural S2 25,291 22,000 1,362 1,380
3 A582 Penwortham Way South Rural S2 25,165 22,000 1,436 1,380
4 A582 Penwortham Way North Rural S2 21,206 22,000 1,373 1,380
5 A582 Golden Way Rural D2AP 36,938 68,000 2,259 4,200
6 A59 Liverpool Rd UAP4 S2 4,538 18,000 420 1,140
7 A6 London Way Rural D2AP 38,211 68,000 2,267 4,200
8 B5254 Leyland Rd UAP4 S2 21,391 18,000 1,248 1,140
38
The identified pattern of traffic increases in the modelled 2037 year will exacerbate the problems identified section
3.2, worsening journey times and reliability as well as increasing the frequency of road traffic accidents. In addition,
it is likely that without intervention the increased congestion on the A582 will hamper the growth ambitions outlined
in section 3.3.2, particularly the development of strategic employment and housing sites, as worsening peak hour
conditions will make sites along the A582 corridor unattractive to residents, developers and businesses.
Of particular relevance are the impacts on the potential Pickering’s Farm and Cuerden sites. Both sites are
identified in the City Deal as essential to unlocking the city region’s economic growth potential, and both are reliant
on future improvement of the transport network which will be provided by the City Deal schemes.
Pickering’s farm will be accessed through the A582 Penwortham Way North and B5254 Leyland Rd (ID 4 and 8
in Table 3.3-ii). The forecast model shows that both these routes will be at or exceeding their capacity, both in
AADT and peak hour flows, in 2037 before development traffic is considered. As such, the level of service on the
network at these locations will be unacceptable for a development of this size to be granted permission without
transport intervention, and without the SRWD scheme the site may not be able to proceed. Further investigation
of this site, including dependency testing, will be undertaken during development of the Outline Business Case to
determine the implications of this analysis for the site.
The Cuerden Strategic Site is located next to the M65 terminus roundabout, and the main access to the site will
be off this roundabout. Unlocking this site is one of the primary business drivers of the scheme, as the costs of
the site access cannot be viably met from private sector contributions without public funding to support. This
dependency was demonstrated by an independent Options Review which was undertaken in 2018 by commercial
property advisors GL Heam on behalf of LCC that demonstrated, through viability testing, that a viable
development strategy exists only if external funding was available to support any off-site highways infrastructure
improvements, primarily the M65 Terminus Roundabout access, with on-site infrastructure costs able to be funded
via scheme revenues.
3.3.4 Infrastructure provision in the Central Lancashire Highways and Transport Masterplan and
Preston City Deal and beyond
The central Lancashire Highways and Transport Masterplan (CLHTM) was adopted in 2013 to support Lancashire
County Council’s ambitions for growth set out in the Central Lancashire Core Strategy, and represents the County
Council’s priorities for future investment in highways and transport across Central Lancashire. Creating extra
capacity has been recognised as key to accommodating new development necessary to achieve the Preston City
Region’s growth objectives, improving the most important bus corridors and enhancing the ‘public realm’ to
encourage sustainable travel and economic growth.
Problem 10: Pickering’s Farm and Cuerden Constraints
The planned large-scale housing development (1,350+ dwellings) at Pickering’s Farm faces significant
deliverability challenges until the capacity of the highway network in the vicinity of the site has been
improved. Pickering’s Farm will be accessed from both the A582 and B5254, which both show
unacceptable levels of service at present and will experience growth in excess of 50% between 2013
and the 2037 forecast year.
The Cuerden Strategic Site has been granted planning permission but is currently unable to proceed
due to the necessity of providing an upgrade to the M65 Terminus Roundabout to provide the primary
access to the site. The necessary scale of the upgrade to ensure a safe and efficiently operating
junction able to accommodate a high volume of goods traffic for the strategic employment site cannot
be viably met from private sector contributions, and without public intervention will render the entire site
unviable, significantly hampering growth ambitions in Central Lancashire and the Northern
Powerhouse Economy.
39
The Preston, South Ribble and Lancashire City Deal (September 2013) agreement with central government
secured investment for 4 of the major road schemes in the CLTM in order to unlock the housing and employment
potential within Lancashire. The 4 schemes to be delivered are:
Preston Western Distributor;
Broughton Bypass;
Penwortham Bypass; and,
A582 South Ribble Western Distributor.
Of these, only the A582 SRWD has yet to receive planning permission and regulatory consent, and represents
the final missing link in completing the city deal and unlocking the full growth potential in the Preston City Region.
The Broughton Bypass has already been completed and opened in 2018, with the Penwortham bypass having
already begun construction and the PWD at the final stage of business case approval and expected to start
construction in November 2019. In addition, improvements to the B6258 bus corridor through Bamber Bridge, part
of CLHTM’s Chorley-Cuerden-Bamber Bridge-Preston bus rapid transit corridor, have been completed.
A number of junction improvements along the A582 corridor have been completed by Lancashire County Council
in preparation for full dualling of the corridor.
In addition to the CHLTM schemes, improvements to Flensburg Way between Moss Side and the A582 SRWD at
Tank Roundabout, and a Cross Borough Link Road between the A582 at Pickering’s Farm, the B5254 and A6 at
Warton-le-Dale have been identified as additional infrastructure requirements in the South Ribble Local Plan (July
2015) and planned to be delivered through a combination of local and private sector contributions. These schemes
all depend on the completion of the A582 SRWD to link them to the rest of the district and city region with a high-
quality dual carriageway road, and without the SRWD will be isolated from the wider network by the missing link
and their potential benefits lost.
Since the City Deal with government and the delivery of the CLHTM schemes, Central Lancashire’s historic
economic underperformance has been significantly reversed, with the city region now becoming one of the
strongest performing centres in the North of England, and only out-performed by Manchester and Leeds in terms
of GVA per head. In recognition of this, the Department for Transport has selected the Preston City Region as one
of 10 shortlisted city regions for further investment through the Transforming Cities Fund.
Preston’s Transforming Cities Fund bid centres on public transport improvements in Preston and South Ribble.
These would involve a new north-south bus and active travel corridor between North West Preston and Leyland,
via the B5254 and Cuerden strategic site, as well as improvements to the South Fylde and East Lancashire rail
lines, improving services between Lostock Hall, Bamber Bridge, Preston and a new Cottam Parkway station, and
an East-West bus priority corridor across Preston. Of these, the B5254 corridor is dependent on the delivery of
the A582 SRWD to provide the necessary highway capacity to make the scheme possible, and relieve the present
high levels of congestion on the B5254 identified in section 3.2.4.
Beyond 2026, there is a proposal for a new Ribble Bridge west of Preston, linking the Preston Western Distributor
to the Penwortham Bypass, and Smart Motorway on the M6 between J29 and J32. The new Ribble Bridge
proposal would link the south end of the PWD to the Penwortham Bypass, creating a continuous link between the
M55 and M65 around the South West side of Preston. However, this scheme is dependent on the SRWD to
provide the sufficient capacity on the network between the Penwortham Bypass and M65 by upgrading the route
to high-quality dual carriageway.
3.3.5 Impact of Not Intervening
Delivery of the SRWD scheme is essential to resolving current and foreseeable problems and issues that could
otherwise result in gridlock for the transport network and missed opportunities to develop the local economy as
40
identified in sections 3.2 and 3.3 above. It is the last scheme identified by the Preston City Deal and CLHTM as
necessary to unlock the full potential of economic growth in the Preston City Region.
If no action is taken, there will be a significant worsening of existing traffic conditions, as well as missed
opportunities for economic growth and development in Central Lancashire. Not intervening is likely to lead to the
following situations developing:
Significantly worsening congestion on the A582 and B5254, with both roads exceeding their practical
capacity by 2037 and experiencing gridlock in peak hours
An associated deterioration in journey times and journey time reliability for both car users and bus
passengers
Air Quality in South Ribble AQMA 3 in Lostock Hall will continue to worsen as congestion and queuing on
the B5254 through the AQMA worsen, likely exceeding the objective value.
Challenges to the deliverability of Pickering’s Farm strategic housing site resulting in the loss of 1,350
homes
Cuerden Strategic Site cannot be delivered, significantly reducing private sector investment and economic
growth in South Ribble
Loss of momentum in transport and business investment sees interest shift to other regions, permanently
missing opportunities for further growth. Economic growth in Central Lancashire returns to its historic
under-performing trend.
Transforming Cities Fund scheme to improve public transport and active travel on a north-south corridor
is unable to proceed or significantly curtailed in scope due to worsening conditions on the B5254.
Unattractiveness of commutes along the A582 corridor results in a reduction of homebuyer and developer
interest at other sites in South Ribble, including Moss Side Test Track and Heatherleigh, which are unlikely
to meet their completions target.
Difficulty in attracting workers results in reduced business investment at the Lancashire and Leyland
Business Parks and reduced job creation at these sites
Reduced business investment in South Ribble hinders Central Lancashire’s ambitions to develop a
globally competitive hub of Aerospace and Advanced Manufacturing, loss of agglomeration economics
and reduced regional and national economic growth.
Further opportunities for transformational growth across Lancashire are lost.
3.4 Establishing the Need for Intervention
The following provides a summary of the existing and future transport problems and issues in South Ribble
discussed in detail in the previous sections
Congestion in the morning and evening peak periods cause poor journey time reliability and lengthy
travel times for North-South traffic to and from Preston. Significant delay occurs on both key arterial A-
roads and parallel local roads. As a result, local traffic makes inappropriate use of the M6 between J28
and J32 to access Preston instead of the more suitable A582 or A6, placing additional pressure on the
SRN during peak times. The congestion also causes delays and frustration for motorists alongside
emissions and environmental issues in residential areas.
Variable Road Standard on the A582 between dual and single-carriageway sections, with poorer road
standard than expected for an MRN route on single carriageway sections, leads to inter-peak and off-
41
peak speeds significantly below the speed limit for the road and increased travel times, in contrast to the
upgraded dual-carriageway section on Golden Way which shows observed speeds at the speed limit. This
also causes the B5254, a local road unsuitable for high traffic volumes, to be a faster and preferable route
than the A582 at all times of day.
Future housing and business growth constraints. Large-scale housing developments are planned in
South Ribble in line with the Central Lancashire Core Strategy but will face significant challenges to their
deliverability until the capacity of the highway network has been improved. The expansion of light industrial
and logistics based businesses with a high value output including the Cuerden Strategic Site and the
Lancashire and Leyland Business Parks is constrained by traffic congestion and difficulty in attracting
skilled labour due to the problems of commuting. The lack of available capacity on the local network will
present significant challenges to the delivery of the Pickering’s Farm development, while the Cuerden
Strategic Site is currently unable to proceed despite having planning permission due to requiring public
investment to support delivery of the main access to the site from the M65 Terminus Roundabout.
Unreliable bus journey times. Bus journeys on the only high-frequency route through Lostock Hall and
Penwortham on the B5254 are significantly extended and highly unreliable during peak hours due to the
congestion and day-to-day journey time variability on this route.
Accidents. Higher than expected accident rates are observed between junctions on the A582 from
Croston Rd to Chain House Ln, indicating road safety issues which will not have been fully addressed by
recent junction improvement works. Higher than national average accident rates are also observed on the
B5254 and A6.
Air Quality. Nitrogen Dioxide Levels in the Air Quality Management Area in Lostock Hall are within 10%
of their objective value and on an upwards trend since 2015 due to the significant congestion and queuing
traffic on the B5254 through the AQMA.
Limited capacity for future sustainable transport interventions. The B5254 is identified as a part of a
key future bus priority corridor in the CLHTM which will be included in an upcoming bid to the DfT’s
Transforming Cities Fund. Existing congestion on the B5254 will severely limit the achievable scope and
impact of this scheme without a complimentary highways intervention to provide relief to this road.
As demonstrated the transport network in South Ribble is already reaching a critical point in terms of both the level
and comprehensiveness of congestion, being present on all key arterial routes to and from central Preston as well
as key employment locations around the A582 corridor. This leads to poor private and public transport journey
time reliability, accidents and excessive concentrations of air pollution.
The level of new development proposed in the adopted Central Lancashire Core Strategy would add high volumes
of additional traffic onto already extremely busy roads in South Ribble, evidenced from future forecasts of traffic
patterns.
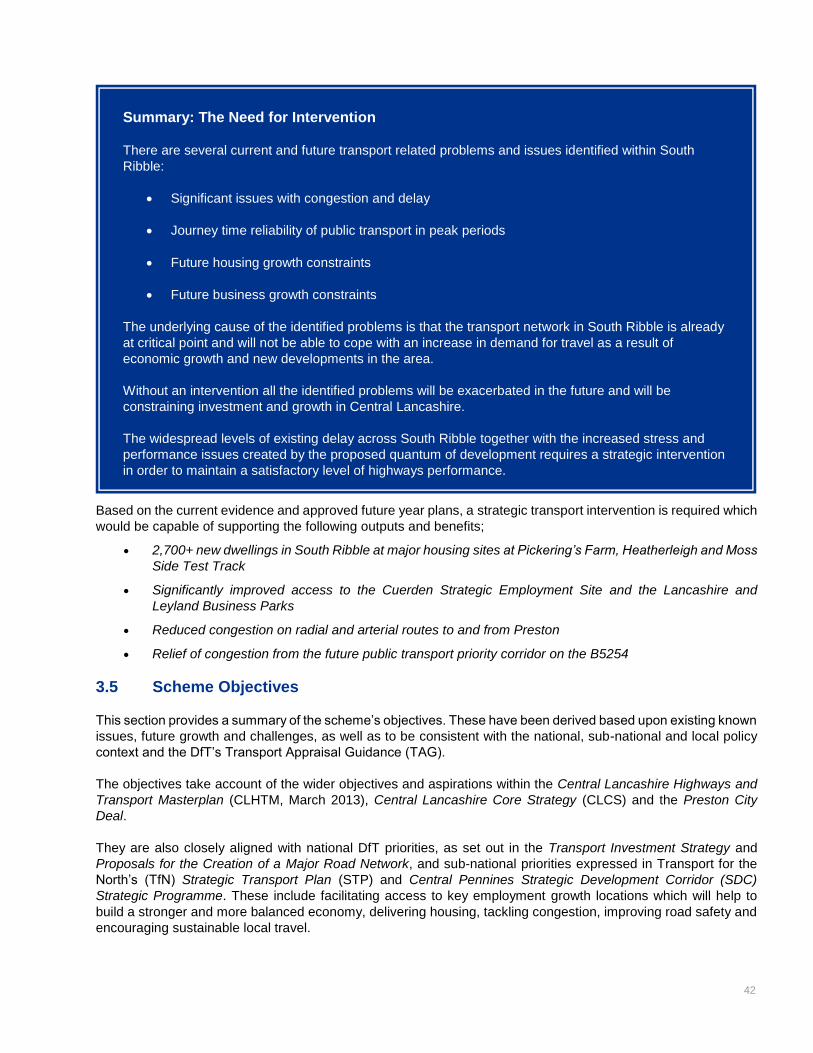
42
Based on the current evidence and approved future year plans, a strategic transport intervention is required which
would be capable of supporting the following outputs and benefits;
2,700+ new dwellings in South Ribble at major housing sites at Pickering’s Farm, Heatherleigh and Moss
Side Test Track
Significantly improved access to the Cuerden Strategic Employment Site and the Lancashire and
Leyland Business Parks
Reduced congestion on radial and arterial routes to and from Preston
Relief of congestion from the future public transport priority corridor on the B5254
3.5 Scheme Objectives
This section provides a summary of the scheme’s objectives. These have been derived based upon existing known
issues, future growth and challenges, as well as to be consistent with the national, sub-national and local policy
context and the DfT’s Transport Appraisal Guidance (TAG).
The objectives take account of the wider objectives and aspirations within the Central Lancashire Highways and
Transport Masterplan (CLHTM, March 2013), Central Lancashire Core Strategy (CLCS) and the Preston City
Deal.
They are also closely aligned with national DfT priorities, as set out in the Transport Investment Strategy and
Proposals for the Creation of a Major Road Network, and sub-national priorities expressed in Transport for the
North’s (TfN) Strategic Transport Plan (STP) and Central Pennines Strategic Development Corridor (SDC)
Strategic Programme. These include facilitating access to key employment growth locations which will help to
build a stronger and more balanced economy, delivering housing, tackling congestion, improving road safety and
encouraging sustainable local travel.
Summary: The Need for Intervention
There are several current and future transport related problems and issues identified within South
Ribble:
Significant issues with congestion and delay
Journey time reliability of public transport in peak periods
Future housing growth constraints
Future business growth constraints
The underlying cause of the identified problems is that the transport network in South Ribble is already
at critical point and will not be able to cope with an increase in demand for travel as a result of
economic growth and new developments in the area.
Without an intervention all the identified problems will be exacerbated in the future and will be
constraining investment and growth in Central Lancashire.
The widespread levels of existing delay across South Ribble together with the increased stress and
performance issues created by the proposed quantum of development requires a strategic intervention
in order to maintain a satisfactory level of highways performance.
43
In addition to meeting national and local objectives, the study objectives have been derived from the evidence in
sections 3.2, 3.3 and 3.3.5 and public consultation to ensure the deliverability of the CLCS and to address the
findings of the current situation and future situation presented above. These objectives were used during the
option sifting process described in section 3.7.
The study objectives are split into two tiers. The five primary objectives are critical to the delivery of the CLCS
and CLHTM and the TfN Central Pennines SDC Strategic Programme, as well as being strongly aligned with
national and sub-national policies. The five supporting objectives relate to additional policy aspirations and the
identified problems from section 3.3.5. The full set of objectives is listed below;
A. Primary Objectives
1. Reduce congestion on arterial routes between Preston city centre and the Strategic Road
Network
2. Support Economic Growth in South Ribble through full development of, and access to, the
Cuerden Strategic Employment Site
3. Support delivery of housing sites accommodating over 2,700 new dwellings south of Preston
4. Support sustainable and active modes by facilitating the provision of bus network
improvements and enhanced walking and cycling facilities on routes connecting South Ribble to
key economic sites in Preston City Centre and the Cuerden Strategic Employment Site
5. Reduce pressure on the SRN, particularly the M6 between Junctions 28 and 32, by reducing
local traffic movements using the SRN
B. Supporting Objectives
1. Enhance the public realm and local centres in South Ribble and Preston.
2. Improve road safety by reducing the frequency and severity of road traffic accidents in the study
area.
3. Improve air quality and reduce noise pollution in residential areas of South Ribble and Preston.
4. Support further housing and employment growth potential in South Ribble.
5. Support access to a new Ribble Crossing with the A583 west of Penwortham.
3.6 Policy Review and Strategic Fit
3.6.1 Introduction
The strategic “policy fit” of the business case is required to demonstrate how the proposed transport intervention
aligns with objectives, priorities and aspirations set out within local, sub-regional and national policy.
It is important to understand the economic and social policy context in which the proposals are made and how
local and national policy aspirations can be supported through the delivery of well thoughts out improvements to
the transport network. A policy review has therefore been undertaken of pertinent local, national and sub-national
policy documents to establish the ‘Strategic Fit’ of the proposed scheme.
The following sections set out the key national, sub-national and local policies which are pertinent with the SRWD
scheme, and the overall policy fit of the scheme with these policies. The key national, sub-national and local
policies which are pertinent to the scheme are;
44
National Policy
National Planning Policy Framework (February 2019)
Transport Investment Strategy (July 2017) – Department for Transport
Proposals for the Creation of a Major Road Network (December 2017) – Department for Transport
Draft Road Investment Strategy 2 Government objectives (October 2018) – Department for Transport
Highways England Delivery Plan 2015-2020
Sub-national Policy
Strategic Transport Plan (February 2019) – Transport for the North
Central Pennines Strategic Development Corridor Strategic Programme Outline Case (February 2019)
– Transport for the North
Local Policy
Preston, South Ribble and Lancashire City Deal (September 2013)
Lancashire Strategic Economic Plan (March 2014)
Central Lancashire Core Strategy (July 2012)
South Ribble Local Plan 2012-2026 (July 2015)
The Local Transport Plan 2011- 2021, A Strategy for Lancashire (May 2011)
Central Lancashire Highways and Transport Masterplan (March 2013)
A summary of each of the above documents and how the SRWD aligns with them is outlined below.
3.6.2 National Policy
National Planning Policy Framework (February 2019)
National themes, objectives and strategies for planning and policy are set out by The Department for Communities
and Local Government (DCLG) in the National Planning Policy Framework (NPPF). The NPPF priorities and
principles that are considered relevant in this assessment are detailed below.
Paragraph 72 of the NPPF states:
‘The supply of large numbers of new homes can often be best achieved through planning for larger scale
development, such as new settlements or significant extensions to existing villages and towns, provided they are
well located and designed, and supported by the necessary infrastructure and facilities...’
The Pickering’s Farm strategic housing location is an extension to Penwortham with 1,350 new dwellings allocated
in the South Ribble Local Plan to meet the demand for local housing, with further dwellings identified on
neighbouring sites for future allocation. To best achieve this scale of development and further future development,
the SRWD is needed to provide sufficient highway capacity in the immediate vicinity of the site and enable the
additional neighbouring sites to be delivered at a later date. The SRWD will also reduce congestion on alternate
routes through the area, enabling the delivery of sustainable transport schemes which will further support the
delivery of Pickering’s Farm and other developments.
Paragraph 80 of the NPPF states:
‘Planning policies and decisions should help create the conditions in which businesses can invest, expand and
adapt. Significant weight should be placed on the need to support economic growth and productivity, taking into
account both local business needs and wider opportunities for development. The approach taken should allow
each area to build on its strengths, counter any weaknesses and address the challenges of the future’
45
The Cuerden strategic employment site is a key site for business investment in South Ribble. Located to the south
of the SRWD and adjacent to existing key employment sites in the South Rings Business Park and South Preston
Office Village, it will support economic growth and boost productivity in the region by building on the strengths of
local industry. The SRWD is an important infrastructure intervention for enabling business investment at Cuerden,
both by providing direct access to the site and enhancing the site’s connectivity to Central Preston and Southport
and Liverpool via the A59.
Transport Investment Strategy (July 2017) – Department for Transport
The Transport Investment Strategy sets out the Government’s plans and priorities for investment in transport
infrastructure, and how investment decisions will be made, to align with and build upon the Government’s Industrial
Strategy (Department for business, Energy and Industrial Strategy, updated June 2018).
Paragraph 3.1 of the Transport Investment Strategy sets out the DfT’s Strategic priorities for investment it states;
‘3.1 As we look ahead to future investment decisions, meeting the challenges set out in Chapter 1 will be at the
heart of our work. Through our investment we can and must seek to:
‘─ create a more reliable, less congested, and better connected transport network that works for the
users who rely on it
Our intensively used networks are ageing and face increasing demands, creating delays and undermining
reliability. In places they don’t provide the connections people and businesses need.’
The SRWD will improve reliability on the A582 by providing increased capacity along the entire section, addressing
identified issues with existing condition and unreliability of journey times which make this route unattractive for
users. In addition, the increased capacity will provide relief to other arterial routes into Preston such as the A6 and
B5254, reducing congestion across the local network.
In addition, the SRWD will provide reliable access from the M65 to the under-construction Penwortham Bypass
and A59, enhancing connectivity to Southport, and will support future aspirations for a new Ribble Crossing west
of Preston, which will further improve the connectivity of the network by providing a link from South Ribble to West
Preston and Blackpool. These new connections will help serve both local communities and businesses in
important local employment clusters.
‘─ build a stronger, more balanced economy by enhancing productivity and responding to local growth
priorities
Our national productivity lags behind other countries and prosperity hasn’t been shared evenly between
different places, leaving some communities feeling left behind.’
The SRWD will build on local growth priorities by improving the accessibility and connectivity between key local
employment and growth areas, including the Cuerden strategic growth site, Leyland Business Park, South Rings
Business Park, South Preston Office Village and Preston Technology Park. It will also enhance the connectivity
of these sites to the wider Major Roads network, particularly the A59 to Southport and Liverpool, and will support
future delivery of a new Ribble crossing west of Preston which will provide access to the Warton Enterprise Zone.
‘─ enhance our global competitiveness by making Britain a more attractive place to trade and invest
Our long term success in a globalised world will depend on our ability to attract job-creating investment in our
industrial strengths and to trade as frictionlessly as possible with partners old and new.’
The enhanced connectivity provided by the SRWD will give businesses confidence to invest in high productivity
sectors within the area, as well as connecting companies to regional and international supply chains. Of particular
local and regional importance is better connecting the business parks in South Ribble to the BAE systems facilities
at Preston Technology Park and Warton Enterprise Zone, which will help create a globally competitive industrial
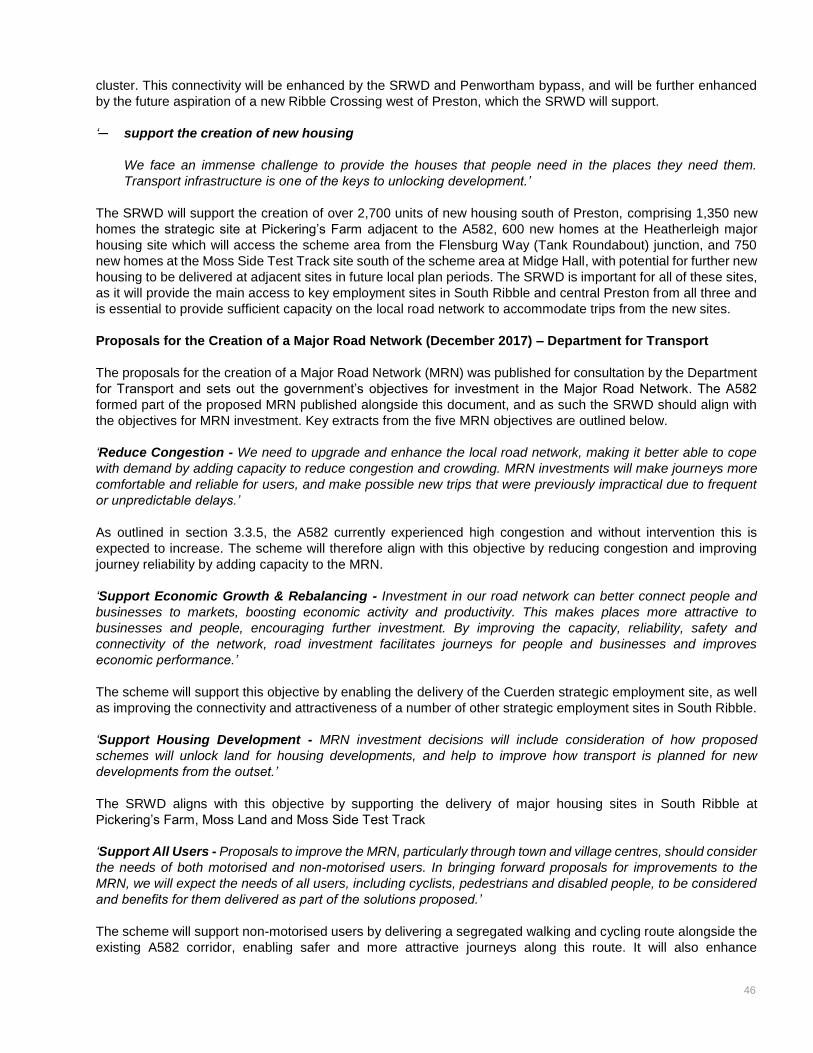
46
cluster. This connectivity will be enhanced by the SRWD and Penwortham bypass, and will be further enhanced
by the future aspiration of a new Ribble Crossing west of Preston, which the SRWD will support.
‘─ support the creation of new housing
We face an immense challenge to provide the houses that people need in the places they need them.
Transport infrastructure is one of the keys to unlocking development.’
The SRWD will support the creation of over 2,700 units of new housing south of Preston, comprising 1,350 new
homes the strategic site at Pickering’s Farm adjacent to the A582, 600 new homes at the Heatherleigh major
housing site which will access the scheme area from the Flensburg Way (Tank Roundabout) junction, and 750
new homes at the Moss Side Test Track site south of the scheme area at Midge Hall, with potential for further new
housing to be delivered at adjacent sites in future local plan periods. The SRWD is important for all of these sites,
as it will provide the main access to key employment sites in South Ribble and central Preston from all three and
is essential to provide sufficient capacity on the local road network to accommodate trips from the new sites.
Proposals for the Creation of a Major Road Network (December 2017) – Department for Transport
The proposals for the creation of a Major Road Network (MRN) was published for consultation by the Department
for Transport and sets out the government’s objectives for investment in the Major Road Network. The A582
formed part of the proposed MRN published alongside this document, and as such the SRWD should align with
the objectives for MRN investment. Key extracts from the five MRN objectives are outlined below.
‘Reduce Congestion - We need to upgrade and enhance the local road network, making it better able to cope
with demand by adding capacity to reduce congestion and crowding. MRN investments will make journeys more
comfortable and reliable for users, and make possible new trips that were previously impractical due to frequent
or unpredictable delays.’
As outlined in section 3.3.5, the A582 currently experienced high congestion and without intervention this is
expected to increase. The scheme will therefore align with this objective by reducing congestion and improving
journey reliability by adding capacity to the MRN.
‘Support Economic Growth & Rebalancing - Investment in our road network can better connect people and
businesses to markets, boosting economic activity and productivity. This makes places more attractive to
businesses and people, encouraging further investment. By improving the capacity, reliability, safety and
connectivity of the network, road investment facilitates journeys for people and businesses and improves
economic performance.’
The scheme will support this objective by enabling the delivery of the Cuerden strategic employment site, as well
as improving the connectivity and attractiveness of a number of other strategic employment sites in South Ribble.
‘Support Housing Development - MRN investment decisions will include consideration of how proposed
schemes will unlock land for housing developments, and help to improve how transport is planned for new
developments from the outset.’
The SRWD aligns with this objective by supporting the delivery of major housing sites in South Ribble at
Pickering’s Farm, Moss Land and Moss Side Test Track
‘Support All Users - Proposals to improve the MRN, particularly through town and village centres, should consider
the needs of both motorised and non-motorised users. In bringing forward proposals for improvements to the
MRN, we will expect the needs of all users, including cyclists, pedestrians and disabled people, to be considered
and benefits for them delivered as part of the solutions proposed.’
The scheme will support non-motorised users by delivering a segregated walking and cycling route alongside the
existing A582 corridor, enabling safer and more attractive journeys along this route. It will also enhance
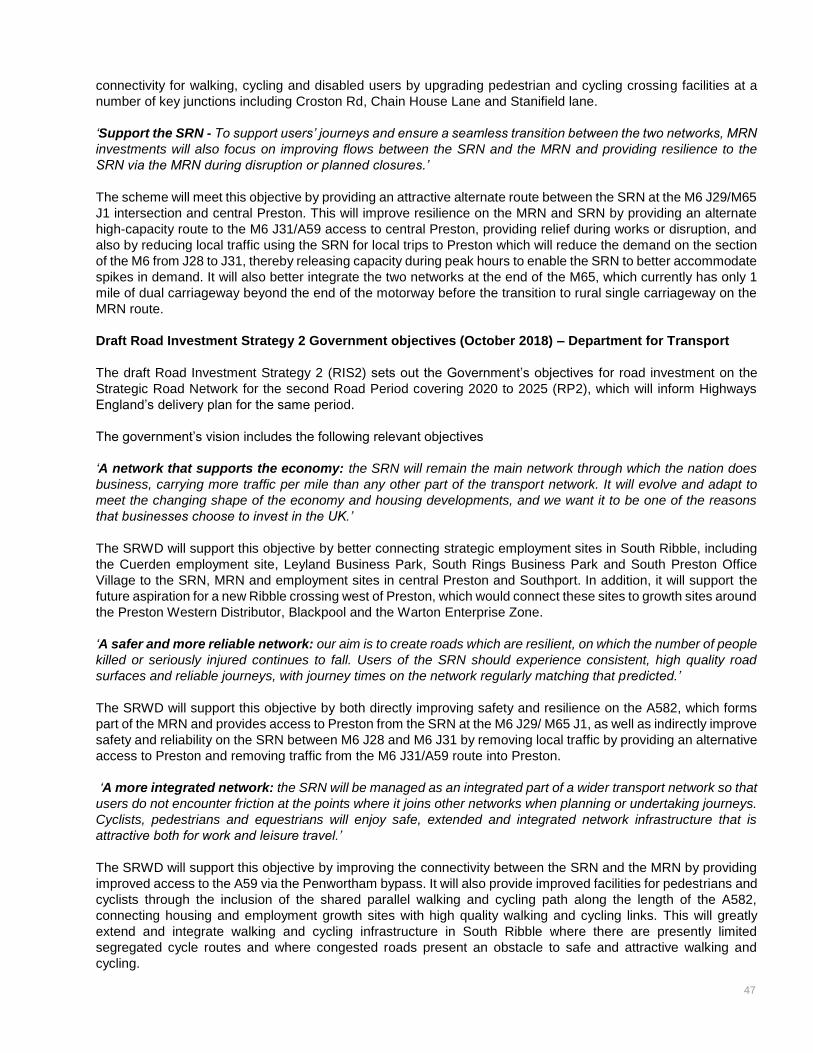
47
connectivity for walking, cycling and disabled users by upgrading pedestrian and cycling crossing facilities at a
number of key junctions including Croston Rd, Chain House Lane and Stanifield lane.
‘Support the SRN - To support users’ journeys and ensure a seamless transition between the two networks, MRN
investments will also focus on improving flows between the SRN and the MRN and providing resilience to the
SRN via the MRN during disruption or planned closures.’
The scheme will meet this objective by providing an attractive alternate route between the SRN at the M6 J29/M65
J1 intersection and central Preston. This will improve resilience on the MRN and SRN by providing an alternate
high-capacity route to the M6 J31/A59 access to central Preston, providing relief during works or disruption, and
also by reducing local traffic using the SRN for local trips to Preston which will reduce the demand on the section
of the M6 from J28 to J31, thereby releasing capacity during peak hours to enable the SRN to better accommodate
spikes in demand. It will also better integrate the two networks at the end of the M65, which currently has only 1
mile of dual carriageway beyond the end of the motorway before the transition to rural single carriageway on the
MRN route.
Draft Road Investment Strategy 2 Government objectives (October 2018) – Department for Transport
The draft Road Investment Strategy 2 (RIS2) sets out the Government’s objectives for road investment on the
Strategic Road Network for the second Road Period covering 2020 to 2025 (RP2), which will inform Highways
England’s delivery plan for the same period.
The government’s vision includes the following relevant objectives
‘A network that supports the economy: the SRN will remain the main network through which the nation does
business, carrying more traffic per mile than any other part of the transport network. It will evolve and adapt to
meet the changing shape of the economy and housing developments, and we want it to be one of the reasons
that businesses choose to invest in the UK.’
The SRWD will support this objective by better connecting strategic employment sites in South Ribble, including
the Cuerden employment site, Leyland Business Park, South Rings Business Park and South Preston Office
Village to the SRN, MRN and employment sites in central Preston and Southport. In addition, it will support the
future aspiration for a new Ribble crossing west of Preston, which would connect these sites to growth sites around
the Preston Western Distributor, Blackpool and the Warton Enterprise Zone.
‘A safer and more reliable network: our aim is to create roads which are resilient, on which the number of people
killed or seriously injured continues to fall. Users of the SRN should experience consistent, high quality road
surfaces and reliable journeys, with journey times on the network regularly matching that predicted.’
The SRWD will support this objective by both directly improving safety and resilience on the A582, which forms
part of the MRN and provides access to Preston from the SRN at the M6 J29/ M65 J1, as well as indirectly improve
safety and reliability on the SRN between M6 J28 and M6 J31 by removing local traffic by providing an alternative
access to Preston and removing traffic from the M6 J31/A59 route into Preston.
‘A more integrated network: the SRN will be managed as an integrated part of a wider transport network so that
users do not encounter friction at the points where it joins other networks when planning or undertaking journeys.
Cyclists, pedestrians and equestrians will enjoy safe, extended and integrated network infrastructure that is
attractive both for work and leisure travel.’
The SRWD will support this objective by improving the connectivity between the SRN and the MRN by providing
improved access to the A59 via the Penwortham bypass. It will also provide improved facilities for pedestrians and
cyclists through the inclusion of the shared parallel walking and cycling path along the length of the A582,
connecting housing and employment growth sites with high quality walking and cycling links. This will greatly
extend and integrate walking and cycling infrastructure in South Ribble where there are presently limited
segregated cycle routes and where congested roads present an obstacle to safe and attractive walking and
cycling.
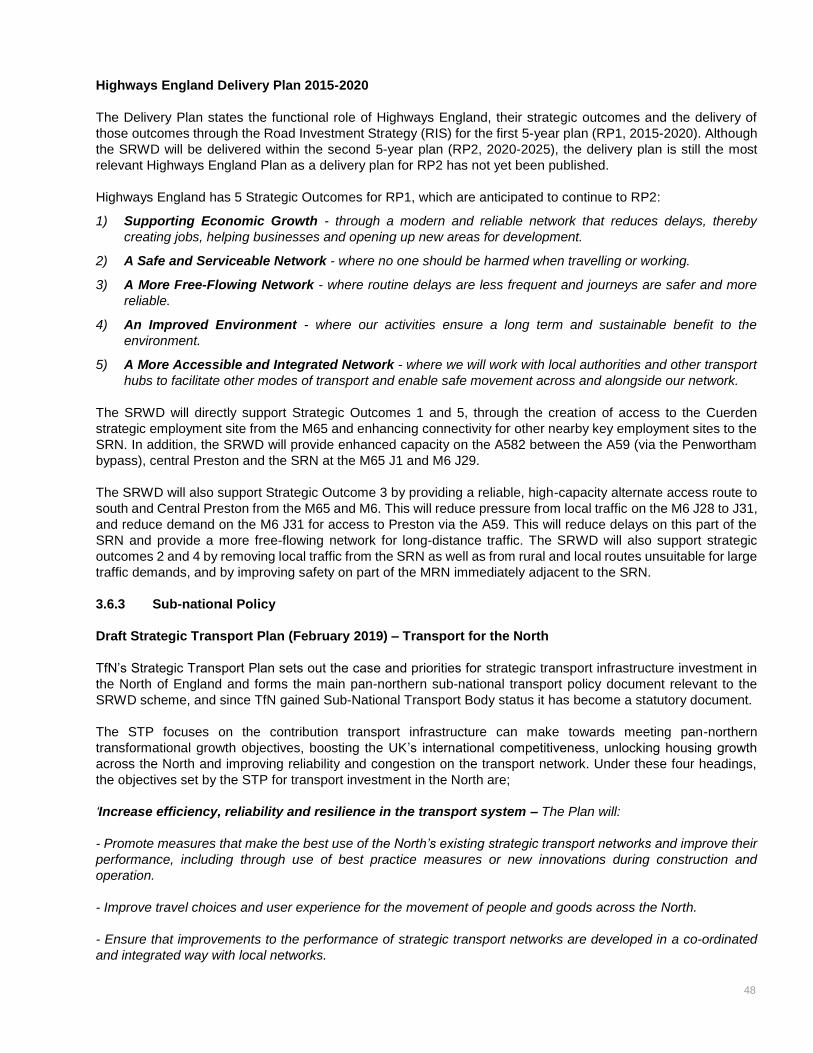
48
Highways England Delivery Plan 2015-2020
The Delivery Plan states the functional role of Highways England, their strategic outcomes and the delivery of
those outcomes through the Road Investment Strategy (RIS) for the first 5-year plan (RP1, 2015-2020). Although
the SRWD will be delivered within the second 5-year plan (RP2, 2020-2025), the delivery plan is still the most
relevant Highways England Plan as a delivery plan for RP2 has not yet been published.
Highways England has 5 Strategic Outcomes for RP1, which are anticipated to continue to RP2:
1) Supporting Economic Growth - through a modern and reliable network that reduces delays, thereby
creating jobs, helping businesses and opening up new areas for development.
2) A Safe and Serviceable Network - where no one should be harmed when travelling or working.
3) A More Free-Flowing Network - where routine delays are less frequent and journeys are safer and more
reliable.
4) An Improved Environment - where our activities ensure a long term and sustainable benefit to the
environment.
5) A More Accessible and Integrated Network - where we will work with local authorities and other transport
hubs to facilitate other modes of transport and enable safe movement across and alongside our network.
The SRWD will directly support Strategic Outcomes 1 and 5, through the creation of access to the Cuerden
strategic employment site from the M65 and enhancing connectivity for other nearby key employment sites to the
SRN. In addition, the SRWD will provide enhanced capacity on the A582 between the A59 (via the Penwortham
bypass), central Preston and the SRN at the M65 J1 and M6 J29.
The SRWD will also support Strategic Outcome 3 by providing a reliable, high-capacity alternate access route to
south and Central Preston from the M65 and M6. This will reduce pressure from local traffic on the M6 J28 to J31,
and reduce demand on the M6 J31 for access to Preston via the A59. This will reduce delays on this part of the
SRN and provide a more free-flowing network for long-distance traffic. The SRWD will also support strategic
outcomes 2 and 4 by removing local traffic from the SRN as well as from rural and local routes unsuitable for large
traffic demands, and by improving safety on part of the MRN immediately adjacent to the SRN.
3.6.3 Sub-national Policy
Draft Strategic Transport Plan (February 2019) – Transport for the North
TfN’s Strategic Transport Plan sets out the case and priorities for strategic transport infrastructure investment in
the North of England and forms the main pan-northern sub-national transport policy document relevant to the
SRWD scheme, and since TfN gained Sub-National Transport Body status it has become a statutory document.
The STP focuses on the contribution transport infrastructure can make towards meeting pan-northern
transformational growth objectives, boosting the UK’s international competitiveness, unlocking housing growth
across the North and improving reliability and congestion on the transport network. Under these four headings,
the objectives set by the STP for transport investment in the North are;
‘Increase efficiency, reliability and resilience in the transport system – The Plan will:
- Promote measures that make the best use of the North’s existing strategic transport networks and improve their
performance, including through use of best practice measures or new innovations during construction and
operation.
- Improve travel choices and user experience for the movement of people and goods across the North.
- Ensure that improvements to the performance of strategic transport networks are developed in a co-ordinated
and integrated way with local networks.
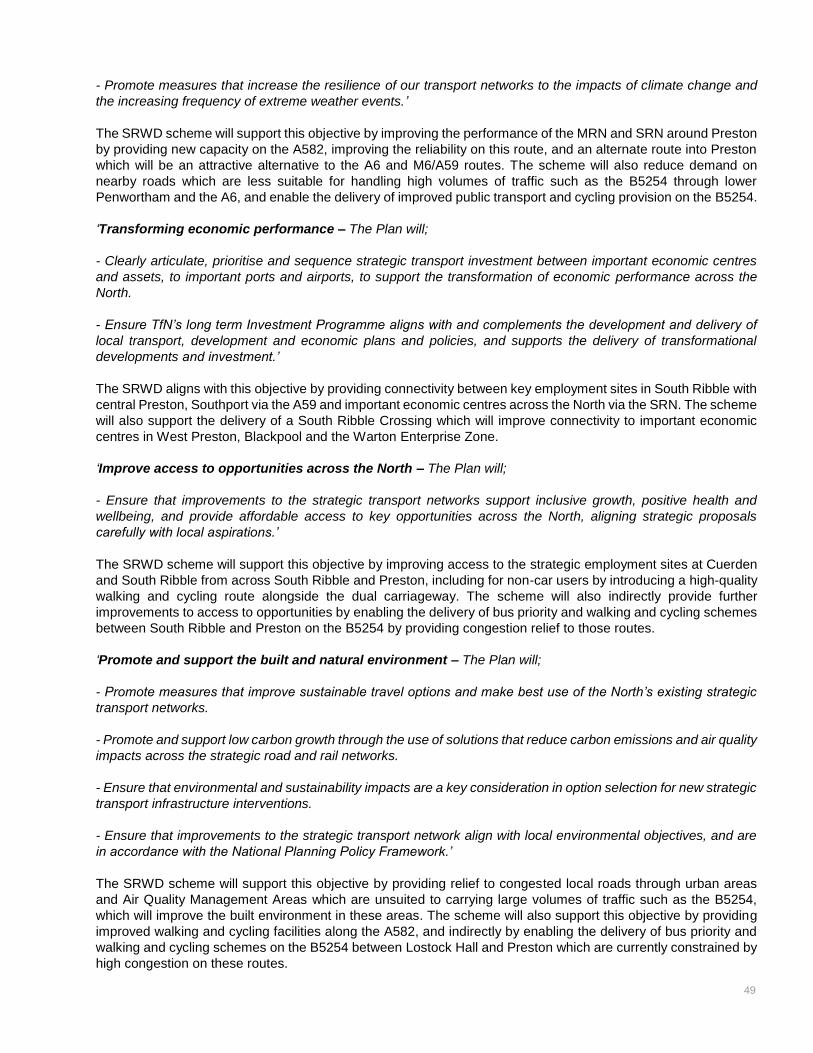
49
- Promote measures that increase the resilience of our transport networks to the impacts of climate change and
the increasing frequency of extreme weather events.’
The SRWD scheme will support this objective by improving the performance of the MRN and SRN around Preston
by providing new capacity on the A582, improving the reliability on this route, and an alternate route into Preston
which will be an attractive alternative to the A6 and M6/A59 routes. The scheme will also reduce demand on
nearby roads which are less suitable for handling high volumes of traffic such as the B5254 through lower
Penwortham and the A6, and enable the delivery of improved public transport and cycling provision on the B5254.
‘Transforming economic performance – The Plan will;
- Clearly articulate, prioritise and sequence strategic transport investment between important economic centres
and assets, to important ports and airports, to support the transformation of economic performance across the
North.
- Ensure TfN’s long term Investment Programme aligns with and complements the development and delivery of
local transport, development and economic plans and policies, and supports the delivery of transformational
developments and investment.’
The SRWD aligns with this objective by providing connectivity between key employment sites in South Ribble with
central Preston, Southport via the A59 and important economic centres across the North via the SRN. The scheme
will also support the delivery of a South Ribble Crossing which will improve connectivity to important economic
centres in West Preston, Blackpool and the Warton Enterprise Zone.
‘Improve access to opportunities across the North – The Plan will;
- Ensure that improvements to the strategic transport networks support inclusive growth, positive health and
wellbeing, and provide affordable access to key opportunities across the North, aligning strategic proposals
carefully with local aspirations.’
The SRWD scheme will support this objective by improving access to the strategic employment sites at Cuerden
and South Ribble from across South Ribble and Preston, including for non-car users by introducing a high-quality
walking and cycling route alongside the dual carriageway. The scheme will also indirectly provide further
improvements to access to opportunities by enabling the delivery of bus priority and walking and cycling schemes
between South Ribble and Preston on the B5254 by providing congestion relief to those routes.
‘Promote and support the built and natural environment – The Plan will;
- Promote measures that improve sustainable travel options and make best use of the North’s existing strategic
transport networks.
- Promote and support low carbon growth through the use of solutions that reduce carbon emissions and air quality
impacts across the strategic road and rail networks.
- Ensure that environmental and sustainability impacts are a key consideration in option selection for new strategic
transport infrastructure interventions.
- Ensure that improvements to the strategic transport network align with local environmental objectives, and are
in accordance with the National Planning Policy Framework.’
The SRWD scheme will support this objective by providing relief to congested local roads through urban areas
and Air Quality Management Areas which are unsuited to carrying large volumes of traffic such as the B5254,
which will improve the built environment in these areas. The scheme will also support this objective by providing
improved walking and cycling facilities along the A582, and indirectly by enabling the delivery of bus priority and
walking and cycling schemes on the B5254 between Lostock Hall and Preston which are currently constrained by
high congestion on these routes.

50
Central Pennines Strategic Development Corridor Strategic Programme Outline Case (February 2019) –
Transport for the North
The Strategic Programme Outline Case (SPOC) for the Central Pennines Strategic Development Corridor (SDC)
builds on the Strategic Transport Plan with specific sub-objectives and interventions for the Central Pennines
SDC, which the study area falls within, to deliver the STP’s broader objectives.
The SPOC sets out the following sub-objectives for the Central Pennines SDC which are relevant to the scheme;
‘Improving productivity across the North
Improving links between the North's ports, airports, and strategic transport interchanges and the major transport
networks for people and goods
Supporting, informing and influencing present and future land-use development in the North’
The SRWD scheme will support these sub-objectives by improving connectivity between strategic employment
sites in South Ribble and the wider transport network and employment sites. This includes improving connectivity
to ports and airports in Liverpool and Manchester via the A59 via the Penwortham bypass and via M6. The scheme
will also improve access to the rail freight sidings in the Lancashire business park from other employment sites
across South Ribble and Preston.
The scheme will also support future land-use development at key strategic employment sites in South Ribble,
especially the new Cuerden employment site and Leyland business park as well as others the scheme’s immediate
vicinity, by providing access and capacity on local roads.
In addition, the scheme will support the delivery of a new Ribble crossing West of Preston which will enhance
connectivity between employment sites in this area and the Warton Enterprise Zone and Blackpool airport.
‘Improving efficient operational performance of existing major transport networks.
Increasing the capacity and capability of the major transport networks for people and goods
Improving the reliability of the major transport networks for strategic transport movements of people and goods
Improving travel choices and user experience for the movement of people and goods across the North
Increasing the resilience of major transport networks’
The scheme will support these sub-objectives by improving the capacity and resilience of the A582, which forms
part of the Major Roads Network, and providing an attractive alternate route to access Preston from the SRN.
‘Reducing the impact of transport on local communities and environmentally sensitive areas’
The SRWD will indirectly support this objective by abstracting traffic from local minor roads which are unsuited to
high traffic flows and which currently experience congestion problems. This will reduce the impact of transport on
local communities in South Ribble, especially lower Penwortham, by removing local congestion and shifting it to
a more suitable distributor route.
‘Supporting the delivery of Transformational Infrastructure and employment projects
Supporting and enabling the delivery of strategic housing sites
Improving integration and coordination with local transport networks’
51
The SRWD will directly support these objectives by supporting the delivery of strategic employment and housing
sites at Cuerden, Pickering’s Farm, Heatherleigh and the Moss Side Test Track. It will also support the later
delivery of a new Ribble crossing west of Preston, which will be transformative and is one of the projects appraised
as part of the economic dimension of the SPOC. The scheme will also improve integration and co-ordination of
the local network by providing an improved connection across South Ribble between the M65/M6 and the A59.
3.6.4 Local Policy
Lancashire Strategic Economic Plan (March 2014)
The Lancashire Local Enterprise Partnership (LEP) produced a Strategic Economic Plan (SEP) to set out growth
ambitions across Lancashire over the next 10 years. This is to be delivered through the Lancashire Growth Deal
as an integral part of achieving the SEP’s stated growth ambitions.
The purpose of the SEP is to re-establish Lancashire as an ‘economic powerhouse’, by maximising its competitive
strengths and capabilities. The framework also directs resourcing agreed in the European Structural Investment
Fund (ESIF) strategy from the objectives of the SEP which are considered relevant to the SRWD scheme are
outlined below.
‘maximising Lancashire’s economic strength;
reclaiming Lancashire’s role as a national centre for advanced manufacturing;
maximising the economic value of Lancashire’s centres of research and innovation excellence;
refocusing the local skills system;
strengthening and refreshing ‘Boost’, the central business hub;
driving forward the Enterprise Zone and City Deal;
creating the right conditions for business and investor growth;
developing complementary local growth accelerator strategies.’
To help achieve these objectives and priorities, the Plan sets out Lancashire’s Growth Deal: an integrated
programme of interventions that the LEP believes are capable of generating the step change required. The
Lancashire LEP has secured £223.9m from the Governments Growth Fund to support economic growth in the
area and fund the priorities in their Growth Deal.
One of the key priorities of the Growth Deal is:
‘Releasing local growth potential through identifying where spatial interventions, often transport infrastructure, are
required to unlock employment, housing and economic opportunities.’
This fully aligns with the objectives of the SRWD in unlocking employment and housing development opportunities
at Cuerden and other employment sites in South Ribble, and the major housing sites at Pickering’s Farm,
Heatherleigh and the Moss Side Test Track.
Preston, South Ribble and Lancashire City Deal (September 2013)
The Preston, South Ribble and Lancashire City Deal supports the Local Enterprise Partnership (LEP) in its aim to
reclaim Lancashire's position as a national economic leader. The City Deal sets out that a more strategic approach
is required to remove existing critical infrastructure barriers, and enable sustainable housing and economic growth.
The principles and priorities from the City Deal that are considered relevant to the SRWD scheme are detailed
below.
A key element of the City Deal is The City Deal Infrastructure Delivery Programme which is worth £434m. This
programme is introduced to deliver:
52
‘the critical infrastructure required to enable the full development of significant housing and commercial
development schemes.’
This includes four major new roads, including the SRWD. It also includes the preparatory works for a New Ribble
Crossing Bridge and the necessary local community infrastructure to support enhanced public transport provision
and local sustainable measures. The City deal says of the SRWD;
‘An enhanced SRWD will double vehicle capacity between Preston City Centre and the motorway network, at the
point at which the M65, M6 and M61 connect. This enhancement will enable full development of, and access to,
Cuerden strategic employment site and the adjacent Lancashire Business Park. In addition the road will unlock
housing sites to create over 2,700 homes.’
Central Lancashire Core Strategy (July 2012)
The Central Lancashire Core Strategy was prepared jointly by Preston City Council, Chorley Council and South
Ribble Council. It was adopted in July 2012. The document helps co-ordinate development in the area covered by
the three councils. The Core Strategy policies considered relevant in this assessment are detailed below.
The Core Strategy Vision for Central Lancashire highlights the need for improvements to Lancashire’s transport
network:
‘By 2026 Central Lancashire will be recognised as a highly sought-after place to live and work in the North West…
It will play a leading role in Lancashire’s world class economy and have sustainable economic growth based on
the area’s unique assets…There will be improved transport connections within Central Lancashire and to wider
regional, national and international destinations.’
The following policies support the Vision for Central Lancashire, and are relevant to the scheme:
Policy 2, SO 2: To ensure there is sufficient and appropriate infrastructure to meet future needs, funded
where necessary by developer contributions.
Policy 3, SO 3: To reduce the need to travel, manage car use, promote more sustainable modes of
transport and improve the road network to the north and south of Preston.
Policy 3, SO 4: To enable easier journeys into and out of Preston City Centre and east/west trips across
South Ribble, improve movement around Chorley, as well as safeguard rural accessibility, especially for
mobility impaired people.
The SRWD scheme is consistent with and contributes to all these policies, as it will provide the necessary
infrastructure to support developments in South Ribble, will improve the road network south of Preston and will
improve east/west trips across South Ribble.
South Ribble Local Plan 2012-2026 (July 2015)
The South Ribble Local Plan was adopted in July 2015. The document builds on the Policy in the Central
Lancashire Core Strategy and sets out planning policies associated with key development sites. Relevant sections
of the plan to the SRWD scheme include the following;
On the provision of Infrastructure, the local plan states;
‘Part of the site allocations process has been to review the infrastructure elements of the South Ribble Local Plan 2000. The majority of infrastructure schemes that were included within the South Ribble Local Plan have been delivered. However, there is still a need to increase accessibility, ease congestion and support economic growth by carrying forward particular infrastructure schemes...’
53
Although not one of the schemes identified in this Local Plan policy which focuses on as yet unfunded
infrastructure requirements, as it has previously been identified for the delivery by the Core Strategy and CLHTM,
the SRWD will align with this policy by easing congestion in South Ribble and supporting economic growth.
On the Pickering’s Farm development site, the Local Plan states;
‘There are currently a number of issues in the area related to traffic congestion, accessibility, public realm and
local facilities…The upgrading of the A582 South Ribble Western Distributor to improve capacity on the existing
A582 between Cuerden and Penwortham Triangle will support this development.’
This reinforces the fit of the scheme with the local plan and in particular its support for unlocking the Pickering’s
Farm development.
Central Lancashire Highways and Transport Masterplan (March 2013)
The CLHTM represents Lancashire County Council’s priorities for future investment in highways and transport
schemes across central Lancashire. The Masterplan leads with an ‘Integrated Transport Vision’, setting out a
vision for highways and transport in Central Lancashire. This vision contains several principles considered relevant
to the SRWD scheme.
Based on highway modelling and both local and national forecasts of demand growth, the Integrated Transport
Vision accepts that by 2026 Lancashire’s existing highway network will not be able to cope with the planned scale
of growth on top of existing level of congestion. As such, the Masterplan introduces the “Better Roads Initiative”
to contribute towards the Integrated Transport Vision. This initiative sets out the need for the:
‘creation of new highway capacity to support new development and allow [Lancashire County Council] to solve
specific problems.’
The SRWD supports this by addressing identified problems with East/West movements in South Ribble and
supporting the new developments in the South Ribble Local Plan and Central Lancashire Core Strategy.
The Better Roads initiative focuses on four major road schemes including the SRWD, stating:
‘The schemes will enable planned new development to go ahead, achieve marked improvements for local
communities and their environment and allow significant complementary improvements to sustainable transport
provision.’
Under the Masterplan’s Better Public Transport initiative, it is reinforced that the Masterplan:
‘seeks to take full advantage of the ability to provide dedicated road space for public transport once the new
distributor roads are open by creating Park and Ride sites at key locations. It specifies that the new sites will be
opened only where we can ensure that journeys using the Park and Ride will be quicker and easier than driving
into the city centre.’
The SRWD will support this aspect of the Masterplan by reducing congestion on alternative routes into Preston
such as the B5254 and A6, which will support the delivery of priority bus measures on the B5254. This will enable
the delivery of Park and Ride sites at key locations along the A582, with fast bus routes to central Preston via
these priority corridors. The scheme will also enhance access to such P&R sites from the SRN.
3.6.5 Summary of Strategic Fit
The Red-Amber-Green (RAG) assessment below summarises the strategic fit of the SRWD with key national,
sub-national and local policy documents.
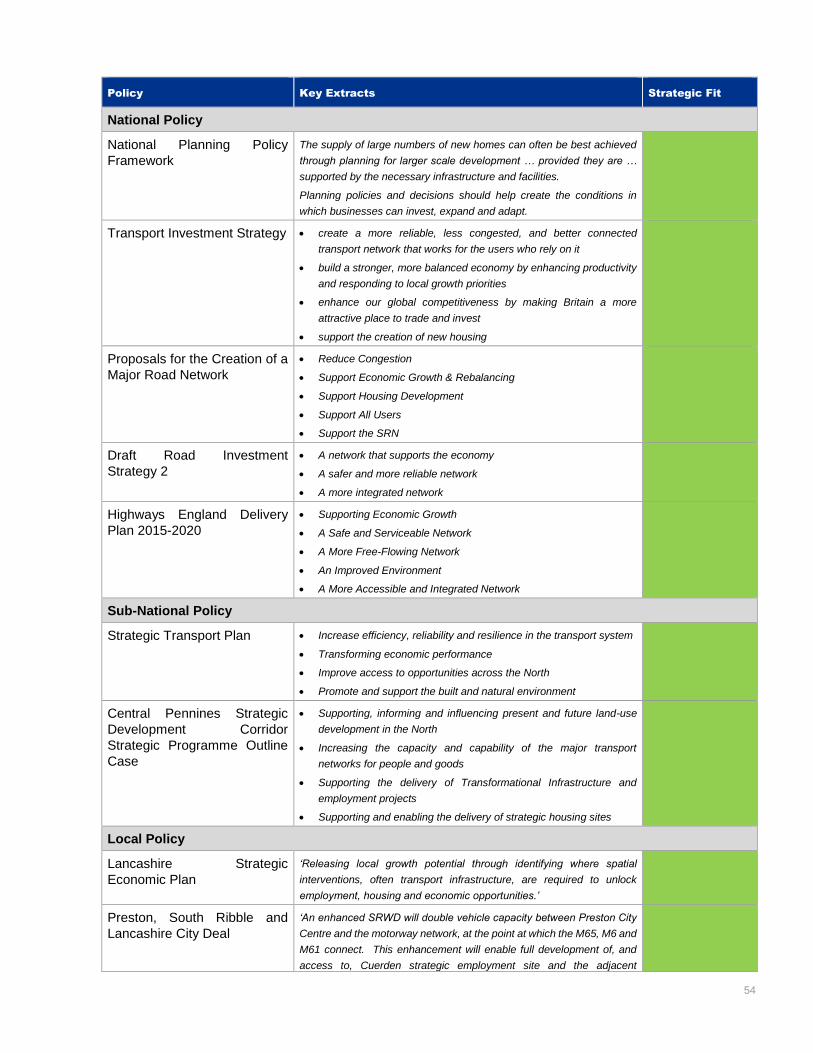
54
Policy Key Extracts Strategic Fit
National Policy
National Planning Policy
Framework
The supply of large numbers of new homes can often be best achieved
through planning for larger scale development … provided they are …
supported by the necessary infrastructure and facilities.
Planning policies and decisions should help create the conditions in
which businesses can invest, expand and adapt.
Transport Investment Strategy create a more reliable, less congested, and better connected
transport network that works for the users who rely on it
build a stronger, more balanced economy by enhancing productivity
and responding to local growth priorities
enhance our global competitiveness by making Britain a more
attractive place to trade and invest
support the creation of new housing
Proposals for the Creation of a
Major Road Network
Reduce Congestion
Support Economic Growth & Rebalancing
Support Housing Development
Support All Users
Support the SRN
Draft Road Investment
Strategy 2
A network that supports the economy
A safer and more reliable network
A more integrated network
Highways England Delivery
Plan 2015-2020
Supporting Economic Growth
A Safe and Serviceable Network
A More Free-Flowing Network
An Improved Environment
A More Accessible and Integrated Network
Sub-National Policy
Strategic Transport Plan Increase efficiency, reliability and resilience in the transport system
Transforming economic performance
Improve access to opportunities across the North
Promote and support the built and natural environment
Central Pennines Strategic
Development Corridor
Strategic Programme Outline
Case
Supporting, informing and influencing present and future land-use
development in the North
Increasing the capacity and capability of the major transport
networks for people and goods
Supporting the delivery of Transformational Infrastructure and
employment projects
Supporting and enabling the delivery of strategic housing sites
Local Policy
Lancashire Strategic
Economic Plan
‘Releasing local growth potential through identifying where spatial
interventions, often transport infrastructure, are required to unlock
employment, housing and economic opportunities.’
Preston, South Ribble and
Lancashire City Deal
‘An enhanced SRWD will double vehicle capacity between Preston City
Centre and the motorway network, at the point at which the M65, M6 and
M61 connect. This enhancement will enable full development of, and
access to, Cuerden strategic employment site and the adjacent
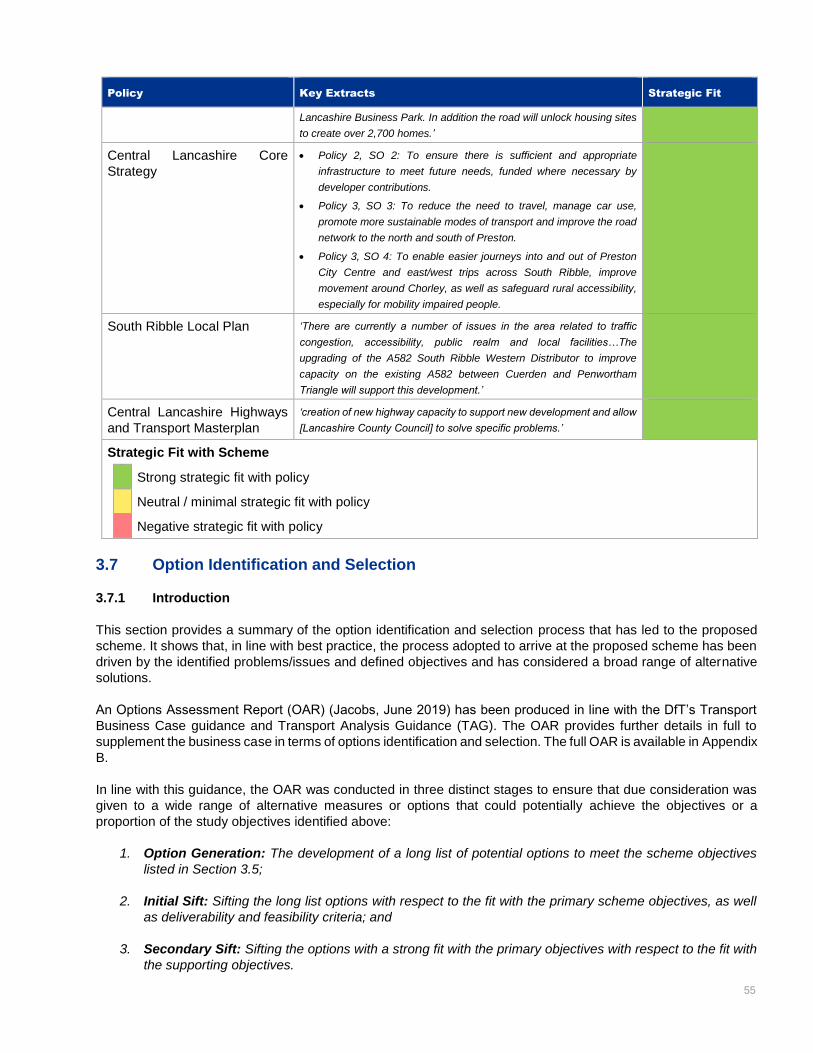
55
Policy Key Extracts Strategic Fit
Lancashire Business Park. In addition the road will unlock housing sites
to create over 2,700 homes.’
Central Lancashire Core
Strategy
Policy 2, SO 2: To ensure there is sufficient and appropriate
infrastructure to meet future needs, funded where necessary by
developer contributions.
Policy 3, SO 3: To reduce the need to travel, manage car use,
promote more sustainable modes of transport and improve the road
network to the north and south of Preston.
Policy 3, SO 4: To enable easier journeys into and out of Preston
City Centre and east/west trips across South Ribble, improve
movement around Chorley, as well as safeguard rural accessibility,
especially for mobility impaired people.
South Ribble Local Plan ‘There are currently a number of issues in the area related to traffic
congestion, accessibility, public realm and local facilities…The
upgrading of the A582 South Ribble Western Distributor to improve
capacity on the existing A582 between Cuerden and Penwortham
Triangle will support this development.’
Central Lancashire Highways
and Transport Masterplan
‘creation of new highway capacity to support new development and allow
[Lancashire County Council] to solve specific problems.’
Strategic Fit with Scheme
Strong strategic fit with policy
Neutral / minimal strategic fit with policy
Negative strategic fit with policy
3.7 Option Identification and Selection
3.7.1 Introduction
This section provides a summary of the option identification and selection process that has led to the proposed
scheme. It shows that, in line with best practice, the process adopted to arrive at the proposed scheme has been
driven by the identified problems/issues and defined objectives and has considered a broad range of alternative
solutions.
An Options Assessment Report (OAR) (Jacobs, June 2019) has been produced in line with the DfT’s Transport
Business Case guidance and Transport Analysis Guidance (TAG). The OAR provides further details in full to
supplement the business case in terms of options identification and selection. The full OAR is available in Appendix
B.
In line with this guidance, the OAR was conducted in three distinct stages to ensure that due consideration was
given to a wide range of alternative measures or options that could potentially achieve the objectives or a
proportion of the study objectives identified above:
1. Option Generation: The development of a long list of potential options to meet the scheme objectives
listed in Section 3.5;
2. Initial Sift: Sifting the long list options with respect to the fit with the primary scheme objectives, as well
as deliverability and feasibility criteria; and
3. Secondary Sift: Sifting the options with a strong fit with the primary objectives with respect to the fit with
the supporting objectives.
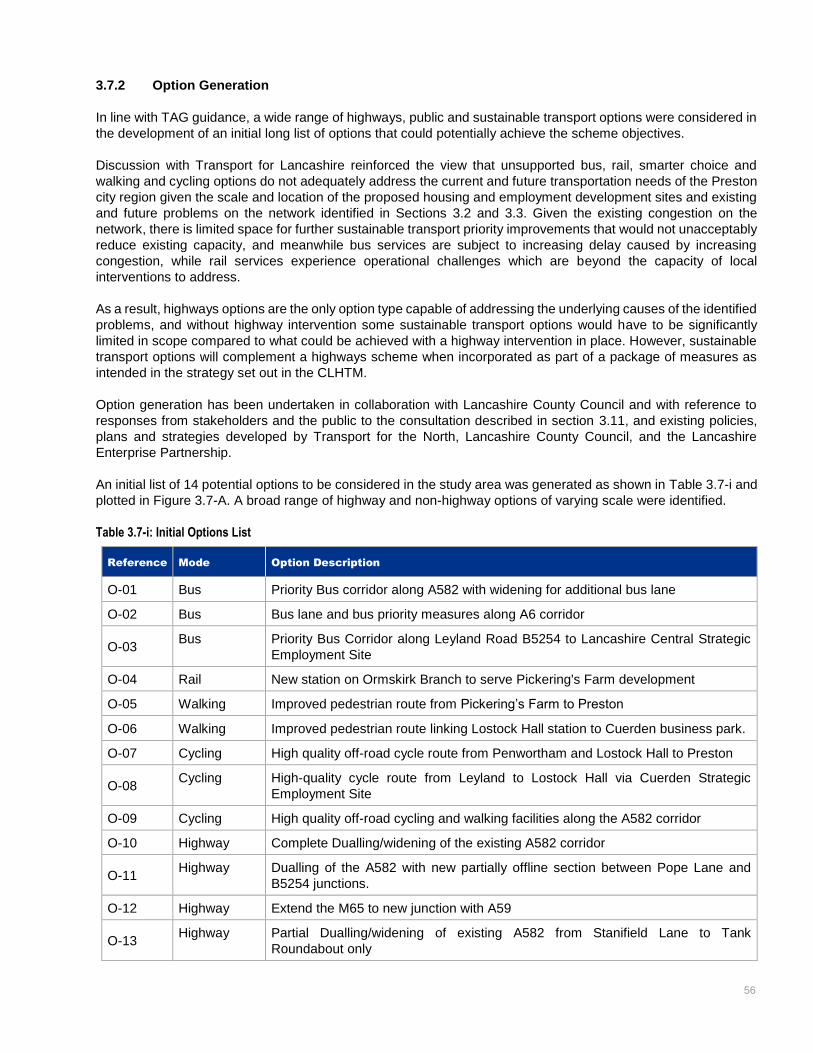
56
3.7.2 Option Generation
In line with TAG guidance, a wide range of highways, public and sustainable transport options were considered in
the development of an initial long list of options that could potentially achieve the scheme objectives.
Discussion with Transport for Lancashire reinforced the view that unsupported bus, rail, smarter choice and
walking and cycling options do not adequately address the current and future transportation needs of the Preston
city region given the scale and location of the proposed housing and employment development sites and existing
and future problems on the network identified in Sections 3.2 and 3.3. Given the existing congestion on the
network, there is limited space for further sustainable transport priority improvements that would not unacceptably
reduce existing capacity, and meanwhile bus services are subject to increasing delay caused by increasing
congestion, while rail services experience operational challenges which are beyond the capacity of local
interventions to address.
As a result, highways options are the only option type capable of addressing the underlying causes of the identified
problems, and without highway intervention some sustainable transport options would have to be significantly
limited in scope compared to what could be achieved with a highway intervention in place. However, sustainable
transport options will complement a highways scheme when incorporated as part of a package of measures as
intended in the strategy set out in the CLHTM.
Option generation has been undertaken in collaboration with Lancashire County Council and with reference to
responses from stakeholders and the public to the consultation described in section 3.11, and existing policies,
plans and strategies developed by Transport for the North, Lancashire County Council, and the Lancashire
Enterprise Partnership.
An initial list of 14 potential options to be considered in the study area was generated as shown in Table 3.7-i and
plotted in Figure 3.7-A. A broad range of highway and non-highway options of varying scale were identified.
Table 3.7-i: Initial Options List
Reference Mode Option Description
O-01 Bus Priority Bus corridor along A582 with widening for additional bus lane
O-02 Bus Bus lane and bus priority measures along A6 corridor
O-03 Bus Priority Bus Corridor along Leyland Road B5254 to Lancashire Central Strategic
Employment Site
O-04 Rail New station on Ormskirk Branch to serve Pickering's Farm development
O-05 Walking Improved pedestrian route from Pickering’s Farm to Preston
O-06 Walking Improved pedestrian route linking Lostock Hall station to Cuerden business park.
O-07 Cycling High quality off-road cycle route from Penwortham and Lostock Hall to Preston
O-08 Cycling High-quality cycle route from Leyland to Lostock Hall via Cuerden Strategic
Employment Site
O-09 Cycling High quality off-road cycling and walking facilities along the A582 corridor
O-10 Highway Complete Dualling/widening of the existing A582 corridor
O-11 Highway Dualling of the A582 with new partially offline section between Pope Lane and
B5254 junctions.
O-12 Highway Extend the M65 to new junction with A59
O-13 Highway Partial Dualling/widening of existing A582 from Stanifield Lane to Tank
Roundabout only
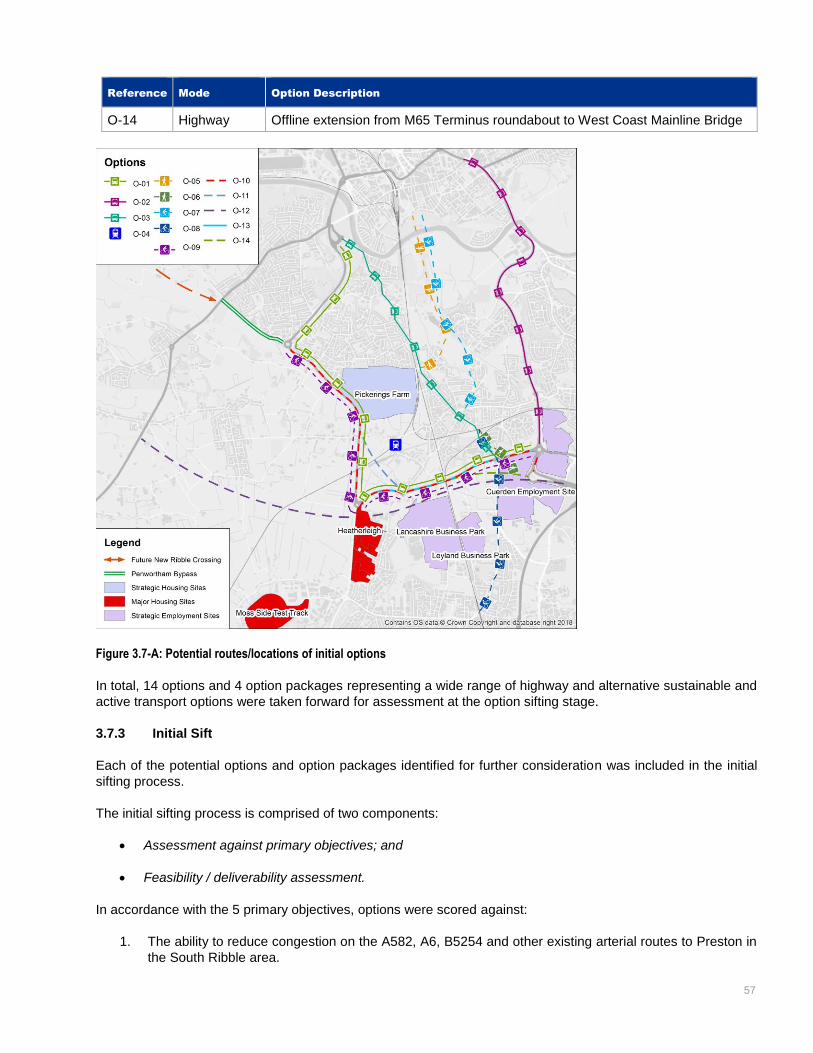
57
Reference Mode Option Description
O-14 Highway Offline extension from M65 Terminus roundabout to West Coast Mainline Bridge
Figure 3.7-A: Potential routes/locations of initial options
In total, 14 options and 4 option packages representing a wide range of highway and alternative sustainable and
active transport options were taken forward for assessment at the option sifting stage.
3.7.3 Initial Sift
Each of the potential options and option packages identified for further consideration was included in the initial
sifting process.
The initial sifting process is comprised of two components:
Assessment against primary objectives; and
Feasibility / deliverability assessment.
In accordance with the 5 primary objectives, options were scored against:
1. The ability to reduce congestion on the A582, A6, B5254 and other existing arterial routes to Preston in
the South Ribble area.
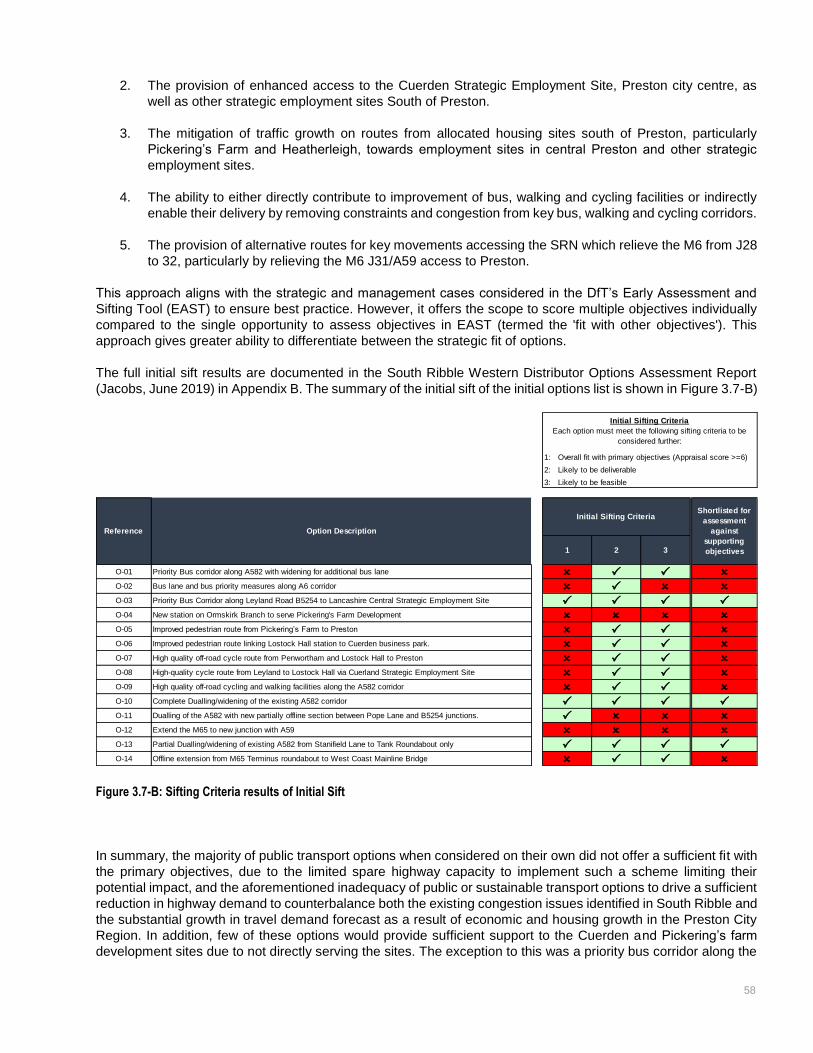
58
2. The provision of enhanced access to the Cuerden Strategic Employment Site, Preston city centre, as
well as other strategic employment sites South of Preston.
3. The mitigation of traffic growth on routes from allocated housing sites south of Preston, particularly
Pickering’s Farm and Heatherleigh, towards employment sites in central Preston and other strategic
employment sites.
4. The ability to either directly contribute to improvement of bus, walking and cycling facilities or indirectly
enable their delivery by removing constraints and congestion from key bus, walking and cycling corridors.
5. The provision of alternative routes for key movements accessing the SRN which relieve the M6 from J28
to 32, particularly by relieving the M6 J31/A59 access to Preston.
This approach aligns with the strategic and management cases considered in the DfT’s Early Assessment and
Sifting Tool (EAST) to ensure best practice. However, it offers the scope to score multiple objectives individually
compared to the single opportunity to assess objectives in EAST (termed the 'fit with other objectives'). This
approach gives greater ability to differentiate between the strategic fit of options.
The full initial sift results are documented in the South Ribble Western Distributor Options Assessment Report
(Jacobs, June 2019) in Appendix B. The summary of the initial sift of the initial options list is shown in Figure 3.7-B)
Figure 3.7-B: Sifting Criteria results of Initial Sift
In summary, the majority of public transport options when considered on their own did not offer a sufficient fit with
the primary objectives, due to the limited spare highway capacity to implement such a scheme limiting their
potential impact, and the aforementioned inadequacy of public or sustainable transport options to drive a sufficient
reduction in highway demand to counterbalance both the existing congestion issues identified in South Ribble and
the substantial growth in travel demand forecast as a result of economic and housing growth in the Preston City
Region. In addition, few of these options would provide sufficient support to the Cuerden and Pickering’s farm
development sites due to not directly serving the sites. The exception to this was a priority bus corridor along the
1: Overall fit with primary objectives (Appraisal score >=6)
2: Likely to be deliverable
3: Likely to be feasible
1 2 3
O-01 O P P O
O-02 O P O O
O-03 P P P P
O-04 O O O O
O-05 O P P O
O-06 O P P O
O-07 O P P O
O-08 O P P O
O-09 O P P O
O-10 P P P P
O-11 P O O O
O-12 O O O O
O-13 P P P P
O-14 O P P OOffline extension from M65 Terminus roundabout to West Coast Mainline Bridge
High-quality cycle route from Leyland to Lostock Hall via Cuerland Strategic Employment Site
High quality off-road cycling and walking facilities along the A582 corridor
Complete Dualling/widening of the existing A582 corridor
Dualling of the A582 with new partially offline section between Pope Lane and B5254 junctions.
Extend the M65 to new junction with A59
Partial Dualling/widening of existing A582 from Stanifield Lane to Tank Roundabout only
High quality off-road cycle route from Penwortham and Lostock Hall to Preston
Shortlisted for
assessment
against
supporting
objectives
Bus lane and bus priority measures along A6 corridor
Priority Bus Corridor along Leyland Road B5254 to Lancashire Central Strategic Employment Site
New station on Ormskirk Branch to serve Pickering's Farm Development
Improved pedestrian route from Pickering’s Farm to Preston
Improved pedestrian route linking Lostock Hall station to Cuerden business park.
Priority Bus corridor along A582 with widening for additional bus lane
Reference Option Description
Initial Sifting Criteria
Initial Sifting Criteria
Each option must meet the following sifting criteria to be
considered further:

59
B5254, similar to the proposal contained within Preston’s shortlisted submission to the Transforming Cities Fund,
which would serve both of these sites directly and as a result scored sufficiently high to pass the initial sift.
Of the highway options considered, off-line options were generally found to be unfeasible and undeliverable due
to the intensive residential and industrial land use in the study area rendering possible alignments either
unachievable within the land constraints, unacceptable due to requiring demolition of significant residential or
business sites, or both. Only a very short off-line extension from the M65 Terminus Roundabout to the West Coast
Mainline Bridge was considered deliverable, however this option did not provide sufficient benefit against the study
objectives.
The on-line highway options, completely dualling of the A582 from Stanifield Lane to Broad Oak Roundabout, and
partial dualling only from Stanifield Lane to Tank Roundabout, both offered sufficient benefit against the study
objectives and were considered deliverable and feasible, and so passed the initial sift.
Following the initial sift, three option packages were subsequently generated, one for each of the options which
had passed the initial sift. These option packages grouped the options passing the initial sift with options which
did not pass on their own where they appeared to offer an improved fit with the scheme objectives when taken
together as a package. This process is explained in more detail in the Option Assessment Report. The three
Option Packages, as well as a “Do Nothing” approach, are shown in Table 3.7-ii.
Table 3.7-ii: Option Packages and their constituent options
Reference Option Description Constituent Options
OP1 Business as Usual - complete committed schemes and limit further
improvements to small schemes and maintenance
None
OP2 Improving What We Have - programme of sustainable transport
measures, no additional highway capacity
O-03, O-07, and O-08
OP3 Improve and Extend - Deliver dualling and widening of the entire A582
alongside a parallel off-road cycling and walking route
O-09 and O-10
OP4 Partial Improvement - Deliver dualling and widening of the A582 between
Stanifield Lane and the A582 alongside a parallel off-road cycling and
walking route on the same section
O-09 and O-13
Following the initial sift, the option packages were taken forwards to the secondary sift stage.
3.7.4 Secondary Sift
Each of the option packages was re-evaluated in their totality using the same initial sift against the primary
objectives and deliverability and feasibility criteria, shown in Figure 3.7-C.
Deliverable in theory Feasible in theory
Deliverable but with challenges Feasible but with challenges
Very difficult to deliver Significant challenges
1 2 3 4 5
To
tal
OP1 Do Minimum None 0 0 0 0 0 0 Deliverable in theory Feasible in theory
OP2 Improving What We Have O-03, O-07, O-08 1 2 2 2 0 7 Deliverable in theory Feasible in theory
OP3 Improve and Extend O-09, O-10 2 2 2 2 1 9 Deliverable in theory Feasible in theory
OP4 Partial Improvement O-09, O-13 2 2 1 2 1 8 Deliverable in theory Feasible in theory
Feasibility
Deliverability
(e.g. political, planning, timescale
or third party issues)
Feasibility
(e.g. physical constraint, land
availability and design standards)
Reference Option Package Constituent Options
Primary Objectives
Deliverability

60
Figure 3.7-C: Initial Sift results for option packages
Subsequently, the option packages were scored according the expected impact on the supporting secondary
objectives, shown in Figure 3.7-D, and the combined fit against all primary and secondary objectives was
calculated.
Figure 3.7-D: Secondary Sift results for option packages
A summary of the expected impacts and score (out of 20) is given for each option as shown in Figure 3.7-D.
Option Package 2 – Improving What We Have (Score: 11)
The public transport only package scored lowest of the three packages. The combined bus and walking and
cycling options would all directly serve both Pickering’s Farm and Cuerden, and therefore support the unlocking
of both these sites, as well as having positive impacts for non-car users and environmental measures. However,
they are considered unlikely to have a significant impact on overall congestion levels given the relatively low mode
share of these modes in the Preston City Region, and would not be able to support any further development
beyond the current local plan period, or support access to a new Ribble Crossing. This option will not be
progressed further through this appraisal, but does represent a beneficial approach which could be pursued in
conjunction with a highways solution and would be complimentary to it.
Option Package 4 – Improve and Extend (Score: 16)
The full dualling of the A582 delivered alongside a parallel cycle route scores the highest of the three packages
and is selected as the preferred option. In addition to relieving congestion along the entire route and providing
direct support to both Pickering’s and Cuerden through additional highway capacity adjacent to the sites, the
inclusion of a cycle route would improve provision for non-car users. Additionally, this option would provide the
best support for further development and access to a new Ribble Crossing. As the highest-scoring option it will be
progressed for further appraisal.
Option Package 3 – Partial Improvement (Score: 13)
Partial dualling of the A582 alongside a parallel cycle route, only between Stanifield Lane and Tank Roundabout,
scores the second highest of the option packages. This package is considered to represent the next best option
and a low-cost alternative. This option would still reduce congestion, support Cuerden and improve provision for
non-car uses through a high quality off-road cycling and walking route. This option would support delivery of major
housing sites at Heatherleigh and Moss Side Test Track and could enable future sites to be delivered south of the
2 Large beneficial impact
1 Beneficial impact
0 Neutral / marginal impact
-1 Adverse impact
-2 Large adverse impact
To
tal
1 2 3 4 5
To
tal
OP2 Improving What We Have O-03, O-07, O-08 7 1 1 2 0 0 4 11
OP3 Improve and Extend O-09, O-10 9 1 1 1 2 2 7 16
OP4 Partial Improvement O-09, O-13 8 1 1 1 2 0 5 13
Overall
ScoreOption Package Constituent Options
Supporting Objectives
Reference
Primary
Objectives
Qualitative assessment against
identified objectives
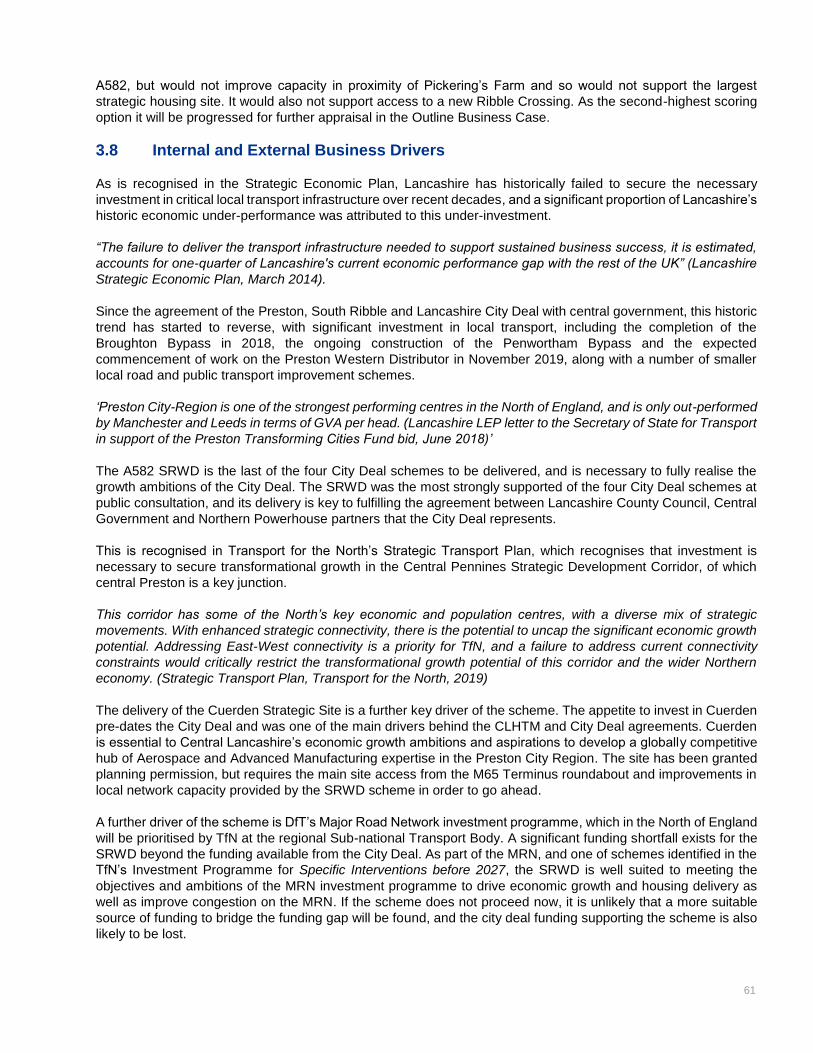
61
A582, but would not improve capacity in proximity of Pickering’s Farm and so would not support the largest
strategic housing site. It would also not support access to a new Ribble Crossing. As the second-highest scoring
option it will be progressed for further appraisal in the Outline Business Case.
3.8 Internal and External Business Drivers
As is recognised in the Strategic Economic Plan, Lancashire has historically failed to secure the necessary
investment in critical local transport infrastructure over recent decades, and a significant proportion of Lancashire’s
historic economic under-performance was attributed to this under-investment.
“The failure to deliver the transport infrastructure needed to support sustained business success, it is estimated,
accounts for one-quarter of Lancashire's current economic performance gap with the rest of the UK” (Lancashire
Strategic Economic Plan, March 2014).
Since the agreement of the Preston, South Ribble and Lancashire City Deal with central government, this historic
trend has started to reverse, with significant investment in local transport, including the completion of the
Broughton Bypass in 2018, the ongoing construction of the Penwortham Bypass and the expected
commencement of work on the Preston Western Distributor in November 2019, along with a number of smaller
local road and public transport improvement schemes.
‘Preston City-Region is one of the strongest performing centres in the North of England, and is only out-performed
by Manchester and Leeds in terms of GVA per head. (Lancashire LEP letter to the Secretary of State for Transport
in support of the Preston Transforming Cities Fund bid, June 2018)’
The A582 SRWD is the last of the four City Deal schemes to be delivered, and is necessary to fully realise the
growth ambitions of the City Deal. The SRWD was the most strongly supported of the four City Deal schemes at
public consultation, and its delivery is key to fulfilling the agreement between Lancashire County Council, Central
Government and Northern Powerhouse partners that the City Deal represents.
This is recognised in Transport for the North’s Strategic Transport Plan, which recognises that investment is
necessary to secure transformational growth in the Central Pennines Strategic Development Corridor, of which
central Preston is a key junction.
This corridor has some of the North’s key economic and population centres, with a diverse mix of strategic
movements. With enhanced strategic connectivity, there is the potential to uncap the significant economic growth
potential. Addressing East-West connectivity is a priority for TfN, and a failure to address current connectivity
constraints would critically restrict the transformational growth potential of this corridor and the wider Northern
economy. (Strategic Transport Plan, Transport for the North, 2019)
The delivery of the Cuerden Strategic Site is a further key driver of the scheme. The appetite to invest in Cuerden
pre-dates the City Deal and was one of the main drivers behind the CLHTM and City Deal agreements. Cuerden
is essential to Central Lancashire’s economic growth ambitions and aspirations to develop a globally competitive
hub of Aerospace and Advanced Manufacturing expertise in the Preston City Region. The site has been granted
planning permission, but requires the main site access from the M65 Terminus roundabout and improvements in
local network capacity provided by the SRWD scheme in order to go ahead.
A further driver of the scheme is DfT’s Major Road Network investment programme, which in the North of England
will be prioritised by TfN at the regional Sub-national Transport Body. A significant funding shortfall exists for the
SRWD beyond the funding available from the City Deal. As part of the MRN, and one of schemes identified in the
TfN’s Investment Programme for Specific Interventions before 2027, the SRWD is well suited to meeting the
objectives and ambitions of the MRN investment programme to drive economic growth and housing delivery as
well as improve congestion on the MRN. If the scheme does not proceed now, it is unlikely that a more suitable
source of funding to bridge the funding gap will be found, and the city deal funding supporting the scheme is also
likely to be lost.
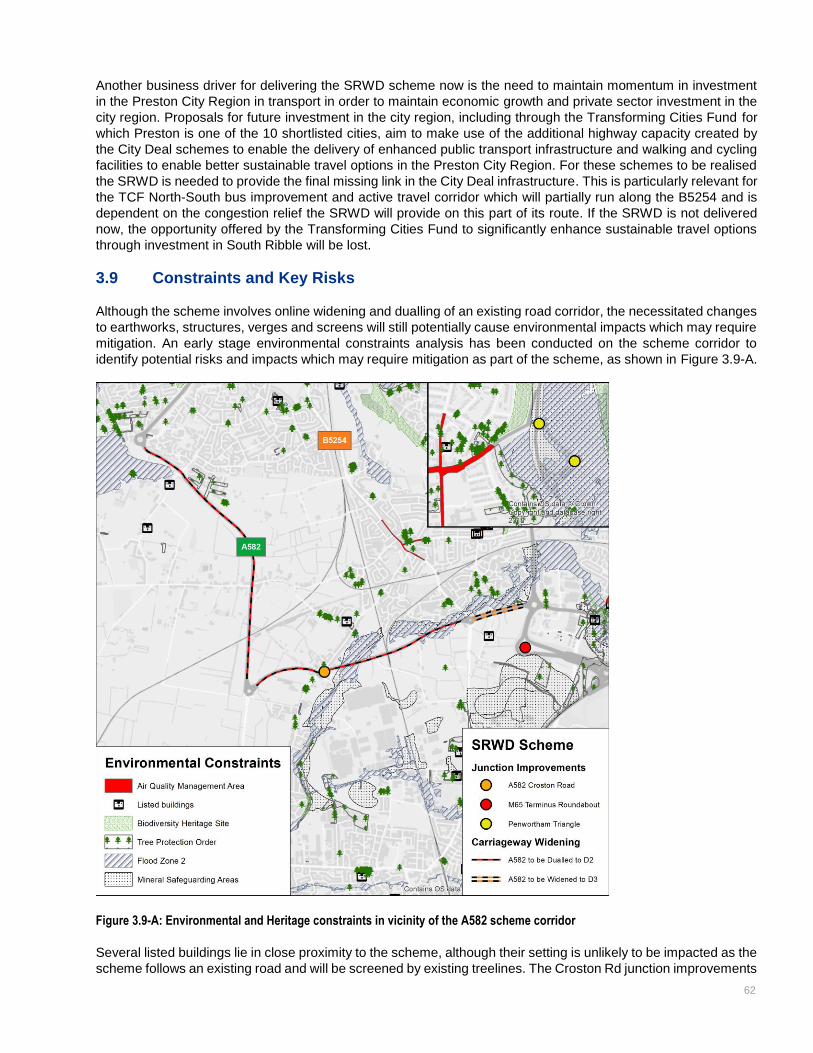
62
Another business driver for delivering the SRWD scheme now is the need to maintain momentum in investment
in the Preston City Region in transport in order to maintain economic growth and private sector investment in the
city region. Proposals for future investment in the city region, including through the Transforming Cities Fund for
which Preston is one of the 10 shortlisted cities, aim to make use of the additional highway capacity created by
the City Deal schemes to enable the delivery of enhanced public transport infrastructure and walking and cycling
facilities to enable better sustainable travel options in the Preston City Region. For these schemes to be realised
the SRWD is needed to provide the final missing link in the City Deal infrastructure. This is particularly relevant for
the TCF North-South bus improvement and active travel corridor which will partially run along the B5254 and is
dependent on the congestion relief the SRWD will provide on this part of its route. If the SRWD is not delivered
now, the opportunity offered by the Transforming Cities Fund to significantly enhance sustainable travel options
through investment in South Ribble will be lost.
3.9 Constraints and Key Risks
Although the scheme involves online widening and dualling of an existing road corridor, the necessitated changes
to earthworks, structures, verges and screens will still potentially cause environmental impacts which may require
mitigation. An early stage environmental constraints analysis has been conducted on the scheme corridor to
identify potential risks and impacts which may require mitigation as part of the scheme, as shown in Figure 3.9-A.
Figure 3.9-A: Environmental and Heritage constraints in vicinity of the A582 scheme corridor
Several listed buildings lie in close proximity to the scheme, although their setting is unlikely to be impacted as the
scheme follows an existing road and will be screened by existing treelines. The Croston Rd junction improvements
63
are close to a number of protected trees, and the design and construction at this junction will have to ensure they
are protected. The stretch from Croston Rd to Stanifield lane passes over and subsequently alongside the River
Lostock, where a new bridge will be required, and passes through the Flood Zone of the river. As such, this stretch
will require a sustainable drainage solution to prevent increased runoff impacting on the water environment of the
river. The improvements to Penwortham triangle lie within the Ribble’s flood plain and are in close proximity to
designated Biodiversity Heritage Sites which will need to be protected from impacts from construction.
None of these constraints are likely to significantly impact on the design and construction of the scheme and it is
expected that all impacts can be reasonably mitigated within the scheme design.
A risk log has been created for the scheme (Appendix L) and the key risks to delivery identified. The top three
risks are;
Revised Cost Estimates result in increased scheme costs and a consequent funding gap;
Widening of existing A582 carriageway in green belt leads to planning refusal
Delays result in failure to complete all works by March 2024 (end of the 10-year City Deal period)
3.10 Synergy with other Schemes
One of the key strategic benefits of the SRWD scheme is the synergy and compatibility with other recent,
committed and proposed transport interventions aimed to support the continued effective operation of Central
Lancashire’s strategic and local highway and public transport networks. Taken together, these interventions will
further support the overarching economic and policy objectives of driving economic growth in key sectors,
increasing productivity and global competitiveness and delivering housing than when considered separately, and
provide a platform for transformative growth and change in the Preston city region. Further, the scheme enables
future interventions that without it could not be delivered or would have to be reduced in scope and provide
significantly reduced benefits.
The SRWD is the last of four major new road schemes to the North, South and West of Preston contained in the
City Deal aimed at opening up new opportunities to create housing and employment. The other three schemes
are all at various stages of deliver, with the Broughton Bypass having opened in 2019, the Penwortham Bypass
under construction and the Preston Western Distributor undergoing final business case approval and due to begin
construction in November 2019. Each is integral to the long-term vision for Central Lancashire, and delivery of all
four schemes is necessary to ensure the planned new development can go ahead and allow significant
complimentary improvements to sustainable transport provision.
In addition to these schemes, the SRWD has strong synergy with other future transport interventions in and
surrounding the study area. Figure 3.10-A shows transport interventions in the study area with synergy with the
SRWD scheme, and these are detailed below.
The SRWD will join immediately with the Penwortham bypass and Golden Way improvements, and will provide
improved junction capacity at Penwortham triangle. Together, the schemes will create a high-quality, high-
capacity, dual carriageway link from the A59 to the M65/M6, which is currently only single carriageway. This will
significantly increase the capacity of the route and shorten it, as well as shortening it and removing this traffic from
central Penwortham and Preston.
The scheme will be delivered concurrently with the Flensburg Way improvements between Tank Roundabout and
Moss Side, which are being delivered through a combination of private sector contributions and local funding, and
together these schemes will connect the Moss Side Test Track housing side and Moss Side Industrial Estate to
Central Preston and the SRN with high quality dual carriageway. Additionally, the scheme will unlock delivery of
Pickering’s Farm development, which will enable the private-sector led completion of the Cross-Borough Link
Road joining the A582 Penwortham Way, B5254 Leyland Rd and A6 London Rd at Walton-le-Dale.
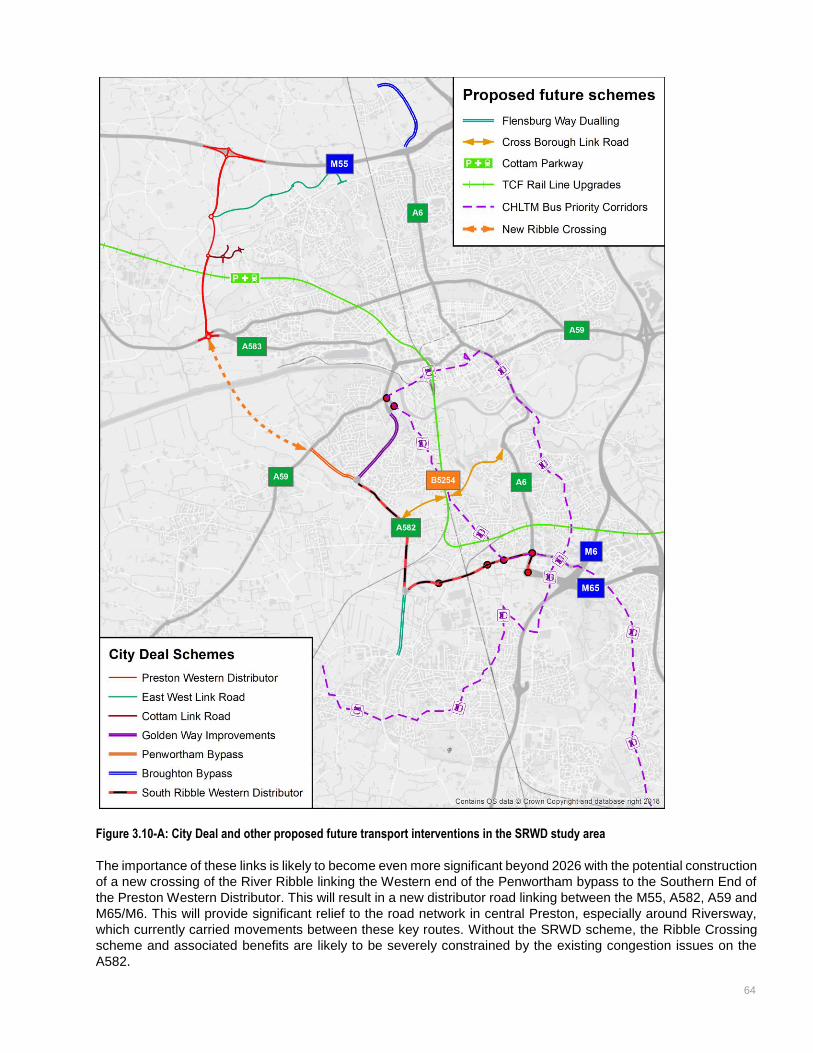
64
Figure 3.10-A: City Deal and other proposed future transport interventions in the SRWD study area
The importance of these links is likely to become even more significant beyond 2026 with the potential construction
of a new crossing of the River Ribble linking the Western end of the Penwortham bypass to the Southern End of
the Preston Western Distributor. This will result in a new distributor road linking between the M55, A582, A59 and
M65/M6. This will provide significant relief to the road network in central Preston, especially around Riversway,
which currently carried movements between these key routes. Without the SRWD scheme, the Ribble Crossing
scheme and associated benefits are likely to be severely constrained by the existing congestion issues on the
A582.
65
Preston is one of 10 city regions shortlisted by the Department for Transport for public transport investment through
the Transforming Cities Fund. The schemes proposed for delivery through the TCF include a North-South bus
priority and cycling corridor between Leyland and Preston partially running along the B5254, which will benefit
greatly from the reduction in traffic on this route provided by the scheme.
There are ambitions to provide greater cycling and walking infrastructure in South Ribble as well. In particular,
there is an ambition to provide high quality off-road or quiet route cycle facilities between Lostock Hall/Bamber
Bridge and central Preston, as well as between Leyland and Lostock Hall. The segregated crossing points
provided by the scheme at key junctions along the A582 will join the two routes, and segregated cycling and
walking route along the A582 corridor provided by the scheme will show strong synergy with these ambitions, as
it will link a number of residential and employment areas into this network, providing an integrated and safe cycle
network across South Ribble.
3.11 Stakeholders and Consultation
Given the importance of the SRWD and its impact on the MRN and SRN, as well as its local and regional economic
importance, there are a large number of internal and external stakeholders with an interest in the project. Key
stakeholders include;
Department for Transport
Highways England – the scheme will impact on M6 J29/M65 J1
Lancashire County Council – the scheme promoter
Preston City Council
South Ribble Council
The Lancashire Enterprise Partnership
Network Rail
As part of the adoption and protection of the route for the scheme, under the Preston City Deal Infrastructure
Delivery Plan, a public consultation process was undertaken with key stakeholder groups and members of the
public between 2nd February to 15th March 2015.
In addition to engaging with stakeholder groups, the council organised consultation events in the local areas that
allowed members of the public to comment on the proposals. These events were held at Farington Moss, Leyland,
Lostock Hall and Penwortham on 2nd, 5th, 9th and 11th February 2015 and were attended by 186 people. Further
to these events, over 4000 letters were sent to residents and businesses in the area around the scheme.
A total of 407 responses were received to the consultation. Respondents included local residents, parish councils,
developers and other statutory service providers. The organisations which provided a response to the consultation
were;
BDP Print Services LTD
Clearview Home Improvements LTD
Cuerden Properties
World Leisure UK LTD
Lostock View Neighbourhood Watch
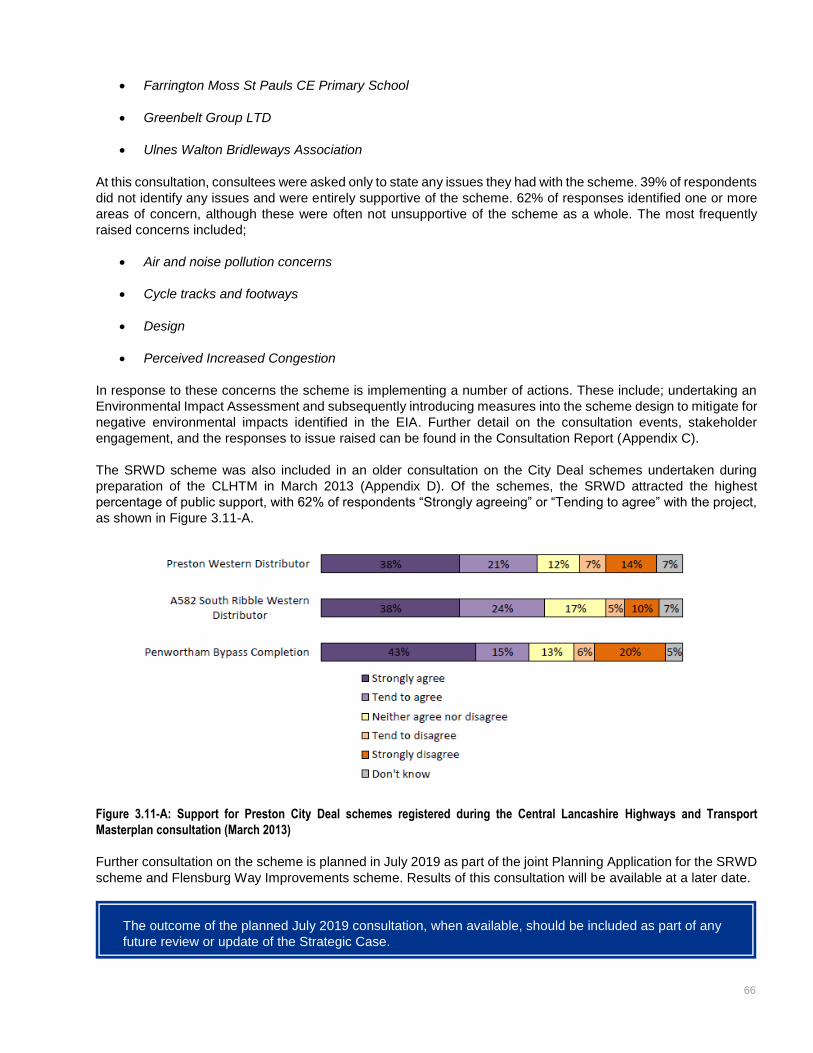
66
Farrington Moss St Pauls CE Primary School
Greenbelt Group LTD
Ulnes Walton Bridleways Association
At this consultation, consultees were asked only to state any issues they had with the scheme. 39% of respondents
did not identify any issues and were entirely supportive of the scheme. 62% of responses identified one or more
areas of concern, although these were often not unsupportive of the scheme as a whole. The most frequently
raised concerns included;
Air and noise pollution concerns
Cycle tracks and footways
Design
Perceived Increased Congestion
In response to these concerns the scheme is implementing a number of actions. These include; undertaking an
Environmental Impact Assessment and subsequently introducing measures into the scheme design to mitigate for
negative environmental impacts identified in the EIA. Further detail on the consultation events, stakeholder
engagement, and the responses to issue raised can be found in the Consultation Report (Appendix C).
The SRWD scheme was also included in an older consultation on the City Deal schemes undertaken during
preparation of the CLHTM in March 2013 (Appendix D). Of the schemes, the SRWD attracted the highest
percentage of public support, with 62% of respondents “Strongly agreeing” or “Tending to agree” with the project,
as shown in Figure 3.11-A.
Figure 3.11-A: Support for Preston City Deal schemes registered during the Central Lancashire Highways and Transport
Masterplan consultation (March 2013)
Further consultation on the scheme is planned in July 2019 as part of the joint Planning Application for the SRWD
scheme and Flensburg Way Improvements scheme. Results of this consultation will be available at a later date.
The outcome of the planned July 2019 consultation, when available, should be included as part of any
future review or update of the Strategic Case.
67
3.12 Summary and Conclusion
The A582 is part of the Major Road Network and is one of three main arterial ‘A road’ routes connecting settlements
in South Ribble, the SRN and the Preston urban area, the main economic and urban centre of the Central
Lancashire region.
The A582 South Ribble Western Distributor (SWRD) is one of the schemes identified in the Transport for the
North’s (TfN) Investment Programme and is the last of four major highway schemes in the Preston, South Ribble
and Lancashire City Deal and CLHTM, as necessary to deliver transformative, nationally significant levels of
housing and employment growth in the City Region.
Delivery of the SRWD scheme is essential to resolving current and foreseeable problems and issues that could
otherwise result in significant congestion along the transport network and missed opportunities to develop the
local economy.
Existing evidence, drawn from a variety of sources, demonstrates that there are wide-ranging and interlinked
transport related problems in the area, including:
Widespread issues with congestion and delay on arterial routes to/from Preston, particularly the A582 and
B5254
Poor journey time reliability on both the road and public transport networks in peak periods
Associated issues with air quality in South Ribble, in particular in the Lostock Hall Air Quality Management
Area
Higher than national average levels of accidents on parts of the A582 and parallel routes
The underlying cause of the identified problems is that the transport network in South Ribble is already at a critical
point and will not be able to cope with an increase in demand for travel as a result of viable economic growth now
being delivered, and new developments in the area as part of the City Deal agreed with government.
Without an intervention, evidence from each of the sources identified above indicates that all the identified
problems will be exacerbated in the future and will be constraining investment and growth in Central Lancashire.
Based on the current evidence and approved future year plans, a strategic transport intervention is required which
would be capable of supporting the following outputs and benefits:
2,700+ new dwellings in South Ribble including the unlocking of 1,350 dwellings at Pickering’s Farm
strategic housing location;
Unlocking of the Cuerden Strategic Site and supporting its future growth;
Significantly improved access to/from strategic employment sites across South Ribble including
Lancashire and Leyland Business Parks, as well as to support their continued future growth;
Facilitate the provision of bus improvements and public realm improvements along the Transforming Cities
Fund North-South Bus and Active Travel corridor by removing through traffic from the B5254;
Reduce the impact of congestion on air quality and pollutant emissions in the Lostock Hall AQMA.
As such, the scheme strongly aligns with the MRN objectives:
Reduce congestion
Support economic growth and rebalancing
68
Support housing delivery
Support all road users, and
Support the SRN
Following the identification and appraisal of a range of fourteen alternative options and four option packages,
covering all modes of transport, and based on the scoring against the set of primary (MRN related) objectives and
project specific objectives, dualling of the existing A582 corridor with provision of a new parallel cycling and walking
route emerged as the Preferred Option. A shorter dualling and cycle route from the Stanifield Lane roundabout to
the Tank Roundabout was identified as the Next Best Alternative and the ‘low-cost’ option.
The SRWD scheme has exceptionally strong underpinning in national, sub-national and local policy, as a scheme
designed to promote economic growth whilst simultaneously delivering transport user and business competitive
advantage.
It has a strong fit with the national priorities for house building and economic growth as set out within the Treasury,
MHCLG, DFT, MRN and Highways England objectives. The SRWD also has strong local and regional support
and is identified as a key project in the Transport for the North Investment Programme, Preston City Deal,
Lancashire Strategic Economic Plan and CLHTM.
One of the key strategic benefits of the SRWD scheme is the synergy and compatibility with other transport
interventions within a larger approved and confirmed Transport Masterplan, aimed to support the continued
effective operation of Central Lancashire strategic and local transport network; both now and in a future world of
sustained economic growth promoted by Transport for the North’s ambitions for transformative growth across the
Northern Powerhouse.
Outline Business Case Update
The information contained within the Strategic Case should be verified and any new information should
be incorporated accordingly as part of the production of the scheme’s Outline Business Case.
The outcome of the planned consultation, when available, should be included as part of any future
review or update of the Strategic Case

69
4. Economic Case
4.1 Introduction
The Economic Case identifies and assesses all the impacts of the proposed scheme, and the resulting value for
money, to fulfil HM Treasury’s requirements for appraisal and demonstrate value for money in the use of taxpayers’
money.
In line with HM Treasury’s appraisal requirements, the impacts considered are not limited to those directly
impacting on the measured economy, nor to those which can be monetised. The economic, environmental, social
and distributional impacts of a proposal are all examined, using qualitative, quantitative and monetised information.
In assessing value for money, all of these are consolidated to determine the extent to which a proposal’s benefits
outweigh its costs.
The economic case is discussed under the following headings:
Methodology
Overall Appraisal Assumptions
Scheme Cost for Economic Appraisal
Monetised Benefits (‘Established’ Impacts)
Monetised Benefits (‘Emerging’ and ‘Indicative’ Impacts)
Summary of Monetised Costs and Benefits
Non-Monetised Benefits
Distributional Impacts
Appraisal Summary Table
Value for Money Statement and Conclusion
This Economic Case has been prepared to support the Strategic Outline Business Case. As the scheme develops
further in the future, the Economic Case will be refined with each subsequent Business Case produced.
4.2 Options Assessed
As discussed in the Strategic Case, a large number of potential scheme options were identified across different
modes. These were sifted into three packages of better-performing options, plus a ‘Do Minimum’ option. Following
an option scoring process, one of these was identified as the best-performing option: Option Package 4. This
consists of full dualling of the A582 delivered alongside a parallel cycle route. The remainder of this Economic
Case presents a value for money assessment for this option.
Another option was identified as the next best option and low-cost alternative: Option Package 3. This consists of
partial dualling of the A582 alongside a parallel cycle route, only between Stanifield Lane and Tank Roundabout.
As the second-highest scoring option, this option is not assessed in this Economic Case, but will be progressed
for further appraisal in the Outline Business Case.
4.3 Methodology
4.3.1 Overview
Figure 4.3-A explains the methodology for the scheme’s Value for Money assessment.
The Value for Money assessment is a staged process which includes appraisal of the scheme’s economic,
environmental, social, distributional and fiscal impacts using qualitative, quantitative and monetised information.
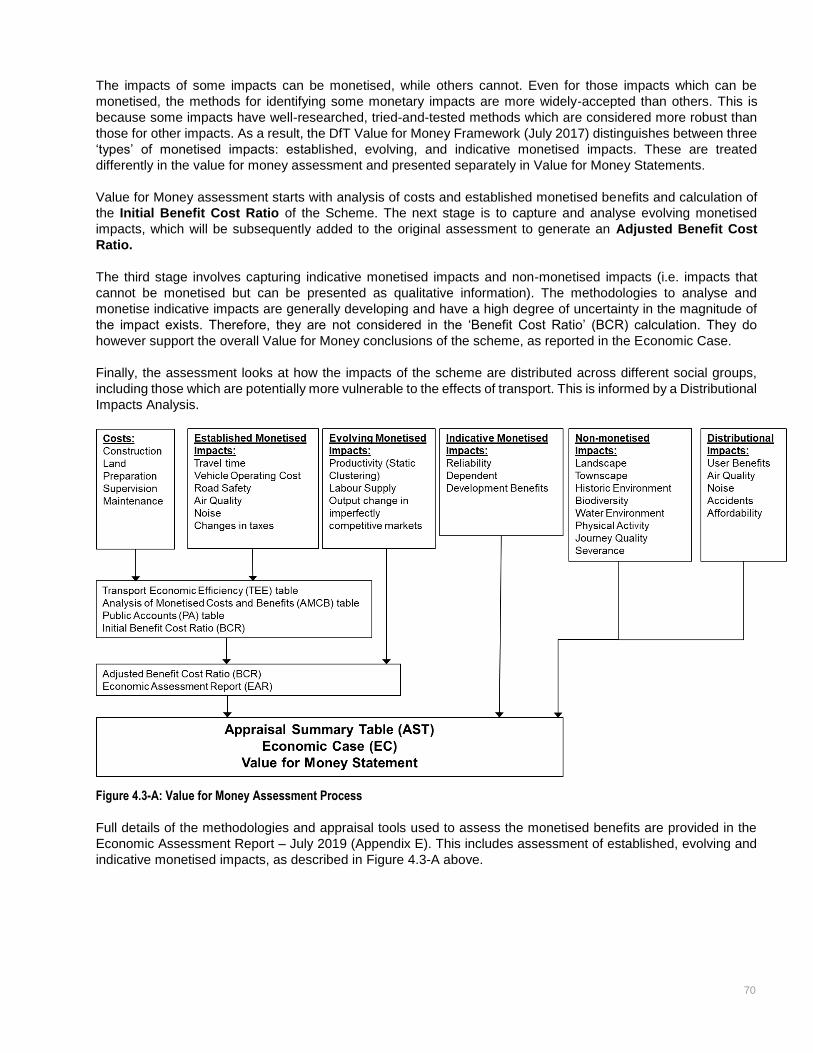
70
The impacts of some impacts can be monetised, while others cannot. Even for those impacts which can be
monetised, the methods for identifying some monetary impacts are more widely-accepted than others. This is
because some impacts have well-researched, tried-and-tested methods which are considered more robust than
those for other impacts. As a result, the DfT Value for Money Framework (July 2017) distinguishes between three
‘types’ of monetised impacts: established, evolving, and indicative monetised impacts. These are treated
differently in the value for money assessment and presented separately in Value for Money Statements.
Value for Money assessment starts with analysis of costs and established monetised benefits and calculation of
the Initial Benefit Cost Ratio of the Scheme. The next stage is to capture and analyse evolving monetised
impacts, which will be subsequently added to the original assessment to generate an Adjusted Benefit Cost
Ratio.
The third stage involves capturing indicative monetised impacts and non-monetised impacts (i.e. impacts that
cannot be monetised but can be presented as qualitative information). The methodologies to analyse and
monetise indicative impacts are generally developing and have a high degree of uncertainty in the magnitude of
the impact exists. Therefore, they are not considered in the ‘Benefit Cost Ratio’ (BCR) calculation. They do
however support the overall Value for Money conclusions of the scheme, as reported in the Economic Case.
Finally, the assessment looks at how the impacts of the scheme are distributed across different social groups,
including those which are potentially more vulnerable to the effects of transport. This is informed by a Distributional
Impacts Analysis.
Figure 4.3-A: Value for Money Assessment Process
Full details of the methodologies and appraisal tools used to assess the monetised benefits are provided in the
Economic Assessment Report – July 2019 (Appendix E). This includes assessment of established, evolving and
indicative monetised impacts, as described in Figure 4.3-A above.
71
4.4 Overall Appraisal Assumptions
4.4.1 Use of traffic model
The assessment of monetised benefits is primary based on traffic model outputs. Forecasts of the ‘with scheme’
and ‘without scheme’ scenarios were developed within the Central Lancashire Highway Transport Model
(CLHTM). Full details of the development of this model are provided in the CLHTM Local Model Validation Report
– April 2019 (Appendix F), Addendum to CLHTM Local Model Validation Report – July 2019 (Appendix G) and
the Traffic Forecasting Report – July 2019 (Appendix H).
Discussion and justification of the use of this traffic model in the A582 SRWD economic assessment is provided
in the Economic Assessment Report.
4.4.2 Appraisal Period
The impacts of the scheme have been assessed over a 60-year period after the scheme opens (2024-2083),
capturing the planned period of scheme development and implementation. Where necessary, the results from the
traffic model have been interpolated and extrapolated to cover the whole appraisal period.
4.4.3 Discounting and Units of Accounts
Costs and benefits occur in different years throughout the assessment period, e.g. the construction costs occur
before the scheme opens, whilst the benefits occur in the 60 years afterwards. For the purposes of appraisal, all
costs and benefits are presented in 2010 prices.
It is also considered that costs and benefits that accrue now are considered to be more valuable than those that
accrue further into the future. All costs and benefits that occur in the future are therefore adjusted by a ‘discount
factor’ that grows over time. This process is known as discounting which adjusts monetary values to a fixed
‘Present Value Year’. In line with DfT guidance, all prices are discounted to a Present Value Year of 2010.
Full details are provided in the Economic Assessment Report.
4.4.4 Uncertainty and Sensitivity Tests
The Value for Money assessment of the A582 SRWD scheme has been based on the ‘most likely’ traffic forecast
scenario known as Core Scenario. It has been produced in line with WebTAG guidance and does not include trips
associated with the scheme dependent development, to meet guidance in the context of schemes delivering
housing growth.
No sensitivity test has been undertaken at this stage of the scheme. ‘High Growth’ and ‘Low Growth’ sensitivity
tests will be undertaken for the scheme during the next stages.
4.5 Scheme Cost for Economic Appraisal
The derivation of scheme costs is a crucial part of the scheme appraisal. Economic assessment considers both
the actual cost of the scheme, together with any changes in future maintenance costs.
The costs used in scheme appraisal differ from the outturn costs used for funding decisions shown in the Financial
Case. Costs for scheme appraisal are adjusted to the DfT's standard present value year for appraisal (2010) to
allow direct comparison with the monetised benefits and the costs are in calendar years. Scheme costs used for
funding submissions are the outturn costs in the expected years of expenditure and are in financial years.
Base cost estimates for construction, land / property, preparation / administration and supervision are presented
in the Economic Assessment Report.
The base cost estimates met the following criteria:
72
Construction costs are based on the scheme design and cost information from similar previous schemes
Expenditure in calendar years
Exclude both recoverable and non-recoverable VAT
Exclude any costs that are present in both the Do-Minimum and the Do-Something scenarios
The cost estimates were prepared in 2019 prices and then inflated to outturn costs (i.e. expected costs in the
actual years of expenditure). Construction inflation was assumed to be 5.5% per annum, which is higher than
general background inflation. The costs were then rebased to 2010 prices using the GDP-deflator series as
published in the May 2019 WebTAG Data-book.
As mentioned in section 4.4.3 all the costs are discounted and are presented in 2010 prices.
Any costs already incurred to date (known as ‘sunk costs’) were excluded from the total scheme costs used for
the value for money assessment.
The costs presented in the Financial Case include a large risk adjustment of over 30%. This is not based on a
Quantified Risk Assessment and has been estimated based on Lancashire County Council’s experience with
similar schemes. In line with DfT guidance, this risk estimate has not been included in the costs used for economic
appraisal purposes, given the early stage of cost development. Instead, optimism bias of 44% has been applied
to the costs, as recommended by WebTAG Unit A1.2 Table 8, to represent the greater uncertainty at this stage of
scheme development.
Table 4.5-isummarises the scheme costs adjusted to the DfT standard present value year (2010).
Table 4.5-i:Present Value of Costs (2010 prices, discounted to 2010)
Discounted Costs
Scheme Costs £59.1m
Additional Costs of Maintenance £1.1m
Present Value of Costs (PVC) £60.3m
4.6 Monetised Benefits (‘Established’ Impacts)
4.6.1 Introduction
As shown in Figure 4.3-A, the following impacts of the scheme can be considered ‘established’ monetised impacts,
and are included within the Initial BCR:
Transport Economic Efficiency benefits – this includes travel time savings and vehicle operating cost
impacts due to the scheme, as well as changes in delays during its construction and maintenance
Changes in indirect tax revenues
Changes in accident numbers
Changes in noise, air quality and greenhouse gases
4.6.2 Transport Economic Efficiency Benefits
The scheme generates significant economic benefits from making road user journeys quicker. There are also
small changes in their Vehicle Operating Costs (e.g. fuel and vehicle maintenance costs) due to travelling at
different speeds or changing the routes they take. In addition, there are disbenefits to road users due to extra
delays during scheme construction. The change in roadworks-related delays during future routine maintenance
(compared to a ‘without scheme’ scenario) are also considered.
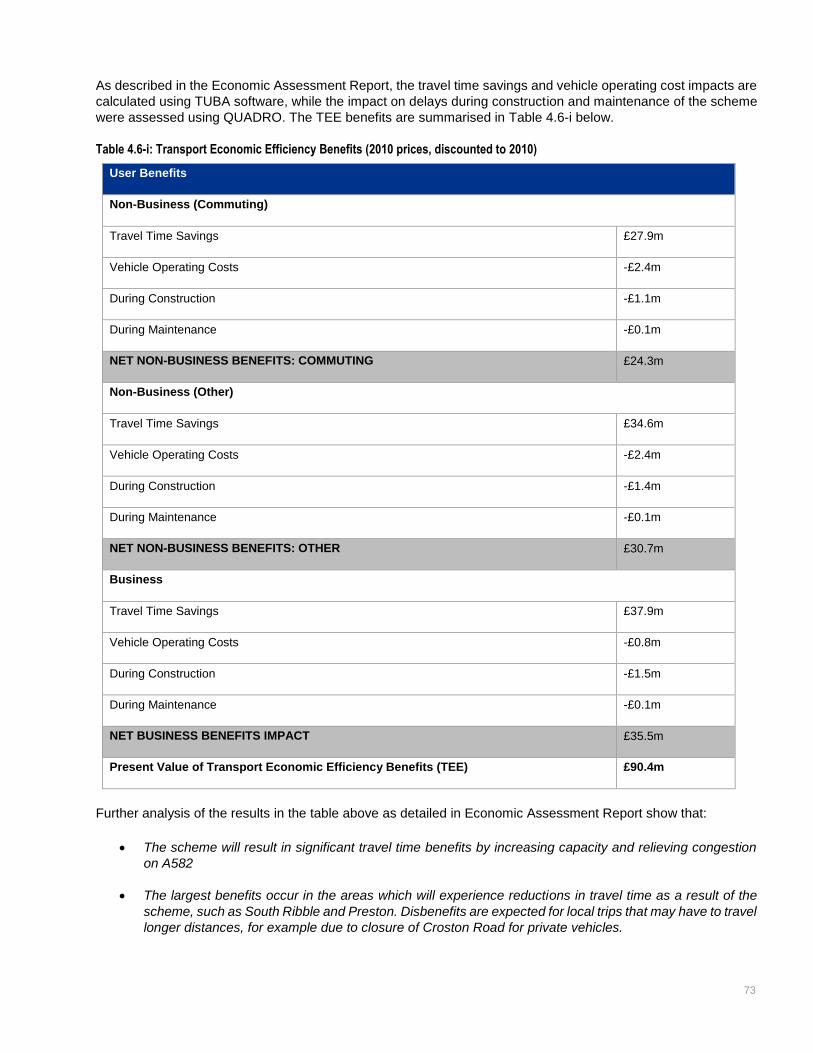
73
As described in the Economic Assessment Report, the travel time savings and vehicle operating cost impacts are
calculated using TUBA software, while the impact on delays during construction and maintenance of the scheme
were assessed using QUADRO. The TEE benefits are summarised in Table 4.6-i below.
Table 4.6-i: Transport Economic Efficiency Benefits (2010 prices, discounted to 2010)
User Benefits
Non-Business (Commuting)
Travel Time Savings £27.9m
Vehicle Operating Costs -£2.4m
During Construction -£1.1m
During Maintenance -£0.1m
NET NON-BUSINESS BENEFITS: COMMUTING £24.3m
Non-Business (Other)
Travel Time Savings £34.6m
Vehicle Operating Costs -£2.4m
During Construction -£1.4m
During Maintenance -£0.1m
NET NON-BUSINESS BENEFITS: OTHER £30.7m
Business
Travel Time Savings £37.9m
Vehicle Operating Costs -£0.8m
During Construction -£1.5m
During Maintenance -£0.1m
NET BUSINESS BENEFITS IMPACT £35.5m
Present Value of Transport Economic Efficiency Benefits (TEE) £90.4m
Further analysis of the results in the table above as detailed in Economic Assessment Report show that:
The scheme will result in significant travel time benefits by increasing capacity and relieving congestion
on A582
The largest benefits occur in the areas which will experience reductions in travel time as a result of the
scheme, such as South Ribble and Preston. Disbenefits are expected for local trips that may have to travel
longer distances, for example due to closure of Croston Road for private vehicles.

74
The scheme will result in an increase in Vehicle Operating Costs for road users, as people travel slightly
longer distances to use the scheme.
There will be a disbenefit to road users during the construction period due to increased roadwork delays.
There are slight disbenefits because of maintenance delays over the lifetime of each scheme. There is
less maintenance activity required because it is a brand new road, however the additional traffic will cause
an overall disbenefits to road users with scheme in place.
Overall, the A582 SRWD will provide over £90m of Transport Economic Efficiency benefits to road users.
4.6.3 Changes in Indirect Tax Revenues
There will be an overall increase in indirect tax revenue received by the government of £4.0m. This is due to an
increase in fuel consumption due to an increase in distance travelled with the scheme in place.
4.6.4 Changes in Accident Numbers
Safety benefits are expected along the A582 scheme because of the safety standards of a new dual carriageway
compared to the single carriageway. Benefits are also driven by reduction of traffic on other local roads such as
Lostock Hall and A6. An increase in accidents is expected at the junctions along the A582 scheme, due to the
increase in traffic travelling through them.
Overall, the scheme is predicted to result in four fewer fatal casualties over the appraisal period, and 19 fewer
serious casualties. The scheme is however expected to result in an increase in the number of slight casualties,
mainly at the junctions along A582. The monetary value of the overall change in accidents would be a benefit of
£3.9m (2010 prices, discounted to 2010). Further detail of the accident analysis is provided in Economic
Assessment Report.
4.6.5 Change in Noise, Air Quality and Greenhouse Gases
An increase in greenhouse gas emissions of 162,314 tonnes over the 60-year appraisal period has been predicted.
These changes are due to an increase in distance travelled once the scheme is in place despite there being a
decrease in overall travel times. This increase in emissions corresponds to a disbenefit of -£7.3m.
In terms of air quality, an increase in regional NOx emissions over the 60-year appraisal period is predicted, with
an associated monetary disbenefit of -£0.1m. However, South Ribble Borough Council AQMA No. 3 (Lostock Hall)
has a reduction in traffic flows. This reduction in traffic flows is likely to result in an improvement in air quality in
this AQMA.
There is predicted to be a benefit from changes in noise levels, equating to £1.8m over the 60-year appraisal
period. There will be 101 fewer households ‘annoyed’ by noise after the scheme is built.
The results of environmental impacts of the scheme are summarised in Table 4.6-ii below.
Table 4.6-ii: Environmental Benefits (2010 prices, discounted to 2010)
Environmental Assessment Benefits
Greenhouse Gas -£7.3m
Air Quality (NOx emissions) -£0.1m
Noise £1.8m
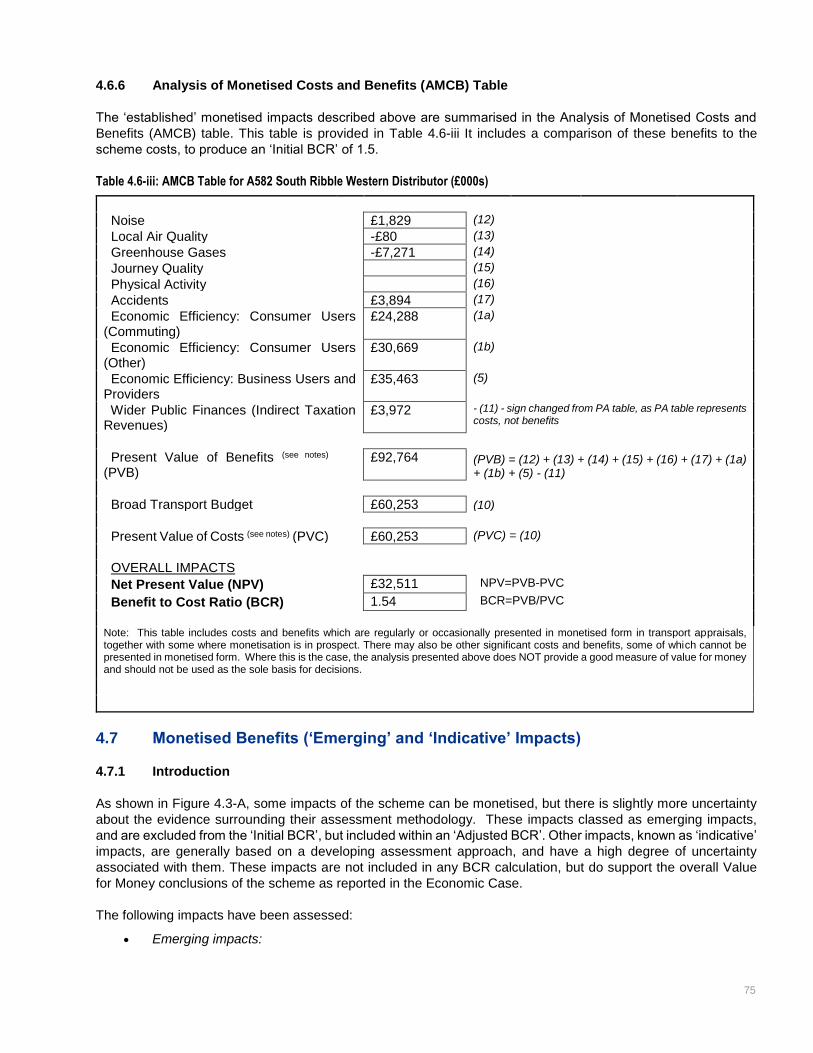
75
4.6.6 Analysis of Monetised Costs and Benefits (AMCB) Table
The ‘established’ monetised impacts described above are summarised in the Analysis of Monetised Costs and
Benefits (AMCB) table. This table is provided in Table 4.6-iii It includes a comparison of these benefits to the
scheme costs, to produce an ‘Initial BCR’ of 1.5.
Table 4.6-iii: AMCB Table for A582 South Ribble Western Distributor (£000s)
Noise £1,829 (12)
Local Air Quality -£80 (13)
Greenhouse Gases -£7,271 (14)
Journey Quality (15)
Physical Activity (16)
Accidents £3,894 (17)
Economic Efficiency: Consumer Users (Commuting)
£24,288 (1a)
Economic Efficiency: Consumer Users (Other)
£30,669 (1b)
Economic Efficiency: Business Users and Providers
£35,463 (5)
Wider Public Finances (Indirect Taxation Revenues)
£3,972 - (11) - sign changed from PA table, as PA table represents costs, not benefits
Present Value of Benefits (see notes) (PVB)
£92,764 (PVB) = (12) + (13) + (14) + (15) + (16) + (17) + (1a) + (1b) + (5) - (11)
Broad Transport Budget £60,253 (10)
Present Value of Costs (see notes) (PVC) £60,253 (PVC) = (10)
OVERALL IMPACTS
Net Present Value (NPV) £32,511 NPV=PVB-PVC
Benefit to Cost Ratio (BCR) 1.54 BCR=PVB/PVC
Note: This table includes costs and benefits which are regularly or occasionally presented in monetised form in transport appraisals, together with some where monetisation is in prospect. There may also be other significant costs and benefits, some of which cannot be presented in monetised form. Where this is the case, the analysis presented above does NOT provide a good measure of value for money and should not be used as the sole basis for decisions.
4.7 Monetised Benefits (‘Emerging’ and ‘Indicative’ Impacts)
4.7.1 Introduction
As shown in Figure 4.3-A, some impacts of the scheme can be monetised, but there is slightly more uncertainty
about the evidence surrounding their assessment methodology. These impacts classed as emerging impacts,
and are excluded from the ‘Initial BCR’, but included within an ‘Adjusted BCR’. Other impacts, known as ‘indicative’
impacts, are generally based on a developing assessment approach, and have a high degree of uncertainty
associated with them. These impacts are not included in any BCR calculation, but do support the overall Value
for Money conclusions of the scheme as reported in the Economic Case.
The following impacts have been assessed:
Emerging impacts:
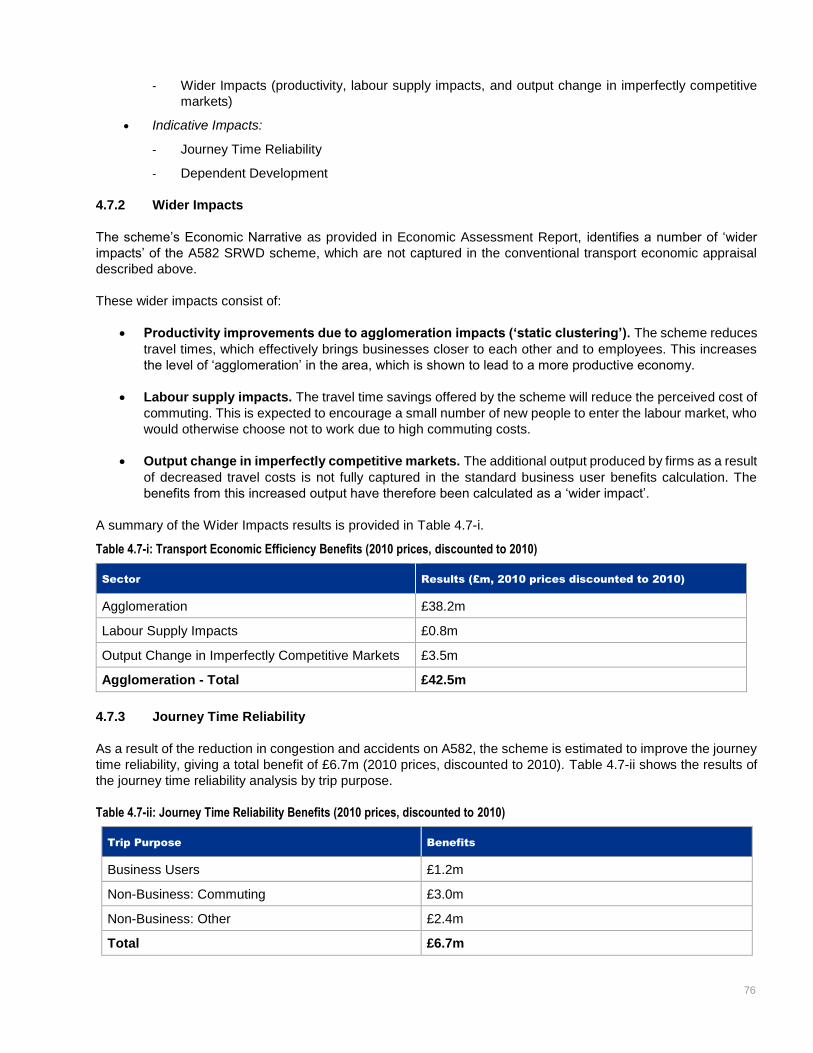
76
- Wider Impacts (productivity, labour supply impacts, and output change in imperfectly competitive
markets)
Indicative Impacts:
- Journey Time Reliability
- Dependent Development
4.7.2 Wider Impacts
The scheme’s Economic Narrative as provided in Economic Assessment Report, identifies a number of ‘wider
impacts’ of the A582 SRWD scheme, which are not captured in the conventional transport economic appraisal
described above.
These wider impacts consist of:
Productivity improvements due to agglomeration impacts (‘static clustering’). The scheme reduces
travel times, which effectively brings businesses closer to each other and to employees. This increases
the level of ‘agglomeration’ in the area, which is shown to lead to a more productive economy.
Labour supply impacts. The travel time savings offered by the scheme will reduce the perceived cost of
commuting. This is expected to encourage a small number of new people to enter the labour market, who
would otherwise choose not to work due to high commuting costs.
Output change in imperfectly competitive markets. The additional output produced by firms as a result
of decreased travel costs is not fully captured in the standard business user benefits calculation. The
benefits from this increased output have therefore been calculated as a ‘wider impact’.
A summary of the Wider Impacts results is provided in Table 4.7-i.
Table 4.7-i: Transport Economic Efficiency Benefits (2010 prices, discounted to 2010)
Sector Results (£m, 2010 prices discounted to 2010)
Agglomeration £38.2m
Labour Supply Impacts £0.8m
Output Change in Imperfectly Competitive Markets £3.5m
Agglomeration - Total £42.5m
4.7.3 Journey Time Reliability
As a result of the reduction in congestion and accidents on A582, the scheme is estimated to improve the journey
time reliability, giving a total benefit of £6.7m (2010 prices, discounted to 2010). Table 4.7-ii shows the results of
the journey time reliability analysis by trip purpose.
Table 4.7-ii: Journey Time Reliability Benefits (2010 prices, discounted to 2010)
Trip Purpose Benefits
Business Users £1.2m
Non-Business: Commuting £3.0m
Non-Business: Other £2.4m
Total £6.7m
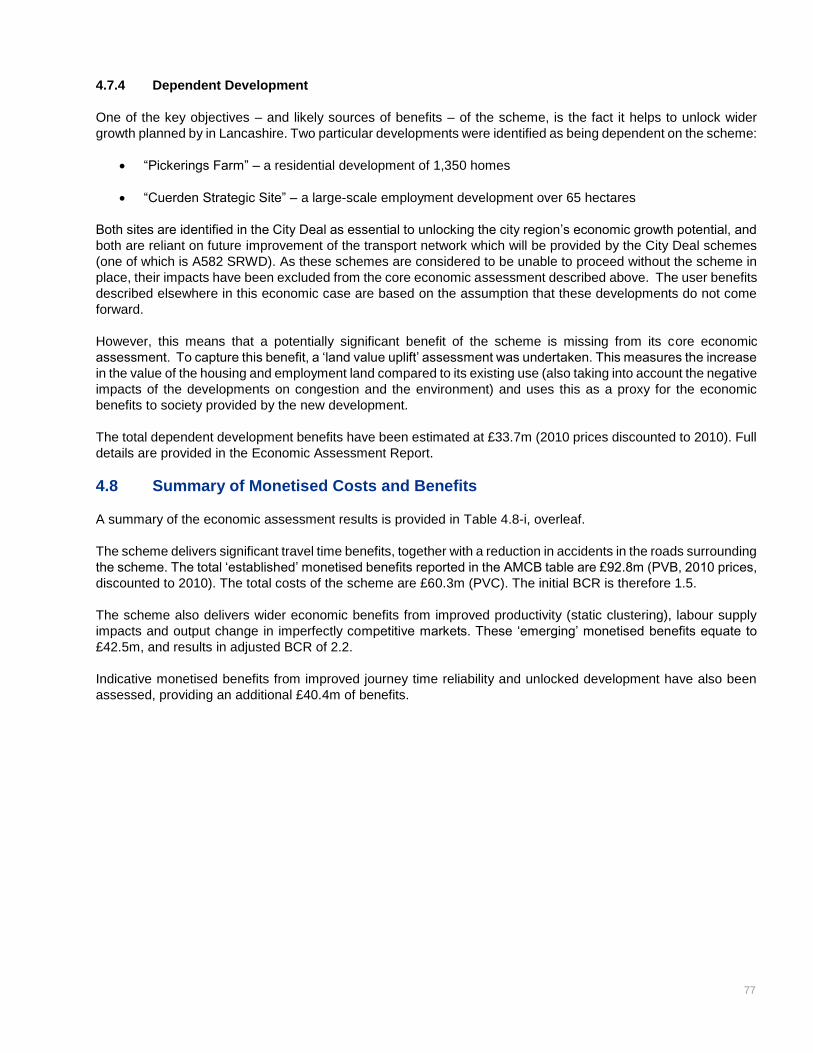
77
4.7.4 Dependent Development
One of the key objectives – and likely sources of benefits – of the scheme, is the fact it helps to unlock wider
growth planned by in Lancashire. Two particular developments were identified as being dependent on the scheme:
“Pickerings Farm” – a residential development of 1,350 homes
“Cuerden Strategic Site” – a large-scale employment development over 65 hectares
Both sites are identified in the City Deal as essential to unlocking the city region’s economic growth potential, and
both are reliant on future improvement of the transport network which will be provided by the City Deal schemes
(one of which is A582 SRWD). As these schemes are considered to be unable to proceed without the scheme in
place, their impacts have been excluded from the core economic assessment described above. The user benefits
described elsewhere in this economic case are based on the assumption that these developments do not come
forward.
However, this means that a potentially significant benefit of the scheme is missing from its core economic
assessment. To capture this benefit, a ‘land value uplift’ assessment was undertaken. This measures the increase
in the value of the housing and employment land compared to its existing use (also taking into account the negative
impacts of the developments on congestion and the environment) and uses this as a proxy for the economic
benefits to society provided by the new development.
The total dependent development benefits have been estimated at £33.7m (2010 prices discounted to 2010). Full
details are provided in the Economic Assessment Report.
4.8 Summary of Monetised Costs and Benefits
A summary of the economic assessment results is provided in Table 4.8-i, overleaf.
The scheme delivers significant travel time benefits, together with a reduction in accidents in the roads surrounding
the scheme. The total ‘established’ monetised benefits reported in the AMCB table are £92.8m (PVB, 2010 prices,
discounted to 2010). The total costs of the scheme are £60.3m (PVC). The initial BCR is therefore 1.5.
The scheme also delivers wider economic benefits from improved productivity (static clustering), labour supply
impacts and output change in imperfectly competitive markets. These ‘emerging’ monetised benefits equate to
£42.5m, and results in adjusted BCR of 2.2.
Indicative monetised benefits from improved journey time reliability and unlocked development have also been
assessed, providing an additional £40.4m of benefits.
78
Table 4.8-i: Summary of Economic Assessment Results (2010 prices, discounted to 2010)
Impact Monetary Value
Costs
Investment Costs £59.9m
Operating Costs (Capital Costs of Maintenance) £1.1m
Total PVC £60.3m
Benefits within
Initial BCR
TEE Benefits
Commuting Travel Time Benefits £27.9m
Other User Travel Time Benefits £34.6m
Business User Travel Time Benefits £37.9m
VOC Benefits -£5.6m
Construction Delay Benefits -£4.0m
Maintenance Delay Benefits -£0.3m
Indirect Tax Revenues £4.0m
Accident Benefits £3.9m
Greenhouse Gas Emissions -£7.3m
Air Quality -£0.1m
Noise £1.8m
Total PVB £92.8m
Net Present Value (NPV) £32.5m
Initial BCR 1.5
Wider Economic
Impacts for
Inclusion in
Adjusted BCR
Labour supply impacts £0.8m
Productivity: Static Clustering £38.2m
Output change in imperfectly competitive markets £3.5m
TOTAL £42.5m
Total PVB (including Wider Economic Impacts) £135.3m
Adjusted BCR 2.2
Benefits not
included in BCR
Journey Time Reliability Benefits £6.7m
Dependent Development benefits (land value uplift) £33.7m
4.9 Non-Monetised Benefits
4.9.1 Analysis of Non-monetised Impacts
In addition to the monetised costs and benefits, a value for money assessment must consider those impacts which
cannot be monetised and how these contribute to the Value for Money of the scheme.
These impacts are difficult to monetise, but have nevertheless been appraised using qualitative and quantitative
information, and given an overall qualitative assessment score are discussed below.
The analysis of these impacts is summarised in the Appraisal Summary Table (Appendix I)
4.9.2 Environmental – Landscape
The removal of woodland and trees adjacent to the A582 and B5253 would result in the presence of traffic initially
being a more noticeable element within the landscape and some reduction of perceived tranquillity would be
79
apparent adjacent to the scheme. At design year the landscape would be restored by establishment of
replacement planting and have a neutral impact. Some locations such as the B5253 are considered to have a
slight improvement in landscape quality. The increased width of the A582/B5253 corridor would barely be
perceived in the context of the wider landscape as it is an existing road corridor.
The overall impact of the scheme on landscape is neutral.
4.9.3 Environmental – Townscape
Townscape covers the physical and social characteristics of the built and non-built urban environment and the
way in which people perceive those characteristics.
The A582 SRWD is situated on the periphery of the built-up area of Lower Penwortham, Farrington and Leyland.
There will be limited impact on local townscape character as the dualling follows the alignment of the existing
A582.
The overall effect for Townscape is slight adverse.
4.9.4 Environmental – Historic Environment
The Historic Environment comprises buildings and sites of architectural and historic significance.
A total of 109 heritage assets have been identified by the desktop assessment none of which would be impacted
by the scheme. After mitigation, residual impact is assessed as being neutral. The potential for as-yet unknown
archaeological remains is considered to be low.
The overall result for historic environment is neutral.
4.9.5 Environmental – Biodiversity
No significant residual impacts have been identified for any ecological receptors during the construction and
operational phases. Design options have been selected during route development to reduce the extent of
woodland habitat loss where practicable. Significant short-term impacts are predicted through habitat loss and/ or
fragmentation, but these impacts will not persist medium to long term as compensatory habitats will mature. Plans
for replanting and new compensatory habitats (including new wetland) have been designed to enhance the
ecological connectivity and functioning of the existing habitat network and the combined areas of mitigation and
compensatory woodland planting will result in a net gain of woodland in the study area.
This would represent an overall assessment of a slight adverse impact for biodiversity.
4.9.6 Environmental – Water Environment
The results show that impacts of the scheme on water environment during operation with mitigation would be
negligible. Most of the impacts on the identified water environment attributes would be insignificant. Potential
impacts were identified prior to the application of any mitigation measures. However, impacts from construction
runoff, routine road runoff and spillages will be mitigated through a drainage system designed to attenuate flows
and treat pollutants. Culverts and watercourse diversions will be designed with sufficient capacity to convey
anticipated flows and to minimise erosion.
As a result, a neutral impact has been awarded for Water Environment.
4.9.7 Social – Physical Activity
Research shows a correlation between physical inactivity and the risk of all-cause mortality. The impact of the
scheme on physical activity has therefore been assessed.
80
Overall, non-motorised users (NMUs) would experience a long-term positive benefit as a result of the introduction
of a new three metre wide shared-use cycletrack along the full length of the proposed scheme (6.5km) combined
with the provision of new toucan crossings at Croston Road and Longmeanygate where there is no provision at
the present time.
NMUs would experience a moderate beneficial impact with regard to physical activity because of the new
facilities provided and slightly increased journey times for users of some Public Rights of Way which cross the
A582 and B5253.
4.9.8 Social – Journey Quality
Journey Quality depends on a number of factors including traveller care, traveller views, traveller stress as well
as additional sub-factors.
It is concluded that the scheme would have a neutral impact on travellers’ views from the road and remain in-line
with the semi-rural setting. The scheme would be designed to a higher standard than the existing road which
reduces driver uncertainty and stress also reducing the opportunity for collisions and drivers’ fear of potential
accidents. Overall the scheme would result in a long-term moderate benefit to driver stress levels. A slight
beneficial impact on traveller care would be experienced through slight improvement the landscape and
environmental quality of the journey in some locations. The provision of a combined footway / cycletrack along the
dualling will provide a facility creating a moderate safety benefit. As the number of travellers affected exceeds
10,000 vehicles per day, the impact is likely to be moderate beneficial.
4.9.9 Social – Severance
Severance is defined as the separation of residents from community facilities and services caused by substantial
changes in transport infrastructure or by changes in traffic flows. To understand the impact of the SRWD on
severance, the difference in the levels of severance in the with-scheme and without-scheme cases have been
examined.
The severance impact is considered to be moderate beneficial to the communities adjacent to the scheme such
as at Lostock, Farrington and Lower Penwortham. The scheme provides new formal crossing access at Croston
Road / Farrington Road and also at Longmeanygate which do not exist at the present time. The new facilities
provided along the road would provide increased level of access for NMU but owing to the limitations on the type
of crossings and the level of safe provision possible after dualling some journeys along existing Public Rights of
Way (PRoWs) will be diverted owing to the provision of a central crash barrier. The impact on PRoWs is considered
to be neutral.
Overall, the impact of the scheme is considered to be slight beneficial.
4.10 Distributional Impacts
The assessment of Distributional Impacts (DIs) is designed to help understand the impacts of transport
interventions on different groups of people, including those potentially more vulnerable to the effects of transport.
In this Strategic Outline Business Case, the likely impact of the scheme on vulnerable groups has been assessed
at a high level, as outlined in Appendix J. This assessment will be developed further at Outline Business Case
stage.
4.11 Appraisal Summary Table
The AST presents evidence from the analysis that that is undertaken to inform the Economic Case of an
intervention. Applying the principles of HM Treasury Green Book, the AST has been designed to record all impacts
- Economic, Environmental, Social, Public Accounts and Distributional.
The Scheme AST is included in Appendix I.
81
4.12 Value for Money Statement
4.12.1 Value for Money Categorisation
The economic, environmental, social and distributional impacts of the proposed scheme have been appraised
using qualitative, quantitative and monetised information.
Based on the monetised costs and benefits of the scheme, Initial and Adjusted Benefit Cost Ratio (BCR) metrics
can be used to identify the likely Value for Money category of a scheme. The categories include:
Poor VfM: if BCR is below 1.0
Low VfM: if the BCR is between 1.0 and 1.5
Medium VfM: if the BCR is between 1.5 and 2.0
High VfM: if the BCR is between 2.0 and 4.0
Very High VfM: if the BCR is greater than 4.0
The BCR represents the amount of benefits of the scheme being provided for every £1 of cost and is calculated
by dividing the Present Value of Benefits (PVB) by the Present Value of Cost (PVC).
Based on the ‘established’ monetised impacts presented in the AMCB table, the total monetised benefits (PVB)
of the scheme, £92.8m, will exceed the scheme cost (PVC) of £60.3m, by £31.7 (NPV) (2010 prices, discounted
to 2010). The Initial BCR of the scheme is therefore 1.5.
The scheme also delivers wider economic benefits from labour supply, productivity and output change in
imperfectly competitive markets, which equate to £42.5m (2010 prices, discounted to 2010). This results in
Adjusted BCR of 2.2.
Any BCR between 2 and 4 indicates the scheme is likely to offer High Value for Money based on DfT guidance
criteria.
Other impacts which have been monetised but not included in the BCR calculations are journey time reliability
(£6.7m) and land value uplift due to unlocking dependent development benefits (£33.7m).
The non-monetised impacts of the scheme have also been considered. The scheme is expected to have a slight
beneficial impact by reducing severance, a moderate beneficial impact by increasing physical activity and journey
quality, and slight adverse environmental impacts on townscape and biodiversity.
Overall, taking into account the BCRs, the indicative monetised impacts from journey time reliability and unlocked
development, and the non-monetised impacts, the scheme is expected to offer High Value for Money.
4.12.2 Switching Values
If the scheme costs are unchanged, for the scheme to fall into Medium Value for Money category (indicated by a
BCR of below 2) the PVB would need to decrease by £14.8m or around 11%.
Given the indicative benefits of £40.4m which are excluded from the BCR (from journey time reliability and
unlocked developments), and the fact that most of the non-monetised impacts are beneficial or slightly adverse,
the risk of the scheme falling into the medium value for money category is considered low.
For scheme to fall into Medium Value for Money category, the PVC should increase by £7.4m or around 12% to
£67.6m. This is while an optimism bias of 44% is included in the calculation of the scheme PVC. Even if this was
the case, it is still likely that the scheme would be considered to offer high value for money, given the £40.4m of
indicative monetised benefits which are not included in that BCR.

82
Outline Business Case Update
The estimation of benefits should be refined at the Outline Business Case stage to incorporate any
updated scheme assumptions.
The estimation of costs should also be refined, including the development of a Quantified Risk
Assessment.
The value for money of the identified Low Cost Alternative should also be assessed.

83
5. Financial Case
The Financial Case determines whether or not the investment is affordable and the net cost to the public sector.
It documents the funding arrangements, expenditure and technical accounting issues with the scheme. It does not
consider the Value for Money of the scheme, which is scrutinised in the Economic Case.
More specifically, and in line with Green Book guidance, the Financial Case should contain:
A budget statement based on Accounting Principles as per the Consolidated Budgeting Guidance,
showing the resource and capital costs over the lifetime of a proposal;
A cashflow statement showing the costs that will be spent on the preferred option if it goes ahead; and,
A funding statement showing the sources of funds and other resources required.
The Financial Case for the South Ribble Western Distributor (SRWD) scheme is discussed in detail under the
following sub-headings
Assumptions
Base Costs Methodology
Sunk Costs and Costs to Produce Outline Business Case
Risk
Inflation
Expenditure Profile
Funding Arrangements
Conclusion
5.1 Assumptions
The key assumptions used in deriving the scheme cost estimates are outlined below:
Cost estimated in 2019 prices;
Construction period commencing Q3 20/21 with the scheme opening Q4 23/24;
Construction Works to generally be undertaken during normal working hours save for the out of hours
requirements associated with specific tasks relating to work near the M65, the West Coast Mainline and
Preston to Ormskirk railway line;
Access to the site is restricted as construction will be online whilst the road remains open. Further
restrictions exist in relation to areas associated with the M65 motorway, the West Coast Mainline and the
Preston to Ormskirk railway line, and;
The estimate only covers those works within the "red line" planning permission boundary.

84
5.2 Base Costs Methodology
The Financial Case for the A582 South Ribble Western Distributor has been based on the development to date
and latest costing of the preferred option. The scheme design is in active an ongoing development for the
preparation of a planning application submission in early 2020.
The cost estimates are based on the scheme design at its present status, and remains a live document which is
amended as the scheme design progresses. The present cost estimate is included in Appendix K.
5.2.1 Construction Costs
Highways design drawings are currently under development for the planning application submission and are at
varying stages of completeness. As a result, the cost estimate has been prepared from the design information
available at this stage of the project, which is 50% complete. However, due to the detail needed for the submission
of a planning application sufficient information is available for robust estimate to be produced.
Lancashire County Council, through the City Deal, have recently submitted the Business Case for the Preston
Western Distributor (PWD) scheme. The scheme has been developed by an integrated team consisting of the
LCC City Deal Delivery Team and ECI contractor staff. Costain Ltd. were awarded the contract for the PWD
scheme and through the integration into the City Deal Delivery Team have provided cost estimate support for the
SWRD scheme. These estimates have drawn on the evolving highway design drawings and the outturn or target
costs of other City Deal schemes, including the PWD.
Structures design for bridges over the West Coast Mainline and Ormskirk Branch Line will be undertaken by
Network Rail, while the design of other structures will be undertaken by LCC. As designs for structures are not
available at present, cost estimates have been taken from option assessment studies undertaken during an earlier
stage of scheme development in 2014 which provided broad order of magnitude estimates for various structures
including a new bridge over the GEML on Farrington Rd and informed by Network Rail’s technical requirements.
These cost estimates have been uplifted to 2019 prices using an inflation rate of 3%.
Allowance has been made for Utility services alterations which are based upon C3 Budget estimates which will
be converted to C4 Detailed estimates prior to construction commencement.
The construction costs estimate includes all construction costs within the red line boundary of the scheme and will
consist of:
Widening existing single carriageway to dual carriageway;
Six junction upgrades
New bridge over West Coast Mainline
New Ormskirk to Preston railway bridge over the scheme
One widened subway
One extended river bridge
One section of narrow widening from 2 to 3 lanes on existing dual carriageway
Site clearance;
Drainage works;
Earthworks;
Fencing;
Shared use footway cycle tracks;
Street lighting;
Works for and liaison with Statutory Undertakers.

85
The cost estimate methodology used by LCC was reviewed by an independent cost consultancy team from Jacobs
Engineering Ltd in November 2018 and found to be “largely reasonable given the early stage of scheme
development and the information currently available” (A582 Dualling Scheme Cost Estimate Review, Jacobs Nov
2018). The same methodology has been adopted to produce this cost estimate, reflecting the revised scope of
the scheme as the design has evolved since this review.
5.2.2 Land Costs
Land acquisition and compensation costs, including compensation payable under Part 1 of the Land
Compensation Act 1973, have been determined from the existing scheme designs and red line boundary for the
planning application submission. Land Assembly is likely to be subject to the Compulsory Purchase procedure.
The land and property valuation was last reviewed in June 2019 by LCC and is considered to be robust. The
estimates were performed by local authority valuers experienced in Lancashire property and Part 1 Claim values.
The total valuation takes into account the following elements:
The acquisition of interests in land including fees.
Compensation under Part 1 of the Land Compensation Act 1973 including fees.
The basis of the valuation is Agricultural Land valued at £8,500 per acre up to Development Land at £250,000 per
acre. The valuation will remain under review as the scheme progresses through to statutory procedures. Changes
to the estimated land and property costs will be included in the Outline/Final Business Case. The changes will be
met by the City Deal.
In line with the requirements of the Major Road Network and Large Local Major Schemes: Submission for
Development Funding Pro-Forma, only land purchase costs are included in the costs presented below.
Compensation payable under Part 1 of the Land Compensation Act 1973 is excluded at this stage.
5.2.3 Preparation and Supervision Costs
Future Preparation and Admin costs have been calculated based upon the known staff requirements within the
dedicated LCC team, in addition to estimates provided by LCC’s framework consultants, to complete the project
to works commencement and the overhead cost attracted by the staff. Site Supervision costs have been calculated
by determining the required supervision team for the project. With this information and understanding the hourly
rates and overheads and the contract length a calculation has been undertaken to evaluate the cost forecast.
In line with the recommendation of the Major Road Network and Large Local Major Schemes: Submission for
Development Funding Pro-Forma to present preparation costs between OBC and construction, preparation costs
of producing the OBC have been excluded from the base preparation costs, while supervision costs during
construction have been presented separately. Costs to produce the OBC are discussed separately in section 5.3,
and have been included in the total scheme costs used to calculate the Present Value of Costs in the Economic
Case. The reader should bear this in mind when comparing the respective treatment of scheme costs in the
economic and financial cases.
5.2.4 Base Costs
The base costs, calculated in line with the above methodology, are outlined in Table 5.2-i below.
Table 5.2-i: Base costs of SRWD scheme in 2019 prices
Preparation costs
(between OBC and
construction)
Supervision
Costs
Land
purchase
Construction
costs
TOTAL
Base cost £4,668,000 £2,500,000 £843,369 £41,990,160 £50,001,529
As outlined above, the base costs exclude the following elements which have also been estimated;
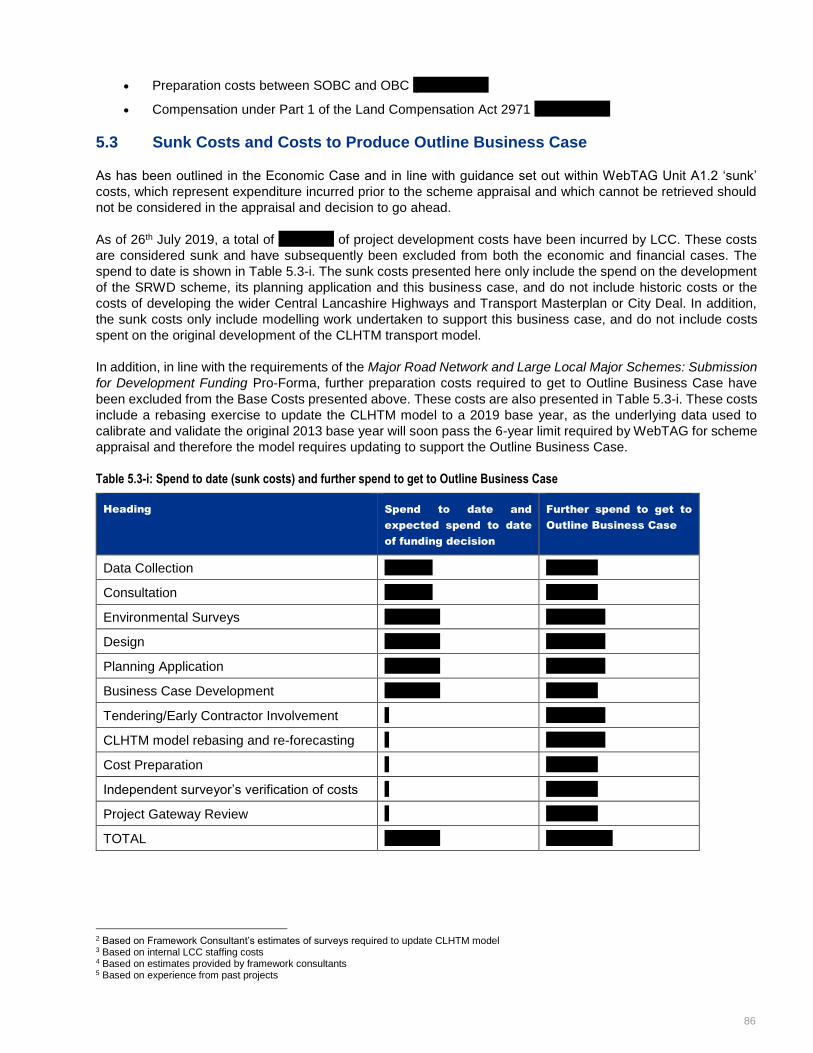
86
Preparation costs between SOBC and OBC (£1,082,000)
Compensation under Part 1 of the Land Compensation Act 2971 (£1,400,000)
5.3 Sunk Costs and Costs to Produce Outline Business Case
As has been outlined in the Economic Case and in line with guidance set out within WebTAG Unit A1.2 ‘sunk’
costs, which represent expenditure incurred prior to the scheme appraisal and which cannot be retrieved should
not be considered in the appraisal and decision to go ahead.
As of 26th July 2019, a total of £855,000 of project development costs have been incurred by LCC. These costs
are considered sunk and have subsequently been excluded from both the economic and financial cases. The
spend to date is shown in Table 5.3-i. The sunk costs presented here only include the spend on the development
of the SRWD scheme, its planning application and this business case, and do not include historic costs or the
costs of developing the wider Central Lancashire Highways and Transport Masterplan or City Deal. In addition,
the sunk costs only include modelling work undertaken to support this business case, and do not include costs
spent on the original development of the CLHTM transport model.
In addition, in line with the requirements of the Major Road Network and Large Local Major Schemes: Submission
for Development Funding Pro-Forma, further preparation costs required to get to Outline Business Case have
been excluded from the Base Costs presented above. These costs are also presented in Table 5.3-i. These costs
include a rebasing exercise to update the CLHTM model to a 2019 base year, as the underlying data used to
calibrate and validate the original 2013 base year will soon pass the 6-year limit required by WebTAG for scheme
appraisal and therefore the model requires updating to support the Outline Business Case.
Table 5.3-i: Spend to date (sunk costs) and further spend to get to Outline Business Case
Heading Spend to date and
expected spend to date
of funding decision
Further spend to get to
Outline Business Case
Data Collection £50,000 £30,0002
Consultation £50,000 £25,0003
Environmental Surveys £250,000 £150,0004
Design £100,000 £250,0003
Planning Application £300,000 £250,0003
Business Case Development £105,000 £60,0004
Tendering/Early Contractor Involvement - £100,0003
CLHTM model rebasing and re-forecasting - £120,0004
Cost Preparation - £25,0003
Independent surveyor’s verification of costs - £22,0005
Project Gateway Review - £50,0005
TOTAL £855,000 £1,082,000
2 Based on Framework Consultant’s estimates of surveys required to update CLHTM model 3 Based on internal LCC staffing costs 4 Based on estimates provided by framework consultants 5 Based on experience from past projects
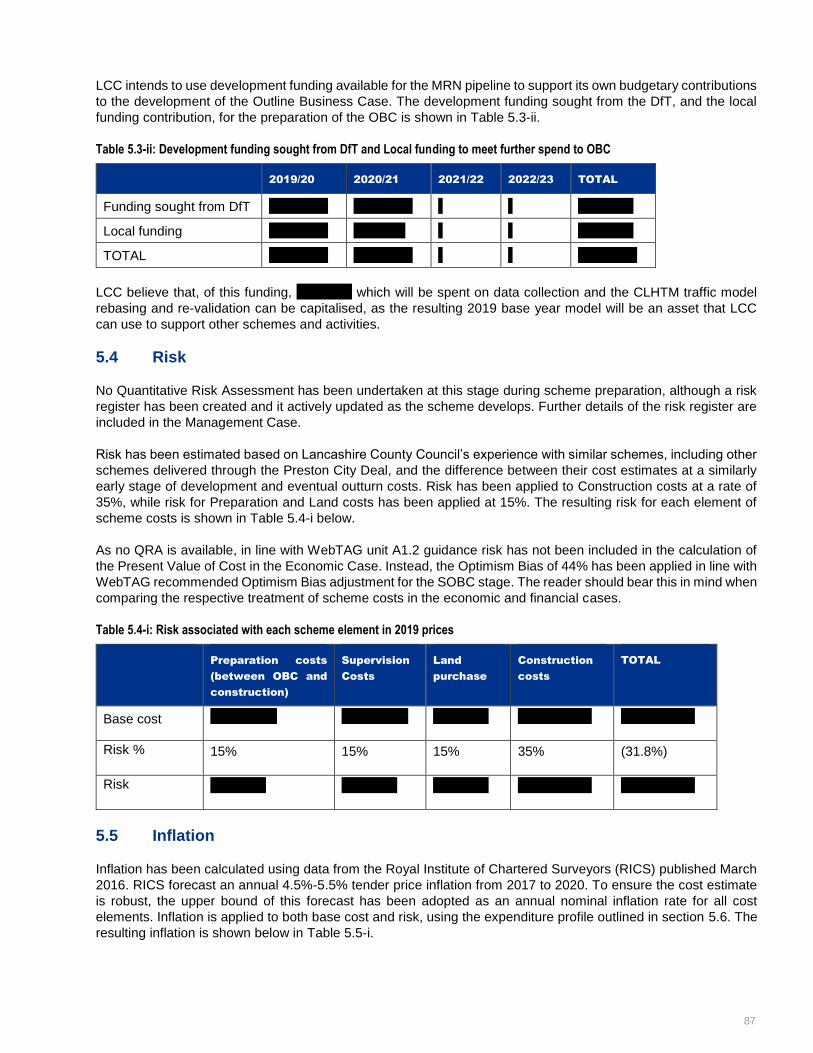
87
LCC intends to use development funding available for the MRN pipeline to support its own budgetary contributions
to the development of the Outline Business Case. The development funding sought from the DfT, and the local
funding contribution, for the preparation of the OBC is shown in Table 5.3-ii.
Table 5.3-ii: Development funding sought from DfT and Local funding to meet further spend to OBC
2019/20 2020/21 2021/22 2022/23 TOTAL
Funding sought from DfT £290,000 £145,000 - - £435,000
Local funding £572,000 £75,000 - - £647,000
TOTAL £862,000 £220,000 - - 1,082,000
LCC believe that, of this funding, £150,000 which will be spent on data collection and the CLHTM traffic model
rebasing and re-validation can be capitalised, as the resulting 2019 base year model will be an asset that LCC
can use to support other schemes and activities.
5.4 Risk
No Quantitative Risk Assessment has been undertaken at this stage during scheme preparation, although a risk
register has been created and it actively updated as the scheme develops. Further details of the risk register are
included in the Management Case.
Risk has been estimated based on Lancashire County Council’s experience with similar schemes, including other
schemes delivered through the Preston City Deal, and the difference between their cost estimates at a similarly
early stage of development and eventual outturn costs. Risk has been applied to Construction costs at a rate of
35%, while risk for Preparation and Land costs has been applied at 15%. The resulting risk for each element of
scheme costs is shown in Table 5.4-i below.
As no QRA is available, in line with WebTAG unit A1.2 guidance risk has not been included in the calculation of
the Present Value of Cost in the Economic Case. Instead, the Optimism Bias of 44% has been applied in line with
WebTAG recommended Optimism Bias adjustment for the SOBC stage. The reader should bear this in mind when
comparing the respective treatment of scheme costs in the economic and financial cases.
Table 5.4-i: Risk associated with each scheme element in 2019 prices
Preparation costs
(between OBC and
construction)
Supervision
Costs
Land
purchase
Construction
costs
TOTAL
Base cost £4,668,000 £2,500,000 £843,369 £41,990,160 £50,001,529
Risk % 15% 15% 15% 35% (31.8%)
Risk £700,200 £375,000 £126,505 £14,696,556 £15,898,261
5.5 Inflation
Inflation has been calculated using data from the Royal Institute of Chartered Surveyors (RICS) published March
2016. RICS forecast an annual 4.5%-5.5% tender price inflation from 2017 to 2020. To ensure the cost estimate
is robust, the upper bound of this forecast has been adopted as an annual nominal inflation rate for all cost
elements. Inflation is applied to both base cost and risk, using the expenditure profile outlined in section 5.6. The
resulting inflation is shown below in Table 5.5-i.
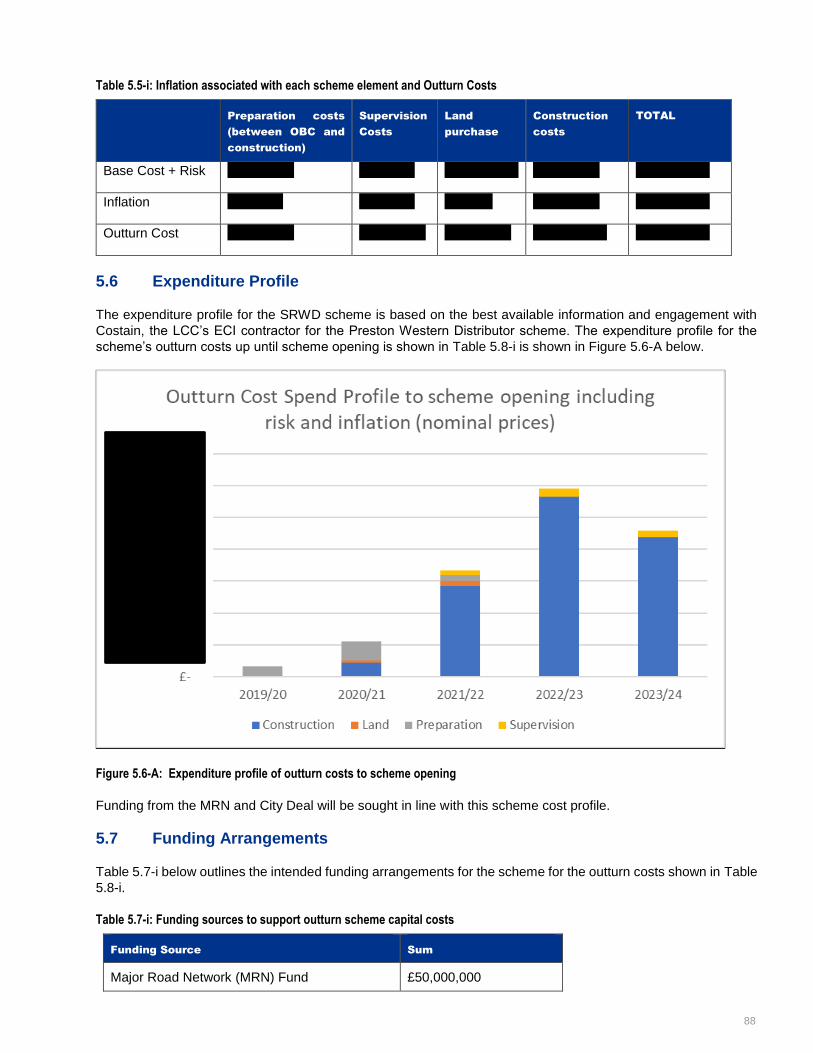
88
Table 5.5-i: Inflation associated with each scheme element and Outturn Costs
Preparation costs
(between OBC and
construction)
Supervision
Costs
Land
purchase
Construction
costs
TOTAL
Base Cost + Risk £5,368,200 £969,875 £56,686,715 £2,875,000 £65,899,790
Inflation £253,901 £559,806 £95,551 £9,986,976 £10,896,234
Outturn Cost £5,622,101 £3,434,806 £1,065,426 £66,673,691 £76,796,024
5.6 Expenditure Profile
The expenditure profile for the SRWD scheme is based on the best available information and engagement with
Costain, the LCC’s ECI contractor for the Preston Western Distributor scheme. The expenditure profile for the
scheme’s outturn costs up until scheme opening is shown in Table 5.8-i is shown in Figure 5.6-A below.
Figure 5.6-A: Expenditure profile of outturn costs to scheme opening
Funding from the MRN and City Deal will be sought in line with this scheme cost profile.
5.7 Funding Arrangements
Table 5.7-i below outlines the intended funding arrangements for the scheme for the outturn costs shown in Table
5.8-i.
Table 5.7-i: Funding sources to support outturn scheme capital costs
Funding Source Sum
Major Road Network (MRN) Fund £50,000,000
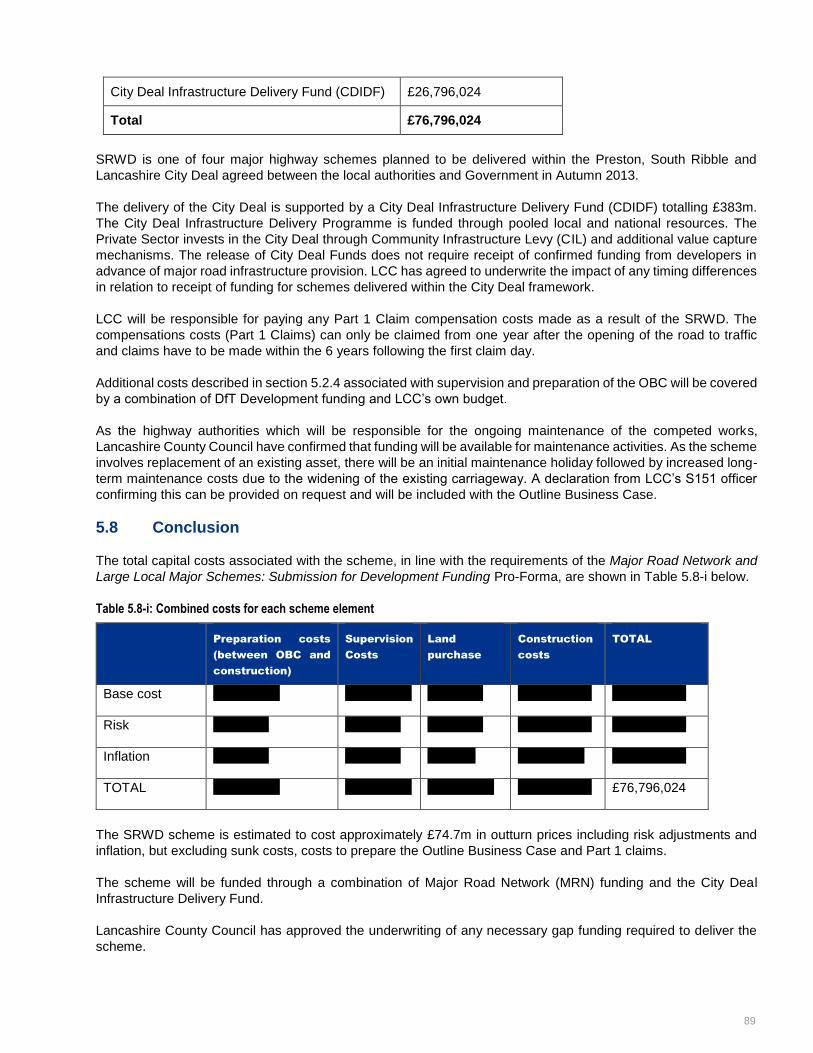
89
City Deal Infrastructure Delivery Fund (CDIDF) £26,796,024
Total £76,796,024
SRWD is one of four major highway schemes planned to be delivered within the Preston, South Ribble and
Lancashire City Deal agreed between the local authorities and Government in Autumn 2013.
The delivery of the City Deal is supported by a City Deal Infrastructure Delivery Fund (CDIDF) totalling £383m.
The City Deal Infrastructure Delivery Programme is funded through pooled local and national resources. The
Private Sector invests in the City Deal through Community Infrastructure Levy (CIL) and additional value capture
mechanisms. The release of City Deal Funds does not require receipt of confirmed funding from developers in
advance of major road infrastructure provision. LCC has agreed to underwrite the impact of any timing differences
in relation to receipt of funding for schemes delivered within the City Deal framework.
LCC will be responsible for paying any Part 1 Claim compensation costs made as a result of the SRWD. The
compensations costs (Part 1 Claims) can only be claimed from one year after the opening of the road to traffic
and claims have to be made within the 6 years following the first claim day.
Additional costs described in section 5.2.4 associated with supervision and preparation of the OBC will be covered
by a combination of DfT Development funding and LCC’s own budget.
As the highway authorities which will be responsible for the ongoing maintenance of the competed works,
Lancashire County Council have confirmed that funding will be available for maintenance activities. As the scheme
involves replacement of an existing asset, there will be an initial maintenance holiday followed by increased long-
term maintenance costs due to the widening of the existing carriageway. A declaration from LCC’s S151 officer
confirming this can be provided on request and will be included with the Outline Business Case.
5.8 Conclusion
The total capital costs associated with the scheme, in line with the requirements of the Major Road Network and
Large Local Major Schemes: Submission for Development Funding Pro-Forma, are shown in Table 5.8-i below.
Table 5.8-i: Combined costs for each scheme element
Preparation costs
(between OBC and
construction)
Supervision
Costs
Land
purchase
Construction
costs
TOTAL
Base cost £4,668,000 £2,500,000 £843,369 £41,990,160 £50,001,529
Risk £700,200 £375,000 £126,505 £14,696,556 £15,898,261
Inflation £253,901 £559,806 £95,551 £9,986,976 £10,896,234
TOTAL £5,622,101 £3,434,806 £1,065,426 £66,673,691 £76,796,024
The SRWD scheme is estimated to cost approximately £74.7m in outturn prices including risk adjustments and
inflation, but excluding sunk costs, costs to prepare the Outline Business Case and Part 1 claims.
The scheme will be funded through a combination of Major Road Network (MRN) funding and the City Deal
Infrastructure Delivery Fund.
Lancashire County Council has approved the underwriting of any necessary gap funding required to deliver the
scheme.
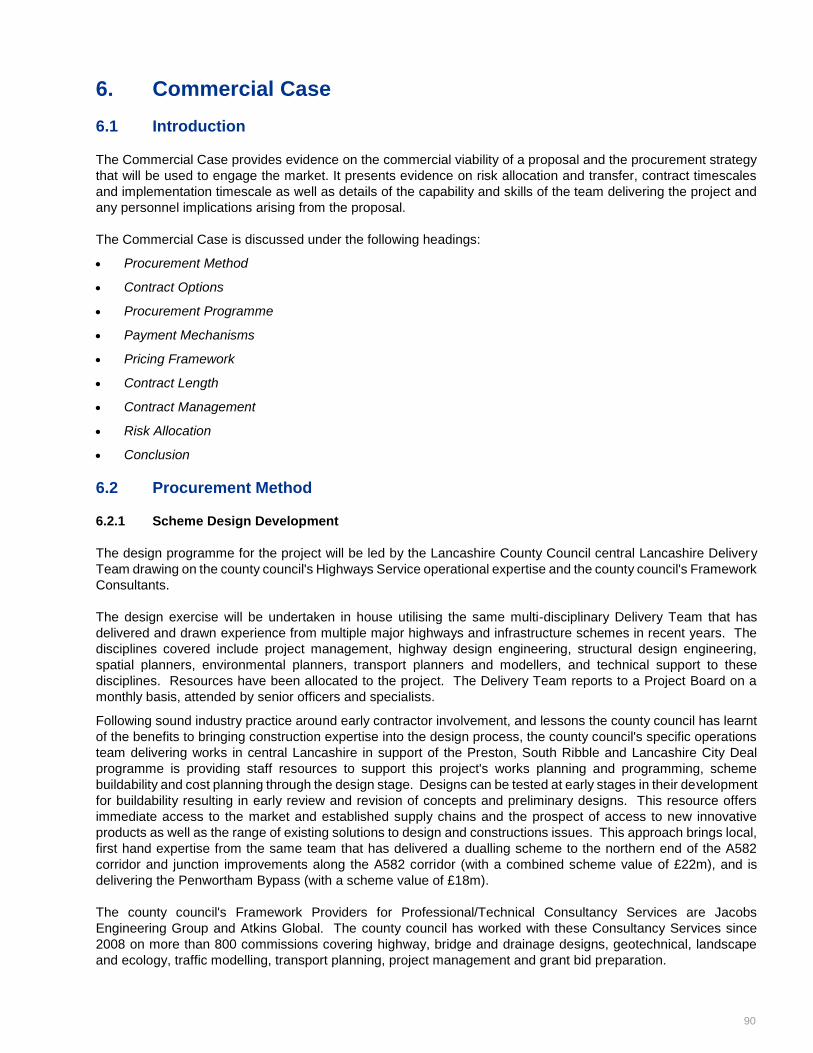
90
6. Commercial Case
6.1 Introduction
The Commercial Case provides evidence on the commercial viability of a proposal and the procurement strategy
that will be used to engage the market. It presents evidence on risk allocation and transfer, contract timescales
and implementation timescale as well as details of the capability and skills of the team delivering the project and
any personnel implications arising from the proposal.
The Commercial Case is discussed under the following headings:
Procurement Method
Contract Options
Procurement Programme
Payment Mechanisms
Pricing Framework
Contract Length
Contract Management
Risk Allocation
Conclusion
6.2 Procurement Method
6.2.1 Scheme Design Development
The design programme for the project will be led by the Lancashire County Council central Lancashire Delivery
Team drawing on the county council's Highways Service operational expertise and the county council's Framework
Consultants.
The design exercise will be undertaken in house utilising the same multi-disciplinary Delivery Team that has
delivered and drawn experience from multiple major highways and infrastructure schemes in recent years. The
disciplines covered include project management, highway design engineering, structural design engineering,
spatial planners, environmental planners, transport planners and modellers, and technical support to these
disciplines. Resources have been allocated to the project. The Delivery Team reports to a Project Board on a
monthly basis, attended by senior officers and specialists.
Following sound industry practice around early contractor involvement, and lessons the county council has learnt
of the benefits to bringing construction expertise into the design process, the county council's specific operations
team delivering works in central Lancashire in support of the Preston, South Ribble and Lancashire City Deal
programme is providing staff resources to support this project's works planning and programming, scheme
buildability and cost planning through the design stage. Designs can be tested at early stages in their development
for buildability resulting in early review and revision of concepts and preliminary designs. This resource offers
immediate access to the market and established supply chains and the prospect of access to new innovative
products as well as the range of existing solutions to design and constructions issues. This approach brings local,
first hand expertise from the same team that has delivered a dualling scheme to the northern end of the A582
corridor and junction improvements along the A582 corridor (with a combined scheme value of £22m), and is
delivering the Penwortham Bypass (with a scheme value of £18m).
The county council's Framework Providers for Professional/Technical Consultancy Services are Jacobs
Engineering Group and Atkins Global. The county council has worked with these Consultancy Services since
2008 on more than 800 commissions covering highway, bridge and drainage designs, geotechnical, landscape
and ecology, traffic modelling, transport planning, project management and grant bid preparation.
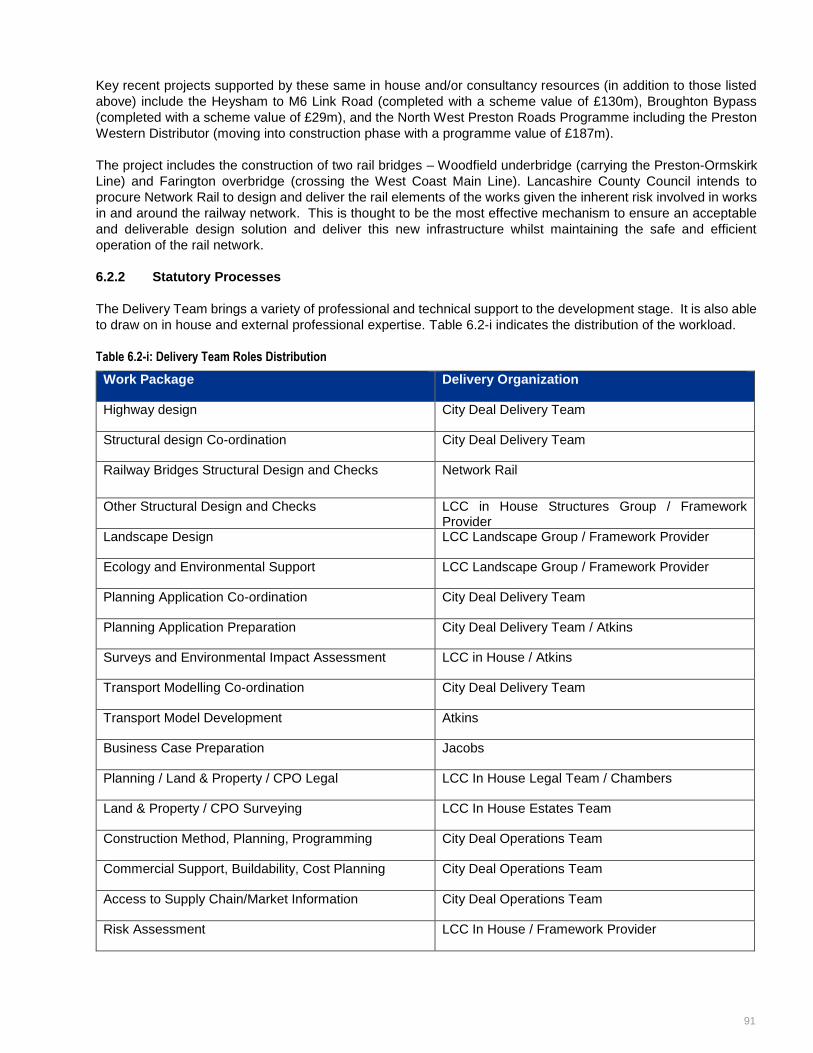
91
Key recent projects supported by these same in house and/or consultancy resources (in addition to those listed
above) include the Heysham to M6 Link Road (completed with a scheme value of £130m), Broughton Bypass
(completed with a scheme value of £29m), and the North West Preston Roads Programme including the Preston
Western Distributor (moving into construction phase with a programme value of £187m).
The project includes the construction of two rail bridges – Woodfield underbridge (carrying the Preston-Ormskirk
Line) and Farington overbridge (crossing the West Coast Main Line). Lancashire County Council intends to
procure Network Rail to design and deliver the rail elements of the works given the inherent risk involved in works
in and around the railway network. This is thought to be the most effective mechanism to ensure an acceptable
and deliverable design solution and deliver this new infrastructure whilst maintaining the safe and efficient
operation of the rail network.
6.2.2 Statutory Processes
The Delivery Team brings a variety of professional and technical support to the development stage. It is also able
to draw on in house and external professional expertise. Table 6.2-i indicates the distribution of the workload.
Table 6.2-i: Delivery Team Roles Distribution
Work Package Delivery Organization
Highway design City Deal Delivery Team
Structural design Co-ordination City Deal Delivery Team
Railway Bridges Structural Design and Checks Network Rail
Other Structural Design and Checks LCC in House Structures Group / Framework Provider
Landscape Design LCC Landscape Group / Framework Provider
Ecology and Environmental Support LCC Landscape Group / Framework Provider
Planning Application Co-ordination City Deal Delivery Team
Planning Application Preparation City Deal Delivery Team / Atkins
Surveys and Environmental Impact Assessment LCC in House / Atkins
Transport Modelling Co-ordination City Deal Delivery Team
Transport Model Development Atkins
Business Case Preparation Jacobs
Planning / Land & Property / CPO Legal LCC In House Legal Team / Chambers
Land & Property / CPO Surveying LCC In House Estates Team
Construction Method, Planning, Programming City Deal Operations Team
Commercial Support, Buildability, Cost Planning City Deal Operations Team
Access to Supply Chain/Market Information City Deal Operations Team
Risk Assessment LCC In House / Framework Provider
92
6.2.3 Construction Strategy
Works will be procured in compliance with the Lancashire County Council Procurement Strategy, national public
sector procurement regulations and the OJEU framework.
The procurement process will be managed by ECC Project Manager and Supervisor with the support of in house
highways engineering, commercial legal and procurement services, and this management will continue into the
contract management phase. The county council will continue to manage the design aspects with the contractor
responsible for construction tasks.
Given the nature of the project, involving works on, and the widening of, the existing highway, works may be
suitable for delivery utilising the County Council's Highways Service. This Service has developed a specific
Operations Team delivering works in central Lancashire in support of the Preston, South Ribble and Lancashire
City Deal programme. This team has already delivered a dualling scheme to the northern end of the A582 corridor
and junction improvements along the A582 corridor (with a combined scheme value of £22m), and is delivering
the Penwortham Bypass (with a scheme value of £18m).
Section 6.2.1 above notes the early involvement of this operations team in the scheme design development,
bringing construction planning and programming, buildability and cost planning expertise. Early understanding of
the construction methodology will support the project's delivery. It will enable construction methods to evolve which
provide a balance between engineering and build efficiency and cost efficacy within the constraints of both the
planning and compulsory purchase process.
Network Rail is responsible for the management of the strategic rail infrastructure and will need to be closely
involved with the delivery of the rail elements of the project. As discussed in section 6.2.1 above, Lancashire
County Council intends to procure Network Rail to deliver rail-based works given the inherent risks involved in
works in and around the railway network.
6.3 Contract Strategy
6.3.1 Contract Options
Where externally contracted, the form of contract used will be the Engineering and Construction Contract (ECC),
part of the New Engineering Contract (NEC3) family of contract documents, the stand form of construction contract
in the UK and in widespread use across Europe. The county council has adopted it as standard for this type of
contract.
The form of contract is not yet developed at this stage but critical to this project will be delivery timescales. It is
therefore anticipated that key contractual clauses will reflect this within the Contract Data of the NEC contract
employed.
There are six main payment options within the ECC
A: Priced contract with Activity Schedule
B: Priced contract with Bill of Quantities
C: Target contract with Activity Schedule
D: Target contract with Bill of Quantities
E: Cost reimbursable contract
F: Management Contract
The NEC/ECC is published in the form of a set of core clauses with a range of main and secondary option clauses
enabling scheme specific contracts to be produced depending on individual requirements. The choice of option is
a balance between risk, apportionment of risk and certainty of cost. The contract options legally define the
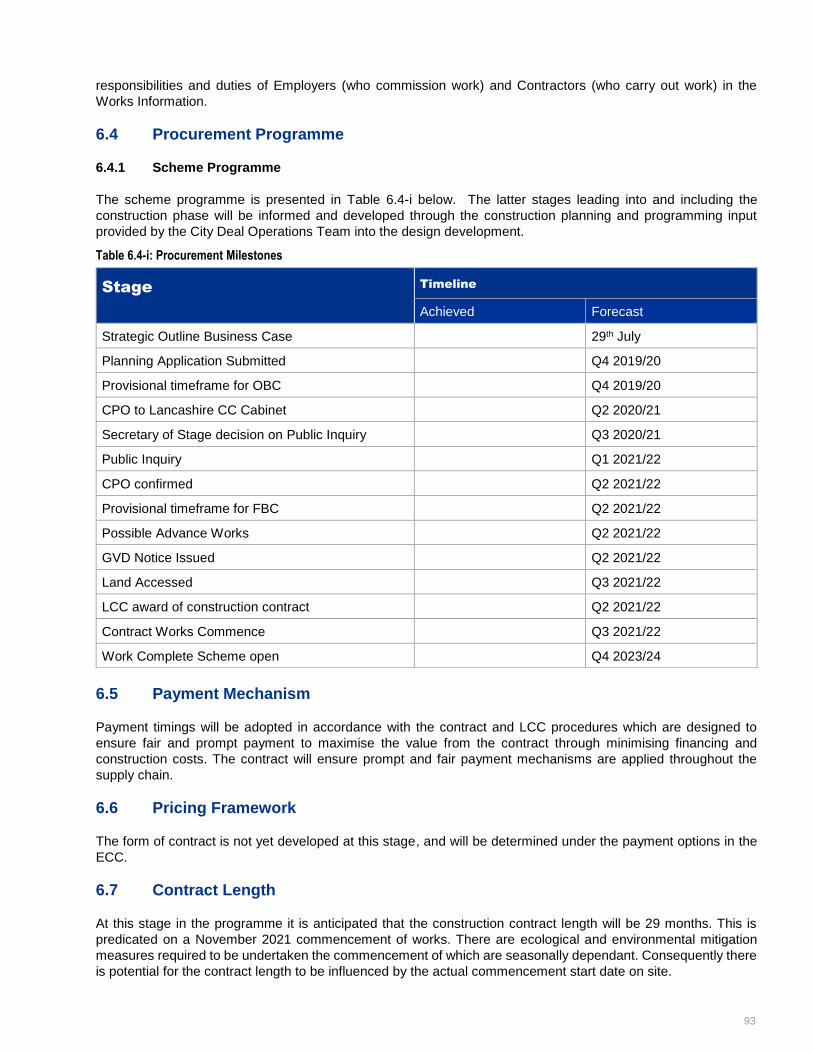
93
responsibilities and duties of Employers (who commission work) and Contractors (who carry out work) in the
Works Information.
6.4 Procurement Programme
6.4.1 Scheme Programme
The scheme programme is presented in Table 6.4-i below. The latter stages leading into and including the
construction phase will be informed and developed through the construction planning and programming input
provided by the City Deal Operations Team into the design development.
Table 6.4-i: Procurement Milestones
6.5 Payment Mechanism
Payment timings will be adopted in accordance with the contract and LCC procedures which are designed to
ensure fair and prompt payment to maximise the value from the contract through minimising financing and
construction costs. The contract will ensure prompt and fair payment mechanisms are applied throughout the
supply chain.
6.6 Pricing Framework
The form of contract is not yet developed at this stage, and will be determined under the payment options in the
ECC.
6.7 Contract Length
At this stage in the programme it is anticipated that the construction contract length will be 29 months. This is
predicated on a November 2021 commencement of works. There are ecological and environmental mitigation
measures required to be undertaken the commencement of which are seasonally dependant. Consequently there
is potential for the contract length to be influenced by the actual commencement start date on site.
Stage Timeline
Achieved Forecast
Strategic Outline Business Case 29th July
Planning Application Submitted Q4 2019/20
Provisional timeframe for OBC Q4 2019/20
CPO to Lancashire CC Cabinet Q2 2020/21
Secretary of Stage decision on Public Inquiry Q3 2020/21
Public Inquiry Q1 2021/22
CPO confirmed Q2 2021/22
Provisional timeframe for FBC Q2 2021/22
Possible Advance Works Q2 2021/22
GVD Notice Issued Q2 2021/22
Land Accessed Q3 2021/22
LCC award of construction contract Q2 2021/22
Contract Works Commence Q3 2021/22
Work Complete Scheme open Q4 2023/24
94
6.8 Contract Management
The County Council has experienced contract management capacity as utilised in the projects identified in section
6.2.1 above. This capacity will be available as the infrastructure delivery moves forward and can be supplemented
if necessary by the County Council's Framework Providers.
The contract management arrangements during the implementation stage will be administered by an ECC Project
Manager and Supervisor and a support team applicable to stage of the works at any one time. The ECC Project
Manager and Supervisor will also provide a site presence to deal with all contract variations/issues and early
warnings/compensation events. The roles for the project will otherwise be as set out in the detail within the Project
Governance section of the Management Case. This approach will also ensure that the construction contract is
programmed and coordinated.
6.9 Risk Allocation
The construction of highways carries a high level of risk due to the significant amount of earthworks, the interaction
with live motorways, railways and waterways and varying weather conditions. Works on or widening existing
highway carries he added risk of interaction with live carriageways.
Risks and associated cost estimates are included in the Risk Register at Appendix L and will be specifically
assessed and assigned depending on which specialist area is best placed to manage them. The register is a live
document and, once the design is appropriately advanced with the highway alignment, drainage strategy and
options for new and replacement structures finalised, will draw on a risk workshop involving multidisciplinary
professions covering all aspects of delivering a scheme of this scale and adjustments to risks, costs and
responsibilities are amended as the detail design progresses.
6.10 Conclusion
The project is on programme for award of a construction contract for the highway elements in July 2021 with a
November 2021 start on site and resources are in place and available to the project to complete the development
stage and all necessary statutory processes to achieve this programme. Risk around the rail elements to the
project is being minimised through procurement of Network Rail to design and build the two rail bridges. There
are no additional personnel requirements for the county council as the skills required to deliver the scheme are
already engaged and committed to the project.
95
7. Management Case
7.1 Introduction
The Management Case assesses whether a proposal is deliverable. It tests the project planning, governance
structure, risk management, assurance, communications and stakeholder management, and plans for monitoring
and evaluation.
There should be a clear and agreed understanding of what needs to be done, why, when and how, with measures
in place to identify and manage any risks. The Management Case sets out a plan to ensure that the benefits set
out in the Economic Case are realised and will include measures to assess and evaluate this.
The Management Case is discussed under the following headings:
Governance
Evidence of Successful Project Delivery
Assurance
Delivery Programme
Risk Management
Communications and Stakeholder Management
Monitoring and Evaluation
Benefits Realisation Plan
Conclusion
7.2 Governance
7.2.1 High Level and Steering Governance
The management of the delivery of the A582 South Ribble Western Distributor Road (SRWD) Dualling is fully
encompassed within the overall accountabilities of the Lancashire Enterprise Partnership in its governance
responsibilities of the Preston, South Ribble and Lancashire City Deal.
The City Deal has been in place since 2013 and has evolved in its structure since its inception. The governance
is best demonstrated by Figure 7.2-A and the chart provided as Appendix O. This explains how through the boards
and teams with clear terms of reference the City Deal infrastructure projects such as the SRWD are managed.
The composition of the boards and teams are indicated and illustrate the distribution of responsibility across the
members.
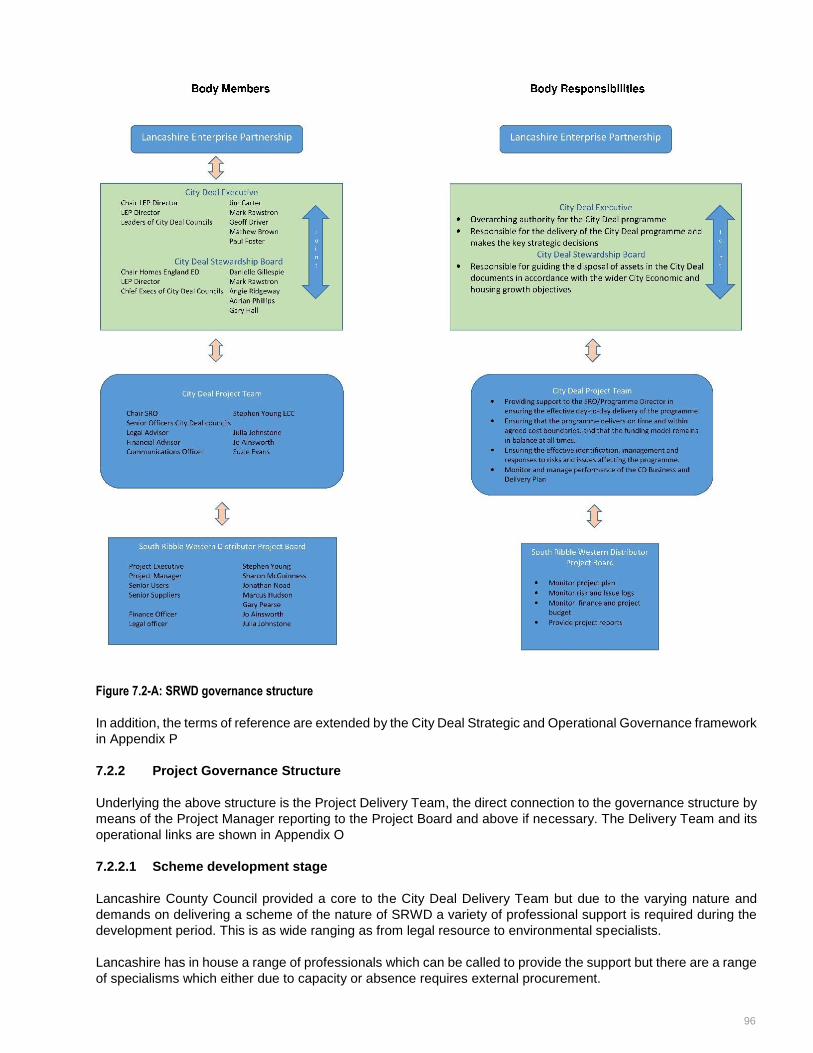
96
Figure 7.2-A: SRWD governance structure
In addition, the terms of reference are extended by the City Deal Strategic and Operational Governance framework
in Appendix P
7.2.2 Project Governance Structure
Underlying the above structure is the Project Delivery Team, the direct connection to the governance structure by
means of the Project Manager reporting to the Project Board and above if necessary. The Delivery Team and its
operational links are shown in Appendix O
7.2.2.1 Scheme development stage
Lancashire County Council provided a core to the City Deal Delivery Team but due to the varying nature and
demands on delivering a scheme of the nature of SRWD a variety of professional support is required during the
development period. This is as wide ranging as from legal resource to environmental specialists.
Lancashire has in house a range of professionals which can be called to provide the support but there are a range
of specialisms which either due to capacity or absence requires external procurement.
97
To fill this gap Lancashire County Council has a framework consultant(s) in place to readily call upon as needs
arise. The consultants are procured following an open tender process in accordance with the relevant regulations
and selected on an 80/20 quality/price basis. The heavy reliance on quality ensured the level of the delivered
products is of the highest excellence. During the life of the project the framework has been retendered. From 2013
– 2017 the service was provided by a single consultant Jacobs Ltd and from 2017 to date two consultants have
provided the service, Jacobs Ltd and Atkins Ltd the former taking all commissions below a predetermined finical
level with higher value commissions being subject to a bidding process.
The organogram shown in Appendix N illustrates how the scheme is being delivered. The distribution of the
workload is provided in the Commercial Case.
7.2.2.2 Strategy During Construction and Beyond
The development of a team which understands the project whilst offering the wide range of professional support
is intended to continue into construction phase and beyond. The appointment of a contractor through the ECC
process will be made. The other support services remain available under the LCC professional services delivery
framework.
7.2.2.3 Forward Delivery Structure
Subject to successfully accomplishing the stages highlighted in the Delivery Programme (Section 7.5) and further
defined in Section 6.4 of the Commercial Case, works will commence on site in November 2021.
In preparation and to ensure smooth transition from the design and preparation phases in to contract and
construction appropriate personnel will be appointed by Senior Responsible Owner (Stephen Young, Executive
Director of Growth Environment Transport and Community Services) to key contractual roles for the county council
who as accountable body will be entering into the construction contract with the awarded contractor.
In line with the selected NEC Contract option, the key roles are Project Manager and Supervisor.
The Project Manager appointed is Sharon McGuinness from Lancashire County Council's Programme Office who
brings a wealth of Project Management experience to the role. This accords with the NEC Guidance which
suggests that in appointing to this role continuance is an essential criterion.
Further to this, the Principal Engineer from the City Deal Delivery Team has been appointed as Supervisor who
will be bringing a depth of design and contractual supervision experience to the role. The supervising team will be
expanded commensurate with the employer's responsibilities on a project of this scale.
7.3 Evidence of Successful Project Delivery
LCC has a strong track record of project delivery. Recent major transport projects demonstrating successful
delivery include:
Heysham to M6 Link Road, the £130m scheme completed in 2017;
Broughton Bypass, the £32m relief road completed in 2017;
Penwortham Bypass, the £20m scheme currently under construction and due for completion in January
2020;
Preston Western Distributor Road, £196m scheme programmed to start construction in late 2019 and
due for completion in 2023; and
A582 Junction Improvements, the £21m improvements on existing single carriageway in preparation for
dualling.
The Heysham scheme completes the long-awaited connection from the Heysham and Morecambe peninsula to
Junction 34 of the M6 and is a 4.8km two lane dual carriageway with a footpath and cycle way along the entire
route.
98
Broughton Bypass is the first of the four schemes delivered through the City Deal Infrastructure Delivery
Programme and largely followed the same project delivery governance structure as the SRWD.
Penwortham Bypass is the second of the City Deal Schemes to reach the construction stage and is directly under
the governance structure of the City Deal and by the City Deal Delivery Team. It has been designed form concept
and taken through the planning process. The land was assembled by agreement without recourse to CPO. The
scheme is currently on programme and on budget for completion in January 2020.
The Preston Western Distributor Road is new dual carriageway in the north west of Preston linking the A583/A584
to the motorway network via a new junction on the M55. This will be the third of the City Deal Schemes to reach
the construction stage in 2019 and is directly under the governance structure of the City Deal and by the City Deal
Delivery Team. Like the Penwortham Bypass the Preston Western Distributor has been designed form concept
and taken through the planning process. The land was assembled through the CPO process. The PWD scheme
has been subject to LEP and DfT assurances through outline and full business case submission and is currently
on programme and on budget for completion in 2023.
The improvements to the A582 are early wins by the City Deal Delivery Team to ease immediate congestion and
facilitate access to housing sites and business opportunities in Preston and South Ribble as a precursor to the full
dualling of the A582 from Cuerden to Preston. This has been achieved under the current City Deal governance.
The lessons learnt from delivery of the above projects both external and within the City Deal Team are shared
across the team to ensure the widespread learning for other projects.
7.4 Assurance
7.4.1 Funding Guarantees
In order to receive funding through the National Roads Fund for the period 2020-2025, schemes need to be able
to demonstrate value for money, deliverability in these timescales and a local or third party contribution of at least
15%, and in the case of schemes benefiting the private sector, especially developers, the Department would
expect a significant contribution. As set out in the Financial Case Lancashire’s Section 151 officer has under-
written the authority’s ability to fund the local contribution to SRWD and any subsequent cost increases post the
granting of remaining funding approval. The release of City Deal Funds does not require receipt of confirmed
funding from developers in advance of major road infrastructure provision. Furthermore, the LCC agreed to
underwrite the impact of any timing difference in relation to receipt of funding for scheme delivered within the City
Deal framework.
7.4.2 External Views on Business Case
Scheme business cases will be published on the website to ensure transparency. The Full Business Case and its
supporting documentation will be made available for inspection and independent assurance by the Independent
Assurance team appointed to review the scheme.
7.4.3 Value for Money
A Value for Money (VfM) statement for SRWD has been produced which summarises the Economic Case for the
scheme and the BCR. The BCR of the SRWD scheme has been assessed as being 2.2, including 44% Optimism
Bias on costs. This represents High VfM.
7.4.4 Monthly Update to Project Board
Monthly update reports are being provided by the SRWD Project Manager to the SRWD Project Board and will
continue through the delivery of the scheme. The reports currently cover scheme design, CPO Process, Funding,
Land and Planning. When funding is secured, and contracts are let, the reports will also cover adherence to
programme and budget, issues and decisions made within the tolerances granted and exceptions.

99
7.5 Delivery Programme
The delivery programme for the scheme is owned by the Project Manager. The programme is reviewed and
updated as necessary prior to formal progress meetings.
Changes to the project programme that could impact upon key milestones within the development and delivery of
the scheme are communicated to the Project Board.
Key milestones for the project are also set out in the City Deal Infrastructure Delivery Plan. The City Deal
Infrastructure Delivery Plan sets out the major activity for the next 36 months. The Key Milestones for the SRWD
are shown in Table 7.5-i.
Table 7.5-i: Key Programme Milestones
Delivery Stage Current position
SOBC Achieved Q2 2019/20
Submission of Planning Application Target Q4 2019/20
Planning Consent Decision Q1 2020/21
OBC Target Q1 2020/21
OBC Approval Target Q2 2020/21
CPO Published Target Q2 2020/21
CPO Inquiry Procedure Target Q1 2021/22
FBC Target Q2 2021/22
Works Commence Target Q3 2021/22
The current detailed scheme programme is shown in Appendix M.
7.6 Risk Management
7.6.1 Risk Management Strategy
Risks associated with delivery of the LEP investment programme are managed according to the overall monitoring
responsibilities set out in the LEP’s Accountability Framework. This Framework requires risk registers to be
produced and maintained for individual schemes once approved.
The Steering Group has overall responsibility for governance and risk associated with the delivery of the SRWD
scheme. It is responsible for managing and overseeing the risk management strategy and where appropriate
agreeing and undertaking actions to mitigate key risks. The Project Manager is responsible for maintaining and
updating a Quantified Risk Register and planning for mitigating any risks which do not require escalation. The
project and City Deal programme governance structures outlined earlier in this chapter show the arrangements
for decision making and approvals including the responsibilities regarding risk on SRWD are clearly defined.
7.6.2 SRWD Risk Register
A quantified risk assessment (QRA) for the SRWD will be undertaken by LCC and the appointed ECC contractor
in order to determine the amount of risk to be applied to the base costs. The QRA will include all types of risk
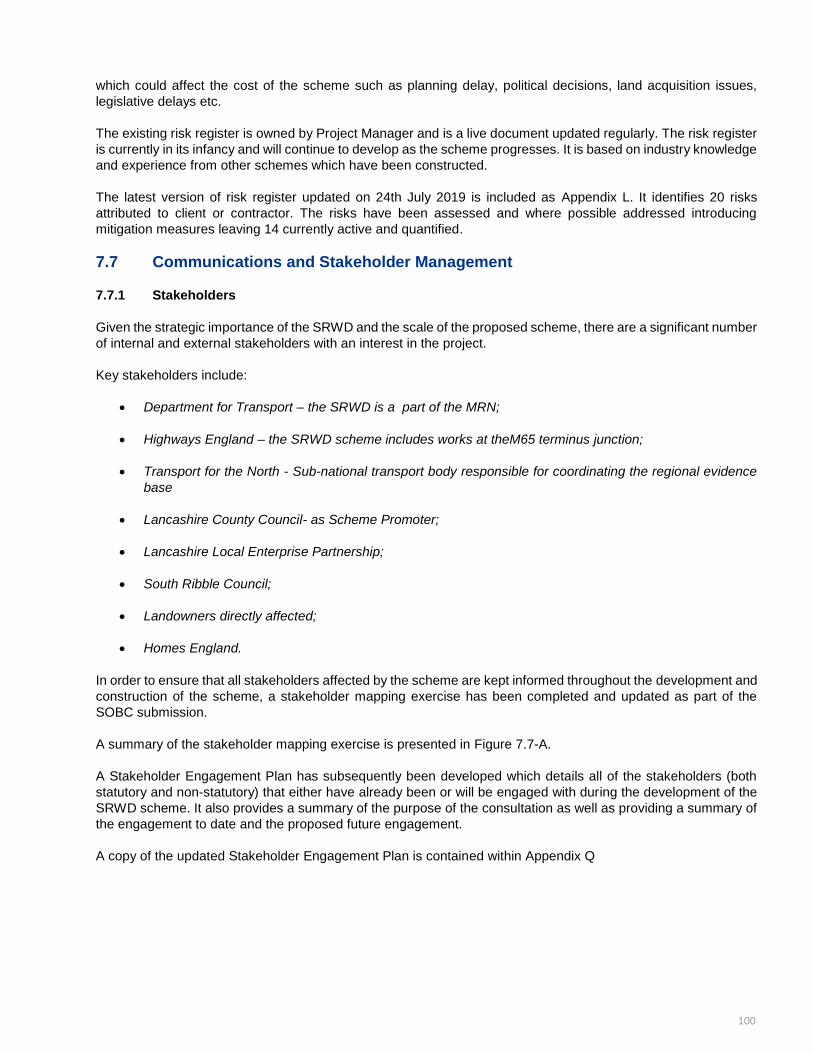
100
which could affect the cost of the scheme such as planning delay, political decisions, land acquisition issues,
legislative delays etc.
The existing risk register is owned by Project Manager and is a live document updated regularly. The risk register
is currently in its infancy and will continue to develop as the scheme progresses. It is based on industry knowledge
and experience from other schemes which have been constructed.
The latest version of risk register updated on 24th July 2019 is included as Appendix L. It identifies 20 risks
attributed to client or contractor. The risks have been assessed and where possible addressed introducing
mitigation measures leaving 14 currently active and quantified.
7.7 Communications and Stakeholder Management
7.7.1 Stakeholders
Given the strategic importance of the SRWD and the scale of the proposed scheme, there are a significant number
of internal and external stakeholders with an interest in the project.
Key stakeholders include:
Department for Transport – the SRWD is a part of the MRN;
Highways England – the SRWD scheme includes works at theM65 terminus junction;
Transport for the North - Sub-national transport body responsible for coordinating the regional evidence
base
Lancashire County Council- as Scheme Promoter;
Lancashire Local Enterprise Partnership;
South Ribble Council;
Landowners directly affected;
Homes England.
In order to ensure that all stakeholders affected by the scheme are kept informed throughout the development and
construction of the scheme, a stakeholder mapping exercise has been completed and updated as part of the
SOBC submission.
A summary of the stakeholder mapping exercise is presented in Figure 7.7-A.
A Stakeholder Engagement Plan has subsequently been developed which details all of the stakeholders (both
statutory and non-statutory) that either have already been or will be engaged with during the development of the
SRWD scheme. It also provides a summary of the purpose of the consultation as well as providing a summary of
the engagement to date and the proposed future engagement.
A copy of the updated Stakeholder Engagement Plan is contained within Appendix Q
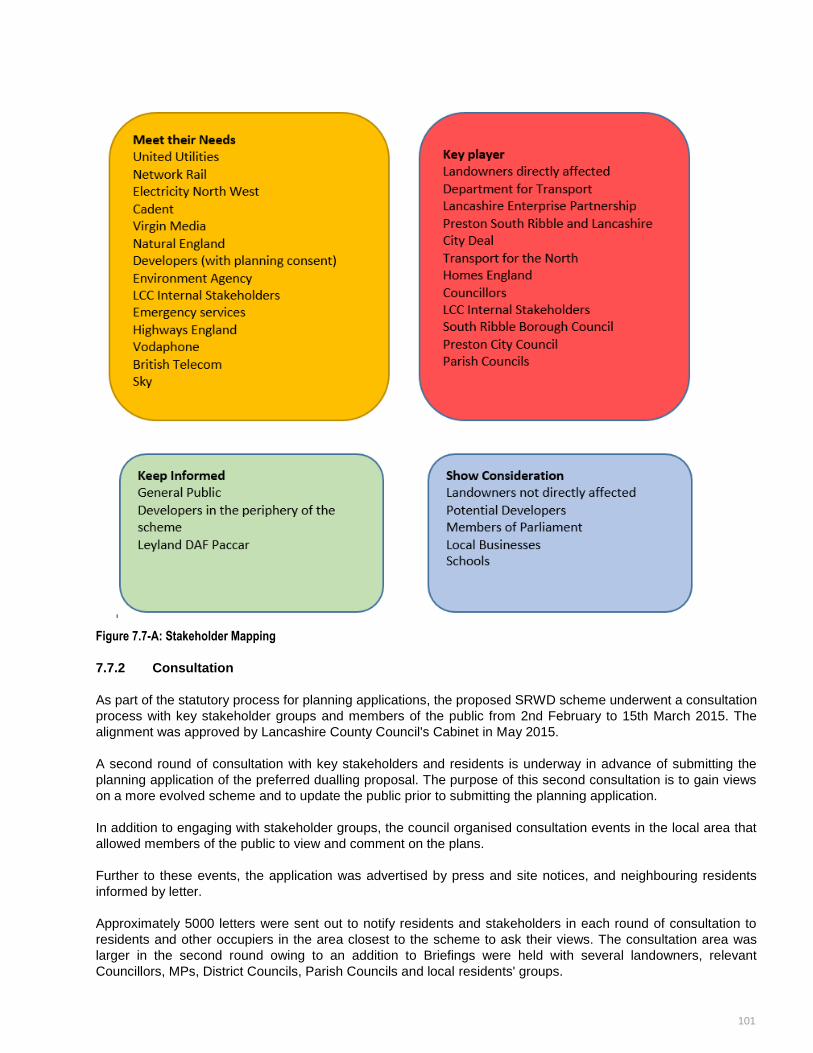
101
Figure 7.7-A: Stakeholder Mapping
7.7.2 Consultation
As part of the statutory process for planning applications, the proposed SRWD scheme underwent a consultation
process with key stakeholder groups and members of the public from 2nd February to 15th March 2015. The
alignment was approved by Lancashire County Council's Cabinet in May 2015.
A second round of consultation with key stakeholders and residents is underway in advance of submitting the
planning application of the preferred dualling proposal. The purpose of this second consultation is to gain views
on a more evolved scheme and to update the public prior to submitting the planning application.
In addition to engaging with stakeholder groups, the council organised consultation events in the local area that
allowed members of the public to view and comment on the plans.
Further to these events, the application was advertised by press and site notices, and neighbouring residents
informed by letter.
Approximately 5000 letters were sent out to notify residents and stakeholders in each round of consultation to
residents and other occupiers in the area closest to the scheme to ask their views. The consultation area was
larger in the second round owing to an addition to Briefings were held with several landowners, relevant
Councillors, MPs, District Councils, Parish Councils and local residents' groups.

102
Consultation events were held at Farington Moss, Leyland, Lostock Hall and Penwortham on 2nd, 5th, 9th and
11th February 2015. These were attended by staff from the City Deal Delivery Team and Estates Management to
answer any queries. Poster boards were provided to show the proposed road alignment and supporting
information on the scheme design and timescales. Leaflets and questionnaires were available at all events. 186
people in total attended the three events.
In response to the letters to residents, exhibitions, press articles and social media, 407 responses were received.
Respondents included local residents, parish councils, developers and other statutory service providers. In total
89% (361) individuals/public and approx. 6% (23) organisations responded by questionnaire.
The most frequently raised concerns included:
Air and noise pollution concerns
Design and alignment of the proposals
Perceived Increased Congestion
Provision of cycleways and footways
In response to these concerns the scheme has implemented a number of actions. These include: observing and
reporting effects within the Environmental Assessment Report, the screening of options where available, and
where possible the mitigation of impacts. Further detail on the consultation events, stakeholder engagement, and
the responses to issue raised can be found in the Consultation Report (Appendix C).
A pre-planning application consultation commenced on the 24 July 2019 which is ongoing and the outcome and
comments are still being collated. For the 2019 consultation the comments have mainly raised specific detailed
design queries as to how parts of the draft proposals will impact them on subject matters such as future traffic
volumes; junction design, tree loss and landscaping. The outcome of comments and suggestions for both the
2015 and the 2019 will be considered in-combination prior to planning application submission.
7.7.3 City Deal Communications and Marketing Strategy
The communications strategy for the project is framed within the wider communications strategy for the City Deal.
The City Deal Communications and Marketing Strategy have been developed to:
Ensure a consistent approach to all external communications activities relating to the City Deal;
Effectively engage with appropriate stakeholder groups; and
Raise the profile of the City Deal area, and its impact on the Lancashire economy, on a local, regional and
national level.
The proposed overarching approach and activities have been identified by communications staff from Lancashire
County Council, Preston City Council, South Ribble Borough Council and Homes England. They are intended to
establish foundations for successful communication of the implementation phase and have been directly
influenced by the schedule of work outlined in the Infrastructure Delivery Plan (including the South Ribble Western
Distributor).
7.7.4 Approach
A partnership approach to communications activity during the lifetime of the City Deal requires a close working
relationship on communications between the three councils with input from the Homes England, LEP, government
departments and other partners where appropriate, reflecting the arrangements for delivering the programme
overall. The activities within the plan are led by the three councils with the support of the City Deal Delivery Team.
These activities will be reviewed annually throughout the City Deal lifetime.
In keeping with best practice communications and value for money principles, the overall approach will have a
clear focus on achieving measurable results. Detailed proactive planning ensures that objectives and targets are

103
set and regularly measured against. Updates and reports against these objectives are provided back to the City
Deal Delivery Team, Programme Board, Executive and Stewardship Board.
The scheme has reached a specific stage as it progresses towards submission of the Planning Application and is
currently undertaking a 6 week public consultation. A communication strategy for this stage of the project has
been developed by the county councils' communication team.
The county councils’ communications team in association with the partner's communications officers and the ECC
contractor once appointed will also develop the strategy to construction commencing and throughout the
construction period.
7.7.5 Audiences
Communications key audience groups consist of:
Business and business groups - both existing and future;
Residents and wider public;
Councillors;
Campaign groups;
Statutory groups;
Government - at local and central level;
Developers, house-builders and land owners;
Investors;
Partners, e.g. Lancashire Enterprise Partnership, Homes England, Highways England, other Councils,
and Media.
7.8 Monitoring and Evaluation
A Monitoring and Evaluation plan in line with the Lancashire LEP Growth Deal Monitoring and Evaluation guidance will be developed as the scheme progresses giving further detail of how the scheme inputs, outputs and outcomes are to be monitored. As such, the plan will include the following:
Process Evaluation
- Scheme Delivery Process;
- Delivered Scheme; and
- Outturn Costs.
Impact Evaluation
- Scheme Objectives;
- Travel Demand;
- Travel Times & Reliability;
- Impacts on the Economy;
- Impacts on Carbon;
- Impacts on Noise;
- Impacts on Local Air Quality; and,

104
- Impacts on Accidents
Economic Evaluation
- Outturn Appraisal Assumptions
The Monitoring and Evaluation plan will outline the data collection that will be required to inform each of the evaluation metrics, together with an indication of when the data collection would be required within the monitoring and evaluation period.
The indicative timescales for monitoring and evaluation will be based upon the current programmed opening of the scheme in March 2024. Therefore, 1 year after surveys would be undertaken in neutral months in late 2025, with the 4 to 5 years after surveys in late 2029 in the same neutral months.
The Monitoring and Evaluation plan will also set out the proposed Governance arrangements to be adopted as part of the Monitoring and Evaluation strategy. It will provide details of the key personnel responsible for each aspect of the scheme evaluation, the reporting lines and information dissemination.
The One Year After and the Final Monitoring and Evaluation reports will be disseminated to the Project Board, the DfT, the LEP and key stakeholders by the Evaluation Manager.
7.9 Benefit Realisation Plan
A Benefits Realisation Plan (BRP) will be developed for the SRWD scheme.
The purpose of a BRP is to enable the benefits that are expected to be derived by a project to be identified, tracked
and compared to those that were predicted. A BRP details the key activities that are required to manage the
successful realisation of the benefits (i.e. what needs to be done, when and by whom).
7.10 Conclusion
The Management Case for SRWD scheme demonstrates that robust project governance and assurance
frameworks have been established.
A detailed scheme delivery programme has been produced and will be owned by the Project Manager.
A risk register has been developed which has a ‘risk owner’ allocated to each risk.
Lancashire County has successfully delivered four major schemes recently and has a proven record in delivering
them on time and within budget.
The communications strategy for the project is framed within the wider communications strategy for the City Deal
and a project specific Stakeholder Engagement Plan is in place. Early stakeholder and public consultation has
already been undertaken whilst a second round of consultation related to the planning permission and land
acquisition is ongoing.
An Outline Monitoring and Evaluation Plan will be produced in line with Lancashire LEP Growth Deal Monitoring
and Evaluation guidance.

Appendix A. Scheme Drawings

Appendix B. A582 Business Case Option Assessment Report – June 2019

Appendix C. A582 Road Widening Consultation Report - May 2015
Appendix D. Draft Central Lancashire Transport and Highways Master Plan Consultation Report - March 2013

Appendix E. Economic Assessment Report – July 2019

Appendix F. CLHTM Local Model Validation Report– April 2019

Appendix G. Addendum to CLHTM Local Model Validation Report – July 2019

Appendix H. Traffic Forecasting Report – July 2019

Appendix I. Appraisal Summary Table – July 2019

Appendix J. Distributional Impacts

Appendix K. Cost Estimate

Appendix L. A582 Risk and Issue Log

Appendix M. A582 Scheme Programme (July 2019)

Appendix N. A582 Organogram

Appendix O. A582 Governance Structure

Appendix P. City Deal Strategic and Operational Governance

Appendix Q. A582 Stakeholder Management Plan