strategic plan for puerto nuevo inland port volume 4 ... · airport. europort vatry was...
TRANSCRIPT

THE TIOGA GROUP
Strategic Plan forPuerto Nuevo Inland Port
Volume 4Inland Port Case Studies
Prepared for:
PUERTO NUEVO OFFICEPIMA ASSOCIATION OF GOVERNMENTS
CITY OF TUCSON
Final –April 26, 2007
042607 Puerto Nuevo Report Vol 4 Final Page iTHE TIOGA GROUP
Contents
CASE STUDY FINDINGS 1
1. VIRGINIA INLAND PORT 8
2. METROPORT, NEW ZEALAND 14
3. ALLIANCE TEXAS LOGISTICS PARK 18
4. THE PORT OF HUNTSVILLE, AL 23
5. RICKENBACKER AIRPORT COLUMBUS INLAND PORTS 29
6. LOGPORT, DUISBURG, GERMANY 35
7. JOLIET ARSENAL DEVELOPMENT AUTHORITY (JADA) 38
8. GLOBAL III INTERMODAL TERMINAL, ROCHELLE, IL 43
9. PORT OF QUINCY, WA 47
10. CALIFORNIA INTEGRATED LOGISTICS CENTER, SHAFTER, CA 50
11. NEOMODAL, STARK COUNTY, OHIO 53
12. DETROIT INTERMODAL FREIGHT TERMINAL (DIFT) 56
13. PORT OF MONTANA 61
14. EUROPORT VATRY, FRANCE 64
15. SAN BERNARDINO INTERNATIONAL AIRPORT 66
16. KELLY USA/PORT SAN ANTONIO 68
17. SOUTHERN CALIFORNIA LOGISTICS AIRPORT 72
18. MARCH GLOBALPORT 75
19. GLOBAL TRANSPARK 78
20. NY/NJ PORT INLAND DISTRIBUTION NETWORK 84
21. HEARTLAND CORRIDOR 91
22. NORTH AMERICAN INLAND PORTS NETWORK (NAIPN) 97
23. ALBANY, NY BARGE SERVICE 100
24. WORCESTER-KEARNY RAIL SHUTTLE 103
25. RICHARDS-GEBAUR ITC DEVELOPMENT 107
26. PORT OF BATTLE CREEK, MI 110
27. KINGMAN INTERNATIONAL TRADE PROCESSING CENTER 111
28. GREATER YUMA PORT AUTHORITY 114
29. KC SMARTPORT 116
042607 Puerto Nuevo Report Vol 4 Final Page iiTHE TIOGA GROUP
ExhibitsExhibit 1: VIP Market Area........................................................................................................... 8Exhibit 2: VIP Site ......................................................................................................................... 9Exhibit 3: VIP Tariff Rates, February 2006................................................................................. 10Exhibit 4: VIP Location ............................................................................................................... 11Exhibit 5: Metroport Auckland, NZ.............................................................................................. 14Exhibit 6: Metroport Facility Plan ................................................................................................ 15Exhibit 7: Preactor Scheduling System........................................................................................ 16Exhibit 8: Metroport Cargo Growth ............................................................................................. 17Exhibit 9: Alliance Logistics Park ............................................................................................... 18Exhibit 10: BNSF Alliance .......................................................................................................... 20Exhibit 11: Mid-Texas Intermodal Terminals ............................................................................. 21Exhibit 12: Port of Huntsville Market Region.............................................................................. 23Exhibit 13: Huntsville International Intermodal Center ............................................................... 24Exhibit 14: Jetplex Planned Industrial Development.................................................................... 25Exhibit 15: Regional Auto Plants ................................................................................................ 26Exhibit 16: Columbus Location ................................................................................................... 29Exhibit 17: Columbus “Inland Ports”.......................................................................................... 30Exhibit 18: Duisport...................................................................................................................... 35Exhibit 19: Logport Before (Left) and After ................................................................................ 36Exhibit 20: Joliet Arsenal Location ............................................................................................. 38Exhibit 21: Logistics Park Chicago ............................................................................................. 39Exhibit 22: Cal Cartage LPC Warehouse ..................................................................................... 40Exhibit 23: CIC Customers.......................................................................................................... 41Exhibit 24: Rochelle Rail Development Site ................................................................................ 43Exhibit 25: UP Intermodal Terminals in Greater Chicago ........................................................... 44Exhibit 26: Rochelle Highway Access ......................................................................................... 45Exhibit 27: Port of Quincy Location............................................................................................ 47Exhibit 28: Quincy Industrial Park 1 ........................................................................................... 48Exhibit 29: Quincy Industrial Park 2 ........................................................................................... 48Exhibit 30: Port of Quincy Industrial Park .................................................................................. 49Exhibit 31: Shafter CILC Site....................................................................................................... 50Exhibit 32: Shafter Project Site..................................................................................................... 51Exhibit 33: Neomodal Location.................................................................................................... 53Exhibit 34: Neomodal Terminal ................................................................................................... 54Exhibit 35: Detroit Intermodal Terminals..................................................................................... 57Exhibit 36: Livernois Yard Expanded Terminals ......................................................................... 59Exhibit 37: Montana Project Sites ................................................................................................ 61Exhibit 38: Port of Montana ......................................................................................................... 62

042607 Puerto Nuevo Report Vol 4 Final Page iiiTHE TIOGA GROUP
Exhibit 39: Europort Vatry, France .............................................................................................. 64Exhibit 40: SBIAA and Alliance California ................................................................................ 66Exhibit 41: Kelly Air Force Base.................................................................................................. 68Exhibit 42: Port San Antonio........................................................................................................ 69Exhibit 43: SCLA Plan ................................................................................................................ 72Exhibit 44: SCLA Location ......................................................................................................... 73Exhibit 45: March GlobalPort...................................................................................................... 76Exhibit 46: Inland Empire Cargo Airports.................................................................................... 77Exhibit 47: Global TransPark and Southeastern NC ................................................................... 78Exhibit 48: Current Global TransPark Site Plan.......................................................................... 79Exhibit 49: Global TransPark Market Reach................................................................................ 82Exhibit 50: Port Inland Distribution Network ............................................................................. 85Exhibit 51: PANYNJ ExpressRail Projects .................................................................................. 87Exhibit 52: Regional Rail Projects............................................................................................... 88Exhibit 53: Heartland Corridor .................................................................................................... 91Exhibit 54: Heartland Corridor Projects ...................................................................................... 92Exhibit 55: Portsmouth Rail Projects........................................................................................... 93Exhibit 56: Western Freeway Rail Corridor ................................................................................ 93Exhibit 57: Roanoke and Prichard Terminals.............................................................................. 95Exhibit 58: Heartland Corridor Funding...................................................................................... 96Exhibit 59: North America SuperCorridor .................................................................................. 97Exhibit 60: Trans-Texas Corridor................................................................................................. 99Exhibit 61: Albany Express Barge............................................................................................. 100Exhibit 62: Albany Barge Location ........................................................................................... 101Exhibit 63: South Kearny Terminal ............................................................................................ 103Exhibit 64: Intransit Container Terminal .................................................................................... 104Exhibit 65: Stackbridge Intermodal Terminal ............................................................................ 105Exhibit 66: Rail Shuttle Route ................................................................................................... 105Exhibit 67: Richards-Gebaur Redevelopment Site .................................................................... 107Exhibit 68: Kingman AZ Site ..................................................................................................... 111Exhibit 69: Trade Volume Map .................................................................................................. 112Exhibit 70: LA/LB Port Rail Data .............................................................................................. 112Exhibit 71: Arizona Population by County................................................................................. 113Exhibit 72: Yuma Project Site .................................................................................................... 114
042607 Puerto Nuevo Report Vol 4 Final Page 1THE TIOGA GROUP
Case Study Findings
Introduction
This report volume presents 29 case studies of inland ports and related developments. Althoughthe projects differ widely they have one key element in common: the goal of developingeconomic activity around transportation infrastructure at inland points.
These case studies were chosen on the basis of their analytic and instructive value. No claim ismade that this list is exhaustive.
The information presented here was drawn from a variety of sources, including industrypublications, project Web sites, staff and consultant reports, presentations, and personal contacts.The availability of information is inevitably uneven.
The case studies have been organized into groups.
Satellite Marine Terminals
Virginia Inland Port
Metroport, New Zealand
Satellite marine terminals are the only type of inland ports that act as extensions of specificseaports. Both Virginia Inland Port and Metroport in New Zealand are owned and operated bythe Ports of Virginia (Norfolk) and Tauranga. Both are connected to their parent ports by railintermodal shuttles.
Multimodal Logistics Parks
Alliance, Texas
Port of Huntsville, Alabama
Rickenbacker/Columbus Inland Ports
Logport, Duisburg Germany
These developments have used multi-modal infrastructure (air-rail-truck, or sea-rail-truck) as thecore of business/industrial parks. Whereas conventional business or industrial parks seek officebuildings or manufacturers as “anchor tenants,” these “logistics parks” use the transportationinfrastructure as a selling point. These developments have much in common with the shippers,consignees, and ancillary businesses that surround seaports. They are “inland ports” without being extensions of seaports.
Rail Intermodal Parks
Joliet Arsenal (JADA)
Global III, Rochelle, IL
Port of Quincy, WA
042607 Puerto Nuevo Report Vol 4 Final Page 2THE TIOGA GROUP
CILC, Shafter, CA
Neomodal, Stark Co., Ohio
Detroit Intermodal Freight Terminal
Port of Montana
Almost all rail intermodal terminals are built and owned by the railroads. In very few cases havepublic or public/private agencies created intermodal terminals in the hopes of encouragingdevelopment in the same manner as the multimodal logistics parks. Of the rail intermodalinitiatives, only the Joliet Arsenal project has attracted significant new business developmentbeyond the terminal itself. Some of the other projects have achieved modest progress to date,some are dormant, and some have yet to start.
Logistics Airports
Europort Vatry (France)
San Bernardino International
Kelly USA/Port of San Antonio, TX
Southern California Logistics Airport (Victorville)
March Global Port
Global TransPark
These “logistics airport” developments have as their core an all-cargo (or primarily cargo)airport. Europort Vatry was purpose-built, Global TransPark converted Kingston RegionalAirport, and the others are former military air bases. (Rickenbacker, Huntsville, and AllianceTexas also have cargo airports and have rail intermodal terminals as well.) Some of these effortshave attracted significant logistics-based development, notably Europort Vatry. Others haveprimarily attracted aircraft industry firms with a need for runway access.
Networks and Corridors
PANYNJ Port Inland Distribution Network
Heartland Corridor
North American Inland Ports Network
These projects link together inland ports, seaports, and related developments into operatingnetworks or corridors. Some of the other case study developments, for example, are part of theHeartland Corridor or the North American Inland Port Network. These networks and corridorshave been included to illustrate the potential of linking individual initiatives.
Shuttle Services
Albany, NY Barge Service
Worcester-Keary Rail Shuttle

042607 Puerto Nuevo Report Vol 4 Final Page 3THE TIOGA GROUP
Since rail or barge shuttles are an integral part of many inland port concepts, these two casestudies of the shuttles themselves (rather than of the facilities they serve) have been included inthis Appendix. The Albany Barge Shuttle has been discontinued; the Worcester-Keary railshuttle continues to operate.
Trade Processing Centers
Richards-Gebaur
Port of Battle Creek
Kingman, AZ ITPC
Greater Yuma Port Authority
U.S. Customs and Border Protection has encouraged the concept of International TradeProcessing Centers (ITPCs) to shift some of the trade-related activity away from congested portsand border crossings. The case studies presented here involve proposed ITPCs; none have beenbuilt or are in operation. These proposals differ from the others in that the developmentattraction is presumed to be a regulatory function - “trade processing”- that requires a physicallocation rather than a transportation or logistics function.
Economic Development Initiatives
KC SmartPort
KC SmartPort is unique among the case studies as not involving a specific facility or site. KCSmartPort is an economic development initiative designed to bring business to Kansas City byvirtue of the area’s transportation and logistics capabilities.
Findings: Realistic Market Assessment
The lack of a market assessment was a critical factor in the failure of the Neomodal project, andwas probably a significant factor in the failure of the Port of Montana and Shelby, Montanaprojects. While a market assessment was prepared for the Albany, NY, barge service, the largedisparity between expectation and results suggests that the assessment was not realistic. TheKingman, Yuma and Shafter efforts appear to lack formal market assessments. Unless remedied,this shortfall greatly increases the risk associated with those projects.
A thorough and realistic market assessment is the foundation for a reliable business plan. Such amarket assessment should cover at least these basic points:
Identification of the customer base for the services to be offered. In a complexfield such as intermodal freight transportation, it is particularly important toestablish exactly who would buy the services or use the facilities, how many suchcustomers exist, and where they are located.
Estimation of total market size. If every potential customer took everyopportunity to use the services offered, what would be the total volume?

042607 Puerto Nuevo Report Vol 4 Final Page 4THE TIOGA GROUP
Documentation of customer decision factors and priorities. How do customersmake their choices, and what is important to them? How do they balance cost,speed, reliability, convenience, simplicity, etc.?
Analysis of competition and competitive response. What other choices does thecustomer have? What are the competition’s strengths and weaknesses? How will the competition respond to the project?
Estimation of market share and volume growth. Any new service or facilitymust progress from start-up to maturity, gradually fulfilling its market potential.Implicitly assuming that the new service or facility will serve the entire potentialmarket is a common mistake. It is also easy to ignore the adverse scaleeconomies of small start-up volumes in large new facilities.
Identification of outside influences and risk factors. Exogenous factorsaffecting the success of an “inland port” project could include fuel prices, ocean carrier routing practices, shipper relocation, competing projects, etc. Sensitivityanalysis is the most common technique for this task.
Findings: Reality Checks
The commercial world of freight transportation and logistics is complex and changing. Even themost rigorous staff or consultant analytic efforts must be subjected to “reality checks” through contacts with potential customers, contractors, vendors, competitors, and other stakeholders.“Ivory tower” plans are inherently riskydue to potential differences between public aspirationsand commercial realities..
Involving commercial entities from the start is one way of maintaining contact with commercialrealities. Several case studies note the importance of willing railroad participation. If railroads,ocean carriers, or other key participants are unwilling to participate, the project sponsors shouldfind that out at the beginning of the planning stage, not after a facility has been built.
Examples of analytic steps that require reality checks include:
The use of averages for distances, costs, rates, or other key variables when thedistribution of real-world values is skewed or bifurcated.
The use of past data that do not reflect significant recent real world changes.
Assuming that competitors and other outside influences will maintain currentbusiness patterns and practices.
In each case, the lack of a reality check can set the project up for failure.
Findings: Project “Champions”
Public agencies are rarely structured to initiate, build and manage projects that must compete inthe commercial world. The exceptions are usually port and airport authorities, and the case

042607 Puerto Nuevo Report Vol 4 Final Page 5THE TIOGA GROUP
studies for VIP, Huntsville and Metroport illustrate the successful “championing” of such agencies in inland port projects.
Public agencies created for the express purpose of developing and promoting an inland port orlogistics airport have often been less successful. The Neomodal, Port Montana, Shelby andShafter projects are, so far, unsuccessful. It cannot be said with certainty in any of these caseswhether the project concept was flawed, the organization was unable to carry out the project, ormore time is required for ultimate success.
The most successful logistics park projects to date are the Alliance Texas and Jolietdevelopments, both of which were “championed” by major business park development firms(Hillwood Group and CenterPoint). These and similar firms have a track record of assessing andacting on commercial opportunities and the “staying power’ required for multi-year developmentefforts. Whether acting as master developers or in some other role, major development firmshave other capabilities that public agencies typically lack:
national and international marketing and sales staff;
a portfolio of properties and projects; and
contacts and credibility with major national firms (e.g. manufacturers, retailchains, 3PLs).
Findings: Willing Carrier Participation
Early and willing railroad participation was a key factor in the success of the VIP, Huntsville,Joliet and Alliance projects. The Shafter project lacks willing railroad participation and isattempting to force the railroads to participate. Other projects that anticipate rail service, such asSCLA, may find that service difficult to secure.
Service by cargo or parcel air carriers distinguish the airport projects with substantial cargoactivity (Huntsville, Alliance, Rickenbacker) from those that have primarily attracted aircraftindustry or ancillary businesses (SCLA, SBD, March).
The major factors in service decisions by all carriers in all modes are basically the same.
Volume. The potential business volume must be sufficient to justify capitalinvestment, equipment and labor time, and management attention. Whether theunit of service is a train, an airplane or a delivery truck, there is a minimumvolume threshold to engage the carrier’s interest. The volume also determines service frequency and the possibility of attracting more than one carrier to obtainthe benefits of competition. The central role of volume is one reason why marketassessments are so critical.
Profit Potential. Profitability may be influenced by volume, length of haul,balance, commodity, shipment size and other factors. Profitability must begauged in both an absolute sense (e.g. a minimum return on investment oroperating margin) and relative to other carrier opportunities (e.g. compared toother business on the same railroad line or other stops for the same airplane).

042607 Puerto Nuevo Report Vol 4 Final Page 6THE TIOGA GROUP
Network Fit. Railroads, airlines and trucking firms are all network business,although the nature and flexibility of the network varies.
Railroads have a fixed network of lines, terminals and connections, and an operating strategy forusing that network. A new proposed service that fits neatly into the network is much easier thana service that requires changes in the network, changes in other operations, or changes beyondthe network. For example:
The Keary-Worcester shuttle can accommodate small volumes of short-haulintermodal business because much of it moves as added cars on existing trains.
The Detroit Intermodal Freight Terminal (DIFT) project stalled over thereluctance of Contrail to share Livornois Yard.
The Neomodal terminal was located on the Wheeling and Lake Erie regionalrailroad, off the CR, CSX, and NS networks.
In the air cargo case, the issue is whether or not a flight to and from the proposed facility fitswithin the carrier’s hub and spoke network. Specific factors might include:
distance and flying time between the project airport and existing hubs;
appropriate cut-off, departure, arrival and delivery times; and
the schedules of existing multi-stop flights.
For rail intermodal, air cargo and LTL trucking, the operative question is whether the relevantmarket is best served through the proposed new facility or via truck from an existing facility inthe same region.
For a truckload carrier the decision is simpler. If profitable westbound loads from the projectsite can be matched with profitable inbound loads to customers nearby (or vice versa), truckloadcarriers who operate in the region will usually want the business. The balance of outbound andinbound loads is the critical factor. Where loads are imbalanced or the carrier must repositionthe empty unit farther to obtain a balancing load, the carrier will demand a higher rate.
Findings: Long Development Times
Most of the successful inland port developments described in the case studies have had longgestation periods. Of these examples, some appear to have been successful from the beginningand increased in scope over time while others took a long time–decades–to reach a sustainablebusiness value.
Virginia Inland Port –planning began in 1984, opened in 1989, reached targetvolume in 1999.
Alliance Texas–planning began in 1988, airport opened in 1989.
Port of Huntsville –airport began operations in 1967, international air cargoservice began in 1991.

042607 Puerto Nuevo Report Vol 4 Final Page 7THE TIOGA GROUP
For this reason it is difficult to label any existing project a permanent failure. A project mayindeed be “ahead of its time,” as Huntsville was, and eventually succeed as the market develops or other necessary changes take place. For a project to be a decade or more “ahead of its time,” however, means that the land, capital investment and other resources are unproductive for a longperiod and generate no public or private benefits.
The market assessment and business forecast are critical in deciding whether and when to start aproject. Where project sponsors engage in overly optimistic “aspirational forecasting” public resources can be ill-spent. Forecasting is not an exact science, however, and project plans andfinancing should be sufficiently robust to sustain the effort through a slower than anticipatedstart-up.
Findings: Valid Value Proposition
To complement the market assessment there needs to be a clear understanding of how the projectproposes to create value for its customers. That “value proposition” must be verified in the marketplace, just as market assessments must be subjected to reality checks.
Some of the inland port projects that seem to have stalled for commercial rather than regulatoryreasons have vague or questionable value propositions. The Montana, Neomodal and BattleCreek projects are examples.
Satellite Marine Terminals
042607 Puerto Nuevo Report Vol 4 Final Page 8THE TIOGA GROUP
1. Virginia Inland Port
Overview
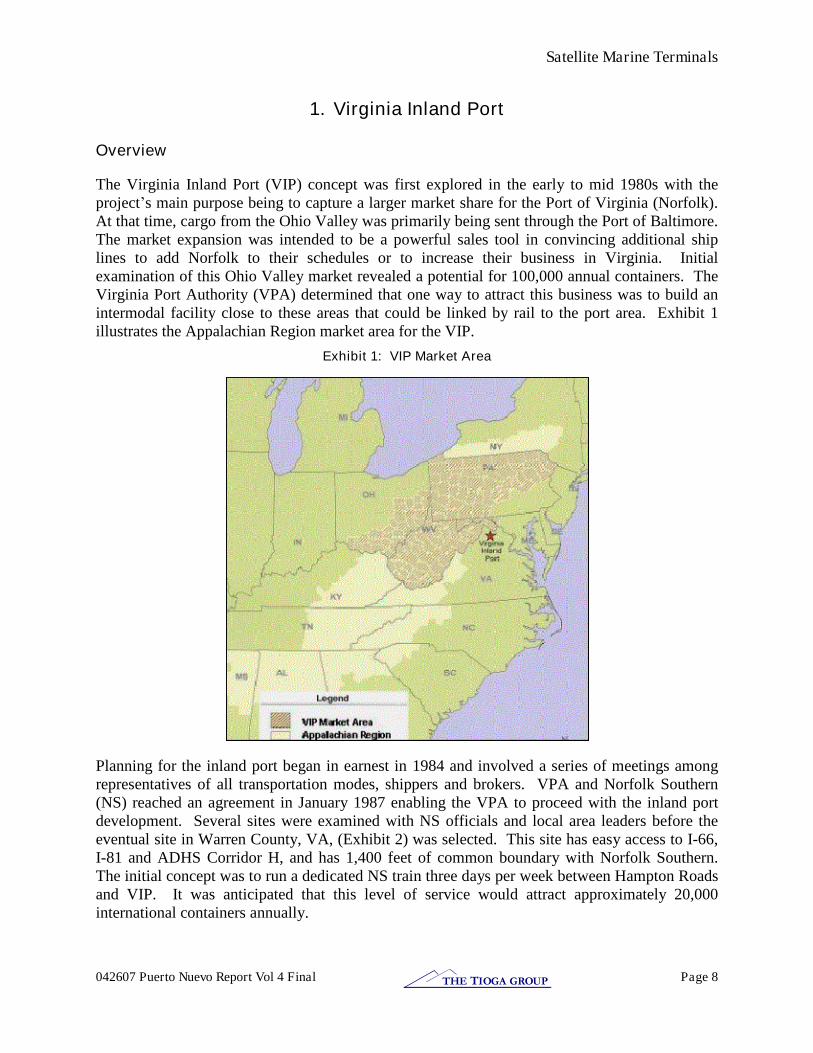
The Virginia Inland Port (VIP) concept was first explored in the early to mid 1980s with theproject’s main purpose being to capture a larger market share for the Port of Virginia (Norfolk).At that time, cargo from the Ohio Valley was primarily being sent through the Port of Baltimore.The market expansion was intended to be a powerful sales tool in convincing additional shiplines to add Norfolk to their schedules or to increase their business in Virginia. Initialexamination of this Ohio Valley market revealed a potential for 100,000 annual containers. TheVirginia Port Authority (VPA) determined that one way to attract this business was to build anintermodal facility close to these areas that could be linked by rail to the port area. Exhibit 1illustrates the Appalachian Region market area for the VIP.
Exhibit 1: VIP Market Area
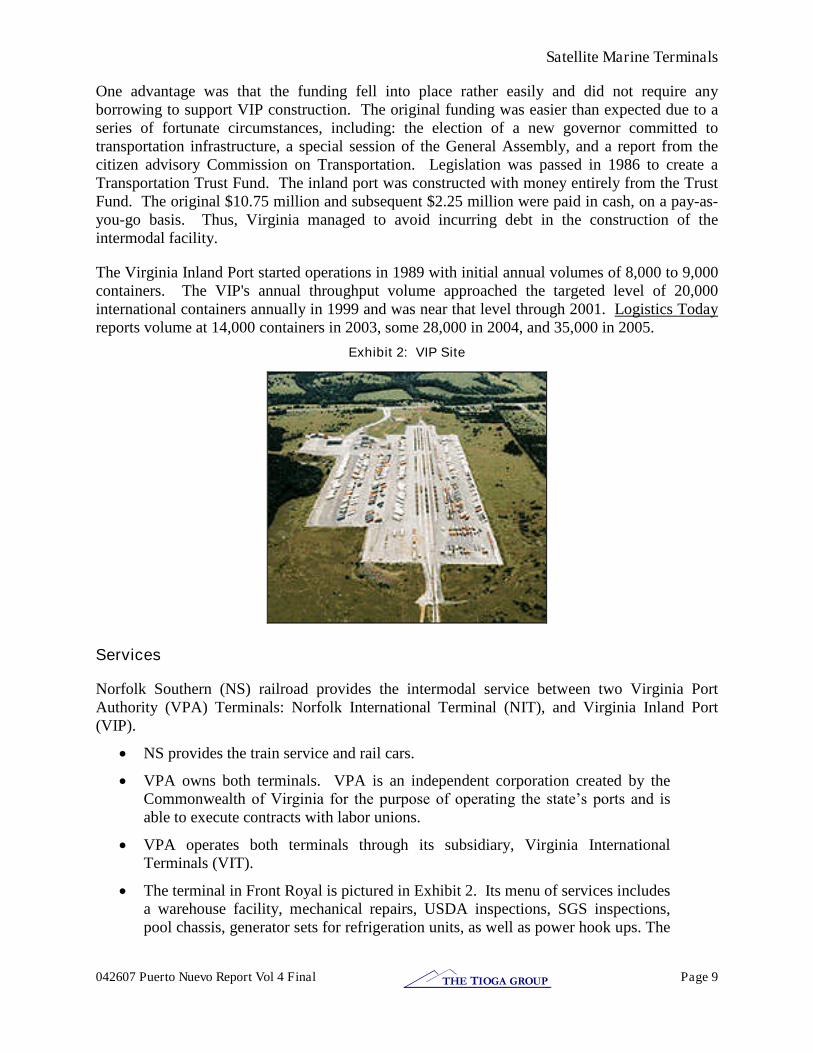
Planning for the inland port began in earnest in 1984 and involved a series of meetings amongrepresentatives of all transportation modes, shippers and brokers. VPA and Norfolk Southern(NS) reached an agreement in January 1987 enabling the VPA to proceed with the inland portdevelopment. Several sites were examined with NS officials and local area leaders before theeventual site in Warren County, VA, (Exhibit 2) was selected. This site has easy access to I-66,I-81 and ADHS Corridor H, and has 1,400 feet of common boundary with Norfolk Southern.The initial concept was to run a dedicated NS train three days per week between Hampton Roadsand VIP. It was anticipated that this level of service would attract approximately 20,000international containers annually.
Satellite Marine Terminals
042607 Puerto Nuevo Report Vol 4 Final Page 9THE TIOGA GROUP
One advantage was that the funding fell into place rather easily and did not require anyborrowing to support VIP construction. The original funding was easier than expected due to aseries of fortunate circumstances, including: the election of a new governor committed totransportation infrastructure, a special session of the General Assembly, and a report from thecitizen advisory Commission on Transportation. Legislation was passed in 1986 to create aTransportation Trust Fund. The inland port was constructed with money entirely from the TrustFund. The original $10.75 million and subsequent $2.25 million were paid in cash, on a pay-as-you-go basis. Thus, Virginia managed to avoid incurring debt in the construction of theintermodal facility.
The Virginia Inland Port started operations in 1989 with initial annual volumes of 8,000 to 9,000containers. The VIP's annual throughput volume approached the targeted level of 20,000international containers annually in 1999 and was near that level through 2001. Logistics Todayreports volume at 14,000 containers in 2003, some 28,000 in 2004, and 35,000 in 2005.
Exhibit 2: VIP Site
Services
Norfolk Southern (NS) railroad provides the intermodal service between two Virginia PortAuthority (VPA) Terminals: Norfolk International Terminal (NIT), and Virginia Inland Port(VIP).
NS provides the train service and rail cars.
VPA owns both terminals. VPA is an independent corporation created by theCommonwealth of Virginia for the purpose of operating the state’s ports and isable to execute contracts with labor unions.
VPA operates both terminals through its subsidiary, Virginia InternationalTerminals (VIT).
The terminal in Front Royal is pictured in Exhibit 2. Its menu of services includesa warehouse facility, mechanical repairs, USDA inspections, SGS inspections,pool chassis, generator sets for refrigeration units, as well as power hook ups. The

Satellite Marine Terminals
042607 Puerto Nuevo Report Vol 4 Final Page 10THE TIOGA GROUP
facility is a U.S. Customs-designated port of entry, and the full range of Customsfunctions is available.
The marine carriers are the customers of VIT. The cargo largely remains in bondand clears customs in Front Royal. Some of the cargo may move on through amarine bill of lading with final destinations in Northern Virginia, West Virginia,Western Maryland, Pennsylvania, and Ohio.
VIT contracts with NS to provide a second morning train service scheduled sixdays per week in each direction. VPA markets this service to marine carriers as apart of its terminal service package.
Norfolk Southern has a flat rate charge to VIP for box movement to VIT, shown in the VIT tarifftable (Exhibit 3).
Exhibit 3: VIP Tariff Rates, February 2006
Loaded Empty
TOFC $449.00 $366.00COFC $271.00 $188.00
The original arrangement between NS and VIP when VIT opened in 1989 was a 3-day-per-weektrain, with payment for the full train cost regardless of container volume. That has evolved to aflat rate between Hampton Roads and VIP. The containers can move on any NS train that runsto or through Front Royal, but there is a train each way five days per week that originates at VITto VIP as well as a reverse train from VIP to VIT.
The highway distance between VIT and VIP is about 220 miles, which makes the publishedload/empty round trip COFC rail rate less than $1.05 per mile, much less than any conceivablemotor carrier drayage rate. The TOFC rate for the same trip is $1.85 per round trip mile, whichwould indicate that VIT and NS would not really be interested in TOFC in this market. NS railmileage is 400–450 miles one way, so NS is paying a circuitry penalty in this lane of about 100percent.
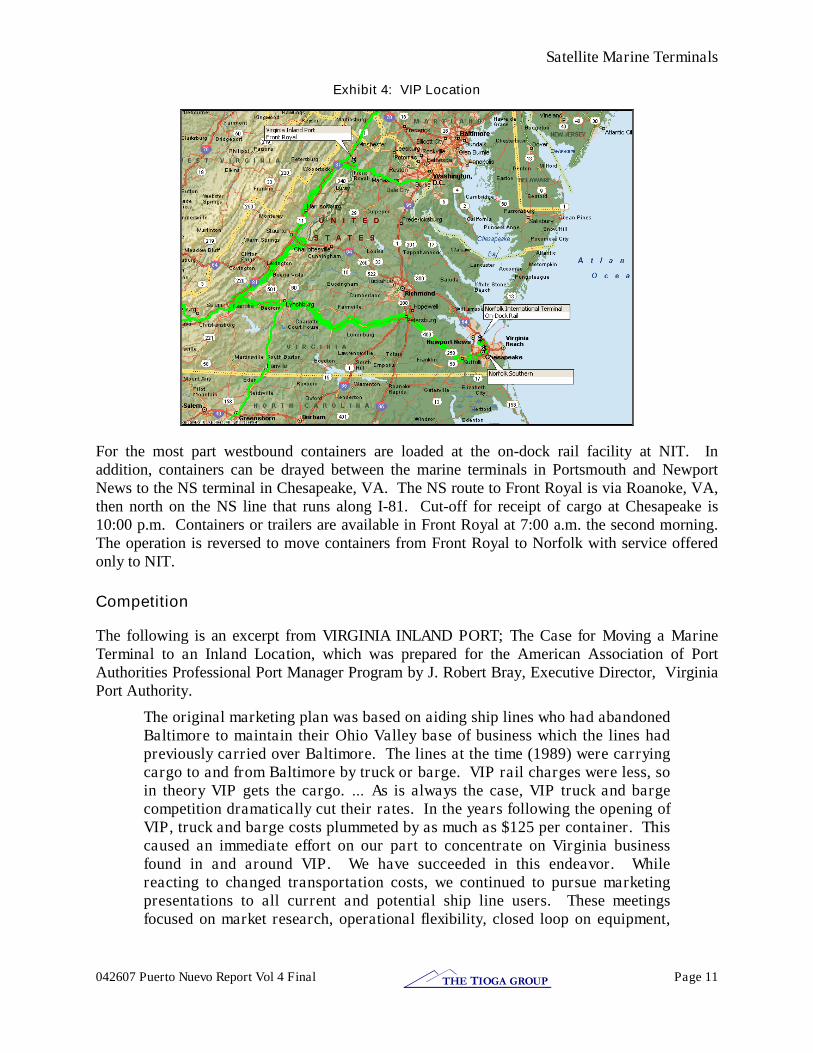
In Norfolk, the cargo can originate at the on-dock rail terminal at NIT, and at NS’s Chesapeake, VA, facility. Shipments from Front Royal terminate at NIT. The Front Royal terminal is locatedless than a mile from I-66 and less than five miles from I-81. The thick green line on the map inExhibit 4 illustrates the NS rail route between the terminals.
Satellite Marine Terminals
042607 Puerto Nuevo Report Vol 4 Final Page 11THE TIOGA GROUP
Exhibit 4: VIP Location
For the most part westbound containers are loaded at the on-dock rail facility at NIT. Inaddition, containers can be drayed between the marine terminals in Portsmouth and NewportNews to the NS terminal in Chesapeake, VA. The NS route to Front Royal is via Roanoke, VA,then north on the NS line that runs along I-81. Cut-off for receipt of cargo at Chesapeake is10:00 p.m. Containers or trailers are available in Front Royal at 7:00 a.m. the second morning.The operation is reversed to move containers from Front Royal to Norfolk with service offeredonly to NIT.
Competition
The following is an excerpt from VIRGINIA INLAND PORT; The Case for Moving a MarineTerminal to an Inland Location, which was prepared for the American Association of PortAuthorities Professional Port Manager Program by J. Robert Bray, Executive Director, VirginiaPort Authority.
The original marketing plan was based on aiding ship lines who had abandonedBaltimore to maintain their Ohio Valley base of business which the lines hadpreviously carried over Baltimore. The lines at the time (1989) were carryingcargo to and from Baltimore by truck or barge. VIP rail charges were less, soin theory VIP gets the cargo. … As is always the case, VIP truck and bargecompetition dramatically cut their rates. In the years following the opening ofVIP, truck and barge costs plummeted by as much as $125 per container. Thiscaused an immediate effort on our part to concentrate on Virginia businessfound in and around VIP. We have succeeded in this endeavor. Whilereacting to changed transportation costs, we continued to pursue marketingpresentations to all current and potential ship line users. These meetingsfocused on market research, operational flexibility, closed loop on equipment,
Satellite Marine Terminals
042607 Puerto Nuevo Report Vol 4 Final Page 12THE TIOGA GROUP
rate comparisons and cost savings over existing liner methods for handlingintermodal containers. We pitched - if it reaches VIP - it is on the ship.
Our task has been made difficult by a reluctance on the part of somecustomhouse brokers and international freight forwarders to assist and somehave continued to insist on a Baltimore bill of lading; some ship lines arehesitant to offer a VIP bill of lading without an arbitrary charge to cover therail movement; and the rationalization of equipment and services has enabledship lines the option of handling cargo from more ports at a reasonable cost.
Regional Benefits
Since VIP opened, it has spurred nearly $600 million in private sector capital investments. It isestimated that 95 percent of the business generated by the VIP is new business for the Port ofVirginia-Hampton Roads (i.e., this freight traffic has been captured from other ports).
The local community expected that the VIP facility would stimulate regional economicdevelopment. This local expectation caused VPA to shift from the original plan concentrated oninternational containers to a broader program encompassing domestic rail service and regionaleconomic development (increasing jobs, wages and taxes), which is its core mission to theCommonwealth of Virginia. Operations at the VIP are conducted by about 17 full-timeemployees. The VIP has been generating operating profits. Its establishment is associated withstrengthening the competitive position of Virginia's ports relative to their East Coast competitors,and has resulted in increased business investment and employment in nearby AppalachianRegion areas.
The VIP terminal has been in operation since 1989 with rail intermodal service from and to thePort of Virginia. Over that time, 24 major companies have located distribution centers near VIPwith investments of $600 million and over 6.25 million square feet of buildings. These firmsactively take advantage of the Port to ship a variety of products overseas, including plastics,medical supplies, apparel, auto parts, furnishings, food, paper and four-wheel-drive vehicles.(Virginia Port Authority, 1999) Logistics Today (December 2005) reports that, “Althoughimports flow through VIP, [export] poultry, logs and lumber represent a major part of thefacility's freight.”
Long-Term Direction
The Virginia Inland Port seeks to increase container volume by marketing the facility and itsbenefits to shippers. Marketing plans are carried out in conjunction with economic developmentefforts based on the freight mobility the VIP offers the region. In 1995, a long-term VIP Missionand Strategic Plan was created that advocated making the inland port the focal point for regionaleconomic activity. To this end, the Virginia Port Authority created an Economic DevelopmentCenter, including an administration building and warehouse facilities at the VIP.
Needs and Next Steps
Any VIP infrastructure improvements and expansion will require additional funding. However,the VIP may not need to rely solely on public financing for any expansion funds; the facility has
Satellite Marine Terminals
042607 Puerto Nuevo Report Vol 4 Final Page 13THE TIOGA GROUP
been self-sufficient and operating profitably since 1994. As of this writing expansion is underway. Beyond targeting and increasing market-share from within the existing VIP market area,the Port of Virginia also seeks to expand the VIP market area and customer base. This plan willinvolve significant area and regional economic development efforts. In conjunction withWashington-Dulles International Airport, ongoing efforts have been made to develop thecorridor between the two facilities as a principal freight distribution center/hub. This involvesattracting warehouse and distribution facilities (and ancillary support infrastructure) to the area.Expansion of the Foreign Trade Zone to land and facilities surrounding the VIP is also seen as apositive step for the Port. Such an FTZ expansion would include land owned and operated byvarious economic development agencies in the region.
Success Factors
This operation has been successful because:
There was Capital and Commitment to develop the terminal driven by thestrong resolve of the Commonwealth to develop its ports. As Mr. Bray reports,During this time frame, the Virginia General Assembly created aTransportation Trust Fund (TTF). The TTF is composed of a set-aside ofcertain taxes on gasoline, titling taxes and sales and use taxes. The VPAreceives 4.2 percent of the TTF as the Commonwealth Port Fund (CPF). ThisCPF is used for capital development and maintenance by VPA and this certainsource of funding made possible serious consideration of an inland port.
The Marketing Plan was viable and flexible enough to accommodate change.While the original target market was Baltimore-billed Ohio Valley cargo handledover the Port of Norfolk, the market that has emerged is based on improvedtransportation access to the region and its impact on the local economy. Theregional economic development was created by the VPA’s terminal infrastructure investment and the availability of necessary terminal services to support themarketing plan described above.
Norfolk Southern is a willing Class 1 railroad. Norfolk Southern has a long-standing and symbiotic relationship with the Virginia Port Authority whichsupported the development of VIP. There was a commitment to run the train andabsorb the train operating cost even during the long start-up period.
Satellite Marine Terminals
042607 Puerto Nuevo Report Vol 4 Final Page 14THE TIOGA GROUP
2. Metroport, New Zealand
Overview
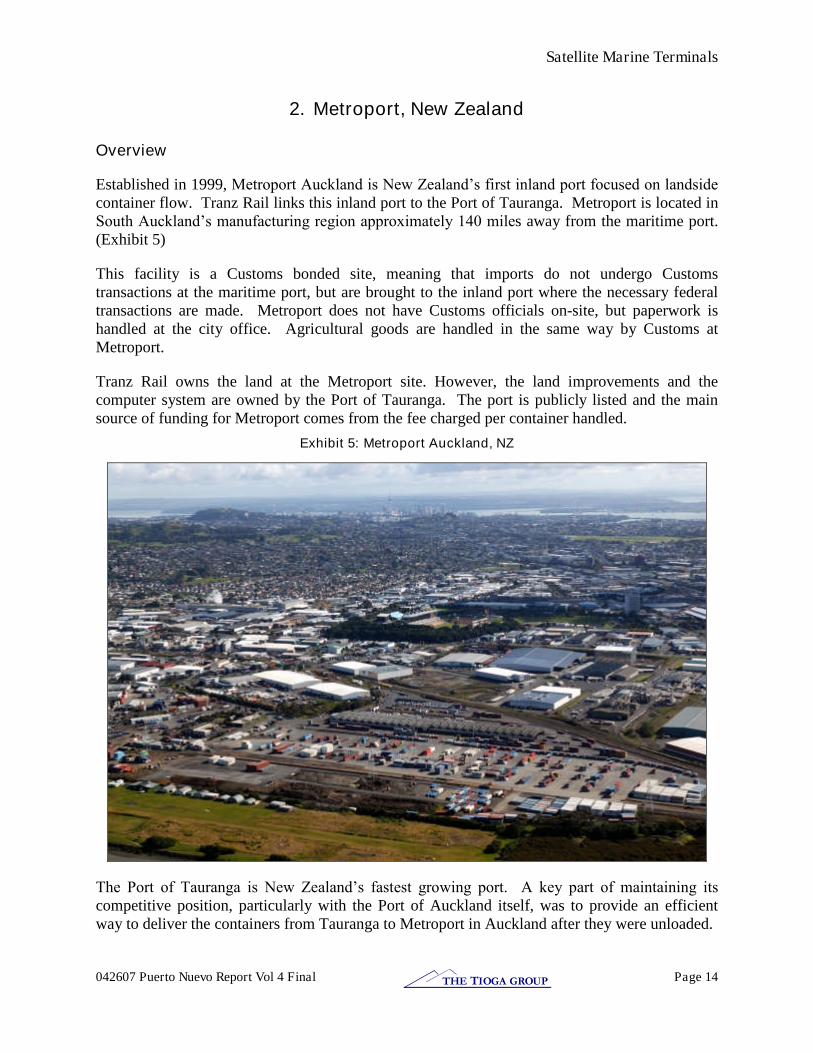
Established in 1999,Metroport Auckland is New Zealand’s first inland port focused on landside container flow. Tranz Rail links this inland port to the Port of Tauranga. Metroport is located inSouth Auckland’s manufacturing region approximately 140 miles away from the maritime port.(Exhibit 5)
This facility is a Customs bonded site, meaning that imports do not undergo Customstransactions at the maritime port, but are brought to the inland port where the necessary federaltransactions are made. Metroport does not have Customs officials on-site, but paperwork ishandled at the city office. Agricultural goods are handled in the same way by Customs atMetroport.
Tranz Rail owns the land at the Metroport site. However, the land improvements and thecomputer system are owned by the Port of Tauranga. The port is publicly listed and the mainsource of funding for Metroport comes from the fee charged per container handled.
Exhibit 5: Metroport Auckland, NZ
The Port of Tauranga is New Zealand’s fastest growing port. A key part of maintaining itscompetitive position, particularly with the Port of Auckland itself, was to provide an efficientway to deliver the containers from Tauranga to Metroport in Auckland after they were unloaded.
Satellite Marine Terminals
042607 Puerto Nuevo Report Vol 4 Final Page 15THE TIOGA GROUP
Services
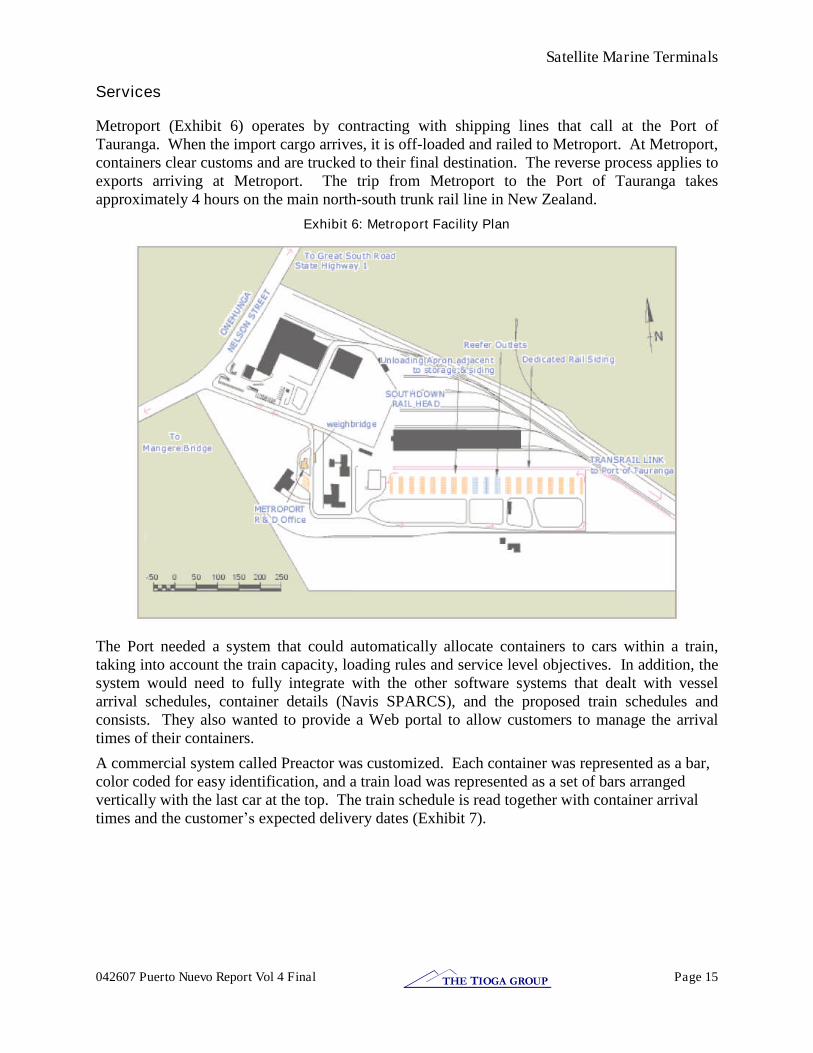
Metroport (Exhibit 6) operates by contracting with shipping lines that call at the Port ofTauranga. When the import cargo arrives, it is off-loaded and railed to Metroport. At Metroport,containers clear customs and are trucked to their final destination. The reverse process applies toexports arriving at Metroport. The trip from Metroport to the Port of Tauranga takesapproximately 4 hours on the main north-south trunk rail line in New Zealand.
Exhibit 6: Metroport Facility Plan
The Port needed a system that could automatically allocate containers to cars within a train,taking into account the train capacity, loading rules and service level objectives. In addition, thesystem would need to fully integrate with the other software systems that dealt with vesselarrival schedules, container details (Navis SPARCS), and the proposed train schedules andconsists. They also wanted to provide a Web portal to allow customers to manage the arrivaltimes of their containers.
A commercial system called Preactor was customized. Each container was represented as a bar,color coded for easy identification, and a train load was represented as a set of bars arrangedvertically with the last car at the top. The train schedule is read together with container arrivaltimes and the customer’sexpected delivery dates (Exhibit 7).
Satellite Marine Terminals
042607 Puerto Nuevo Report Vol 4 Final Page 16THE TIOGA GROUP
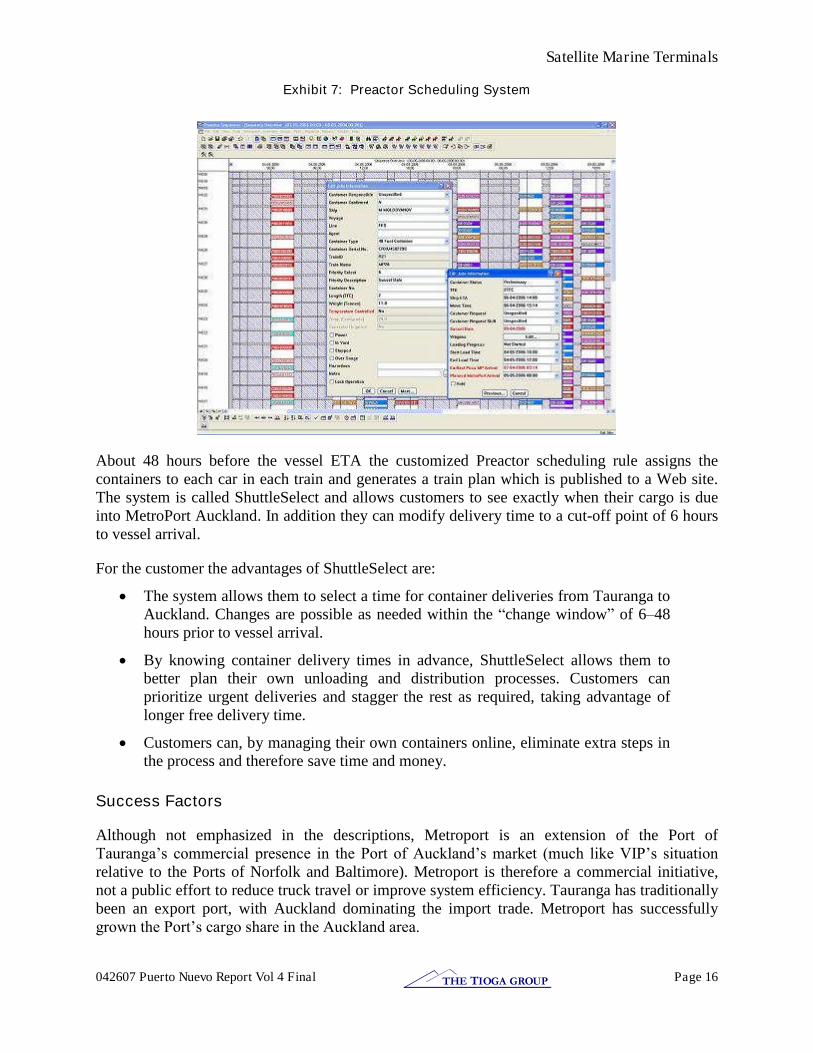
Exhibit 7: Preactor Scheduling System
About 48 hours before the vessel ETA the customized Preactor scheduling rule assigns thecontainers to each car in each train and generates a train plan which is published to a Web site.The system is called ShuttleSelect and allows customers to see exactly when their cargo is dueinto MetroPort Auckland. In addition they can modify delivery time to a cut-off point of 6 hoursto vessel arrival.
For the customer the advantages of ShuttleSelect are:
The system allows them to select a time for container deliveries from Tauranga toAuckland. Changes are possible as needed within the “change window”of 6–48hours prior to vessel arrival.
By knowing container delivery times in advance, ShuttleSelect allows them tobetter plan their own unloading and distribution processes. Customers canprioritize urgent deliveries and stagger the rest as required, taking advantage oflonger free delivery time.
Customers can, by managing their own containers online, eliminate extra steps inthe process and therefore save time and money.
Success Factors
Although not emphasized in the descriptions, Metroport is an extension of the Port ofTauranga’s commercial presence in the Port of Auckland’s market (much like VIP’s situation relative to the Ports of Norfolk and Baltimore). Metroport is therefore a commercial initiative,not a public effort to reduce truck travel or improve system efficiency. Tauranga has traditionallybeen an export port, with Auckland dominating the import trade. Metroport has successfullygrown the Port’s cargo share in the Auckland area.

Satellite Marine Terminals
042607 Puerto Nuevo Report Vol 4 Final Page 17THE TIOGA GROUP
Exhibit 8: Metroport Cargo Growth
Ease of use and rail service frequency are key factors in Metroport’s success. The rail shuttle operating over Tranz Rail between Tauranga and Metroport has three departures each way onmost days, with two to three on Monday and four on Sunday. This is a very high level of servicefor any rail intermodal operation.

Multimodal Logistics Parks
042607 Puerto Nuevo Report Vol 4 Final Page 18THE TIOGA GROUP
3. Alliance Texas Logistics Park
Overview
Alliance Texas (Exhibit 9) is located 15 miles north of downtown Fort Worth and 15 miles westof Dallas/Fort Worth International Airport. Covering some 15,000 acres, Alliance is one of thelargest and most successful master-planned developments in the country. Existing air, rail andhighway systems have been greatly expanded and upgraded in order to connect Alliance with afull range of domestic and international markets. Business activity is further enhanced atAlliance by a Foreign Trade Zone, an enterprise zone, a world trade center, high-techtelecommunications facilities (with state-of-the-art fiber optics) and an inventory tax exemption.
Hillwood, a Perot Co., operates the business park which now houses more than 140 companies,including 62 from the Fortune 500, Global 500 and Forbes List of Top Private Companies. Thesefirms have invested more than $5 billion to build 24.4 million square feet and create 24,000 full-time jobs. Many of these are also served by the BNSF intermodal facility.
Exhibit 9: Alliance Logistics Park
Alliance is divided into multiple sub-developments:
Alliance Center, a 2,600-acre complex that encircles the airport and is gearedprimarily toward aviation-related enterprises.
Alliance Commerce Center, a 300-acre business park for manufacturing and high-tech firms.
Alliance Air Trade Center, a 52-acre air cargo development with direct access tothe Alliance Airport runway system, direct access to Interstate 35W, and over250,000 square feet of space for cargo companies.
Alliance Gateway, a 2,400-acre distribution, manufacturing, and office sector forlarge distribution and industrial firms.
Alliance Advanced Technology Center, a 1,400-acre technology complex.
Heritage Reserve at Alliance, which offers locations for research anddevelopment facilities in a natural setting.
Westport at Alliance, a 1,500-acre industrial and distribution sector located onBNSF’s main line and intermodal terminal.
Alliance Crossing, a 170-acre retail complex.
Multimodal Logistics Parks
042607 Puerto Nuevo Report Vol 4 Final Page 19THE TIOGA GROUP
Major ground transportation routes through Alliance include I-35W and State Highways 170 and114. Dallas/Fort Worth International Airport is only 20 minutes travel time to the east.
A variety of economic incentives have been made available to spur business development atAlliance. These include a Foreign Trade Zone designation, a triple Freeport tax exemption, andenterprise zones that encourage job creation and capital investment in designated areas for aperiod of seven years. Alliance operates its own 3PL firm, called Alliance Operating Services.AOS provides such services as Foreign Trade Zone assistance, overseas container processing andthird-party warehousing. A number of other 3PL firms also operate at Alliance, producing awide range of possibilities for tenants seeking to outsource part of their operations.
Educational and technical training programs also are provided. The Alliance Opportunity Centeroffers technical training for companies located at the park.. Texas Christian University’s TCUglobalcenter at Alliance offers advanced degrees and provides conferencing facilities.
Alliance also offers the services of TeraSpace Networks to build and market data centers acrossthe country. TeraSpace has recently completed the first phase of a 1.1-million-square-footinternet data center on the eastern side of Alliance. The company also provides power and fiberoptic connectivity to more than a dozen Web-hosting and carrier-hotel companies that offer theirservices to Alliance tenants.
Companies originally chose to locate at Alliance because of its availability of relatively cheapdevelopable land, access to a large workforce, intermodal facilities, and economic inducements.Alliance has been labeled an “e-commerce fulfillment center” because of the prominence of companies that are engaged in filling business-to-business and business-to-consumer orders viathe Internet. The most prominent of these businesses include AT&T Wireless, Ameritrade,W.W. Grainer, Dell Computer, and UPS Logistics Group.
About $4.38 billion have been invested so far in Alliance, 96.7 percent from private sources.This investment has translated to 18,167 permanent jobs created and $147 million in propertytaxes generated over the last 10 years.
Rail Intermodal Terminal
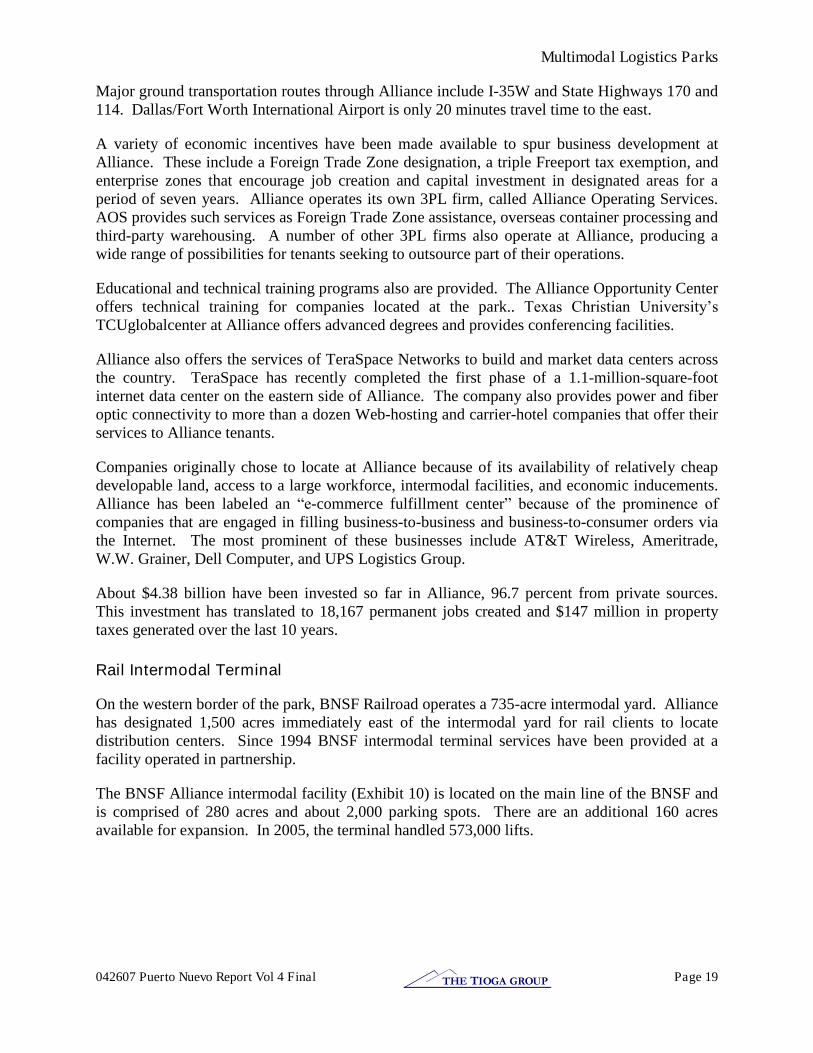
On the western border of the park, BNSF Railroad operates a 735-acre intermodal yard. Alliancehas designated 1,500 acres immediately east of the intermodal yard for rail clients to locatedistribution centers. Since 1994 BNSF intermodal terminal services have been provided at afacility operated in partnership.
The BNSF Alliance intermodal facility (Exhibit 10) is located on the main line of the BNSF andis comprised of 280 acres and about 2,000 parking spots. There are an additional 160 acresavailable for expansion. In 2005, the terminal handled 573,000 lifts.
Multimodal Logistics Parks
042607 Puerto Nuevo Report Vol 4 Final Page 20THE TIOGA GROUP
Exhibit 10: BNSF Alliance
In the late 1980s, during the planning process for the then new Dallas Area Rapid Transit System(DART), planning authorities determined that Santa Fe’s rail intermodal facility in Dallas was required for use as a support facility for the system. As a result Santa Fe conducted a series ofstudies to determine the best location for a new intermodal terminal in the region with the resultthat a decision was made to construct the new facility at the Alliance Industrial Park. In theprocess, surplus property and rail lines were sold. The proceeds were combined with those fromthe sale of the Dallas facility to fund the new Alliance terminal.
This facility, which was designed and constructed by Hillwood, was funded by BNSF. BNSFpurchased the land from Hillwood. The initial cost of construction was in excess of $100million. For the railroad this industrial park provides customers, while for the developer the railterminal serves to increase the commercial value of the property.
Multimodal Logistics Parks
042607 Puerto Nuevo Report Vol 4 Final Page 21THE TIOGA GROUP
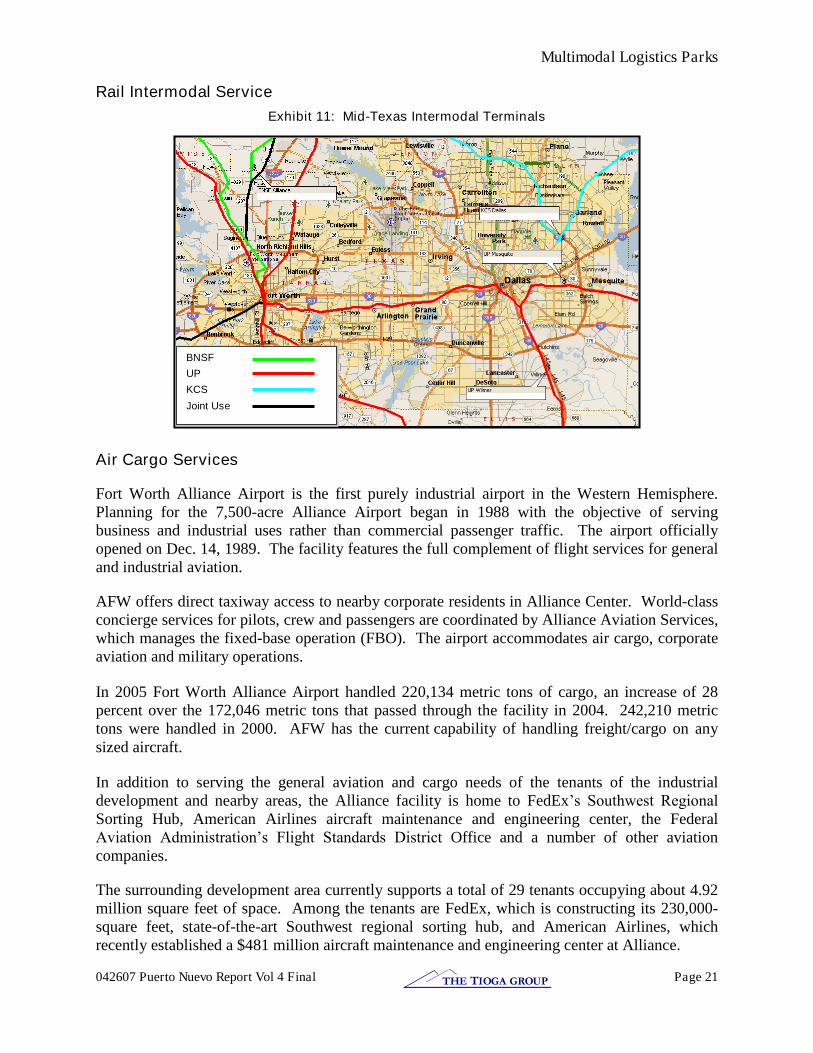
Rail Intermodal ServiceExhibit 11: Mid-Texas Intermodal Terminals
Air Cargo Services
Fort Worth Alliance Airport is the first purely industrial airport in the Western Hemisphere.Planning for the 7,500-acre Alliance Airport began in 1988 with the objective of servingbusiness and industrial uses rather than commercial passenger traffic. The airport officiallyopened on Dec. 14, 1989. The facility features the full complement of flight services for generaland industrial aviation.
AFW offers direct taxiway access to nearby corporate residents in Alliance Center. World-classconcierge services for pilots, crew and passengers are coordinated by Alliance Aviation Services,which manages the fixed-base operation (FBO). The airport accommodates air cargo, corporateaviation and military operations.
In 2005 Fort Worth Alliance Airport handled 220,134 metric tons of cargo, an increase of 28percent over the 172,046 metric tons that passed through the facility in 2004. 242,210 metrictons were handled in 2000. AFW has the current capability of handling freight/cargo on anysized aircraft.
In addition to serving the general aviation and cargo needs of the tenants of the industrialdevelopment and nearby areas, the Alliance facility is home to FedEx’s Southwest Regional Sorting Hub, American Airlines aircraft maintenance and engineering center, the FederalAviation Administration’s Flight Standards District Office and a number of other aviationcompanies.
The surrounding development area currently supports a total of 29 tenants occupying about 4.92million square feet of space. Among the tenants are FedEx, which is constructing its 230,000-square feet, state-of-the-art Southwest regional sorting hub, and American Airlines, whichrecently established a $481 million aircraft maintenance and engineering center at Alliance.
BNSF
UP
KCS
Joint Use
Multimodal Logistics Parks
042607 Puerto Nuevo Report Vol 4 Final Page 22THE TIOGA GROUP
The airport received $4.5 million in Airport Improvement Program funds from the FAA toextend both runways to 11,000 feet to accommodate larger jets. Fee-simple ownership of largetracts of land with direct runway access is a unique airport feature. The U.S. Customs Servicehas on-site facilities, allowing international flights and cargo to be cleared at the airport.
Auto Loading Services
The 55-acre auto facility is a conventional rail transfer facility and serves DaimlerChrysler,American Honda, Hyundai and a number of other manufacturers and automotive re-marketers.
Competition
Union Pacific has two intermodal terminals in the Dallas-Fort Worth area that compete directlywith Alliance. A primarily domestic terminal is located in Mesquite, and a primarilyinternational terminal is located in Wilmer. This brand new UP terminal advertises beingadjacent to a planned 4,500-acre industrial park. Kansas City Southern (KCS) operates anintermodal terminal located in Dallas and is often considered a business partner of BNSF in thismarket, particularly for east/west movements.
Success Factors
This facility started the trend toward synergistic development of business parks and intermodalterminals. There was some concern initially about the distance of the new facility from theDallas Metro area, primarily related to drayage costs. While this may be a negative factor,Alliance has been a very successful development. Hillwood also was highly interested in havingan intermodal facility as an adjunct to the industrial park and actively markets the synergisticrelationship between the intermodal terminal and the industrial park. For example, J. C. Penneydeveloped a major distribution center that was planned to receive 18,000 inbound containersannually and distribute goods to approximately 1,000 stores located east of the Rockies. All theinbound and many of the outbound loads will move via the BNSF intermodal facility.
The airport was sited to serve the greater Dallas-Ft. Worth area and points beyond. As withother cargo airports its initial tenants were aircraft and airline industry firms, not cargo shippersor consignees.
The rail intermodal terminal was relocated from Dallas to Alliance and therefore had a pre-existing clientele. The Hillwood Group has been a very effective master developer and“champion” for the project.

Multimodal Logistics Parks
042607 Puerto Nuevo Report Vol 4 Final Page 23THE TIOGA GROUP
4. The Port of Huntsville, AL
Overview
The Port of Huntsville is an inland port complex located in Northern Alabama (Exhibit 12)comprised of three operating facilities under the jurisdiction of Huntsville–Madison CountyAirport Authority: Huntsville International Airport, the International Intermodal Center, andJetplex Industrial Park. The mission of the Port of Huntsville is to provide quality multi-modaltransportation services to a diverse regional customer base and to stimulate the economic growthand development of the Tennessee Valley Region.
The driving force of the Airport Authority created the Port of Huntsville. The Airport Authorityalso financed and built the intermodal terminal and convinced NS to provide service. Facilitiesand infrastructure significantly exceed current demand and provide long-term capacity forgrowth.
Exhibit 12: Port of Huntsville Market Region
International Intermodal Center (IIC)
The IIC (Exhibit 13) is divided into two distinct operations: rail cargo, which began in 1986, andair cargo, which began in 1987.

Multimodal Logistics Parks
042607 Puerto Nuevo Report Vol 4 Final Page 24THE TIOGA GROUP
Exhibit 13: Huntsville International Intermodal Center
The rail intermodal terminal is co-located with the air cargo terminal on the east side of theairport. The terminal is served by Norfolk Southern (NS) whose main line between Memphisand Chattanooga passes about 4 miles north of the terminal. The terminal is owned by theAirport Authority and operated by Authority employees. NS pays a lift charge to cover the costof the terminal operation. The facility handled 22,000 lifts in 1999 and has grown to 35,000 liftsin 2005. With a recent expansion, terminal lift capacity is estimated at 100,000 lifts.
The terminal is served by two NS trains per day, one eastbound and one westbound. NS mainline trains pick up and set off Huntsville blocks which are switched to and from the facility byNS local switch crews. Authority personnel provide terminal switching with their ownlocomotives. About 90 percent of the volume at the terminal is international containers with 60percent to 70 percent of that moving over West Coast ports. West Coast volume is interchangedto NS at Memphis by Union Pacific or Burlington Northern Santa Fe. The remaininginternational volume moves over the ports of Savannah and Charleston or the Florida Ports ofJacksonville and Miami. NS also provides domestic service, principally in domestic containers,to Rutherford, PA, (Harrisburg) and Erail, NJ, (Elizabeth). Service frequency is five days perweek for both eastbound and westbound services. Considering the volume and the size of thelocal market, the service frequency and port coverage are quite good.
The air cargo facility includes a 200,000-square-foot terminal building for domestic andinternational air cargo along with 1 million square feet of cargo ramp space. Air cargo was aprimary goal of Huntsville planners throughout the facility’s development process. In 2004, HSV was ranked 18th among U.S. airports for international air cargo tonnage.
The IIC provides Customs services for both international air cargo and rail containers, along withservices offered by a number of freight forwarders, customs brokers and ground handlers. Inaddition, the designation of Foreign Trade Zone 83 gives manufacturers and processors theability to take advantage of duty deferral, duty reduction and other FTZ cost savings.
Multimodal Logistics Parks
042607 Puerto Nuevo Report Vol 4 Final Page 25THE TIOGA GROUP
Huntsville International Airport
HSV began operations in 1967 as Carl T. Jones field when the regional airport was relocatedfrom downtown Huntsville. At that time, the airport was built with two parallel 8,000–footrunways with one mile separation enabling simultaneous operations during instrumentconditions. After expansions in 1991 and 2005, the airport runways are now 10,000 and 12,600feet giving HSV the capability to handle any size aircraft in service today, including the newAirbus 380. Current air operations utilize less than half of current airport capacity.
Jetplex Industrial Park
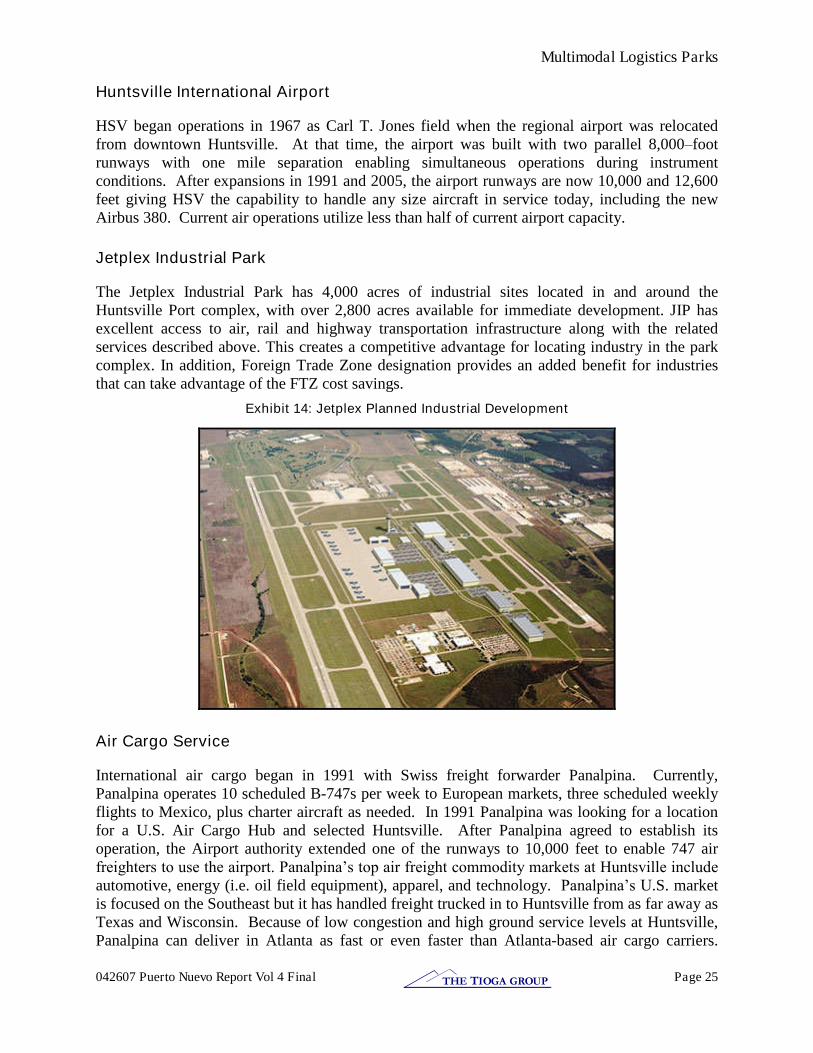
The Jetplex Industrial Park has 4,000 acres of industrial sites located in and around theHuntsville Port complex, with over 2,800 acres available for immediate development. JIP hasexcellent access to air, rail and highway transportation infrastructure along with the relatedservices described above. This creates a competitive advantage for locating industry in the parkcomplex. In addition, Foreign Trade Zone designation provides an added benefit for industriesthat can take advantage of the FTZ cost savings.
Exhibit 14: Jetplex Planned Industrial Development
Air Cargo Service
International air cargo began in 1991 with Swiss freight forwarder Panalpina. Currently,Panalpina operates 10 scheduled B-747s per week to European markets, three scheduled weeklyflights to Mexico, plus charter aircraft as needed. In 1991 Panalpina was looking for a locationfor a U.S. Air Cargo Hub and selected Huntsville. After Panalpina agreed to establish itsoperation, the Airport authority extended one of the runways to 10,000 feet to enable 747 airfreighters to use the airport. Panalpina’s top air freight commodity markets at Huntsville include automotive, energy (i.e. oil field equipment), apparel, and technology. Panalpina’s U.S. marketis focused on the Southeast but it has handled freight trucked in to Huntsville from as far away asTexas and Wisconsin. Because of low congestion and high ground service levels at Huntsville,Panalpina can deliver in Atlanta as fast or even faster than Atlanta-based air cargo carriers.
Multimodal Logistics Parks
042607 Puerto Nuevo Report Vol 4 Final Page 26THE TIOGA GROUP
Panalpina operates daily service to Luxemburg for its European service. It also operates twiceweekly service to Mexico. It had a weekly service to Hong Kong but this service was recentlydiscontinued because high fuel costs made it difficult to secure enough high-paying cargo.Panalpina’s volumes are well balanced, which is a requirement for profitable operations.Termination of its Hong Kong service was partially due to an inability to secure backhaul cargoto Asia.
Auto Plants
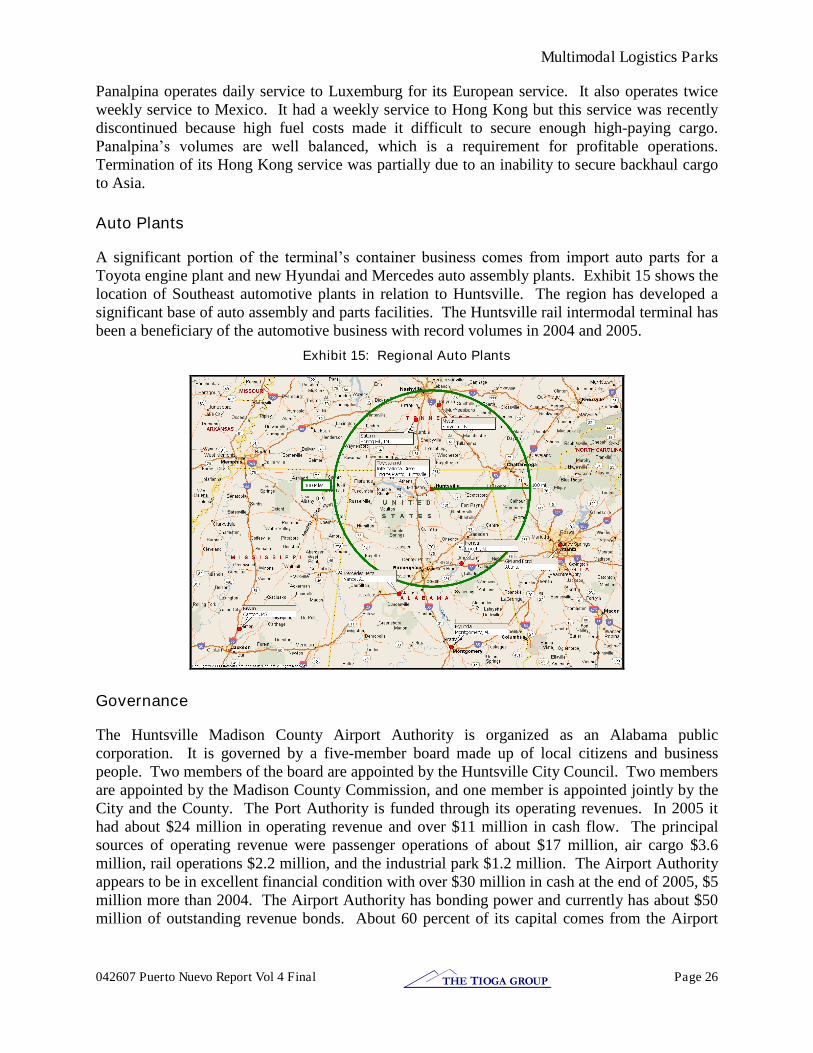
A significant portion of the terminal’s container business comes from import auto parts for a Toyota engine plant and new Hyundai and Mercedes auto assembly plants. Exhibit 15 shows thelocation of Southeast automotive plants in relation to Huntsville. The region has developed asignificant base of auto assembly and parts facilities. The Huntsville rail intermodal terminal hasbeen a beneficiary of the automotive business with record volumes in 2004 and 2005.
Exhibit 15: Regional Auto Plants
Governance
The Huntsville Madison County Airport Authority is organized as an Alabama publiccorporation. It is governed by a five-member board made up of local citizens and businesspeople. Two members of the board are appointed by the Huntsville City Council. Two membersare appointed by the Madison County Commission, and one member is appointed jointly by theCity and the County. The Port Authority is funded through its operating revenues. In 2005 ithad about $24 million in operating revenue and over $11 million in cash flow. The principalsources of operating revenue were passenger operations of about $17 million, air cargo $3.6million, rail operations $2.2 million, and the industrial park $1.2 million. The Airport Authorityappears to be in excellent financial condition with over $30 million in cash at the end of 2005, $5million more than 2004. The Airport Authority has bonding power and currently has about $50million of outstanding revenue bonds. About 60 percent of its capital comes from the Airport

Multimodal Logistics Parks
042607 Puerto Nuevo Report Vol 4 Final Page 27THE TIOGA GROUP
Authority itself, with the remaining coming from FAA grants, Appalachian RegionalCommission grants and federal earmarks.
Success Factors
Although the Huntsville–Decatur regional population is only 500,000, the Port of Huntsville hasfacilities and infrastructure that significantly exceed current demand and provide long-termcapacity for growth. This can be attributed to the vision and long-range planning of theHuntsville-Madison County Airport Authority which was formed in the early 1960s to relocatethe region’s airport. It took 20 years, from 1967 to 1987, for the Port of Huntsville to “get off the ground.”
Vision
A key example of the Airport Authority’s vision and planning was its early focus on development of freight facilities required to support future transport needs and industrialdevelopment, namely air cargo and rail intermodal for both domestic and international markets.Examples include:
Creation of the IIC hub with both air cargo handling and rail intermodal facilities.
The runway extension to 10,000 feet in 1991. This attracted Panalpina to the Port with itsdirect freight service to Europe.
The runway extension to 12,500 feet in 2005. This enables fully loaded 747-400 non-stop airfreight service to Asia and future operations of Airbus 380 air cargo planes.
Another example of this vision is in land acquisition. A key factor in the development of thePort of Huntsville was the availability of land. At the time the airport was relocated in 1967, theAirport Authority acquired 3,000 acres of cotton fields with a plan to create an industrial park asan integral part of the airport development. Today, the Airport Authority owns 6,000 acres ofland for Port facilities and industrial development. In addition, the Port master plan provides foracquisition of an additional 4,000 acres.
Willing rail service
Another key success factor was securing NS intermodal service. NS had no interest in investingits own capital for an intermodal terminal or in establishing intermodal service for the HuntsvilleDecatur market. Obviously, without NS service the inland rail port could not have beenestablished. The Airport Authority financed and built the intermodal terminal and convinced NSto provide service from and to key markets. After some negotiation, NS agreed to serve theHuntsville terminal and pay the Airport Authority a lift charge for terminal services. At the sametime, NS closed its Birmingham and Chattanooga terminals, enabling the Huntsville terminal toserve as a regional terminal for Northern Alabama and Middle Tennessee. The AirportAuthority development plan prepared in the 1970s included a rail intermodal terminal as part ofthe multi-modal transportation complex. The intermodal terminal was built in 1986, well beforethe growth of intermodal and international container movement that is currently beingexperienced.

Multimodal Logistics Parks
042607 Puerto Nuevo Report Vol 4 Final Page 28THE TIOGA GROUP
Financing
Financing of these capital investments in land and facilities was the critical element of the Port’s development. Funding was accomplished by the Airport Authority through a combination offederal grants and Airport Authority Revenue Bonds. The federal grants came from FAA airportconstruction and improvement grants, Appalachian Regional Commission Area Economic andHuman Resource Program grants, and federal earmarks. The total historical value of investmentsfor the Port of Huntsville at the end of 2002 was $207.4 million: $160.8 million for the Airportand $46.6 million for the Intermodal Center. The Airport Authority financed about 60 percent ofthe total and the remainder came from federal sources.
Champion
It was the driving force of the Airport Authority that created the Port of Huntsville’s inland port complex. The key objective was to create economic development and jobs. The economic impacton the region has been significant. The 2003 Port of Huntsville Economic Impact Study showsdirect employment within a two-mile radius of the airport to be 12,505 employees with an annualpayroll of $714.9 million. The multiplied impact on the region was 24,654 jobs with a payroll of$1.1 billion. There was certainly significant risk in making the necessary investments intransportation and industrial development infrastructure. However, the Port of Huntsville is nowvery well positioned for long-term economic growth.
Multimodal Logistics Parks
042607 Puerto Nuevo Report Vol 4 Final Page 29THE TIOGA GROUP
5. Rickenbacker Airport Columbus Inland Ports
Overview
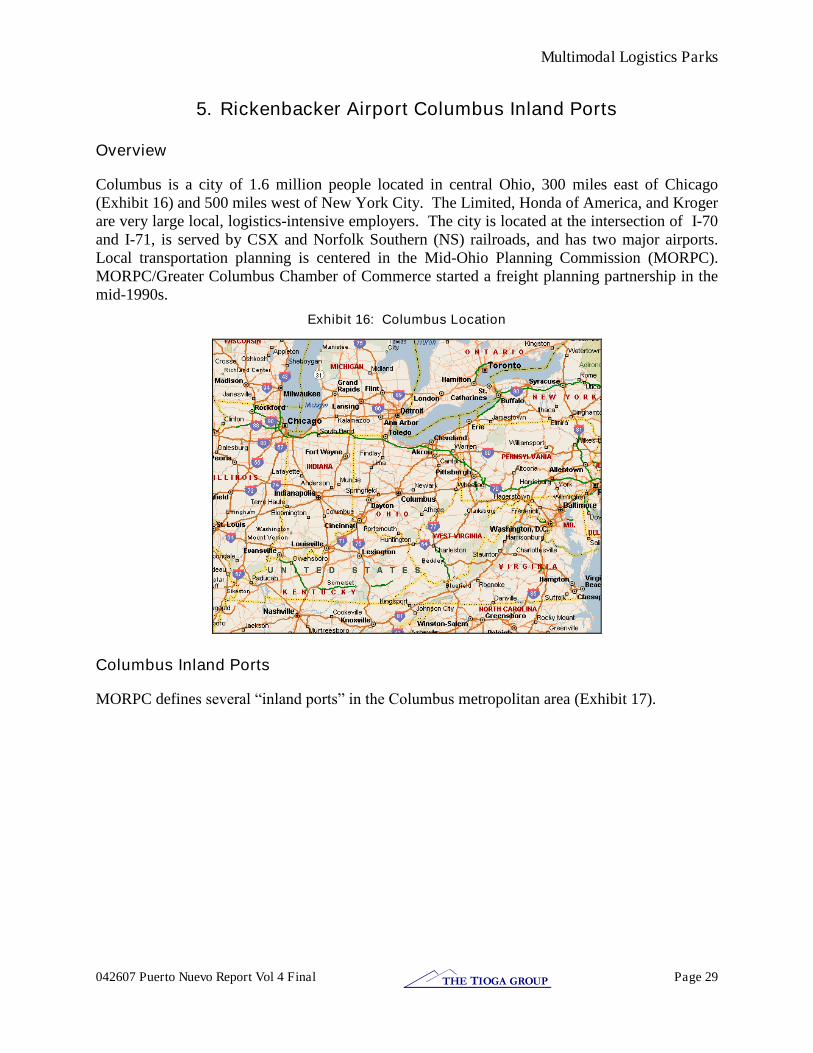
Columbus is a city of 1.6 million people located in central Ohio, 300 miles east of Chicago(Exhibit 16) and 500 miles west of New York City. The Limited, Honda of America, and Krogerare very large local, logistics-intensive employers. The city is located at the intersection of I-70and I-71, is served by CSX and Norfolk Southern (NS) railroads, and has two major airports.Local transportation planning is centered in the Mid-Ohio Planning Commission (MORPC).MORPC/Greater Columbus Chamber of Commerce started a freight planning partnership in themid-1990s.
Exhibit 16: Columbus Location
Columbus Inland Ports
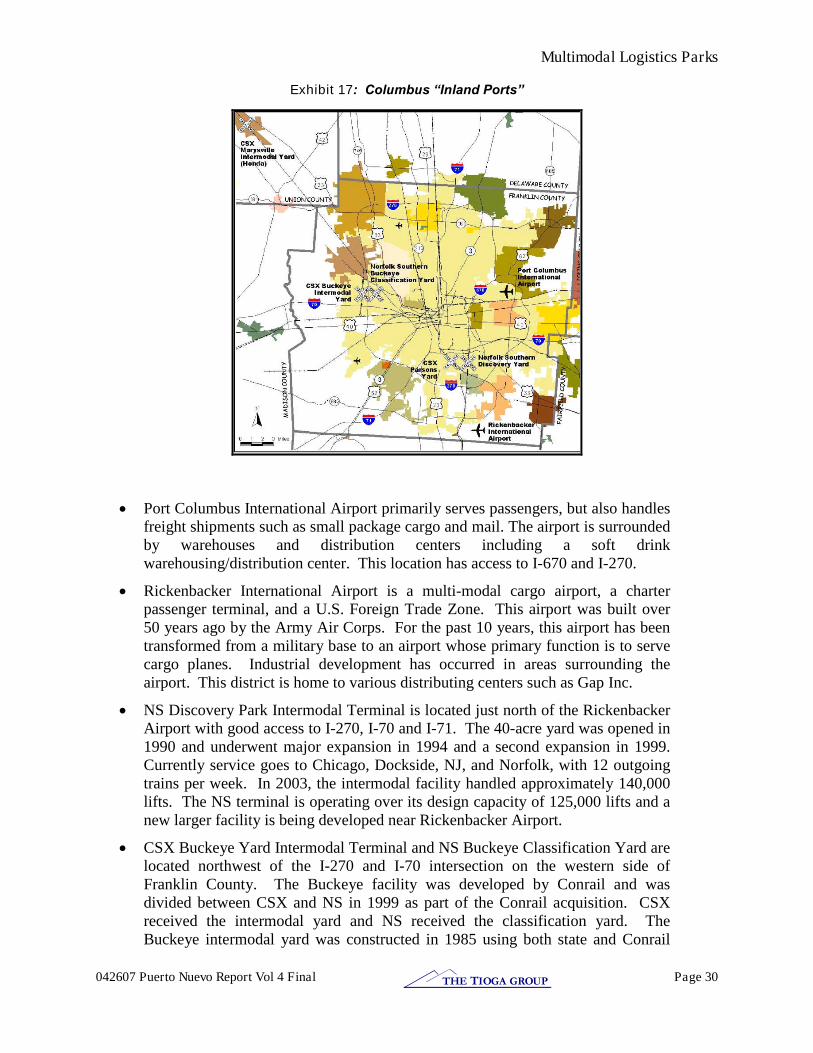
MORPC defines several “inland ports” in the Columbusmetropolitan area (Exhibit 17).
Multimodal Logistics Parks
042607 Puerto Nuevo Report Vol 4 Final Page 30THE TIOGA GROUP
Exhibit 17: Columbus “Inland Ports”
Port Columbus International Airport primarily serves passengers, but also handlesfreight shipments such as small package cargo and mail. The airport is surroundedby warehouses and distribution centers including a soft drinkwarehousing/distribution center. This location has access to I-670 and I-270.
Rickenbacker International Airport is a multi-modal cargo airport, a charterpassenger terminal, and a U.S. Foreign Trade Zone. This airport was built over50 years ago by the Army Air Corps. For the past 10 years, this airport has beentransformed from a military base to an airport whose primary function is to servecargo planes. Industrial development has occurred in areas surrounding theairport. This district is home to various distributing centers such as Gap Inc.
NS Discovery Park Intermodal Terminal is located just north of the RickenbackerAirport with good access to I-270, I-70 and I-71. The 40-acre yard was opened in1990 and underwent major expansion in 1994 and a second expansion in 1999.Currently service goes to Chicago, Dockside, NJ, and Norfolk, with 12 outgoingtrains per week. In 2003, the intermodal facility handled approximately 140,000lifts. The NS terminal is operating over its design capacity of 125,000 lifts and anew larger facility is being developed near Rickenbacker Airport.
CSX Buckeye Yard Intermodal Terminal and NS Buckeye Classification Yard arelocated northwest of the I-270 and I-70 intersection on the western side ofFranklin County. The Buckeye facility was developed by Conrail and wasdivided between CSX and NS in 1999 as part of the Conrail acquisition. CSXreceived the intermodal yard and NS received the classification yard. TheBuckeye intermodal yard was constructed in 1985 using both state and Conrail
Multimodal Logistics Parks
042607 Puerto Nuevo Report Vol 4 Final Page 31THE TIOGA GROUP
funds. Currently, CSX provides service from Columbus to destinations in Texas,Georgia, Massachusetts, South Carolina, Illinois, California, New Jersey, Florida,Virginia, Oregon and Washington. CSX has double-stack clearance on all routesto Columbus and services approximately 18 outbound trains/week and 25 inboundtrains/week. The number of rail lifts at Buckeye Yard has increased steadily; in2004, the intermodal facility handled approximately 150,000 lifts. Although bothyards have reached capacity, the yards are landlocked and cannot be expanded.
CSX Parsons Classification Yard is located near NS Discovery Park and is CSX’s freight classification facility in the region. It is also the planned location of a newlarger intermodal facility to supplement or replace CSX’s Buckeye facility.
Honda Intermodal Terminal. The Honda–Marysville terminal was constructed in1989 as a joint venture between Conrail and Honda and is located at the HondaMarysville plant in Union County. Under the Conrail split, CSX bought the rightsto operate this yard. The initial yard annual traffic volume projections werearound 14,000-15,000 inbound loads, consisting principally of auto parts importedfrom Japan either directly to the plant or to local suppliers who did certainadditional work before delivery to the plant. Volume has declined somewhat asHonda has chosen to source more parts locally.
Rickenbacker International Airport
Only Rickenbacker International Airport is an “inland port” with Customs facilities, FTZ, etc.The others are conventional rail facilities and the existing passenger airport.
Rickenbacker is a 5,000 acre all-cargo airport. It was the first public use all-cargo airport in theUnited States and is currently the largest public all-cargo airfield in the world. Rickenbacker is aformer Air Force base that was designed with 12,000-foot runways. The base was realigned in1980, with the control transferred to the Ohio National Guard. The Franklin County Board ofCommissioners formed the Rickenbacker Port Authority to operate and develop a civilian airportat Rickenbacker with a joint use agreement with the National Guard. Over 5,000 acres of landwere transferred from the Air Force to the Port Authority between 1984 and 1994. The PortAuthority now operates the facility and the military is one of many tenants.
Rickenbacker did not become an economic success until after 1990 when a new managementcompany was hired and a new marketing strategy developed based on the Greater ColumbusInland Port Concept. Local business and political leaders believed that a container could arriveat port in New York, be unloaded, shipped by rail to Columbus, clear Customs, be broken downinto small units and driven to East Coast locations faster than if processed entirely in New York.
The airport anchors the southern end of a 15,000-acre industrial zone. It contains over 22 millionsquare feet of class “A” distribution and logistics space that employs over 15,000 workers. The Rickenbacker Port Authority has developed 10 million square feet over the last 10 years in theForeign Trade Zone industrial park. An additional 12 million square feet have been developed in12 other industrial parks in the Rickenbacker Area over the last five years. Ample room stillexists for additional growth; only 40 percent of the area’s land suitable for industrial projects has been developed thus far.

Multimodal Logistics Parks
042607 Puerto Nuevo Report Vol 4 Final Page 32THE TIOGA GROUP
More than 60 companies now do business at Rickenbacker, including several Fortune 500 firms.These companies employ about 5,000 civilian employees at Rickenbacker. Eagle GlobalLogistics and Forward Air have established national truck hubs at Rickenbacker, and regionalgateways are operated by Federal Express and United Parcel Service. A number of logisticscompanies have also located at Rickenbacker, including Exel. Exel’s 23,000 square-foot all-inclusive facility at Rickenbacker consolidates all of Exel’s airfreight forwarding, Customsbrokerage, truck brokerage, intermodal operations, logistics and warehousing. Logistics and e-commerce fulfillment firms are supported at Rickenbacker by telecommunications servicesincluding state-of-the-art fiber optic lines, high-speed data circuits, and video-teleconferencecapabilities.
In the 1990s, air cargo volumes handled at Rickenbacker increased by an average of 15 percent ayear, double the national average. About 45 percent of the cargo handled by Rickenbacker isinternational. While the total number of flights at the airport declined in 2001 compared to theprevious year, a greater number of larger cargo aircraft used the airport. This increase was duein large part to FedEx’s new contract with the U.S. Postal Service.
Cargo operations at Rickenbacker are enhanced by the development of Rickenbacker’s 500,000 square-foot Air Cargo Terminal Complex, which is being continually expanded. It providesdirect airfield access to freight forwarders, shippers, logistics companies, and others looking tocapitalize on a Foreign Trade Zone location. The Air Cargo Terminal Complex is beingdeveloped by the Franklin County Improvement Corp., which was created in 1994 by theRickenbacker Port Authority and the Franklin County Commissioners to develop specializedfacilities backed by joint ventures and private financing. More than three million square feet ofadditional air cargo facilities are planned for development during the next five to 10 years.
The success of Rickenbacker International was the catalyst for the 1991 creation of the GreaterColumbus Inland Port Commission, which promotes trade and the development of intermodalinfrastructure for freight shipping and distribution in the Columbus area. It is made up of city,county, state and federal representatives on the public side, and the Greater Columbus Chamberof Commerce, as well as individual manufacturers, shippers, carriers and other private serviceproviders.
Funding
In the period 1981–1991, Rickenbacker drew a total of $72.8 million in public capital investmentand $1.7 million in private capital investment. Public investment sources included 49 percentfrom the Rickenbacker Port Authority (mostly revenue bonds), 23 percent from Franklin County,17 percent from the State of Ohio, and 11% from the FAA and Department of Defense. In theperiod 1992 –2000, the facility drew a total of $111.7 million in public capital investment and$403.0 million in private capital investment. Public investment sources included 52 percentfrom the FAA and DOT, 21 percent from the State of Ohio, 12 percent from the RickenbackerPort Authority, 11 percent from Franklin County, and 4 percent from other local sources.
The Rickenbacker Port Authority received a $5 million grant from the FAA’s Military Airports Program for the construction of a small charter passenger terminal. A new parallel runway thatis at least 5,000 feet distant from the existing primary runway is planned for construction withinthe next fifteen years. This will allow for simultaneous instrument flight rules (IFR) landings
Multimodal Logistics Parks
042607 Puerto Nuevo Report Vol 4 Final Page 33THE TIOGA GROUP
that are not possible with the existing runway configuration because the parallel runways are tooclose together.
As a cargo airport, Rickenbacker receives a variable entitlement of about $500,000 annuallyfrom the FAA, based upon cargo tonnage handled. The airport is not entitled to any federalairport funding based on passenger activity at airports. Consequently, in 2003 the Port Authorityexpanded its business services to include charter passengers in order to become eligible forfederal grants needed to provide for minimal maintenance of the airfield.
Benefits
To date, every dollar of public investment in Rickenbacker has produced over $3 in direct privateinvestment and $25 in regional economic impact. A recent economic study estimates thatRickenbacker Airport currently generates over $811 million in economic impact to the GreaterColumbus Region and supports over 7,600 jobs. Businesses located in the Foreign Trade Zonegenerate an additional $951 million to the regional economy and support almost 10,500 jobs. Anadditional $988 million is generated by Rickenbacker Area development outside the boundariesof the Rickenbacker Port Authority. The total impact of Rickenbacker and Rickenbacker Areadevelopment to the regional economy is currently about $2.8 billion. This is forecast to increaseto $3.8 billion in 2006 with the development of the International Facilities Complex, which willinclude a passenger terminal, hotel and conference center, and corporate hangars.
Public-Private Collaboration
The following is taken from a 2004 MORPC report “Freight Planning in Central Ohio ACompanion Report to the 2030 Transportation Plan.” In the mid-1990s MORPC and theGreater Columbus Chamber of Commerce started a freight planning partnership (GCIP –Greater Columbus Inland Port) to play a strong leadership role in advancing Columbus’ freight transportation and distribution industries. The work that resulted from this effort won nationalrecognition and became known as the Inland Port Reports, as described below.
Inland Port Phase I (1994): MORPC concluded its first study exploring theinstitutional, organizational, and regulatory impediments to freight movement inthe region.
Inland Port Phase II (1997): This study stressed closer and more effectivecommunication between the private and public sectors, and more extensiveexchange of information and opportunity for input in the decision-making processon transportation infrastructure improvement projects.
Inland Port Phase III (1998): The Freight Transportation Economic Impact Studyfor Central Ohio was completed. This study documented that public investment infreight transportation projects is an effective method to achieve economic growthin the region.
The result of this state and MPO activity coupled with an aggressive Chamber of Commerce hashelped the region maintain long-term job growth in the face of a significant reduction inmanufacturing jobs.
Multimodal Logistics Parks
042607 Puerto Nuevo Report Vol 4 Final Page 34THE TIOGA GROUP
Success Factors
Columbus is a successful model for any city that is seeking job creation in the transportation andlogistics sectors of industry. The simple key to this process has been leadership exercised inboth the public and private sector around shared economic development goals.
The biggest advantage is Rickenbacker’s location as a distribution center for both domestic and international air cargo. Columbus is within a one-day truck drive or a 90-minute flight of morethan half of the population, employment, retail purchasing power and manufacturing capacity ofboth the United States and Canada. Rickenbacker has convenient access to the nine state andfederal freeways and highways that intersect in central Ohio and link Columbus to major marketsin New York, Chicago, and Atlanta. Lastly, Rickenbacker is located within a rapidly growingmetropolitan area of 1.4 million people with a workforce exceeding 700,000 workers.
Creation of a Foreign Trade Zone at Rickenbacker in 1987 also contributed to its success.Rickenbacker enjoys an exemption from state inventory taxes, and abatement on real estate taxesfor improvements to land and buildings through 2007. The airport receives a subsidy of about $3million per year from local government, and the State of Ohio has pledged a total of $65 millionin revenue bonds for future facility improvements.
The collaboration between MORPC and the Greater Columbus Chamber of Commerce datesfrom the mid-1990s and has helped sustain a focus on regional freight planning issues. Theregion is regarded, and regards itself, as “freight friendly.”

Multimodal Logistics Parks
042607 Puerto Nuevo Report Vol 4 Final Page 35THE TIOGA GROUP
6. Logport, Duisburg, Germany
Overview
Duisburg is a German city in the western part of the Ruhr region in North Rhine-Westphalia. It isan independent metropolitan borough in the Düsseldorf area. With its harbor and proximity toDüsseldorf International Airport, Duisburg has become an important venue for commerce andsteel production.
Logport is an offshoot of Duisport, itself an “inland port” by virtue of being on a river rather than on the coast. Logport is not a satellite terminal in the sense of being connected by a rail shuttle,but has its own berths and water access. Logport is of interest because of its emphasis on modernlogistics and multimodal (water-rail-truck) transportation.
Duisburg Port
"Duisport" (Exhibit 18) is the largest inland river port in Europe. It is officially regarded as a"seaport" because sea-going river vessels go to ports in Europe, Africa, and the Middle East.Numerous docks are mostly located at the mouth of the River Ruhr.
Exhibit 18: Duisport
Each year more than 40 million metric tons of various goods are handled, with more than 20,000ships calling at the port. The public harbor facilities stretch across an area of 7.4 km². There are21 docks covering an area of 1.8 km² and 40 km of wharf. A number of companies run theirown private docks, and 70 million metric tons of goods yearly are handled in Duisburg on

Multimodal Logistics Parks
042607 Puerto Nuevo Report Vol 4 Final Page 36THE TIOGA GROUP
average. Duisburg Harbor is approximately 155 miles from the North Sea and is considered thehub of a 169-mile long system of inland waterways.
Logport
Logport is a logistics center at the former Duisburg-Rheinhausen ironworks site. The Logportproject was started in 1998. Logport is situated on approximately 665 acres with access to itsown river container terminal, road, rail, and nearby airports. The site is classed as “industrialspace”and offers little or no land-use restrictions under German zoning laws. Exhibit 19 showsthe “brownfield” ironworks site and a current aerial view of Logport
Exhibit 19: Logport Before (Left) and After
Logport is located in the heart of central Europe at the intersection of north-south and east-westtraffic. Approximately 30 million consumers live within a 94-mile radius of Logport. Threeeast-west and two north-south roads provide an 8-hour travel time to reach 40 percent of theentire European Union population, approximately 150 million consumers.
Logport’s container terminal began operation in February 2001. To provide rail service to thesite, the Duisport Group is entering into a joint venture with an existing rail operator to link thePort of Duisburg, Duisburg-Hochfeld (coal terminal), and Logport with a shuttle service. Afourth modal connection by air is available at the Düsseldorf International Airport located 10miles from Logport.
Direct connection to Europe’s most important waterway, the River Rhine, is available to Logport. This connection is enhanced by the direct link to Duisport, Europe’s largest inland port.
The three target industries for Logport are logistics and the transportation sector, logistics-basedmanufacturing, and logistics-oriented services.

Multimodal Logistics Parks
042607 Puerto Nuevo Report Vol 4 Final Page 37THE TIOGA GROUP
Multimodal Connections
Duisburg and Logport are connected to the German Autobahn system. Five such roads extendthrough the city area or pass it.
Duisburg is served by the InterCityExpress and InterCity long-distance network of the DeutscheBahn, the German national railway.
Success Factors
The Logport site is ideally chosen to access a very large market base. The use of a brownfieldsite with preexisting river and rail access minimized start-up cost and time.
The role of Duisport management is critical, bringing extensive port facility operating andmarketing experience to the project.

Rail Intermodal Parks
042607 Puerto Nuevo Report Vol 4 Final Page 38THE TIOGA GROUP
7. Joliet Arsenal Development Authority (JADA)
Overview
The Joliet Arsenal was developed by the U.S. Army in the early 1940s as a munitions plant. Itwas located on a 26,500-acre site near Joliet, IL, about 40 miles southwest of Chicago (Exhibit20). In 1976 the Arsenal was decommissioned and in 1993 the U.S. Army declared the JolietArsenal site as excess property.
Exhibit 20: Joliet Arsenal Location
In 1995, the site was subdivided for both public and private use and the Joliet ArsenalDevelopment Authority (JADA) was established to facilitate and promote the redevelopment of3,000 acres of Arsenal property. JADA worked with all levels of government, more than adozen public agencies and private industry to create a development plan.
The cornerstone of this redevelopment was a complex of over 2,000 acres being developed byCenterPoint Properties, one of the largest industrial real estate developers in the Chicago region.In 2000, the U.S. Army transferred ownership of nearly 1,900 acres to CenterPoint. Thisproperty was combined with 375 acres of property previously acquired by CenterPoint to enabledevelopment of the CenterPoint Intermodal Center (CIC). The plan for CIC included aBurlington Northern Santa Fe (BNSF) transportation complex named Logistics Park Chicago(LPC) along with an adjacent industrial park (Exhibit 21). CIC’s industrial park is currently located on 1,100 acres and when fully developed will encompass up to 12 million square feet ofrail-served industrial buildings suitable for warehousing, distribution and light manufacturing.
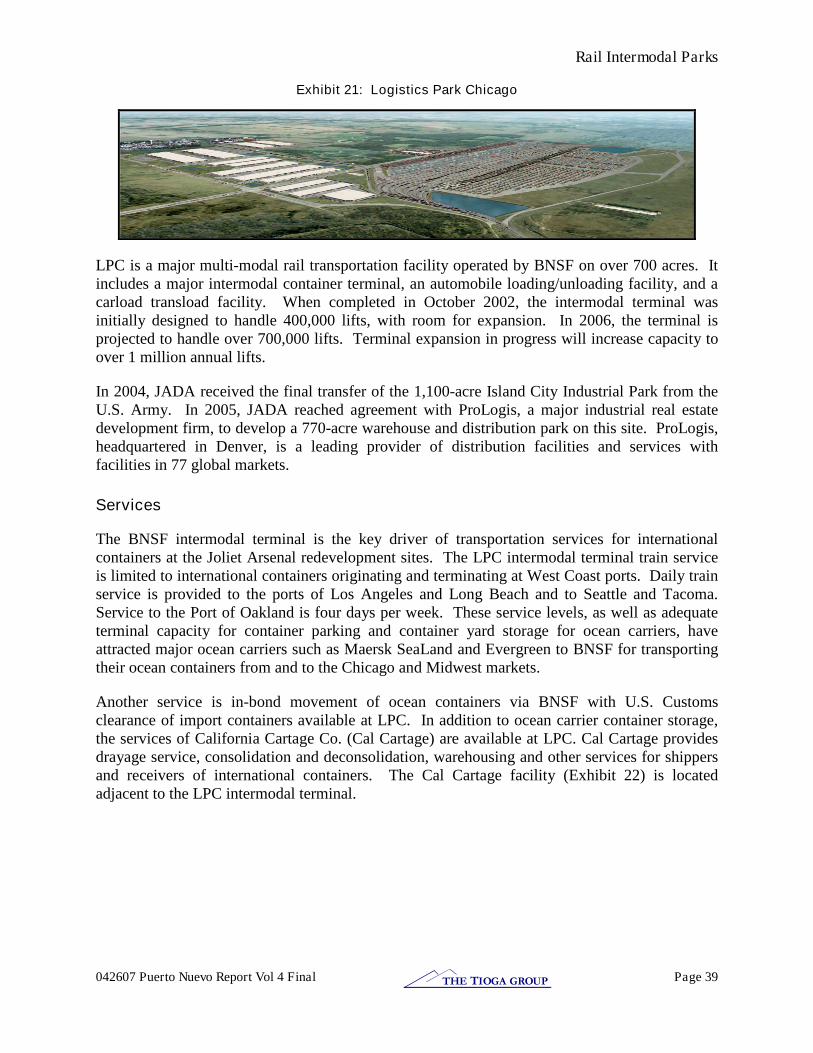
Rail Intermodal Parks
042607 Puerto Nuevo Report Vol 4 Final Page 39THE TIOGA GROUP
Exhibit 21: Logistics Park Chicago
LPC is a major multi-modal rail transportation facility operated by BNSF on over 700 acres. Itincludes a major intermodal container terminal, an automobile loading/unloading facility, and acarload transload facility. When completed in October 2002, the intermodal terminal wasinitially designed to handle 400,000 lifts, with room for expansion. In 2006, the terminal isprojected to handle over 700,000 lifts. Terminal expansion in progress will increase capacity toover 1 million annual lifts.
In 2004, JADA received the final transfer of the 1,100-acre Island City Industrial Park from theU.S. Army. In 2005, JADA reached agreement with ProLogis, a major industrial real estatedevelopment firm, to develop a 770-acre warehouse and distribution park on this site. ProLogis,headquartered in Denver, is a leading provider of distribution facilities and services withfacilities in 77 global markets.
Services
The BNSF intermodal terminal is the key driver of transportation services for internationalcontainers at the Joliet Arsenal redevelopment sites. The LPC intermodal terminal train serviceis limited to international containers originating and terminating at West Coast ports. Daily trainservice is provided to the ports of Los Angeles and Long Beach and to Seattle and Tacoma.Service to the Port of Oakland is four days per week. These service levels, as well as adequateterminal capacity for container parking and container yard storage for ocean carriers, haveattracted major ocean carriers such as Maersk SeaLand and Evergreen to BNSF for transportingtheir ocean containers from and to the Chicago and Midwest markets.
Another service is in-bond movement of ocean containers via BNSF with U.S. Customsclearance of import containers available at LPC. In addition to ocean carrier container storage,the services of California Cartage Co. (Cal Cartage) are available at LPC. Cal Cartage providesdrayage service, consolidation and deconsolidation, warehousing and other services for shippersand receivers of international containers. The Cal Cartage facility (Exhibit 22) is locatedadjacent to the LPC intermodal terminal.
Rail Intermodal Parks
042607 Puerto Nuevo Report Vol 4 Final Page 40THE TIOGA GROUP
Exhibit 22: Cal Cartage LPC Warehouse
CIC is also a designated Foreign Trade Zone. This gives manufacturers and processors theability to take advantage of FTZ duty deferral, duty reduction and weekly customs entry,providing cost reduction opportunity. With the BNSF service for import and export containershipments along with access to CIC development sites, the Joliet Arsenal provides an attractivelocation for companies involved in international trade and distribution of imports which movevia West Coast ports.
Governance
JADA is governed by a nine-member board. Four members are appointed by the Governor withconsent of the Senate and five members are appointed by the Will County Board. All membersare from Will County. JADA has the authority to borrow money and to issue revenue bondswith a maximum indebtedness of $100 million. Day-to-day operations are managed by anexecutive director who is responsible to the board. Initial funding of JADA operations camefrom a State grant which provided the seed money to get it started. Subsequent funding ofoperations and capital improvements came from land sales. Grant funding also was secured forspecific projects. As a result of these sources of funding JADA has never used its bondingauthority.
Success Factors
The primary objective of the redevelopment of the Joliet Arsenal by JADA was to createeconomic benefits and job opportunities from the reuse of the Arsenal property. However, itappears that the driving force for the logistics-based development was the developer, CenterPointProperties. CenterPoint led the effort to assemble the land, deal with the environmental issues,secure needed financing, and work with BNSF to site and develop its transportation facilities atthe Arsenal. John Gates, CenterPoint’s president and CEO, gives an indication of the difficultyof the project, “Laying the foundations for one of the world’s premier multi-modal distributioncomplexes has been a truly extraordinary effort over many years.… A truly remarkable team of public officials and private professionals has overcome literally thousands of obstacles to makethe redevelopment of the Joliet Arsenal a reality.”
Rail Intermodal Parks
042607 Puerto Nuevo Report Vol 4 Final Page 41THE TIOGA GROUP
CenterPoint’s 1,100-acre development plan for CIC is reported to be five years ahead ofschedule, and the ProLogis planned development of a 770-acre warehouse and distribution parkis being developed on the south side of the Arsenal redevelopment complex.
The CenterPoint development has attracted several major industries including two huge Wal-Mart warehouse and distribution facilities. Exhibit 23 is a listing of the CIC customers:
Exhibit 23: CIC Customers
CenterPoint Intermodal Center Customer List1) BNSF Logistics Park Chicago 715 acres2) Maersk Sea Land 17 acres3) California Cartage, Inc. 213,500 square feet4) Georgia Pacific 1,001,200 square feet5) DSC Logistics 1,022,000 square feet6) Potlatch, Inc. 624,000 square feet7) Sanyo Logistics 400,000 square feet
Partners Warehouse 200,000 square feet8) Wal-Mart 1,600,000 square feet9) Wal-Mart 1,800,000 square feet
Location
Chicago is the U.S. transportation and distribution hub. This is a great location for bothindustrial development in general and logistics-related development in particular. Growth ofU.S. imports over West Coast ports has created the demand for rail transportation to Midwestmarkets that utilize Chicago as a distribution hub. BNSF was reaching capacity limits at itsChicago terminals. These two factors created the “perfect storm” that drove the success of combined development of the BNSF logistics park, LPC, and CenterPoint’s business park, CIC.
Market and Funding
This project had the necessary prerequisites that lead to success: adequate financing, a solid andwell understood market opportunity, and a willing Class I railroad. In spite of this, it took nearlya decade of work from decommissioning to establishment of the inland port, which opened inlate 2002.
Willing Railroad
When BNSF developed Logistics Park Chicago (LPC) at the Joliet Arsenal, it changed itsoperations to concentrate most of its international container business at LPC. Most of theCalifornia ocean carrier business was taken out of BNSF’s Corwith and Cicero terminals. The BNSF’sPacific Northwest container business is still handled at the Cicero terminal because theformer BN lines from the Pacific Northwest come in to Cicero.
Because BNSF shifted large volumes of existing ocean carrier container traffic fromoverburdened Chicago terminals to Joliet, the new facility had a ready-made traffic base. Afterfour years of operations LPC is expected to handle about 700,000 annual lifts in 2006, making itone of the busiest terminals in the BNSF system.
Rail Intermodal Parks
042607 Puerto Nuevo Report Vol 4 Final Page 42THE TIOGA GROUP
Champion
Every major project of this scope and complexity needs a particular “champion” to carry it forward and CenterPoint filled that role for this project.
The CenterPoint Intermodal Center adjacent to LPC has been very successful in attractingindustry and is reaching capacity with the recent development of a large Wal-Mart warehouseand distribution facility.
The Wal-Mart facility at LPC is a 3.4 million-square-foot warehouse with future capacityexpected to reach 5.2 million square feet. This facility is a Midwest import distribution centerfor Wal-Mart. Pacific import containers are brought into LPC by BNSF and delivered to theWal-Mart facility for distribution to Wal-Mart stores and distribution centers throughout theMidwest.

Rail Intermodal Parks
042607 Puerto Nuevo Report Vol 4 Final Page 43THE TIOGA GROUP
8. Global III Intermodal Terminal, Rochelle, IL
Overview
The Union Pacific Global III Intermodal Facility, located in Rochelle, IL, was built to meet thegrowing need for intermodal terminal capacity in the Chicago market. Unlike other intermodalterminal development projects, the driving force for this facility was the railroad and its need forcapacity. It was not driven by an industrial development company or public economicdevelopment authority seeking an industrial development opportunity.
The development encompasses two facilities that cover 843 acres of 1,200 acres owned by UnionPacific (UP) (Exhibit 24).
The first is a 13-track carload classification yard for assembling line haul trains.The yard also includes support tracks for locomotive servicing. This facility wasopened in December 2002.
The second is an intermodal terminal with four 7,000-foot loading tracks, a 10-lane automated gate system, and a 7,200-unit container storage yard. Theterminal, which was opened in August 2003, has capacity to perform 720,000 liftsannually.
Exhibit 24: Rochelle Rail Development Site
The intermodal terminal and the switching yard work in tandem to load railcars and build railcarblocks of intermodal containers for movement beyond Chicago. These blocks are shuttled tointermodal facilities of eastern railroads in the Chicago area for interline movement. Blocks arealso made for the UP’s intermodal terminal at Yard Center on the south side of Chicago for transport to Texas, Mexico, and other Southwest UP markets. Westbound intermodal service

Rail Intermodal Parks
042607 Puerto Nuevo Report Vol 4 Final Page 44THE TIOGA GROUP
from Rochelle is provided to major West Coast ports and intermediate points. Exhibit 25 showsthe other UP intermodal terminals in the Chicago area.
Exhibit 25: UP Intermodal Terminals in Greater Chicago
Global III is 80 miles west of Chicago. Rochelle, IL, was not the UP’s first choice for the facility location. UP selected Rochelle after a 5-year search for a municipality that was willing toaccept the development of an intermodal terminal. The first two sites selected were in WestChicago, IL, and Elburn, IL, approximately 38 and 54 miles west of Chicago, respectively.Public and political opposition to these two sites forced the railroad further west to the site atRochelle.
Parties and Roles
The local political and economic development officials from Rochelle promoted this site locationto the UP when it became apparent that the two sites closer to Chicago were not going to besuccessfully developed. The local officials saw the terminal employment and increased potentialfor future economic development as a major benefit. These benefits enabled local officials tocooperate with the UP on development of the site. The construction and engineering firmRagnar Benson built Global III for the Union Pacific at a cost of $181 million.
In addition to the rail facilities, there is an industrial park adjacent to the intermodal terminalbeing developed by CenterPoint Properties as a joint marketing partnership with UP. TheCenterPoint Intermodal Center at Rochelle is a 289-acre site just north of the terminal. There isalso a 200-acre land parcel adjacent to the CenterPoint property that is being marketed by thenational commercial real estate firm Martin, Goodrich and Waddell. Both of these sites, as wellas several thousand acres of farmland, will have direct access to the UP terminal after a roadproject is built by the City of Rochelle. Jack Dame Road, shown in Exhibit 24, connects Route38 with the terminal entrance road, avoiding city streets in Rochelle. Once this road isconstructed, development of property north of the UP main line is expected to accelerate.
Rail Intermodal Parks
042607 Puerto Nuevo Report Vol 4 Final Page 45THE TIOGA GROUP
Services
This facility provides UP with much needed intermodal capacity in the Chicago area albeit at adistance from the center of the city. However, industrial and warehouse expansion is movingwest of the city and the UP site has good existing intrastate access both east/west andnorth/south.
Direct rail-to-rail interchange is accomplished by building blocks of cars at Global III for directrail movement to connecting railroads in Chicago. This operation has been developed in arelatively efficient and effective manner.
Highway drayage of intermodal freight between local Chicago markets and Global III has provedto be relatively expensive. Due to the highway distance of 80 miles each way and local freightimbalance, Global III has experienced a drayage cost premium of $250 to $350 per movementwhen compared to the drayage of other Chicago terminals. The drayage differential depends onthe relative location of the freight customer and the intermodal terminal. In addition, there is a$136 surcharge for tolls associated with drayage service on I-88 between Chicago and Rochelle.
The UP carload and unit train classification yard is not expected to generate local economicdevelopment beyond its own employment and vendor purchases. The yard primarily sorts carsand unit trains for distant points rather than serving local customers.
Competition
Exhibit 26: Rochelle Highway Access
UP competes directly with BNSF for international container business moving over west coastports. BNSF’s Logistics Park Chicago, built on the site of the former Joliet Arsenal, currently provides very effective competition to the UP because it is located only 40 miles from Chicago.

Rail Intermodal Parks
042607 Puerto Nuevo Report Vol 4 Final Page 46THE TIOGA GROUP
In addition, the CenterPoint Intermodal Center at Joliet has been successful in attracting severallarge distribution facilities. There is also regional competition for industrial development in LaSalle/Peru, IL, 45 miles south of Rochelle on I-80, in Rockford, IL, 20 miles north and DeKalb,IL, 10 miles east. These communities have a larger work force and have been more aggressivein working to develop industry that has been attracted to the region by the UP intermodalterminal.
Success Factors
Global III’s primary role for the UP, at present, is to provide capacity for the growing intermodal business that travels through Chicago. The terminal allows UP the opportunity to buildinterchange blocks for connecting railroads as well as build UP west bound trains outside thecongestion of Chicago proper. Rochelle is located at the intersection of I-39 and I-88 andtherefore enjoys excellent highway access both north/south and east/west. The region haspotential as a major Midwest distribution center that can serve not only the Chicago market butalso Milwaukee, Madison, WI, Springfield, IL, and the Quad Cities markets.
Lessons Learned
Union Pacific is making a long-term investment in advance of anticipated westward developmentin the Chicago area. UP acted to secure needed capacity ahead of demand, while the localjurisdiction was cooperative and the price of land was relatively low.
Although the UP terminal has attracted industrial development in the region, developmentadjacent to the terminal has been relatively slow. There are two issues that will improve futuredevelopment for the city of Rochelle. One is the development of Jack Dame Road. An importantlesson is to include direct access to the intermodal terminal as part of the development plan. Thesecond issue is to be competitive with other communities in the region with respect todevelopment. Because of the nature of intermodal, the entire region can benefit from access toan intermodal terminal. Although Rochelle will be the closest community to the terminal, it isstill necessary for it to be competitive with other communities in the region in attractingdevelopment.
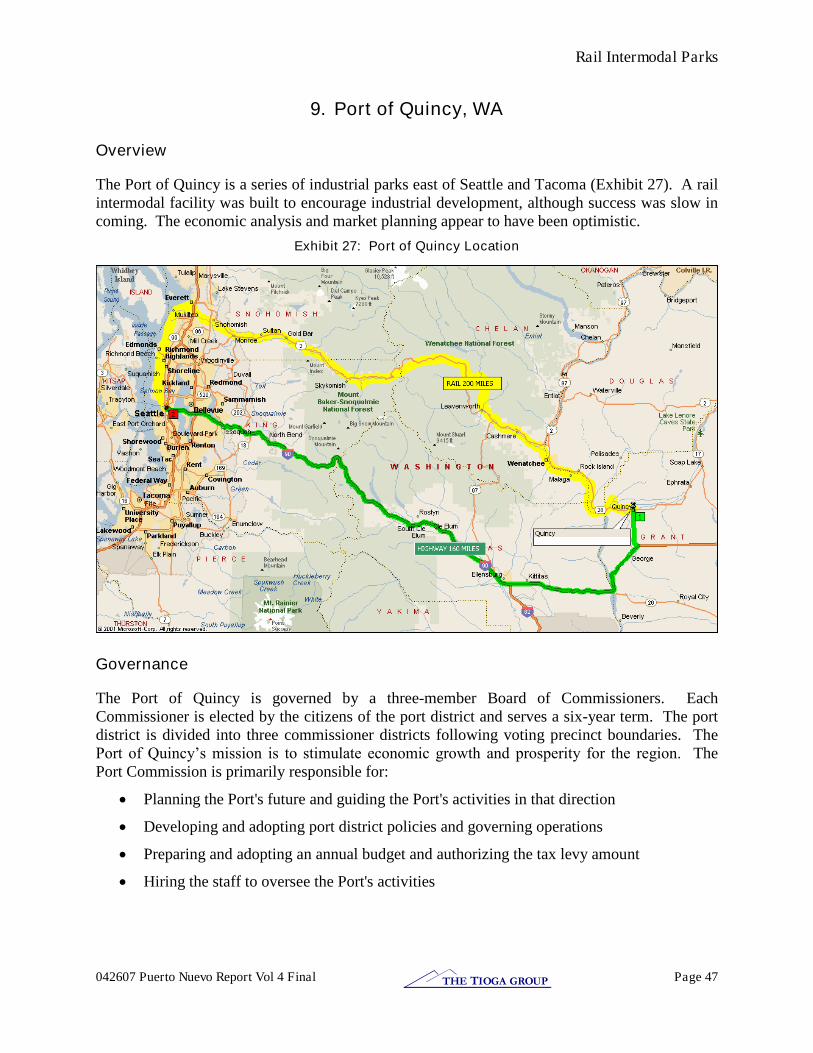
Rail Intermodal Parks
042607 Puerto Nuevo Report Vol 4 Final Page 47THE TIOGA GROUP
9. Port of Quincy, WA
Overview
The Port of Quincy is a series of industrial parks east of Seattle and Tacoma (Exhibit 27). A railintermodal facility was built to encourage industrial development, although success was slow incoming. The economic analysis and market planning appear to have been optimistic.
Exhibit 27: Port of Quincy Location
Governance
The Port of Quincy is governed by a three-member Board of Commissioners. EachCommissioner is elected by the citizens of the port district and serves a six-year term. The portdistrict is divided into three commissioner districts following voting precinct boundaries. ThePort of Quincy’s mission is to stimulate economic growth and prosperity for the region. ThePort Commission is primarily responsible for:
Planning the Port's future and guiding the Port's activities in that direction
Developing and adopting port district policies and governing operations
Preparing and adopting an annual budget and authorizing the tax levy amount
Hiring the staff to oversee the Port's activities

Rail Intermodal Parks
042607 Puerto Nuevo Report Vol 4 Final Page 48THE TIOGA GROUP
Services
Quincy’s short-haul rail initiative was coupled with a competitive pricing policy from NorthWestContainer Services, the exclusive container operator. The Port of Quincy can handle dry orrefrigerated containers and offers a dedicated steamship container depot with full maintenanceand repair capability. As shown in Exhibit 27, however, Quincy is 200 miles from Seattle by railvs. 160 miles by highway, making it difficult for intermodal rail to compete head-on withtrucking.
Exhibit 28: Quincy Industrial Park 1
Industrial Park 2 (Exhibit 29) has been divided into individual parcels. The smallest is less than7 acres, and the largest over 12, but parcels can be combined to accommodate largerdevelopments. Industrial Park 3 comprises a 50-acre parcel. Both Parks have access to allutilities, such as power, municipal water, sewer and natural gas. And, with rail bordering thesite, these properties have excellent loading or shipping options.
Exhibit 29: Quincy Industrial Park 2
Industrial Park 1 (Exhibit 28) is fully leased to two apple packing industries -- Double DiamondFruit Company and Custom Apple Packers. Vocational training and support is available fromcommunity colleges in Wenatchee and Moses Lake as well as Washington ManufacturingServices out of Spokane.
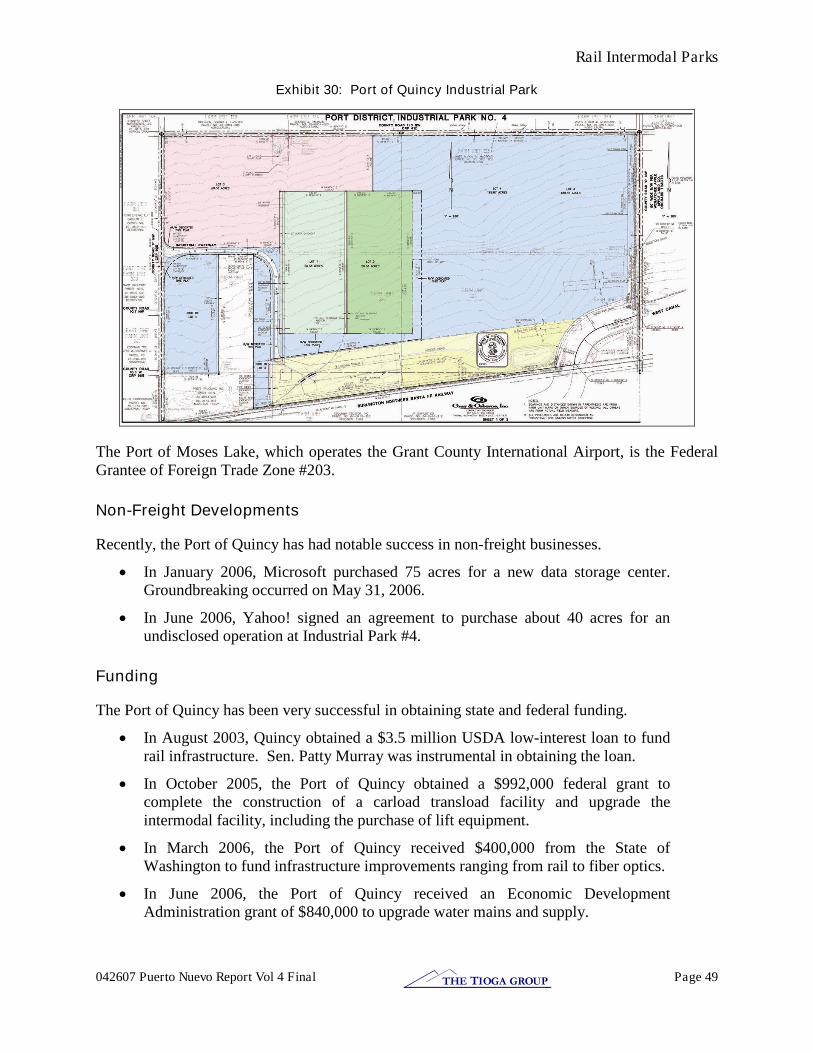
Rail Intermodal Parks
042607 Puerto Nuevo Report Vol 4 Final Page 49THE TIOGA GROUP
Exhibit 30: Port of Quincy Industrial Park
The Port of Moses Lake, which operates the Grant County International Airport, is the FederalGrantee of Foreign Trade Zone #203.
Non-Freight Developments
Recently, the Port of Quincy has had notable success in non-freight businesses.
In January 2006, Microsoft purchased 75 acres for a new data storage center.Groundbreaking occurred on May 31, 2006.
In June 2006, Yahoo! signed an agreement to purchase about 40 acres for anundisclosed operation at Industrial Park #4.
Funding
The Port of Quincy has been very successful in obtaining state and federal funding.
In August 2003, Quincy obtained a $3.5 million USDA low-interest loan to fundrail infrastructure. Sen. Patty Murray was instrumental in obtaining the loan.
In October 2005, the Port of Quincy obtained a $992,000 federal grant tocomplete the construction of a carload transload facility and upgrade theintermodal facility, including the purchase of lift equipment.
In March 2006, the Port of Quincy received $400,000 from the State ofWashington to fund infrastructure improvements ranging from rail to fiber optics.
In June 2006, the Port of Quincy received an Economic DevelopmentAdministration grant of $840,000 to upgrade water mains and supply.
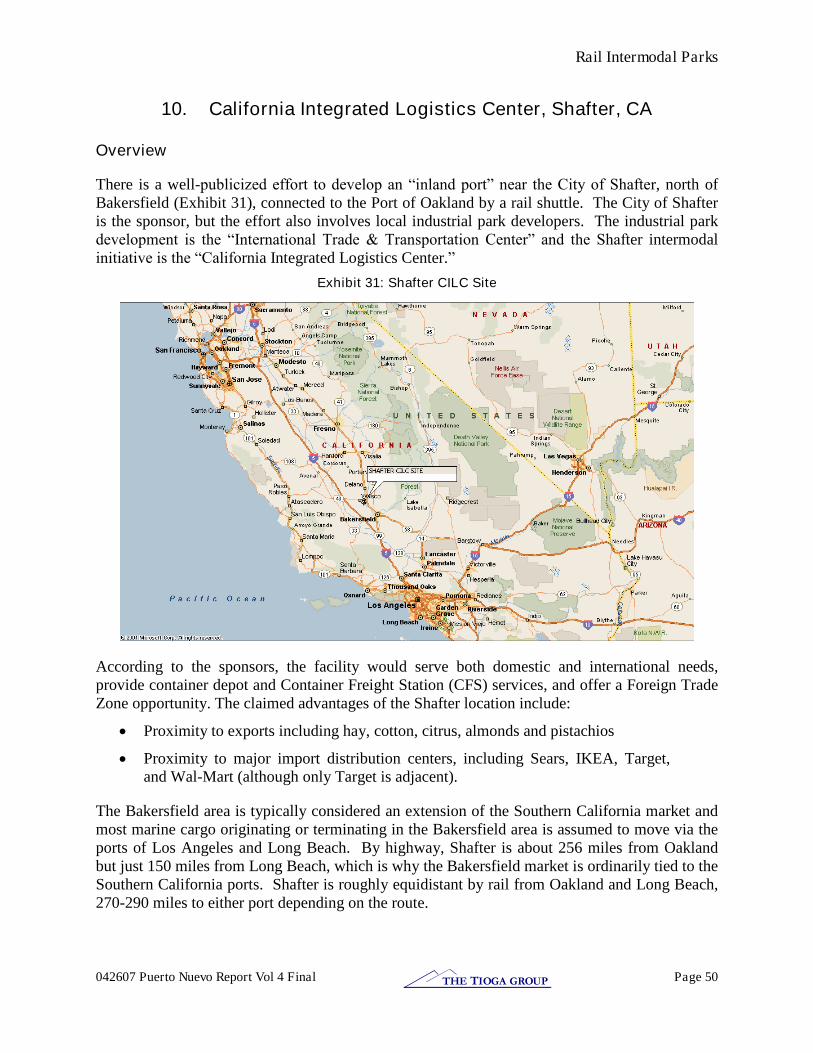
Rail Intermodal Parks
042607 Puerto Nuevo Report Vol 4 Final Page 50THE TIOGA GROUP
10. California Integrated Logistics Center, Shafter, CA
Overview
There is a well-publicized effort to develop an “inland port” near the City of Shafter, north ofBakersfield (Exhibit 31), connected to the Port of Oakland by a rail shuttle. The City of Shafteris the sponsor, but the effort also involves local industrial park developers. The industrial parkdevelopment is the “International Trade & Transportation Center” and the Shafter intermodalinitiative is the “California Integrated Logistics Center.”
Exhibit 31: Shafter CILC Site
According to the sponsors, the facility would serve both domestic and international needs,provide container depot and Container Freight Station (CFS) services, and offer a Foreign TradeZone opportunity. The claimed advantages of the Shafter location include:
Proximity to exports including hay, cotton, citrus, almonds and pistachios
Proximity to major import distribution centers, including Sears, IKEA, Target,and Wal-Mart (although only Target is adjacent).
The Bakersfield area is typically considered an extension of the Southern California market andmost marine cargo originating or terminating in the Bakersfield area is assumed to move via theports of Los Angeles and Long Beach. By highway, Shafter is about 256 miles from Oaklandbut just 150 miles from Long Beach, which is why the Bakersfield market is ordinarily tied to theSouthern California ports. Shafter is roughly equidistant by rail from Oakland and Long Beach,270-290 miles to either port depending on the route.

Rail Intermodal Parks
042607 Puerto Nuevo Report Vol 4 Final Page 51THE TIOGA GROUP
Exhibit 32: Shafter Project Site
Legislation
The Shafter project sponsors have taken the unusual step of introducing legislation to giveShafter precedence over other inland port projects. The current version of SB 1010 wouldestablish the Shafter site as a unique circumstance.
Economics
At an early point in the development of the Shafter project, sponsors envisioned using revenuebonds to finance the construction of an intermodal facility. The revenue bonds would be repaidfrom the intermodal terminal operating profits.
The difficulty with this plan is that intermodal terminals themselves do not ordinarily yieldoperating profits, so there would be no net revenue to cover the bonds. Railroads profit fromintermodal line haul operations between terminals, not from owning the terminals themselves.Terminal contractors profit from providing lift services and ancillary services under contract anddo not own, lease, or build terminals. In other words, no one pays rent on intermodal terminals.The few privately owned intermodal terminals in North America (such as Stackbridge inMassachusetts or Port of Tucson in Arizona) generate their revenue from lift fees, not rent.
Status
A review of the available reports and presentations on the Shafter initiative suggests that theproposal faces some significant near-term obstacles. There is no intermodal terminal at Shafteryet. The sponsors obtained $5 million in funds from the State of California, which are beingused to install a track connection between the industrial park/terminal site and the BNSFmainline. Although the sponsors state that funding will be forthcoming for terminal

Rail Intermodal Parks
042607 Puerto Nuevo Report Vol 4 Final Page 52THE TIOGA GROUP
construction, it is not clear that sufficient funding will be available. The sponsors note thedifficulty of placing debt unless there is a service and volume commitment. The study team wasunable to locate any market analyses beyond the conceptual level or any financial or economicanalyses of costs, rates, etc. Railroad interest in serving Shafter has been minimal, and theproject lacks service commitments from either railroad.
An interim facility was opened along the UP line on the east side of the Shafter area but there hasbeen no significant business. A track connection is being built to an industrial park adjacent tothe BNSF line (Exhibit 32).

Rail Intermodal Parks
042607 Puerto Nuevo Report Vol 4 Final Page 53THE TIOGA GROUP
11. Neomodal, Stark County, Ohio
Overview
The Stark County intermodal terminal (Neomodal) was opened in 1996 under the auspices of theStark County (Ohio) Development Board (Exhibit 33). It is a good example of a new terminalbuilt with government funding, without benefit of a comprehensive marketing plan, and withoutprivate sector financial commitment. Perhaps this could be best characterized as a “build it and maybe they will come” approach. The result has been a terminal with little business.
Exhibit 33: Neomodal Location
Terminal
The 28-acre terminal (Exhibit 34) is a technologically advanced design using overhead cranesthat can be operated from the ground. The gate facility was developed using the best technologyavailable at the time.
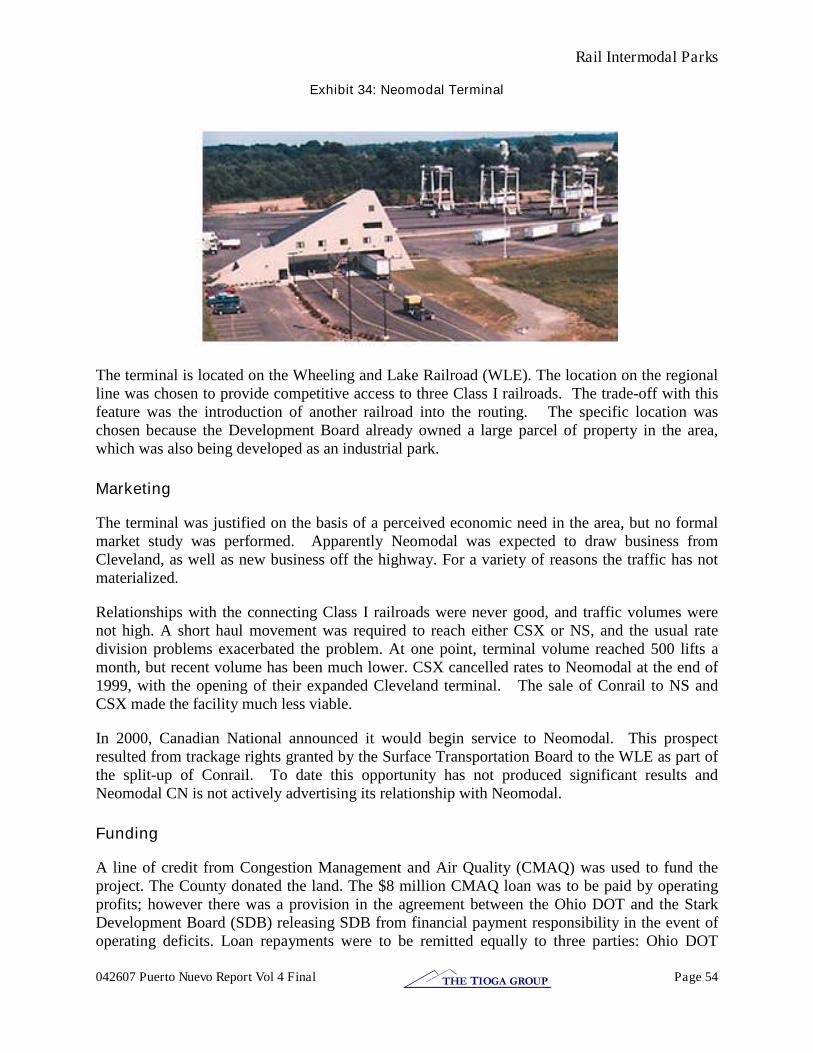
Rail Intermodal Parks
042607 Puerto Nuevo Report Vol 4 Final Page 54THE TIOGA GROUP
Exhibit 34: Neomodal Terminal
The terminal is located on the Wheeling and Lake Railroad (WLE). The location on the regionalline was chosen to provide competitive access to three Class I railroads. The trade-off with thisfeature was the introduction of another railroad into the routing. The specific location waschosen because the Development Board already owned a large parcel of property in the area,which was also being developed as an industrial park.
Marketing
The terminal was justified on the basis of a perceived economic need in the area, but no formalmarket study was performed. Apparently Neomodal was expected to draw business fromCleveland, as well as new business off the highway. For a variety of reasons the traffic has notmaterialized.
Relationships with the connecting Class I railroads were never good, and traffic volumes werenot high. A short haul movement was required to reach either CSX or NS, and the usual ratedivision problems exacerbated the problem. At one point, terminal volume reached 500 lifts amonth, but recent volume has been much lower. CSX cancelled rates to Neomodal at the end of1999, with the opening of their expanded Cleveland terminal. The sale of Conrail to NS andCSX made the facility much less viable.
In 2000, Canadian National announced it would begin service to Neomodal. This prospectresulted from trackage rights granted by the Surface Transportation Board to the WLE as part ofthe split-up of Conrail. To date this opportunity has not produced significant results andNeomodal CN is not actively advertising its relationship with Neomodal.
Funding
A line of credit from Congestion Management and Air Quality (CMAQ) was used to fund theproject. The County donated the land. The $8 million CMAQ loan was to be paid by operatingprofits; however there was a provision in the agreement between the Ohio DOT and the StarkDevelopment Board (SDB) releasing SDB from financial payment responsibility in the event ofoperating deficits. Loan repayments were to be remitted equally to three parties: Ohio DOT
Rail Intermodal Parks
042607 Puerto Nuevo Report Vol 4 Final Page 55THE TIOGA GROUP
CMAQ revolving fund; Ohio's Erie Canal Heritage Account (established under the NationalHeritage Corridor program), and Stark County Area Transportation Study (the MPO). Instead ofa 20 percent direct local match, OH DOT used toll revenue credits from tolls generated by theOhio Turnpike Authority under provisions of Section 1044 of ISTEA.
The project was overseen by a management committee of five people, including representationfrom ODOT. Construction of the terminal was completed in a period of one year; 16 separatepermits were required. Construction costs included only 10 percent engineering overhead vs. the“usual” ODOT’s 30percent -35 percent. As a result the terminal came in under the $11.2 millionbudget.
Lessons Learned
In order to be successful a project of this type needs to have the following:
A substantial market to serve and an effective plan for marketing the service.
Willing and committed Class I rail carriers.
Sufficient funding to develop the project.
This project enjoyed only one of the three necessary prerequisites.
Competing facilities are located in Cleveland (55 mi.), Columbus and Pittsburgh (90 mi.), andToledo (120 mi.), all of which are much larger population centers with more significantconcentrations of business. The Neomodal planners may not have thought clearly about themarket and potential competition in the market. Even before the Conrail split that furtherjeopardized their market, they did not properly consider the relative ability of competing railsystems to serve these population centers.

Rail Intermodal Parks
042607 Puerto Nuevo Report Vol 4 Final Page 56THE TIOGA GROUP
12. Detroit Intermodal Freight Terminal (DIFT)
Overview
Based on a consultant study completed in 1994, Michigan DOT (MDOT), with the support ofGM, Chrysler and Ford, embarked on a project to consolidate the intermodal terminals of thefour Class I rail carriers serving Detroit. At that time Conrail, Norfolk Southern (NS), CanadianNational (CN), and Canadian Pacific (CP) operated intermodal terminals in Detroit. The conceptwas the creation of a consolidated common user terminal located at Conrail’s Livernois Yard in Southwest Detroit. Livernois Yard, also referred to as Junction Yard, was selected as the site forthe consolidated terminal because of its central location and rail connection to all Detroitcarriers. In addition, at nearly 350 acres, this site was the only rail-served site large enough toaccommodate a consolidated terminal. The project was named Detroit Intermodal FreightTerminal and referred to as DIFT.
The purpose of the DIFT project was to support the economic competitiveness of southeasternMichigan and of the State by improving intermodal freight transportation and ensuring sufficientterminal capacity to meet future intermodal demand. Specific objectives included:
improving highway infrastructure to the common location
reducing the distance and related cost for trucking between the terminals, and
assisting the rail carriers in providing the terminal capacity needed for futuredemand.
This project was extremely ambitious because of the number of operational, commercial andengineering issues that needed to be resolved. At that time, Conrail had no interest in giving upits Livernois Yard property for use by other rail carriers and the project never advanced untilConrail was acquired by CSX and NS. The acquisition of Conrail by CSX and NS in June 1997provided an opportunity for Michigan DOT to revive the terminal consolidation project. As acondition of the Conrail merger, NS and CSX agreed to cooperate with MDOT on DIFT.
High-level political support for the project by Gov. John Engler, Congresswoman CarolynCheeks Kilpatrick, and Congressman John Dingell enabled an $18 million earmark for theproject within TEA-21 in 1998. Section 1602, High Priority Project 1221, describes the projectas, “Construct intermodal freight terminal in Wayne County, Michigan.” This funding enabled the DIFT project to be reactivated.
Detroit Intermodal Terminals
Following the integration of Conrail operations into NS and CSX in June 1999, Conrail’s Livernois Avenue intermodal terminal was shared by NS and CSX. The freight-car switchingoperations at Livernois yard continued to be operated by Conrail on behalf of both NS and CSX,who had equal access to Conrail’s Detroit customers. In addition, NS was operating two other terminals in Detroit: a Triple Crown Roadrailer terminal at its Melvindale Yard, and a smallintermodal terminal at Delray. CP operated two intermodal terminals in Detroit. The first wasCP Expressway, a specialized terminal for CP’s Expressway branded service to Toronto and
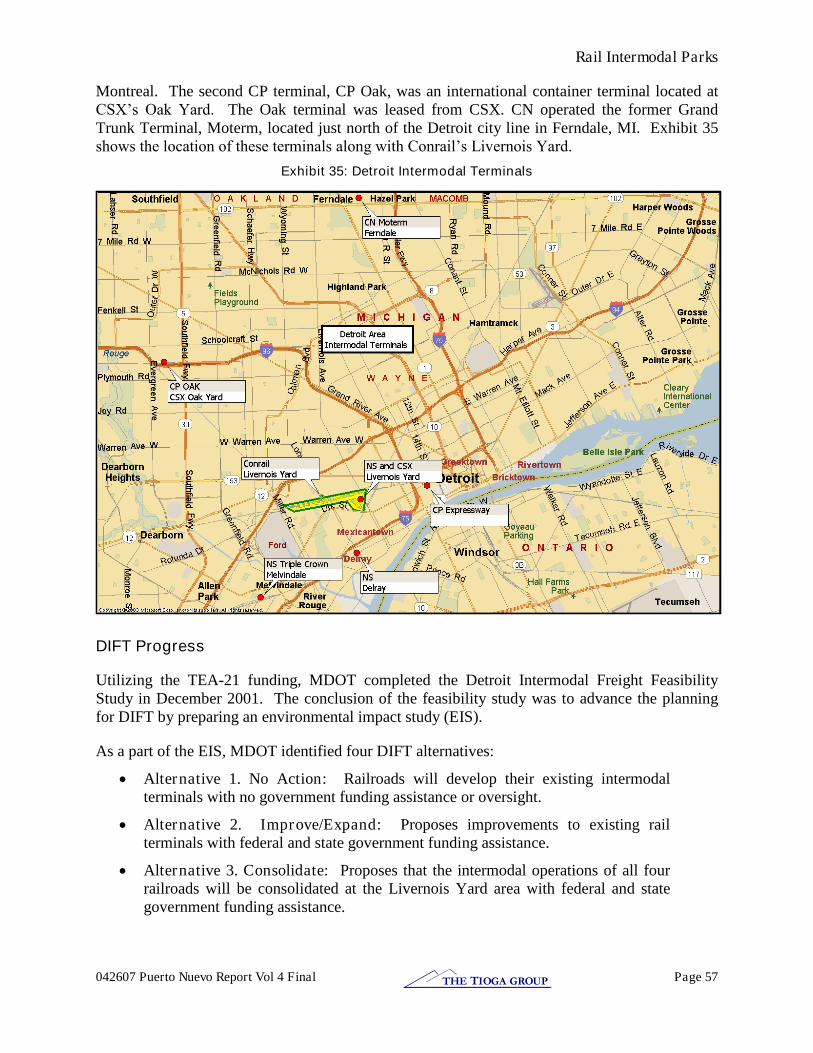
Rail Intermodal Parks
042607 Puerto Nuevo Report Vol 4 Final Page 57THE TIOGA GROUP
Montreal. The second CP terminal, CP Oak, was an international container terminal located atCSX’s Oak Yard. The Oak terminal was leased from CSX. CN operated the former GrandTrunk Terminal, Moterm, located just north of the Detroit city line in Ferndale, MI. Exhibit 35shows the location of these terminals along with Conrail’s Livernois Yard.
Exhibit 35: Detroit Intermodal Terminals
DIFT Progress
Utilizing the TEA-21 funding, MDOT completed the Detroit Intermodal Freight FeasibilityStudy in December 2001. The conclusion of the feasibility study was to advance the planningfor DIFT by preparing an environmental impact study (EIS).
As a part of the EIS, MDOT identified four DIFT alternatives:
Alternative 1. No Action: Railroads will develop their existing intermodalterminals with no government funding assistance or oversight.
Alternative 2. Improve/Expand: Proposes improvements to existing railterminals with federal and state government funding assistance.
Alternative 3. Consolidate: Proposes that the intermodal operations of all fourrailroads will be consolidated at the Livernois Yard area with federal and stategovernment funding assistance.
Rail Intermodal Parks
042607 Puerto Nuevo Report Vol 4 Final Page 58THE TIOGA GROUP
Alternative 4. The Composite Option: Proposes that the intermodal operationsof CSX, NS and CP will be consolidated at the Livernois Yard area, while CNMoterm terminal will be improved at its existing location. Projects will be fundedwith federal and state government funding assistance.
MDOT continues to advance the EIS and conduct public hearings to obtain community andstakeholder responses to the various alternatives. The EIS schedule, revised in December 2005,shows determination of the preferred/recommended alternative and finalization of the EIS inOctober 2006 with a Record of Decision (ROD) by FHWA in December 2006. Althoughfunding of preliminary engineering and EIS development have come from the $18 million TEA-21 earmark, actual project funding requires completion of the EIS and FHWA ROD. Once theROD is issued, the remaining funds from the original $18 million earmark can be utilized for theDIFT project. In addition, any future federal funding authorizations for the project can beutilized.
CSX and NS Intermodal Terminal Expansion
In 2002 the shared CSX and NS intermodal terminal at Livernois Yard was well beyond itsdesign capacity. The terminal occupied about 35 acres on the east side of Livernois Yard andhad a nominal capacity of about 60,000 lifts. Current operations of both carriers are estimated at90,000 to 100,000 lifts. In addition, since NS and CSX are direct competitors, sharing acommon facility created operational and commercial conflicts. As a result, CSX and NS agreedthat they would work together to expand their terminal capacity in Detroit. This was done bycreating a new facility on about 65 acres of adjacent Livernois Yard property for CSX andexpanding and improving the existing facility to provide NS with a comparable 65-acre terminal.
Since this project was consistent with the DIFT, MDOT agreed to consider a loan/grantapplication for the project under its current capital program for funding of transportationimprovements. The MDOT program provided matching-grant funding under a five-year loanwhich converted to a grant over the five-year loan term. The MDOT loan agreementcontractually obligates the carrier to make five loan payments to pay off the loan. However, ineach year that the borrower achieves certain agreed operating performance, the loan payment isconverted to a grant and waived.
Since the CSX and NS terminal expansions were located on Livernois Yard property owned byConrail, the application for the MDOT grant and the final loan agreement were completed byConrail on behalf of CSX and NS. The overall cost of the expansion of both terminals wasbetween $10 million and $11 million. Of this amount, $4.5 million was funded through theMDOT program. The MDOT loan agreement provided an operating performance requirement interms of combined CSX and NS lifts, which were agreed to by Conrail on behalf of CSX andNS. All agreements necessary to advance the project were completed by the end of 2003. TheCSX terminal was completed in 2004 and the NS expansion was completed in 2005. Exhibit 36shows the location of the two terminals within the Livernois Yard complex.
Although the CSX and NS expansions at Livernois Yard were not a part of the DIFT project,they did make a significant contribution to the DIFT objectives. The combined capacity of thetwo terminals more than doubled the capacity of the former Conrail terminal. The project alsoprovided land for future CSX and NS expansion and separated the terminal operations of the two
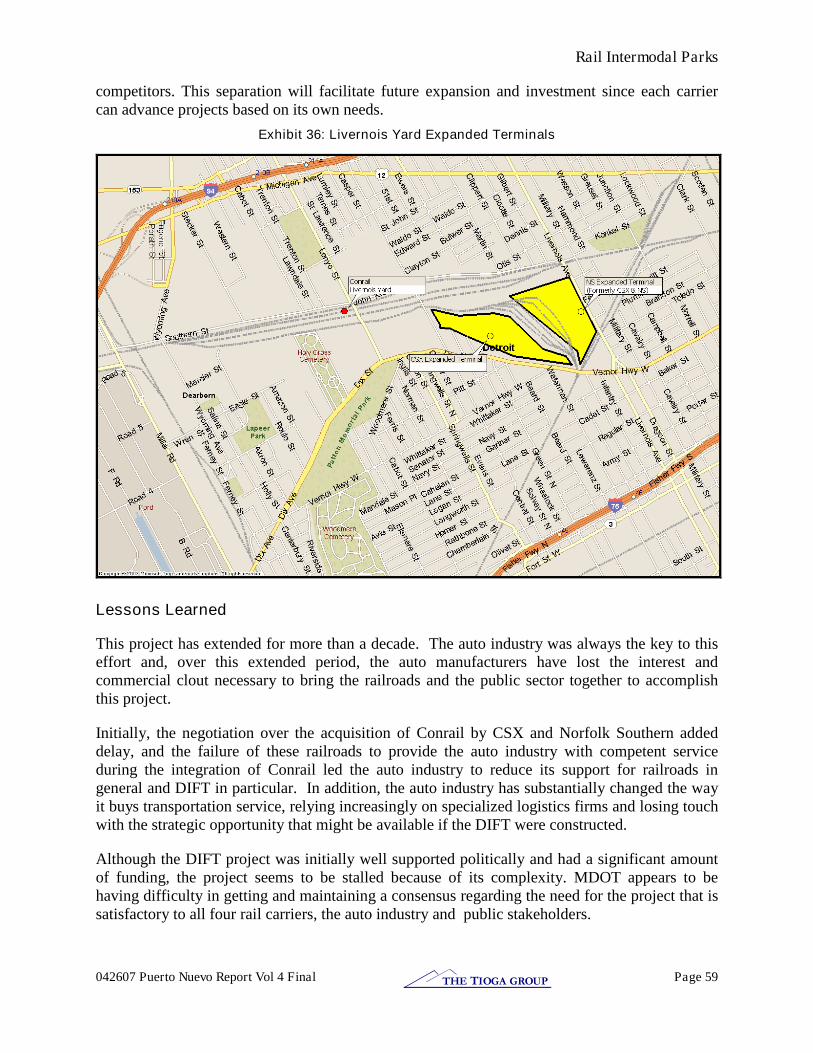
Rail Intermodal Parks
042607 Puerto Nuevo Report Vol 4 Final Page 59THE TIOGA GROUP
competitors. This separation will facilitate future expansion and investment since each carriercan advance projects based on its own needs.
Exhibit 36: Livernois Yard Expanded Terminals
Lessons Learned
This project has extended for more than a decade. The auto industry was always the key to thiseffort and, over this extended period, the auto manufacturers have lost the interest andcommercial clout necessary to bring the railroads and the public sector together to accomplishthis project.
Initially, the negotiation over the acquisition of Conrail by CSX and Norfolk Southern addeddelay, and the failure of these railroads to provide the auto industry with competent serviceduring the integration of Conrail led the auto industry to reduce its support for railroads ingeneral and DIFT in particular. In addition, the auto industry has substantially changed the wayit buys transportation service, relying increasingly on specialized logistics firms and losing touchwith the strategic opportunity that might be available if the DIFT were constructed.
Although the DIFT project was initially well supported politically and had a significant amountof funding, the project seems to be stalled because of its complexity. MDOT appears to behaving difficulty in getting and maintaining a consensus regarding the need for the project that issatisfactory to all four rail carriers, the auto industry and public stakeholders.
Rail Intermodal Parks
042607 Puerto Nuevo Report Vol 4 Final Page 60THE TIOGA GROUP
A further complication is that over the development period there have been multiple governors,mayors and public officials involved in the public process. Because there have been communityconcerns regarding the development, DIFT has become a political issue.
The inherent difficulty of getting large competing companies to reach long-term agreements oncomplex operating and commercial issues can be a major constraint to the project. Eachcompany’s driving self-interest makes it very difficult to create a consolidated operation withoutin some way disturbing the existing competitive balance. This is particularly true when dealingwith CSX and NS who are owners of the property and are being asked to make trade-offs thatmay improve a competitor’s position. CSX and NS must agree or the project cannot go forward.
On the other hand, when private sector companies develop a plan that satisfies their own self-interest, they can move very quickly. This was the case with CSX and NS on their own terminalexpansions at Livernois Yard. With MDOT funding as a key driver, along with the need forterminal capacity, CSX and NS found a way to work together for their mutual self-interest. Ifthe grant funding incentive is offered, the private sector companies can find a way to overcomecomplexity and other issues to take advantage of it.
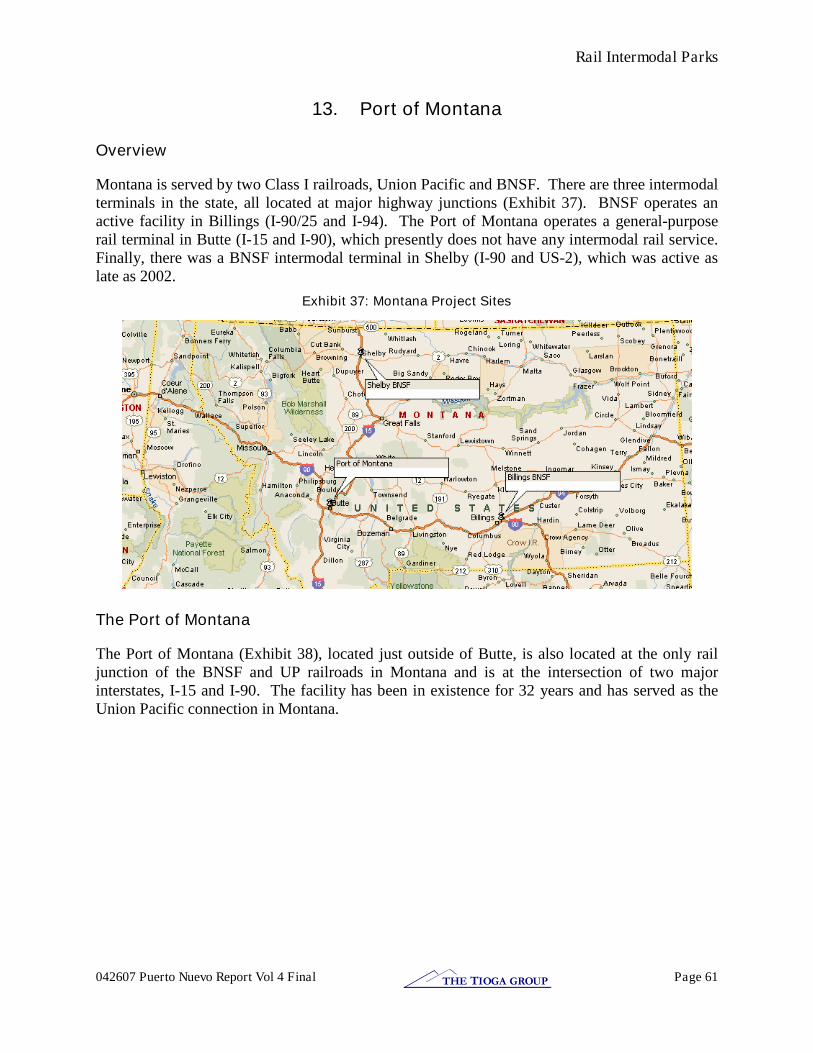
Rail Intermodal Parks
042607 Puerto Nuevo Report Vol 4 Final Page 61THE TIOGA GROUP
13. Port of Montana
Overview
Montana is served by two Class I railroads, Union Pacific and BNSF. There are three intermodalterminals in the state, all located at major highway junctions (Exhibit 37). BNSF operates anactive facility in Billings (I-90/25 and I-94). The Port of Montana operates a general-purposerail terminal in Butte (I-15 and I-90), which presently does not have any intermodal rail service.Finally, there was a BNSF intermodal terminal in Shelby (I-90 and US-2), which was active aslate as 2002.
Exhibit 37: Montana Project Sites
The Port of Montana
The Port of Montana (Exhibit 38), located just outside of Butte, is also located at the only railjunction of the BNSF and UP railroads in Montana and is at the intersection of two majorinterstates, I-15 and I-90. The facility has been in existence for 32 years and has served as theUnion Pacific connection in Montana.
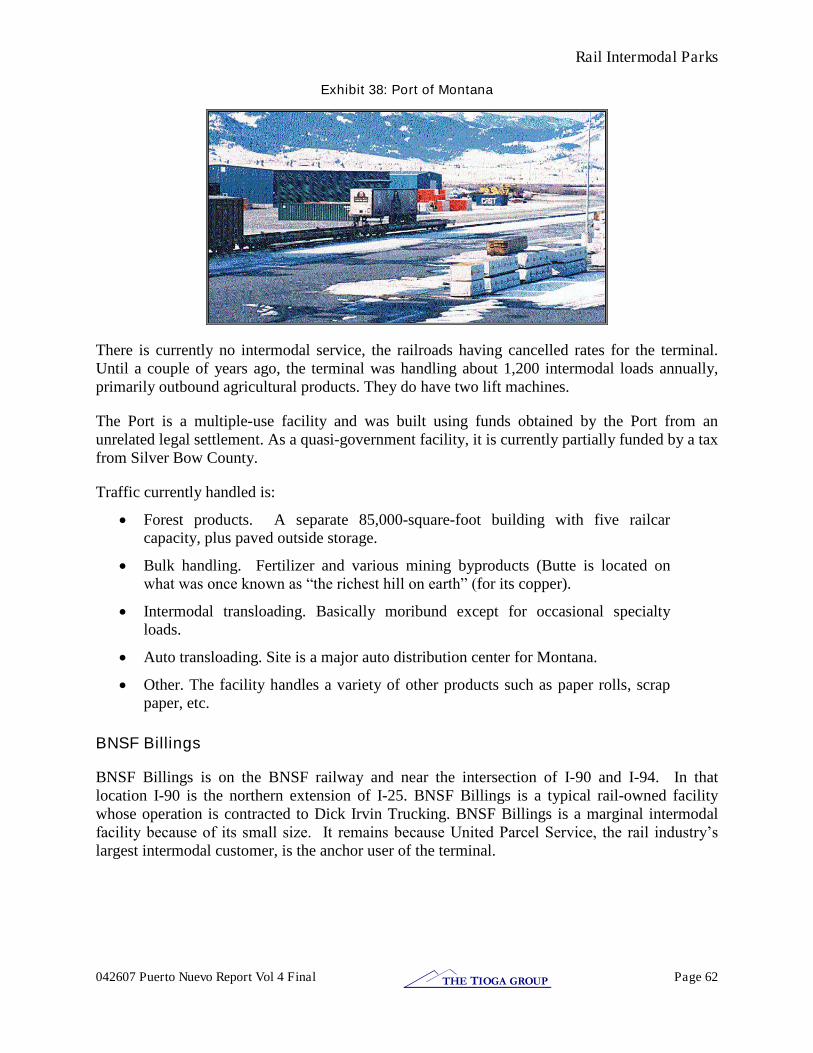
Rail Intermodal Parks
042607 Puerto Nuevo Report Vol 4 Final Page 62THE TIOGA GROUP
Exhibit 38: Port of Montana
There is currently no intermodal service, the railroads having cancelled rates for the terminal.Until a couple of years ago, the terminal was handling about 1,200 intermodal loads annually,primarily outbound agricultural products. They do have two lift machines.
The Port is a multiple-use facility and was built using funds obtained by the Port from anunrelated legal settlement. As a quasi-government facility, it is currently partially funded by a taxfrom Silver Bow County.
Traffic currently handled is:
Forest products. A separate 85,000-square-foot building with five railcarcapacity, plus paved outside storage.
Bulk handling. Fertilizer and various mining byproducts (Butte is located onwhat was once known as “the richest hill on earth” (for its copper).
Intermodal transloading. Basically moribund except for occasional specialtyloads.
Auto transloading. Site is a major auto distribution center for Montana.
Other. The facility handles a variety of other products such as paper rolls, scrappaper, etc.
BNSF Billings
BNSF Billings is on the BNSF railway and near the intersection of I-90 and I-94. In thatlocation I-90 is the northern extension of I-25. BNSF Billings is a typical rail-owned facilitywhose operation is contracted to Dick Irvin Trucking. BNSF Billings is a marginal intermodalfacility because of its small size. It remains because United Parcel Service, the rail industry’s largest intermodal customer, is the anchor user of the terminal.
Rail Intermodal Parks
042607 Puerto Nuevo Report Vol 4 Final Page 63THE TIOGA GROUP
BNSF Shelby
BNSF Shelby is on the BNSF railway near the Canadian border at the intersection of I-15 andUS-2. The facility is now closed. BNSF Shelby was also a rail-owned facility whose operationwas contracted to Dick Irvin Trucking.
The concept was that Canadian longer-combination vehicles could be operated across the borderto Shelby, then loaded on the train for distribution to points south and east. The facility wassuccessful in penetrating this market, but the volume was small and unbalanced. There wassome thought to also moving international exports through Shelby, but again the business washeavily balanced outbound and only a very small number of international containers wereavailable for loading in the market. An additional small, unbalanced inbound movement ofparcel and less-than-truckload shipments in private trailers apparently developed over time, butwas not sufficient to make the facility viable in the long term.
Lessons Learned
Size
In order for a Class I railroad to be interested in a particular new market for intermodal service,the potential volume needs to be at least 20,000 loads per year.
Balance and Equipment
Many small terminal projects fail for lack of balanced equipment movements. This iscomplicated because of the many different types of domestic and international highwayequipment. Balance is typically worse in small markets.
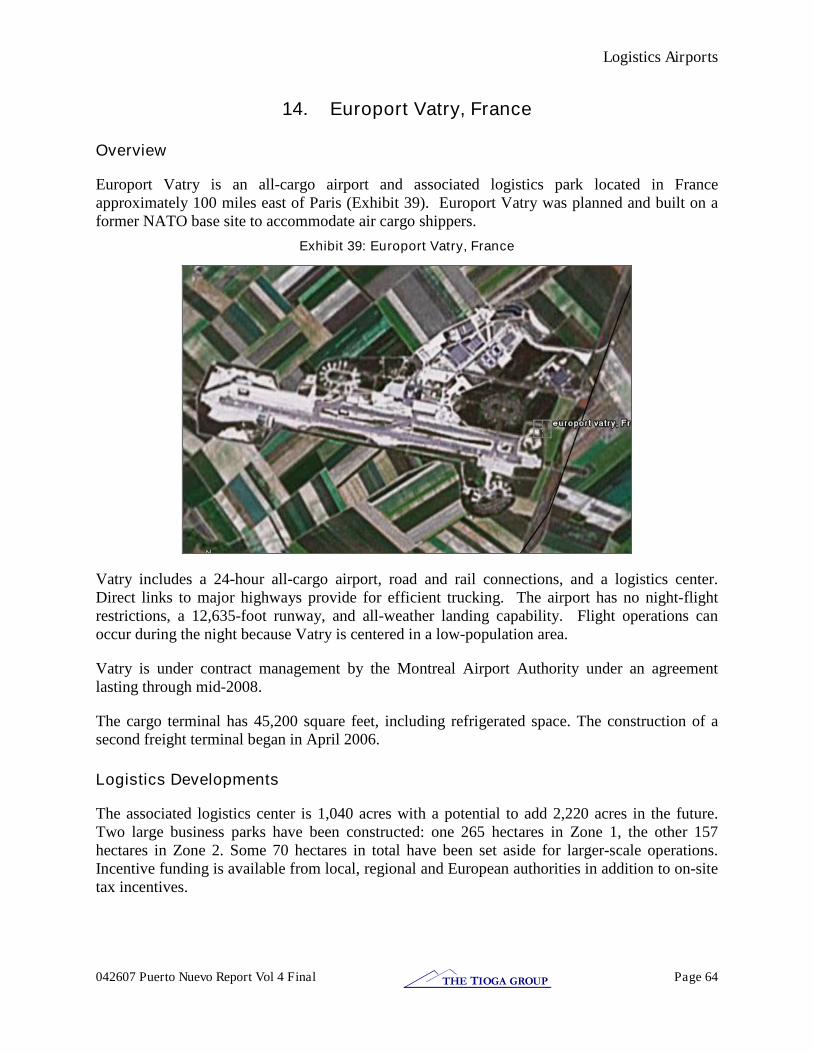
Logistics Airports
042607 Puerto Nuevo Report Vol 4 Final Page 64THE TIOGA GROUP
14. Europort Vatry, France
Overview
Europort Vatry is an all-cargo airport and associated logistics park located in Franceapproximately 100 miles east of Paris (Exhibit 39). Europort Vatry was planned and built on aformer NATO base site to accommodate air cargo shippers.
Exhibit 39: Europort Vatry, France
Vatry includes a 24-hour all-cargo airport, road and rail connections, and a logistics center.Direct links to major highways provide for efficient trucking. The airport has no night-flightrestrictions, a 12,635-foot runway, and all-weather landing capability. Flight operations canoccur during the night because Vatry is centered in a low-population area.
Vatry is under contract management by the Montreal Airport Authority under an agreementlasting through mid-2008.
The cargo terminal has 45,200 square feet, including refrigerated space. The construction of asecond freight terminal began in April 2006.
Logistics Developments
The associated logistics center is 1,040 acres with a potential to add 2,220 acres in the future.Two large business parks have been constructed: one 265 hectares in Zone 1, the other 157hectares in Zone 2. Some 70 hectares in total have been set aside for larger-scale operations.Incentive funding is available from local, regional and European authorities in addition to on-sitetax incentives.

Logistics Airports
042607 Puerto Nuevo Report Vol 4 Final Page 65THE TIOGA GROUP
Recent cargo growth has been very rapid. Vatry International Airport handled 10,830 metric tonsof freight in the first quarter of 2006, up by more than 72.6% from the same period last year.Vatry handled 37,670 metric tons of freight in 2005 compared with 19,128 tons in 2004 and8,730 tons in 2003.
2004 saw Vatry succeed in attracting a number of cargo carriers and becoming, in some cases, atraffic hub for operators. For example, Coyne Airways operates several weekly services to theCaspian Sea region while Avient uses Vatry as a European base for flights to and from Africa.
The main business sector locating at Vatry is distribution. Starting in 1998, the initial tenantsincluded:
Air Liquide Welding, which distributes welding equipment throughout Europe;
JCH Associates, which warehouses and distributes toys and textiles;
Vatinel, a Customs broker;
Transports Vertusiens, a parcel transport company specializing in foods; and
Varty Poids Lourds, a forklift repair company.
Major new tenants include Prologis, a leading world logistics real estate investor, and TNT,which operates a European distribution center for Fiat.
Success Factors
The location of Europort Vatry appears to be the single greatest success factor. Vatry is centrallylocated within Europe, with 75 percent of all freight traffic in the European Communityconcentrated within an 800-kilometer radius of the airport complex.
Another major growth factor has been the marked development in perishable freight (fruit,vegetables and fish).Vatry’s perishable goods center is one of the largest facilities in Europe and includes multiple cold-storage rooms designed specifically for fresh vegetables, fruits andflowers, as well as fish, meat and prepared foods. European regulations require the separatehandling of various types of food products. Vatry International Airport’s perishable goods center is certified by European authorities and is a recognized European cargo Border Inspection Point,both of which constitute major competitive advantages for the airport. As a result, productstransiting through Vatry can be distributed throughout the European Community with noadditional customs approval.
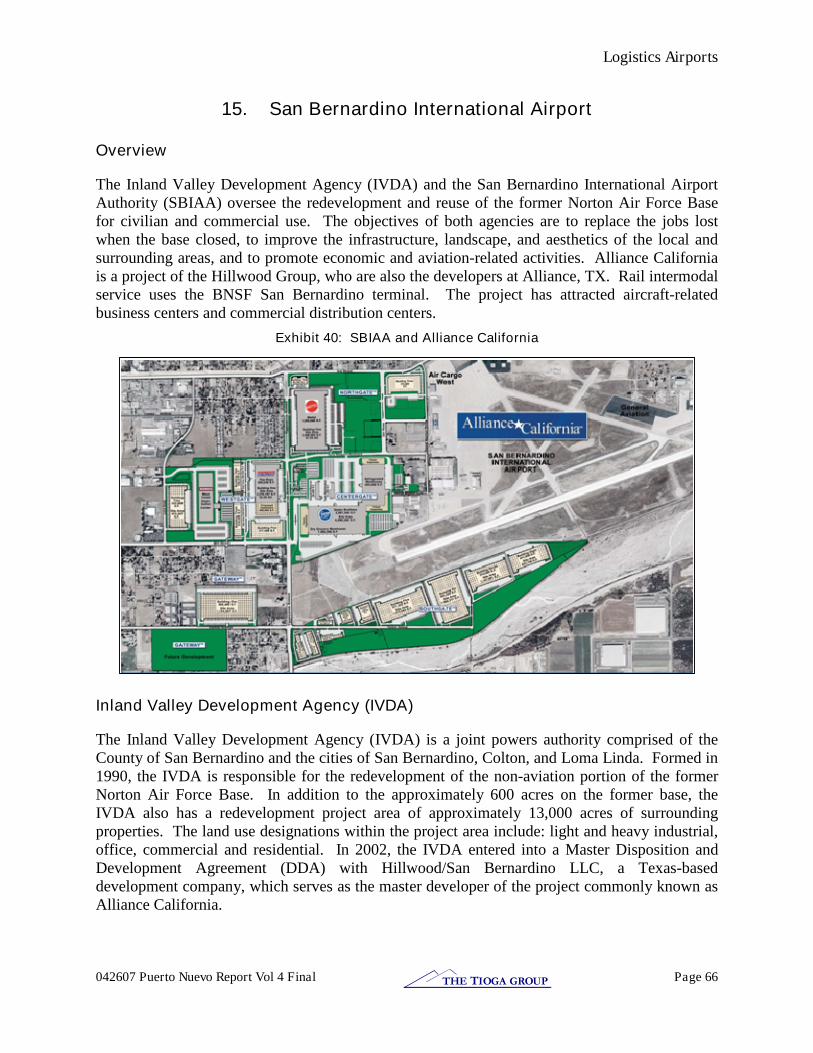
Logistics Airports
042607 Puerto Nuevo Report Vol 4 Final Page 66THE TIOGA GROUP
15. San Bernardino International Airport
Overview
The Inland Valley Development Agency (IVDA) and the San Bernardino International AirportAuthority (SBIAA) oversee the redevelopment and reuse of the former Norton Air Force Basefor civilian and commercial use. The objectives of both agencies are to replace the jobs lostwhen the base closed, to improve the infrastructure, landscape, and aesthetics of the local andsurrounding areas, and to promote economic and aviation-related activities. Alliance Californiais a project of the Hillwood Group, who are also the developers at Alliance, TX. Rail intermodalservice uses the BNSF San Bernardino terminal. The project has attracted aircraft-relatedbusiness centers and commercial distribution centers.
Exhibit 40: SBIAA and Alliance California
Inland Valley Development Agency (IVDA)
The Inland Valley Development Agency (IVDA) is a joint powers authority comprised of theCounty of San Bernardino and the cities of San Bernardino, Colton, and Loma Linda. Formed in1990, the IVDA is responsible for the redevelopment of the non-aviation portion of the formerNorton Air Force Base. In addition to the approximately 600 acres on the former base, theIVDA also has a redevelopment project area of approximately 13,000 acres of surroundingproperties. The land use designations within the project area include: light and heavy industrial,office, commercial and residential. In 2002, the IVDA entered into a Master Disposition andDevelopment Agreement (DDA) with Hillwood/San Bernardino LLC, a Texas-baseddevelopment company, which serves as the master developer of the project commonly known asAlliance California.

Logistics Airports
042607 Puerto Nuevo Report Vol 4 Final Page 67THE TIOGA GROUP
San Bernardino International Airport Authority
The San Bernardino International Airport (SBD) is located 60 miles east of the Los AngelesInternational Airport (LAX). SBD is surrounded by major interstate freeways (I-10, I-215 and I-30/I-210), and is within two miles of the BNSF intermodal facility. SBD offers Customsclearance, aircraft ramp space, room for new development opportunities and expansion potential,including Foreign Trade Zone and LAMBRA tax incentives.
Businesses at SBD itself are primarily aircraft-related:
BSA International, an FAA-certified repair station for aircraft components.
Blue's Aviation, a fixed-base operator (FBO). An FBO provides numerousservices for local and transient aircraft. Services include fuel, light aircraftmaintenance, general aviation aircraft tiedown and storage, and numerousaccommodations for air passengers.
Aircraft Rescue & Fire Fighting (ARFF) Training Center.
Aero Pro, a private company specializing in aircraft painting.
US Forest Service air tanker base.
Negotiations are currently underway with a company to function as an FAA-certified repairstation performing inspection, overhaul, and maintenance services for large commercial aircraft.These services can be beneficial to tenants who base their aircraft operations at SBD.
Alliance California
Alliance California is a 2,000-acre “trade and logistics center” adjacent to SBD. It incorporates aForeign Trade Zone and an on-site CBP office.
The FTZ is operated by Alliance Operating Services, the same firm that operates the FTZ atAlliance Texas.
There are multiple buildings in existence or under development at the site, totaling roughly 64million square feet. Tenants include MedLine, Pep Boys, Kohl’s, Mattel, and Stater Bros. Grocers. Hillwood estimates that over 29,000 jobs have been created there since 2000.
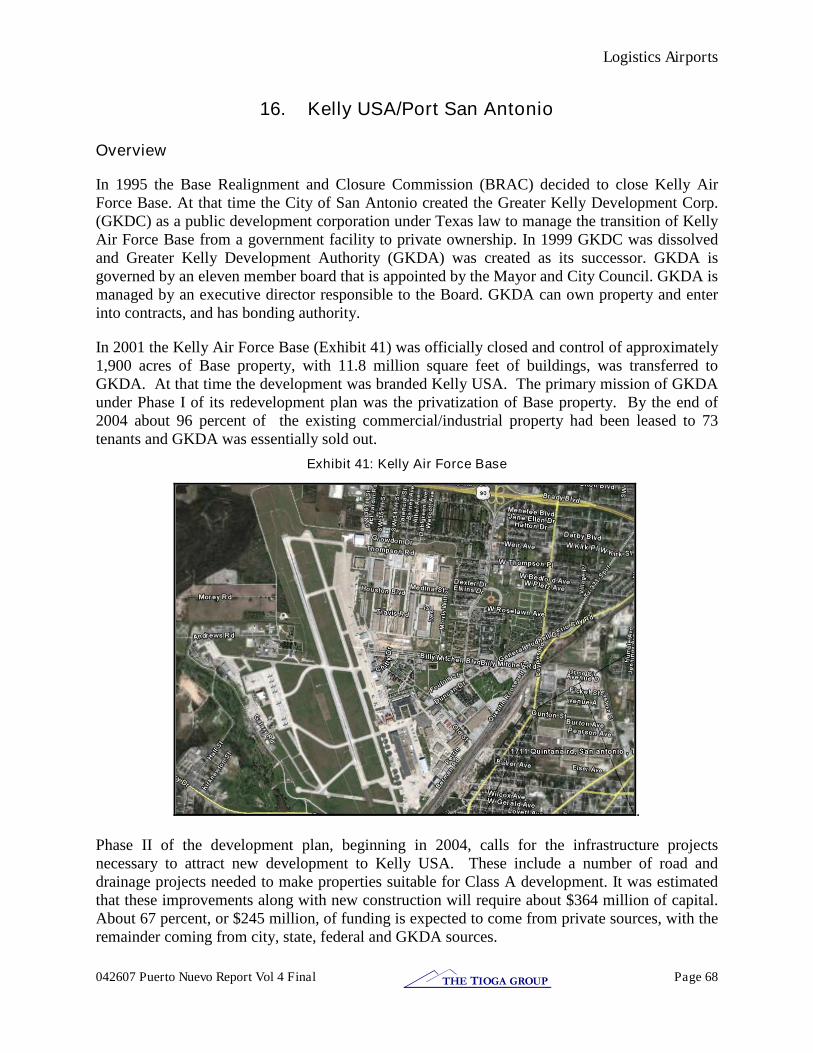
Logistics Airports
042607 Puerto Nuevo Report Vol 4 Final Page 68THE TIOGA GROUP
16. Kelly USA/Port San Antonio
Overview
In 1995 the Base Realignment and Closure Commission (BRAC) decided to close Kelly AirForce Base. At that time the City of San Antonio created the Greater Kelly Development Corp.(GKDC) as a public development corporation under Texas law to manage the transition of KellyAir Force Base from a government facility to private ownership. In 1999 GKDC was dissolvedand Greater Kelly Development Authority (GKDA) was created as its successor. GKDA isgoverned by an eleven member board that is appointed by the Mayor and City Council. GKDA ismanaged by an executive director responsible to the Board. GKDA can own property and enterinto contracts, and has bonding authority.
In 2001 the Kelly Air Force Base (Exhibit 41) was officially closed and control of approximately1,900 acres of Base property, with 11.8 million square feet of buildings, was transferred toGKDA. At that time the development was branded Kelly USA. The primary mission of GKDAunder Phase I of its redevelopment plan was the privatization of Base property. By the end of2004 about 96 percent of the existing commercial/industrial property had been leased to 73tenants and GKDA was essentially sold out.
Exhibit 41: Kelly Air Force Base
.
Phase II of the development plan, beginning in 2004, calls for the infrastructure projectsnecessary to attract new development to Kelly USA. These include a number of road anddrainage projects needed to make properties suitable for Class A development. It was estimatedthat these improvements along with new construction will require about $364 million of capital.About 67 percent, or $245 million, of funding is expected to come from private sources, with theremainder coming from city, state, federal and GKDA sources.

Logistics Airports
042607 Puerto Nuevo Report Vol 4 Final Page 69THE TIOGA GROUP
Port San Antonio
Phase III of the development plan turns Kelly USA into an international cargo port. This isconsistent with the citywide strategy named Inland Port San Antonio. This strategy promotes thegrowth of all of the transportation, distribution, and logistics facilities that make up the city’s capacity to serve international trade. The primary focus of this initiative is on the trade corridorwith Mexico, particularly those industries located in Monterrey, Mexico. In response to thisstrategy the GKDA board, in early 2006, approved a name change to Port Authority of SanAntonio (PASA) and changed the industrial park brand name from Kelly USA to Port SanAntonio. PASA is currently developing a master plan for development of 700 acres of industrialand commercial property at Port San Antonio. The plan calls for three types of development:aerospace and aeronautical at Kelly Airport, commercial and mixed use at Kelly Town Center,and rail-served industrial at East Kelly Railport.
PASA is just beginning the implementation of its Phase III plan. One of the key drivers is SanAntonio’s location as a South Texas hub. San Antonio is located at the juncture of I-10, I-35 andI-37. Exhibit 42 provides an area map showing San Antonio’s interstate highway network and the access to Port San Antonio. The largest US / Mexico gateway crossing is located in Laredoabout 150 miles to the south via I-35. Seventy-five percent of all goods moving between theUnited States and Mexico flow through San Antonio.
Exhibit 42: Port San Antonio
Logistics Airports
042607 Puerto Nuevo Report Vol 4 Final Page 70THE TIOGA GROUP
Port San Antonio has an 11,500-foot runway which can handle 747-400 air freighters. An80,000-square-foot air cargo terminal is under construction as part of the Phase I air cargodevelopment plan. This facility will be completed in 2007, enabling start-up of commercial airfreight service.
On the east side of Port San Antonio, PASA is developing the East Kelly Railport. This area isadjacent to the Union Pacific rail yard and is served by Union Pacific. PASA is developing therail infrastructure and necessary rail operating capability to provide its own local switchingservice for rail carload tenants. PASA has recently located a railcar transload operator who isbuilding a 360,000 square foot rail-served warehouse and transload facility.
Port San Antonio tenants will be able to utilize Foreign Trade Zone 10. In addition, a federalinspection facility is being established that will include offices of U.S. Customs, U.S.Department of Agriculture, Food and Drug Administration and other federal agencies involvedin clearing and inspecting international cargo. This facility will be located at the air cargo centerbut will also be available for use by rail customers as well as Foreign Trade Zone customers.
San Antonio Rail Intermodal
The Union Pacific has two small intermodal terminals in San Antonio. The Quintana Roadterminal is located at the Union Pacific yard adjacent to Port San Antonio. The Quintana Roadfacility handles north-south business from and to Mexico. The Sherman Road terminal is innortheast San Antonio and serves east-west business. The current intermodal terminals are smalland relatively inefficient and Union Pacific is considering the feasibility of consolidating theseterminals into a new facility. The project is in its early stages and a site location has not beenidentified.
PASA has no plans for development of a rail intermodal terminal at Port San Antonio. There isnot enough land available for a large-scale terminal or the associated distribution warehouses atexisting industrial sites. PASA is not relying on large-scale rail intermodal service to handleimport and export containers as part of its development plan.
Port Authority of San Antonio Funding
In its early years GKDA received City grants as seed money to begin operations. Once GKDAtook control of the Kelly Air Force Base Property, it was able to fund its operations from leaserevenues. Today PASA generates about $29 million in gross revenue, with net income of about$3.2 million. About 70 percent of PASA revenue comes from the aerospace and aeronauticalindustries.
PASA has authority to issue revenue bonds and has issued $6 million of bonds to finance ahangar for Boeing’s aircraft repair facility. These bonds were secured by lease revenues. PASAis currently considering issuing bonds for about $30 million in capital projects. These bondswould be secured by its operating income and proceeds from tenant infrastructure charges.PASA property is not subject to property tax. However, in lieu of property tax it assesses aninfrastructure charge based on 75 percent of assessed property value. These charges generatebetween $3 million and $4 million annually and are used for infrastructure projects. Thisrevenue stream can also be used to secure bond funding.

Logistics Airports
042607 Puerto Nuevo Report Vol 4 Final Page 71THE TIOGA GROUP
Lessons Learned
The primary drivers for the Greater Kelly Development Authority since it took control of Baseproperty in 2001 were industrial development and replacement of the lost Air Force jobs.Although there are a few logistics services companies, logistics and inland port operations havenot been a key driver of development. The Inland Port San Antonio citywide strategy appears tohave been adopted by PASA in early 2006. The inland port concept of ocean containers movingin to Port San Antonio by rail from west coast ports and being distributed to south Texas marketsis not a part of the PASA plan. The inland port vision of Port San Antonio involves Mexicanimports and exports coming to San Antonio by highway, international air cargo arriving at KellyAirport, and domestic or Mexican rail carload business moving to Kelly Railport for processingand distribution. It is too early to tell how successful Port San Antonio will be in attractinglogistics-related industrial development.

Logistics Airports
042607 Puerto Nuevo Report Vol 4 Final Page 72THE TIOGA GROUP
17. Southern California Logistics Airport
Overview
The SCLA is the former George Air Force Base, being developed by Stirling International into a4,000-acre master-planned business and industrial airport complex (Exhibit 43).
To date, the project has attracted primarily aircraft industry plants and retail distribution centersserved by over-the-highway trucks.
Exhibit 43: SCLA Plan
As shown in Exhibit 44, SCLA is in the Victor Valley, a developing region north of Cajon Passand separated by Cajon Pass from the Inland Empire market. In many respects, the future forSCLA is in this developing market rather than in competing with San Bernardino, MarchGlobalPort, and Ontario for the Inland Empire market.
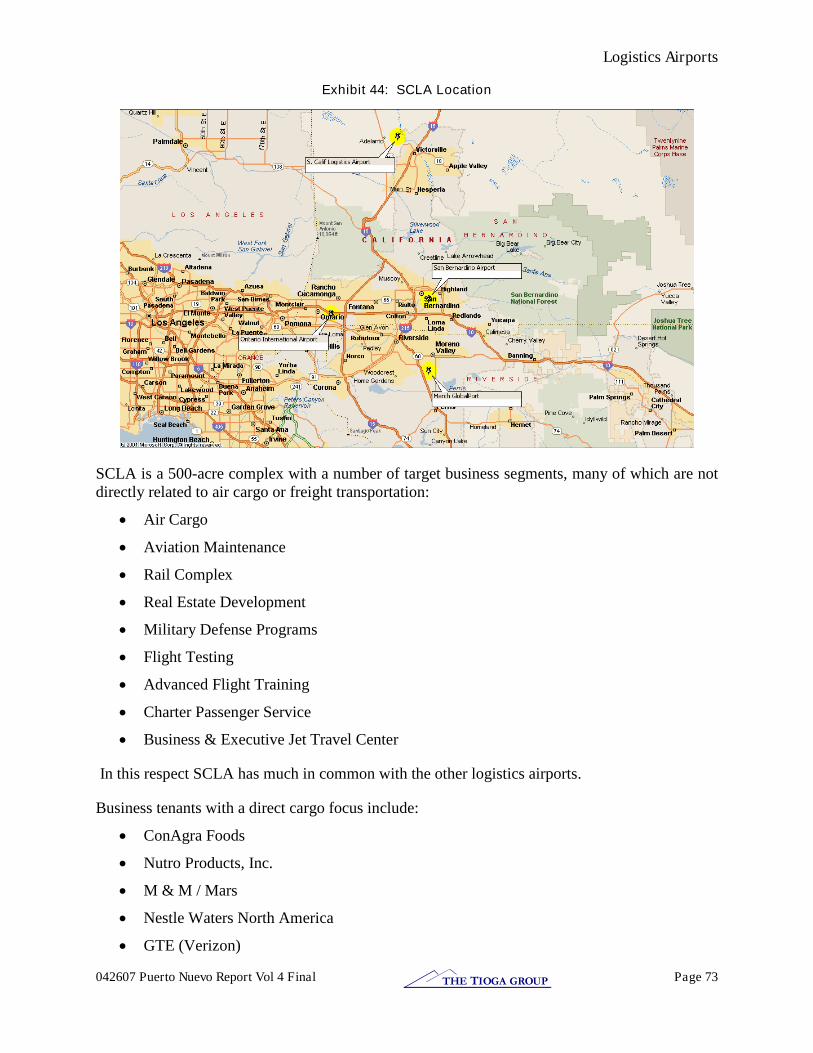
Logistics Airports
042607 Puerto Nuevo Report Vol 4 Final Page 73THE TIOGA GROUP
Exhibit 44: SCLA Location
SCLA is a 500-acre complex with a number of target business segments, many of which are notdirectly related to air cargo or freight transportation:
Air Cargo
Aviation Maintenance
Rail Complex
Real Estate Development
Military Defense Programs
Flight Testing
Advanced Flight Training
Charter Passenger Service
Business & Executive Jet Travel Center
In this respect SCLA has much in common with the other logistics airports.
Business tenants with a direct cargo focus include:
ConAgra Foods
Nutro Products, Inc.
M & M / Mars
Nestle Waters North America
GTE (Verizon)

Logistics Airports
042607 Puerto Nuevo Report Vol 4 Final Page 74THE TIOGA GROUP
Wal-Mart
Commercial air cargo carriers have included Cargolux, FedEx Express, ASB Air, Atlas Air, andMK International.
Incentives
Acting as the Airport and Rail Complex Authority for SCLA, the Victorville City Council isfocused on developing economic activity and job creation within the region. As well as strongcity support, companies located at SCLA benefit from county, state and federal incentives, suchas:
60,000-acre redevelopment district
LAMBRA Zone credits and incentives
2,500-acre Foreign Trade Zone No. 243
Tax assistance from the State of California for employee training and equipmentpurchases
San Bernardino County incentives, including tax-exempt bonds
FAA program support
Local tax-exempt bond financing
City tax credits for hiring and equipment purchases

Logistics Airports
042607 Puerto Nuevo Report Vol 4 Final Page 75THE TIOGA GROUP
18. March GlobalPort
Overview
March is a 350-acre “joint-use airport” governed by the Air Force and the MarchJoint PowersAuthority. March Inland Port Airport Authority (MIPAA) was formed by the March JPA in 1996to develop the civilian airport and related business. The Authority’s marketing partner is theLynxs Group. Lynxs was chosen in 1996 and formed March Inland CargoPort Development,LLC to convert and market the base. March also formed a California Redevelopment Agencyand project area to assist with development.
The marketing focus is on air freight and air industry support businesses. The Base Reuse Plan(Exhibit 45) includes approximately 350 acres of land for civilian aviation facilities at thesouthern end of the airfield at March and an additional 200 acres west of the I-215 freeway. Thisacreage is intended to be used for commercial aviation through a military/civilian joint-usearrangement. March does not have any distinct “inland port” functions beyond those of alogistics airport, although it does have a rail connection.
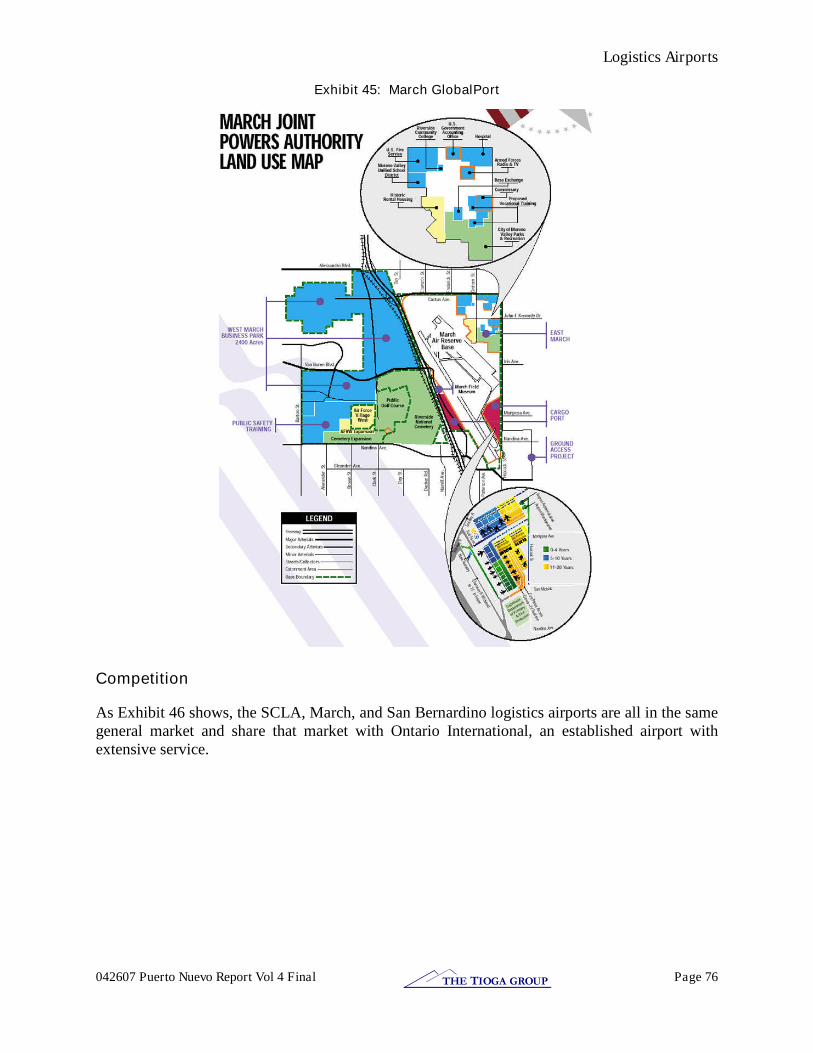
Logistics Airports
042607 Puerto Nuevo Report Vol 4 Final Page 76THE TIOGA GROUP
Exhibit 45: March GlobalPort
Competition
As Exhibit 46 shows, the SCLA, March, and San Bernardino logistics airports are all in the samegeneral market and share that market with Ontario International, an established airport withextensive service.
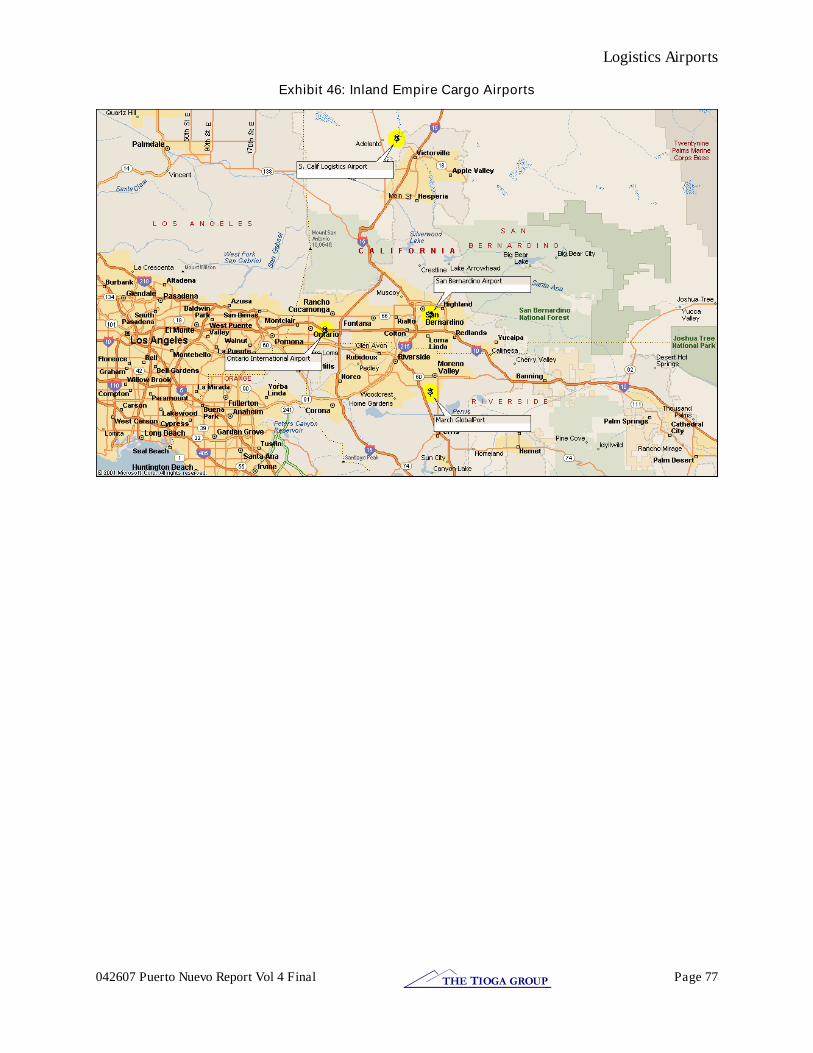
Logistics Airports
042607 Puerto Nuevo Report Vol 4 Final Page 77THE TIOGA GROUP
Exhibit 46: Inland Empire Cargo Airports

Logistics Airports
042607 Puerto Nuevo Report Vol 4 Final Page 78THE TIOGA GROUP
19. Global TransPark
Overview
In 1991 the North Carolina General Assembly created the North Carolina Cargo AirportAuthority (now the North Carolina Global TransPark Authority) to develop an air cargoindustrial complex. This concept was based on an expectation that the next wave of industrialdevelopment will be driven by just-in-time manufacturing and distribution. Flexibility and speedare expected to become the critical competitive factors driving industrial development. As aresult, an integrated air cargo airport/industrial complex was believed to offer a competitiveadvantage in attracting new industry, generating jobs and economic benefits for the region itserves.
In 1992 the Global TransPark Authority (GTPA) selected Kinston, NC, as the site for the GlobalTransPark (GTP). Kinston is located about 70 miles southeast of Raleigh, with reasonableaccess to interstate highways I-95 and I-40 as well as to the North Carolina ports of Wilmingtonand Morehead City (Exhibit 47).
Exhibit 47: Global TransPark and Southeastern NC
The current master plan provides for a 15,300-acre development. Improved highway access to I-95 and I-40 is to be built. The plan also includes a rail intermodal terminal with connections toCSX and Norfolk Southern which will enable rail intermodal service to the ports of Wilmingtonand Morehead City. Industrial areas are planned to locate industries with high air transportdemand close to the runway and those with a higher reliance on surface transport on the

Logistics Airports
042607 Puerto Nuevo Report Vol 4 Final Page 79THE TIOGA GROUP
periphery. The Master Plan projects about 23,000 cargo flights carrying 696,000 tons of cargoby 2014.
Global TransPark Development
GTPA has advanced the development of Global TransPark at the former Kinston RegionalAirport over the last 13 years. Over that time about $150 million in state, federal, and privatesector funds have been received for development. Exhibit 48 shows the current site plan forGTP development. The areas in blue denote GTP property.
Exhibit 48: Current Global TransPark Site Plan
Following are a number of major development events at TransPark:
May 1996–TransPark approved as Foreign Trade Zone
August 1996–Mountain Air Cargo opens new facility as TransPark’s first tenant
March 2000 - Construction of 32,000-square feet education and training centercompleted
December 2002–Runway extension to 11,500 feet opened enabling Boeing 747-400 airfreighters to utilize TransPark
Logistics Airports
042607 Puerto Nuevo Report Vol 4 Final Page 80THE TIOGA GROUP
May 2002–58,200 sq. ft. air cargo facility opened with three tenants
April 2003–Duke Realty selected as developer for industrial component of TransPark
June 2005 –New Breed Inc. leases 120,000-square-feet distribution warehouse. This isthe largest transaction completed by GTPA.
Currently, GTP supports 27 employers in its initial development area and has over 5,700 acresfully permitted and available for development. These companies are providing 2,600 jobs withover $65 million of payroll and benefits.
Global TransPark Financial Issues
Although GTP has modest success, it has fallen far short of its original forecasts andexpectations with respect to its ability to attract air cargo operations. Even with the progress thathas been made, GTPA is not self-sufficient and requires ongoing subsidies to fund its currentoperations. In the fiscal year ending June 30, 2005, GTPA received only $690,000 in operatingrevenue and experienced an operating loss of $3.2 million. Even with a state funding subsidy of$1.6 million, GTPA experienced negative cash flow of over $300,000. As a result, publicsupport for continued funding is eroding, as evidenced by the reduction of the state subsidy from$3.4 million to $1.6 million in 2003. In addition, the state Legislature has ordered studies todetermine ways to improve operations and/or restructure the organization.
It does not appear feasible to discontinue operations of GTPA. There is outstanding debt of $32million, most of which is held by the State. Another concern is that if GTPA discontinuesoperations the FAA may require payback of $20.1 million in grants. Now that the funds havebeen invested it appears that the only option available to the state is to continue supporting theoperation and increase efforts to turn it around.
Tenants
Existing GTP tenants are primarily aircraft-related businesses (e.g. flight training, aircraftcharter) and state agencies (e.g. Highway Patrol, Forestry, Economic Development). There arefew firms engaged in moving, shipping, or receiving air cargo.
Global TransPark tenants include:
ASA Delta Connection - Commercial jet service
Aero Contractors - Aircraft charter
Henley Aviation - Flight Training Center
Longistics–Foreign Trade Zone Operator
MJE Telestructure - Plant infrastructure
Mountain Air Cargo - Full A&P contract air service
N.C. Emergency Management - Eastern Branch
N.C. Forestry Service - Eastern Branch

Logistics Airports
042607 Puerto Nuevo Report Vol 4 Final Page 81THE TIOGA GROUP
N.C. Highway Patrol - Eastern Aviation Unit
New Breed Inc. - Logistics and supply chain management
North Carolina's Eastern Region - Economic development
Segrave Aviation - FBO, Charter service, trucking
Workhorse Aviation Manufacturing - Military support plant
Funding
The act creating the North Carolina Global TransPark Authority authorizes the financing ofprojects that may be available for use by private parties by the issuance of bonds and notes by theAuthority. Under federal tax laws, the general rule is that interest on bonds issued to financefacilities used by private parties will not be tax-exempt. However there are exceptions to thisgeneral tax rule for facilities that qualify as “exempt facilities,” such as certain airport facilities, and manufacturing facilities, if the facilities and their user meet the requirements for “small issue” industrial revenue bonds. The Authority also can issue bonds on a federal taxable interestbasis; the interest on which bonds, however, would be exempt from North Carolina income tax.
The Authority may issue bonds and notes (“obligations”) (1) to provide airport projects and (2) special user projects. The obligations will constitute special limited obligations of the Authority,payable solely from Authority revenues, income on assets specifically assigned or pledged forthe payment thereof, or from the funds, collateral and undertakings of a private party that areassigned or pledged by that party for the payment thereof.
The Global TransPark statute’s definition of “airport projects” authorizes the financing by the Authority of land, building and structures at the TransPark, including facilities to be leased toone or more private parties.
The Act defines special user projects to mean any land, equipment, buildings or other structureslocated at the TransPark and the addition to or rehabilitation, improvement, renovation orenlargement of an existing structure. The special user project must be used as, or in connectionwith,:
(a) an undertaking for industry, including an industrial or manufacturing factory, mill,assembly plant or fabricating plant, a freight terminal, an industrial research,development or laboratory facility, or an industrial processing or distribution facilityfor industrial or manufactured products; or
(b) a commercial, processing, mining, transportation, distribution, storage, marine,aviation, or environmental facility or improvement; or
(c) any combination of the above items.
Lessons Learned
The Global TransPark experience is an excellent example of the importance of location andmarkets in developing new airport facilities and industrial parks. The region surroundingKinston does not appear to have enough economic growth to absorb the projected industrial

Logistics Airports
042607 Puerto Nuevo Report Vol 4 Final Page 82THE TIOGA GROUP
development. There are no major population centers to support the market for a major cargoairport or passenger operations. As a result, the available market served by GTP cannot sustainthe size of the facility investment. Exhibit 49 shows the market region through drive-time zonessurrounding GTP. Access to markets and interstate highways is not particularly good and doesnot appear to provide competitive advantage to the Kinston location.
Exhibit 49: Global TransPark Market Reach
GTP is almost totally dependent on the air cargo operation to attract development. AlthoughGTP advertises close proximity to the deep-water ports of Wilmington and Morehead City, theseports are very small niche ports and do not have the import-export container business needed todrive container-oriented distribution. The ports of Norfolk, Charleston and Savannah are the eastcoast ports that are handling most of the Southeast Atlantic container business. GTP has nocompetitive advantage to these ports in attracting Atlantic container cargo.
GTP also makes reference to rail access to CSX and Norfolk Southern. Kinston is not on themain lines of either of these two rail carriers and is very doubtful that GTP will be able to justifythe development of an intermodal terminal. With no rail intermodal service, the Kinston locationsuffers another competitive disadvantage for attracting logistics-oriented development.
Although the concept of a global air cargo industrial complex was certainly a creative andforward thinking idea in 1991, it does not appear that the site location selected for GTP hadsufficient market and location advantages to support the investment made. This makes itnecessary for GTP to rely entirely on its air cargo capability and regional market to provide the

Logistics Airports
042607 Puerto Nuevo Report Vol 4 Final Page 83THE TIOGA GROUP
needed industrial development. It may only be a matter of time and increased marketing effort tobring GTP to a position of financial self-sufficiency.

Networks and Corridors
042607 Puerto Nuevo Report Vol 4 Final Page 84THE TIOGA GROUP
20. NY/NJ Port Inland Distribution Network
Overview
The Comprehensive Port Improvement Plan (CPIP) is a strategic plan for the future developmentof the Port of New York and New Jersey (PANYNJ). The CPIP evolved from a U.S. Army Corpsof Engineers Harbor Navigation Study completed in December of 1999.
As logistics and distribution activities are a major economic driver of the New YorkMetropolitan regional economy, the PANYNJ seeks to maintain and expand Port market share inthe very competitive Atlantic port marketplace.i Over the past five years for which data isavailable (2000-2004), the PANYNJ’s container business has grown much faster than its major port competitors, Montreal and Norfolk. The ports of Baltimore and Halifax have smallercontainer operations and are not strong competitors to the Port of New York and New Jersey.The ports in Boston, Wilmington and Philadelphia are considered niche ports with veryspecialized container operations.
The Port has five major marine container terminals at Newark, Elizabeth, Global Marine (not aPANYNJ terminal), Howland Hook, and Red Hook. Land-side access is critical for future portdevelopment. ExpressRail on-dock volume is climbing rapidly from 50,000 annual containerlifts 10 years ago to 227,000 lifts last year. About 75 percent to 80 percent of all rail business isExpressRail, and rail has steadily gained at the expense of truck. Projected rail growth is 1million rail lifts by 2020 and 2 million by 2040. The basic reasons for rail growth are increasingdemand for rail transport, the PIDN program, overall growth in the port business and rail’s increasing role in port growth.
While there are major environmental aspects of CPIP, the major logistics infrastructurecomponents of the current plan include:
deepening major shipping channels
expanding and modernizing cargo handling equipment
developing inland distribution centers (Inland Ports-PIDN)
expanding rail infrastructure
The latter two aspects are the subject of this report.
Port Inland Distribution Network (PIDN)
In the study, which justified the dredging of New York Harbor to commercially relevant depths,it was recognized that the existing highway infrastructure would not be able to meet theincreased demand associated with dredging. Without a shift away from the highway mode, the
i A January 2006 PA pamphlet reports, “The port directly and indirectly supports 230,000 diverse and highly skilled jobs within thetwo states of New York and New Jersey and generates $9.4 billion a year in personal income.”
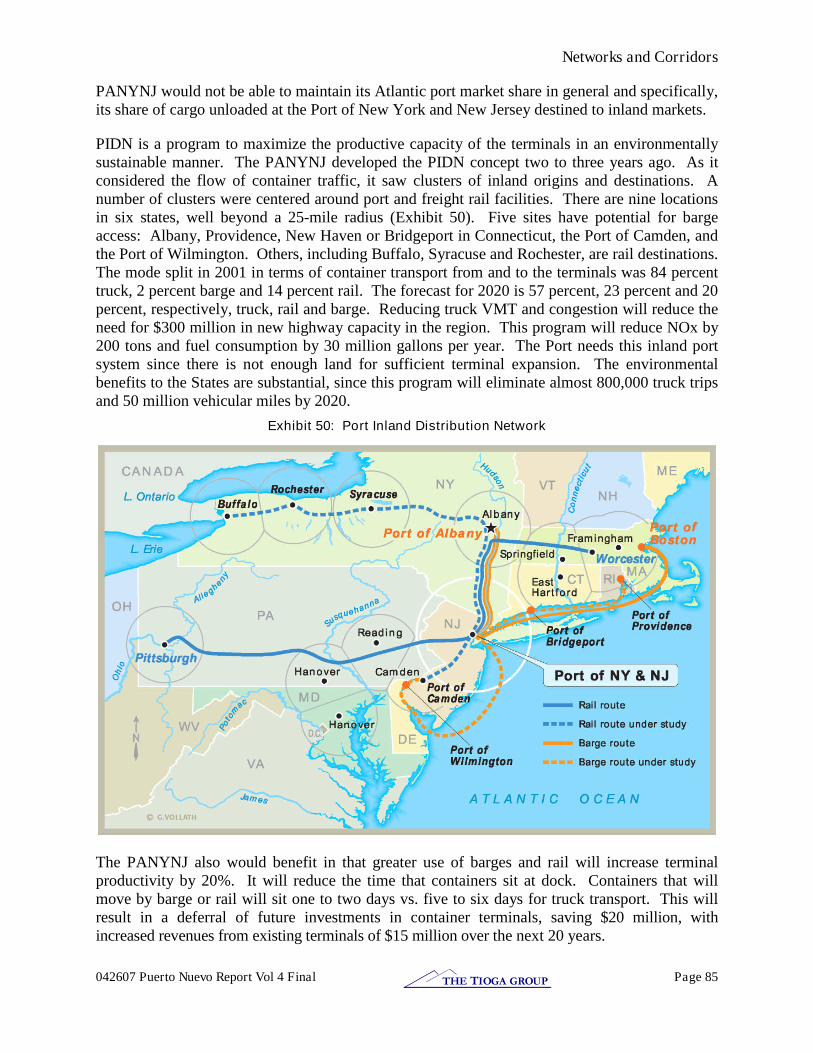
Networks and Corridors
042607 Puerto Nuevo Report Vol 4 Final Page 85THE TIOGA GROUP
PANYNJ would not be able to maintain its Atlantic port market share in general and specifically,its share of cargo unloaded at the Port of New York and New Jersey destined to inland markets.
PIDN is a program to maximize the productive capacity of the terminals in an environmentallysustainable manner. The PANYNJ developed the PIDN concept two to three years ago. As itconsidered the flow of container traffic, it saw clusters of inland origins and destinations. Anumber of clusters were centered around port and freight rail facilities. There are nine locationsin six states, well beyond a 25-mile radius (Exhibit 50). Five sites have potential for bargeaccess: Albany, Providence, New Haven or Bridgeport in Connecticut, the Port of Camden, andthe Port of Wilmington. Others, including Buffalo, Syracuse and Rochester, are rail destinations.The mode split in 2001 in terms of container transport from and to the terminals was 84 percenttruck, 2 percent barge and 14 percent rail. The forecast for 2020 is 57 percent, 23 percent and 20percent, respectively, truck, rail and barge. Reducing truck VMT and congestion will reduce theneed for $300 million in new highway capacity in the region. This program will reduce NOx by200 tons and fuel consumption by 30 million gallons per year. The Port needs this inland portsystem since there is not enough land for sufficient terminal expansion. The environmentalbenefits to the States are substantial, since this program will eliminate almost 800,000 truck tripsand 50 million vehicular miles by 2020.
Exhibit 50: Port Inland Distribution Network
The PANYNJ also would benefit in that greater use of barges and rail will increase terminalproductivity by 20%. It will reduce the time that containers sit at dock. Containers that willmove by barge or rail will sit one to two days vs. five to six days for truck transport. This willresult in a deferral of future investments in container terminals, saving $20 million, withincreased revenues from existing terminals of $15 million over the next 20 years.

Networks and Corridors
042607 Puerto Nuevo Report Vol 4 Final Page 86THE TIOGA GROUP
The PANYNJ expresses the PIDN goal as follows:
“The PIDN program aims to lower inland distribution costs; reduce truck trips (vehicle miles traveled); improve air quality; save energy through reduced truck fuel use; increase portthroughput capacity and spur economic development at feeder ports and hinterlands byproviding new port platforms for value-added warehousing and distribution opportunities.”
The Port Inland Distribution Network (PIDN) was therefore conceived to move non-New Yorkmetropolitan area freight handled in the Port of New York and New Jersey directly to inlandhubs using non-highway modes. Under this plan the non-New York metropolitan area freightwould not utilize the local highway network, reserving this capacity for the growth of localhighway traffic.
Regional Port-Related Rail Capacity Improvements
The PANYNJ estimates that about 13 percent of its current marine cargo volume is transportedoff the port by rail. The stated goal is to increase rail handling to as much as 30 percent of thefuture total cargo volume. A barrier to this growth is that the rail capacity to handle it is limited.To overcome this barrier, the PANYNJ is currently investing $600 million in a comprehensiverail program to increase rail capacity for handling planned growth.
The $600 million rail program is a multi-year effort with the goal of ensuring that each containerport in NJ and Staten Island have supporting intermodal rail infrastructure. The projects haveincluded the development of three new intermodal terminals, rail support yards, and railconnectors.
ExpressRail
The initial ExpressRail on-dock intermodal terminal (Exhibit 51) was introduced in 1991.Volume has grown from 35,000 containers in 1991 to 303,000 containers in 2005. This volumeincrease results in a compounded growth rate of over 16 percent per year for more than a decade.The PANYNJ is developing an on-dock rail system and intermodal terminals to serve all of thePort’s major marine container terminals.

Networks and Corridors
042607 Puerto Nuevo Report Vol 4 Final Page 87THE TIOGA GROUP
Exhibit 51: PANYNJ ExpressRail Projects
Rail Access
PANYNJ and the major railroads serving the port, CSX and Norfolk Southern (NS), have beeninvesting in increased capacity of the rail network in and around the port (Exhibit 52). Projectsinclude double tracking the lines in New Jersey that access the port. This includes the LehighLine to the west and the Chemical Coast Line to the south. Of particular significance is acomplex set of projects that add rail capacity in the immediate vicinity of the Port’s majorcontainer terminals, Port Elizabeth and Port Newark.

Networks and Corridors
042607 Puerto Nuevo Report Vol 4 Final Page 88THE TIOGA GROUP
Exhibit 52: Regional Rail Projects
The Lehigh Line double-tracking project has encountered significant local opposition. Thisopposition is difficult to understand because the project is straightforward and has little impacton the community. The line was double-tracked in the past and this project simply returns theline to its original condition. The Lehigh Line is a very active rail line and now is congested tothe point that trains back up, creating a nuisance for the neighborhood. This congestion will beeliminated by the double track project. Unfortunately, the project has become a local politicalissue that, for a time, threatened to stop all New Jersey state rail investment.
Staten Island Railroad
There is a PA/EDC partnership to revitalize freight rail to Staten Island. This effort will involvethe construction of a new terminal, with the Arlington Yard providing support facilities. ThePANYNJ has acquired the property for the connector to the existing Conrail Chemical Coastline.
New York City Economic Development Corp. (EDC) and PANYNJ are working together torestore rail freight service between Staten Island and connections to CSX and NS rail networksin NJ. The project includes reactivating the Arthur Kill Lift Bridge (longest lift bridge in theworld) after being out of service and mothballed for decades. The project will also rebuild therail infrastructure on Staten Island and develop an on-dock rail intermodal terminal at HowlandHook.
The new eight-track rail facility at the Elizabeth Marine Terminal opened in October 2004. Thenew terminal capacity in Elizabeth and Newark filled so rapidly that it overwhelmed the supportyard and track capacity. As a result, last year the PANYNJ chose to complete several criticalelements of its rail program at the Port Newark and Elizabeth-Port Authority Marine terminals
Networks and Corridors
042607 Puerto Nuevo Report Vol 4 Final Page 89THE TIOGA GROUP
up to two years sooner than previously projected, satisfying a request made by New JerseyActing Governor Codey.
The Board previously authorized approximately $310 million for the port rail program. TheBoard authorized an additional $141 million for the project, which will allow for completion ofthree new components of the program. They are:
Final design and construction of a second lead track to ExpressRail Elizabeth;
Completion of ExpressRail Elizabeth’s on-dock rail terminal, which willultimately have 18 tracks;
Construction of the ExpressRail Corbin Street rail support facility to providecapacity for staging, arrival and departure of two-mile-long trains, and integraterail traffic from the three on-dock ExpressRail facilities;
This work, which will be completed between 2007 and 2009, will complement andsupport previously authorized projects for on-dock rail terminals at the Howland HookContainer Terminal on Staten Island, Port Newark and the Elizabeth-Marine Terminal.
Completion of this work will allow approximately 1 million containers a year to be handled byrail through these facilities.
In addition to the Elizabeth rail facility, the PANYNJ is actively working to install a rail terminalat the Howland Hook Marine Terminal, which will open in 2006.
Major rail projects for the PANYNJ include the Elizabeth Corbin Street grade crossing. ThePANYNJ is constructing a grade crossing via the McLester Street realignment, compressing theroadway and constructing a rail bridge. The PANYNJ is planning a new ExpressRail facility withfive to six times the amount of track, and capacity to handle one million lifts per year. Last fallPANYNJ opened a second dedicated rail terminal for Port Newark. Both of these projects arenow completed.
On the New Jersey side the PANYNJ has been meeting with the railroads to increase the use offreight rail. Phase 1 includes a list of improvements to be financed with $25 million from thePANYNJ and $25 million from the railroads. The projects are aimed at furthering competitiverail service to the NY/NJ region. This includes a second track along the Chemical Coast line anda second track along portions of the Lehigh line from Bound Brook to PN/EMT and other majoryards in north Jersey. It appears the work is going to move forward, though slower thananticipated.
On the NY side, the PANYNJ’s $25 million along with NYSDOT’s $15 million are being invested to accommodate heavier cars, improve clearances, and reduce conflicts with passengerrail service.
Lessons Learned
After several years of experience it is clear that some aspects of the PIDN and CPIP have beenmore successful than others. Demand for increased Atlantic Port capacity in general, andPANYNJ port capacity in particular has continued to be very strong, as expected. NS has

Networks and Corridors
042607 Puerto Nuevo Report Vol 4 Final Page 90THE TIOGA GROUP
continued its rail service to Pittsburg. CSX successfully implemented the rail shuttle to NewEngland over its Worcester, MA terminal and is planning a new service to Buffalo, NY. Thebarge service between New York and Boston continues to operate. However, after a multi-yearexperiment, the initial PIDN barge service to Albany was discontinued after its operating subsidyran out.
Last year container volume in the Port of New York and New Jersey grew by 7.6% overall andthe rail volume, constrained by infrastructure, did not quite keep pace. As a result, a greatershare of PANYNJ volume must use highway capacity in 2006 than in 2005.
There appears to be no shortage of unmet demand for increased intermodal rail servicesoperating between the PANYNJ and major inland destinations. The railroads anticipate that assoon as the capacity improvement projects are completed, it will be possible to accommodateanother round of growth. Implementing long-term plans takes a long-term perspective. It isclear that in spite of relatively soft rail growth of international containers in 2005, the long-termmode shift strategy is sound. While it is difficult, it appears to be easier to increase rail capacitythan to increase highway capacity to service growing freight transportation demand.
Market and political conditions change and plans need to remain adaptable. At present, itappears that PANYNJ rail solutions are more successful than barge solutions in meeting theinfrastructure goals of the CPIP.
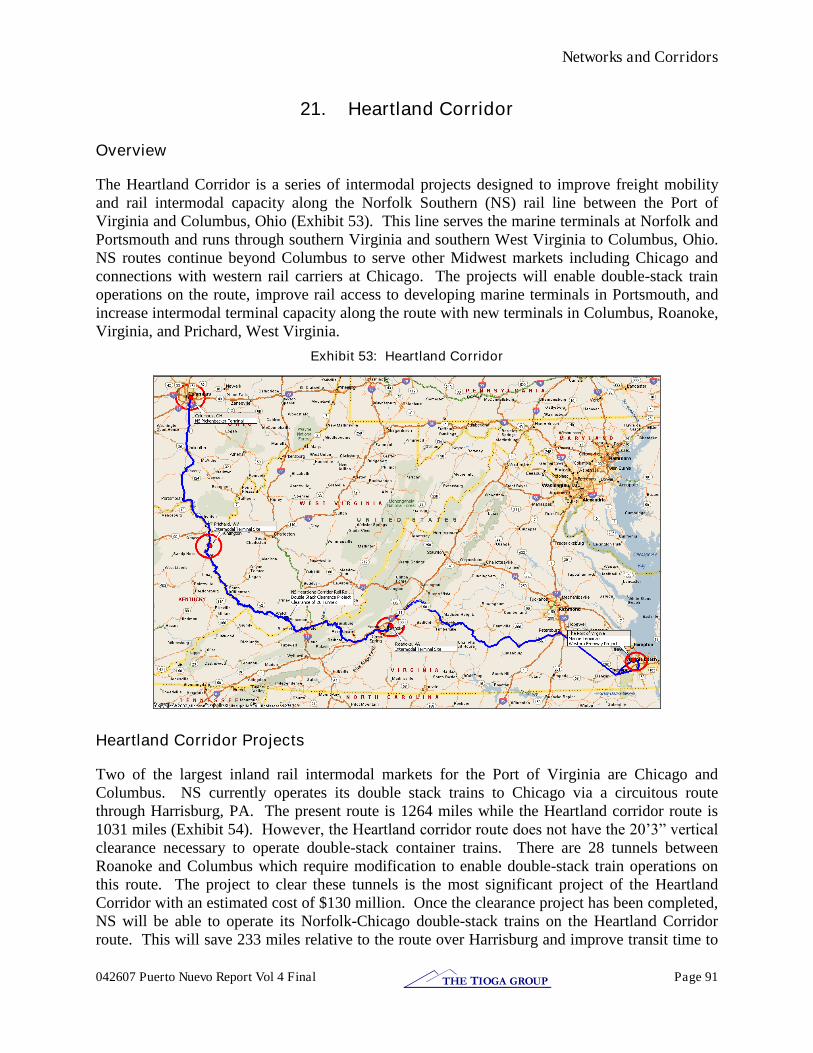
Networks and Corridors
042607 Puerto Nuevo Report Vol 4 Final Page 91THE TIOGA GROUP
21. Heartland Corridor
Overview
The Heartland Corridor is a series of intermodal projects designed to improve freight mobilityand rail intermodal capacity along the Norfolk Southern (NS) rail line between the Port ofVirginia and Columbus, Ohio (Exhibit 53). This line serves the marine terminals at Norfolk andPortsmouth and runs through southern Virginia and southern West Virginia to Columbus, Ohio.NS routes continue beyond Columbus to serve other Midwest markets including Chicago andconnections with western rail carriers at Chicago. The projects will enable double-stack trainoperations on the route, improve rail access to developing marine terminals in Portsmouth, andincrease intermodal terminal capacity along the route with new terminals in Columbus, Roanoke,Virginia, and Prichard, West Virginia.
Exhibit 53: Heartland Corridor
Heartland Corridor Projects
Two of the largest inland rail intermodal markets for the Port of Virginia are Chicago andColumbus. NS currently operates its double stack trains to Chicago via a circuitous routethrough Harrisburg, PA. The present route is 1264 miles while the Heartland corridor route is1031 miles (Exhibit 54). However, the Heartland corridor route does not have the 20’3” vertical clearance necessary to operate double-stack container trains. There are 28 tunnels betweenRoanoke and Columbus which require modification to enable double-stack train operations onthis route. The project to clear these tunnels is the most significant project of the HeartlandCorridor with an estimated cost of $130 million. Once the clearance project has been completed,NS will be able to operate its Norfolk-Chicago double-stack trains on the Heartland Corridorroute. This will save 233 miles relative to the route over Harrisburg and improve transit time to

Networks and Corridors
042607 Puerto Nuevo Report Vol 4 Final Page 92THE TIOGA GROUP
Chicago by about one day. Since Columbus will be on the route of the Chicago trains, double-stack service to Columbus will be significantly improved as well.
Exhibit 54: Heartland Corridor Projects
Portsmouth Rail Project
There are two new marine terminals being developed in Portsmouth. The first is beingdeveloped by APM Terminals, a subsidiary of AP Moller Company which owns MaerskSeaLand. The APM terminal is under construction and is scheduled to begin operation in 2007.The second marine terminal is being developed by the Virginia Port Authority on Craney Islandjust north of the APM terminal. The Craney Island terminal is planned to begin operation in2017. Both of these terminals will be served by the Commonwealth Railway, a short line thatoperates from Suffolk to Portsmouth. The Commonwealth Railway will connect with NS andCSX at Suffolk to bring NS and CSX container trains to the APM and Craney Island marineterminals. On its existing route, the Commonwealth Railway must operate its trains through thecities of Chesapeake and Portsmouth to reach the APM terminal and future Craney Islandterminal. This route passes through 14 at-grade street crossings creating the potential forsignificant conflict with local street traffic as train operations increase to serve the marineterminals.
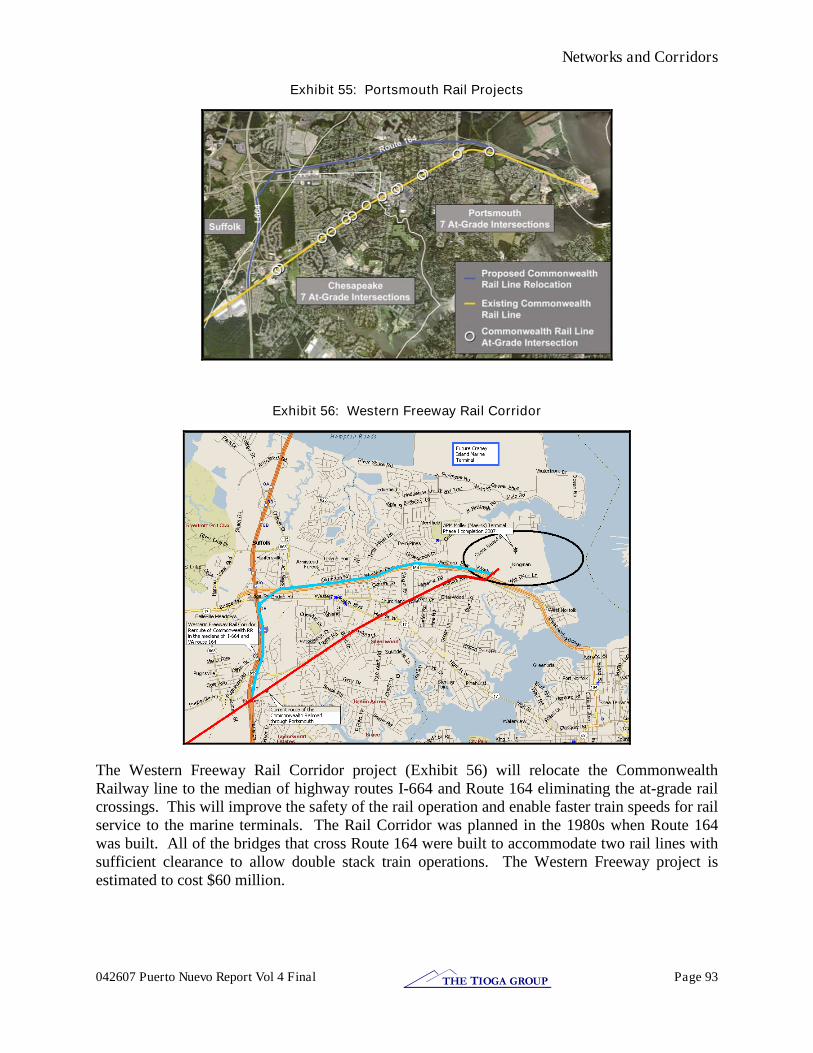
Networks and Corridors
042607 Puerto Nuevo Report Vol 4 Final Page 93THE TIOGA GROUP
Exhibit 55: Portsmouth Rail Projects
Exhibit 56: Western Freeway Rail Corridor
The Western Freeway Rail Corridor project (Exhibit 56) will relocate the CommonwealthRailway line to the median of highway routes I-664 and Route 164 eliminating the at-grade railcrossings. This will improve the safety of the rail operation and enable faster train speeds for railservice to the marine terminals. The Rail Corridor was planned in the 1980s when Route 164was built. All of the bridges that cross Route 164 were built to accommodate two rail lines withsufficient clearance to allow double stack train operations. The Western Freeway project isestimated to cost $60 million.
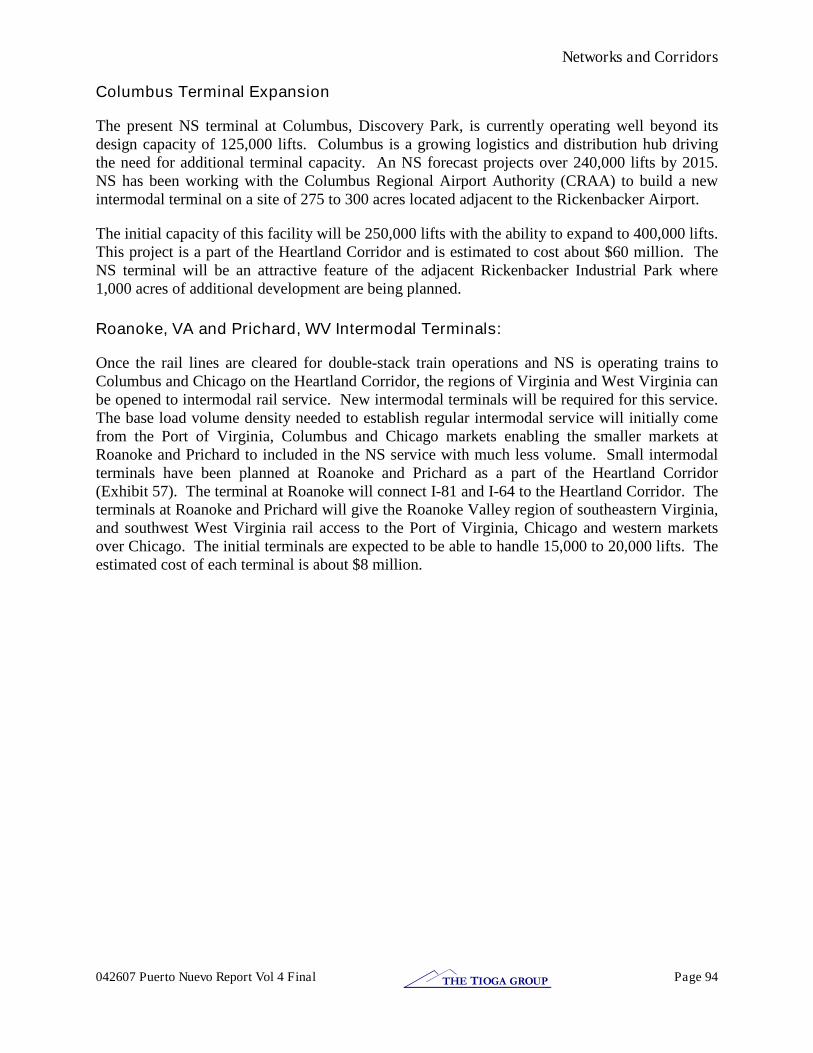
Networks and Corridors
042607 Puerto Nuevo Report Vol 4 Final Page 94THE TIOGA GROUP
Columbus Terminal Expansion
The present NS terminal at Columbus, Discovery Park, is currently operating well beyond itsdesign capacity of 125,000 lifts. Columbus is a growing logistics and distribution hub drivingthe need for additional terminal capacity. An NS forecast projects over 240,000 lifts by 2015.NS has been working with the Columbus Regional Airport Authority (CRAA) to build a newintermodal terminal on a site of 275 to 300 acres located adjacent to the Rickenbacker Airport.
The initial capacity of this facility will be 250,000 lifts with the ability to expand to 400,000 lifts.This project is a part of the Heartland Corridor and is estimated to cost about $60 million. TheNS terminal will be an attractive feature of the adjacent Rickenbacker Industrial Park where1,000 acres of additional development are being planned.
Roanoke, VA and Prichard, WV Intermodal Terminals:
Once the rail lines are cleared for double-stack train operations and NS is operating trains toColumbus and Chicago on the Heartland Corridor, the regions of Virginia and West Virginia canbe opened to intermodal rail service. New intermodal terminals will be required for this service.The base load volume density needed to establish regular intermodal service will initially comefrom the Port of Virginia, Columbus and Chicago markets enabling the smaller markets atRoanoke and Prichard to included in the NS service with much less volume. Small intermodalterminals have been planned at Roanoke and Prichard as a part of the Heartland Corridor(Exhibit 57). The terminal at Roanoke will connect I-81 and I-64 to the Heartland Corridor. Theterminals at Roanoke and Prichard will give the Roanoke Valley region of southeastern Virginia,and southwest West Virginia rail access to the Port of Virginia, Chicago and western marketsover Chicago. The initial terminals are expected to be able to handle 15,000 to 20,000 lifts. Theestimated cost of each terminal is about $8 million.
Networks and Corridors
042607 Puerto Nuevo Report Vol 4 Final Page 95THE TIOGA GROUP
Exhibit 57: Roanoke and Prichard Terminals
Funding
The Heartland Corridor projects are estimated to cost $266 million and take five years tocomplete. Over $200 million of this amount will be for clearance projects and intermodalterminals on NS, which is more than can be justified based on private sector benefits alone.
While the Heartland Corridor Project will provide benefits to a broad spectrum of public andprivate stakeholders, it appears that the primary beneficiaries will be NS and the Port of Virginia.A cleared route from Norfolk to Columbus will improve the NS competitive position to Midwestmarkets and western markets over Chicago. The Port of Virginia will benefit by havingimproved double-stack rail access to its major interior markets. As Asian container importscontinue to grow, ocean carriers are moving more cargo via all water services to the east coast,creating growth opportunities for east coast ports. The Port of Virginia, with its deep-waterchannels, its new APM marine terminal and long-term plan for marine terminal capacity atCraney Island is well positioned to take advantage of this growth opportunity. The improved railaccess provided by the Heartland Corridor will provide strategic advantage for the Port as itcompetes for Midwest cargo.
As the key beneficiaries of the Heartland Corridor, NS and the Port of Virginia worked veryclosely together to develop support for public funding for these projects. NS and the Port ofVirginia have a long-standing relationship in development of intermodal services for the Port. Asa result of their work, local and congressional support from all three states was developed

Networks and Corridors
042607 Puerto Nuevo Report Vol 4 Final Page 96THE TIOGA GROUP
enabling $143 million in federal funding earmarks in the federal transportation bill which passedin July 2005. Exhibit 58 is a summary of project funding.
Exhibit 58: Heartland Corridor Funding
Project Total Cost Federal Funding NS/State/Local funding
Double Stack Clearances $130M $95M $35MIntermodal Terminals $76M $33M $43M
Western Freeway $60M $15M $45MTotal $266M $143M $128M
Securing the federal funding was a major accomplishment and excellent example of privatepublic partnership in the development of a major transportation initiative. It is very likely thatwithout federal support the key clearance and terminal projects would not go forward.
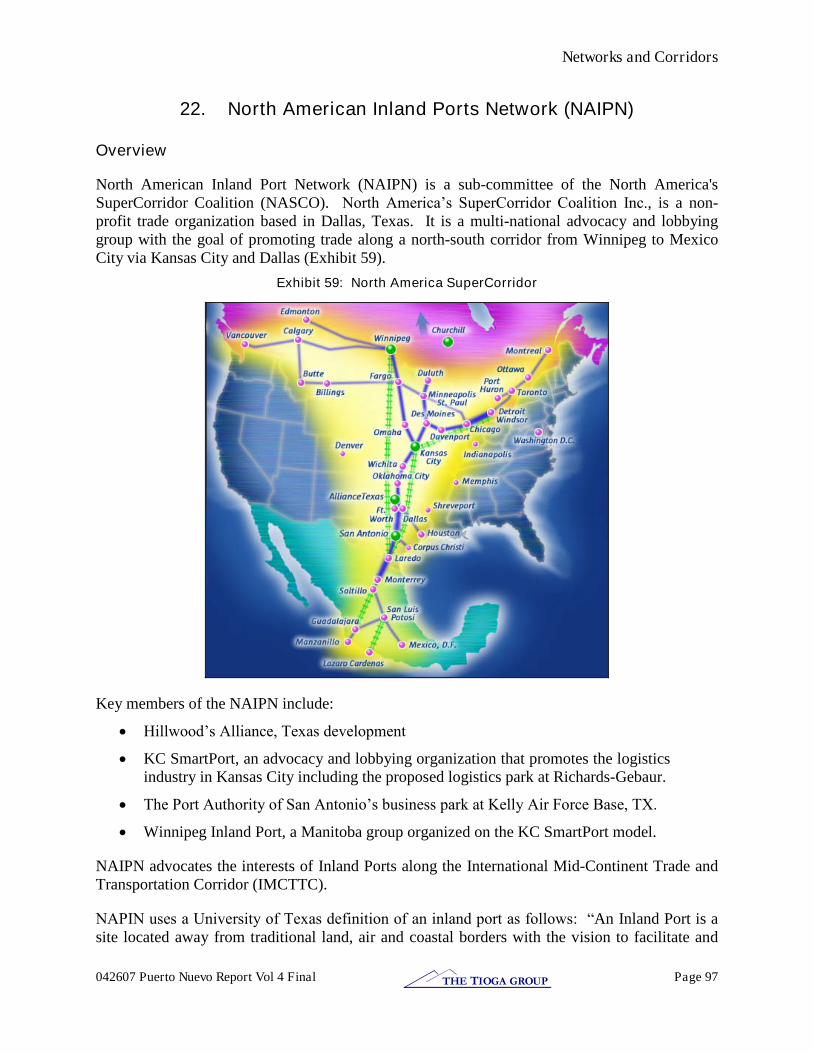
Networks and Corridors
042607 Puerto Nuevo Report Vol 4 Final Page 97THE TIOGA GROUP
22. North American Inland Ports Network (NAIPN)
Overview
North American Inland Port Network (NAIPN) is a sub-committee of the North America'sSuperCorridor Coalition (NASCO). North America’s SuperCorridor Coalition Inc., is a non-profit trade organization based in Dallas, Texas. It is a multi-national advocacy and lobbyinggroup with the goal of promoting trade along a north-south corridor from Winnipeg to MexicoCity via Kansas City and Dallas (Exhibit 59).
Exhibit 59: North America SuperCorridor
Key members of the NAIPN include:
Hillwood’s Alliance, Texas development
KC SmartPort, an advocacy and lobbying organization that promotes the logisticsindustry in Kansas City including the proposed logistics park at Richards-Gebaur.
The Port Authority of San Antonio’s business park at Kelly Air Force Base, TX.
Winnipeg Inland Port, a Manitoba group organized on the KC SmartPort model.
NAIPN advocates the interests of Inland Ports along the International Mid-Continent Trade andTransportation Corridor (IMCTTC).
NAPIN uses a University of Texas definition of an inland port as follows: “An Inland Port is asite located away from traditional land, air and coastal borders with the vision to facilitate and
Networks and Corridors
042607 Puerto Nuevo Report Vol 4 Final Page 98THE TIOGA GROUP
process international trade through strategic investment in multi-modal transportation assets andby promoting value-added services as goods move through the supply chain.”
The definition lends the University’s name and an element of credibility that supports NAPIN’s simple, direct and totally understandable goal of promotion of public and private investment inthis trade lane.
NAPIN and Texas DOT’s privatized TransTexas Corridor
Apart from the University of Texas inland port definition there is some synergy betweenSuperCorridor activities and the Texas DOT in the promotion of the Trans-Texas Corridor.Texas’s largest trading partner is Mexico and the congested I-35 corridor is the key trade route.The TransTexas Corridor (Exhibit 60) is a planned 50-year transportation infrastructureimprovement program with the following features:
separate lanes for passenger vehicles and large trucks
freight railways
high-speed commuter railways
infrastructure for utilities including water lines, oil and gas pipelines, andtransmission lines for electricity, broadband and other telecommunicationsservices
Plans call for TxDOT to oversee planning, construction and ongoing maintenance, with privatevendors responsible for daily operations.

Networks and Corridors
042607 Puerto Nuevo Report Vol 4 Final Page 99THE TIOGA GROUP
Exhibit 60: Trans-Texas Corridor

Shuttle Services
042607 Puerto Nuevo Report Vol 4 Final Page 100THE TIOGA GROUP
23. Albany, NY Barge Service
Overview
The Albany barge service was an initiative to move containers on barges from the Port of NewYork and New Jersey to the inland river Port of Albany.
Exhibit 61: Albany Express Barge
The Port of Albany carried out the market analysis and a financial pro forma was developed.Albany had to ensure that the necessary infrastructure and security systems would be in placebefore PANYNJ would agree to participate. Albany also had to guarantee funding for two years.PANYNJ put up $6 million to initiate barge services for five locations, one of which wasAlbany. For each feeder port, the PANYNJ would contribute $25 per container that moves bybarge up to 40,000 containers. Later on the feeder ports would pay the PANYNJ $5 percontainer in excess of 25,000 containers transported in any calendar year. The PANYNJprovided $200,000 per inland port for marketing and start-up services. PANYNJ had CMAQfunds totaling $3.3 million for the Port of Albany for the first two years of service.
Parties and Roles
This project was an element of the Port Authority of New York and New Jersey’s (PA) Port Inland Distribution Network (PIDN). The project was a two-year demonstration underwritten bythe Port of Albany, Port Authority of New York and New Jersey, State of New York, and thefederal government. The service was recently terminated as the funding which supported theoperation was not renewed. The operator of the barge was Columbia Coastal, an east coastocean barge operator.
Service
The service operated from Port Elizabeth, NJ, to Albany, NY, approximately 140 miles up theHudson River. The initiative provided a second day service twice a week between federal
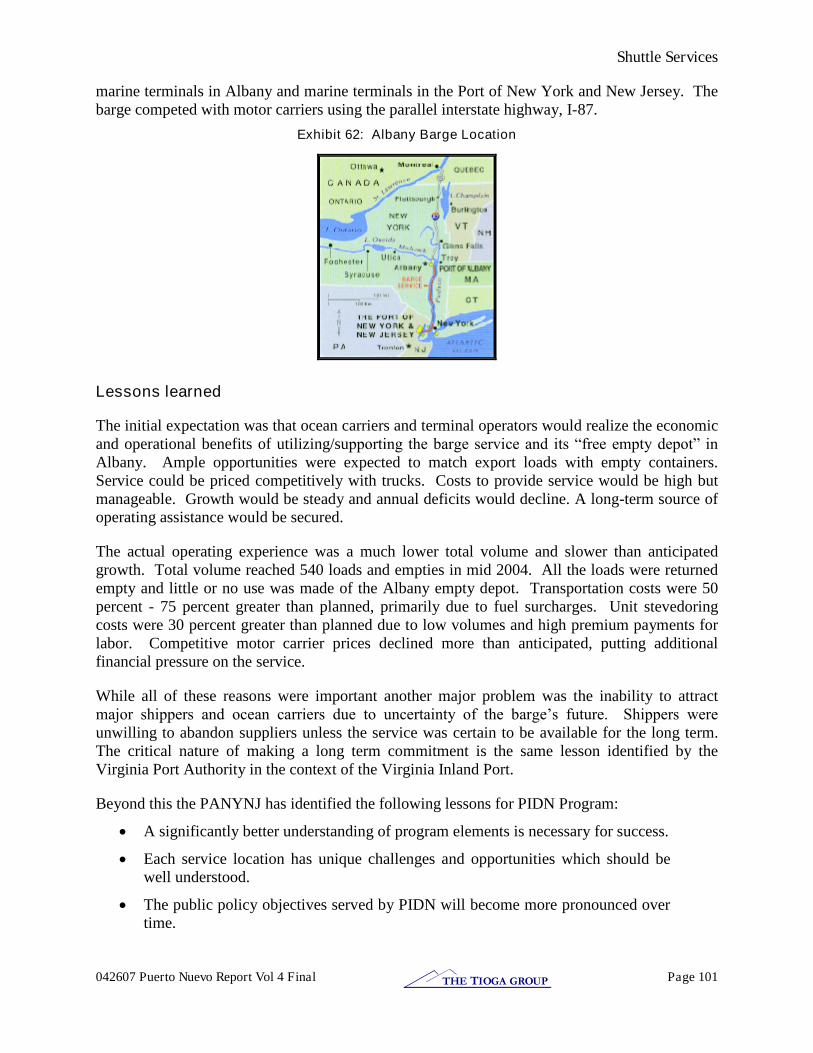
Shuttle Services
042607 Puerto Nuevo Report Vol 4 Final Page 101THE TIOGA GROUP
marine terminals in Albany and marine terminals in the Port of New York and New Jersey. Thebarge competed with motor carriers using the parallel interstate highway, I-87.
Exhibit 62: Albany Barge Location
Lessons learned
The initial expectation was that ocean carriers and terminal operators would realize the economicand operational benefits of utilizing/supporting the barge service and its “free empty depot” in Albany. Ample opportunities were expected to match export loads with empty containers.Service could be priced competitively with trucks. Costs to provide service would be high butmanageable. Growth would be steady and annual deficits would decline. A long-term source ofoperating assistance would be secured.
The actual operating experience was a much lower total volume and slower than anticipatedgrowth. Total volume reached 540 loads and empties in mid 2004. All the loads were returnedempty and little or no use was made of the Albany empty depot. Transportation costs were 50percent - 75 percent greater than planned, primarily due to fuel surcharges. Unit stevedoringcosts were 30 percent greater than planned due to low volumes and high premium payments forlabor. Competitive motor carrier prices declined more than anticipated, putting additionalfinancial pressure on the service.
While all of these reasons were important another major problem was the inability to attractmajor shippers and ocean carriers due to uncertainty of the barge’s future. Shippers were unwilling to abandon suppliers unless the service was certain to be available for the long term.The critical nature of making a long term commitment is the same lesson identified by theVirginia Port Authority in the context of the Virginia Inland Port.
Beyond this the PANYNJ has identified the following lessons for PIDN Program:
A significantly better understanding of program elements is necessary for success.
Each service location has unique challenges and opportunities which should bewell understood.
The public policy objectives served by PIDN will become more pronounced overtime.

Shuttle Services
042607 Puerto Nuevo Report Vol 4 Final Page 102THE TIOGA GROUP
Re-activation of the Albany barge service could be warranted if long-termfunding materializes or the business environment changes.
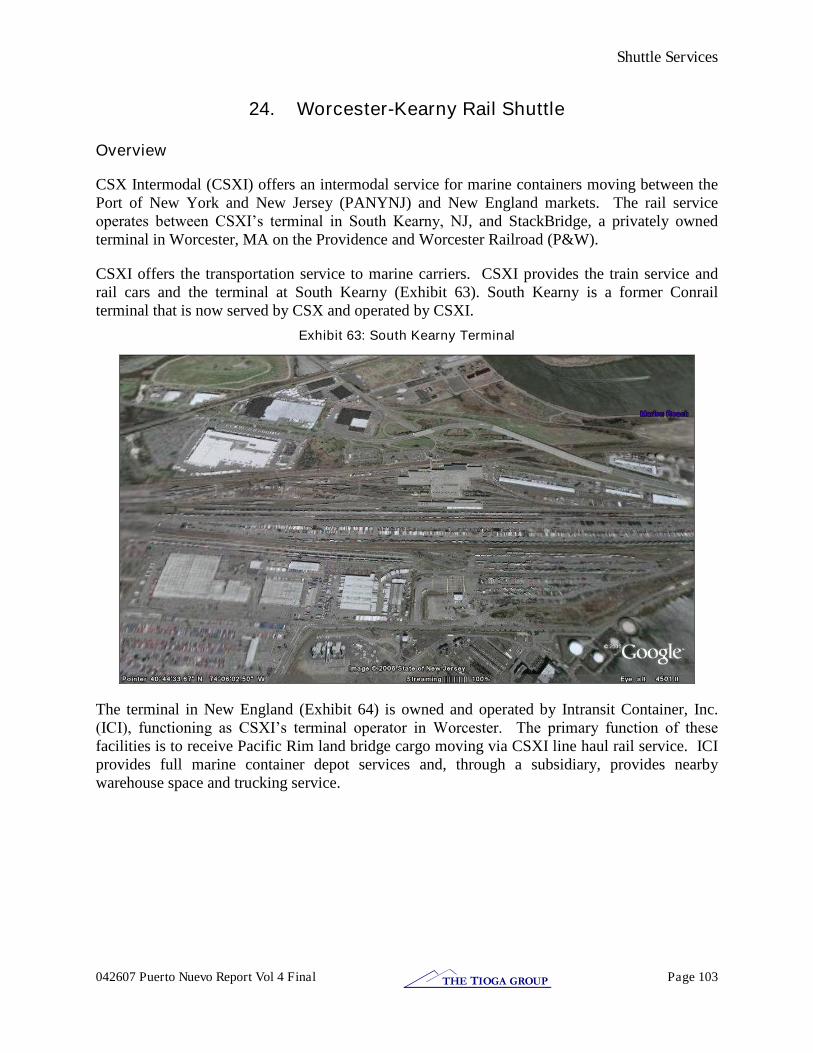
Shuttle Services
042607 Puerto Nuevo Report Vol 4 Final Page 103THE TIOGA GROUP
24. Worcester-Kearny Rail Shuttle
Overview
CSX Intermodal (CSXI) offers an intermodal service for marine containers moving between thePort of New York and New Jersey (PANYNJ) and New England markets. The rail serviceoperates between CSXI’s terminal in South Kearny, NJ, and StackBridge, a privately ownedterminal in Worcester, MA on the Providence and Worcester Railroad (P&W).
CSXI offers the transportation service to marine carriers. CSXI provides the train service andrail cars and the terminal at South Kearny (Exhibit 63). South Kearny is a former Conrailterminal that is now served by CSX and operated by CSXI.
Exhibit 63: South Kearny Terminal
The terminal in New England (Exhibit 64) is owned and operated by Intransit Container, Inc.(ICI), functioning as CSXI’s terminal operator in Worcester. The primary function of these facilities is to receive Pacific Rim land bridge cargo moving via CSXI line haul rail service. ICIprovides full marine container depot services and, through a subsidiary, provides nearbywarehouse space and trucking service.

Shuttle Services
042607 Puerto Nuevo Report Vol 4 Final Page 104THE TIOGA GROUP
Exhibit 64: Intransit Container Terminal
The marine carriers are the customers of CSXI and ICI. The cargo largely remains in bond andclears Customs in MA. Some of the cargo moves on a marine bill of lading to Boston.
Notwithstanding the fact that this is a private sector transportation solution, the Port Authority ofNew York and New Jersey feature this service as a part of their Port Inland Distribution Network(PIDN).
Stackbridge (Exhibit 65) is located on the P&W railroad, a New England regional rail carrierwhich connects with CSX Transportation (CSX) at Worcester. The P&W interchanges cars andswitches the Stackbridge terminal.

Shuttle Services
042607 Puerto Nuevo Report Vol 4 Final Page 105THE TIOGA GROUP
Exhibit 65: Stackbridge Intermodal Terminal
Service
South Kearny is located approximately 5 miles from the main container terminals in the Port ofNew York and New Jersey. Stackbridge is located 35–40 miles from downtown Boston and iswell located to serve the New England market. Worcester is approximately 160 miles fromSouth Kearny (Exhibit 66).
Exhibit 66: Rail Shuttle Route

Shuttle Services
042607 Puerto Nuevo Report Vol 4 Final Page 106THE TIOGA GROUP
Containers are drayed between PANYNJ marine terminals and South Kearny IntermodalTerminal. The cargo is moved in a block of cars added to westbound trains moving betweenNorthern New Jersey and Selkirk (Albany), NY. The block is picked up by eastbound landbridge trains destined for Stackbridge and the Boston market. The cut off time at South Kearnyis 1,300 hours. Monday, Tuesday and Thursday. Containers are available at StackBridge by1,500 hours the following day. The cargo is then drayed to destinations in New England.
The process is reversed to move containers from New England to PANYNJ. On the reversemove the cut time off is 1,700 hrs. daily with availability at South Kearny at 0200 hrs. Thursdaythrough Monday. The minimum scheduled transit time is 57 hours; Saturday, Sunday andMonday departures are available Thursday morning, and Tuesday’s departure is available earlyFriday morning.
Competition
The cargo could move by barge between PANYNJ and Boston or by motor carrier betweenPANYNJ and final destination.
Success Factors
The highways in the region I-84, I-91, and I-95 are highly congested and truck costs arerelatively high. The barge service is weekly, limiting departure flexibility and transit time. Inaddition the Boston port location may result in increased drayage cost to many MA and RIcustomer locations. A key driver of the rail economics is the availability of existing traincapacity enabling CSXI to view the business as incremental to existing trains. If there were notrain capacity it is doubtful that this short haul business could justify new dedicated train starts.

Trade Processing Centers
042607 Puerto Nuevo Report Vol 4 Final Page 107THE TIOGA GROUP
25. Richards-Gebaur ITC development
Overview
Richards-Gebaur (Exhibit 67) was operated as an Army Air Force, Air Force, and Air ForceReserve base from 1941–1994. In 1976, the Air Force converted the base to reserve status anddeclared approximately 1,362 acres surplus. In August 1985, the property was given back toKansas City, to be used as a public airport. Between 1986 and 1994, approximately $12.2million in federal airport development funds were obtained for airport improvements. Thisfunding was subject to the city’s agreement that the airport would be available to the public foraeronautical use.
Exhibit 67: Richards-Gebaur Redevelopment Site
The airport consistently lost money on its air operations and was projected to continue to loosemore than $1.5 million annually. In 1997, the city identified an opportunity to redevelop theairport land into an intermodal rail-truck freight distribution center and industrial park. Toenable this redevelopment, Kansas City submitted an application to the FAA requestingpermission to close the airport and be released from its previous federal aviation obligations andcommitments. The next five years were spent in a series of court battles that were resolved infavor of the logistics redevelopment. Following this litigation, the Port Authority of Kansas Citywas charged with economic development of the former Air Force Base with the objective ofcreating an international trade-processing center.
In 2004, the Port Authority selected CenterPoint Properties to plan and manage theredevelopment project. CenterPoint is a major industrial real estate developer, headquartered inChicago, with considerable experience in logistics park development. The Port Authority plan

Trade Processing Centers
042607 Puerto Nuevo Report Vol 4 Final Page 108THE TIOGA GROUP
provides for sale of the property to the master developer for diverse industrial uses, includingdistribution, light manufacturing and warehousing.
Services
The Kansas City Port Authority expects the Richards-Gebaur development to capitalize onKansas City’s position as the second largest rail hub and the third largest trucking hub in thecountry. In addition, Kansas City has more Foreign Trade Zone space than any other Americancity strengthening its position to compete for international trade. Kansas City is also wellpositioned for NAFTA trade having entered into agreements with Mexican and Canadianofficials to take advantage of the major international North to South I-29 and I-35 tradecorridors.
The Kansas Southern Railway (KCS) is expected to serve an intermodal terminal that will bebuilt and financed by CenterPoint as a part of the development. This project will be similar inconcept but somewhat smaller than the Joliet Arsenal redevelopment. The KCS has beenpursuing business strategies seeking to capitalize on the synergies between the carrier’s service area and NAFTA. In 2005, following a series of very complex international transactions, KCSacquired the controlling interest in TFM, the railway serving the key Mexico City-Laredocorridor. KCS, with its TFM acquisition, now provides single line service between Kansas Cityand Mexico City. In addition, KCS has developed a marketing alliance with the CanadianNational railroad creating interline service routes to Canadian markets. These actions havepositioned KCS to take advantage of the expected future growth of NAFTA trade.
ITPC Concept
Richards-Gebaur is being labeled an “International Freight Gateway” and positioned as the hub of an “Inland Trade Processing Center” or ITPC. ITPCs are intended by Customs to relieve pressure on congested border crossings and ports. It is unclear, however, whether an ITPCwould serve as an effective anchor or attraction for logistics-based business development.
Project Status
CenterPoint does not yet have control of the Air Force Base property and it is actively engagedin resolving the administrative issues related to transfer of the property from the U.S.Government. These issues should be resolved in 2006 with groundbreaking expected in 2007.
Lessons Learned
Despite the best efforts of many willing partners working toward development of a logisticsbusiness park, this project has still taken more than a decade of effort, and groundbreaking hasyet to occur. In many, if not most cases, the length of time required to resolve propertyacquisition, environmental, political and financing issues requires patience and staying power tofinalize this type of development. Beyond the cost of the lost opportunities there is the generalconcern (perhaps not in this specific case) that by the time such a facility is finally built themarket will have shifted resulting in significant loss of potential opportunity. A key lesson is

Trade Processing Centers
042607 Puerto Nuevo Report Vol 4 Final Page 109THE TIOGA GROUP
that the developer and development authority must have political support, a significantcommitment and staying power to drive the project to conclusion.

Trade Processing Centers
042607 Puerto Nuevo Report Vol 4 Final Page 110THE TIOGA GROUP
26. Port of Battle Creek, MI
Overview
Fort Custer Industrial Park is the largest modern industrial park in Michigan. In 1972, BattleCreek Unlimited Inc. was created as a private, nonprofit organization to conduct economicdevelopment activities for the city of Battle Creek. Owned by the City of Battle Creek, theplanned industrial complex now is home to more than 90 companies.
The U.S. Customs Port of Battle Creek and Foreign Trade Zone #43 serves southwest Michiganfrom a central location in Fort Custer Industrial Park.
Battle Creek Unlimited (BCU), with a total staff of 15 people, is a private, nonprofit corporationunder contract with the City of Battle Creek for economic development activities. The efforts ofBCU are focused primarily in Fort Custer Industrial Park, the downtown central business district,and W.K. Kellogg Airport.
Site location assistance in Fort Custer Industrial Park, the downtown centralbusiness district including Renaissance Zone sites, the Aviation and e-LearningSmart Zone of Battle Creek, and W.K. Kellogg Airport
Employee selection and training for new companies locating in Battle Creek
Gap financing and equity investment
Tax incentive assistance
Project management before, during and after site selection
The City of Battle Creek has the flexibility to grant tax abatements. If a tax abatement isapproved by the City of Battle Creek (with concurrence of the State Tax Commission), themajority of local property tax can be cut in half for up to 12 years. A tax abatement allows 50percent reduction of local taxes assessed on the building and equipment.
BC/CAL/KAL Inland Port Development Corporation
The private, nonprofit organization that administers Foreign Trade Zone #43, and markets theinland port of entry in Battle Creek, is BC/CAL/KAL Inland Port Development Corporation.The primary activity of the Inland Port Development Corporation is promotion and managementof the FTZ and associated sub-zones to the benefit of regional employers.
The U.S. Customs Port of Battle Creek is an inland port of entry. The U.S. Customs Port ofBattle Creek is adjacent to W.K. Kellogg Airport, allowing for convenient clearances of aircraftarriving from international points of departure. The Port of Battle Creek is centrally located inthe 3,000-acre Fort Custer Industrial Park, providing a convenient terminal to companies in thelargest modern industrial park in Michigan. Located midway between Detroit and Chicago alongthe I-94 corridor, the U.S. Customs Port of Battle Creek has twenty-five years of service to theSouthwest Michigan region. Two full-time U.S. Customs Service personnel serve the port ofentry and W.K. Kellogg Airport.
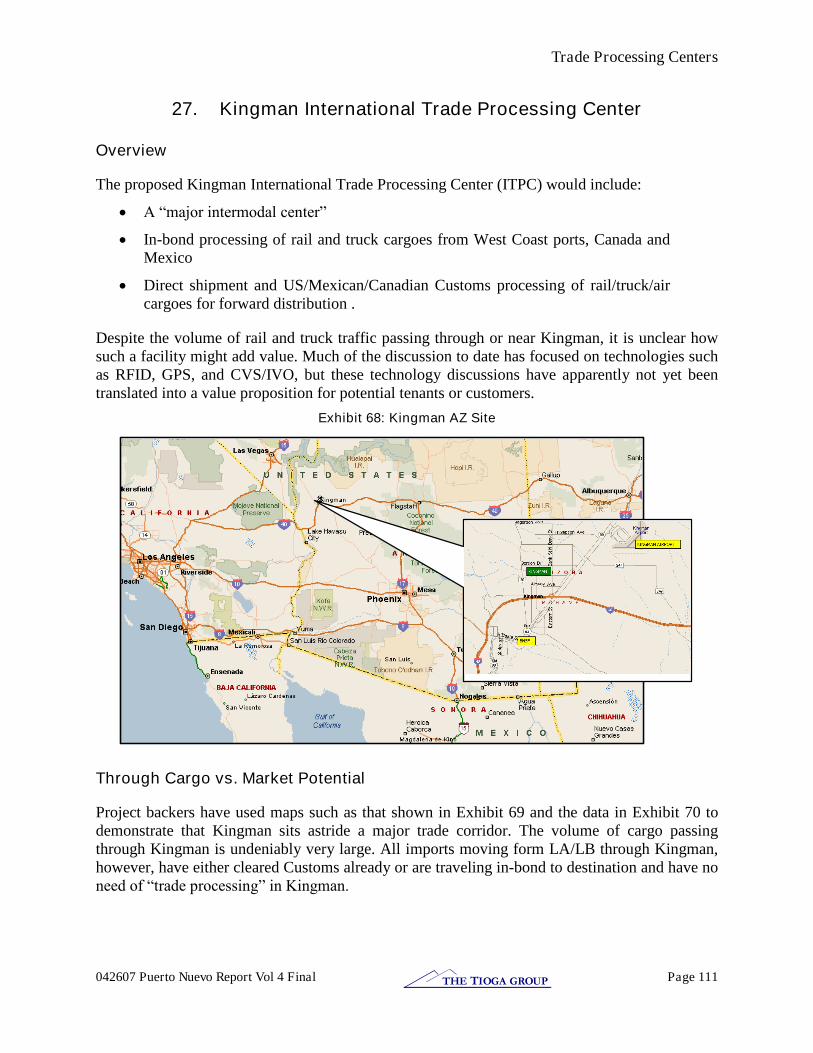
Trade Processing Centers
042607 Puerto Nuevo Report Vol 4 Final Page 111THE TIOGA GROUP
27. Kingman International Trade Processing Center
Overview
The proposed Kingman International Trade Processing Center (ITPC) would include:
A “major intermodal center”
In-bond processing of rail and truck cargoes from West Coast ports, Canada andMexico
Direct shipment and US/Mexican/Canadian Customs processing of rail/truck/aircargoes for forward distribution .
Despite the volume of rail and truck traffic passing through or near Kingman, it is unclear howsuch a facility might add value. Much of the discussion to date has focused on technologies suchas RFID, GPS, and CVS/IVO, but these technology discussions have apparently not yet beentranslated into a value proposition for potential tenants or customers.
Exhibit 68: Kingman AZ Site
Through Cargo vs. Market Potential
Project backers have used maps such as that shown in Exhibit 69 and the data in Exhibit 70 todemonstrate that Kingman sits astride a major trade corridor. The volume of cargo passingthrough Kingman is undeniably very large. All imports moving form LA/LB through Kingman,however, have either cleared Customs already or are traveling in-bond to destination and have noneed of “trade processing” in Kingman.
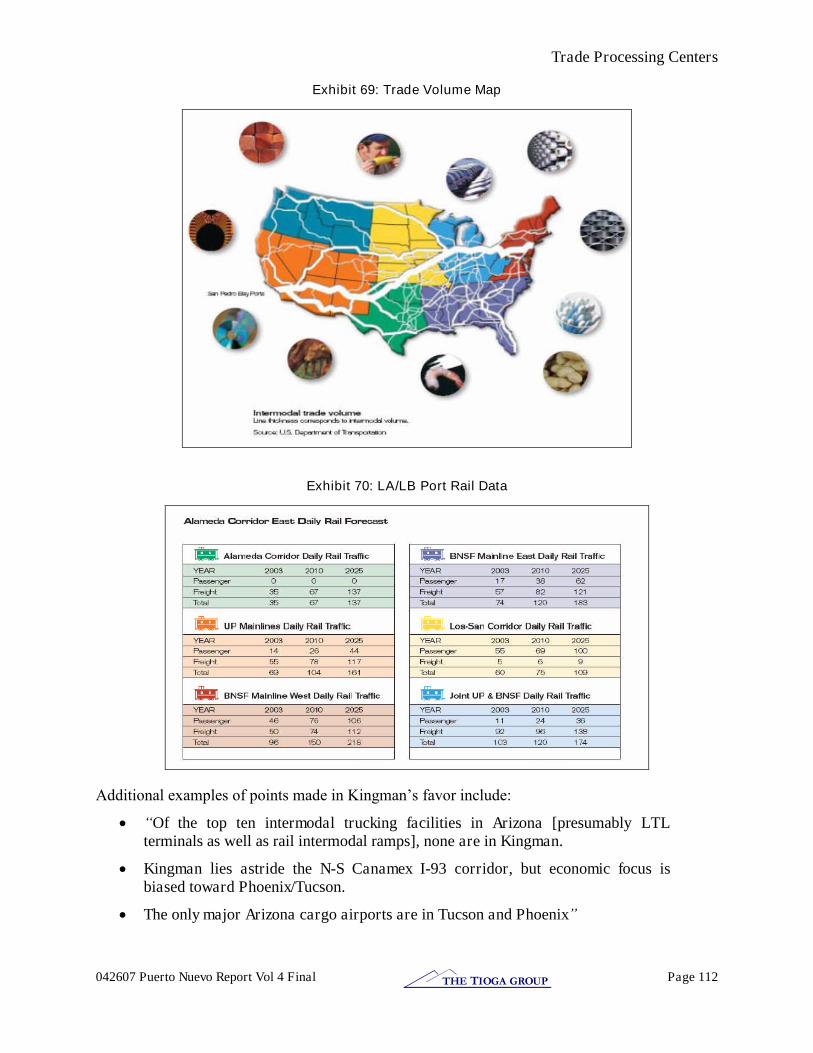
Trade Processing Centers
042607 Puerto Nuevo Report Vol 4 Final Page 112THE TIOGA GROUP
Exhibit 69: Trade Volume Map
Exhibit 70: LA/LB Port Rail Data
Additional examples of points made in Kingman’s favor include:
“Of the top ten intermodal trucking facilities in Arizona [presumably LTLterminals as well as rail intermodal ramps], none are in Kingman.
Kingman lies astride the N-S Canamex I-93 corridor, but economic focus isbiased toward Phoenix/Tucson.
The only major Arizona cargo airports are in Tucson and Phoenix”
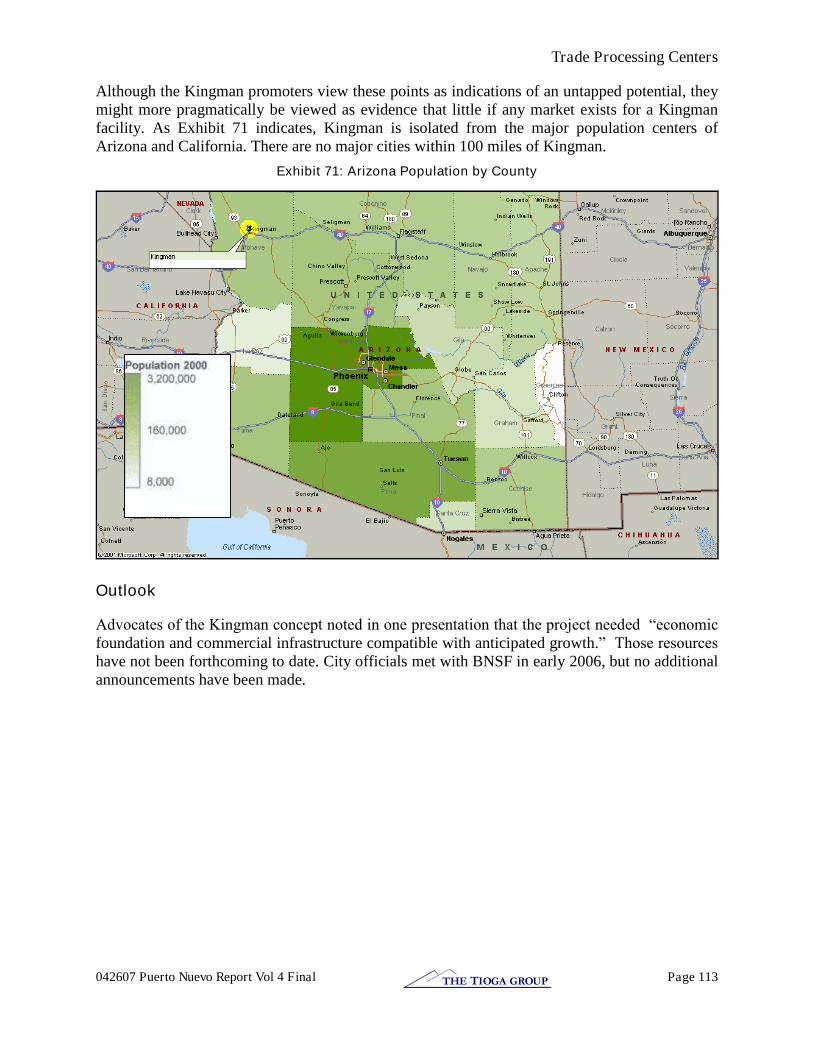
Trade Processing Centers
042607 Puerto Nuevo Report Vol 4 Final Page 113THE TIOGA GROUP
Although the Kingman promoters view these points as indications of an untapped potential, theymight more pragmatically be viewed as evidence that little if any market exists for a Kingmanfacility. As Exhibit 71 indicates, Kingman is isolated from the major population centers ofArizona and California. There are no major cities within 100 miles of Kingman.
Exhibit 71: Arizona Population by County
Outlook
Advocates of the Kingman concept noted in one presentation that the project needed “economic foundation and commercial infrastructure compatible with anticipated growth.” Those resources have not been forthcoming to date. City officials met with BNSF in early 2006, but no additionalannouncements have been made.
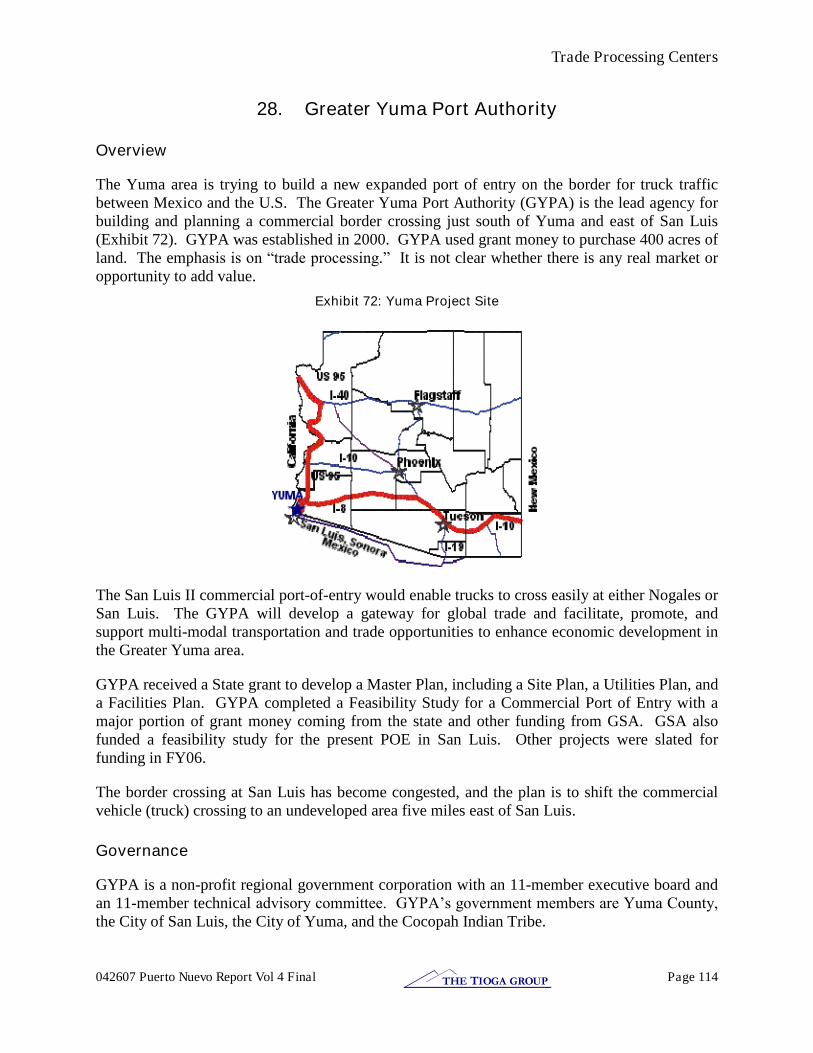
Trade Processing Centers
042607 Puerto Nuevo Report Vol 4 Final Page 114THE TIOGA GROUP
28. Greater Yuma Port Authority
Overview
The Yuma area is trying to build a new expanded port of entry on the border for truck trafficbetween Mexico and the U.S. The Greater Yuma Port Authority (GYPA) is the lead agency forbuilding and planning a commercial border crossing just south of Yuma and east of San Luis(Exhibit 72). GYPA was established in 2000. GYPA used grant money to purchase 400 acres ofland. The emphasis is on “trade processing.” It is not clear whether there is any real market oropportunity to add value.
Exhibit 72: Yuma Project Site
The San Luis II commercial port-of-entry would enable trucks to cross easily at either Nogales orSan Luis. The GYPA will develop a gateway for global trade and facilitate, promote, andsupport multi-modal transportation and trade opportunities to enhance economic development inthe Greater Yuma area.
GYPA received a State grant to develop a Master Plan, including a Site Plan, a Utilities Plan, anda Facilities Plan. GYPA completed a Feasibility Study for a Commercial Port of Entry with amajor portion of grant money coming from the state and other funding from GSA. GSA alsofunded a feasibility study for the present POE in San Luis. Other projects were slated forfunding in FY06.
The border crossing at San Luis has become congested, and the plan is to shift the commercialvehicle (truck) crossing to an undeveloped area five miles east of San Luis.
Governance
GYPA is a non-profit regional government corporation with an 11-member executive board andan 11-member technical advisory committee. GYPA’s government members are Yuma County, the City of San Luis, the City of Yuma, and the Cocopah Indian Tribe.
Trade Processing Centers
042607 Puerto Nuevo Report Vol 4 Final Page 115THE TIOGA GROUP
Services
The project area already has an industrial park and a Foreign Trade Zone.
The project appears to anticipate that a new commercial point-of-entry would serve as a catalystfor business and industrial development. Studies to date, however, appear to have focused onfacilities for the POE rather than on the market for new business development.
Economic Development Initiatives
042607 Puerto Nuevo Report Vol 4 Final Page 116THE TIOGA GROUP
29. KC SmartPort
Overview
KC SmartPort is an economic development initiative designed to promote Kansas City as alogistics hub (separate from the KC Port Authority). Kansas City SmartPort is not an inland portfacility, but rather an organization formed to promote and enhance the Kansas City metro area’s status as “America’s Inland Port Solution”. KC SmartPort was created in June 2001 to combinea number of previous uncoordinated efforts.
SmartPort has two main focuses in its mission.
To grow the area’s transportation industry by attracting businesses withsignificant transportation and logistics elements;
To make it cheaper, faster, more efficient, and secure for companies to movegoods into, from, and through the Kansas City area.
SmartPort also has been defined to serve as an umbrella over Richards-Gebaur (separate casestudy) and FTZ space at the airport and elsewhere.
KC SmartPort received $500,000 in federal funding for 2003 and $750,000 for 2004 through theefforts of Congressman Graves. The funds were to be used for pilot projects rather than forfacilities development. The focus has been tests of wireless and RFID data systems.
SmartPort has had significant success in attracting businesses to Kansas City, specifically newDCs for New Holland and Musician’s Friend.