strategic plan/fiscal years 2012
TRANSCRIPT
TRANSPORTATION NEW GENERATIONFO
R A
STRATEGIC PLAN | FISCAL YEARS
2012–16

2 U.S. DEPARTMENT OF TRANSPORTATION | STRATEGIC PLAN FOR FISCAL YEARS 2012–16
On the cover: the Golden Gate Bridge, one of America’s great
transportation achievements.
On May 27, 2012, the Golden Gate Bridge turned 75. Until the Bridge’s opening in 1937, ferry service was the only means of crossing between San Francisco and Marin County, California. The bridge’s two towers climb 750 feet high with a 4,200-foot span suspended between them. For nearly three decades, that span remained the world’s longest. The Golden Gate Bridge embodies the best of American vision, engineering, and workmanship.
© ROB MCGOWAN/CORBIS
U.S. DEPARTMENT OF TRANSPORTATION | STRATEGIC PLAN FOR FISCAL YEARS 2012–16 3
MESSAGE FROM SECRETARY RAY LAHOOD I am proud to present the United States Department of Transportation’s Strategic Plan for fiscal years 2012–2016: “Transportation for a New Generation.”
In a time of great challenge and opportunity, a spirit of reform is sweeping across America. Cities and towns are seeking innovative approaches to moving people and goods—in addition to our state-of-the-art highway system. The traveling public is calling for investment in transit, rail, sidewalks and bike paths, and for policies that bring affordable hous-ing closer to good schools and quality jobs. People from across the political spectrum recognize that our transportation system must become safer, more efficient, more outcome-based, cost-effective, and more environmentally sustainable.
This Strategic Plan responds to these challenges and opportunities. It presents five strategic goals for America’s transportation system:
Safety;
State of Good Repair;
Economic Competitiveness;
Livable Communities;
Environmental Sustainability.
To achieve these goals, we must commit to developing an open, inclusive culture, and a dedicated workforce that is innovative, nimble, and focused on results.
The Obama Administration is committed to passage of a robust, six-year surface transportation reau-thorization bill, and our fiscal 2013 budget request. This legislation is needed to create jobs, and to strengthen and reform our Nation’s transportation programs in a fiscally sustainable way.
The President has recently signed Moving Ahead for Progress in the 21st Century (MAP-21), a bipartisan two-year reauthorization bill that DOT is currently implementing. While this provides predictability in transportation funding in the near future, two years will pass quickly. We need to begin work on a six-year bill to provide the long-term stability needed to rebuild our roads, bridges and transit systems and meet future demands for new roadway, transit, rail, and port infrastructure.

4 U.S. DEPARTMENT OF TRANSPORTATION | STRATEGIC PLAN FOR FISCAL YEARS 2012–16
After 56 years of steady funding increases fueled by Federal gas taxes, the Highway Trust Fund now faces shortfalls. A long-term surface transportation reauthorization bill with increased resources is urgently needed so that agencies and private firms can get multi-year projects underway, create high-quality jobs, and spur economic growth.
Our transportation infrastructure, much of which was built decades ago, is aging and in need of repair. The growing U.S. population, particularly in metropolitan areas, increasingly demands varied, acces-sible, affordable, and environmentally sustainable transportation options. Americans of all ages are seeking lifestyles that are less auto-dependent.
Our farms, factories, and businesses require a smart, efficient supply chain to compete globally. Within the transportation sector itself, aviation, maritime and freight rail, and intermodal facilities face interna-tional competition. Safety challenges—including distracted driving, positive train control, and high-profile transit, pipeline, motorcoach, and aviation incidents—remain urgent.
We must also speed the transition to a transportation system that burns less oil and emits less carbon. The U.S. maintains only two percent of the world’s oil reserves; yet we consume more than 20 percent of the world’s oil, 70 percent of which fuels our cars and trucks. This level of oil dependence is not sustainable, fiscally, strategically, or environmentally.
In short, we must create a transportation system that addresses these new challenges while putting the needs of the American people and their communities first.
The Administration’s surface transportation reauthorization proposal, our budget request for fiscal 2013, and this Strategic Plan constitute our roadmap to meet these new challenges. We look forward to working with the Congress and our public and private sector stakeholders to re-imagine America’s transportation system—not as an end in itself, but because it is the means by which we connect with one another, grow our economy, and pursue our dreams.
Sincerely yours,
Ray LaHood
U.S. DEPARTMENT OF TRANSPORTATION | STRATEGIC PLAN FOR FISCAL YEARS 2012–16 5
TABLE OF CONTENTS
SAFETY STRATEGIC GOAL . . . . . . . . . . . . . . . . . . . . . . . . . . . . . . . . . . . . . . . 8
CHALLENGES AND STRATEGIES . . . . . . . . . . . . . . . . . . . . . . . . . . . . . . . . . . . . . . . . . . . . . . . . 9
OUTCOMES, PRIORITY GOALS, AND PERFORMANCE MEASURES . . . . . . . . . . . . . . . . . . . . . . . . . 20
EXTERNAL RISK FACTORS . . . . . . . . . . . . . . . . . . . . . . . . . . . . . . . . . . . . . . . . . . . . . . . . . . . 21
STATE OF GOOD REPAIR STRATEGIC GOAL . . . . . . . . . . . . . . . . . . . . . . . . . . .22
CHALLENGES AND STRATEGIES . . . . . . . . . . . . . . . . . . . . . . . . . . . . . . . . . . . . . . . . . . . . . . . 23
OUTCOMES AND PERFORMANCE MEASURES . . . . . . . . . . . . . . . . . . . . . . . . . . . . . . . . . . . . . . 28
EXTERNAL RISK FACTORS . . . . . . . . . . . . . . . . . . . . . . . . . . . . . . . . . . . . . . . . . . . . . . . . . . . 29
ECONOMIC COMPETITIVENESS STRATEGIC GOAL . . . . . . . . . . . . . . . . . . . . . .30
CHALLENGES AND STRATEGIES . . . . . . . . . . . . . . . . . . . . . . . . . . . . . . . . . . . . . . . . . . . . . . . 31
OUTCOMES, PRIORITY GOALS AND PERFORMANCE MEASURES . . . . . . . . . . . . . . . . . . . . . . . . . 41
EXTERNAL RISK FACTORS . . . . . . . . . . . . . . . . . . . . . . . . . . . . . . . . . . . . . . . . . . . . . . . . . . . 42
LIVABLE COMMUNITIES STRATEGIC GOAL . . . . . . . . . . . . . . . . . . . . . . . . . . .44
CHALLENGES AND STRATEGIES . . . . . . . . . . . . . . . . . . . . . . . . . . . . . . . . . . . . . . . . . . . . . . . 45
OUTCOMES AND PERFORMANCE MEASURES . . . . . . . . . . . . . . . . . . . . . . . . . . . . . . . . . . . . . . 51
EXTERNAL RISK FACTORS . . . . . . . . . . . . . . . . . . . . . . . . . . . . . . . . . . . . . . . . . . . . . . . . . . . 52
ENVIRONMENTAL SUSTAINABILITY STRATEGIC GOAL . . . . . . . . . . . . . . . . . .54
CHALLENGES AND STRATEGIES . . . . . . . . . . . . . . . . . . . . . . . . . . . . . . . . . . . . . . . . . . . . . . . 55
OUTCOMES AND PERFORMANCE MEASURES . . . . . . . . . . . . . . . . . . . . . . . . . . . . . . . . . . . . . . 62
EXTERNAL RISK FACTORS . . . . . . . . . . . . . . . . . . . . . . . . . . . . . . . . . . . . . . . . . . . . . . . . . . . 63
THE UNITED STATES DEPARTMENT OF TRANSPORTATION . . . . . . . . . . . . . . .64
ORGANIZATIONAL EXCELLENCE GOAL . . . . . . . . . . . . . . . . . . . . . . . . . . . . . .65
PROGRAM EVALUATION . . . . . . . . . . . . . . . . . . . . . . . . . . . . . . . . . . . . . . . .68
ACRONYMS . . . . . . . . . . . . . . . . . . . . . . . . . . . . . . . . . . . . . . . . . . . . . . . . .70
6 U.S. DEPARTMENT OF TRANSPORTATION | STRATEGIC PLAN FOR FISCAL YEARS 2012–16
EXECUTIVE SUMMARY“TRANSPORTATION FOR A NEW GENERATION”HTTP://WWW .DOT .GOV
Crafted with the input of our leadership, our employees and our stakeholders, the United States Department of Transportation’s (DOT’s) Strategic Plan for fiscal years 2012–2016 re-imagines America’s transportation system as the means by which we connect with one another, grow our economy, and protect the environment. It fulfills our mission1 and sets the direction for DOT to provide safe, efficient, convenient, and sustainable transportation choices through five strategic goals that are supported by a wide-rang-ing management goal.
1 . SAFETY Improving transportation safety remains DOT’s top priority. Our goal is to bring a department-wide focus on reducing transportation-related fatalities and injuries. In our safety chapter, we highlight roadway safety for all users; combating
distracted driving and other dangerous behaviors; the need for a more effective Federal role in transit safety; and our strategies for addressing the most serious safety risks in other surface transportation modes and in aviation.
2 . STATE OF GOOD REPAIR Recent reports on the condition of key facilities—highways, bridges, transit systems, passenger rail and airport runways—reveal that many fall short of a state of good repair and thus compromise the safety, capacity, and efficiency of the U.S. transportation system. DOT will bring a strong programmatic emphasis and new resources to improving the condition of our infrastructure. DOT will encourage its government and industry partners to make optimal use of existing capacity, minimize life-cycle costs, and apply sound asset management principles throughout the system.
1 Section 101 of Title 49, U.S.C. contains DOT’s mission: “The national objectives of general welfare, economic growth and stability, and the security of the United States require the development of transportation policies and programs that contribute to providing fast, safe, efficient, and convenient transportation at the lowest cost, consistent with those and other national objectives, including the efficient use and conservation of the resources of the United States.”
In developing our policy, legislative and
funding initiatives, we at the Depart-
ment are moving beyond traditional
modal programmatic stereotypes . We
are looking at transportation policy and
investment from a bottom-line perspec-
tive . We are asking, where does our
policy emphasis and transportation
investment yield the greatest benefit
when viewed against these goals?
TRANSPORTATION DEPUTY SECRETARY JOHN D. PORCARI
U.S. DEPARTMENT OF TRANSPORTATION | STRATEGIC PLAN FOR FISCAL YEARS 2012–16 7
3 . ECONOMIC COMPETITIVENESSWith demand for both freight and passenger transportation expected to more than double by 2050, our goal is to support the U.S. economy by fostering smart, strategic investments that will serve the traveling public and facilitate freight movement. Our central strategies for achieving maximum eco-nomic returns on our policies and investments include leading the development of intercity, high-speed passenger rail and a competitive air transportation system; increasing travel time reliability in freight-significant highway corridors; improving the performance of freight rail and maritime networks; advancing transportation interests in targeted markets around the world; and expanding opportunities in the transportation sector for small businesses.
4 . LIVABLE COMMUNITIESFostering livable communities—places where coordinated transportation, housing, and commercial development gives people access to affordable and environmentally sustainable transportation—is a transformational policy shift for DOT. Over the last 50 years, transportation spending has often been poorly coordinated with other infrastructure investments resulting in auto-dependent residential com-munities where access to job opportunities and key amenities is inadequate and expensive. Our livable communities chapter addresses these and other related issues to show how we will pursue coordinated, place-based policies and investments that increase transportation choices and access to public transpor-tation services for all Americans.
5 . ENVIRONMENTAL SUSTAINABILITY Transportation is crucial to our economy and our quality of life, but building, operating, and maintain-ing transportation systems clearly have significant environmental impacts on our air, water, and natural ecosystems. The transportation sector is a significant source of greenhouse gas (GHG) emissions, accounting for 33 percent of total U.S. GHG emissions in 2009. Our environmental sustainability chapter describes how we will address these challenges through strategies such as fuel economy stan-dards for cars and trucks, more environmentally sound construction and operational practices, and by expanding opportunities for shifting freight from less fuel-efficient modes to more fuel-efficient modes.
ORGANIZATIONAL EXCELLENCEOur organizational excellence chapter outlines the management strategies we will implement to make DOT a high-performance, outcome-driven agency, and the best place to work in the Federal Government.

8 U.S. DEPARTMENT OF TRANSPORTATION | STRATEGIC PLAN FOR FISCAL YEARS 2012–16
SAFETY
U.S. DEPARTMENT OF TRANSPORTATION | STRATEGIC PLAN FOR FISCAL YEARS 2012–16 9
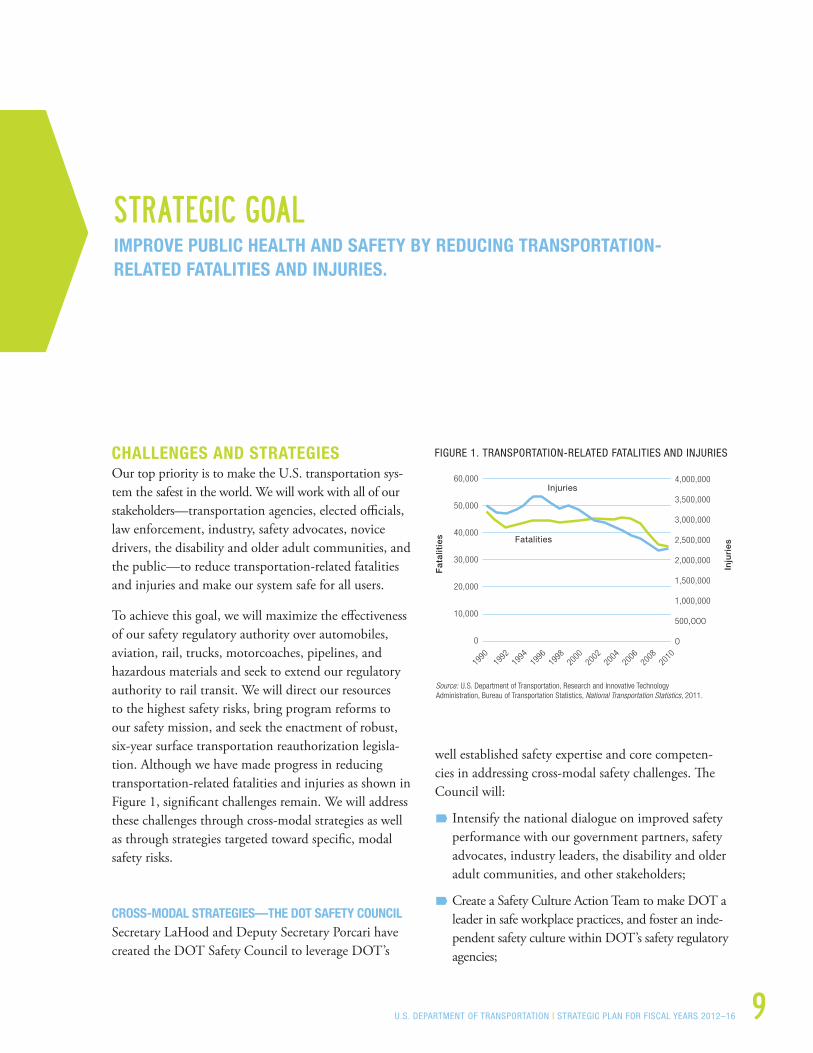
STRATEGIC GOALIMPROVE PUBLIC HEALTH AND SAFETY BY REDUCING TRANSPORTATION-RELATED FATALITIES AND INJURIES .
CHALLENGES AND STRATEGIES Our top priority is to make the U.S. transportation sys-tem the safest in the world. We will work with all of our stakeholders—transportation agencies, elected officials, law enforcement, industry, safety advocates, novice drivers, the disability and older adult communities, and the public—to reduce transportation-related fatalities and injuries and make our system safe for all users.
To achieve this goal, we will maximize the effectiveness of our safety regulatory authority over automobiles, aviation, rail, trucks, motorcoaches, pipelines, and hazardous materials and seek to extend our regulatory authority to rail transit. We will direct our resources to the highest safety risks, bring program reforms to our safety mission, and seek the enactment of robust, six-year surface transportation reauthorization legisla-tion. Although we have made progress in reducing transportation-related fatalities and injuries as shown in Figure 1, significant challenges remain. We will address these challenges through cross-modal strategies as well as through strategies targeted toward specific, modal safety risks.
CROSS-MODAL STRATEGIES—THE DOT SAFETY COUNCIL Secretary LaHood and Deputy Secretary Porcari have created the DOT Safety Council to leverage DOT’s
well established safety expertise and core competen-cies in addressing cross-modal safety challenges. The Council will:
Intensify the national dialogue on improved safety performance with our government partners, safety advocates, industry leaders, the disability and older adult communities, and other stakeholders;
Create a Safety Culture Action Team to make DOT a leader in safe workplace practices, and foster an inde-pendent safety culture within DOT’s safety regulatory agencies;
Fat
alit
ies Fatalities
Inju
ries
Injuries
FIGURE 1. TRANSPORTATION-RELATED FATALITIES AND INJURIES
Source: U.S. Department of Transportation, Research and Innovative Technology Administration, Bureau of Transportation Statistics, National Transportation Statistics, 2011.
60,000
50,000
40,000
30,000
20,000
10,000
0
4,000,000
3,500,000
3,000,000
2,500,000
2,000,000
1,500,000
1,000,000
500,000
0
19901992
19941996
20002002
20042006
20082010
1998
10 U.S. DEPARTMENT OF TRANSPORTATION | STRATEGIC PLAN FOR FISCAL YEARS 2012–16
Provide leadership in anticipating new cross-modal and intermodal safety issues, and in advocating research, technology, systems designs, public educa-tion, and outreach to reduce risky behaviors;
Use comparative analysis for States and localities to predict and target safety risks across the transporta-tion system, and to evaluate safety improvements;
Expand and promote the Safetydata.gov web site to make safety data accessible across all Federal safety agencies, bring better access to data and create new opportunities for analysis and new applications of analyses;
Direct and coordinate policy on cyber security issues that could harm transportation safety such as spoof-ing or jamming safety critical devices such as GPS;
Standardize terminology and reporting formats to facilitate cross-modal data collection, comparison, and analysis with priority given to transportation-related injury data; and
Provide a forum for modal organizations to coor-dinate their responses to cross-modal safety issues brought forward by the National Transportation Safety Board (NTSB), industry, public advocacy groups, and other organizations.
STRATEGIES FOR REDUCING MOTOR VEHICLE FATALITIES AND INJURIES Motor vehicle travel has the highest fatality and injury rates per capita of all modes, accounting for nearly 95 percent of transportation-related fatalities and drain-ing more than $230 billion from the economy each year.2 In 2010, roadway fatalities and injuries fell to their lowest rates ever—and to their lowest numbers since 1949. Nevertheless, 32,885 people lost their lives in motor vehicle crashes. This record-breaking decline occurred even as Americans drove nearly 3 trillion miles, and it is the result of three important factors:
Cars are safer—as crash avoidance and crash worthi-ness technologies continue to improve;
2 National Highway Traffic Safety Administration’s Fatality Analysis Reporting System.
Roads are safer—with safer intersections, better signs and lighting, improved pavement technolo-gies, and more effective crash barriers; and
Drivers are safer—buckling their seatbelts at record rates and choosing not to get behind the wheel after drinking.
High visibility enforcement campaigns like “Click It or Ticket” to increase seat belt use and “Drive Sober or Get Pulled Over” also contribute to the decline. However, with an economic recovery, there will be more vehicles on the road and fatalities and injuries are likely to increase.
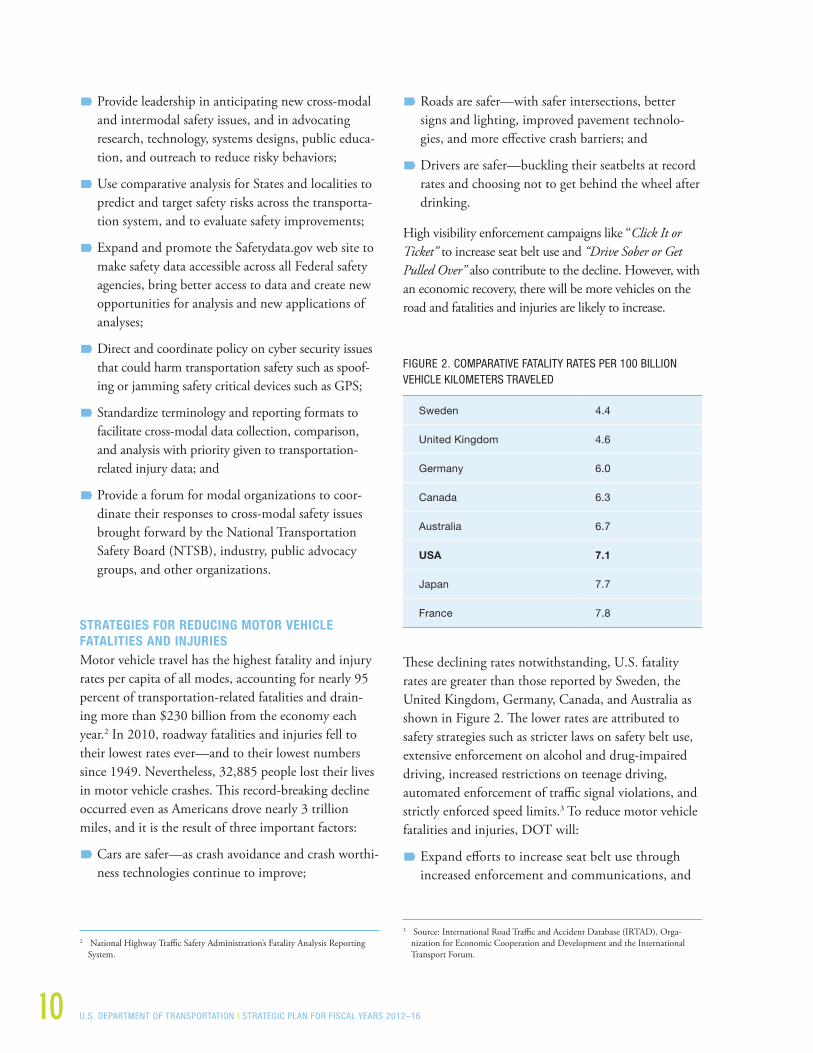
FIGURE 2. COMPARATIVE FATALITY RATES PER 100 BILLION VEHICLE KILOMETERS TRAVELED
Sweden 4.4
United Kingdom 4.6
Germany 6.0
Canada 6.3
Australia 6.7
USA 7.1
Japan 7.7
France 7.8
These declining rates notwithstanding, U.S. fatality rates are greater than those reported by Sweden, the United Kingdom, Germany, Canada, and Australia as shown in Figure 2. The lower rates are attributed to safety strategies such as stricter laws on safety belt use, extensive enforcement on alcohol and drug-impaired driving, increased restrictions on teenage driving, automated enforcement of traffic signal violations, and strictly enforced speed limits.3 To reduce motor vehicle fatalities and injuries, DOT will:
Expand efforts to increase seat belt use through increased enforcement and communications, and
3 Source: International Road Traffic and Accident Database (IRTAD), Orga-nization for Economic Cooperation and Development and the International Transport Forum.
U.S. DEPARTMENT OF TRANSPORTATION | STRATEGIC PLAN FOR FISCAL YEARS 2012–16 11
propose a requirement for lap/shoulder seat belts for motorcoaches;
Reinforce partnerships with Federal agencies, States, localities, and tribal governments to address prob-lems associated with alcohol-impaired driving which claimed an estimated 10,228 lives in 2010, and explore the policy challenges and benefits associated with widespread use of in-vehicle technologies to prevent alcohol-impaired driving;4
Improve the safety of roadway infrastructure through system-wide implementation of proven countermeasures, professional capacity enhance-ments, traffic calming measures (such as round-abouts), improvements in State Strategic Highway Safety Plans (SHSP), and upgrades in State and local data systems that contribute to performance-based investment decisions and grant allocations;
Encourage the deployment of advanced crash avoidance technologies such as Electronic Stability Control and Forward Collision and Lane Departure Warning Systems by establishing minimum vehicle performance standards and uniform, system-wide
4 In 2008, a 5 year cooperative research agreement, titled “DADSS” (Driver Alcohol Detection System for Safety), was entered into with the Automotive Coalition for Traffic Safety (ACTS) to investigate and develop alcohol detection technologies that are non-invasive, reliable, accurate and precise that would prevent impaired drivers above the legal limit (.08+) from operating their vehicle.
implementation of countermeasures to address roadway departure, intersections, pedestrians, and speed management;
Evaluate the safety risks and benefits of all new vehicles, technologies, and products as they enter the market-place; and
Conduct vehicle-to-vehicle (V2V) and vehicle-to-infrastructure (V2I) research on technologies that enable vehicles to communicate with each other to avoid collisions.
DISTRACTED DRIVING
In an era of smart phones, navigational systems, and other mobile devices, distracted driving has become a serious safety issue and a top priority for DOT. During 2010, there were 3,092 distraction-related fatalities and over 9 percent of fatal crashes in that year involved distracted driving.
The Obama Administration has launched a comprehen-sive effort to combat this deadly epidemic. On October 1, 2009, President Obama issued Executive Order 13513, “Federal Leadership on Reducing Text Messaging While Driving,” that prohibits Federal employees from texting while driving on government business, and from using government-issued electronics while driving their private cars on official government business. In both 2009 and 2010, DOT held national distracted driving summits that brought together law enforcement, indus-try representatives, researchers, legislators, and victims to highlight public outreach, best practices in enforcement, research, and technology.
As a result of these summits, DOT has banned com-mercial truck and bus drivers from text messaging and using hand-held mobile phones on the job, provided State governments with sample legislation outlawing texting while driving, and conducted pilot programs in Hartford, Connecticut and Syracuse, New York to deter-mine which strategies are most effective in combating distracted driving. After a year of research, DOT found that a combination of tough State laws, strong enforce-ment and ongoing public awareness are most effective in saving lives. DOT’s central strategies for addressing distracted driving are to:
Distracted driving is a deadly epidemic .
Look at the facts . During 2010, distracted
driving-related crashes caused over
3,000 deaths and half-a-million injuries,
each of them completely avoidable .
The victims aren’t just statistics .
They’re parents who lost children .
They’re children who lost parents .
TRANSPORTATION SECRETARY RAY LAHOOD
12 U.S. DEPARTMENT OF TRANSPORTATION | STRATEGIC PLAN FOR FISCAL YEARS 2012–16
Ban text messaging and restrict the use of cell phones by truck and interstate bus operators while operating vehicles; and
Disqualify school bus drivers from maintaining their commercial driver’s licenses when convicted of violating State traffic laws concerning texting or using hand-held mobile phones while driving.
SAFETY STRATEGIES FOR ALL ROAD USERS
Traditional roadway safety has focused on maintaining automobile speeds and throughput while relying on auto-mobile technology, roadway design, and physical barriers between cars to improve safety. While we have achieved many safety gains through these approaches, we have also created many roadways, especially in populated areas, which fail to provide adequate safety for pedestrians of all ages, bicyclists, and people with disabilities.
In 2010, over 4,200 pedestrians were killed and 70,000 pedestrians were injured in traffic crashes. On average, a pedestrian was killed every two hours and injured in traffic crashes every nine minutes. In addition, in 2010, 618 bicyclists were killed and an additional 51,000 were injured in motor vehicle traffic crashes. Bicyclist deaths accounted for two percent of all motor vehicle traffic fatalities, and two percent of the people injured in traffic crashes during the year.5
Roadways that are designed to accommodate pedestrians of all ages, cyclists, people boarding and alighting from transit vehicles, and people with disabilities safely—complete streets—can reduce fatalities and injuries. An FHWA safety review found that designing streets with these users in mind—sidewalks, raised medians, turning access controls, better bus stop placement, better light-ing, traffic calming measures, accessible sidewalks, curb cut outs, accessible signage for sensory and cognitive disabilities, and other advances for travelers with disabili-ties—improves pedestrian, bicyclist, and motorist safety.6
5 National Highway Traffic Safety Administration, National Center for Statistics and Analyses. FARS and GES Databases, 2009.
6 B.J. Campbell, Charles V. Zegeer, Herman H. Huang, and Michael J. Cynecki. A Review of Pedestrian Safety Research in the United States and Abroad Jan. 2004, Federal Highway Administration, Publication number FHWA-RD-03-042.
Instituting policies that accommodate all roadway users ensures that every transportation project becomes a com-prehensive safety project. These policies have the added benefit of making walking and biking more attractive options, and of enhancing the aesthetic quality and com-mercial activity on local streets. To reduce pedestrian and bicyclist fatalities and injuries, DOT will:
Encourage State DOTs to adopt policies and pro-grams that improve pedestrian, transit rider, and bicyclist safety. These policies include safe routes to schools, walking school buses,7 pedestrian crossing medians, sidewalks, walkable road shoulders, round-abouts, and bike lanes;
Work with State, local, and tribal governments to provide more technical assistance such as the application of pedestrian and bicycle safety audits to ensure that transportation systems are designed for optimum safety for all users;
Develop training programs for motorists, children, pedestrians and bicyclists and promote the use of these programs in schools and other venues;
Work with stakeholders to increase accessible side-walks, curb cut outs and signage, to increase safety for people with disabilities, older adults, novice drivers, and young children in strollers;
Distribute community-oriented material, including material in multiple languages, culturally competent and accessible formats for people with disabilities, that offers technical guidance on improving pedes-trian and bicycle safety and engineering, outreach and enforcement activities;
Propose adoption of global technical regulations on pedestrian safety to reduce injuries to pedestrians in light vehicle crashes by promoting improvements in vehicle design and in management of vehicle speeds;
Collaborate with the Department of Justice, and with State and local law enforcement agencies to promote the adoption of integrated law enforcement and traffic safety strategies based on geographic analysis of crime and traffic safety data; and
7 A walking school bus is a group of children walking to school with one or more adults.
U.S. DEPARTMENT OF TRANSPORTATION | STRATEGIC PLAN FOR FISCAL YEARS 2012–16 13
Provide national leadership on comprehensive, data-driven and evidence-based emergency medical services and Next Generation 911 systems.
SAFETY ON RURAL ROADS
Although 23 percent of the U.S. population lived in rural areas in 2009, rural fatal crashes accounted for 56 percent of all traffic fatalities that same year. To improve rural road safety, DOT will:
Encourage State and local agencies to adopt data-driven, comprehensive safety strategies and col-laborate with stakeholders such as the Federal land management agencies, local, and tribal governments to improve safety levels; and
Provide national leadership in delivering safety pro-grams and products to tribal communities, gateway communities, and local governments.
MOTORCYCLE SAFETY
There were 4,502 motorcycle fatalities in 2010 com-pared with 4,462 in 2009—80 percent higher than a decade ago. Since the late 1990s, State repeals of universal helmet laws have curbed efforts to reduce the motorcyclist fatality rate offsetting gains in the reduc-tion of overall highway fatalities by other groups.8 In 2010, only 54 percent of motorcyclists nationwide were wearing motorcycle helmets. This represents a significant decline in helmet use from 2009, where 67 percent of motorcyclists were helmeted.9 However, if all motorcyclists were to wear helmets, an estimated 800 lives could be saved each year. DOT endorses efforts requiring riders to wear DOT-certified motorcycle helmets on every trip. To improve motorcycle safety, DOT will:
Develop a set of voluntary national education standards for entry-level motorcycle rider training programs to promote more comprehensive and consistent programs nationwide, and best practices for States in implementing these programs. The
8 Twenty States and the District of Columbia have motorcycle helmet laws that require all riders to wear helmets.
9 2010 National Occupant Protection Use Survey, NHTSA National Center for Statistics and Analysis.
standards will establish baseline content that all entry-level riders should be taught, including pre-ride skills, vehicle-control skills, street strategies and roadway management, and skills for group riding.
Evaluate the benefits of increased enforcement (e.g., motorcycle impoundment) and raising the number of licensed motorcyclists because unlicensed motor-cyclists are overrepresented in crashes;
Clarify motorcycle helmet labeling requirements, and address the problem of certification of non-compliant helmets; and
Work with States to implement new programs to reduce alcohol impairment levels among motorcy-clists, and explore new technologies that could make motorcycles safer to operate.
COMMERCIAL MOTOR VEHICLE SAFETY
In 2009, commercial motor vehicles (CMV), large trucks and buses, represented 4.7 percent (11.8 mil-lion) of all registered vehicles (254.2 million). Further, large trucks and buses accounted for 10.2 percent of total Vehicle Miles Traveled (VMT) on the Nation’s roadways. In 2010, about 12 percent (3,944) of all motor vehicle fatalities in the U.S. involved crashes with CMVs.

14 U.S. DEPARTMENT OF TRANSPORTATION | STRATEGIC PLAN FOR FISCAL YEARS 2012–16
Since 2000, the fatality rate for CMVs has fallen from 0.205 fatalities per 100 million VMT to a projected rate of 0.131 in 2010. The number of fatalities involv-ing a CMV increased in 2010 to 3,944 fatalities or nine percent higher than 2009’s best ever performance of 3,619 fatalities. The number of fatalities involv-ing CMVs through the first three quarters of 2011 is slightly better than the number of fatalities reported in the same period during the record setting year of 2009. DOT attributes some portion of this improvement over 2010 to the steady implementation of its Compli-ance, Safety, Accountability (CSA) enforcement model which is modernizing the effectiveness and efficiency of enforcement activities through early contact with a greater number of motor carriers. Targeted enforce-ment interventions, increased oversight of Commercial Driver’s License programs, safety audits, and inspec-tions of motor carriers and operators have contributed to reducing the fatality rate. The primary challenge in continuing to improve truck and bus safety is to make certain that a safety culture exists across the industry. To improve motor vehicle safety, DOT will:
Implement a three-pronged strategy that raises the bar to enter the motor carrier industry, requires car-riers to maintain high safety standards to remain in the industry, and removes high-risk carriers, drivers, and service providers from operation;
Promote safe operations and best practices through partnerships and education; improving operator medical qualifications, credentialing, and licens-ing systems; and improving safety information, research, and analysis to advance innovation, techni-cal solutions, and operational effectiveness;
Complete a rulemaking that would require new motorcoaches (buses in intercity service) to have lap-shoulder belts to help prevent driver and pas-senger ejections during a collision; and
Continue to test two stability systems that address truck tractor rollover and loss of control.
STRATEGIES TO REDUCE FATALITIES AND INJURIES IN AVIATION While past DOT efforts have brought commercial aviation fatalities to historic lows, a shift in thinking will be necessary to drive safety improvements in the future. Looking forward, it will be essential to view aviation as a system of interacting elements, and to bring together all aviation stakeholders to achieve additional improvements.
Several government and industry initiatives are underway to shift from forensic, accident-based safety analysis with targeted mitigations to a more robust, integrated safety data/information driven environment with systematic safety solutions. The successes of these initiatives are vital to implement Safety Management Systems (SMS) in the aviation sector.
In 2010, large air carriers had no fatalities during pas-senger operations and two fatalities during cargo opera-tions, when two pilots were killed in an accident that occurred in Dubai. Part 13510 operations may be broken into two categories: unscheduled or on-demand air taxi operations, and scheduled commuter operations. The on-demand air taxi operators suffered 17 fatalities, the same as in 2009, but well below the preceding two years. Scheduled Part 135 commuters had no fatalities for the fourth consecutive year. General aviation sustained its long-term improvement with the number of fatal accidents and fatalities going down 25 percent over the past 10 years.
FAA’s aviation safety strategy is based on working with domestic and international stakeholders, including carri-ers, to stimulate cooperation for, and protections of, the open reporting of safety concerns. In its safety oversight capacity, FAA is working with stakeholders to incorpo-rate SMS principles throughout their operations.
DOT will continue to develop and deploy technolo-gies to utilize U.S. airspace in safer, more efficient, and
10 The Federal Aviation Regulations, or FARs, are rules prescribed by the Federal Aviation Administration (FAA) governing all aviation activities in the U.S. The FARs are part of Title 14 of the Code of Federal Regulations (CFR). The FARs are organized into sections, called parts due to their organization within the CFR. Each part deals with a specific type of activity. Part 135 Operating Requirements refers to Commuter and On Demand Operations and Rules Governing Persons on Board Such Aircraft.

U.S. DEPARTMENT OF TRANSPORTATION | STRATEGIC PLAN FOR FISCAL YEARS 2012–16 15
more environmentally sound ways via NextGen.11 To accelerate the adoption of NextGen, DOT will:
Leverage optimum use of existing aircraft naviga-tion and communication capabilities, and accom-modate new aircraft capabilities through improved airport, terminal and en-route operations, and flight information services so there is no degradation of safety as NextGen technologies and operations are introduced;
Modernize the criteria related to commercial pilot qualification, training, testing, and hiring practices for airlines, including those providing regional service;
Implement those aspects of NTSB recommenda-tions, or equivalent technological advances, that reduce the risk of runway incursions and improve airport safety;
Work to develop competent civil aviation authori-ties worldwide to meet international safety oversight standards; and
Continue vital partnership initiatives with key avia-tion stakeholders to encourage the implementation of voluntary safety reporting programs in a pro-tected environment.12
STRATEGIES TO REDUCE RAILROAD FATALITIES AND INJURIES This decade has been the safest ever for the railroad indus-try. The number of rail-related accidents and incidents declined 33 percent from 16,919 in 2000 to 11,317 in 2010. During this period, the number of train accidents decreased by 37 percent—from 2,983 to 1,868 accidents. Injuries decreased by 29 percent—from 12,580 to 8,906, and highway-rail grade crossing incidents decreased by 43 percent—from 3,502 to 2,013. The accident and incident rate fell from 23.41 per million train-miles in 2000 to 16.45 in 2010 a decline of almost 30 percent.
Safety levels have improved because of a strengthened inspector force, broadened regulatory and enforcement
11 NextGen is a transformation of the National Airspace System (NAS), including our national system of airports, using 21st century technologies to ensure future safety, capacity and environmental needs are met.
12 These programs include the Air Safety Action Program, the Flight Operations Quality Assurance, and Line Operation Safety Audit.
efforts, and initiatives implemented under both the “Secretary’s Action Plan for Highway-Rail Grade Crossing Safety and Trespasser Prevention” and the “National Rail Safety Action Plan.” In addition, DOT concentrated on reducing the two most important causes of train accidents—human error and track flaws. To promote further increases in rail safety, DOT will:
Work with the freight and passenger railroads to implement positive train control (PTC), a system of monitoring and controlling train movements that has safety benefits for all rail operations;
Oversee implementation of regulations to discour-age distraction while operating trains, and work with the Railroad Safety Advisory Committee to develop recommendations for additional preventive measures in conjunction with the comprehensive effort to combat distracted driving across all modes;
Work with railroad, labor and other stakeholders to establish risk reduction programs on Amtrak, commuter railroads, and major freight railroads. These programs will target operations, equipment, and systems that pose safety risks, and will estab-lish projects designed to identify and manage risks before accidents occur. They will include root cause analysis of accidents and incidents, identifying alternative technologies, procedures, or practices that might be more effective than existing regula-tions alone to address root causes; and evaluating project outcomes. Successful pilot projects could
16 U.S. DEPARTMENT OF TRANSPORTATION | STRATEGIC PLAN FOR FISCAL YEARS 2012–16
be developed into nationwide non-regulatory safety improvement programs;
Ensure that each Class I railroad and Amtrak are inspected at least once every two years, and require safety inspectors to conduct inspections outside of normal working hours because freight and passen-ger railroads operate around the clock. Railroads must expect an inspection at any time during the course of their operations including second and third shifts.
Of major concern are the approximately 216,000 public and private at-grade railroad-highway crossings where about 250 fatalities occur each year. To improve safety at these crossings, DOT will:
Assist in grade crossing safety improvements (including closing grade crossings), encourage enforcement of traffic laws, and promote technolo-gies designed to improve safety such as intercon-nection and preemption of nearby highway traffic control signals, provision of standby backup power for these interconnected traffic signals, and use of pre-signals or queue-cutter signals;
Ensure that corridor plans for high-speed and inter-city passenger rail operations address grade crossing safety; and
Support the non-profit organization Operation Lifesaver’s public education programs to prevent collisions, injuries, and fatalities on and around tracks and at-grade railroad-highway crossings.
STRATEGIES TO REDUCE TRANSIT FATALITIES AND INJURIESTransit, which currently provides nearly 33 million passenger trips each working day, is one of the safest modes of travel. In 2010, 366 fatalities were associated with all modes of transit.13 However, several recent transit accidents have brought to light deep concerns about the safety systems at some of our Nation’s largest transit agencies. The challenge confronting the transit sector is how to improve on the current transit safety
13 Transit modes include buses, ferry boats, commuter rail, and closed, fixed guide-way systems for rail and bus rapid transit.
record as the number of people using transit increases and as existing systems age.
Until recently, America’s passenger rail and rail transit systems operated under two different Federal safety regimes. The Federal Railroad Administration (FRA) oversaw the safety of commuter rail and Amtrak. Indi-vidual State oversight agencies14 handled urban heavy rail (subway) and light rail (streetcar) safety. However, the Federal Transit Administration (FTA) funds com-muter rail, heavy rail and light rail creating a confusing patchwork of regulatory and funding requirements.
Through the enactment of a new transportation autho-rization, MAP-21, FTA has been granted significant new authority to strengthen public transportation safety. This is the culmination of a concerted effort that began in December 2009 when Secretary LaHood formally transmitted to Congress President Obama’s legislative proposal to establish and enforce minimum federal safety standards for rail transit systems. MAP-21 includes many of the new authorities included in the Administration’s original proposal and includes important safety provisions for bus-only operators. As we embark on implementing this new program, DOT will seek to:
Implement new authorities for safety oversight of transit rail systems established by the transporta-tion authorization law, MAP-21;
Create policies and programs that assist the transit industry in improving the condition of safety-critical transit assets, and in increasing industry focus on safety vulnerabilities through safety management systems;
Build partnerships with industry associations to develop recommended practices and industry safety standards;
Provide technical assistance and training to help the transit industry understand and implement innovative safety strategies, and
Advance research to develop materials and technology, in areas such as crash energy management, fire safety of transit materials, right-of-way intrusion detection, and
14 Under Federal Transit Administration 49 CFR Part 659 requirements.
U.S. DEPARTMENT OF TRANSPORTATION | STRATEGIC PLAN FOR FISCAL YEARS 2012–16 17
track worker safety, to reduce transit fatalities and the number and severity of transit-related injuries.
STRATEGIES TO REDUCE FATALITIES AND INJURIES IN HAZARDOUS MATERIALS TRANSPORTATION Hazmat transportation fatalities across all modes of transportation occur at the rate of one for every 21 billion ton-miles moved—an average of 13 fatalities per year over the past 10 years (2001–2010). During this period there were 94 hazmat incidents with one or more fatalities. At least three-fourths of these involved a truck rollover or crash. Some of the most serious risks from hazardous materials are low-probability high-consequence accidents. Key targeted areas of risk include fire aboard aircraft, release of bulk quantities of materials that are toxic-by-inhalation, and tank truck rollovers. To increase hazmat safety, DOT will:
Enhance the review of applicants for special permits and approvals to ensure they are fit to perform the required functions and they adhere to the provisions of their permit or approval;
Develop uniform standards for training hazmat inspectors and investigators;
Expand the enforcement and outreach programs to monitor and improve compliance with Hazardous Materials Regulations;
Enhance the capability of the hazmat safety pro-gram to obtain a better understanding of the root causes of incidents involving hazmat;
Develop a risk management framework and improve hazmat data collection (incident, inspec-tion, and investigation) to integrate data and target use of resources to manage the most serious risks;
Collaborate with Federal and State government agencies and the international community to ensure that the rules for the commercial transport of hazardous materi-als are uniform across modes and consistent with risk;
Advance research to develop technologies and procedures to better secure hazardous materials shipments and assess the risks of hazmat events; and
Continue to build the capabilities of local emergency responders through Hazardous Materials Emergency Preparedness grants and take steps internally to improve administration of the grant program.
STRATEGIES TO REDUCE PIPELINE FATALITIES AND INJURIES Pipelines carry two-thirds of the Nation’s energy sup-plies and over the past 20 years, pipeline incidents involving fatalities or major injuries have declined by 50 percent. Improvements in risk management—such as integrity management programs for each pipe-line system and damage prevention programs in the States—have markedly reduced accidents from cor-rosion and excavation damage. Advances in pipeline materials and technology have reduced the risks from material failure. Nevertheless, pipelines continue to present low-probability, high-consequence risks to people and the environment. In 2010 and 2011 for example, a number of high consequence pipeline incidents traumatized communities in Allentown, Pennsylvania; Philadelphia, Pennsylvania; San Bruno, California; and Marshall, Michigan. Most fatal inci-dents occurred on gas distribution systems. To address pipeline safety issues, DOT will:
Extend its pipeline integrity management program which includes rulemaking, workshops, and guid-ance for Federal and State inspectors, to gas distri-bution pipeline systems where 80 percent of the most serious safety incidents occur;
Use outreach and inspection programs to encourage all gas and liquid pipeline companies to focus on safety beyond compliance with minimum standards, with particular attention to developing strong safety cultures;
Through periodic meetings, program evaluations, and performance tracking, work with State pipeline safety programs to accelerate the identification, repair, rehabilitation, requalification, or replacement of the highest risk pipelines;

18 U.S. DEPARTMENT OF TRANSPORTATION | STRATEGIC PLAN FOR FISCAL YEARS 2012–16
Enhance “811—Call Before You Dig” through public awareness campaigns, proclamations by Governors, and support of State and local damage prevention efforts to reduce pipeline damage from excavation;
Strengthen the national pipeline safety program by identifying and reducing inconsistencies between Federal and State safety programs, and by bringing together all stakeholders to create a more coherent approach to pipeline safety. This effort will include periodic meetings with State program managers to discuss inconsistencies and meetings with State legal offices to discuss enforcement and inspection issues;
Develop and implement data systems to ensure that all pipelines are inspected and that pipelines that pose the most serious risks are subject to increas-ingly detailed inspections;
Expand data collection and analysis to evaluate the risks from pipelines, improve the transparency of data, and make the findings publicly available to increase public awareness of pipeline safety issues;
Investigate new technologies for improving the assess-ment, detection and control of pipeline risks; and
Minimize the human and environmental effects of accidents when they occur by improving leak detec-tion; increasing use of excess flow valves, remote control valves, and automatic shutoff valves; and
strengthening the capabilities of local emergency response through studies and workshops to inform risk-based inspections.
STRATEGIES TO REDUCE FATALITIES AND INJURIES FROM ILLEGAL DRUG USE AND ALCOHOL MISUSE For more than two decades, DOT has been the world’s leader in regulated drug and alcohol testing and our program is the largest of its kind world-wide. Our mis-sion is to ensure the safety and security of the traveling public, and this includes requiring drug and alcohol testing of specific transportation industry employees. The DOT Agencies that require drug and alcohol test-ing in their respective industries15 work together with the Office of the Secretary to ensure that the regulations and enforcement efforts are carried out consistently. They share information to ensure that they are maxi-mizing program effectiveness. The Office of the Secre-tary works closely with the NHTSA on research issues related to drunk and drugged driving to advance policy and regulatory matters. The Office of the Secretary also works closely with the Office of National Drug Control Policy, the Department of Justice and other Federal partners to ensure that our regulations and policy are efficient and effective in reducing both supply and demand issues. DOT has maintained an internal venue for sharing experience, expertise and best practices directed toward reducing illegal drug use and alcohol misuse in the transportation industries covering more than eight million safety-sensitive employees in the U.S. To continue this work, DOT will:
Collaborate internally and with the U.S. Coast Guard to conduct inspections, carry out enforce-ment, and improve regulations, policies, and educa-tion to detect and deter illicit drug use and alcohol misuse with respect to safety-sensitive transportation industry employees, including pilots, truck drivers, school bus drivers, subway operators, ship captains, pipeline controllers, airline mechanics, flight atten-dants, locomotive engineers, public bus drivers, and armed security personnel.
Ensure that DOT regulations are applied uniformly
15 FAA, FMCSA, FRA, FTA, PHMSA, and U.S. Coast Guard, now in the Depart-ment of Homeland Security.
U.S. DEPARTMENT OF TRANSPORTATION | STRATEGIC PLAN FOR FISCAL YEARS 2012–16 19
across the modes to reduce the risks of fatalities and injuries; and
Work through high-level meetings and close coor-dination with the Office of National Drug Control Policy, the Department of Justice and other Federal partners to ensure that our regulations and policies are efficient and effective in both drug interdiction work and reducing the demand for illegal drugs through prevention, education, and rehabilitation.
SUPPORT FOR DEFENSE MOBILITY AND EMERGENCY PREPAREDNESS DOT supports the missions of the Departments of Homeland Security (DHS) and Defense (DOD) that prepare for and respond to emergencies by ensuring the availability of transportation services after natural disas-ters and in times of national emergency. The Secretary of Transportation has responsibility for a number of modal emergency preparedness programs, authorized by the Defense Production Act of 1950 and other legislation, that provide the DOD and civilian agencies with assured access to commercial transportation in times of national emergency.
One such program is the operational management of government-owned sealift platforms (the Maritime Administration’s (MARAD) Ready Reserve Force) that provide a valuable service to the Nation by maintaining strategic sealift readiness and by efficiently executing their responsibilities when needed. These assets are maintained to meet strict DOD readiness timelines by leveraging the expertise of commercial ship manage-ment companies and civilian operating crews.
DOT also proactively supports the transportation mis-sion of the DHS which is to improve the resilience and security of the domestic and intermodal transportation sectors including air cargo, passenger aviation, rail, tran-sit, highway, maritime, and pipeline modes.16 DOT also supports the DHS mission to strengthen the transporta-tion network and effectively mitigate risk through an integrated systems approach and by using risk manage-ment analyses that strengthen the security and vitality
16 Quadrennial Homeland Security Review Report: A Strategic Framework for a Secure Homeland. U.S. Department of Homeland Security. February 2010.
of commercial aviation. DOT’s defense mobility and emergency preparedness strategies are described in the Organizational Excellence chapter of this Strategic Plan.
RESOURCESThe human resources, programs, capital assets, infor-mation technology and other resources described in DOT’s Annual Performance Budgets are designed to achieve our outcomes for improving safety throughout the transportation system. The schedule for execut-ing our safety strategies extends from fiscal year 2012 through fiscal year 2016.
20 U.S. DEPARTMENT OF TRANSPORTATION | STRATEGIC PLAN FOR FISCAL YEARS 2012–16
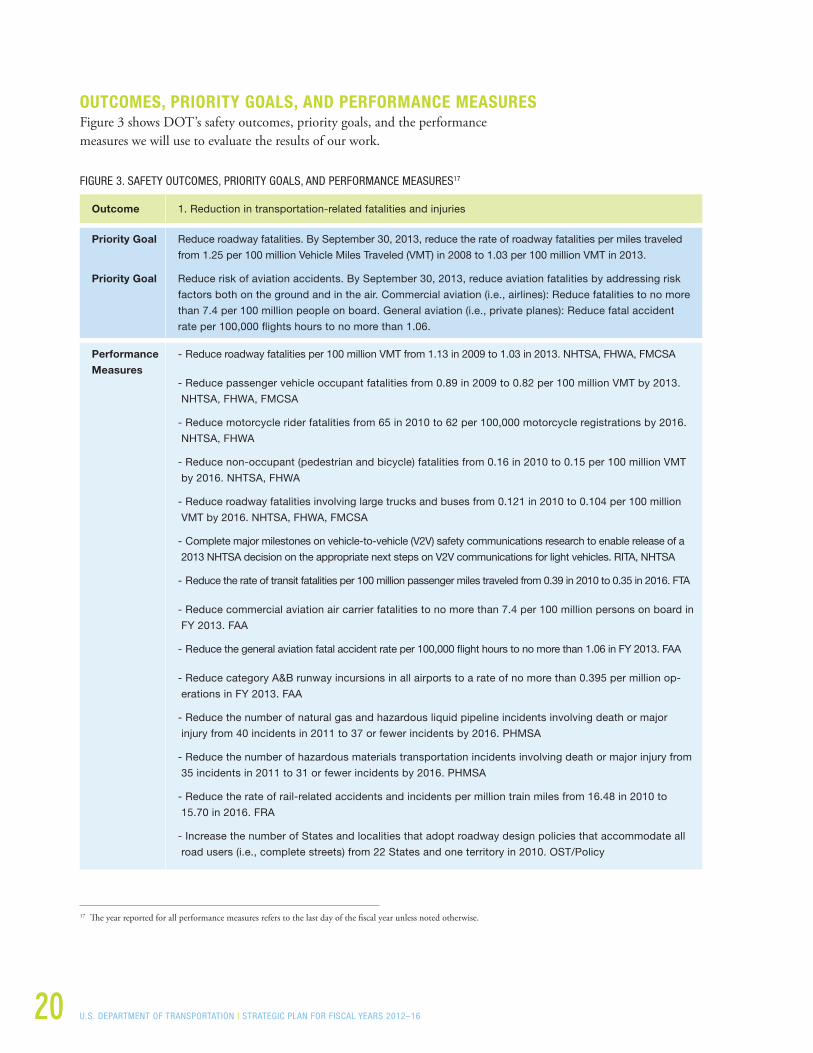
OUTCOMES, PRIORITY GOALS, AND PERFORMANCE MEASURES Figure 3 shows DOT’s safety outcomes, priority goals, and the performance measures we will use to evaluate the results of our work.
FIGURE 3. SAFETY OUTCOMES, PRIORITY GOALS, AND PERFORMANCE MEASURES17
Outcome 1. Reduction in transportation-related fatalities and injuries
Priority Goal Reduce roadway fatalities. By September 30, 2013, reduce the rate of roadway fatalities per miles traveled
from 1.25 per 100 million Vehicle Miles Traveled (VMT) in 2008 to 1.03 per 100 million VMT in 2013.
Priority Goal Reduce risk of aviation accidents. By September 30, 2013, reduce aviation fatalities by addressing risk
factors both on the ground and in the air. Commercial aviation (i.e., airlines): Reduce fatalities to no more
than 7.4 per 100 million people on board. General aviation (i.e., private planes): Reduce fatal accident
rate per 100,000 flights hours to no more than 1.06.
Performance
Measures
- Reduce roadway fatalities per 100 million VMT from 1.13 in 2009 to 1.03 in 2013. NHTSA, FHWA, FMCSA
- Reduce passenger vehicle occupant fatalities from 0.89 in 2009 to 0.82 per 100 million VMT by 2013.
NHTSA, FHWA, FMCSA
- Reduce motorcycle rider fatalities from 65 in 2010 to 62 per 100,000 motorcycle registrations by 2016.
NHTSA, FHWA
- Reduce non-occupant (pedestrian and bicycle) fatalities from 0.16 in 2010 to 0.15 per 100 million VMT
by 2016. NHTSA, FHWA
- Reduce roadway fatalities involving large trucks and buses from 0.121 in 2010 to 0.104 per 100 million
VMT by 2016. NHTSA, FHWA, FMCSA
- Complete major milestones on vehicle-to-vehicle (V2V) safety communications research to enable release of a
2013 NHTSA decision on the appropriate next steps on V2V communications for light vehicles. RITA, NHTSA
- Reduce the rate of transit fatalities per 100 million passenger miles traveled from 0.39 in 2010 to 0.35 in 2016. FTA
- Reduce commercial aviation air carrier fatalities to no more than 7.4 per 100 million persons on board in
FY 2013. FAA
- Reduce the general aviation fatal accident rate per 100,000 flight hours to no more than 1.06 in FY 2013. FAA
- Reduce category A&B runway incursions in all airports to a rate of no more than 0.395 per million op-
erations in FY 2013. FAA
- Reduce the number of natural gas and hazardous liquid pipeline incidents involving death or major
injury from 40 incidents in 2011 to 37 or fewer incidents by 2016. PHMSA
- Reduce the number of hazardous materials transportation incidents involving death or major injury from
35 incidents in 2011 to 31 or fewer incidents by 2016. PHMSA
- Reduce the rate of rail-related accidents and incidents per million train miles from 16.48 in 2010 to
15.70 in 2016. FRA
- Increase the number of States and localities that adopt roadway design policies that accommodate all
road users (i.e., complete streets) from 22 States and one territory in 2010. OST/Policy
17 The year reported for all performance measures refers to the last day of the fiscal year unless noted otherwise.
U.S. DEPARTMENT OF TRANSPORTATION | STRATEGIC PLAN FOR FISCAL YEARS 2012–16 21
EXTERNAL RISK FACTORS The external risk factors that could play a part in DOT’s ability to achieve our safety goal include: lack of sustain-able funding for transportation programs; lack of statu-tory authority for transit safety; safety risk arising from economic expansion; and demographic trends which are likely to have a negative effect on roadway safety.
LACK OF SUSTAINABLE FUNDINGThe Government Accountability Office (GAO) reported18 that revenues to support the Highway Trust Fund are not keeping pace with spending levels. In addition, the excise tax revenues that fund the Airport and Airway Trust Fund have been lower than previ-ously forecasted in 2009 due to the economy. The Administration supports passage of a robust, six-year surface transportation reauthorization bill.
AS THE ECONOMY RECOVERS, SAFETY RISKS WILL INCREASE While recent roadway fatality and injury trends are encouraging, DOT does not expect them to continue at the same rate once the economy enters a period of expansion. With an economic rebound, the expectation is that discretionary driving will increase, which in turn may slow or even reverse fatality reductions. Discre-tionary and recreational travel is considered much riskier than travel for work and family obligations because it places motorists behind the wheel for longer periods of time, during all hours of the day and night, and often in unfamiliar driving locations. Similarly, in the rail industry economic expansion is likely to lead to increases in the number of train miles traveled that may lead to accidents.
18 Transportation Programs: Challenges Facing the Department of Transportation and Congress, GAO-09-435T March 10, 2009.
CHANGING DEMOGRAPHIC TRENDS WILL INCREASE SAFETY RISK Several demographic trends will affect roadway safety over the coming decade including: the increasing prevalence of older drivers with age-related medical conditions that impact safe driving; increasing obesity (affecting both injury risk as occupants and medical fitness to drive); and the increasing non-English speak-ing population who may have less exposure to safety messages.
22 U.S. DEPARTMENT OF TRANSPORTATION | STRATEGIC PLAN FOR FISCAL YEARS 2012–16
STATE OF GOOD REPAIR
U.S. DEPARTMENT OF TRANSPORTATION | STRATEGIC PLAN FOR FISCAL YEARS 2012–16 23
STRATEGIC GOALENSURE THE U .S . PROACTIVELY MAINTAINS CRITICAL TRANSPORTATION INFRASTRUCTURE IN A STATE OF GOOD REPAIR .
CHALLENGES AND STRATEGIESRecent reports on the condition of our highways, bridges, transit assets, airports, and passenger rail facilities reveal that many fall short of state of good repair, and as a result, they compromise the safety, capacity, and efficiency of the U.S. transportation network. As a Nation, we have not adequately maintained our major highway, transit, aviation and rail systems. At a time when transportation programs face unprecedented fiscal challenges, we believe that stewardship of transportation infrastructure rises to the level of a Federal strategic goal. DOT is committed to making state of good repair a top priority in its ongoing programmatic and legislative proposals.
DOT’s role in achieving state of good repair varies from mode to mode. DOT can influence the condi-tion of federally-funded highway, transit and airport infrastructure through program guidance and technical assistance provided to State DOTs, transit agencies, and airport authorities.
Similarly, DOT can influence the condition of railroad infrastructure, which is owned by private railroads, Amtrak, and certain transit agencies, via DOT’s Fed-eral Railroad Administration (FRA) safety regulations. For example, DOT’s “2008 National Rail Safety Action Plan” focuses on reducing the two leading causes of train accidents—human factors and track flaws—the
latter clearly related to a state of good repair. Addition-ally, significant new Federal investments in high-speed and intercity passenger rail programs necessitate main-tenance of nationally significant rail assets to ensure that they will provide safe, reliable service for future generations of rail travelers.
DOT can also influence the condition of pipeline infrastructure, which is owned and operated by private entities, via safety and environmental regula-tions. DOT’s Pipeline and Hazardous Materials Safety Administration (PHMSA) enforces standards for the design, construction, operations and maintenance of pipelines carrying natural gas or hazardous liquids.
The U.S. has 400 ports owned and operated by State and local governments, private corporations, or a combina-tion of those entities. Historically, DOT’s role in financ-ing port infrastructure has been limited. However, recent Federal investments in port infrastructure through TIGER (Transportation Investment Generating Economic Recovery) grants and America’s Marine Highway Program provide opportunities for DOT to incentivize improve-ments in operations, facilities, and equipment to make ports more efficient and productive.
DOT will work with Congress and stakeholders to find long-term, stable funding to help modernize an infrastructure that now receives a grade of “D” from
24 U.S. DEPARTMENT OF TRANSPORTATION | STRATEGIC PLAN FOR FISCAL YEARS 2012–16
the American Society of Civil Engineers. DOT will also work for passage of robust surface transportation reauthorization legislation with strong programmatic focus on state of good repair. Below, we describe the condition of our highways, bridges, transit assets, airport runways and Amtrak rail along with our strate-gies for achieving a state of good repair in this critical infrastructure.
STRATEGIES TO IMPROVE THE CONDITION OF HIGHWAYS Preserving the health of pavement on our Nation’s roadways, particularly on the National Highway System (NHS), is critical to the structural integrity, functionality, and cost effectiveness of the Nation’s transportation network.19 DOT’s Federal Highway Administration (FHWA) monitors the condition of pavement on the NHS to determine ride quality. The ride quality condition affects the wear-and-tear on vehicles, the comfort of travelers, fuel consump-tion, and traffic congestion. The percentage of VMT on NHS roads classified as having good ride quality increased from 46 percent in 2000 to 58 percent in 2010.20 To build on these accomplishments and bring our highways into a state of good repair, DOT will:
Develop and use a set of performance indicators, as set out in MAP-21, that focus on the NHS, the Strategic Highway Network, and other major arteri-als and intermodal connectors;
Provide national leadership to encourage greater use of asset management practices in State DOTs including training, workshops, peer exchanges, and technical assistance on topics such as improved highway design and construction procedures, innova-tive quality assurance practices, materials, tools and techniques that advance asset management principles;
19 The National Highway System Designation Act of 1995 (P.L.104-59) desig-nated the NHS, which includes the Interstate system, other principal arterials, the Strategic Highway Network, and major intermodal connectors. For more information, see http://www.fhwa.dot.gov/planning/nhs/index.html.
20 The most recent results reported for the pavement condition measure are at http://www.fhwa.dot.gov/policy/fhplan.html#measurement An International Roughness Index (IRI) of 95 inches per mile or less is necessary for a good rated ride. The IRI is a quantitative measure of the accumulated response of a quarter-car vehicle suspension experienced while traveling over pavement. For more details, see the Highway Performance Monitoring System at http://www.fhwa.dot.gov/ohim/hpmsmanl/appe.cfm#hpm.
Develop a national research agenda to identify opportunities to manage and preserve surface transportation infrastructure based on conclusions reached through consultation with private and public infrastructure experts;
Make improvements to critical aspects of highway system performance (safety, congestion, reliability, infrastructure condition, air quality, user satisfac-tion, and emergency response) by developing a comprehensive process to regularly document the condition of pavement and bridge infrastructure on the NHS, identify critical gaps that are jeopardizing the system, and direct resources toward improve-ments; and
Raise the awareness and understanding of the per-formance information available in the Highway Per-formance Monitoring System and National Bridge Inventory through a series of webinars, workshops and technical assistance for State DOTs. The goal of this effort is to convince our partner agencies to begin using a common performance reporting sys-tem that will inform resource allocation decisions.
As parts of our major roadway systems reach the end of their useful lives and must be replaced at significant cost, those portions in center cities that no longer serve central transportation goals and are capable of being decommissioned or downsized should be identified. In such instances, a wise public investment might be to reclaim the land for commercial and community use, particularly in economically distressed communities.
For example, after the Loma Prieta earthquake, San Francisco tore down the damaged Embarcadero Free-way rather than rebuild it, reuniting the waterfront and downtown and spurring new residential and commer-cial development. Similarly, Fort Worth relocated a portion of its interstate away from its downtown, and cities like Seattle, Phoenix, San Diego, and Hartford have capped their downtown interstates with decks in order to reclaim land for parks, museums, schools, and housing. To address these situations, DOT will:
Work with State and local partners to evaluate where transportation and community needs have changed over time and where decommissioning may be a better alternative than rebuilding.
U.S. DEPARTMENT OF TRANSPORTATION | STRATEGIC PLAN FOR FISCAL YEARS 2012–16 25
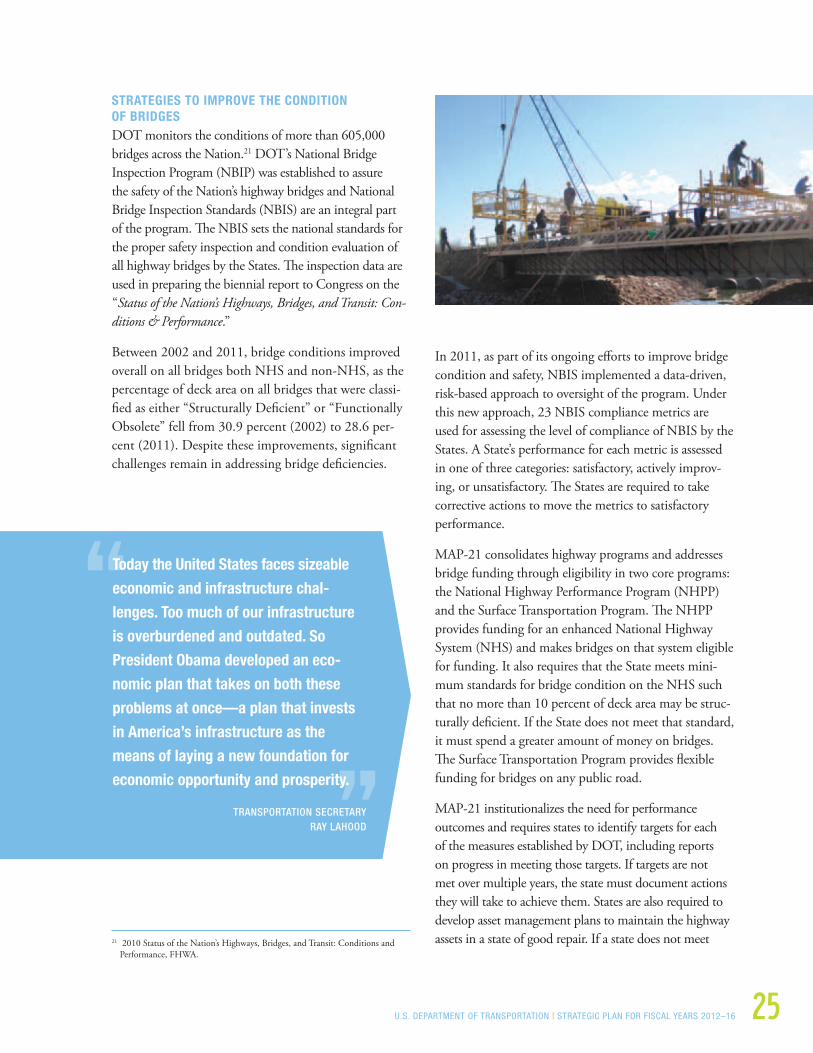
STRATEGIES TO IMPROVE THE CONDITION OF BRIDGESDOT monitors the conditions of more than 605,000 bridges across the Nation.21 DOT’s National Bridge Inspection Program (NBIP) was established to assure the safety of the Nation’s highway bridges and National Bridge Inspection Standards (NBIS) are an integral part of the program. The NBIS sets the national standards for the proper safety inspection and condition evaluation of all highway bridges by the States. The inspection data are used in preparing the biennial report to Congress on the “Status of the Nation’s Highways, Bridges, and Transit: Con-ditions & Performance.”
Between 2002 and 2011, bridge conditions improved overall on all bridges both NHS and non-NHS, as the percentage of deck area on all bridges that were classi-fied as either “Structurally Deficient” or “Functionally Obsolete” fell from 30.9 percent (2002) to 28.6 per-cent (2011). Despite these improvements, significant challenges remain in addressing bridge deficiencies.
21 2010 Status of the Nation’s Highways, Bridges, and Transit: Conditions and Performance, FHWA.
In 2011, as part of its ongoing efforts to improve bridge condition and safety, NBIS implemented a data-driven, risk-based approach to oversight of the program. Under this new approach, 23 NBIS compliance metrics are used for assessing the level of compliance of NBIS by the States. A State’s performance for each metric is assessed in one of three categories: satisfactory, actively improv-ing, or unsatisfactory. The States are required to take corrective actions to move the metrics to satisfactory performance.
MAP-21 consolidates highway programs and addresses bridge funding through eligibility in two core programs: the National Highway Performance Program (NHPP) and the Surface Transportation Program. The NHPP provides funding for an enhanced National Highway System (NHS) and makes bridges on that system eligible for funding. It also requires that the State meets mini-mum standards for bridge condition on the NHS such that no more than 10 percent of deck area may be struc-turally deficient. If the State does not meet that standard, it must spend a greater amount of money on bridges. The Surface Transportation Program provides flexible funding for bridges on any public road.
MAP-21 institutionalizes the need for performance outcomes and requires states to identify targets for each of the measures established by DOT, including reports on progress in meeting those targets. If targets are not met over multiple years, the state must document actions they will take to achieve them. States are also required to develop asset management plans to maintain the highway assets in a state of good repair. If a state does not meet
Today the United States faces sizeable
economic and infrastructure chal-
lenges . Too much of our infrastructure
is overburdened and outdated . So
President Obama developed an eco-
nomic plan that takes on both these
problems at once—a plan that invests
in America’s infrastructure as the
means of laying a new foundation for
economic opportunity and prosperity .
TRANSPORTATION SECRETARY RAY LAHOOD

26 U.S. DEPARTMENT OF TRANSPORTATION | STRATEGIC PLAN FOR FISCAL YEARS 2012–16
that standard, it must spend a greater amount of money on bridges. In addition to advancing sound asset manage-ment principles in bridge stewardship, our key strategies for bringing bridges into a state of good repair are to:
Work through a consortia of competitively selected University Transportation Centers (UTC) to imple-ment the Long Term Performance Bridge pro-gram—applying academic expertise to a 20-year comprehensive examination of the Nation’s highway bridges from 2008 to 2028. This is the first time that quantitative bridge-performance data is collected uniformly across the U.S. Program objectives include providing highway authorities with procedures to detect problems early, address safety issues, extend the lives of current bridges, and build new structures that will maintain them well into the future;
Examine the trends in permits for weights in excess of legal limits and the pavement and bridge damage costs associated with those loads and take appropriate actions; and
Implement the bridge state of repair performance measurement requirement created in MAP-21.
STRATEGIES TO IMPROVE THE CONDITION OF TRANSIT SYSTEMSPublic transportation systems provide service to tens of millions of Americans daily, especially in our Nation’s largest metropolitan areas. These major transit systems, some of which are over 100 years old, suffer from chronic under-investment and less than optimal asset management practices. Americans traveled 52.6 billion miles on public
transportation in 2009, up 17 percent from 2000.22 DOT seeks to meet the increasing demand for public transporta-tion and at the same time bring transit infrastructure into a state of good repair.
MAP-21 places new emphasis on restoring and replac-ing aging transportation infrastructure by establishing a needs-based formula program, including a new tier for the needs of high-intensity bus services. The new program defines eligible recapitalization and restora-tion activities, with a goal of bringing all systems into a state of good repair. Under MAP-21, recipients will be required to establish and use an asset management system and report on their conditions.
Analysis of national transit data indicates that more than one-quarter of the Nation’s bus and rail assets are in marginal or poor condition.23 The proportion of assets in marginal or poor condition jumps to one-third in the larg-est and oldest rail transit agencies.24 In its “2010 National State of Good Repair Assessment,” FTA estimated the current backlog in rail and bus facilities and rolling stock at $77.7 billion. FTA further estimated annual expenditures from all Federal and nonfederal sources of $14.4 billion would be required to replace aging assets in poor condition each year.
DOT proposes a strong programmatic focus and sig-nificant new investments in improving the state of good repair of our Nation’s transit systems. FTA will work in partnership with States, local transit agencies, and other grant recipients to administer Federal transit programs. FTA will provide financial assistance, policy direction, technical expertise, and grant compliance oversight aimed at improving transit assets. Disability-related transit ele-ments that ensure accessibility—elevators, escalators, lifts, boarding, and communications technology are integral to a well maintained system. To bring our transit systems into a state of good repair, DOT will:
Implement new metropolitan and statewide planning efforts and transit capital programs that support asset management and investments to improve the state of good repair;
22 National Transit Database 2010 National Transit Profile: http://www.ntdprogram.gov/ntdprogram/pubs/national_profile/2010NationalProfile.pdf.
23 FTA National State of Good Repair Assessment, June 2010.24 FTA Rail Modernization Study, April 2009.
U.S. DEPARTMENT OF TRANSPORTATION | STRATEGIC PLAN FOR FISCAL YEARS 2012–16 27
Conduct outreach to the transit industry through roundtable meetings and training sessions to discuss management, maintenance and financial practices, and to develop an industry consensus on the need for, and measurement of state of good repair;
Work to establish criteria for public investments that allow for the comparison of benefits between rebuilding existing systems and expansion projects;
Develop tools to understand the future maintenance needs of expanding systems which will provide a framework for collecting data and metrics that can support better use of resources through a compre-hensive asset management program at both the local and Federal levels;
Identify critical assets and maintenance practices which best contribute to the safe operation of transit infrastruc-ture, and help establish priority re-investment decisions;
Collect data and analyze the condition of a cross-section of the Nation’s transit systems to determine the most effective investment strategies to bring transit infrastructure to a state of good repair; and
Deliver research and technical assistance on capital asset management and develop methods, tools, and guidance to improve asset management systems.
STRATEGIES TO IMPROVE THE CONDITION OF AIRPORT RUNWAYS DOT’s Federal Aviation Administration (FAA) faces a number of challenges as it takes steps to ensure that runway conditions at our airports are maintained in a state of good repair. FAA funds infrastructure develop-ment at eligible public-use airports. Funding for routine maintenance is limited to those airports that do not have sufficient revenue sources for periodic repairs, usually the smaller non-hub primary and non-primary airports. Airports of all sizes rely on FAA financial assistance for significant rehabilitation, resurfacing, and reconstruction of runways and major taxiways.
Periodic maintenance of runways, particularly resurfac-ing, is a cost effective way to delay the need for major runway rehabilitation. The metric used to monitor infrastructure condition includes a method to gauge whether FAA’s project priority strategy can maintain at
least 93 percent of the Nation’s runways in excellent, good, or fair condition. This level is important because it is intended to limit the number of runways undergoing significant reconstruction simultaneously. Under-funded maintenance creates an increasing risk of damage to aircraft and is a safety concern. To continue maintaining our runways in a state of good repair, DOT will:
Update priorities for infrastructure investments, includ-ing runway capabilities, to maintain and enhance exist-ing airport capacity across all types of airports; and
Through the cross-organizational Airport Obstructions Standards Committee, update standards and action plans for runway infrastructure and procedures (such as end-around taxiways), and use advanced data collec-tion tools to improve airport flight operations, while maintaining an optimal balance among safety, capacity, cost effectiveness, and efficiency considerations.
STRATEGIES TO ELIMINATE AMTRAK’S STATE OF GOOD REPAIR BACKLOG ON THE NORTHEAST CORRIDOR Amtrak’s Northeast Corridor, from Boston, Mas-sachusetts, to Washington, D.C., is the backbone of the transportation network in the Northeastern U.S. It provides high-speed passenger rail service that links four of the ten largest metropolitan areas in the country. When combined with connecting regional corridors and commuter services, the Northeast Corridor region serves nearly 50 million people. However, Amtrak is faced with an approximately $5 billion backlog of state of good repair projects that must be addressed to ensure the safety and reliability of these services, as well as improve trip times

28 U.S. DEPARTMENT OF TRANSPORTATION | STRATEGIC PLAN FOR FISCAL YEARS 2012–16
and the overall passenger experience. To bring the North-east Corridor into a state of good repair, DOT will:
Assist Amtrak in updating the Northeast Corridor State of Good Repair Spend Plan to reflect recent investments in the Corridor;
Work with Congress to pass a long-term reauthorization bill that provides financial assistance to eliminate the backlog of state of good repair projects by FY 2022; and
Oversee federally funded projects to ensure that they are delivered on time and within budget.
RESOURCESThe human resources, programs, capital assets, informa-tion technology and other resources described in DOT’s Annual Performance Budgets are needed to achieve our outcomes for achieving a state of good repair. The sched-ule for executing our State of Good Repair strategies extends from fiscal year 2012 through fiscal year 2016.
OUTCOMES AND PERFORMANCE MEASURESFigure 4 presents the relationship between the outcomes we will achieve under our state of good repair goal as well as the performance measures we propose to use to track our progress and evaluate the results of our work.25
FIGURE 4. STATE OF GOOD REPAIR OUTCOMES AND PERFORMANCE MEASURES
Outcomes Performance Measures
1. Increased percentage of highways in good condition - Increase the percent of travel on the enhanced National
Highway System (NHS) roads with pavement performance
standards rated good from 54 percent in 2011 to 60 per-
cent in 2016. FHWA
2. Increased percentage of bridges in good or fair condition - Decrease the percent of deck area (the roadway surface
of a bridge) on Enhanced NHS bridges rated structurally
deficient from 7.9 percent in 2011 to 7.4 percent in 2016.
FHWA
3. Increased percentage of transit assets in good condition - Reverse the trend of an increasing backlog of transit
capital assets in need of replacement or refurbishment (as
defined by an estimated condition rating of 2.5 or lower).
The 2016 target is a 2 percent decrease in the backlog
from the 2010 baseline. FTA
4. Increased percentage of airport runways in excellent,
good, or fair25 condition
- Maintain runway pavement in excellent, good, or fair con-
dition for 93 percent of the paved runways in the National
Plan of Integrated Airport Systems through 2016. FAA
5. Amtrak’s state of good repair backlog on the Northeast
Corridor has been eliminated
- Increase the cumulative percent of funds obligated to
complete the Northeast Corridor State of Good Repair
Plan from zero funding in 2010 to 60 percent by the end
of 2016. FRA
25 FAA has established three categories for runway condition that meet strict standards for the operational safety of aircraft transiting runways at high speed. Runways in Fair condition are fully compliant with those standards, but may require a higher level of surveillance and day-to-day maintenance than runways in Good or Excellent condition.
U.S. DEPARTMENT OF TRANSPORTATION | STRATEGIC PLAN FOR FISCAL YEARS 2012–16 29
EXTERNAL RISK FACTORSLack of sustainable funding for surface transportation is an external risk factor that could affect our ability to achieve results under our State of Good Repair Goal. Please refer to the full discussion of sustainable funding in the External Risk Factors section of the Safety Goal. Other significant risk factors include DOT’s limited ability to select projects for improvement, lack of common standards for various conditions, and lack of political support for maintenance.
ROADWAY AND BRIDGE RISK FACTORS DOT has limited ability to systematically improve pave-ment quality and bridge condition since State and local highway agencies prioritize projects that may or may not address pavement quality and bridge condition. While States and MPOs failing to meet the MAP-21 perfor-mance measures must focus funds on state of repair, those requirements do not become effective for 2–7 years.
TRANSIT RISK FACTORS For transit, external risk factors include the large backlog of older infrastructure in the largest metro transit systems; lack of an industry-wide commitment to implementing modern asset management prac-tices; dependence on revenue from State and local tax receipts and budget processes; and the competing needs of reinvesting in current infrastructure and at the same time expanding systems to meet increasing demand for transit services.
RISK FACTORS FOR AIRPORT RUNWAYSThe FAA funds initial infrastructure development at all airports; however, funding for maintenance is limited to those airports that generally do not have sufficient revenue sources for periodic repairs, usually smaller airports. In addition, airports can use nonfederal passenger facility charges, landing fees, and other sources of revenue to fund maintenance. Proper maintenance of runways can delay the need for major runway rehabilitation. If the cur-rent revenue sources for pavement maintenance were to diminish, maintenance at some runways could suffer and maintaining the goal of 93 percent of runways in excel-lent, good, or fair condition will become more difficult.
30 U.S. DEPARTMENT OF TRANSPORTATION | STRATEGIC PLAN FOR FISCAL YEARS 2012–16
ECONOMIC COMPETITIVENESS
U.S. DEPARTMENT OF TRANSPORTATION | STRATEGIC PLAN FOR FISCAL YEARS 2012–16 31
STRATEGIC GOALPROMOTE TRANSPORTATION POLICIES AND INVESTMENTS THAT BRING LASTING AND EQUITABLE ECONOMIC BENEFITS TO THE NATION AND ITS CITIZENS .
CHALLENGES AND STRATEGIES Over the next 40 years the U.S. population is expected to rise by 43 percent (from 307 million to 439 mil-lion), and the GDP is expected to almost triple (from $14 trillion to $41 trillion). To support this growth, the demand for both freight and passenger transportation is expected to increase by about two-and-a-half times by 2050. Since 1970, exports as a percentage of GDP have almost doubled, and imports have tripled. The U.S. manufacturing base is increasingly shifting to high-value, high-tech products whose manufacture integrates transportation into a just-in-time supply chain requiring efficient performance and consistent reliability.
Economic competitiveness means increasing and maxi-mizing the contribution of the transportation system to economic growth while at the same time reinforcing our other strategic goals. This requires consideration of safety, the stewardship of transportation assets, livable communities, personal mobility, and environmental sustainability in addition to economic growth. Eco-nomic competitiveness will also require implementa-tion of new technologies which enable us to move people and goods more efficiently and fully utilize existing capacity across all modes. These technologies will in turn require a highly skilled workforce trained to operate, maintain, and repair increasingly sophisti-cated vehicles and equipment.
Our economic competitiveness goal is to foster smart, strategic investments that will serve the traveling public, facilitate freight movement and bring equitable economic benefits to the Nation. Below we present our central strategies for achieving maximum eco-nomic returns on our policies and investments, leading the development of a competitive air transportation system, advancing transportation interests in targeted markets around the world, and expanding opportuni-ties for businesses in the transportation sector.
HIGH-SPEED PASSENGER RAIL
The American Recovery and Reinvestment Act (Recov-ery Act) provided an unprecedented $8 billion invest-ment in high-speed and intercity passenger rail. This initial funding, and $2.1 billion in additional, FY 2010 appropriations, has generated an extraordinary amount of interest across the country. In just 20 months, FRA received nearly 500 applications from 39 States, the District of Columbia, and Amtrak, requesting more than $75 billion—far exceeding the amount available. The resulting investments are expected to move us closer to achieving the President’s goal of providing 80 percent of Americans with convenient access to high-speed rail within 25 years. The investments will also spur eco-nomic growth, revitalize domestic rail manufacturing

32 U.S. DEPARTMENT OF TRANSPORTATION | STRATEGIC PLAN FOR FISCAL YEARS 2012–16
and supply industries, and establish an economic base of highly skilled, well paying American jobs.
Over 30 rail manufacturers, both domestic and foreign, have agreed to establish or expand their U.S. bases of operations if they are hired to build America’s next generation high-speed rail lines and equipment—a commitment the Administration secured to ensure that new jobs are created here at home. In addition, Amtrak and the States are using nearly $1.7 billion in Recovery Act, other appropriations and loans to purchase over 100 American-made locomotives and 250 railcars.
To advance high-speed rail services, DOT will work with Congress on the next surface transportation authorization to develop and fund a multi-tiered passenger rail network that accounts for different markets and geographic con-texts throughout the U.S. This vision includes:
Core Express Corridors that will form the backbone of the national high-speed passenger rail system, operating in and between large, dense metro-politan regions. These corridors will connect large urban areas up to 600 miles apart, within a 2–3 hour travel time at speeds between 125 and 250+ miles per hour (mph). Service will be frequent and will operate on electrified, dedicated track that is publicly-owned;
Regional Corridors that will connect mid-sized urban areas with convenient, frequent, 90–125 mph ser-vice on a mix of dedicated and shared track. These corridors will connect directly to the core express network, with many passenger services operating over both core express and regional networks; and
Emerging Corridors that will connect regional urban areas at speeds up to 90 mph on shared track. These corridors will connect to the core express or regional corridors allowing residents of more distant areas efficient access to the national system. As these communities grow and the passenger rail market matures, these services could be converted to regional or core express services.
Efficient, multi-modal connections are critical to the ultimate success of high-speed and intercity passenger rail. The Administration will continue to work with Amtrak, States, freight railroads and other key stake-holders in transit, airports and other transportation modes to ensure intercity passenger rail is effectively integrated into the national transportation system
MORE EFFICIENT FREIGHT MOVEMENT An efficient freight transportation system that con-nects population centers, economic activity, produc-tion, and consumption is critical to maintaining the competitiveness of our economy. In the past, the highly developed U.S. transportation system played a key role in allowing GDP per capita to grow faster in the U.S. than abroad. But other countries have increased their investments in transportation infrastructure and closed the gap with the U.S.
The efficiency of freight movement in the U.S. is chal-lenged by growth in global and domestic demands that are outpacing existing capacity. The result is decreased performance and reliability, a steady erosion of our economic competitiveness, and growing safety and environmental challenges. Additional U.S. transpor-tation infrastructure investment is needed, but the investment needs to be smart—carefully targeted where it will have the greatest economic payoff and where it will help to achieve our companion strategic goals. The Obama Administration is committed to providing suf-ficient resources and programmatic focus to strengthen
America’s highways will remain a crucial
component of our national transportation
network well into the future . But we can
no longer rely exclusively on roads as a
strategy for economic growth over the
long term . That is why the Obama Admin-
istration has begun the heavy lifting of
building a national high-speed-rail system
that will spur economic development and
job creation along its corridors .
TRANSPORTATION SECRETARY RAY LAHOOD

U.S. DEPARTMENT OF TRANSPORTATION | STRATEGIC PLAN FOR FISCAL YEARS 2012–16 33
our Nation’s economic competitiveness. The need for a strong Federal role in freight movement was clearly expressed in the report of the National Surface Trans-portation Policy and Revenue Study Commission26 and was foreshadowed and subsequently championed by a multitude of trade groups and associations. The U.S. needs a comprehensive, multimodal national freight transportation strategy that bolsters economic competi-tiveness and balances that need with safety, livability, and environmental sustainability.
DOT has conducted extensive data collection and analysis on freight movement in the U.S. and across global supply chains. This analysis shows that fewer than 30,000 miles of multi-modal corridors serve as the major trunk lines of our transportation system, each carrying at least 50 million tons per year. These corridors connect centers of economic activity throughout urban and rural America and require national focus and investment. All U.S. modal interests27 support a freight corridor strategy, as do cargo owners28 and representatives of system own-ers and operators.29
26 Transportation for Tomorrow: Report of the National Surface Transportation Policy and Revenue Study Commission, December 2007.
27 American Trucking Associations (ATA), Association of American Railroads (AAR) and American Association of Port Authorities (AAPA).
28 National Industrial Transportation League (NITL) and the U.S. Chamber of Commerce.
29 American Association of State Highway and Transportation Officials (AASHTO).
Acknowledging the economic importance of efficiently moving freight shipments, the European Union imple-mented a corridor strategy through their Trans-Euro-pean Transportation network. Similarly, Canada and Mexico are integrating this strategy into their policy, programs, and investment strategies.
DOT’s national freight strategy has three key objec-tives: 1) improving the system performance, reliability, safety, and environmental sustainability of our national freight network and the multi-modal freight corridors that connect major population centers with freight generators and international gateways; 2) targeting public freight policies and investments on strengthen-ing U.S. economic competitiveness by focusing on domestic industries and businesses to create high-value jobs; and 3) promoting economic opportunities for and reducing the negative effects of freight facilities and operations on surrounding communities. To achieve these objectives, DOT will:
Focus DOT-wide multi-modal freight policy efforts at the Secretarial level;
Support and focus public infrastructure investments on the national freight network and on multi-modal freight corridors, and encourage private sector infra-structure investments necessary to deliver integrated system improvements;
Develop and implement a framework that enables multi-jurisdictional and multi-modal freight trans-portation planning and investment;
Advance the research, data collection, analysis, training, and education needed to support informed decision-making regarding freight transportation, including the development of a freight plan required by MAP-21 that focuses on the highway freight network;
Advance operational and technological solutions that maximize the efficiency of existing infrastruc-ture, and adopt performance management practices to improve the condition and performance of the national freight network;
Enforce regulations that minimize risks of freight transportation to safety, reduce carbon footprints and other detriments to environmental sustainability
Goods movement is part of a larger
system . In the 21st century, companies
need end-to-end logistics solutions .
They need an infrastructure that is
intermodal and multi-modal . The better
connected ports, highways, railways, and
airports are, the better-off the system is
as a whole .
TRANSPORTATION SECRETARY RAY LAHOOD
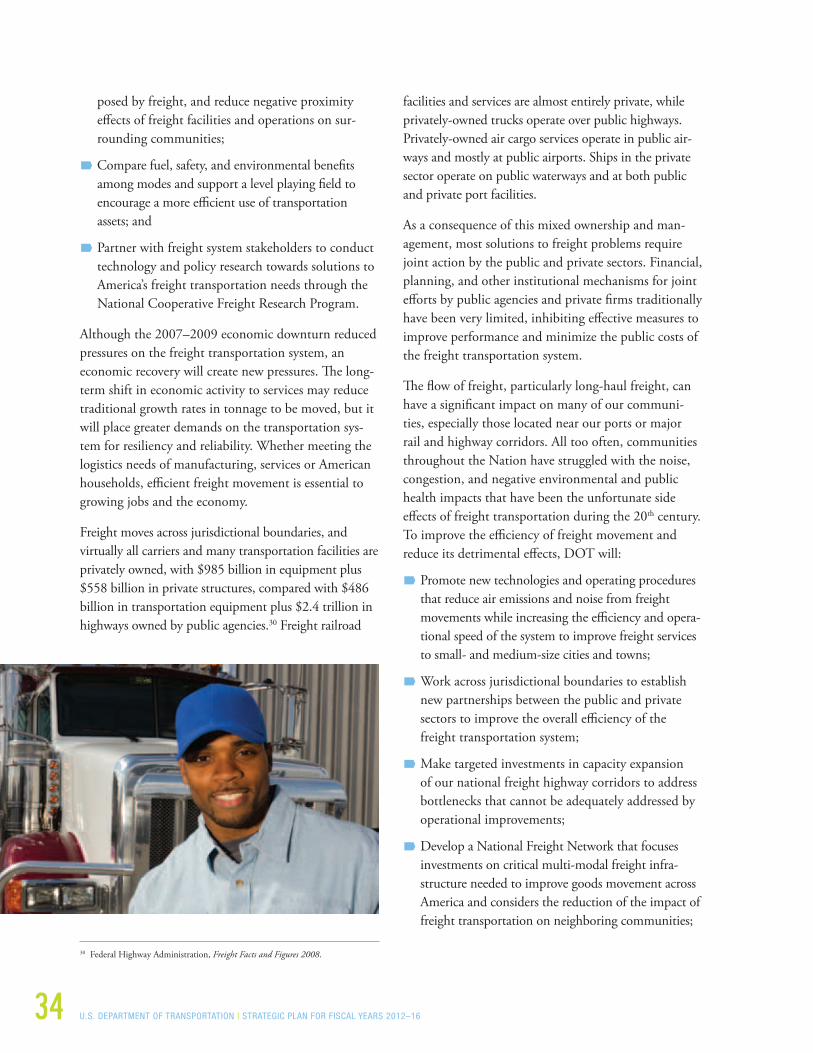
34 U.S. DEPARTMENT OF TRANSPORTATION | STRATEGIC PLAN FOR FISCAL YEARS 2012–16
posed by freight, and reduce negative proximity effects of freight facilities and operations on sur-rounding communities;
Compare fuel, safety, and environmental benefits among modes and support a level playing field to encourage a more efficient use of transportation assets; and
Partner with freight system stakeholders to conduct technology and policy research towards solutions to America’s freight transportation needs through the National Cooperative Freight Research Program.
Although the 2007–2009 economic downturn reduced pressures on the freight transportation system, an economic recovery will create new pressures. The long-term shift in economic activity to services may reduce traditional growth rates in tonnage to be moved, but it will place greater demands on the transportation sys-tem for resiliency and reliability. Whether meeting the logistics needs of manufacturing, services or American households, efficient freight movement is essential to growing jobs and the economy.
Freight moves across jurisdictional boundaries, and virtually all carriers and many transportation facilities are privately owned, with $985 billion in equipment plus $558 billion in private structures, compared with $486 billion in transportation equipment plus $2.4 trillion in highways owned by public agencies.30 Freight railroad
30 Federal Highway Administration, Freight Facts and Figures 2008.
facilities and services are almost entirely private, while privately-owned trucks operate over public highways. Privately-owned air cargo services operate in public air-ways and mostly at public airports. Ships in the private sector operate on public waterways and at both public and private port facilities.
As a consequence of this mixed ownership and man-agement, most solutions to freight problems require joint action by the public and private sectors. Financial, planning, and other institutional mechanisms for joint efforts by public agencies and private firms traditionally have been very limited, inhibiting effective measures to improve performance and minimize the public costs of the freight transportation system.
The flow of freight, particularly long-haul freight, can have a significant impact on many of our communi-ties, especially those located near our ports or major rail and highway corridors. All too often, communities throughout the Nation have struggled with the noise, congestion, and negative environmental and public health impacts that have been the unfortunate side effects of freight transportation during the 20th century. To improve the efficiency of freight movement and reduce its detrimental effects, DOT will:
Promote new technologies and operating procedures that reduce air emissions and noise from freight movements while increasing the efficiency and opera-tional speed of the system to improve freight services to small- and medium-size cities and towns;
Work across jurisdictional boundaries to establish new partnerships between the public and private sectors to improve the overall efficiency of the freight transportation system;
Make targeted investments in capacity expansion of our national freight highway corridors to address bottlenecks that cannot be adequately addressed by operational improvements;
Develop a National Freight Network that focuses investments on critical multi-modal freight infra-structure needed to improve goods movement across America and considers the reduction of the impact of freight transportation on neighboring communities;

U.S. DEPARTMENT OF TRANSPORTATION | STRATEGIC PLAN FOR FISCAL YEARS 2012–16 35
Work with other Federal agencies to ensure that all regulations on the marine and surface transportation systems facilitate the flow of commerce in a safe and secure environment;
Work with the States and industry to implement technology nationwide that will enable State and Federal motor carrier regulatory agencies to perform their regula-tory functions while CMVs operate at highway speeds. CMVs that comply with size, weight, and safety require-ments could then move unimpeded on the network;
Identify and implement solutions to the inefficient movement of freight through major metropolitan regions using a variety of technologies and opera-tional approaches such as real time information on the performance of the system for passengers and freight, tools to optimize systems operations and seamlessly link the freight supply chain;
Work with Federal, State, and local stakeholders to ensure the adequacy, efficiency, and reliability of our land, sea and air international gateways; and
Prioritize timely operations and maintenance projects for the Great Lakes and the St. Lawrence Seaway, and modernize the St. Lawrence Seaway’s U.S. infrastructure assets as part of a decade-long Seaway Asset Renewal Program.
HIGHWAY CONGESTION
While automobile and truck congestion currently imposes a relatively small cost on the overall economy (about 0.6 percent), the cost of congestion is grow-ing faster than GDP, and if current trends continue, is expected to impose a larger proportionate cost in the future. The cost of congestion has risen at a rate of almost 7 percent per year over the past 25 years, more than double the growth rate of GDP.
Highway congestion adversely affects our economy, our communities, and our quality of life. According to the “2011 Urban Mobility Report” prepared by the Texas Transportation Institute, traffic congestion in 2010 worsened in American cities of all sizes, creating a $101 billion annual drain on the U.S. economy in the form of 4.8 billion lost hours resulting from travel delay and 1.9 billion gallons of wasted fuel. The report noted that congestion caused the average peak-period traveler to spend an extra 34 hours of travel time and consume an additional 14 gallons of fuel annually, amounting to a cost of $713 per traveler. In addition to supporting long-term extensions of surface transportation authori-zations, to reduce highway congestion, DOT will:
Promote operational strategies that reduce the impact of congestion-causing incidents and bottle-necks including the use of effective traffic incident management and geospatial technologies, traveler and traffic information systems, and arterial and corridor management systems;
Provide support for better and a wider variety of transit services and increased transit capacity;31
Advocate adoption of demand management strategies which improve the efficiency of existing capacity such as ridesharing, car- and van-pooling, flextime, parking demand management, road pric-ing, and car sharing; and
Foster investment in high-speed, intercity passenger rail to balance demand across modes and relieve traffic on roads and on aviation.
31 Additional details are provided under the State of Good Repair Strategic Goal.
Transportation demand fluctuates by
time of day and by season, as anyone
who has driven a morning commute can
testify . Network congestion adds hidden
and not-so-hidden costs for both travel-
ers, infrastructure providers, and the
environment . Costs include wasted time,
additional greenhouse gas and urban air
pollutant emissions, excess fuel con-
sumption, excess infrastructure costs .
TRANSPORTATION DEPUTY SECRETARY JOHN D. PORCARI

36 U.S. DEPARTMENT OF TRANSPORTATION | STRATEGIC PLAN FOR FISCAL YEARS 2012–16
AVIATION
Expanding capacity and reducing costs in our aviation system will play an important role in improving the economic returns from our transportation system. In the decade between 1998 and 2008, total airline passenger traffic rose 13 percent in U.S. domestic markets and 47 percent in the international arena, despite the impacts of the September 11, 2001, terrorist attacks and the more recent global recession. Air transportation plays a key role in the growing tourism and hospitality sector of the economy and also serves business travelers who make the key connections that allow economic activity to grow and expand. As domestic and world economies recover, U.S. airline passenger demand is expected to increase and approach a growth rate of 3–4 percent annually.
In 2009, civil aviation supported over 10 million jobs, contributed $1.3 trillion in total economic activity, and accounted for 5.2 percent of total U.S. Gross Domes-tic Product (GDP), thus an important factor in the Nation’s economic growth.32
On April 2, 2010, Secretary Ray LaHood announced the establishment of the “Future of Aviation Advisory Committee” to provide information and recommenda-tions on the competitiveness of the U.S. aviation indus-
32 The Economic Impact of Civil Aviation on the U.S. Economy, FAA, 2011.
try. The Advisory Committee, representing the broad spectrum of aviation stakeholders, investigated the areas the industry has identified as priorities, including the competitiveness of the industry, infrastructure financing, workforce, environmental, and safety issues.
DOT is committed to meeting new and growing demands for air transportation services through 2025 and beyond by transforming the National Airspace System through the NextGen programs. NextGen will change the way the air transportation system operates by reducing congestion, noise, and emissions, and by expanding capacity, and improving the passenger expe-rience. To advance aviation capacity and reduce delays, DOT will work with the aviation industry to:
Meet the new and growing demands for air trans-portation services through 2025 through longer-range NextGen implementation;
Work through the Future Airport Capacity Team, to update airport capacity needs for 2020 and 2030;
Evaluate existing airport capacity levels and set investment and infrastructure priorities and policies that enhance capacity where economically justified;
Implement procedures with supporting infrastruc-ture to increase the efficiency of individual flights, deliver increased capacity for high density opera-tions, and maintain higher levels of capacity in low-visibility conditions;
Improve airspace access and modify separation standards to increase capacity and safely allow more efficient use of congested airspace; and
Direct Airport Improvement Program funding to provide cost-beneficial reductions in capacity constraints and provide greater access to regional airports in the metropolitan areas that will have a beneficial impact on system delays.
STRATEGIES TO FOSTER A COMPETITIVE AIR TRANSPORTATION SYSTEM THAT IS RESPONSIVE TO CONSUMER NEEDSOne of DOT’s key missions is to negotiate liberalized, bilateral aviation agreements that result in increased air service opportunities and lower fares for consumers.
NextGen will make air travel safer .
It will make our tarmacs and skies
less congested . It will cut travel times
and alleviate delays . It will make the
industry’s carbon footprint smaller .
And it will help the civil aviation sector—
responsible for 10 million jobs and
$1 .3 trillion of economic activity—to
become more efficient and competitive .
TRANSPORTATION SECRETARY RAY LAHOOD
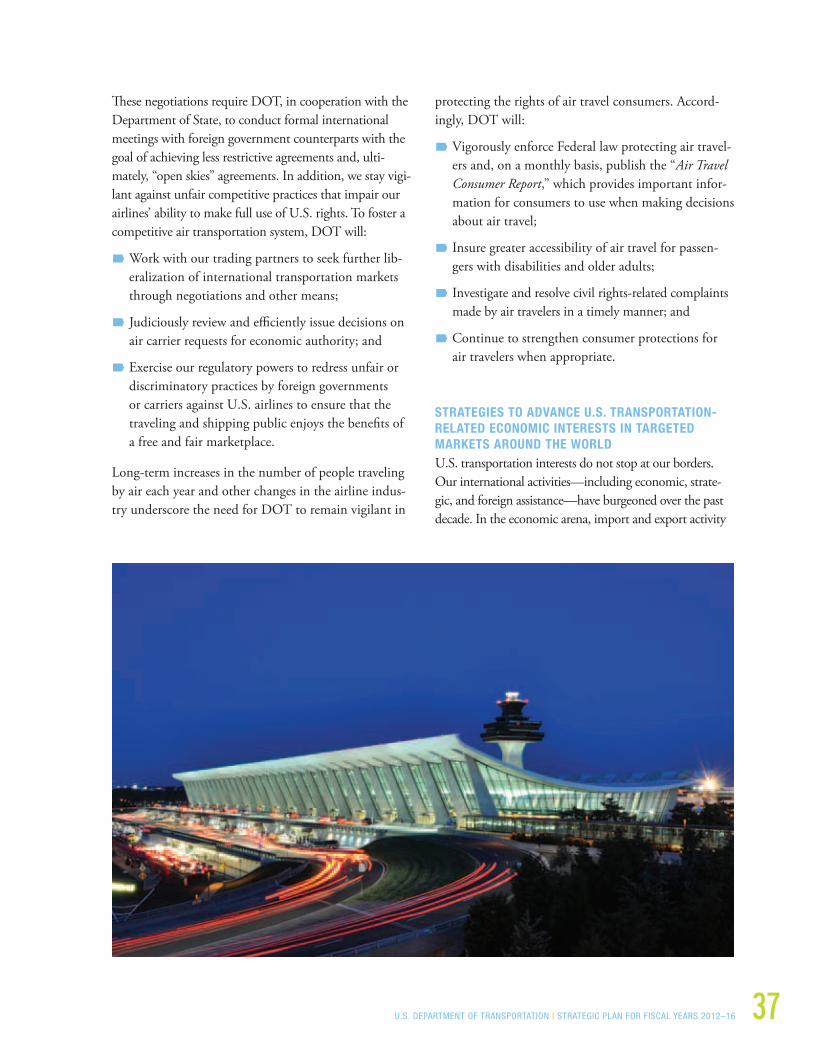
U.S. DEPARTMENT OF TRANSPORTATION | STRATEGIC PLAN FOR FISCAL YEARS 2012–16 37
These negotiations require DOT, in cooperation with the Department of State, to conduct formal international meetings with foreign government counterparts with the goal of achieving less restrictive agreements and, ulti-mately, “open skies” agreements. In addition, we stay vigi-lant against unfair competitive practices that impair our airlines’ ability to make full use of U.S. rights. To foster a competitive air transportation system, DOT will:
Work with our trading partners to seek further lib-eralization of international transportation markets through negotiations and other means;
Judiciously review and efficiently issue decisions on air carrier requests for economic authority; and
Exercise our regulatory powers to redress unfair or discriminatory practices by foreign governments or carriers against U.S. airlines to ensure that the traveling and shipping public enjoys the benefits of a free and fair marketplace.
Long-term increases in the number of people traveling by air each year and other changes in the airline indus-try underscore the need for DOT to remain vigilant in
protecting the rights of air travel consumers. Accord-ingly, DOT will:
Vigorously enforce Federal law protecting air travel-ers and, on a monthly basis, publish the “Air Travel Consumer Report,” which provides important infor-mation for consumers to use when making decisions about air travel;
Insure greater accessibility of air travel for passen-gers with disabilities and older adults;
Investigate and resolve civil rights-related complaints made by air travelers in a timely manner; and
Continue to strengthen consumer protections for air travelers when appropriate.
STRATEGIES TO ADVANCE U .S . TRANSPORTATION-RELATED ECONOMIC INTERESTS IN TARGETED MARKETS AROUND THE WORLD U.S. transportation interests do not stop at our borders. Our international activities—including economic, strate-gic, and foreign assistance—have burgeoned over the past decade. In the economic arena, import and export activity
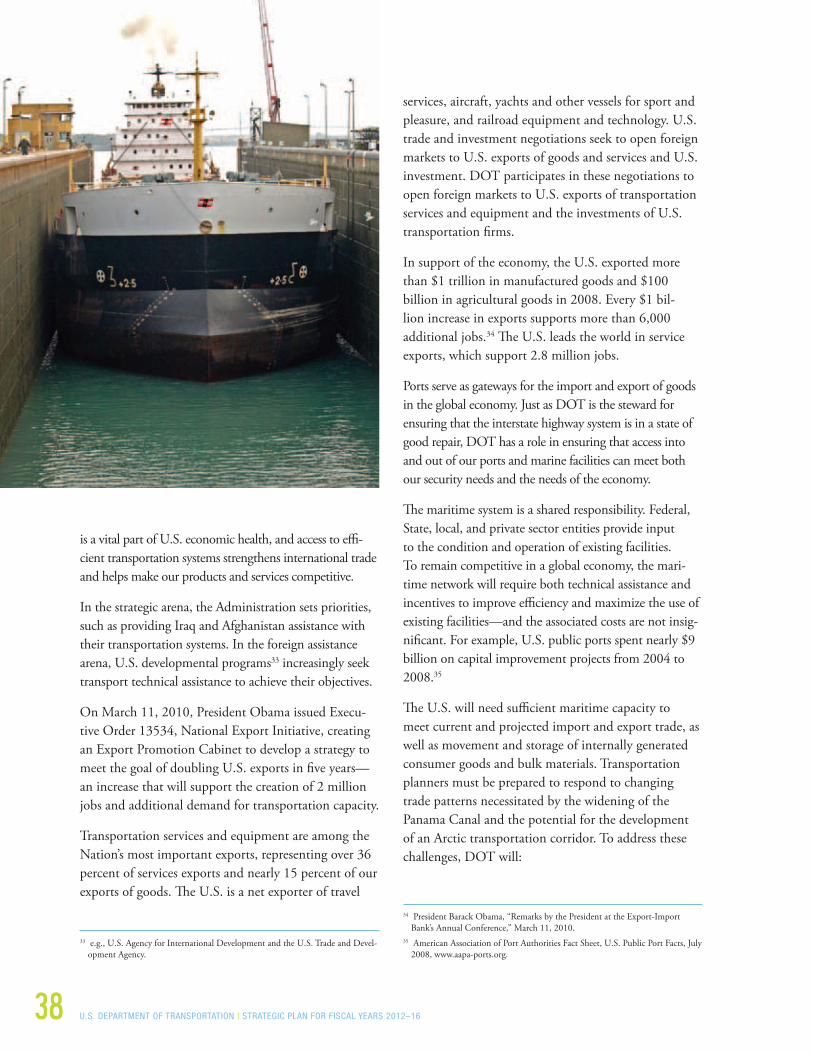
38 U.S. DEPARTMENT OF TRANSPORTATION | STRATEGIC PLAN FOR FISCAL YEARS 2012–16
is a vital part of U.S. economic health, and access to effi-cient transportation systems strengthens international trade and helps make our products and services competitive.
In the strategic arena, the Administration sets priorities, such as providing Iraq and Afghanistan assistance with their transportation systems. In the foreign assistance arena, U.S. developmental programs33 increasingly seek transport technical assistance to achieve their objectives.
On March 11, 2010, President Obama issued Execu-tive Order 13534, National Export Initiative, creating an Export Promotion Cabinet to develop a strategy to meet the goal of doubling U.S. exports in five years—an increase that will support the creation of 2 million jobs and additional demand for transportation capacity.
Transportation services and equipment are among the Nation’s most important exports, representing over 36 percent of services exports and nearly 15 percent of our exports of goods. The U.S. is a net exporter of travel
33 e.g., U.S. Agency for International Development and the U.S. Trade and Devel-opment Agency.
services, aircraft, yachts and other vessels for sport and pleasure, and railroad equipment and technology. U.S. trade and investment negotiations seek to open foreign markets to U.S. exports of goods and services and U.S. investment. DOT participates in these negotiations to open foreign markets to U.S. exports of transportation services and equipment and the investments of U.S. transportation firms.
In support of the economy, the U.S. exported more than $1 trillion in manufactured goods and $100 billion in agricultural goods in 2008. Every $1 bil-lion increase in exports supports more than 6,000 additional jobs.34 The U.S. leads the world in service exports, which support 2.8 million jobs.
Ports serve as gateways for the import and export of goods in the global economy. Just as DOT is the steward for ensuring that the interstate highway system is in a state of good repair, DOT has a role in ensuring that access into and out of our ports and marine facilities can meet both our security needs and the needs of the economy.
The maritime system is a shared responsibility. Federal, State, local, and private sector entities provide input to the condition and operation of existing facilities. To remain competitive in a global economy, the mari-time network will require both technical assistance and incentives to improve efficiency and maximize the use of existing facilities—and the associated costs are not insig-nificant. For example, U.S. public ports spent nearly $9 billion on capital improvement projects from 2004 to 2008.35
The U.S. will need sufficient maritime capacity to meet current and projected import and export trade, as well as movement and storage of internally generated consumer goods and bulk materials. Transportation planners must be prepared to respond to changing trade patterns necessitated by the widening of the Panama Canal and the potential for the development of an Arctic transportation corridor. To address these challenges, DOT will:
34 President Barack Obama, “Remarks by the President at the Export-Import Bank’s Annual Conference,” March 11, 2010.
35 American Association of Port Authorities Fact Sheet, U.S. Public Port Facts, July 2008, www.aapa-ports.org.
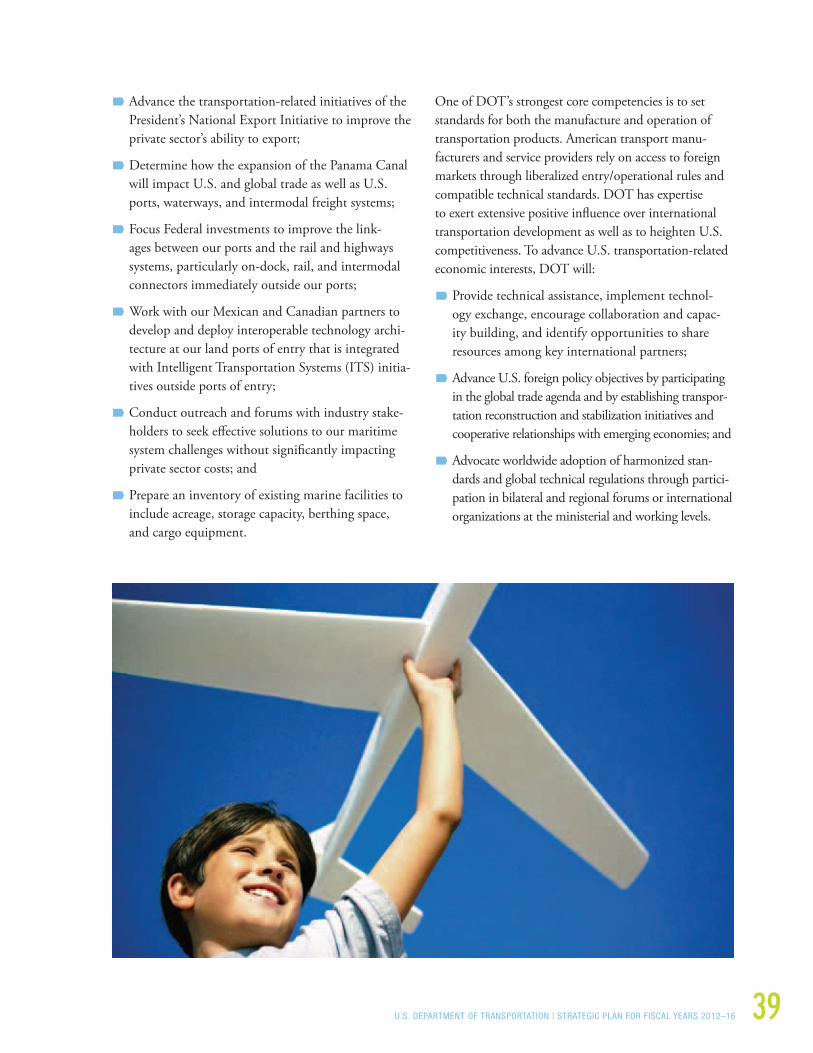
U.S. DEPARTMENT OF TRANSPORTATION | STRATEGIC PLAN FOR FISCAL YEARS 2012–16 39
Advance the transportation-related initiatives of the President’s National Export Initiative to improve the private sector’s ability to export;
Determine how the expansion of the Panama Canal will impact U.S. and global trade as well as U.S. ports, waterways, and intermodal freight systems;
Focus Federal investments to improve the link-ages between our ports and the rail and highways systems, particularly on-dock, rail, and intermodal connectors immediately outside our ports;
Work with our Mexican and Canadian partners to develop and deploy interoperable technology archi-tecture at our land ports of entry that is integrated with Intelligent Transportation Systems (ITS) initia-tives outside ports of entry;
Conduct outreach and forums with industry stake-holders to seek effective solutions to our maritime system challenges without significantly impacting private sector costs; and
Prepare an inventory of existing marine facilities to include acreage, storage capacity, berthing space, and cargo equipment.
One of DOT’s strongest core competencies is to set standards for both the manufacture and operation of transportation products. American transport manu-facturers and service providers rely on access to foreign markets through liberalized entry/operational rules and compatible technical standards. DOT has expertise to exert extensive positive influence over international transportation development as well as to heighten U.S. competitiveness. To advance U.S. transportation-related economic interests, DOT will:
Provide technical assistance, implement technol-ogy exchange, encourage collaboration and capac-ity building, and identify opportunities to share resources among key international partners;
Advance U.S. foreign policy objectives by participating in the global trade agenda and by establishing transpor-tation reconstruction and stabilization initiatives and cooperative relationships with emerging economies; and
Advocate worldwide adoption of harmonized stan-dards and global technical regulations through partici-pation in bilateral and regional forums or international organizations at the ministerial and working levels.

40 U.S. DEPARTMENT OF TRANSPORTATION | STRATEGIC PLAN FOR FISCAL YEARS 2012–16
STRATEGIES TO EXPAND OPPORTUNITIES FOR BUSINESSES IN THE TRANSPORTATION SECTOR, ESPECIALLY SMALL, WOMEN-OWNED, AND DISADVANTAGED BUSINESSESSmall businesses routinely develop, manufacture, and distribute quality products and services, but continue to face significant hurdles participating in procurement, contracting and concession opportunities with the Federal Government. To give these entrepreneurs a fair opportu-nity to compete, Congress and the Administration have established procurement goals for the Federal Government.
DOT’s Office of Small and Disadvantaged Business Utilization answers questions on how to grow, expand, and maintain small businesses as well as successfully market and do business with the Department. It dis-tributes publications to encourage, stimulate, promote, and better prepare small and disadvantaged businesses to compete for, obtain, and manage transportation-related contracts and subcontracts. The Office also provides management and technical assistance, as well as specific financial assistance for transportation-related projects. To expand these opportunities, DOT will:
Establish annual procurement goals for using women-owned, small and disadvantaged busi-nesses, based on historical achievements, legal authority, contracting opportunities, and availability of potential suppliers;
Increase participation in all stages of DOT’s Small Business Innovation Research (SBIR) program;
Increase compliance with Buy America and the abil-ity of the domestic manufacturers and suppliers to meet content requirements.
Implement a rulemaking that will help economically and socially disadvantaged businesses take advantage of opportunities to participate in federally-funded highway, transit and airport projects and hold States and local agencies more accountable for including disadvantaged businesses in their transportation plans. Among its provisions, the rulemaking will require greater accountability from State and local transportation agencies for including disadvantaged businesses in their spending plans and adjust the personal net worth limit for disadvantaged business owners from $750,000 to $1.32 million;
Work with airport sponsors to conduct meaningful outreach to include small, women-owned, and dis-advantaged businesses in contracts and concession opportunities; and
Conduct outreach and educational programs such as the bond readiness workshop and outreach to the dis-advantaged business community to ensure that small businesses have access to Federal contracting dollars.
RESOURCES The human resources, programs, capital assets, informa-tion technology and other resources described in DOT’s Annual Performance Budgets are needed to execute our Economic Competitiveness strategies and achieve results. The schedule for executing the strategies extends from fiscal year 2012 through fiscal year 2016.
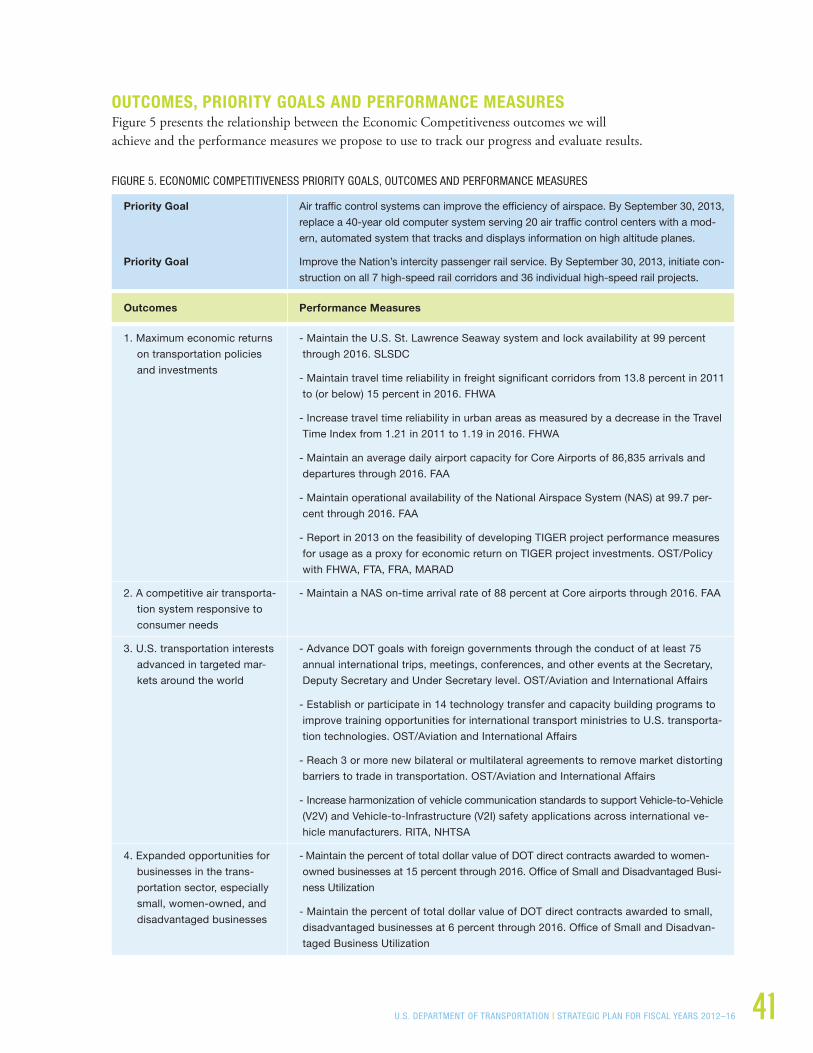
U.S. DEPARTMENT OF TRANSPORTATION | STRATEGIC PLAN FOR FISCAL YEARS 2012–16 41
OUTCOMES, PRIORITY GOALS AND PERFORMANCE MEASURESFigure 5 presents the relationship between the Economic Competitiveness outcomes we will achieve and the performance measures we propose to use to track our progress and evaluate results.
FIGURE 5. ECONOMIC COMPETITIVENESS PRIORITY GOALS, OUTCOMES AND PERFORMANCE MEASURES
Priority Goal Air traffic control systems can improve the efficiency of airspace. By September 30, 2013,
replace a 40-year old computer system serving 20 air traffic control centers with a mod-
ern, automated system that tracks and displays information on high altitude planes.
Priority Goal Improve the Nation’s intercity passenger rail service. By September 30, 2013, initiate con-
struction on all 7 high-speed rail corridors and 36 individual high-speed rail projects.
Outcomes Performance Measures
1. Maximum economic returns
on transportation policies
and investments
- Maintain the U.S. St. Lawrence Seaway system and lock availability at 99 percent
through 2016. SLSDC
- Maintain travel time reliability in freight significant corridors from 13.8 percent in 2011
to (or below) 15 percent in 2016. FHWA
- Increase travel time reliability in urban areas as measured by a decrease in the Travel
Time Index from 1.21 in 2011 to 1.19 in 2016. FHWA
- Maintain an average daily airport capacity for Core Airports of 86,835 arrivals and
departures through 2016. FAA
- Maintain operational availability of the National Airspace System (NAS) at 99.7 per-
cent through 2016. FAA
- Report in 2013 on the feasibility of developing TIGER project performance measures
for usage as a proxy for economic return on TIGER project investments. OST/Policy
with FHWA, FTA, FRA, MARAD
2. A competitive air transporta-
tion system responsive to
consumer needs
- Maintain a NAS on-time arrival rate of 88 percent at Core airports through 2016. FAA
3. U.S. transportation interests
advanced in targeted mar-
kets around the world
- Advance DOT goals with foreign governments through the conduct of at least 75
annual international trips, meetings, conferences, and other events at the Secretary,
Deputy Secretary and Under Secretary level. OST/Aviation and International Affairs
- Establish or participate in 14 technology transfer and capacity building programs to
improve training opportunities for international transport ministries to U.S. transporta-
tion technologies. OST/Aviation and International Affairs
- Reach 3 or more new bilateral or multilateral agreements to remove market distorting
barriers to trade in transportation. OST/Aviation and International Affairs
- Increase harmonization of vehicle communication standards to support Vehicle-to-Vehicle
(V2V) and Vehicle-to-Infrastructure (V2I) safety applications across international ve-
hicle manufacturers. RITA, NHTSA
4. Expanded opportunities for
businesses in the trans-
portation sector, especially
small, women-owned, and
disadvantaged businesses
- Maintain the percent of total dollar value of DOT direct contracts awarded to women-
owned businesses at 15 percent through 2016. Office of Small and Disadvantaged Busi-
ness Utilization
- Maintain the percent of total dollar value of DOT direct contracts awarded to small,
disadvantaged businesses at 6 percent through 2016. Office of Small and Disadvan-
taged Business Utilization
42 U.S. DEPARTMENT OF TRANSPORTATION | STRATEGIC PLAN FOR FISCAL YEARS 2012–16
EXTERNAL RISK FACTORS A significant factor that could affect achievement of DOT’s Economic Competitiveness strategic goal is the lack of sustainable funding for surface transportation programs which is discussed fully in the External Risk Factors section of the Safety goal. Additional risk factors include economic cycles, lack of data on freight trans-portation, increasing congestion, the need for a highly skilled transportation workforce, and factors associated with implementation of high-speed passenger rail.
ECONOMIC CYCLES In addition to the need for sustainable funding, the U.S. economy will have an effect upon our ability to achieve our Economic Competitiveness goal. Cycli-cal and long-term changes in economic activity have a strong impact on discretionary personal travel and shipment of goods, driving demand for transportation infrastructure and services. For-hire transportation activity, including both freight ton miles and passenger miles, are highly correlated with stages of the business cycle, as documented in “BTS Technical Report: Trans-portation Services Index and the Economy.”36
LACK OF FREIGHT TRANSPORTATION DATABetter information on freight flows is a factor that will improve our ability to achieve our economic competi-tiveness goal. The outcome-oriented, performance-based approach to transportation investment that we have emphasized relies on good freight transportation data to make possible the economic analysis of the ben-efits of freight transportation projects. At present there are major gaps in freight data availability.
For example, there are public and private entities provid-ing international freight shipment data that have varying degrees of timeliness, coverage, and reliability. Inland movements of imports are difficult, if not impossible, to track. Data are limited or non-existent on truck move-ments within metropolitan areas. Records of freight moved by rail in intermodal service often do not publicly include data detailed enough to identify specific commodities.
36 BTS TR-002, December 2007.
The Commodity Flow Survey,37 on which we rely for data on national freight flows, does not cover some categories of freight, and does not provide detailed commodity-spe-cific data for all metropolitan areas. Comprehensive data on freight movements are needed in order to objectively distinguish good freight projects from bad ones.
The International Freight Data System (IFDS), a DOT-agency partnership led by RITA, will sig-nificantly improve import and export data used for decision-making and fill major data gaps. IFDS, which is in beta testing for the production environment, is expected to produce full data flows in the second quarter of 2012. IFDS is DOT’s coordinated response to the Safe Port Act of 2006.
THE TRANSPORTATION WORKFORCEThe transportation workforce is a risk factor in our ability to achieve all of our goals. A highly skilled and well-trained workforce is needed to meet the planning, design, and operational requirements of future transportation systems. But in the next decade, 40–50 percent of all transporta-tion workers are expected to begin to retire.38 Moreover, due to financial challenges, many public agencies have downsized and frozen hiring. Consulting and engineer-ing firms have also been downsized due to reductions in land development projects, and a slowdown in design and operations projects. Graduate school enrollment in transportation programs is on a decline as is undergraduate enrollment in civil engineering and, of those enrolled, there are an increasing number of foreign nationals who upon graduation are returning to their home countries. Many of DOT’s strategic initiatives, such as high-speed rail and NextGen, depend on a highly skilled workforce.
HIGH-SPEED PASSENGER RAIL Risk factors for high-speed rail include sustainable funding and industry capacity. Low levels of passenger rail investment in recent decades and a high number of rail personnel retirements have resulted in a diminished
37 The BTS Commodity Flow Survey is the primary source of national and State-level data on domestic freight shipments by American establishments in mining, manufacturing, wholesale, auxiliaries, and selected retail industries.
38 “HELP WANTED: Meeting the Need for Tomorrow’s Transportation Work-force,” Public Roads, July/August 2001.
U.S. DEPARTMENT OF TRANSPORTATION | STRATEGIC PLAN FOR FISCAL YEARS 2012–16 43
pool of expertise, including engineers skilled in signal, track, and rolling stock design, rail planners, and managers. While increased investment in passenger rail will draw expertise into the industry, project sponsors, including States, must aggressively build capacity to manage their new portfolios. Likewise, the freight rail-roads and service operators (e.g., Amtrak) must support the new effort without diverting resources from their core operating and maintenance responsibilities.
While core express services will operate on dedi-cated passenger track, many regional corridors will share track with freight and commuter trains. Project stakeholders—especially States, infrastructure–owning railroads, intercity passenger rail operators, and com-muter authorities—must reach agreements to assure that high-speed rail, commuter, and freight services not only coexist, but also flourish and accommodate future demand. The three rail services have different characteristics, including operating speeds and stop-ping patterns, and typically impose different capac-ity requirements, engineering parameters, and safety standards. It is important, therefore, to tailor the design of incremental high-speed rail systems to demand levels, service patterns, and operating and maintenance requirements of all rail users.

44 U.S. DEPARTMENT OF TRANSPORTATION | STRATEGIC PLAN FOR FISCAL YEARS 2012–16
LIVABLE COMMUNITIES
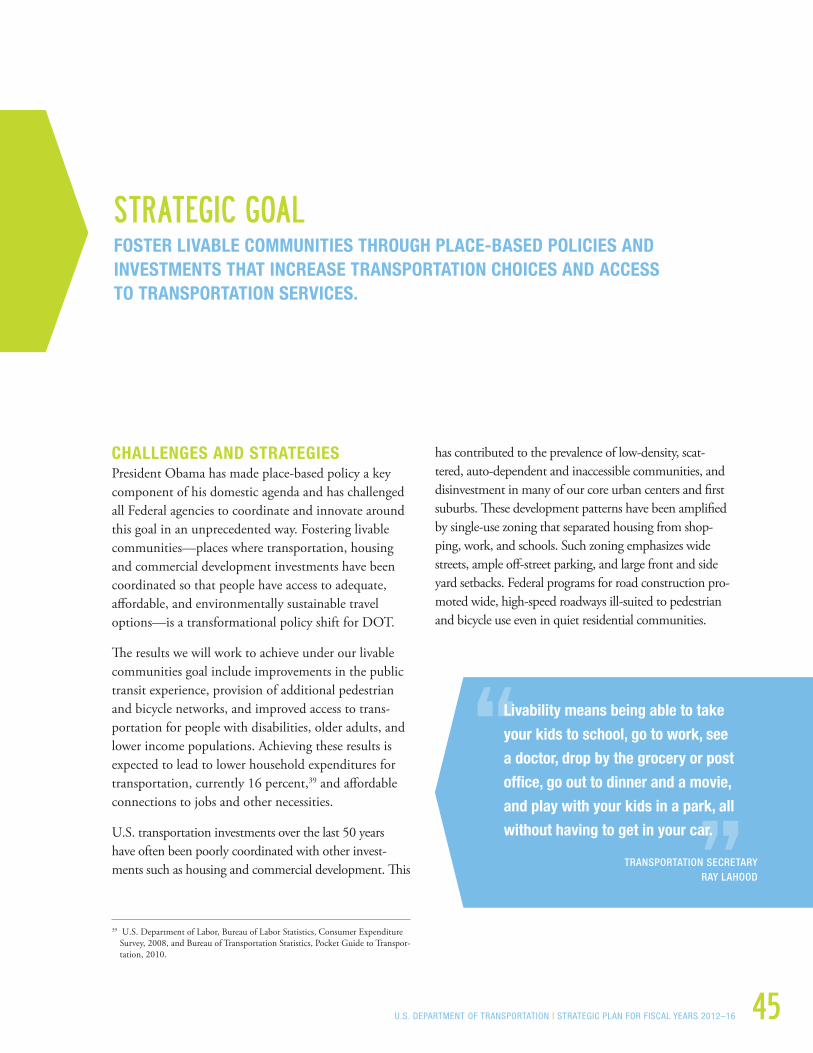
U.S. DEPARTMENT OF TRANSPORTATION | STRATEGIC PLAN FOR FISCAL YEARS 2012–16 45
STRATEGIC GOALFOSTER LIVABLE COMMUNITIES THROUGH PLACE-BASED POLICIES AND INVESTMENTS THAT INCREASE TRANSPORTATION CHOICES AND ACCESS TO TRANSPORTATION SERVICES .
CHALLENGES AND STRATEGIESPresident Obama has made place-based policy a key component of his domestic agenda and has challenged all Federal agencies to coordinate and innovate around this goal in an unprecedented way. Fostering livable communities—places where transportation, housing and commercial development investments have been coordinated so that people have access to adequate, affordable, and environmentally sustainable travel options—is a transformational policy shift for DOT.
The results we will work to achieve under our livable communities goal include improvements in the public transit experience, provision of additional pedestrian and bicycle networks, and improved access to trans-portation for people with disabilities, older adults, and lower income populations. Achieving these results is expected to lead to lower household expenditures for transportation, currently 16 percent,39 and affordable connections to jobs and other necessities.
U.S. transportation investments over the last 50 years have often been poorly coordinated with other invest-ments such as housing and commercial development. This
39 U.S. Department of Labor, Bureau of Labor Statistics, Consumer Expenditure Survey, 2008, and Bureau of Transportation Statistics, Pocket Guide to Transpor-tation, 2010.
has contributed to the prevalence of low-density, scat-tered, auto-dependent and inaccessible communities, and disinvestment in many of our core urban centers and first suburbs. These development patterns have been amplified by single-use zoning that separated housing from shop-ping, work, and schools. Such zoning emphasizes wide streets, ample off-street parking, and large front and side yard setbacks. Federal programs for road construction pro-moted wide, high-speed roadways ill-suited to pedestrian and bicycle use even in quiet residential communities.
Livability means being able to take
your kids to school, go to work, see
a doctor, drop by the grocery or post
office, go out to dinner and a movie,
and play with your kids in a park, all
without having to get in your car .
TRANSPORTATION SECRETARY RAY LAHOOD
46 U.S. DEPARTMENT OF TRANSPORTATION | STRATEGIC PLAN FOR FISCAL YEARS 2012–16
These development patterns have provided many American families of all income levels with unprec-edented choices in where they can live, and the ability to own a single-family home. In the 1950s and 1960s, many of these communities were walkable and located near the urban core. But over time, more far-flung neighborhoods were built—often without sidewalks—and transit service to these neighborhoods was cut back or dismantled completely. The United States’ heavy reliance on car-dependent, dispersed development is not without costs.40
For example, the average American adult between the ages of 25 and 54 drives over 12,700 miles per year, spending the equivalent of approximately one month each year in the car, and the average American house-hold has to spend $8,220 per year to buy, maintain, and operate personal automobiles.
Alternatives to auto travel are scarce in many com-munities. Fewer than one in 20 households are located within a half-mile of rail transit41 and only 53 per-cent of Americans have access to any form of public transportation service.42 Health experts believe that our auto-dependent development patterns may also contribute to a host of health problems by making walking and biking dangerous in some residential neighborhoods.43
For example, nearly one-third of Americans live in neighborhoods without sidewalks. An increase in the number of communities built without sidewalks has been correlated with a decline in the percentage of
40 Robert W. Burchell, et al. “The Costs of Sprawl—Revisited.” Transportation Research Board. (1998-2000).
Robert W. Burchell, et al. “The Costs of Sprawl—2000.” Transportation Research Board. 2002.
Ken Snyder and Lori Bird. “Paying the Costs of Sprawl: Using Fair-Share Costing to Control Sprawl.” U.S. Department of Energy Center of Excellence for Sustain-able Development. 1998.
41 Center for Transit Oriented Development and Federal Transit Administration. “National Transit Oriented Development GIS Database.” 2010.
42 Center for Urban Transportation Research. Public Transit in America: Analysis of Access Using the 2001 National Household Travel Survey. 2007.
43 Pucher, John, and Lewis Dijkstra. “Promoting Safe Walking and Cycling to Improve Public Health: Lessons from The Netherlands and Germany.” American Journal of Public Health. 93.9.2003.
Goldberg, David, Lawrence Frank, Barbara McCann, Jim Chapman, and Sarah Kavage. NEW DATA FOR A NEW ERA: A Summary of the SMARTRAQ Findings Linking Land Use, Transportation, Air Quality and Health in the Atlanta Region, January 2007.
Ewing, R., Schmid, T. L. et al. (2003). Relationship between urban sprawl and physi-cal activity, obesity and morbidity. American Journal of Health Promotion 18(1): 47-57.
American children who walk or bike to school. In 1969, 42 percent of children five to 18 years of age walked or bicycled to school. In contrast in 2001, only 16 percent walked or bicycled to school44 which is one of the causes of rising childhood obesity.45
A 2003 study on the health effects of sprawl found that people living in more compact, walkable coun-ties are likely to walk more, weigh less, and are less likely to suffer from hypertension than people living in more sprawling counties.46 A 2004 study published in the journal Public Health was the first to examine the relationship between sprawl and a wider spectrum of chronic illnesses. This study corroborated the finding that suggests that the physical attributes of where a person lives can encourage or discourage active living and, therefore, have an impact on health.
Roughly 40 percent of all trips in metropolitan areas are two miles or less in length. These are trips that could be taken on foot or bicycle but are still taken primarily by car due at least in part to disjointed land use patterns, poor infrastructure design, and limited connectivity.
A consumer research study found that over half of the Millennial Generation—people born from the mid-1970s to the 1990s—felt that an easy walk to stores was an extremely important determinant in housing and neighborhood choice and over two-thirds of them felt that living in a walkable community was impor-tant.47 The American Association of Retired Persons
44 U.S. Centers for Disease Control and Prevention. Kids Walk-to-School: Then and Now—Barrier and Solutions. www.cdc.gov/nccdphp/dnpa/kidswalk/then_and_now.htm.
45 Cooper, Ashley, Angie Page, Lucy Foster, and Dina Qahwaji. “Commuting to school: Are children who walk more physically active? .American Journal of Preventive Medicine 25.4 (2003): 273-276.
Childhood Obesity: Trends and Potential Causes, by Patricia M. Anderson and Kristin F. Butcher 2006 Princeton University.
The Role of Built Environments in Physical Activity, Eating, and Obesity in Childhood, by James F. Sallis and Karen Glanz, 2006 Princeton University.
Ewing, R., Schmid, T. L. et al. (2003). Relationship between urban sprawl and physical activity, obesity and morbidity. American Journal of Health Promotion 18(1): 47-57.
Watson M, Dannenberg AL. Investment in Safe Routes to School projects: public health benefits for the larger community, 2008.
46 Measuring the Health Effects of Sprawl A National Analysis of Physical Activity, Obesity and Chronic Disease, Smart Growth America, Surface Transportation Policy Project, September 2003.
47 Ducker, Adam. “Generation Y and the MPC: Oil and Water or the Next Big Wave?.” ULI MPC Conference. RCLCO consumer research: 2008. Web. 25 Jan 2010.
Reconnecting America’s Center for Transit Oriented Development. HIDDEN IN PLAIN SIGHT: Capturing the Demand for Housing Near Transit. Washington, D.C. 2004.
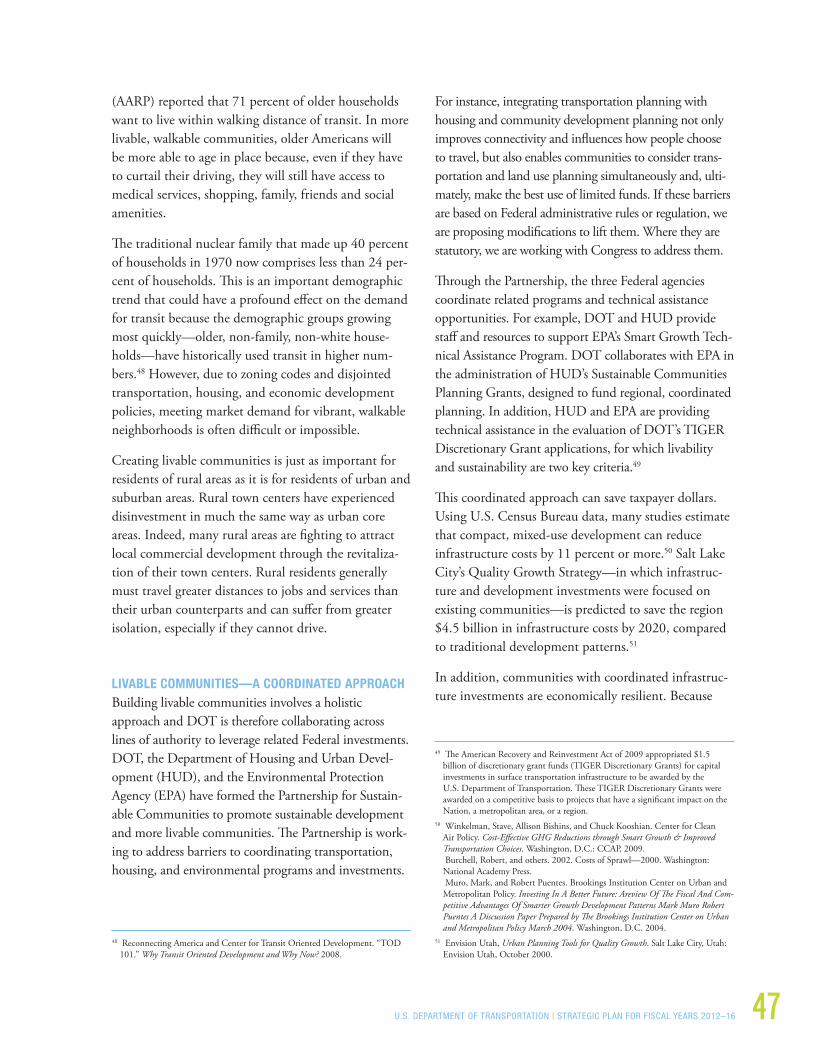
U.S. DEPARTMENT OF TRANSPORTATION | STRATEGIC PLAN FOR FISCAL YEARS 2012–16 47
(AARP) reported that 71 percent of older households want to live within walking distance of transit. In more livable, walkable communities, older Americans will be more able to age in place because, even if they have to curtail their driving, they will still have access to medical services, shopping, family, friends and social amenities.
The traditional nuclear family that made up 40 percent of households in 1970 now comprises less than 24 per-cent of households. This is an important demographic trend that could have a profound effect on the demand for transit because the demographic groups growing most quickly—older, non-family, non-white house-holds—have historically used transit in higher num-bers.48 However, due to zoning codes and disjointed transportation, housing, and economic development policies, meeting market demand for vibrant, walkable neighborhoods is often difficult or impossible.
Creating livable communities is just as important for residents of rural areas as it is for residents of urban and suburban areas. Rural town centers have experienced disinvestment in much the same way as urban core areas. Indeed, many rural areas are fighting to attract local commercial development through the revitaliza-tion of their town centers. Rural residents generally must travel greater distances to jobs and services than their urban counterparts and can suffer from greater isolation, especially if they cannot drive.
LIVABLE COMMUNITIES—A COORDINATED APPROACHBuilding livable communities involves a holistic approach and DOT is therefore collaborating across lines of authority to leverage related Federal investments. DOT, the Department of Housing and Urban Devel-opment (HUD), and the Environmental Protection Agency (EPA) have formed the Partnership for Sustain-able Communities to promote sustainable development and more livable communities. The Partnership is work-ing to address barriers to coordinating transportation, housing, and environmental programs and investments.
48 Reconnecting America and Center for Transit Oriented Development. “TOD 101.” Why Transit Oriented Development and Why Now? 2008.
For instance, integrating transportation planning with housing and community development planning not only improves connectivity and influences how people choose to travel, but also enables communities to consider trans-portation and land use planning simultaneously and, ulti-mately, make the best use of limited funds. If these barriers are based on Federal administrative rules or regulation, we are proposing modifications to lift them. Where they are statutory, we are working with Congress to address them.
Through the Partnership, the three Federal agencies coordinate related programs and technical assistance opportunities. For example, DOT and HUD provide staff and resources to support EPA’s Smart Growth Tech-nical Assistance Program. DOT collaborates with EPA in the administration of HUD’s Sustainable Communities Planning Grants, designed to fund regional, coordinated planning. In addition, HUD and EPA are providing technical assistance in the evaluation of DOT’s TIGER Discretionary Grant applications, for which livability and sustainability are two key criteria.49
This coordinated approach can save taxpayer dollars. Using U.S. Census Bureau data, many studies estimate that compact, mixed-use development can reduce infrastructure costs by 11 percent or more.50 Salt Lake City’s Quality Growth Strategy—in which infrastruc-ture and development investments were focused on existing communities—is predicted to save the region $4.5 billion in infrastructure costs by 2020, compared to traditional development patterns.51
In addition, communities with coordinated infrastruc-ture investments are economically resilient. Because
49 The American Recovery and Reinvestment Act of 2009 appropriated $1.5 billion of discretionary grant funds (TIGER Discretionary Grants) for capital investments in surface transportation infrastructure to be awarded by the U.S. Department of Transportation. These TIGER Discretionary Grants were awarded on a competitive basis to projects that have a significant impact on the Nation, a metropolitan area, or a region.
50 Winkelman, Stave, Allison Bishins, and Chuck Kooshian. Center for Clean Air Policy. Cost-Effective GHG Reductions through Smart Growth & Improved Transportation Choices. Washington, D.C.: CCAP, 2009.
Burchell, Robert, and others. 2002. Costs of Sprawl—2000. Washington: National Academy Press.
Muro, Mark, and Robert Puentes. Brookings Institution Center on Urban and Metropolitan Policy. Investing In A Better Future: Areview Of The Fiscal And Com-petitive Advantages Of Smarter Growth Development Patterns Mark Muro Robert Puentes A Discussion Paper Prepared by The Brookings Institution Center on Urban and Metropolitan Policy March 2004. Washington, D.C. 2004.
51 Envision Utah, Urban Planning Tools for Quality Growth. Salt Lake City, Utah: Envision Utah, October 2000.
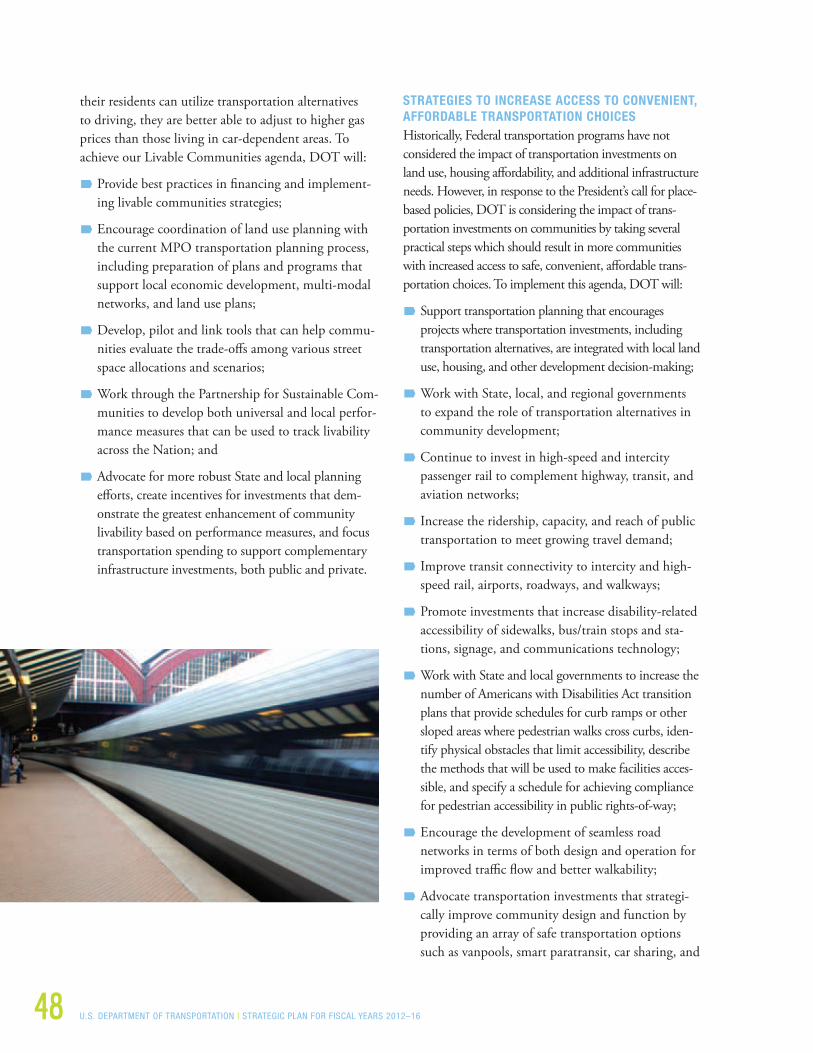
48 U.S. DEPARTMENT OF TRANSPORTATION | STRATEGIC PLAN FOR FISCAL YEARS 2012–16
their residents can utilize transportation alternatives to driving, they are better able to adjust to higher gas prices than those living in car-dependent areas. To achieve our Livable Communities agenda, DOT will:
Provide best practices in financing and implement-ing livable communities strategies;
Encourage coordination of land use planning with the current MPO transportation planning process, including preparation of plans and programs that support local economic development, multi-modal networks, and land use plans;
Develop, pilot and link tools that can help commu-nities evaluate the trade-offs among various street space allocations and scenarios;
Work through the Partnership for Sustainable Com-munities to develop both universal and local perfor-mance measures that can be used to track livability across the Nation; and
Advocate for more robust State and local planning efforts, create incentives for investments that dem-onstrate the greatest enhancement of community livability based on performance measures, and focus transportation spending to support complementary infrastructure investments, both public and private.
STRATEGIES TO INCREASE ACCESS TO CONVENIENT, AFFORDABLE TRANSPORTATION CHOICES Historically, Federal transportation programs have not considered the impact of transportation investments on land use, housing affordability, and additional infrastructure needs. However, in response to the President’s call for place-based policies, DOT is considering the impact of trans-portation investments on communities by taking several practical steps which should result in more communities with increased access to safe, convenient, affordable trans-portation choices. To implement this agenda, DOT will:
Support transportation planning that encourages projects where transportation investments, including transportation alternatives, are integrated with local land use, housing, and other development decision-making;
Work with State, local, and regional governments to expand the role of transportation alternatives in community development;
Continue to invest in high-speed and intercity passenger rail to complement highway, transit, and aviation networks;
Increase the ridership, capacity, and reach of public transportation to meet growing travel demand;
Improve transit connectivity to intercity and high-speed rail, airports, roadways, and walkways;
Promote investments that increase disability-related accessibility of sidewalks, bus/train stops and sta-tions, signage, and communications technology;
Work with State and local governments to increase the number of Americans with Disabilities Act transition plans that provide schedules for curb ramps or other sloped areas where pedestrian walks cross curbs, iden-tify physical obstacles that limit accessibility, describe the methods that will be used to make facilities acces-sible, and specify a schedule for achieving compliance for pedestrian accessibility in public rights-of-way;
Encourage the development of seamless road networks in terms of both design and operation for improved traffic flow and better walkability;
Advocate transportation investments that strategi-cally improve community design and function by providing an array of safe transportation options such as vanpools, smart paratransit, car sharing, and

U.S. DEPARTMENT OF TRANSPORTATION | STRATEGIC PLAN FOR FISCAL YEARS 2012–16 49
pricing strategies that, in conjunction with transit services, reduce single-occupancy driving;
Promote market-based strategies and information tech-nologies to manage demand on congested roadways;
Ensure that more rural areas are provided oppor-tunities to walk and ride bicycles as well as reliable means of high-quality, accessible public transporta-tion services to connect them to vital destinations now accessible only by automobile; and
Create a database which catalogues land near transit stations that is eligible for development to encour-age local governments and Metropolitan Planning Organizations (MPOs) to locate new developments in areas near transit.
STRATEGIES FOR IMPROVED PUBLIC TRANSIT EXPERIENCEAs part of the larger transportation system, a network of highly interconnected regional, urban, local, and rural public transportation services will have a vital role in providing mobility and access, ensuring that people can move conveniently and efficiently from place to place. Accordingly, DOT will pursue policies that:
Increase the capacity and reach of public transporta-tion, improve the quality of service, and improve travel time reliability through deployment of advanced technologies and significant gains in the state of good repair of transit infrastructure;
Improve public transportation’s access and con-nections to intercity and high-speed rail, airports, roadways, and walkways to reduce passenger travel times and make travel more reliable; and
Advance ITS program research and deployment of real-time multi-modal travel information for travel-ers, carriers, and public agencies.
STRATEGIES FOR IMPROVING NETWORKS THAT ACCOMMODATE PEDESTRIANS AND BICYCLES According to the most recent National Household Travel Survey, about 11.6 percent of all trips are made by walking or bicycling, an increase of 4.4 percent from 2001 and 6.4 percent from 1995. But approximately
one-third of Americans live in communities without sidewalks or bike lanes.52 Poor provision for pedestrian and bicycle traffic can impact safety.
DOT estimates that Federal funds spent for walking and bicycling facilities were roughly $1 billion in 2010 and $790 million in 2011. Although walking and bicycling account for almost 12 percent of trips and about 13 percent of roadway fatalities, these modes receive less than 2 percent of annual Federal-Aid High-way funds. To increase safe, convenient, and attractive facilities for non-motorists DOT will:
Support Pedestrian and Bicycle Safety Assessments which analyze current engineering proposals, enforce-ment strategies, and education programs. The assess-ments can be used to assist with long-range planning and resource allocation; generate political support for program improvement; and serve as a benchmark against which to measure future improvements;
Develop Geographic Information System (GIS) based methods to estimate non-motorized travel, evaluate change in VMT per capita, reduced planned transportation greenhouse gas (GHG) emissions
52 “Sidewalks Promote Walking.” Bureau of Transportation Statistics, Issue Brief 12, December 2004
“National Complete Streets Coalition.” Fact Sheets: Changing Travel Patterns. 2009. National Complete Streets Coalition, Web. <http://www.completestreets.org/complete-streets-fundamentals/factsheets/change-travel-patterns/>.

50 U.S. DEPARTMENT OF TRANSPORTATION | STRATEGIC PLAN FOR FISCAL YEARS 2012–16
nationally, and begin to trace and report travel time reliability in the 40 largest metropolitan areas;
Encourage Federal Land Management Agencies, States and tribal governments to inventory their walking and bicycling facilities; and
Maintain a web-based clearinghouse on walking and bicycling to provide best practices on walking and bicy-cling design, planning, safety, ways to encourage using these modes for short trips and continue to develop methods to evaluate the walkability of a community.
STRATEGIES FOR IMPROVED COORDINATION OF HUMAN SERVICES TRANSPORTATIONUnder the Chairmanship of the Secretary of Transporta-tion, DOT leads the Federal Coordinating Council on Access and Mobility (CCAM), in support of the United We Ride (UWR) initiative. UWR is a Federal interagency initiative to coordinate over 60 federally-assisted trans-portation programs aimed at improving the availability, quality, and efficient delivery of transportation services for older adults, people with disabilities, and individuals with
lower incomes. UWR works through FTA staff, other Federal agencies, State and local organizations, and non-profits to provide assistance in obtaining Federal grants in support of the transportation-disadvantaged. To increase access to transportation for these persons, DOT will con-tinue to support the CCAM mandates and also:
Support locally-coordinated human service trans-portation planning processes and advocate for a single point of access that links human services with transportation providers to address mobility needs of persons with disabilities, older adults, low-income persons and others without cars or who are unable to access the fixed route system and trains;
Conduct research to develop transportation manage-ment center capabilities for automated scheduling, mapping, routing, and dispatching to link human services transportation providers for easier access, and more efficient and cost beneficial services; and
Enhance technical assistance and training activities to improve the operations of local public and non-profit community transportation providers.
RESOURCESThe human resources, programs, capital assets, informa-tion technology and other resources described in DOT’s Annual Performance Budgets are designed to achieve our outcomes for fostering livable communities. The schedule for executing our Livable Communities strategies extends from fiscal year 2012 through fiscal year 2016.
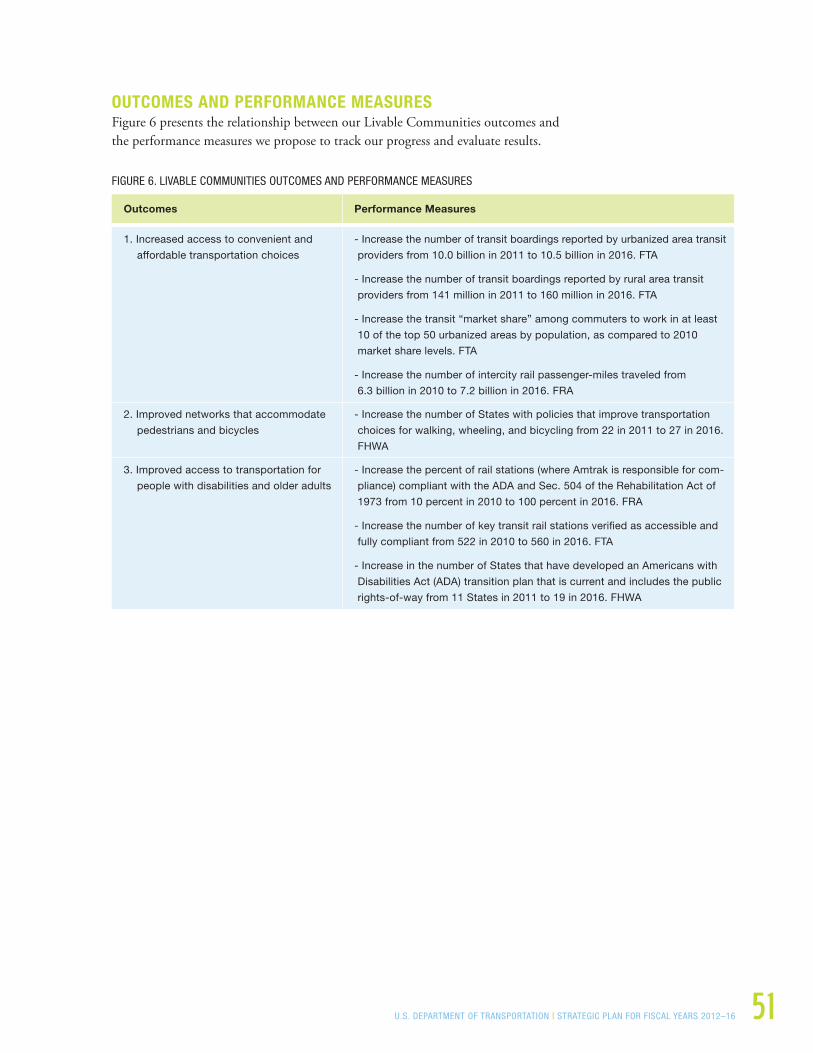
U.S. DEPARTMENT OF TRANSPORTATION | STRATEGIC PLAN FOR FISCAL YEARS 2012–16 51
OUTCOMES AND PERFORMANCE MEASURES Figure 6 presents the relationship between our Livable Communities outcomes and the performance measures we propose to track our progress and evaluate results.
FIGURE 6. LIVABLE COMMUNITIES OUTCOMES AND PERFORMANCE MEASURES
Outcomes Performance Measures
1. Increased access to convenient and
affordable transportation choices
- Increase the number of transit boardings reported by urbanized area transit
providers from 10.0 billion in 2011 to 10.5 billion in 2016. FTA
- Increase the number of transit boardings reported by rural area transit
providers from 141 million in 2011 to 160 million in 2016. FTA
- Increase the transit “market share” among commuters to work in at least
10 of the top 50 urbanized areas by population, as compared to 2010
market share levels. FTA
- Increase the number of intercity rail passenger-miles traveled from
6.3 billion in 2010 to 7.2 billion in 2016. FRA
2. Improved networks that accommodate
pedestrians and bicycles
- Increase the number of States with policies that improve transportation
choices for walking, wheeling, and bicycling from 22 in 2011 to 27 in 2016.
FHWA
3. Improved access to transportation for
people with disabilities and older adults
- Increase the percent of rail stations (where Amtrak is responsible for com-
pliance) compliant with the ADA and Sec. 504 of the Rehabilitation Act of
1973 from 10 percent in 2010 to 100 percent in 2016. FRA
- Increase the number of key transit rail stations verified as accessible and
fully compliant from 522 in 2010 to 560 in 2016. FTA
- Increase in the number of States that have developed an Americans with
Disabilities Act (ADA) transition plan that is current and includes the public
rights-of-way from 11 States in 2011 to 19 in 2016. FHWA
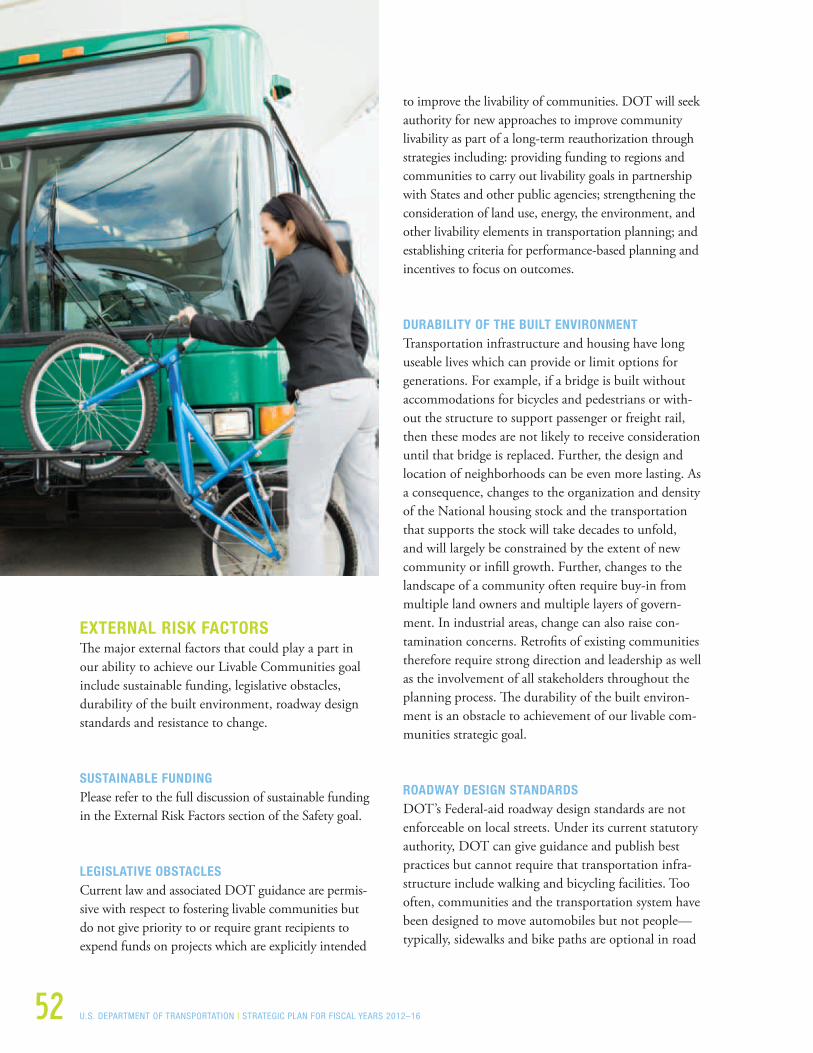
52 U.S. DEPARTMENT OF TRANSPORTATION | STRATEGIC PLAN FOR FISCAL YEARS 2012–16
EXTERNAL RISK FACTORS The major external factors that could play a part in our ability to achieve our Livable Communities goal include sustainable funding, legislative obstacles, durability of the built environment, roadway design standards and resistance to change.
SUSTAINABLE FUNDING Please refer to the full discussion of sustainable funding in the External Risk Factors section of the Safety goal.
LEGISLATIVE OBSTACLESCurrent law and associated DOT guidance are permis-sive with respect to fostering livable communities but do not give priority to or require grant recipients to expend funds on projects which are explicitly intended
to improve the livability of communities. DOT will seek authority for new approaches to improve community livability as part of a long-term reauthorization through strategies including: providing funding to regions and communities to carry out livability goals in partnership with States and other public agencies; strengthening the consideration of land use, energy, the environment, and other livability elements in transportation planning; and establishing criteria for performance-based planning and incentives to focus on outcomes.
DURABILITY OF THE BUILT ENVIRONMENTTransportation infrastructure and housing have long useable lives which can provide or limit options for generations. For example, if a bridge is built without accommodations for bicycles and pedestrians or with-out the structure to support passenger or freight rail, then these modes are not likely to receive consideration until that bridge is replaced. Further, the design and location of neighborhoods can be even more lasting. As a consequence, changes to the organization and density of the National housing stock and the transportation that supports the stock will take decades to unfold, and will largely be constrained by the extent of new community or infill growth. Further, changes to the landscape of a community often require buy-in from multiple land owners and multiple layers of govern-ment. In industrial areas, change can also raise con-tamination concerns. Retrofits of existing communities therefore require strong direction and leadership as well as the involvement of all stakeholders throughout the planning process. The durability of the built environ-ment is an obstacle to achievement of our livable com-munities strategic goal.
ROADWAY DESIGN STANDARDSDOT’s Federal-aid roadway design standards are not enforceable on local streets. Under its current statutory authority, DOT can give guidance and publish best practices but cannot require that transportation infra-structure include walking and bicycling facilities. Too often, communities and the transportation system have been designed to move automobiles but not people—typically, sidewalks and bike paths are optional in road

U.S. DEPARTMENT OF TRANSPORTATION | STRATEGIC PLAN FOR FISCAL YEARS 2012–16 53
construction. Where sidewalks do exist, they are often not well-connected or safely designed. Other barriers to livable communities include the lack of crosswalks, traffic signals with insufficient time for crossing, wide roads without medians, fast-moving traffic, long blocks, the lack of gridded streets, and narrow side-walks. Poor zoning, roadway, bike, and pedestrian design standards could impede achievement of our livable communities strategic goal.
RESISTANCE TO CHANGECommunity and institutional resistance to change—such as the change in transportation norms that will be needed to build livable communities—can be strong and pervasive. Obstacles to change include skepticism about the benefits of change, lack of knowledge about how the change would affect individuals or the com-munity, lack of community pressure to change, and lack of sustained leadership in the direction of change. Often the costs of change are immediate while the benefits are long-range, and this cost-benefit disparity reduces the political appeal of change.

54 U.S. DEPARTMENT OF TRANSPORTATION | STRATEGIC PLAN FOR FISCAL YEARS 2012–16
ENVIRONMENTAL SUSTAINABILITY
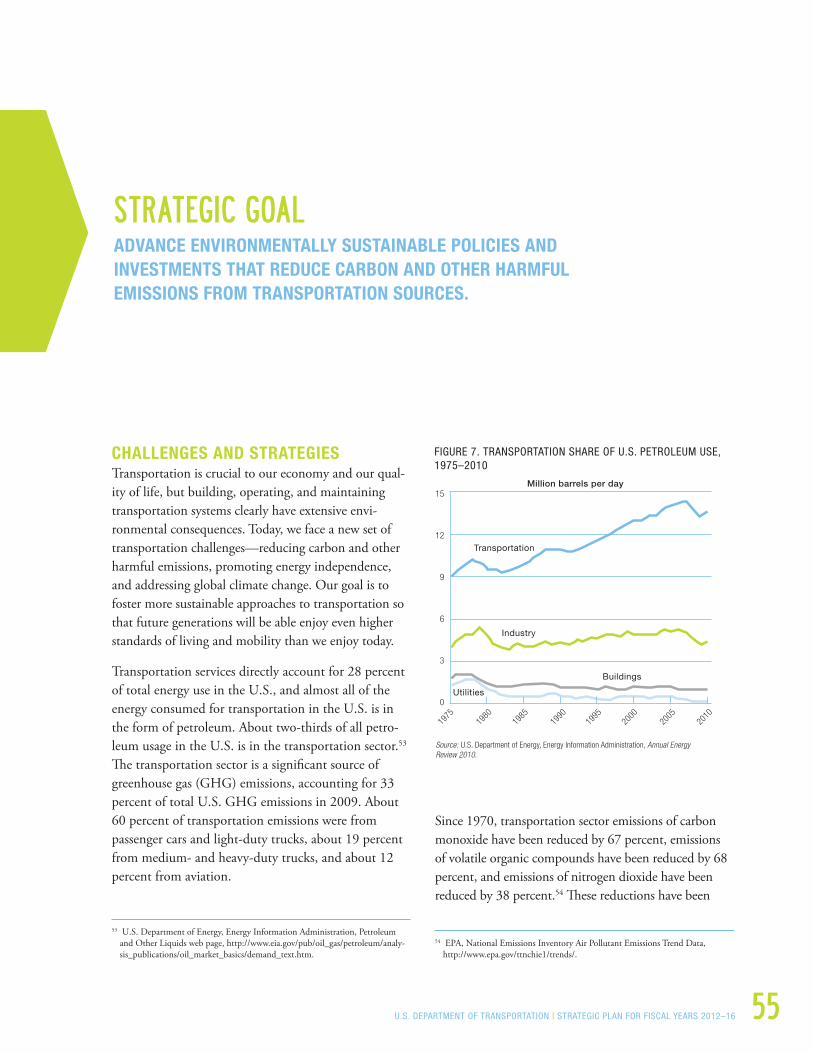
U.S. DEPARTMENT OF TRANSPORTATION | STRATEGIC PLAN FOR FISCAL YEARS 2012–16 55
STRATEGIC GOALADVANCE ENVIRONMENTALLY SUSTAINABLE POLICIES AND INVESTMENTS THAT REDUCE CARBON AND OTHER HARMFUL EMISSIONS FROM TRANSPORTATION SOURCES .
CHALLENGES AND STRATEGIESTransportation is crucial to our economy and our qual-ity of life, but building, operating, and maintaining transportation systems clearly have extensive envi-ronmental consequences. Today, we face a new set of transportation challenges—reducing carbon and other harmful emissions, promoting energy independence, and addressing global climate change. Our goal is to foster more sustainable approaches to transportation so that future generations will be able enjoy even higher standards of living and mobility than we enjoy today.
Transportation services directly account for 28 percent of total energy use in the U.S., and almost all of the energy consumed for transportation in the U.S. is in the form of petroleum. About two-thirds of all petro-leum usage in the U.S. is in the transportation sector.53 The transportation sector is a significant source of greenhouse gas (GHG) emissions, accounting for 33 percent of total U.S. GHG emissions in 2009. About 60 percent of transportation emissions were from passenger cars and light-duty trucks, about 19 percent from medium- and heavy-duty trucks, and about 12 percent from aviation.
53 U.S. Department of Energy, Energy Information Administration, Petroleum and Other Liquids web page, http://www.eia.gov/pub/oil_gas/petroleum/analy-sis_publications/oil_market_basics/demand_text.htm.
Million barrels per day
Industry
Buildings
Transportation
FIGURE 7. TRANSPORTATION SHARE OF U.S. PETROLEUM USE, 1975–2010
Source: U.S. Department of Energy, Energy Information Administration, Annual Energy Review 2010.
15
12
9
6
3
0
19751980
19851995
20002005
20101990
Utilities
Since 1970, transportation sector emissions of carbon monoxide have been reduced by 67 percent, emissions of volatile organic compounds have been reduced by 68 percent, and emissions of nitrogen dioxide have been reduced by 38 percent.54 These reductions have been
54 EPA, National Emissions Inventory Air Pollutant Emissions Trend Data, http://www.epa.gov/ttnchie1/trends/.
56 U.S. DEPARTMENT OF TRANSPORTATION | STRATEGIC PLAN FOR FISCAL YEARS 2012–16
achieved notwithstanding a 50 percent increase in the U.S. population, a tripling of GDP, and a 150 percent increase in passenger-miles traveled.55 Transportation sector emission reductions have been achieved largely by progressively strengthening regulation of vehicle and aircraft emissions under the Clean Air Act.
Nonetheless significant challenges remain, particularly as new, national ambient air quality standards are revised to be more protective of public health. As of 2007, some 158.5 million Americans lived in counties or regions that exceeded health-based, national ambient air quality stan-dards for at least one regulated air pollutant.
DOT’s emphasis on ecosystem approaches to deter-mining the environmental impact of transportation projects has promoted broader mitigation and conser-vation strategies—wetland acreage has been replaced at a rate exceeding impacts. However, DOT’s investments in transportation systems and infrastructure will be more sustainable by more broadly considering the sec-ondary effects of construction and land use. Although transportation projects comply with requirements for management of stormwater runoff, and Federal funds are available for restoration activities, more must be done to meet the challenge of reducing transportation’s contribution to water quality problems.
President Obama has recognized the vital role that DOT can play in reducing carbon emissions, improv-ing energy efficiency, and combating climate change. The President has challenged us to transform the way transportation serves the American people by encour-aging transportation that is less carbon-intensive—transit, car- and van-pooling, intercity passenger buses, rail—and active transportation that produces zero emissions like biking and walking.
STRATEGIES TO REDUCE CARBON EMISSIONS, IMPROVE ENERGY EFFICIENCY AND REDUCE DEPENDENCE ON OIL DOT is working across all modes to improve the energy and environmental performance of the trans-portation sector. The aviation industry has made
55 BTS, National Transportation Statistics.
significant gains in fuel efficiency, with commercial jet aircraft fuel efficiency improvements of 70 percent over the last 40 years. Since 2000, despite increasing passenger and air traffic, the commercial aviation sector is consuming less fuel than it did at the beginning of the decade.
DOT supports the conversion of airport ground vehicles to alternative fuels, and sponsors the Com-mercial Aviation Alternative Fuels Initiative focused on achieving sustainable fuels for commercial aircraft.56 DOT’s FAA has launched the Continuous Lower Energy, Emissions and Noise (CLEEN) program that will accelerate development of new engine and airframe technologies to advance alternative fuels, and reduce noise, emissions, and energy consumption.
DOT and the Environmental Protection Agency (EPA) have worked closely with auto manufacturers, the State of California, environmental groups and other stake-holders to develop a series of programs to increase fuel economy for the Nation’s vehicle fleet.
56 Alternative fuels include non-conventional fuels (including biofuels such as biodiesel or ethanol, hydrogen, electricity-storing batteries, fuel cells), often with improved environmental footprints, that are derived from non-petroleum sources.
Transportation systems are on the
front lines in the struggle to make our
Nation’s economy more sustainable .
Transportation accounts for 71 percent
of U .S . petroleum consumption, and
about 28 percent of U .S . greenhouse
gas emissions . We need to improve
the energy and environmental perfor-
mance of the transportation sector, so
that it can continue to provide mobility
for the public and the economy .
TRANSPORTATION DEPUTY SECRETARY JOHN D. PORCARI
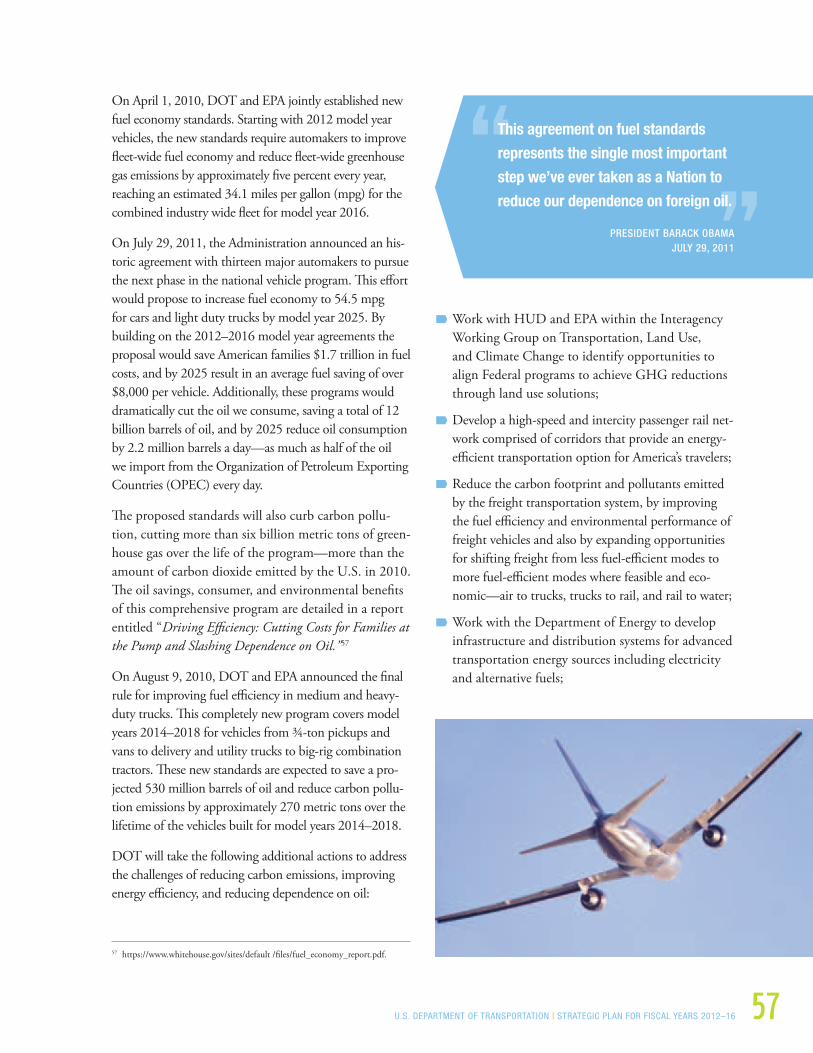
U.S. DEPARTMENT OF TRANSPORTATION | STRATEGIC PLAN FOR FISCAL YEARS 2012–16 57
On April 1, 2010, DOT and EPA jointly established new fuel economy standards. Starting with 2012 model year vehicles, the new standards require automakers to improve fleet-wide fuel economy and reduce fleet-wide greenhouse gas emissions by approximately five percent every year, reaching an estimated 34.1 miles per gallon (mpg) for the combined industry wide fleet for model year 2016.
On July 29, 2011, the Administration announced an his-toric agreement with thirteen major automakers to pursue the next phase in the national vehicle program. This effort would propose to increase fuel economy to 54.5 mpg for cars and light duty trucks by model year 2025. By building on the 2012–2016 model year agreements the proposal would save American families $1.7 trillion in fuel costs, and by 2025 result in an average fuel saving of over $8,000 per vehicle. Additionally, these programs would dramatically cut the oil we consume, saving a total of 12 billion barrels of oil, and by 2025 reduce oil consumption by 2.2 million barrels a day—as much as half of the oil we import from the Organization of Petroleum Exporting Countries (OPEC) every day.
The proposed standards will also curb carbon pollu-tion, cutting more than six billion metric tons of green-house gas over the life of the program—more than the amount of carbon dioxide emitted by the U.S. in 2010. The oil savings, consumer, and environmental benefits of this comprehensive program are detailed in a report entitled “Driving Efficiency: Cutting Costs for Families at the Pump and Slashing Dependence on Oil.”57
On August 9, 2010, DOT and EPA announced the final rule for improving fuel efficiency in medium and heavy-duty trucks. This completely new program covers model years 2014–2018 for vehicles from ¾-ton pickups and vans to delivery and utility trucks to big-rig combination tractors. These new standards are expected to save a pro-jected 530 million barrels of oil and reduce carbon pollu-tion emissions by approximately 270 metric tons over the lifetime of the vehicles built for model years 2014–2018.
DOT will take the following additional actions to address the challenges of reducing carbon emissions, improving energy efficiency, and reducing dependence on oil:
57 https://www.whitehouse.gov/sites/default /files/fuel_economy_report.pdf.
Work with HUD and EPA within the Interagency Working Group on Transportation, Land Use, and Climate Change to identify opportunities to align Federal programs to achieve GHG reductions through land use solutions;
Develop a high-speed and intercity passenger rail net-work comprised of corridors that provide an energy-efficient transportation option for America’s travelers;
Reduce the carbon footprint and pollutants emitted by the freight transportation system, by improving the fuel efficiency and environmental performance of freight vehicles and also by expanding opportunities for shifting freight from less fuel-efficient modes to more fuel-efficient modes where feasible and eco-nomic—air to trucks, trucks to rail, and rail to water;
Work with the Department of Energy to develop infrastructure and distribution systems for advanced transportation energy sources including electricity and alternative fuels;
This agreement on fuel standards
represents the single most important
step we’ve ever taken as a Nation to
reduce our dependence on foreign oil .
PRESIDENT BARACK OBAMAJULY 29, 2011
58 U.S. DEPARTMENT OF TRANSPORTATION | STRATEGIC PLAN FOR FISCAL YEARS 2012–16
Implement new regulations applying integrity management principles to natural gas distribution pipelines, which will help identify and manage risks including methane leaks, and explore possible methods for measuring and controlling releases;
Work through DOT’s virtual Center for Climate Change to coordinate climate-related activities, research and products with the climate experts throughout the Department. Work under way includes implementation of the Council on Environmental Quality’s (CEQ’s) climate adapta-tion implementing instructions, and editing the Vulnerability Assessment due to CEQ in March, 2012. The Center also completed phase I of the Gulf Coast Study and is continuing research on the second phase. The Center is supporting DOT’s work on the National Climate Assessment by reviewing DOT’s technical paper, supporting a related workshop for stakeholders, and reaching out to other modal stakeholders about the assess-ment. The Center is supporting DOT’s participa-tion in the Global Change Research Program’s working groups;
Work with the International Civil Aviation Orga-nization (ICAO) to advance international aircraft and engine emissions standards, and to recommend practices and guidance materials for solutions that are technologically feasible, economically reason-able, provide measurable benefits, do not adversely affect safety, and take interdependencies between emissions and noise into account;58
Promote maturation of technologies which lower aircraft energy consumption, emissions and noise through the CLEEN (Continuous Lower Energy, Emissions and Noise) program;59
58 For example, FAA is conducting a study to identify and assess metrics for CO2 emissions from aircraft which may potentially be used to set standards for the certification of new aircraft (including the benchmarking of existing aircraft) and to monitor the operational performance of the commercial aircraft fleet. The results of the study will be provided within the work program of ICAO’s Committee on Aviation Environmental Protection for considering development of the aircraft CO2 standard by the end of 2012.
59 Commercial Aviation Alternative Fuels Initiative (CAAFI) is a forum for the U.S. commercial aviation community to engage the emerging alternative fuels industry and to work together, share and collect needed data, and direct research on aviation alternative fuels.
Improve operational solutions in aviation that include Optimum Profile Descents/Continuous Descent Arrivals, airport surface movement opti-mization, and enroute and terminal area traffic optimization for energy efficiency and reduction in aircraft noise and emissions;
Conduct research into V2V and V2I technolo-gies and the potential to gather and use data from vehicles on emissions and fuel consumption to better manage the transportation network for reduc-tion in greenhouse gases;
Advance the Aviation Climate Change Research Initiative to understand the impacts of high-altitude aircraft emissions, and expand international engage-ment on reducing aviation emissions by working with ICAO in coordination with the Department of State and the EPA;
Promote the deployment of technologies—such as hydrogen fuel cell and diesel-electric hybrid buses—that reduce the energy consumption and greenhouse gas emissions of transit systems;
Support infrastructure investment for alternative fuels for transit and bus rapid transit systems; and
Provide technical assistance and incentives to States and MPOs on strategies that reduce GHG such as: innovative land use/transportation modeling; travel forecasting data collection and analysis techniques; system efficiency improvements; coordination of transportation and land use planning; improved availability of public transportation, sidewalks and bike paths; and on how to incorporate climate change considerations such as flooding into plan-ning and funding processes.
STRATEGIES TO REDUCE TRANSPORTATION-RELATED AIR, WATER AND NOISE POLLUTION AND IMPACTS ON ECOSYSTEMSMaking transportation more sustainable requires reducing its impact on human health and ecosystems. This calls for reducing emissions of urban air pollut-ants, reducing water and noise pollution, and reducing waste from transportation sources. To accomplish these objectives, DOT will:
U.S. DEPARTMENT OF TRANSPORTATION | STRATEGIC PLAN FOR FISCAL YEARS 2012–16 59
Advance multi-jurisdictional and regional decision-making that enables States and local communities to take a broader view of how their transportation systems integrate into longer haul freight move-ments so that, potentially, they could collaboratively and more effectively use rail or maritime options in partnership with the private sector;
Promote the smart use of ITS technologies to decrease air pollution by maximizing the efficient movement of goods and people across the entire transportation network, using Applications for the Environment: Real-Time Information Synthesis (AERIS) data to facilitate “green” transportation choices by transportation system users and operators;
Promote the smart use of ITS technologies in trans-portation operations to reduce the over applica-tion of road treatment chemicals during inclement weather situations, through the ITS Technology Transfer, Technical Assistance, and Professional Capacity Building programs;
Promote the use of bike/pedestrian modalities for daily activities through investment in on- and off-street bike/pedestrian infrastructure;
Inspect hazardous liquid pipeline systems and operators to ensure they are following the sound integrity management practices described in new rules, advance the safety of pipeline control room operations, and lead the national program for pipe-line damage prevention; and
Modernize the U.S. air transportation system through NextGen by setting investment and infrastructure pri-orities, and developing new airport design standards to support NextGen energy and environmental goals that will result in cleaner and quieter movement of aircraft in the air and on the ground.
DOT will advocate for expansion of the marine high-way system to meet current and projected movements of domestic and international trade. Shipments via the marine highway system permit the movement of more cargo containers per trip because barge and ship freight container constructs are not constrained by over-the-road weight limits. These shipments also reduce fuel
use and the emissions generated on a per ton basis to move the cargo. Marine highways can be an efficient conduit for shipping hazardous materials and other cargo which may not easily travel by road or rail. In many instances hazardous materials can be routed to avoid city centers, thus lessening general population exposure to potential hazardous spills. To expand the marine highway system, DOT will:
Work with industry stakeholders and the U.S. Army Corps of Engineers to maintain the capability of the inland lock and waterway system; and
Promote greater usage of America’s marine highways through the MARAD Marine Highway program, where appropriate.
STRATEGIES TO INCREASE THE USE OF ENVIRONMENTALLY SUSTAINABLE PRACTICES IN THE TRANSPORTATION SECTOR Our goal is to make both the U.S. transportation system and DOT’s operations more sustainable by increasing the efficiency of transportation systems which will in turn reduce the negative environmental effects of transportation and also reduce the use of scarce resources. This goal is most effectively achieved by changing the way that our transportation systems are planned, designed, and operated. Specifically, DOT will:
Encourage and support research toward more sus-tainable transportation materials, construction, and infrastructure;
Promote best practices that increase sustainability in transportation planning, construction, operation, and maintenance;
Advocate the use of environmental management systems as tools to increase the sustainability of airports, highways, navigation aids, ports, transit systems, and other transportation facilities;
Encourage industry to develop and implement innovative technologies that are more sustainable, and apply lifecycle analysis to products and pro-cesses; and
Conduct exploratory advanced research that pro-motes a more environmentally friendly highway
60 U.S. DEPARTMENT OF TRANSPORTATION | STRATEGIC PLAN FOR FISCAL YEARS 2012–16
template that not only mitigates environmental impacts, but actually works to reduce environmen-tal pollution. For example, DOT will work to make the highway infrastructure more environmentally friendly by expanding the research and use of recy-clable techniques, renewable materials, permeable surfaces, innovative techniques to mitigate storm-water runoff, and the use of transportation rights-of-way to contribute to improvements in air quality and electricity generation.
STRATEGIES TO REDUCE POLLUTION FROM DOT OWNED OR CONTROLLED TRANSPORTATION SERVICES AND FACILITIES In accordance with President Obama’s October 5, 2009, Executive Order 13514, “Federal Leadership in Environmental, Energy, and Economic Performance,” DOT will work to: increase energy efficiency; reduce GHG emissions; conserve water resources; eliminate waste, and prevent pollution; leverage acquisitions to foster markets for sustainable technologies and envi-
ronmentally preferable materials; operate high-perfor-mance sustainable buildings; strengthen the livability of the communities in which DOT facilities are located; and involve our employees in the achievement of these goals. Accordingly, DOT will:
Develop and implement a Strategic Sustainability Performance Plan that integrates achievement of EO 13514 goals with DOT’s strategic goals to optimize performance and minimize implementation costs;
Implement Environmental Management Systems to address environmental, energy and sustainability issues strategically;
Become a certified bike-friendly employer;
Promote electronics stewardship by: (1) ensuring procurement preference for EPEAT-registered, Energy Star, and FEMP-designated electronic products; (2) establishing and implementing poli-cies to enable power management, duplex printing, and other energy-efficient or environmentally pref-erable features on all eligible electronic products;

U.S. DEPARTMENT OF TRANSPORTATION | STRATEGIC PLAN FOR FISCAL YEARS 2012–16 61
(3) employing environmentally sound practices with respect to the disposition of all excess or surplus electronic products; and (4) establish-ing policies to extend the useful life of electronic equipment;
Ensure that all new construction, renovation, or repair and alteration of buildings complies with the Guiding Principles for Federal Leadership in High Performance and Sustainable Buildings and that DOT makes annual progress toward 100-percent conformance with the Guiding Principles for its occupied buildings;
Implement the 2030 net-zero-energy building requirement for all new buildings that begin the design process in 2020 and thereafter;
Implement the guidance for sustainable Federal build-ing locations developed with HUD, EPA and GSA;
Work with HUD and EPA to develop guidance for sustainable Federal building locations in alignment with Livability Principles;
Encourage web/video conferencing, collaboration and dissemination to reduce staff travel requirements;
Maximize recycling and use of recycled materials;
Eliminate use of paper whenever possible by shifting to electronic publications where possible, moving to electronic platforms instead of ferrying paper documents around the Department, and, when printing is required, using sustainable products and approaches;
Conduct its ship recycling program for obsolete, federally-owned, merchant-type vessels in an environ-mentally responsible manner that further reduces the risk of environmental contamination; and
Conduct maritime environment and compliance activities that address improving marine air emis-sions, energy efficiency and alternative energy usage, and conduct cooperative efforts to advance develop-ment of effective ballast water treatment systems and compliance monitoring methods.
RESOURCESThe human resources, programs, capital assets, infor-mation technology, and other resources described in DOT’s Annual Performance Budgets are needed to achieve our outcomes for environmentally sustainable transportation and to execute the strategies presented above. The schedule for executing these strategies extends from fiscal year 2012 through fiscal year 2016.
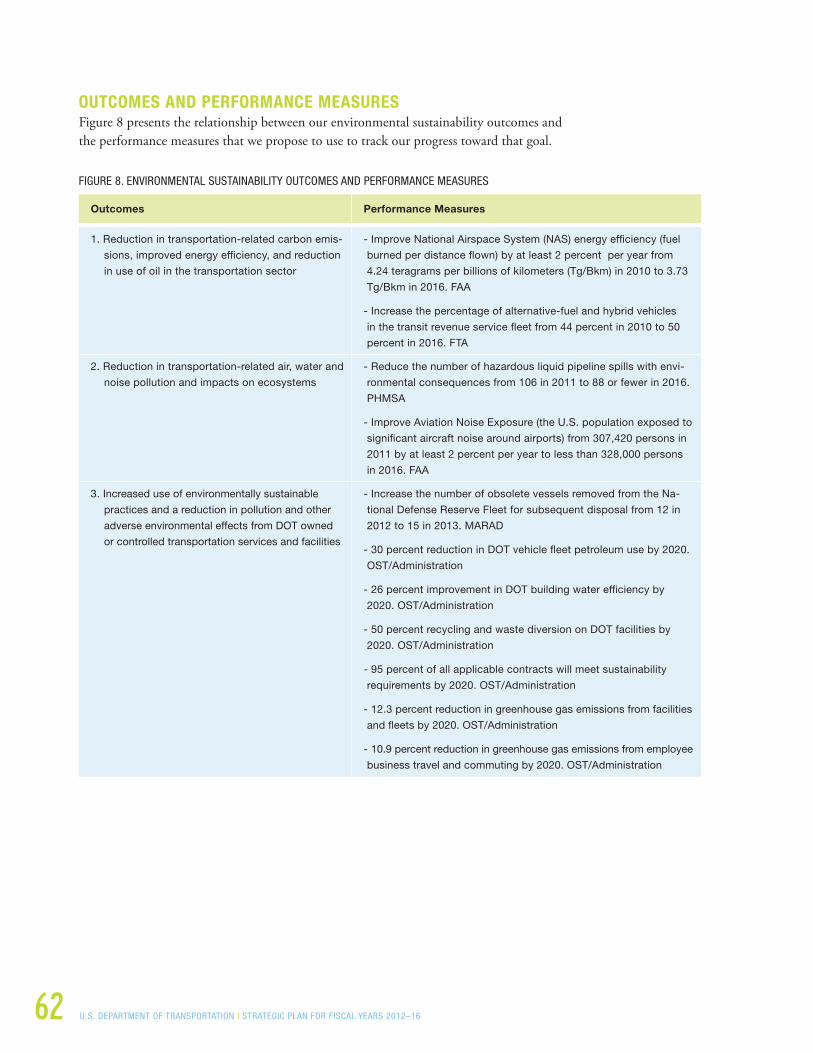
62 U.S. DEPARTMENT OF TRANSPORTATION | STRATEGIC PLAN FOR FISCAL YEARS 2012–16
OUTCOMES AND PERFORMANCE MEASURESFigure 8 presents the relationship between our environmental sustainability outcomes and the performance measures that we propose to use to track our progress toward that goal.
FIGURE 8. ENVIRONMENTAL SUSTAINABILITY OUTCOMES AND PERFORMANCE MEASURES
Outcomes Performance Measures
1. Reduction in transportation-related carbon emis-
sions, improved energy efficiency, and reduction
in use of oil in the transportation sector
- Improve National Airspace System (NAS) energy efficiency (fuel
burned per distance flown) by at least 2 percent per year from
4.24 teragrams per billions of kilometers (Tg/Bkm) in 2010 to 3.73
Tg/Bkm in 2016. FAA
- Increase the percentage of alternative-fuel and hybrid vehicles
in the transit revenue service fleet from 44 percent in 2010 to 50
percent in 2016. FTA
2. Reduction in transportation-related air, water and
noise pollution and impacts on ecosystems
- Reduce the number of hazardous liquid pipeline spills with envi-
ronmental consequences from 106 in 2011 to 88 or fewer in 2016.
PHMSA
- Improve Aviation Noise Exposure (the U.S. population exposed to
significant aircraft noise around airports) from 307,420 persons in
2011 by at least 2 percent per year to less than 328,000 persons
in 2016. FAA
3. Increased use of environmentally sustainable
practices and a reduction in pollution and other
adverse environmental effects from DOT owned
or controlled transportation services and facilities
- Increase the number of obsolete vessels removed from the Na-
tional Defense Reserve Fleet for subsequent disposal from 12 in
2012 to 15 in 2013. MARAD
- 30 percent reduction in DOT vehicle fleet petroleum use by 2020.
OST/Administration
- 26 percent improvement in DOT building water efficiency by
2020. OST/Administration
- 50 percent recycling and waste diversion on DOT facilities by
2020. OST/Administration
- 95 percent of all applicable contracts will meet sustainability
requirements by 2020. OST/Administration
- 12.3 percent reduction in greenhouse gas emissions from facilities
and fleets by 2020. OST/Administration
- 10.9 percent reduction in greenhouse gas emissions from employee
business travel and commuting by 2020. OST/Administration
U.S. DEPARTMENT OF TRANSPORTATION | STRATEGIC PLAN FOR FISCAL YEARS 2012–16 63
EXTERNAL RISK FACTORS There is still a great deal of political and policy debate about the best way to address the environmental chal-lenges posed by our transportation system, especially its effects on climate change, and the potential costs of migrating transportation from fossil-based energy to other alternatives. Working on a 20 to 40 year horizon, it is possible to predict an orderly transition to a variety of fuels that include fuel cells and hybrid fuel cells, battery, electric, hydrogen, green diesels and gasolines. Using shorter timelines, the risks become more severe. The shorter the time for the transition, the higher the risks and the greater the likelihood of failure. The major risks are related to technology and the lack of delivery infrastructure.
TECHNOLOGYWe do not have the fuel cells, batteries or hydrogen engines that can provide travel distances equal to a tank of fossil fuel. Current passenger-vehicle battery tech-nologies provide less than 100 miles on a single charge, far below consumers’ expectations of a 250–300 mile range. With the exception of 10 percent ethanol (E10) and 5 percent biodiesel (B5), the requisite codes and standards are not in place that would allow the travel-ing public or commercial carriers to use alternative fuels. These codes and standards govern a wide variety of topics including safety, emergency response, and engine warranties.
LACK OF DELIVERY INFRASTRUCTUREResearchers are currently grappling with the technical challenges of adding alcohols and bio-oils to the petro-leum infrastructure. High concentrations of these addi-tives create corrosion and contamination issues that are solvable in the mid-term. There is extremely limited infrastructure for hydrogen fuels, and it will take decades to create it. For example, there are fewer than 60 hydrogen-fueling stations in the Nation, and of these, 40 are in California. In addition, at present, only a limited number of natural gas pipelines can move hydrogen over distances. While some vehicle manufac-turers are introducing all electric vehicles that have zero GHG emissions at the tailpipe, consumer adoption will be hampered by the lack of charging stations. Without an expansion of charging stations, electric vehicles will be limited to dense urban areas where drivers travel minimal distances.
64 U.S. DEPARTMENT OF TRANSPORTATION | STRATEGIC PLAN FOR FISCAL YEARS 2012–16
THE UNITED STATES DEPARTMENT OF TRANSPORTATION
HTTP://WWW .DOT .GOVDOT occupies a leadership role in global transportation with nearly 57,000 dedicated professionals stationed in the U.S. and around the world. Since its first official day of operation in 1967, DOT’s programs have evolved to meet the social and economic demands of the Nation.
DOT’s mission is described in its original enabling legislation: “The national objectives of general welfare, economic growth and stability, and the security of the United States require the development of transportation policies and programs that contribute to providing fast, safe, efficient, and convenient transportation at the lowest cost, consistent with those and other national objectives, including the efficient use and conservation of the resources of the United States.”60
60 Section 101 of Title 49, U.S.C.
Today, DOT is composed of the Office of the Secretary, the Surface Transportation Board,61 the Office of the Inspector General, and the 10 operating administra-tions listed below.
Federal Aviation Administration
Federal Highway Administration
Federal Motor Carrier Safety Administration
Federal Railroad Administration
Federal Transit Administration
Maritime Administration
National Highway Traffic Safety Administration
Pipeline and Hazardous Materials Safety Administration
Research and Innovative Technology Administration
Saint Lawrence Seaway Development Corporation
61 With passage of the Interstate Commerce Commission Termination Act of 1995 (P.L.No.104-88), Congress established the Surface Transportation Board within DOT, effective January 1, 1996. While formally part of DOT, the Board is decisionally independent of DOT and by law, “…shall not be responsible to or subject to the supervision or direction…of any other part of the Department of Transportation.” (49 U.S.C. 703(c)).

U.S. DEPARTMENT OF TRANSPORTATION | STRATEGIC PLAN FOR FISCAL YEARS 2012–16 65
ORGANIZATIONAL EXCELLENCE GOAL
DEVELOP A DIVERSE AND COLLABORATIVE WORKFORCE THAT WILL ENABLE THE DEPARTMENT TO ADVANCE A TRANSPORTATION SYSTEM THAT SERVES THE NATION’S LONG-TERM SOCIAL, ECONOMIC, SECURITY, AND ENVIRONMENTAL NEEDS .
We believe that a dedicated and talented workforce is the key to DOT’s ability to foster a multimodal transportation system that provides travelers and busi-nesses with safe, secure, efficient, and environmentally sustainable transportation choices.
Our goal is for our current and potential employees to consider DOT the Best Place to Work in the Federal Government. Therefore, to improve employee satisfac-tion, reduce turnover, and attract a high-performance workforce we will:
Develop a positive work environment with a vibrant public service culture through frequent town hall meetings with the Secretary and Deputy Secretary, and open communication channels that enable DOT employees to collaborate, brainstorm and share ideas to make DOT a better organization;
Promote diversity, equal employment opportunity, and affirmative employment for underrepresented groups at DOT, including increasing the number of people with disabilities employed at DOT at all levels;
Work with stakeholders to determine the skills, educational, and occupational requirements of the future transportation workforce and implement a national workforce development strategy to meet the demands of the rapidly changing 21st century transportation system;
Ensure all employees adhere to all standards of ethical conduct;
Link employee performance to strategic goals;
Hold mandatory training for all first-line supervi-sors which will focus on the fundamental compe-tencies of effective leadership, empowerment, and employee engagement;
Implement processes which will improve acquisi-tions and contract management;
Implement the June 13, 2011 Executive Order (EO): Delivering an Efficient, Effective and Accountable Government; and
Work with local government entities to improve transit service and neighborhood amenities around DOT field offices and headquarters.
DEFENSE MOBILITY AND EMERGENCY PREPAREDNESS Defense mobility and emergency preparedness are criti-cal in ensuring the availability of transportation services after natural disasters and in times of national emer-gency. To maintain transportation services under these conditions, DOT will:
Develop a security policy to ensure personnel and facility security and preparedness, mitigate the con-sequences of transportation sector emergencies, and support DOT’s mission;
Assure continuity of operations and maintain emergency operations and response capabilities to respond effectively to incidents and fulfill our

66 U.S. DEPARTMENT OF TRANSPORTATION | STRATEGIC PLAN FOR FISCAL YEARS 2012–16
commitments under Presidential Directives and the National Response Framework;
Maintain government-owned transportation assets, and provide access to commercial transportation assets for critical support for defense mobility and emergency response;
Ensure that funded assets are wheelchair accessible, meet the diverse functional needs of people with disabilities and older adults, and are integrated into State and local governments’ emergency response, exercises, and drills;
Advance modal redundancy as a strategic national transportation and homeland security objective, with intercity passenger rail as a critical element;
Coordinate with DHS/FEMA to provide security and emergency management training, technical assistance and information sharing to transit agen-cies including the evacuation or shelter in place of persons with disabilities and persons that are Limited English Proficient;
Collaborate with DHS to ensure that the design and refurbishment of transportation infrastructure includes consideration of built-in protection and security measures;
Coordinate with DHS to address security threats to oil and natural gas pipelines and to the movement of hazardous materials;
Through grants and technical assistance, help State and local response agencies plan and train for effec-tive emergency response to transportation incidents involving hazardous materials;
Provide guidance and technical assistance to locali-ties, State DOTs and their first response partners to improve their ability to conduct emergency response;
Improve aviation command, control and commu-nications for service 24 hours a day/7 days a week, and during emergency operations by strengthen-ing operational coordination, communication, and command and control capabilities needed to prepare for, respond to, and recover from crises and by improving the security of data and information using advanced cyber defense strategies;
Communicate timely, relevant, expert intelligence analysis that focuses on preparedness efforts, supports operational response, and international programs, and fulfills technical requests from the Intelligence and Law Enforcement Communities;
Document and report on behavior that may be indicative of intelligence gathering or pre-opera-tional planning related to terrorism, criminal, or other illicit intention;
Issue advisory messages as necessary to Federal, State, local, tribal, and foreign governments as well as the private sector that provide immediate or urgent information on time sensitive threats or situ-ations that may impact local security environments and may require responsive activity;
Implement the Controlled Unclassified Information (CUI) Framework and monitor compliance with policy, standards, and markings; and
Fulfill DOT commitments to international partners and agreements, such as the Asia-Pacific Economic Cooperation (APEC) forum, and the North Atlan-tic Treaty Organization (NATO).
OPEN GOVERNMENTDOT will incorporate the three principles of open government—transparency, participation, and collabo-ration—in our daily work. To achieve a vibrant, open government culture, DOT will:
Use ONE DOT decision-making via cross-modal work groups to achieve our strategic goals;
Implement EO 13563, “Improving Regulations and Regulatory Review,” by using a variety of innovative techniques to encourage the public to identify rules that should be modified or revoked because they are outmoded, ineffective, insufficient, or excessively burdensome;
Adopt a work culture that advances open govern-ment principles by increasing transparency and encouraging collaboration in DOT programs, policies, funding, management and other matters of importance to the public;

U.S. DEPARTMENT OF TRANSPORTATION | STRATEGIC PLAN FOR FISCAL YEARS 2012–16 67
Achieve greater public participation in rulemaking to better inform DOT action by exploring the effective-ness of various Web 2.0 technologies to increase pub-lic awareness and understanding of the rulemaking process, increase collaboration among commenters, and ultimately increase the quality and usefulness of comments received on DOT rulemakings;
Make the case for strategic investment by using valid, reliable, and timely data supported by robust analysis to tell the DOT story;
Apply knowledge management and collaboration principles across DOT by providing platforms for employees to be more open in their work;
Enable proactive, responsive, agile, transparent, secure and integrated technology adoption and infrastructure life cycle for communications, col-laboration, community building, business intelli-gence, geo-spatial mapping and transparency;
Manage IT assets and data for increased produc-tivity, reduced costs for investment management, records management, data sharing, collaboration, reuse, and informed decision-making.
FINANCIAL PERFORMANCETo improve financial management and provide quality customer service, DOT will:
Ensure strategic, continuously-improving, secure and efficient storage and exchange of critical information;
Improve efficiency and transparency of procurement processes using online-workflow, contract review boards, peer reviews, and shared best practices;
Improve the administration, oversight, transparency and management of DOT’s traditional grants and its portfolio of discretionary grants;
Maximize efficiencies through proactive assessments of investment vs. output/outcomes; and
Ensure performance driven programs, consistent with Office of Management and Budget Memo-randum 10–01, “Increased Emphasis on Program Evaluations.”
The era of government as a ‘big black
box’ is rapidly drawing to a close . In
its place, we’re taking full advantage
of the latest generation of information
technology to make our vast store of
data and information available—and
intelligible—to the public .
TRANSPORTATION DEPUTY SECRETARY JOHN D. PORCARI
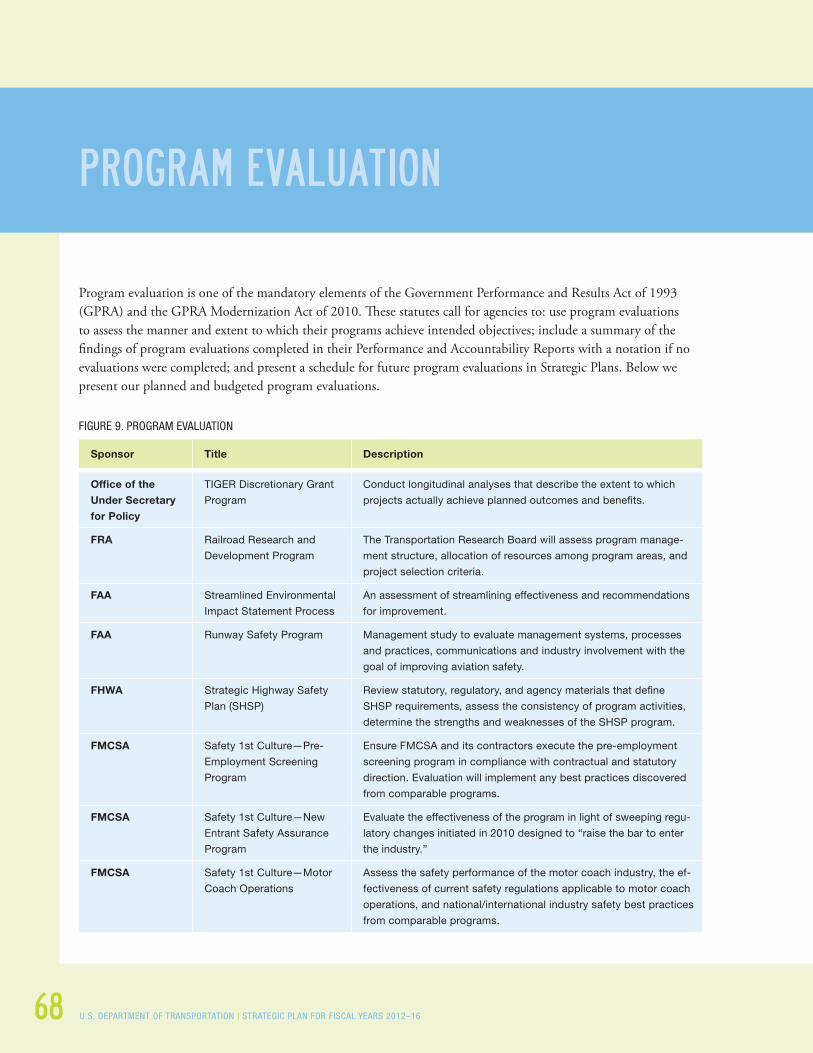
68 U.S. DEPARTMENT OF TRANSPORTATION | STRATEGIC PLAN FOR FISCAL YEARS 2012–16
PROGRAM EVALUATION
Program evaluation is one of the mandatory elements of the Government Performance and Results Act of 1993 (GPRA) and the GPRA Modernization Act of 2010. These statutes call for agencies to: use program evaluations to assess the manner and extent to which their programs achieve intended objectives; include a summary of the findings of program evaluations completed in their Performance and Accountability Reports with a notation if no evaluations were completed; and present a schedule for future program evaluations in Strategic Plans. Below we present our planned and budgeted program evaluations.
FIGURE 9. PROGRAM EVALUATION
Sponsor Title Description
Office of the
Under Secretary
for Policy
TIGER Discretionary Grant
Program
Conduct longitudinal analyses that describe the extent to which
projects actually achieve planned outcomes and benefits.
FRA Railroad Research and
Development Program
The Transportation Research Board will assess program manage-
ment structure, allocation of resources among program areas, and
project selection criteria.
FAA Streamlined Environmental
Impact Statement Process
An assessment of streamlining effectiveness and recommendations
for improvement.
FAA Runway Safety Program Management study to evaluate management systems, processes
and practices, communications and industry involvement with the
goal of improving aviation safety.
FHWA Strategic Highway Safety
Plan (SHSP)
Review statutory, regulatory, and agency materials that define
SHSP requirements, assess the consistency of program activities,
determine the strengths and weaknesses of the SHSP program.
FMCSA Safety 1st Culture—Pre-
Employment Screening
Program
Ensure FMCSA and its contractors execute the pre-employment
screening program in compliance with contractual and statutory
direction. Evaluation will implement any best practices discovered
from comparable programs.
FMCSA Safety 1st Culture—New
Entrant Safety Assurance
Program
Evaluate the effectiveness of the program in light of sweeping regu-
latory changes initiated in 2010 designed to “raise the bar to enter
the industry.”
FMCSA Safety 1st Culture—Motor
Coach Operations
Assess the safety performance of the motor coach industry, the ef-
fectiveness of current safety regulations applicable to motor coach
operations, and national/international industry safety best practices
from comparable programs.
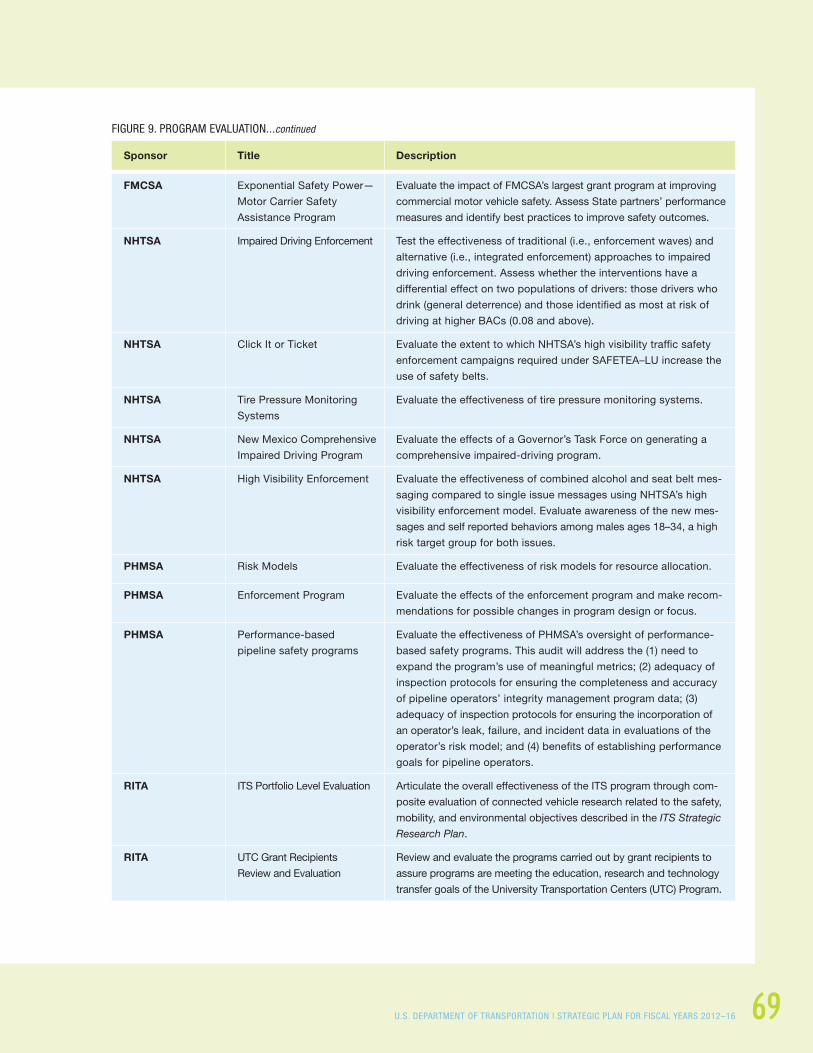
U.S. DEPARTMENT OF TRANSPORTATION | STRATEGIC PLAN FOR FISCAL YEARS 2012–16 69
FIGURE 9. PROGRAM EVALUATION...continued
Sponsor Title Description
FMCSA Exponential Safety Power—
Motor Carrier Safety
Assistance Program
Evaluate the impact of FMCSA’s largest grant program at improving
commercial motor vehicle safety. Assess State partners’ performance
measures and identify best practices to improve safety outcomes.
NHTSA Impaired Driving Enforcement Test the effectiveness of traditional (i.e., enforcement waves) and
alternative (i.e., integrated enforcement) approaches to impaired
driving enforcement. Assess whether the interventions have a
differential effect on two populations of drivers: those drivers who
drink (general deterrence) and those identified as most at risk of
driving at higher BACs (0.08 and above).
NHTSA Click It or Ticket Evaluate the extent to which NHTSA’s high visibility traffic safety
enforcement campaigns required under SAFETEA–LU increase the
use of safety belts.
NHTSA Tire Pressure Monitoring
Systems
Evaluate the effectiveness of tire pressure monitoring systems.
NHTSA New Mexico Comprehensive
Impaired Driving Program
Evaluate the effects of a Governor’s Task Force on generating a
comprehensive impaired-driving program.
NHTSA High Visibility Enforcement Evaluate the effectiveness of combined alcohol and seat belt mes-
saging compared to single issue messages using NHTSA’s high
visibility enforcement model. Evaluate awareness of the new mes-
sages and self reported behaviors among males ages 18–34, a high
risk target group for both issues.
PHMSA Risk Models Evaluate the effectiveness of risk models for resource allocation.
PHMSA Enforcement Program Evaluate the effects of the enforcement program and make recom-
mendations for possible changes in program design or focus.
PHMSA Performance-based
pipeline safety programs
Evaluate the effectiveness of PHMSA’s oversight of performance-
based safety programs. This audit will address the (1) need to
expand the program’s use of meaningful metrics; (2) adequacy of
inspection protocols for ensuring the completeness and accuracy
of pipeline operators’ integrity management program data; (3)
adequacy of inspection protocols for ensuring the incorporation of
an operator’s leak, failure, and incident data in evaluations of the
operator’s risk model; and (4) benefits of establishing performance
goals for pipeline operators.
RITA ITS Portfolio Level Evaluation Articulate the overall effectiveness of the ITS program through com-
posite evaluation of connected vehicle research related to the safety,
mobility, and environmental objectives described in the ITS Strategic
Research Plan.
RITA UTC Grant Recipients
Review and Evaluation
Review and evaluate the programs carried out by grant recipients to
assure programs are meeting the education, research and technology
transfer goals of the University Transportation Centers (UTC) Program.
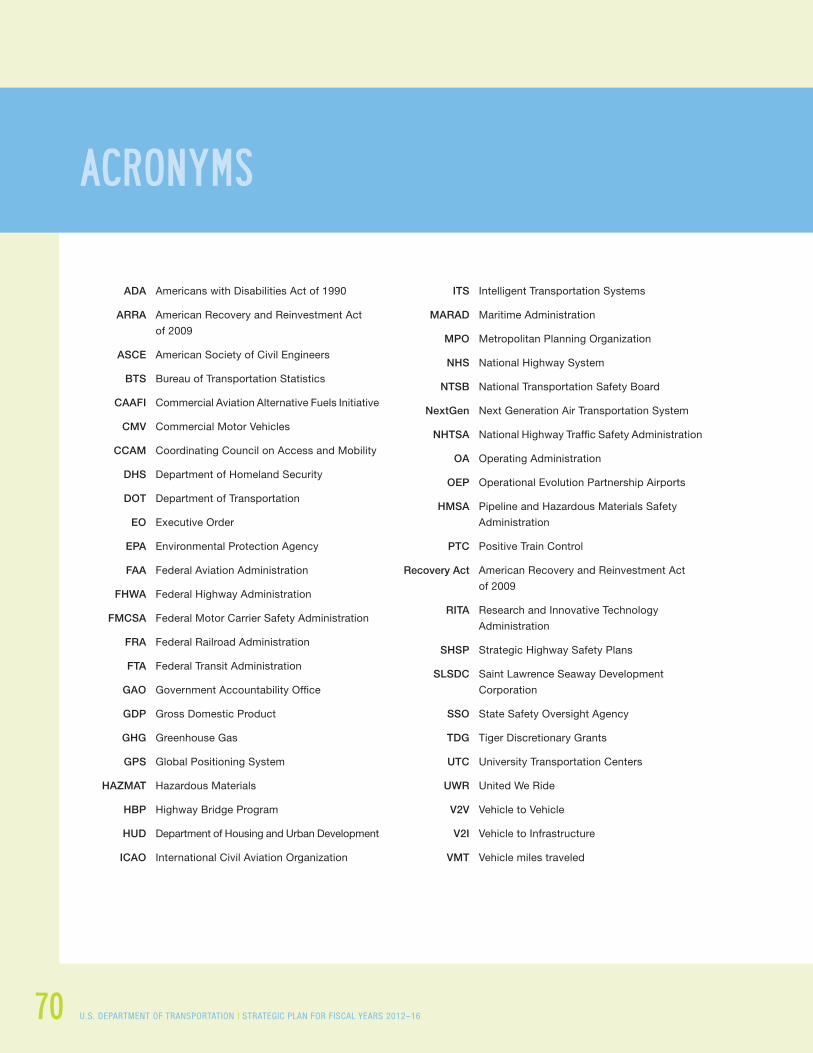
70 U.S. DEPARTMENT OF TRANSPORTATION | STRATEGIC PLAN FOR FISCAL YEARS 2012–16
ACRONYMS
ADA Americans with Disabilities Act of 1990
ARRA American Recovery and Reinvestment Act
of 2009
ASCE American Society of Civil Engineers
BTS Bureau of Transportation Statistics
CAAFI Commercial Aviation Alternative Fuels Initiative
CMV Commercial Motor Vehicles
CCAM Coordinating Council on Access and Mobility
DHS Department of Homeland Security
DOT Department of Transportation
EO Executive Order
EPA Environmental Protection Agency
FAA Federal Aviation Administration
FHWA Federal Highway Administration
FMCSA Federal Motor Carrier Safety Administration
FRA Federal Railroad Administration
FTA Federal Transit Administration
GAO Government Accountability Office
GDP Gross Domestic Product
GHG Greenhouse Gas
GPS Global Positioning System
HAZMAT Hazardous Materials
HBP Highway Bridge Program
HUD Department of Housing and Urban Development
ICAO International Civil Aviation Organization
ITS Intelligent Transportation Systems
MARAD Maritime Administration
MPO Metropolitan Planning Organization
NHS National Highway System
NTSB National Transportation Safety Board
NextGen Next Generation Air Transportation System
NHTSA National Highway Traffic Safety Administration
OA Operating Administration
OEP Operational Evolution Partnership Airports
HMSA Pipeline and Hazardous Materials Safety
Administration
PTC Positive Train Control
Recovery Act American Recovery and Reinvestment Act
of 2009
RITA Research and Innovative Technology
Administration
SHSP Strategic Highway Safety Plans
SLSDC Saint Lawrence Seaway Development
Corporation
SSO State Safety Oversight Agency
TDG Tiger Discretionary Grants
UTC University Transportation Centers
UWR United We Ride
V2V Vehicle to Vehicle
V2I Vehicle to Infrastructure
VMT Vehicle miles traveled


HTTP://WWW .DOT .GOV