strategic sustainability performance plan public...and operations through its strategic...
TRANSCRIPT

GREEN
“The integration of mission, environmental, economic and social considerations.”
Strategic SustainabilityPerformance Plan
June 2012
GREEN

2012 U.S. Department of Transportation’s Strategic Sustainability Performance Plan
Table of Contents
I. Policy Statement . . . . . . . . . . . . . . . . . . . . . . . . . . . . . . . . . . .1
II. Executive Summary. . . . . . . . . . . . . . . . . . . . . . . . . . . . . . . . .2
III. Agency Size and Scope. . . . . . . . . . . . . . . . . . . . . . . . . . . . . . 7
IV. Sustainability Goals and Analysis. . . . . . . . . . . . . . . . . . . . . .8
V. Appendices
• Appendix A – Climate Change Adaptation Plan
• Appendix B – Fleet Management Plan
• Appendix C - Biobased Procurement Strategy
Agency Points of Contact:
Hetal Jain ([email protected])
Brent Kurapatskie ([email protected])

1 2012 DOT SSPP – Executive Summary
“We are making meaningful progress in our sustainability efforts, especially with renewable energy use and reducing our greenhouse gas emissions while we forge ahead to reduce our environmental footprint in all areas.”
Brodi Fontenot
Senior Sustainability Officer
2012 U.S. Department of Transportation’s Strategic Sustainability Performance Plan
Executive Summary
Sustainability principles are fundamental to the Department of Transportation’s (DOT or the Department) mission. DOT serves the American people to ensure a robust transportation system that enhances quality of life, today and for the future. Whether making unprecedented investments in high-speed rail, setting more stringent fuel economy standards, or creating a new satellite-based technology for more efficient management of air-traffic, DOT is doing its part to lead America towards a more sustainable future. Simultaneously, DOT has laid the foundation for weaving sustainability principles into the fabric of its internal policy, performance, and operations through its Strategic Sustainability Performance Plan (SSPP). DOT is in its third year of implementing its 10-year SSPP, which sets aggressive and achievable sustainability targets based on the requirements of Executive Order 13514, “Federal Leadership in Environmental, Energy, and Economic Performance,” and other sustainability mandates. In FY2011, the Department continued to improve its sustainability performance by reducing its overall building energy use, decreasing fuel consumption in its vehicles, increasing the use of renewable energy, acquiring green products, and responsibly managing electronic equipment. DOT also created a climate change adaptation plan and has completed the first phase of its Sustainability Management System (SMS). However, the Department sees opportunities for improvement by reducing both its water use and the amount of solid waste generated, increasing alternative fuel use in vehicles, and using performance-based contracting to improve building performance. The Department has identified four key strategies - accountability, education, data management, and performance to address sustainability requirements and ensure wise investments today and in the future. Leadership and Accountability: The Department added a sustainability performance component to its internal quarterly regulatory review process. At each of DOT’s Operating Administrations’ (OAs) meetings with the Deputy Secretary, the OA Administrator provides a status update on programmatic and mandated activities. During these executive sessions, each OA must demonstrate progress towards compliance with defined sustainability metrics. This continued senior-level oversight, support, and integration with other high-priority requirements has been a powerful tool. In FY2011, the Department accomplished a major milestone by linking OA sustainability progress with performance appraisal plans for DOT’s cadre of senior executives. Additionally, DOT continues to make progress in incorporating sustainability across the organization from budgets to procurement to capital planning. These initiatives improve accountability, which drives OAs’ performance.

2 2012 DOT SSPP – Executive Summary
Did you know . . .
The DOT-wide Green Team assembled a voluntary Green Code of Conduct for all employees:
o Reuse o Lights Out, Power
Down o Conserve when
printing o Consider your
commute o Recycle
Education and Awareness: The Department recognizes that achieving sustainability performance requires a behavioral or cultural change in its employees. This may be a difficult challenge, but DOT is making progress. DOT is using numerous tools to educate its workforce about the importance of incorporating sustainability into daily decision-making. For example, last year DOT launched a “Sustainable Performance” internal website where its workforce can learn about the Federal Government’s sustainability requirements, DOT’s performance on the OMB Scorecard, and new sustainability initiatives. Furthermore, DOT-wide Green Team, a voluntary group of DOT employees, works collaboratively to educate DOT’s workforce on sustainability concepts through activities such as the annual Earth Day celebration, employee code of conduct, and hosting “Lights Out, Power Down” awareness campaigns. DOT will continue to seek creative ways to educate its workforce and create a culture of sustainability. Data Management: The Department continues to improve its ability to collect and report numerous sustainability related data. In some areas, DOT has robust and comprehensive data collection systems in place; in other areas, DOT has targeted strategies for overcoming challenges and making progress. The Office of Sustainable Performance, within DOT’s Office of the Secretary, plays a pivotal role in aggregating the data and sharing best practices across the Department. Through projects such as working with GSA on accurate alternative fuel tracking or exploring the use of the Aviation Environmental Design Tool to enhance greenhouse gas calculations, DOT will improve data collection government-wide. Performance Improvement: In addition to the strategies highlighted above, DOT is focused on improving overall performance across the goals through a range of tools such as policy development, performance-based contracting, and sharing best practices. Below is a summary of DOT’s progress, highlights, challenges, and strategies for each goal defined in EO 13514.
Goal 1: Greenhouse Gas (GHG) Reduction and Maintenance of Agency Comprehensive Greenhouse Gas Inventory This year DOT met and exceeded the FY2020 goal for Scope 1 and 2 GHG emissions nine years in advance of the target. It has already reduced its overall Scope 1 and 2 GHG emissions by 17.8 percent relative to its FY2008 baseline. DOT accomplished this reduction through a targeted 26.4 percent
reduction of energy intensity in goal-subject buildings, along with a significant increase (8.4 percent) in the use of renewable electricity. There was a small reduction in overall Scope 3 GHG emissions (>1%) compared to its FY2008 baseline. Part of this improvement comes from a 7 percent decrease in
emissions from employee business air travel. DOT anticipates further Scope 3 emission reductions by encouraging DOT’s workforce to commute via public transit and telework. While altering employees’ commuting decisions may be difficult, the National Highway Traffic Safety Administration (NHTSA) recently approved an option to allow employees’ to use a 4
Did you know…
DOT has reduced its overall scope 1 and 2 greenhouse gas emissions by 17.8 percent relative to a FY2008 baseline, exceeding the FY2020 goal nine years in advance.

3 2012 DOT SSPP – Executive Summary
day/10 hour compressed work schedule, which may reduce its workforce’s commuting days by up to 20 percent. Goal 2: Buildings, Energy Savings Performance Contract (ESPC) Initiative Schedule, and Regional and Local Planning
As stated in goal 1, DOT has made significant strides in energy reduction in its building portfolio, but challenges remain. To date, only a small percentage of DOT’s buildings meet the Guiding Principles for Federal Leadership in High Performance and Sustainable Buildings (the “Guiding Principles”). The primary hurdles concern resource constraints and the long lead time to complete building projects. To overcome these challenges, OAs are exploring options to integrate components of the Guiding Principles into performance-based contracts. This action will not only improve DOT’s buildings, but will satisfy DOT’s
commitment to meeting the goals established in December 2011 Presidential Memorandum, “Implementation of Energy Savings Projects and Performance-Based Contracting for Energy Savings.” Goal 3: Fleet Management Meeting the fleet management goals is a high-priority, and DOT has numerous accomplishments. DOT met the requirement to source greater than 75 percent of its vehicle acquisitions with alternative fuel vehicles.
In addition, DOT realigned some of its fleet so that employees working in areas with alternative fuel infrastructure can use such alternative fuels. DOT’s fleet also achieved a 5 percent reduction in its petroleum use. Moreover, DOT developed its Fleet Management Plan to reduce its overall fleet, which
should contribute significantly to its FY2012 target for petroleum reduction. Part of DOT’s limited progress for this goal involves a data discrepancy. When vehicle operators refuel with alternative fuels, the General Services Administration (GSA) tracking system does not properly code these transactions as alternative fuel. To remedy this situation, senior DOT officials recently met with senior GSA staff, which led to a joint working-group analyzing ways to correct the problem for all Federal agencies. Another challenge is the need by DOT’s largest organization, the Federal Aviation Administration (FAA), to use vehicle types for which no low GHG-emitting alternative. However, DOT is playing a critical role for the government by evaluating whether new vehicle technologies, such as electric trucks, could overcome this challenge. Goal 4: Water Use Efficiency and Management Four of DOT’s OAs subject to this requirement are not only meeting, but exceeding, the goals for water use efficiency. For example, at the Maritime Administration’s Merchant Marine Academy, a cooling tower replacement yields a water savings annually of 700,000 gallons. However, for DOT’s largest water consumer, FAA, water reduction has been challenging at some facilities because of drought conditions, extreme high temperatures, and an increased workforce. Additionally, they are grappling with data quality issues, which impact their reported water consumption. Therefore, DOT’s overall reported potable water consumption increased in FY2011 by over 5 percent from the FY2007 baseline. FAA is conducting EISA evaluations, which include evaluations of water systems and equipment, and is pursuing ESPC and Utility Energy Service Contracts (UESC) projects. These efforts focused on both data and performance will help DOT improve its water conservation.
Did you know…
Exceeding its annual goal, DOT has significantly increased its use of renewable energy (8.4 percent of total electricity consumed).
In FY11, DOT acquired over 600 alternate fuel vehicles and returned 60 underutilized vehicles to GSA
Water Consumption
5.1%

4 2012 DOT SSPP – Executive Summary
Goal 5: Pollution Prevention and Waste Reduction
Currently, DOT has limited data for pollution prevention and waste for its facilities. However, data gathered for the annual GHG inventory indicates that DOT generated 3.8 percent less waste in FY2011 than the previous year. DOT’s Senior Sustainability Officer has provided targets and guidance to OAs for these measures, but the decentralized operations of the OAs have made it challenging to produce enough viable data to provide comprehensive values. Therefore, the Department must find ways to make its data formats consistent and resolve the limited availability of the data at the facility level. Some
OAs have achieved great results nonetheless; for example, in FY2011 the Federal Highway Administration (FHWA) reduced its non-hazardous solid waste by 63 percent. Also in FY2011, the Research and Innovative Technology Administration (RITA) diverted 78 percent of construction and demolition material and debris. Clearly the decentralized data collection is a challenge, but DOT is working closely with the OAs to design a viable solution including policy development. Goal 6: Sustainable Acquisition DOT met its sustainable acquisition target. This year, DOT implemented a green procurement compliance tracking system and sampled 5 percent of its contracts to ensure that at least 95 percent of them meet the sustainable acquisition guidelines. In addition, DOT has developed a special provision for
service and product contracts to address green procurement requirements at most of its OAs. Keeping the acquisition workforce current on all rules and regulations for sustainability contracting is another challenge, but most DOT OAs require Contracting Officers Representatives (CORs) and purchase-card holders to regularly complete green procurement training. DOT will
continue to track its compliance with a special emphasis in FY2012 on bio-based acquisition, consistent with the February 2012 Presidential Directive, “Driving Innovation and Creating Jobs in Rural America through Biobased and Sustainable Product Procurement.” FAA, who manages its procurement separate from the Department, has also taken pro-active steps to institutionalize green procurement, such as updating statement of work templates to incorporate additional sustainability considerations. Goal 7: Electronic Stewardship and Data Centers
DOT met its computer power management goals, requirements for purchasing ENERGY STAR and EPEAT designated electronics, and end-of-life management of electronics. DOT also issued a printing policy and is currently implementing DOT-wide duplex printing. Furthermore, DOT consolidated 11 data centers and is on track for several more in FY2012. Meeting the myriad requirements of the Federal Data Center Consolidation Initiative is challenging, but a number of creative solutions have been identified. These solutions range from a simple data center consolidation to a more complicated assessment of moving DOT
data into cloud-based services. Goal 8: Agency Innovation and Government-Wide Support DOT’s many programmatic efforts should expand its ability, along with other Federal agencies, to meet all of the requirements noted above. Specifically, RITA’s Federal Commuter Choice Survey became the standard
Did you know…
DOT has achieved a 26.4 percent reduction in energy goal-subject building energy use (measured by intensity) from a FY2003 baseline
DOT launched an employee website focused on sustainability

5 2012 DOT SSPP – Executive Summary
format for all Federal agencies to collect data on employee commuting. FAA is currently conducting an analysis to demonstrate the Aviation Environmental Design Tool’s (AEDT) ability to provide more accurate Scope 3 GHG emissions data for business air travel than the current government standard. AEDT is a newly developed software system that models aircraft performance in space and time to more effectively evaluate the interdependencies of aircraft fuel consumption, emissions, and noise. In addition to these and many other programmatic efforts, DOT is an active participant in many Federal interagency workgroups formed to review new guidance and share best practices. Conclusion All levels of DOT are committed to sustainability; legal, procurement, programmatic, and budget personnel are collaborating to reach our future goals. To date, the Department has achieved some significant milestones, but much work remains for DOT to continue to be a leader among Federal agencies. The Department will continue to build on its successes, both strategic and tactical, and move quickly to address areas that need improvement. By leveraging strategies involving accountability, education, policy, and better data to drive performance, DOT is transforming the organization into a culture of sustainability. An important first step in this transformation is the Regulatory Review process, which integrated sustainability into DOT’s business practices. Going forward, the Department will promote energy and natural resource conservation in all aspects of its operations to ensure a safe, efficient, and affordable transportation system for all Americans.
For more information, contact: Hetal Jain, Brent Kurapatskie, Office of Sustainable Performance Office of Sustainable Performance [email protected] [email protected] 202-366-1210 202-366-7007 http://www.dot.gov/sustainability

2012 U.S. Department of Transportation’s Strategic Sustainability Performance Plan Agency Size and Scope
Table 1: SIZE AND SCOPE of AGENCY OPERATIONS
Agency Size and Scope FY 2011 Total Number of Employees as Reported in the President's Budget 58,103 Total Acres of Land Managed 176,319 Total Number of Facilities Owned 11,473 Total Number of Facilities Leased (GSA and Non-GSA lease) 1,420 Total Facility Gross Square Feet (GSF) 32,770,848 Operates in Number of Locations Throughout U.S. 51 Operates in Number of Locations Outside of U.S. 9 Total Number of Fleet Vehicles Owned 272 Total Number of Fleet Vehicles Leased 5,814

2012 U.S. Department of Transportation’s Strategic Sustainability Performance Plan
Sustainability Goals and Analysis
GOAL 1: GREENHOUSE GAS REDUCTION AND MAINTENANCE OF AGENCY COMPREHENSIVE GREENHOUSE GAS INVENTORY Agency-Specific Performance Metrics for Scope 1 & 2 GHG Emissions Reduction:
Note: E.O. 13514 requires each agency to establish a scope 1 & 2 GHG reduction target for FY2020. The target for this agency is 12.3% compared to FY2008. The red bar represents the agency’s FY2008 baseline. The green bar represents the FY2020 target reduction. The blue bars show actual status in relationship to the target. The percentage on each bar shows the reduction or increase from the FY2008 baseline.
821,960 732,879 10.8% 674,649
17.9%
720,859 12.3%
0
100,000
200,000
300,000
400,000
500,000
600,000
700,000
800,000
900,000
2008 Baseline 2010 2011 2020 Target
Met
ric To
ns o
f CO
2e
Progress toward Scope 1 & 2 Greenhouse Gas Goals

Agency-Specific Performance Metrics for Scope 3 GHG Emissions Reduction:
Note: E.O. 13514 requires each agency to establish a scope 3 GHG reduction target for FY2020. The FY2020 target for this agency is 11% compared to the FY2008 baseline. The red bar represents the agency’s FY2008 baseline. The green bar represents the FY2020 target reduction. The blue bars show actual status in relationship to the target. The percentage on each bar shows the reduction or increase from the FY2008 baseline. A negative percentage reflects an increase in scope 3 greenhouse gas emissions.
281,241
324,256 -15.3%
281,057 0.1% 250,304
11.0%
0
50,000
100,000
150,000
200,000
250,000
300,000
350,000
2008 Baseline 2010 2011 2020 Target
Met
ric To
ns o
f CO
2e
Progress toward Scope 3 Greenhouse Gas Goals

GOAL 2: BUILDINGS Agency-Specific Performance Metrics for Facility Energy Intensity Reduction:
Note: EISA requires agencies to reduce energy intensity by 18% for FY2011, compared to an FY2003 baseline; a 30% reduction is required by FY2015. The red bar represents the agency’s FY2003 baseline. The green bar represents the FY2015 target reduction. The blue bars show actual status in relationship to the target. The percentage on each bar shows the reduction or increase from the FY2003 baseline.
101,426
74,828 26.2%
74,646 26.4% 70,998
30.0%
0
20,000
40,000
60,000
80,000
100,000
120,000
2003 Baseline 2010 2011 2015 Target
Btu
per G
ross
Squ
are
Foot
Progress toward Facility Energy Intensity Reduction Goals

Agency-Specific Performance Metrics for Renewable Energy:
Agency-Specific Performance Metrics for Total Buildings Meeting the Guiding Principles:
Note: E.O. 13514 requires that by FY2011 agencies have 7% of new, existing, and leased buildings >5,000 square feet meet the Guiding Principles; the requirement increases to 15% by FY2015. The green bar represents the FY2015 target. The blue bars show actual progress toward the target.
102,519 8.4%
1,111,777 91.6%
Use of Renewable Energy as a Percentage of Electricity Use
Renewable Electricity MWh
Non-Renewable ElectricityMWh
0.3% 0.5%
15.0%
0.0
2.0
4.0
6.0
8.0
10.0
12.0
14.0
16.0
2010 2011 2015 Target
Perc
ent o
f Tot
al B
uild
ings
Mee
ting
the
Gui
ding
Prin
cipl
es
Progress toward Total Buildings Meeting the Guiding Principles

GOAL 3: FLEET MANAGEMENT Agency-Specific Performance Metrics for Fleet Petroleum Reduction:
Note: E.O. 13514 and EISA require that by FY2011 agencies reduce fleet petroleum use by 12%, compared to an FY2005 baseline. A 20% reduction is required by FY2015 and a 30% reduction is required by FY2020. The red bar represents the agency’s FY2005 baseline. The green bars represent the FY2015 and FY2020 target reductions. The blue bars show actual status in relationship to the target. The percentage on each bar shows the reduction or increase from the FY2005 baseline.
3,661 3,474 5.1%
3,482 4.9%
2,929 20.0% 2,563
30.0%
0
500
1,000
1,500
2,000
2,500
3,000
3,500
4,000
2005 Baseline 2010 2011 2015 Target 2020 Target
Gal
lons
Gas
olin
e Eq
uiva
lent
(tho
us.)
Progress toward Fleet Petroleum Use Reduction Goals

Agency-Specific Performance Metrics for Fleet Alternative Fuel Use:
Note: E.O. 13423 requires that agencies increase total non-petroleum-based fuel consumption by 10% annually compared to an FY2005 baseline. Consequently, by FY2011 agencies must increase alternative fuel use by 77%, compared to an FY2005 baseline. By FY2015, agencies must increase alternative fuel use by 159.4%. The red bar represents the agency’s FY2005 baseline. The green bar represents the FY2015 target. The blue bars show actual status in relationship to the target. The percentage on each bar shows the reduction or increase from the FY2005 baseline. A negative percentage reflects a decrease in alternative fuel consumption.
68,258 68,941 1.0%
62,206 -8.9%
177,044 159.4%
0
20,000
40,000
60,000
80,000
100,000
120,000
140,000
160,000
180,000
200,000
2005 Baseline 2010 2011 2015 Target
Gal
lons
Gas
olin
e Eq
uiva
lent
Progress toward Fleet Alternative Fuel Consumption Goals
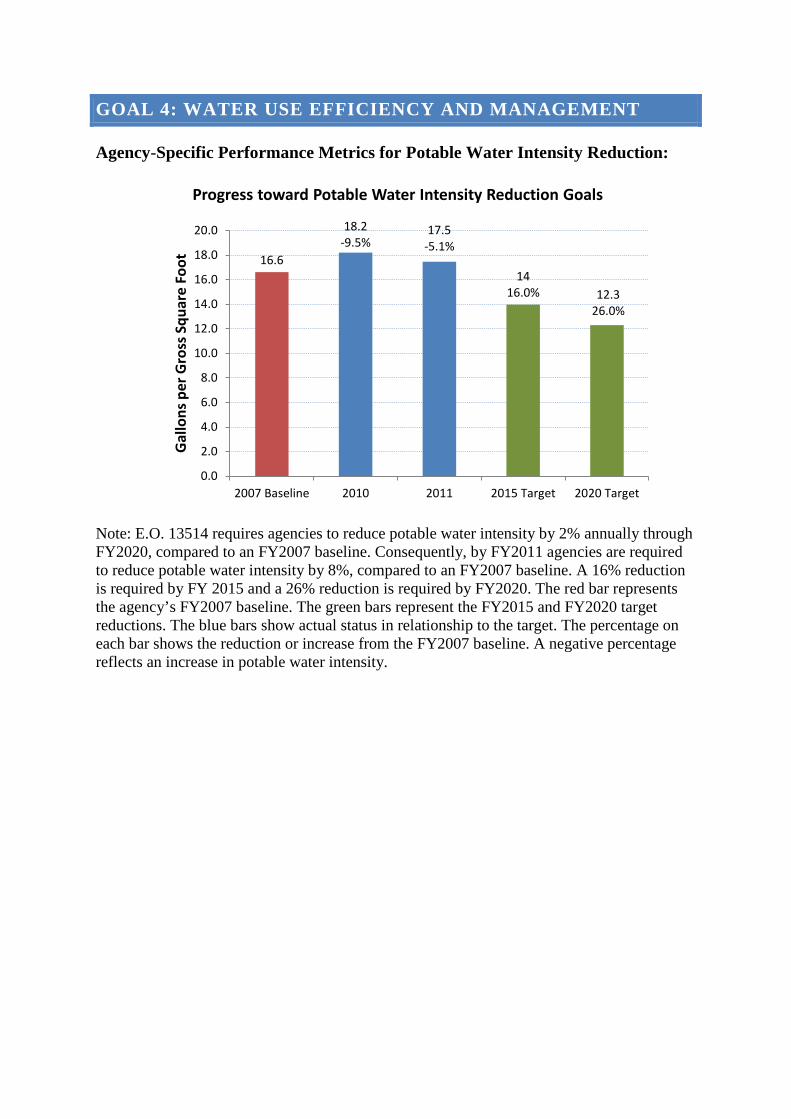
GOAL 4: WATER USE EFFICIENCY AND MANAGEMENT Agency-Specific Performance Metrics for Potable Water Intensity Reduction:
Note: E.O. 13514 requires agencies to reduce potable water intensity by 2% annually through FY2020, compared to an FY2007 baseline. Consequently, by FY2011 agencies are required to reduce potable water intensity by 8%, compared to an FY2007 baseline. A 16% reduction is required by FY 2015 and a 26% reduction is required by FY2020. The red bar represents the agency’s FY2007 baseline. The green bars represent the FY2015 and FY2020 target reductions. The blue bars show actual status in relationship to the target. The percentage on each bar shows the reduction or increase from the FY2007 baseline. A negative percentage reflects an increase in potable water intensity.
16.6
18.2 -9.5%
17.5 -5.1%
14 16.0% 12.3
26.0%
0.0
2.0
4.0
6.0
8.0
10.0
12.0
14.0
16.0
18.0
20.0
2007 Baseline 2010 2011 2015 Target 2020 Target
Gal
lons
per
Gro
ss S
quar
e Fo
ot
Progress toward Potable Water Intensity Reduction Goals

GOAL 5: POLLUTION PREVENTION AND WASTE REDUCTION Agency-Specific Performance Metrics for Non-Hazardous Solid Waste Diversion (Non-C&D):
Note: E.O. 13514 requires that by FY2015 agencies annually divert at least 50% of non-hazardous solid waste from disposal. The green bar represents the FY2015 target. The blue bars show actual progress toward the target.
N/A
64%
50%
0
10
20
30
40
50
60
70
2010 2011 2015 Target
Perc
ent o
f Non
-Haz
ardo
us S
olid
W
aste
Div
ersi
on
Progress toward Non-Hazardous Solid Waste Diversion (Non-C&D)

GOAL 7: ELECTRONIC STEWARDSHIP AND DATA CENTERS
EPEAT POWER MANAGEMENT
END-OF-LIFE COMMENTS
EPEAT:
95% or more Monitors and PCs/Laptops purchased in FY2011 was EPEAT Compliant Agency-wide
85-94% or more Monitors and PCs/Laptops purchased in FY2011 was EPEAT Compliant Agency-wide
84% or less Monitors and PCs/Laptops purchased in FY2011 was EPEAT Compliant Agency-wide
Power Management:
100% Power Management Enabled Computers, Laptops and Monitors Agency-wide
90-99% Power Management Enabled Computers, Laptops and Monitors Agency-wide
89% or less Power Management Enabled Computers, Laptops and Monitors Agency-wide
End-of-Life:
100% of Electronics at end-of-life disposed through GSA Xcess, CFL, Unicor or Certified Recycler (R2, E-Stewards)
100% of Electronics at end-of-life disposed through GSA Xcess, CFL, Unicor or non-Certified Recycler
Less than 100% of Electronics at end-of-life disposed through GSA Xcess, CFL, Unicor or non-Certified Recycler

PRESIDENT’S PERFORMANCE CONTRACTING COMMITMENT Agency-Specific President’s Performance Contracting Commitment Metrics:
Agency-Specific President’s Performance Contracting Commitment Metrics:
$10.7
$0.0
$14.0
$0.0
$5.0
$8.0
$0.0 $0.0
$8.2
$0
$2
$4
$6
$8
$10
$12
$14
$16
No start/Nodata
AcquisitionPlan Done
ReleasedNOO
ESCOSelected
PAdeveloped
NOITAIssued
IGASubmitted
Final Prop.Submitted
Awarded
Mill
ions
of D
olla
rs
Performance Contracting Plan Progress (Millions of Dollars)
Data as of Aug 15, 2012
$31.4 68.4%
$14.5 31.6%
Performance Contracting Commitment (Millions of Dollars)
Investment Gap
DOE ESPC
USACE ESPC
UESC
Other
Data as of Aug 15, 2012
2012 U.S. Department of Transportation’s Strategic Sustainability Performance Plan
Appendices
• Appendix A – Climate Change Adaptation Plan
• Appendix B – Fleet Management Plan
• Appendix C - Biobased Procurement Strategy

U.S. Department of Transportation Climate Adaptation Plan
Ensuring Transportation Infrastructure and System Resilience

Cover graphics courtesy of Nashville MTA, Volpe National Transportation Systems Center, and Jacob Klaus.

1
Table of Contents 1. Introduction ..................................................................................................................................2
2. Potential Vulnerability and Impacts.............................................................................................6
3. Priority Actions to Adapt to Climate Change ............................................................................10
Federal Aviation Administration………………………………………………………...10
Federal Highway Administration………………………………………………………..11
Federal Transit Administration ...………………………………………………………..13
Saint Lawrence Seaway Development Cooperation……………………………………..14
Federal Railroad Administration…………………………………………………………15
Federal Motor Carrier Safety Administration……………………………………………16
Maritime Administration…………………...……………………………………………17
Pipelines and Hazardous Materials Safety Administration……………………………...17
4. Recent Accomplishments in Climate Adaptation ......................................................................19

2
1. Introduction Under Executive Order No. 13514 and Council on Environmental Quality (CEQ) Implementing Instructions, the U.S. Department of Transportation (DOT) is required to submit a Climate Adaptation Plan for implementation in 2013. DOT’s work on climate adaptation began a number of years before this requirement because potential climate impacts influence DOT’s strategic goals of safety, state of good repair and environmental sustainability. This plan reflects FY12 and FY13 commitments as well as other DOT accomplishments. It incorporates DOT’s earlier report on vulnerabilities to climate variability and change. DOT’s Policy Statement on Climate Adaptation is attached. The Department’s mission is to serve the United States by ensuring a safe, efficient, accessible and convenient transportation system that meets vital national interests and enhances the quality of life of the American people, today and into the future. The Department and its modal agencies oversee the safe operation of the United States transportation system including more than 3.9 million miles of public roads, 120,000 miles of major railroads, 25,000 miles of commercially navigable waterways, 5,000 public-use airports, 500 major urban public transit operators and more than 300 coastal, Great Lakes, and inland waterways ports.1 Scientists have concluded that some level of climate change has already occurred, weather patterns are changing, and these changes are expected to continue or accelerate in the future.2 Additionally, past weather and climate patterns appear to be much less reliable indicators of future weather and climate than in recent decades, which necessitates greater flexibility in planning and decision-making processes. Transportation both contributes to and will be impacted by climate change. While mitigating transportation contributions to greenhouse gas emissions and adapting to climate impacts on the transportation system are equally important for the transportation sector to address, this plan addresses adaptation work only.
1 Source: http://www.nationalatlas.gov/transportation.html 2 See USGCRP, Global Climate Change impacts in the United States, particularly pp.27-40. http://www.globalchange.gov/publications/reports/scientific-assessments/us-impacts/full-report
DOT shall integrate consideration of climate impacts and adaptation into the planning, operations, policies, and programs of DOT in order to ensure that taxpayer resources are invested wisely and that transportation infrastructure, services and operations remain effective in current and future climate conditions.
Excerpt from DOT Policy Statement on Climate Adaptation
3
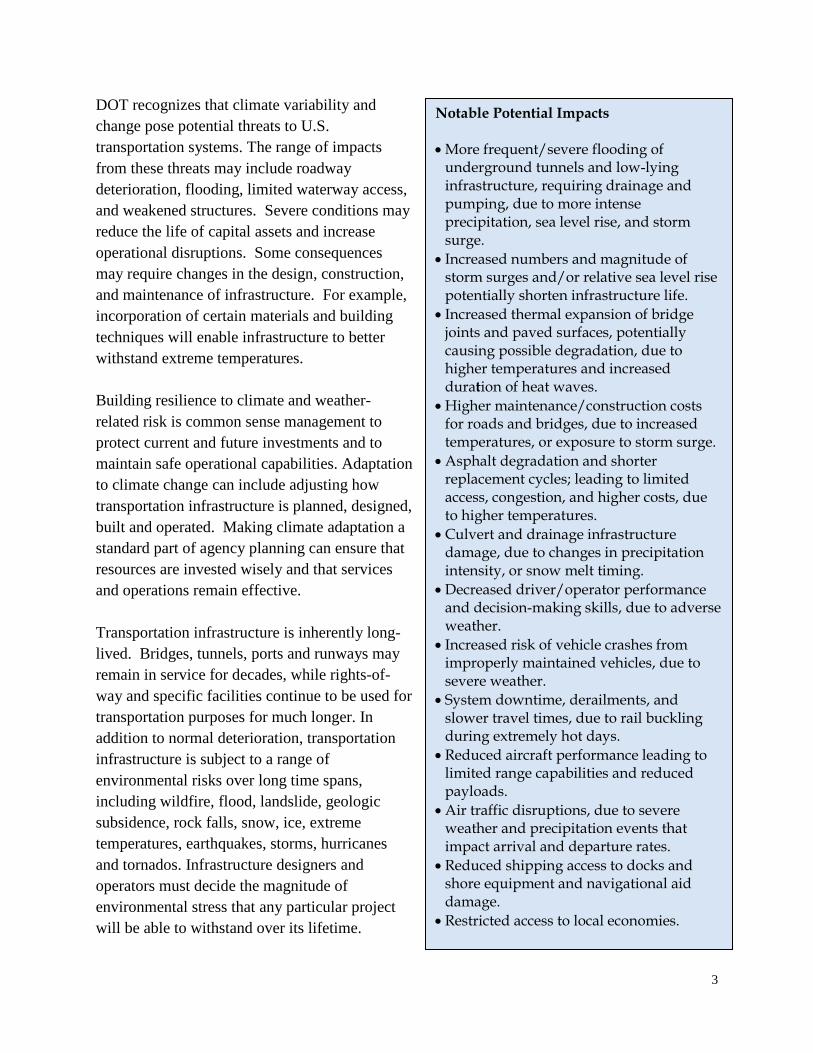
Notable Potential Impacts •More frequent/severe flooding of
underground tunnels and low-lying infrastructure, requiring drainage and pumping, due to more intense precipitation, sea level rise, and storm surge.
• Increased numbers and magnitude of storm surges and/or relative sea level rise potentially shorten infrastructure life.
• Increased thermal expansion of bridge joints and paved surfaces, potentially causing possible degradation, due to higher temperatures and increased duration of heat waves.
•Higher maintenance/construction costs for roads and bridges, due to increased temperatures, or exposure to storm surge.
•Asphalt degradation and shorter replacement cycles; leading to limited access, congestion, and higher costs, due to higher temperatures.
•Culvert and drainage infrastructure damage, due to changes in precipitation intensity, or snow melt timing.
•Decreased driver/operator performance and decision-making skills, due to adverse weather.
• Increased risk of vehicle crashes from improperly maintained vehicles, due to severe weather.
• System downtime, derailments, and slower travel times, due to rail buckling during extremely hot days.
•Reduced aircraft performance leading to limited range capabilities and reduced payloads.
•Air traffic disruptions, due to severe weather and precipitation events that impact arrival and departure rates.
•Reduced shipping access to docks and shore equipment and navigational aid damage.
•Restricted access to local economies.
DOT recognizes that climate variability and change pose potential threats to U.S. transportation systems. The range of impacts from these threats may include roadway deterioration, flooding, limited waterway access, and weakened structures. Severe conditions may reduce the life of capital assets and increase operational disruptions. Some consequences may require changes in the design, construction, and maintenance of infrastructure. For example, incorporation of certain materials and building techniques will enable infrastructure to better withstand extreme temperatures. Building resilience to climate and weather-related risk is common sense management to protect current and future investments and to maintain safe operational capabilities. Adaptation to climate change can include adjusting how transportation infrastructure is planned, designed, built and operated. Making climate adaptation a standard part of agency planning can ensure that resources are invested wisely and that services and operations remain effective. Transportation infrastructure is inherently long-lived. Bridges, tunnels, ports and runways may remain in service for decades, while rights-of-way and specific facilities continue to be used for transportation purposes for much longer. In addition to normal deterioration, transportation infrastructure is subject to a range of environmental risks over long time spans, including wildfire, flood, landslide, geologic subsidence, rock falls, snow, ice, extreme temperatures, earthquakes, storms, hurricanes and tornados. Infrastructure designers and operators must decide the magnitude of environmental stress that any particular project will be able to withstand over its lifetime.
4
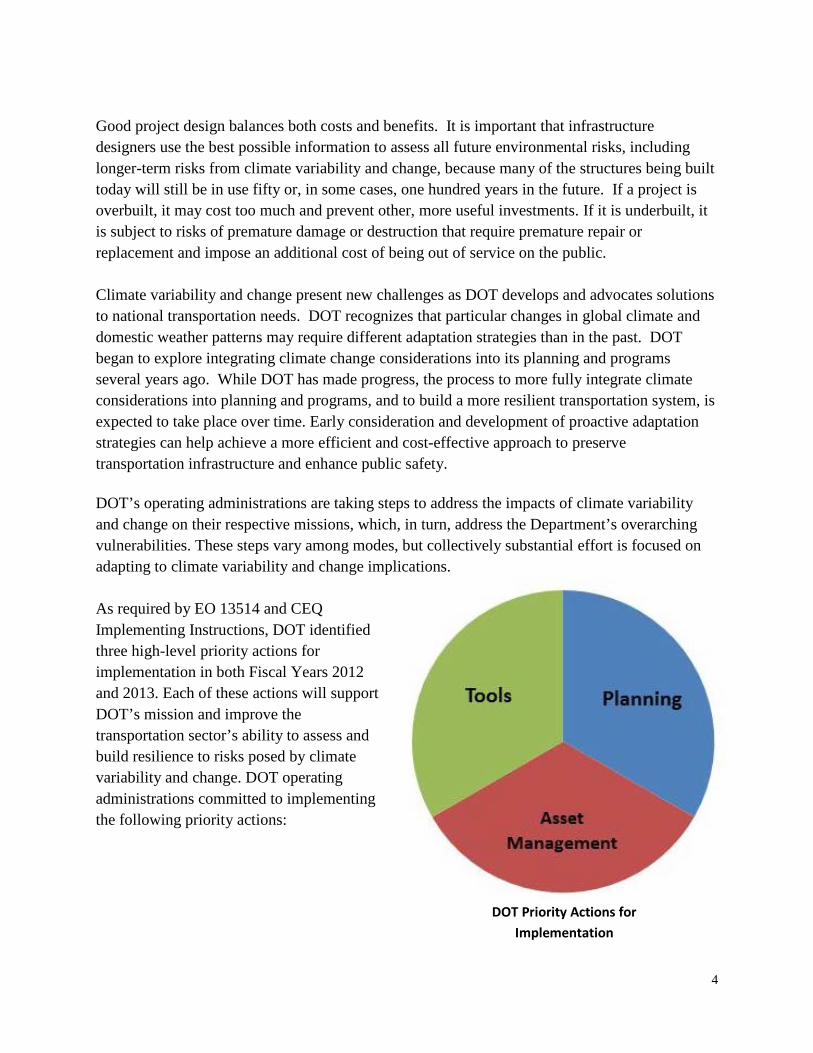
DOT Priority Actions for Implementation
Good project design balances both costs and benefits. It is important that infrastructure designers use the best possible information to assess all future environmental risks, including longer-term risks from climate variability and change, because many of the structures being built today will still be in use fifty or, in some cases, one hundred years in the future. If a project is overbuilt, it may cost too much and prevent other, more useful investments. If it is underbuilt, it is subject to risks of premature damage or destruction that require premature repair or replacement and impose an additional cost of being out of service on the public. Climate variability and change present new challenges as DOT develops and advocates solutions to national transportation needs. DOT recognizes that particular changes in global climate and domestic weather patterns may require different adaptation strategies than in the past. DOT began to explore integrating climate change considerations into its planning and programs several years ago. While DOT has made progress, the process to more fully integrate climate considerations into planning and programs, and to build a more resilient transportation system, is expected to take place over time. Early consideration and development of proactive adaptation strategies can help achieve a more efficient and cost-effective approach to preserve transportation infrastructure and enhance public safety. DOT’s operating administrations are taking steps to address the impacts of climate variability and change on their respective missions, which, in turn, address the Department’s overarching vulnerabilities. These steps vary among modes, but collectively substantial effort is focused on adapting to climate variability and change implications. As required by EO 13514 and CEQ Implementing Instructions, DOT identified three high-level priority actions for implementation in both Fiscal Years 2012 and 2013. Each of these actions will support DOT’s mission and improve the transportation sector’s ability to assess and build resilience to risks posed by climate variability and change. DOT operating administrations committed to implementing the following priority actions:

5
• Planning. DOT will take actions to ensure that Federal transportation investment decisions
address potential climate impacts in statewide and metropolitan transportation planning and project development processes as appropriate in order to protect federal investments. Through such actions transportation systems will gradually become better prepared for future climate shifts.
• Asset Management. DOT will work to incorporate climate variability and change impact
considerations in asset management. For example, modal administrations will work with grantees to assure that potential impacts are incorporated into existing grantee asset management systems. Agencies will assess the policy, guidance, practices, and performance measures of its asset management programs to incorporate such considerations.
• Tools. DOT will provide tools, case studies, best practices, and outreach for incorporating
climate considerations into transportation decision-making. This adaptation plan lays out steps DOT will take to move towards fully integrating considerations of climate change and variability in DOT policies, programs and operations. The Office of the Secretary and operating administrations are each playing a role, to varying degrees, in implementing this plan. The Office of Safety, Energy and Environment (OSEE) in the Office of the Secretary (OST) is coordinating DOT’s actions with support from the Research and Innovative Technologies Administration and DOT’s Climate Change Center. OSEE has participated on the Interagency Climate Change Adaptation Task Force, the related CEQ working group and the community of practice. DOT staff has presented work on regional impacts, pilots and best practices before Federal forums and with Federal agencies in order to share information and exchange best practices. As one example, DOT staff met with Department of the Interior staff to collaborate on transportation-related elements of the National Fish, Wildlife and Plants Climate Adaptation Strategy. The DOT administrations listed below have committed to fulfilling specific actions related to DOT’s high-level priority actions. Most DOT administrations report progress on adaption actions along with other regulatory and sustainability actions to the Deputy Secretary at regularly scheduled meetings. • Federal Aviation Administration (FAA) • Federal Highway Administration (FHWA) • Federal Transit Administration (FTA) • Federal Railroad Administration (FRA) • Federal Motor Carrier Safety
Administration (FMCSA) • Pipeline and Hazardous Materials
Administration (PHMSA)
• Maritime Administration (MARAD) • Saint Lawrence Seaway Development
Corporation (SLSDC)

6
2. Potential Vulnerability and Impacts DOT identified three general vulnerabilities to climate change, which it will address through its climate adaptation actions. They focus on infrastructure and systems of infrastructure to foster a resilient transportation system.
1. Existing Infrastructure Resilience: Existing transportation infrastructure is owned and
operated by various public agencies and private firms, and covers an enormous range of ages, service life and levels of sophistication. Existing infrastructure has been built to many different design standards, and its current and future environmental risk is similarly varied. As environmental risks change, the probability of unexpected failures may increase. Further, as existing infrastructure approaches the end of its service life, decisions about replacement or abandonment should, but may not currently take into account changing future risks.
2. New Infrastructure Resilience: Similarly, newly constructed infrastructure should be
designed and built in recognition of the best current understanding of future environmental risks. In order for this to happen, understanding of projected climate changes would need to be incorporated into infrastructure planning and design processes, across the many public and private builders and operators of transportation infrastructure.
3. System Resilience: Transportation systems are more than just the sum of their individual
parts. Some elements are of particular importance because of their vital economic role, absence of alternatives, heavy use, or critical function. The National Airspace System, for example, plays a critical economic role, while hurricane evacuation routes perform a critical function. Transportation systems are potentially vulnerable to the loss of key elements. Therefore selectively adding redundant infrastructure may be a more efficient strategy than hardening many individual facilities on the existing system. System resilience is best viewed across transportation modes and multiple system owners. While some key elements are obvious, other dependencies may be less well recognized. For example, some airports rely on petroleum pipelines, which may depend, in turn, on electric power for pumping. Transportation systems are also interdependent when passengers rely on multiple transportation modes to reach their destination.
The vulnerabilities described above have some degree of opportunity to disrupt transportation operations and damage transportation assets. The greater the extent of the vulnerability, the greater the risk is for transportation systems and infrastructure. Transportation vulnerabilities to climate impacts must be evaluated alongside other risks to ensure better management of assets and, ultimately, ensure the long-term viability of American transportation systems.

7
DOT initially began adaptation efforts by identifying transportation related vulnerabilities to the potential impacts of climate variability, change and severe weather events. Understanding the range of potential impacts is essential for DOT to develop adaptation actions and options.
Higher Temperatures
Fluctuating temperatures or longer periods of high temperature are expected to place additional stress on transportation infrastructure. For example, transit, highway, airport and other transportation systems across the country will face steadily increasing numbers of days in excess of 90 degrees Fahrenheit and less predictable weather patterns. Some transportation systems may also face more intense storms and changes in precipitation, though projections of precipitation are less clear than those of temperature. Some of the impacts may require changes in the design, construction, or maintenance of infrastructure such as incorporating materials and building techniques that allow infrastructure to better withstand temperature extremes. More extreme conditions also may reduce the life of capital assets and increase operational disruptions. Higher temperatures can break down asphalt, buckle rail track or increase the demand for air conditioning potentially overloading the power grid. Any of these impacts can cause system downtime and/or derailments. On the other hand, some climate change effects may positively affect transportation goals, as higher average temperatures in certain regions could reduce safety and maintenance concerns associated with snow and ice accumulation. Warmer temperatures are expected to affect the volume and rates of water flow in rivers, lakes, reservoirs and marshes, ultimately affecting water depth and the cargo carrying capacity of marine vessels. Increasing temperatures may create greater demands from hydroelectric systems that depend on the water system of the Saint Lawrence Seaway, which may reduce the water available for commercial shipping.
Rail Buckle from High Heat (Photo source DOT Volpe)

8
Severe Weather and Precipitation Severe weather and precipitation already heavily affect transportation infrastructure, and potential changes in precipitation could increase future impacts. For example, four of the seven largest US public transit systems are located in the country’s northeast, where climate change models forecast the largest increase in rain intensity in coming decades. In 2007, the New York City subway system was shut down by flooding during the morning rush hour, affecting 2 million commuters. Severe weather events also often impair or disable critical power lines and systems
Severe precipitation which increases the flooding of roadways, tunnels and evacuation routes can reduce the life of highway infrastructure. It can also increase road washout, landslides, and mudslides that damage roadways and overloaded drainage systems, causing traffic backups and street flooding. Ultimately, severe precipitation and wind speeds can damage bridges, signs, overhead cables and other tall structures. Storm surge can damage and destroy coastal roadways, bridges and airports. National airspace system efficiency and aviation system infrastructure can be adversely affected by severe weather and precipitation. Severe weather can cause delays in operations, impacting air traffic flow and reducing runway arrival and departure rates. More severe events may also increase airfield flooding and erosion, potentially requiring adjustments to infrastructure, drainage and erosion control measures. Severe weather may impact road safety by heightening the risk of commercial motor vehicle or passenger vehicle crashes. Adverse weather conditions may increase weather-related delays and traffic disruptions. Traveling in severe weather can also contribute to operator fatigue which may affect driver/operator performance and decision-making skills.
Sea level rise
Sea level rise presents challenges to the transportation system and infrastructure. Rising sea level can present flooding risks to underground infrastructure such as subway and road tunnels,
Hurricane Damage from Wave Action to Highway 90 in Bay St Louis, MS (Illinoisphoto.com)

9
allowing water to enter through portals and ventilation shafts. Where sea level rises, coastlines will change and infrastructure that was not previously at risk to storm surge and wave damage may be exposed. Rising sea level can affect transit agencies on the US coasts. These systems may experience more downtime due to flooding, requiring system users to be rerouted and possibly making obsolete earlier transportation investments in low-lying coastal areas. Some US airports located in coastal areas could be vulnerable to increased flooding with sea level rise. Rising sea level may also take a toll on marine highway system infrastructure, including ports, terminals, shipyards, and the interfaces with other transportation modes. Sea level changes may add to the rate of infrastructure deterioration and damage shore side equipment and navigational aids. This damage could impact the ability of vessels to access docks and could potentially require rerouting of freight. Combined Effects
Some of these effects, such as sea level rise and increased precipitation intensity, present greater challenges to the transportation system and infrastructure, when combined with subsidence of the land and vulnerable local geology, as well as storm surge and wave impacts associated with coastal storms. For example, storm surge can damage and destroy coastal roadways, bridges and airports, and sea level rise could exacerbate such effects.
Indirect Impacts
In addition to direct impacts of climate change, transportation systems may also have to adapt to changes in the patterns of settlement or economic activity that may be induced by climate change. For example, changes in the location of agricultural production may demand changes in the transportation system to support moving products to markets. Better understanding of climate change impacts in other sectors will permit a better understanding of potential derivative impacts on transportation.
New York City Vulnerability to 2 to 4 feet of Sea Level Rise with 100-year Storm Surge (Source: Jacob Klaus)

10
Selected DOT Climate Adaptation Outreach and Education
2012
o FHWA: two webinars on pilot programs with San Francisco, New Jersey, Washington, Virginia, and Hawaii State DOTs, Metropolitan Planning Organizations (MPOs) and Universities; peer exchange with MPO representatives from Maine, Massachusetts, New Hampshire, Rhode Island, and Vermont
o FTA: Workshop in Arlington, VA, on real-world approaches. 2011
o FHWA: peer exchange with Indiana MPOs and State DOT representatives from Indiana, Michigan, Kentucky, and Ohio.
o FTA: seminars with transit agencies in Los Angeles, CA, and New Orleans, LA; webinar on transit and climate adaptation and webinar on asset management lessons learned from Transport of London.
o DOT’s Climate Center: two sessions for all DOT employees on the need for climate adaptation in transportation and on regional climate projections and why they matter to transportation.
2010 o FHWA: five workshops addressing climate variability and change in the State and MPO
planning processes.
3. Priority Actions to Adapt to Climate Change DOT is working to ensure that climate vulnerability is considered in all modes of American transportation. To this end, the Department has engaged in outreach and educational activities on climate adaptation for over a decade. The most recent actions are in the chart below.
Highlights from USDOT modal administrations’ accomplishments in FY 2012 as well as planned goals for FY 2013 are identified below. Federal Aviation Administration (FAA) 1. Airport Sustainability Planning FAA is evaluating ways to make sustainability a core objective at every airport through the Sustainable Master Plan Pilot Program by funding long-range planning documents at ten airports around the country. These documents, called Sustainable Master Plans and Sustainable Management Plans, will include initiatives for reducing environmental impacts and achieving economic benefits while increasing integration with local communities. The ten airports were chosen earlier this year and several of the projects will be completed by the end of FY 2012 with the rest targeted for completion in FY 2013. The program will use lessons learned to develop national program guidance on airport sustainability.

11
2. Navigation Infrastructure Assessment In FY 2012, FAA is analyzing aviation facility, service, and equipment profile (FSEP) data for vulnerability to a combination of storm surge impacts that climate change might bring. The assessment process involves overlaying outputs of publically available climate models to FAA assets and operations to identify those most affected by storm surge under projected climate scenarios, evaluating mean high water mark in relation to the existing elevation. Based on the findings from the initial FY 2012 assessment, FAA will perform further analysis and take actions as appropriate in FY 2013. This assessment will provide FAA with an initial basis for understanding where vulnerabilities to climate change, and specifically storm surge in combination with sea level rise, exist within FAA navigation infrastructure. Based on the findings from this assessment, FAA will have a better understanding of how to determine adaptation priorities moving forward. 3. NextGen Network Enabled Weather (NNEW) NextGen Network Enabled Weather (NNEW) is part of an interagency effort to provide quick, easy, and cost effective access to weather information. NNEW will enable National Airspace System stakeholders to access weather information. In addition, the NNEW System will provide seamless interagency access to the National Oceanic and Atmospheric Administration’s (NOAA) 4-Dimensional Weather Data Cube (4-D Wx Data Cube). NNEW System will provide common, universal access to aviation weather data. This will ensure that all categories of aviation weather users will have improved access to timely and accurate weather information to support improved decision making which will facilitate enhanced aviation safety. This tool will allow air traffic management (ATM) to more easily adapt to changing weather scenarios by distributing a single, comprehensive picture of current weather to a wide variety of users and systems. It will also be integrated into other NextGen-related systems in the future. FAA will award a contract for system implementation in CY 2013. The Initial Operating Capability (IOC) is set for CY 2016. Federal Highway Administration (FHWA) 1. Vulnerability and Risk Assessments FHWA provided seed-funding to select grantees to support five infrastructure and/or system vulnerability and risk assessments. The vulnerability assessments were conducted on a regional scale and were completed in December 2011. State DOTs and MPOs will be able to apply the lessons learned from these pilots to their own vulnerability assessments and better determine potential climate impacts by providing case studies of vulnerability assessments in different locations.

12
FHWA will use the completed pilot projects to finalize the conceptual model framework for vulnerability and risk assessment, and disseminate/deploy to state and local partners by the end of FY 2012. In FY 2013, FHWA is planning to initiate additional pilots using the updated framework. This may include deploying the framework to additional locations, including inland locations; identifying resulting adaptation strategies; and examining the trade-offs and cost implications of implementing adaptation strategies. 2. Policy and Technical Guidance Information Documents FHWA Office of Infrastructure and the Office of Planning, Environment, and Realty will jointly issue an information document, by the end of FY 2012, clarifying that adaptation activities are generally eligible uses of Federal-aid funds. This document will describe which adaptation activities qualify. This action will encourage grantees to conduct a range of activities that will help them analyze the risks and start adapting to climate change. Over time, State DOTs and MPOs will better factor climate change into their transportation decision-making processes by understanding that Federal-aid funds can be used for adaptation activities. The result will be improved safety, protected transportation investments, and promotion of economic growth. In FY 2012 and FY 2013, FHWA will develop draft guidance documenting procedures and methodologies for incorporating climate change considerations into planning and design analyses for highway projects in the coastal environment. It will provide information on the state of the practice for addressing climate change in analyses related to sea level rise, storm surge, and wave action. The results will be used to support transportation decision making by demonstrating ways to determine potential climate impacts on coastal highway infrastructure. 3. Peer Exchange Workshops In FY 2012, FHWA held a Peer Exchange workshop series with MPOs and State DOTs focused on effective approaches to considering climate change adaptation in metropolitan and statewide transportation planning processes. FHWA is also developing an informational webinar series for stakeholder organizations and grantees focused on planning for climate change adaptation. Other information sharing opportunities such as presentations and conferences will be pursued. These workshops and webinars are intended to raise awareness and understanding of the need to plan for the increased stresses caused by climate change. The series highlights activities that could be conducted in the planning process to identify vulnerabilities and strategies for alleviating them.

13
Federal Transit Administration (FTA) 1. Pilot Studies on Climate Change Assessments FTA is funding seven transit agency climate adaptation assessments pilots that are scheduled to be completed by spring 2013. These pilots will increase knowledge of climate adaptation within the transit industry, improve practices, and allow the transit industry to better prepare for current and future climate change impacts. The success of these assessments will encourage other transit agencies to begin adaptation assessments and benefit from lessons learned from the pilot program. In FY 2013, FTA will develop and document lessons learned and best practices from the pilot projects. FTA will communicate and disseminate final results in various forums including webinars, conferences, and meetings with transit agencies by the end of FY 2013. 2. Roundtables FTA will include information on climate impacts and adaptation in state of good repair and construction roundtables. This action will be completed by September 30, 2012. FTA will also discuss climate change impacts at all of its state of good repair, asset management and construction roundtables and conferences in FY 2013. 3. Workshops and Webinars In FY 2013, FTA plans to continue outreach on climate impacts on public transportation, risk management tools, and adaptation responses through workshops, webinars, and conference sessions. This will build on the success of workshops and webinars held in 2011 and 2012. 4. Adaptation Research FTA will conduct additional research on climate adaptation. Key areas of research identified by stakeholders at workshops included costs related to extreme weather events and adaptation strategies and transit agency insurance against floods and other weather impacts. A better understanding of the range of costs will facilitate transit agency planning. Research products in this area are expected by the end of FY 2013. 5. Transportation Planning Capacity Building (TPCB) - Planning Process FTA will leverage its existing funding of TPCB to build staff and technical capacity for planning for climate change adaptation. FTA will build awareness of technical assistance resources at industry events and encourage stakeholders to take advantage of TPCB resources. FTA will work with FHWA on supporting identification of Planning for Climate Change Adaptation as a joint

14
Planning Emphasis Area in Metropolitan and Statewide Planning programs by the end of FY 2013. 6. Scenario Planning Program FTA funds technical assistance to MPOs on scenario planning, which helps communities consider the broad range impacts of investment options in long term planning for transportation infrastructure. FTA will discuss planning for climate change adaptation as part of at least two scenario planning events by the end of FY 2013. Typical annual program efforts include two on-demand workshops and two national webinars. Saint Lawrence Seaway Development Cooperation (SLSDC) 1. Work Plan The SLSDC is completing a Climate Change Adaptation (CCA) Plan for actions it will pursue in FY 2013 to integrate climate adaptation considerations into its operations and services. This will include coordinating adaptation plans with partnering agencies as appropriate. The success of the CCA Plan is highly dependent on a complete buy-in from the Canadian Seaway. All departments have begun the process of reviewing all standard operating procedures and emergency response plans in FY 2012. Recommendations and assessments of modifications stemming from the CCA Plan are anticipated to be completed by late summer 2012. The formal roll out of a work plan is scheduled for FY 2013.
2. Engineering Assessment Engineering has completed its review of internal mechanical, electrical and hydraulic systems of lock operations. Modifications will be required to safeguard all of these systems from the extreme consequences of high and low water levels that could result from climate variability and change. SLSDC is currently entering the fourth year of its Asset Renewal Program (ARP). The Corporation will be renewing all components that are essential to safe and efficient lock operations. Several areas will incorporate modifications that will safeguard the system in extreme conditions, including:
• New ice flushing systems for Snell lock - 2013 • Hydraulic lock operating equipment - ongoing • Heating systems to safeguard against extreme cold conditions - 2014 • Drainage systems to safeguard against flooding - 2014 • Funding requirements to any non-ARP programed areas.
3. Outreach The SLSDC’s workforce has received a briefing on the SLSDC’s draft CCA Plan. SLSDC has encouraged feedback from employees to ensure that all areas that may be prone to
15
malfunctioning in extreme conditions be brought to the attention of operations and engineering. Periodic briefings are planned during 2012. In March of 2013, prior to the commencement of the 2013 Navigation Season, the CCA Plan will be formally launched.
SLSDC will discuss the CCA Plan with partnering agencies beginning June 2012. The Saint Lawrence Seaway Management Corporation (SLSMC), SLSDC’s Canadian counterpart, will receive an in-depth briefing in June 2012 at the biannual Strategic Planning Meeting.
The time frame for reviewing the CCA plan with other agencies will span a period from June 2012 to December 2012. Key agencies that will be contacted include:
• International Joint Commission- Canadian / US • US Coast Guard/ Canadian Coast Guard • New York State Department of Conservation • Canadian Fish and Wildlife • Environmental Protection Agency • National Oceanic and Atmospheric Association • US / Canadian Pilots • New York Power Authority • Ontario Hydro • Canadian Ship owners • Canadian Shipping Federation • US Ship Owners
Federal Railroad Administration (FRA) 1. Rail Planning FRA will consider potential climate impacts and adaptation during rail planning and corridor program development. This effort includes developing language for future FRA grants regarding infrastructure planning and development that requires the requestors to consider the impacts of climate variability and change in project planning and design. This action will be completed by the end of FY2012. In FY 2013, FRA will incorporate language in future programs regarding infrastructure planning and development that requires the requestors to consider the impacts of climate variability and change in project planning and design. 2. Risk and Vulnerability Assessments FRA and Amtrak will collaboratively initiate a pilot climate risk and vulnerability assessment to determine the potential impacts - both positive and negative - that climate change will have on Amtrak assets. It is economically beneficial to incorporate a comprehensive climate change

16
analysis in funding decisions to improve and maintain Amtrak assets. Anticipating and preparing for the challenges of the future will yield responsible investments in Amtrak-owned facilities and can provide an example for broader consideration of climate change impacts and adaptation. This action will begin by the end of FY 2012. FRA and Amtrak will complete a climate change vulnerability assessment document by the end of FY 2013.
3. Stakeholder Outreach FRA will conduct outreach focused on incorporating climate change consideration into rail planning and operation through meetings with states and railroads. Promoting the incorporation of climate change impact adaptation efforts into rail transportation decisions prepares railroad owners and operators for the demands of future weather related adversities. The desired outcome would be for states and railroads to incorporate climate adaptation planning into planning projects and operations. This action will begin by the end of FY2012. Federal Motor Carrier Safety Administration (FMCSA) 1. Grant language FMCSA grant application requirements will contain language that requires the requestor to consider the impacts of climate variability and change in their project if the grant is to be used to place equipment or temporary facilities, modify structures, or alter existing infrastructure. Grant language will be finalized by FY 2013 and incorporated into FMCSA’s Financial Assistance Agreement General Provisions and Assurances. FMCSA will also continue to pursue links between adverse weather conditions and commercial motor vehicle safety. 2. Asset Management All infrastructure projects funded with FMCSA funds or grants will consider the impacts of climate variability and change by the end of FY 2012. FMCSA may identify a Pilot Project to highlight how to consider and mitigate these impacts in a project in FY 2013 if an appropriate grant project can be identified. This effort would demonstrate to other applicants how this particular provision would be considered and, potentially, how it can produce a better, more effective project. 3. Stakeholder outreach FMCSA will develop guidelines for considering the impacts of climate variability and change for grant projects in FY 2012 to support the new requirement for grants that will be used to place equipment or temporary facilities, modify structures, or alter existing infrastructure. FMCSA will conduct webinars to present and explain the guidelines in FY 2013 as appropriate. FMCSA

17
communicates regularly with its State partners through the Commercial Vehicle Safety Association meetings which may be the venue at which to present this new requirement. FMCSA will also reach out to stakeholders at partnership meetings on the issue for education purposes. 4. NEPA In FY 2013, FMCSA will formally incorporate guidance into FMCSA NEPA Order 5610.1 for considering the impacts of climate change to environmental issues in its NEPA process. While FMCSA currently calculates greenhouse gas emissions as part of its NEPA analysis, consideration of impacts to the Agency’s mission from climate change will be incorporated. Maritime Administration (MARAD) 1. Work Plan MARAD will incorporate climate change adaptation considerations into internal reviews, especially with regard to port infrastructure projects, shipyard grant application evaluations, and Agency facility modifications. This activity will be implemented by the end of FY2013. 2. Stakeholder Outreach MARAD has begun stakeholder outreach efforts to aid adoption of climate change considerations, and will complete these initial activities by the end of FY 2013. Pipelines and Hazardous Materials Safety Administration (PHMSA) 1. Stakeholder Outreach PHMSA will increase awareness among its industry stakeholders regarding the potential impacts of climate change in FY 2012. PHMSA will conduct outreach via the web and in meetings to assist stakeholders in understanding the implications of climate change. While PHMSA’s pipeline safety mission is not directly impacted by climate change factors, the potential impact on related systems could affect PHMSA’s mission area. The outreach program began in September 2011 and continues today. PHMSA will continue to increase awareness among its industry stakeholders regarding the potential impacts of climate change in FY 2013. PHMSA will continue to conduct outreach via the web and in meetings to assist stakeholders in understanding the implications of climate change through FY 2013. 2. Design Reviews

18
PHMSA conducts design reviews of pipeline projects. During these reviews, PHMSA will raise the issue of whether adaptation to climate change was incorporated in the design considerations. While PHMSA’s pipeline safety mission is not directly impacted by climate change factors, the potential impact on related systems could affect PHMSA’s mission area. The program began in September 2011 and continues today. The pipeline safety program has implemented integrity management requirements for gas and liquid pipelines, requiring pipeline operators to assess and mitigate the most serious risks to their pipelines. The operator must implement an integrity plan that prevents/mitigates those risks. FHWA will begin advising operators to consider adaptation in these plans by the end of FY 2013.

19
4. Recent Accomplishments in Climate Adaptation Many of the documents listed below can be found at the DOT Transportation and Climate Change Clearinghouse website at www.climate.dot.gov. Flooded Bus Barns and Buckled Rails: Public Transportation and Climate Change Adaptation (2011) This FTA report examines climate impacts on U.S. public transportation, adaptation strategies, risk management tools, and incorporation into organizational structures and processes. It includes case studies on New York NY; Los Angeles, CA; Mobile, AL; and London, England.
FTA Policy Statement and Dear Colleague Letter (2011) These documents explain the impact of climate change on the key Federal Transit Administration (FTA) goals of state of good repair and safety and commit FTA to taking action by integrating adaptation considerations into FTA programs.
Transit Climate Change Adaptation Workshops and Webinars FTA held three workshops in 2011 through 2012 (Los Angeles, CA, on August 3, 2011, New Orleans, LA, on October 5, 2011, and Arlington, VA, on March 21-22, 2012) with participation from public transportation agencies, MPOs, academics, government agencies, and consulting firms. For more information see http://www.fta.dot.gov/adaptation. Interim Framework on Conducting Assessments of Transportation Infrastructure Vulnerable to Global Climate Change Effects This FHWA project’s first phase addressed what should reasonably be assumed by practitioners with regard to climate change impacts, its effects differentiated by geographic area, and data to be used in conducting assessments, including data gaps. The Framework itself includes criteria to be considered; recommended categories for existing and planned infrastructure; and methods to assess importance, redundancy and scale. Office of Planning, Environment and Reality and Office of Infrastructure provided research funds to pilot the Framework in five States. This research put together the best thinking currently available in a quick timeframe, and the framework will be updated with lessons learned from the results of the pilot test process. The five pilots were completed in December 2011 and the reports are available on FHWA’s website. http://www.fhwa.dot.gov/environment/climate_change/adaptation/ongoing_and_current_research/vulnerability_assessment_pilots/index.cfm Gulf Coast Study, Phase 1 (2008) Phase 1 of the Gulf Coast Study studied how changes in climate over the next 50 to 100 years could affect transportation systems in the U.S. central Gulf Coast region and discussed how to

20
account for potential impacts in transportation planning. A case study approach was selected that generated useful research methodologies for application in other locations. http://www.climatescience.gov/Library/sap/sap4-7/final-report/ Regional Climate Change Effects: Useful Information for Transportation Agencies (May 2010) This FHWA report provides basic information on projected climate change effects (changes in temperature, precipitation, storm activity and sea level rise) over the near term, mid-century and end-of-century by geographic area. The report includes two appendices: maps for some of the climate change effects, and "typology" of projected climate change information gleaned from recent reports. http://www.fhwa.dot.gov/environment/climate_change/adaptation/resources_and_publications/ The Potential Impacts of Global Sea Level Rise on Transportation Infrastructure—Atlantic Coast Study (2008) The study uses multiple data sources to identify the potential impact of sea level rise on land and transportation infrastructure along the Atlantic coast, from Florida to New York. The study (1) creates maps of land and transportation infrastructure that, without protection, could be inundated regularly by the ocean or be at risk of periodic inundation due to storm surge under a range of sea level rise scenarios; and, (2) provides statistics to demonstrate the potential extent of land areas and transportation infrastructure affected. Integrating Climate Change into the Transportation Planning Process (June 2008) The final report summarizes an FHWA review of the state-of-the-practice in State DOTs and MPOs, including statutes and regulations, and interviews with several planning agencies. Report includes both mitigation and adaptation. http://www.fhwa.dot.gov/hep/climatechange/index.htm Peer Workshop on Adaptation to Climate Change Impacts (December 2008) FHWA conducted a peer exchange (with support from the American Association of State Highway Transportation Officials (AASHTO)) on adaptation of transportation infrastructure to climate change impacts. Participants in the workshop included leaders from FHWA and 11 State DOTs. http://www.fhwa.dot.gov/planning/statewide/pwsacci.htm Peer Workshops on Integrating Climate Change into the Transportation Planning Process (2008) Three peer exchanges were conducted (two in Seattle WA, and the other in Albany, NY) in 2008. The goal of the workshops was to allow senior staff from a variety of MPOs and State DOTs from across the country to come together to share information, experiences, and challenges regarding how both climate change mitigation and adaptation issues can be integrated into the transportation planning process. http://www.fhwa.dot.gov/hep/climate/resources.htm

21
WASHTO Facilitated Session on Asset Management and Adaptation (July 2009) FHWA facilitated a session at a Regional AASHTO meeting in Seattle on managing transportation assets in a changing environment. http://www.washto2009.com/ Additional Initiated or Ongoing Activities include: FHWA Adaptation Working Group FHWA has formed a multi-disciplinary internal working group to coordinate policy and program activities to address climate change impacts to transportation infrastructure. This group operates across all of FHWA, including planning and construction officials. This group first met November 30, 2011 to develop a federal highway action plan. All actions are coordinated throughout FHWA. Gulf Coast Study – Phase 2 Phase 1, completed in 2008, studied how changes in climate over the next 50 to 100 years could affect transportation systems in the U.S. central Gulf Coast region and discussed how to account for potential impacts in transportation planning. Phase 2 is building on the information developed in Phase 1 to develop more definitive information about impacts at the local level in a particular MPO or smaller region. The study is developing more precise tools and guides for State DOT and MPO planners to use in deciding how to adapt to potential climate impacts and determine vulnerability for key links for each mode. Phase 2 will also develop a risk assessment tool to allow decision makers to understand vulnerability to climate change and develop a process to implement transportation facility improvements in a systematic manner. http://www.fhwa.dot.gov/environment/climate_change/adaptation/ongoing_and_current_research/gulf_coast_study/index.cfm NCHRP 20-83(05): Climate Change and Highway Infrastructure: Impacts and Adaptation Approaches This $1 million project was identified by the Transportation Research Board (TRB) executive committee as priority research. FHWA is providing technical assistance to the panel and coordination with other FHWA and DOT activities to prevent duplicative effort. The anticipated product will be guidebooks for transportation practitioners and outreach materials. This study is meant to further results of the interim study listed above, with a larger budget and a goal of addressing more issues. This effort is broader than the Gulf Coast Study since it will create guidebooks for planners, NEPA practitioners, designers, asset managers, and operators. NCHRP has a panel overseeing the research that is broad and diverse. Recently, a literature review and study of climate impacts on transportation was completed to better inform the process. For example, work began on the final deliverables, which are guides on how to incorporate adaptation into the different stages of transportation decision making (planning, construction, operations, etc.) The project is expected to be completed by the summer of 2013.

22
Guidelines for Consideration of GCC Impacts and Adaptation in Project Development and Environmental Review These guidelines will include discussions of how to consider climate change impacts as part of the project development, preliminary engineering, and NEPA analysis (including scoping, environmental context, and alternatives screening and analysis). The Guidelines are meant to provide information to FHWA Division offices on how to handle discussion on impacts in the project development process. Case studies were compiled on adaptation planning and considerations within the NEPA process. Draft guidance is presently under review.

1 | A p p e n d i x B
2012 U.S. Department of Transportation’s Strategic Sustainability Performance Plan
Fleet Management Plan
Fleet Management Plan Status Summary The following activities have been undertaken by the Department:
Incorporate Vehicle Allocation Methodology and other fleet adjusting activities into DOT policy and procedures
o Status: In process
Develop a comprehensive plan and schedule for the establishing the optimal DOT fleet o Status: Completed
The Department has completed its FY 2011 VAM and its Attainment Plan (GSA VAM Agency Reporting Tool)
Additionally, the Department has completed its Fleet Management Plan
Develop DOT plan and schedule for placing alternative fuel vehicles (AFVs) in geographic areas with AFV fuel infrastructure
o Status: In process o A systematic review of each new vehicle placement will be conducted in FY13. o Additionally, an evaluation will be performed to identify if existing alternative
fuel vehicles may need to be relocated to geographic areas with AFV fuel infrastructure.
Plan for alternative fuel vehicle acquisition o Status: In process o DOT will work with each Operating Administration to ensure all new vehicle
acquisitions meet DOT policy and procedures, in addition to Federal AFV acquisition requirements.
Introduction On May 24, 2011, the President issued Presidential Memorandum—Federal Fleet Performance directing the General Services Administration (GSA) to develop and distribute a Vehicle Acquisition Methodology (VAM) within 90 days to Federal Agencies. On August 22, 2011, the GSA released Bulletin FMR B-30, Motor Vehicle Management. The purpose of the Bulletin was to ensure that agencies “satisfy the requirements of the Presidential Memorandum.” The Bulletin requires three agency actions: 1. Annual Implementation of the VAM: The purpose of the VAM is to identify the optimum fleet inventory “that is most efficient to meet the agency’s mission and the identification of resources necessary to operate that fleet effectively and

2 | A p p e n d i x B
efficiently.” 2. Report the VAM Results: Using the GSA VAM Agency Reporting Tool, currently an Excel worksheet, the agency must report its VAM results as an Attainment Plan annually “through FAST3,” with the first submission no later than February 17, 2012. 3. Annual Submission of a Fleet Management Plan: The agency must develop a FMP that describes how it will achieve its optimum fleet inventory by December 31, 2015. DOT completed a VAM study of its domestic fleet, as B-30 specifies. Table 1 depicts DOT’s current inventory, the table show that DOT exempted 99 law enforcement vehicles (as allowed under B-30). In FY13, DOT will include law enforcement as part of the study. Inventory: (Table 1) Total number of motor vehicles in the fleet: 6,261 Total number of vehicle exempted from the study: 99 (1.5%)

3 | A p p e n d i x B
DOT is formalizing steps to be taken to improve fleet management and has laid an organizational foundation that is essential to successful implementation of the FMP (Fleet Management Plan). Five factors characterize an effective fleet organization, and DOT is actively improving in each: 1. Right Sizing of the Fleet 2. Maintaining its automated fleet system - Integrated Logistics Management System (ILMS) 3. Petroleum Reduction/ Alternative Fuel Increase 4. Alternative Fuels Vehicles Acquisitions 5. Updating Fleet policies and procedures
1. Right Sizing of the Fleet
0
4
0
68
1 0
21
2
0
0
0
0
0
0 3 0
0
200
400
600
800
1000
1200
1400
1600
1800
2000
Current Inventory
Exempt
Non‐Exempt

4 | A p p e n d i x B
The DOT fleet is operationally decentralized, with Field Activities throughout the United States and US territories. Vehicle missions range from providing administrative support, airports, pipelines, railroads, highways inspections and improvement projects, and national airspace traffic control equipment routine and emergency maintenance. Management of this geographically dispersed and diverse fleet operation is an ongoing challenge. DOT has put in place policies and procedures to direct its Fleet Management Council (FMC) to meet OMB goals regarding right sizing of the fleet, petroleum reduction and alternative fuels increase. The FMC will supply the organizational leadership needed to implement the FMP. Through shared membership, the FMC will be linked to DOT’s Senior Sustainability Officer. The organizational structure will be in place to ensure integration of the FMP with the Annual Strategic Sustainability Performance Plan by June 2012.
2. Fleet Management Information System, ILMS DOT has implemented a new automated fleet system called the Integrated Logistics Management System (ILMS), which enables monitoring and tracking of acquisitions/leasing of DOT vehicles. The system will also improve communication down to the user level identifying the type of vehicle that is approved by the user’s headquarters. The Departmental Fleet Managers will use this tool to employ early intervention measures to get and stay on track with AFVs acquisitions. ILMS also has a unique feature that capture and project petroleum increase and alternative fuel increase and display this information in a chart to be used by the Fleet Managers to determine if they are meeting the OMB scorecard requirement for fuel usage and reduction. This system, which was first developed in 2010 and updated periodically, meets most of the requirements cited in 41 CFR 102-34.347, and GSA Bulletin FMR-15, Motor Vehicle Management. DOT is currently reviewing the capabilities of ILMS to continue to enhance its capabilities.
3. Petroleum Reduction/Alternative Fuel Increase Challenges:
Grant Programs, Federal Roads Construction Projects, and Airport projects - In FY2010-11 the Department received approximately $48 million from the Federal Recovery Act Program to support high speed rails, improve federal and state highways, bridges and other infrastructure needs. DOT issued this money to federal and state agencies through grants and loans. DOT program elements increased its support ensuring that the new projects under this program is properly managed, thus resulted in additional vehicles for project managers, inspectors, investigators, and etc., which equated into additional fuel being consumed.
GSA fuel reporting system is not accurately capturing alternative fuels being dispensed at refueling stations – The configuration of the fuel pump itself may or may not be coded to transmit to GSA databases the true/actual type of fuel that is pumped into the vehicle. So, for instance, although an E85 fuel pump is designated as such at a particular station and in fact contains E85 fuel, the pump itself may be (mis)configured to electronically transmit the fuel type "Gas" on the automated transaction that is sent to GSA's database. In such cases, then, the GSA database can only reflect the fuel type that is transmitted on the electronic sales transaction; there is no other way of electronically verifying the true type of gas that fills the pump and which ultimately goes into the vehicle

5 | A p p e n d i x B
Progress:
During first phase of right sizing of the fleet, DOT returned approximately 60 underutilized vehicles back to GSA.
DOT replaced its executive fleet vehicles (Ford Grand Marquises) with Ford Fusions and Chevrolet Malibu Hybrids. DOT’s entire motorpool consist of alternative fuel vehicles.
Deputy Secretary for Administration is proactively advocating the importance of fleet sustainability. He held his first town hall meeting with departmental fleet managers and their Supervisors to discuss and provide guidance to the transportation portion of the OMB scorecard with emphasis on meeting sustainability goals.
Deputy Secretary for Administration issued a directive to the Heads of Operating Administrations regarding DOT Fleet Management Performance, which outlined the fleet requirements mentioned in the Energy Policy Act of 2005 (EPAct) and Executive Order (EO) 13514 and provided strategies to meet those requirements.
DOT organizations have seen an increase in alternative fuel usage from manual capturing alternative fuel usage.
DOT is looking at other innovative ways to reduce petroleum by: DOT is piloting 8 Chevrolet volts in three location in the United States (Sterling, VA
(2), San Diego, CA (3), and Van Nuys, CA (3) DOT will be Beta testing an extended range electric truck made by VIA motors for
one year Strategies
DOT is working with GSA Leasing to identify alternative fuel vehicles to replace the petroleum dependent vehicles. The total numbers of vehicles have not been identified at this point but DOT plans to execute these replacements during the FY12/13 acquisition cycle.
DOT is meeting with GSA senior leadership to discuss and provide recommendations to GSA’s faulty fuel reporting system
DOT will be capturing and reporting monthly alternative fuels usage of all alternative fuel vehicles to the Departmental Fleet Manager
The Departmental Fleet Manger is keeping track of all alternative vehicles fuel usage and identify to the DOT organizations which alternative fuel vehicles are not using alternative fuels and report annual fuel usage to GSA
DOT will be identifying and replacing all medium/large SUVs, sedan and trucks with energy efficient, low greenhouse gas vehicles that meet federal standards for reduction of petroleum and emissions, as they come available for replacement under the GSA leasing program
DOT will be conducting semi-annual reviews (right sizing of the fleet) to move underutilized vehicles and consolidate fleet requirements where applicable Update DOT order, which will address new fleet acquisition and fuel consumption requirements
4. Alternative Fuels Vehicles Acquisitions

6 | A p p e n d i x B
Section 303 of the Energy Policy Act of 1992 (EPACT) requires that 75% of all covered light-duty vehicles acquired by Federal fleets in FY 1999, and each year thereafter, must be Alternative Fuel Vehicles (AFVs). DOT met this requirement by acquiring over 600 alternative fuel vehicles for FY 2011.
5. Fleet Policies and Procedures The Fleet Manager is in the process of updating DOT’s 4440.3C, Motor Vehicle Management Manual which communicates policy for all motor vehicles. This document will also describe operational processes for sustainability and overseas vehicles. Many DOT policies are already in place to move DOT toward compliance with the Presidential Memo and B-30 requirements. DOT will continue to refine its internal policies and procedures in support of operational fleet users and to fulfill regulatory requirements. Executive Vehicle Fleet DOT met the requirement in the Presidential Memorandum, Fleet Performance, issued May 24, 2011 and the GSA issued FMR Bulletin B-32 by having a 100% alternative fuel executive vehicle fleet. 701 Waivers Section 701 of EPAct 2005 requires Federal agencies to operate dual fueled vehicles on alternative fuel unless the Department of Energy (DOE) determines that a vehicle qualifies for a waiver of this requirement. Agencies may request waivers from DOE for dual fueled vehicles located where the alternative fuel is not reasonably available, or where the alternative fuel is unreasonably more expensive than gasoline. In 2011, DOT requested 1,532 waivers. However, in 2012 DOT’s plan to cut the number of waivers by 10% by working with DOE’s National Resource Laboratory to identify alternative fuel vehicles that are not located near alternative refueling areas and have them moved to alternative fuel locations. VAM Exemptions The Presidential Memorandum on Federal Fleet Performance states that the head of the agency may exempt vehicles used for law enforcement, protective, emergency response, or military tactical operations of that agency from the provisions of the VAM study. It also states that non-domestic fleet operations may be included at the discretion of the agency head. The DOT has exempted 96 law enforcement vehicles and 3 emergency vehicles. This is less than 1.6 percent of the fleet and exemptions are authorized for vehicles that meet unique/mission critical requirements.”

7 | A p p e n d i x B
DOT will include all vehicles in future VAMs as to gain the maximum benefit from the process. DOT will implement policies that ensure that the agency’s law enforcement and emergency vehicles are the smallest, most fuel efficient, and least greenhouse gas emitting vehicles necessary to execute mission requirements as outlined in GSA Bulletin FMR B-33, “Alternative Fuel Vehicle Guidance for Law Enforcement and Emergency Vehicle Fleets. Fleet Size DOT has planned a 10 percent reduction in its overall fleet size. DOT made a serious error in completing its VAM Reporting Tool. It shows no change between the baseline and optimal fleets as shown in the chart below. This error will be corrected in the FY13 submission of the VAM reporting.
Vehicles, Non‐Exempt, 6,273 , 98%
Vehicles, Law Enforcement, 96 , 2%
Vehicles, Emergency Response, 0 , 0%
Vehicles, Overseas, 3 , 0%
Vehicles, Other, 0 , 0%
Vehicles, Other, 99 , 2%
Proportion of Exempt to non‐Exempt Vehicles in 2011
Non‐Exempt Law Enforcement Emergency Response Overseas Other

8 | A p p e n d i x B
0
1,000
2,000
3,000
4,000
5,000
6,000
7,000
Number of Vehicles
Change in Fleet Size Baseline to Optimal
Percent Change 0.2% 4% 4% 2% 10.2%
Vehicles 6,274 6,261 6,010 5,760 5,635 639
Baseline 2012 2013 2014 2015Optimal
Change
DOT’s 2015 plan shows a 10 percent overall reduction, with reductions in every vehicle type. DOT plan to shifts larger to smaller vehicles; i.e., a greater reduction in large vehicles with increases in smaller ones with the intent to reduce in fleet size and petroleum consumption which should be sufficient for achieving the agency's scope 1 & 2 GHG reduction target by 2020. Vehicle Type Composition DOT has proposed reductions in vehicle types and will concentrate on ensuring a change in the mix of vehicles. DOT projects reductions in every vehicle category, especially trucks of all sizes. In future years, DOT plans to employ the usage of LSEVs. On a percentage basis, medium and light trucks face the greatest reductions. DOT will consider changes in FY 2013 to mix its vehicles, as intended by the VAM process and the Presidential Memorandum. AFV Vehicles Composition DOT projects it will eliminate 10% of conventional fuel vehicles from its fleet. DOT plans to continue to exchange the remaining vehicles with alternative fuel vehicles. In the past three years, DOT has surpassed the EPACT requirement of 75 percent of all covered light duty vehicles acquired being alternative fuel vehicles. DOT will continue to surpass this requirement in FY12 by acquiring more than 700 alternative vehicles to replace conventional vehicles in locations where biofuel (e.g., E85 or biodiesel) is available. In locations where biofuel is not available, DOT will consider acquiring AFVs that operate on other alternative fuels (e.g., electricity, natural gas, or propane), including hybrids and other low GHG-emitting vehicles. DOT has sent a listing of all its Light, Medium, and Heavy duty vehicles to GSA alternative fuel department to provide alternative fuel replacement for the upcoming FY13 acquisition year. Dual-fueled vehicles capable of operating on either petroleum or alternative fuel will be placed in locations where the alternative fuel is available (to avoid the need for EPAct section 701 waivers). DOT provided strict guidelines to GSA Acquisitions outlining AFV placement.

9 | A p p e n d i x B
AFV Infrastructure In the past three years, DOT has better aligned it fleet with the help of GSA acquisitions. DOT has instructed GSA to inform their Fleet Service Representatives to not deploy or replace alternative fuel vehicles in locations that do not have alternative refueling stations. This practice along with strict justification and senior leadership oversight has greatly reduced DOT reliance on 701 waivers. In FY13 DOT will used this strategy to reduce the use of 701 waivers by 10% and employ low-GHG vehicles in areas without infrastructure. Vehicle Sourcing/Cost DOT will study the costs of its current vehicles sourcing and making changes to maximize economy and efficiency. While the fleet consists of 92 percent GSA Fleet vehicles, DOT plans to reduce its inventory by 10 percent and agency-owned by 5 percent. DOT looked at the critical utilization and the mission of its vehicles. DOT conducted a review of its inventory in FY12 to determined underutilized vehicles and consolidated fleet requirements where applicable. DOT will continue this practice on a semi-annual basis. Conclusion
February 2012 through September 2012, DOT will track alternative fuel vehicles usage and daily miles traveled
DOT Fleet Manager will communicate problem areas with Operating Administrations and fleet operators and work with Operating Administrations’ fleets to identify strategies to improve fuel usage performance
DOT will direct Operating Administrations to right-size their fleets using the criteria established by the Deputy Assistant Secretary for Administration and GSA’s B-30 guide
DOT will reduce its 701 waivers by 10% in FY2012, require its Operating Administrations to:
o Evaluate public transportation availability o Reassess vehicle needs for mission support o Ensure the optimal type and size of vehicles are acquired according to the
mission o Target non-waivered AFVs where alternative fuel is not being used by
utilizing the National Renewable Energy Laboratory (NREL) Alternative Fuel Station Locator website
June 2013, 2014: Submit updated Fleet Management Plan (FMP) June 2012, 2013, 2014: Incorporate FMP into Annual Strategic Sustainability Plan December 31, 2015: Complete fleet-size optimization initiative covering number
and types of vehicles and fueling of alternative fuel vehicles (per B-30) In FY 2013 DOT will conduct a comprehensive survey to determine what part of its fleet
if any can be used as shared services as required by GSA’s B-30 guide. In the past, DOT has looked at ways and tried to partnership with other federal agencies in regards to combining bus routes and reducing cost. DOT also looked at combining regional offices fleet services into centralized motorpool operations, this study is ongoing and pilot programs are being scheduled for the near future.

1 | A p p e n d i x C
2012 U.S. Department of Transportation’s Strategic Sustainability Performance Plan
Biobased Procurement Strategy
Addendum to the 2012 Strategic Sustainability Performance Plan:
Responding to the President’s Memorandum on Promotion of Biobased Markets On February 21, 2012, President Obama signed Driving Innovation and Creating Jobs in Rural America through Biobased and Sustainable Product Procurement, a Presidential Memorandum requiring all Federal agencies to increase their purchase of biobased products. The Department of Transportation (DOT) is moving aggressively to implement the Presidential Memorandum requirements. It should be noted that the Federal Aviation Administration (FAA), a DOT Operating Administration follows the Acquisition Management System (AMS) rather than the Federal Acquisition Regulation (FAR), which is the standard acquisition system for most other Federal agencies.1 AMS establishes FAA policy and guidance for all aspects of lifecycle acquisition management. Hence, DOT’s biobased acquisition strategy contains information for the entire department, but includes some activities that are specific to FAA’s AMS. Accomplishments to date include: • Encouraged acquisition workforce participation in classroom- and web-based biobased
procurement training.
• Developed Contracting Officer’s Representative course for program officials that includes an emphasis on the green procurement program. (DOT, excluding FAA)
• Drafted a special provision related to sustainable acquisition for inclusion in all DOT contracts. (DOT, excluding FAA)
• Included biobased clauses in all janitorial and construction contracts in FY2011. (DOT, excluding FAA)
• Developed a list of Product Service Codes (PSC) for biobased purchasing. (DOT, excluding FAA)
• Currently updating the Transportation Acquisition Regulation and Transportation Acquisition Manual to include sustainable acquisition (DOT, excluding FAA)
• Developed and incorporated into the AMS, the Green Procurement Plan (GPP)which includes biobased considerations. The purpose of the GPP is to enhance and sustain the FAA mission through cost-effective acquisition that complies with applicable requirements, reduces resource consumption, and minimizes waste generation. (FAA)
• Updated AMS Statement of Work (SOW) Generator templates to reflect biobased requirements. The SOW Generator provides tools and guidance for programs to follow in
1 The Department of Transportation and Related Agencies Appropriations Act of 1996, Pub. L. No. 104-50, Section 348, required FAA to develop and implement an acquisition management system that addressed the unique needs of FAA.

2 | A p p e n d i x C
creating their own SOWs. Categories of SOW templates updated include building maintenance, grounds maintenance, custodial services, and food services. (FAA)
• Updating on an ongoing basis AMS procurement policy and guidance to reflect biobased requirements. (FAA)
• Updating AMS contract clauses and corresponding prescriptions to reflect biobased requirements. A clause communicates specific contract requirements/provisions to the offeror/contractor, and a prescription explains whether, based on the contract’s attributes (e.g., service vs. supply), the clause should be included in the contract. AMS currently includes biobased clauses, and FAA is updating them as necessary to include additional language on biobased tracking/reporting. (FAA)
Baseline for Biobased Contracting Prior to the issuance of the Presidential Memorandum, DOT tracked quarterly compliance with the EO 13514 sustainable acquisition goal based on a five percent sample of appropriate contracts. The quarterly 5% sample was selected at random, and contract actions were considered applicable based on whether sustainable acquisition considerations should have been taken into account. Since this sampling was done in support of the broad sustainable acquisition goal, each specific sustainable acquisition goal (e.g., biobased procurement) did not need to be applicable for each contract in order for the contract to be considered applicable for the broad requirement. Therefore, biobased procurement may have been applicable for some contracts within the sample but not for others. In an effort to establish a baseline of biobased procurements during the first and second quarters of FY2012, the previously selected 5% sample for the broad sustainable acquisition goal was assessed against biobased requirements. The sample included four contracts suitable for biobased considerations. Three of these included the biobased clauses and addressed biobased products in the requirements of the contract. One janitorial contract included the biobased clauses but did not address biobased products in the requirements of the contract. There were several other contracts related to construction that did not address biobased products in the requirements because biobased requirements were determined not to be applicable for these contracts. Therefore, there were only four biobased eligible contracts in the 5% sample, and 75% met all the biobased requirements in the first two quarters of FY 2012. FY 2013 Target/Compliance Goal:
• As a leader in sustainable acquisition strategies and compliance, DOT plans to achieve an annual goal of 50 percent compliance with the biobased requirements for the subset of contracts suitable for biobased procurement in FY2013 and increase by 10 percent annually thereafter.
• The Department plans to achieve full compliance of the 95% sustainable acquisition goal in EO 13514 for the subset of contracts suitable for biobased procurement no later than FY 2018.
Strategies for Improving Compliance:
3 | A p p e n d i x C
The Department’s strategy for improving compliance—full incorporation of requirements and clauses for biobased products in relevant and appropriate contracts and follow on activities to ensure compliance is achieved—includes the following elements:
• Starting in the fourth quarter of FY2012, DOT asked its Operating Administrations (OAs) to identify Recovered Materials and Biobased/BioPreferred purchases that should contain clauses for sustainable purchasing. Using the Federal Procurement Data System (FPDS) to assist the OAs, a list of Product Service Codes (PSC) that lend themselves to “green” products and services has been identified and provided to the OAs. OAs have been asked to do a contract review using a 5% sample to determine if at least 50% of the applicable contracts include contract clauses and Statement of Work language consistent with the biobased requirement and provide corrective actions where appropriate.
• Generate and disseminate Department- and OA-level reports on biobased compliance using data from newly created biobased reporting elements in the Federal Procurement Data System–Next Generation.
• Develop an awareness campaign and provide training opportunities for all employees involved in biobased acquisition. (DOT, excluding FAA)
• Review and assess solicitation announcements on the FedBizOpps website to ensure that biobased language and requirements are incorporated into applicable contracts and take corrective actions where requirements have been erroneously omitted. (DOT, excluding FAA)
• Encourage the use of USDA contract templates from the BioPreferred website, http://www.dm.usda.gov/procurement/programs/biobased/contracttemplates.htm. (DOT, excluding FAA)
• Include biobased requirements in at least 60% of its cafeteria, fleet maintenance and construction contracts and attempt to include requirements and performance standards for biobased products in 100% of newly awarded janitorial contracts. (DOT, excluding FAA)
• Increase its biobased purchasing by expanding requirements clauses to 100% of cafeteria and fleet maintenance contracts; conducting past performance reviews on janitorial contracts to ensure ongoing compliance; and emphasizing requirements and scope of work for construction and renovation contracts to include biobased insulation, carpeting, sealants, roofing materials, etc. (DOT, excluding FAA)
• Develop a news and informational website on Sustainable Acquisition for the acquisition workforce. (DOT, excluding FAA)
• Establish a web-based tool to allow government personnel as well as contractors to suggest ways to incorporate into contracts new biobased products designated under the Federal procurement preference program. (DOT, excluding FAA)

4 | A p p e n d i x C
• Finalize policy, guidance, and contract clause updates consistent with biobased requirements and incorporate them into the AMS. (FAA)
• Communicating policy, guidance, contract clause, and SOW template updates to contracting personnel to ensure they are fully aware of biobased requirements. (FAA)
• Continuing to communicate USDA biobased procurement training opportunities to contracting personnel. (FAA)
• Monitoring progress toward biobased requirements quarterly based on a 5% sample of appropriate contracts, and taking corrective action as necessary. (FAA)
Required Specification Reviews The Presidental Memorandum requires that wherever possible and appropriate, agency specifications require the use of sustainable products, including USDA-designated biobased products, and that any language prohibiting the use of biobased products is removed. The only DOT OAs that have specifications under their direct control are the Federal Aviation Administration (FAA) and Federal Lands Highway Division of the Federal Highway Administration (FHWA). FAA will take steps to review its agency specifications to ensure that the use of sustainable products—including USDA-designated biobased products—are required wherever possible and appropriate, and that any language prohibiting biobased products is removed. The Federal Lands Highway office provides planning and design services and construction administration of contract for bridge and highway construction for Federal Lands Management Agencies. In this role FHWA maintains the Standard Specifications for Construction of Roads and Bridges on Federal Highway Projects. FHWA is in the process of reviewing and updating their standard specifications. Other than the erosion control items and mulch, the specifications do not appear applicable to the biobased products listed by the USDA.
In addition, FHWA manages the Federal-aid highway program, which involves the 52 State Transportation Agencies (STA) and numerous local public agencies that are responsible for designing, construction and maintaining their own transportation systems. In this Federal-assistance program, each STA has developed and is responsible for its own standard specifications. While the FHWA works cooperatively with the STAs and local agencies to improve the quality of construction and implement various recycling programs, FHWA does not have direct control over these specifications. The FHWA will continue to work with its Federal-aid recipients to encourage recycling programs and eliminate barriers for the use of biobased materials and encourage recipients to remove any language prohibiting the use of biobased products.