strategies and spoken production on three oral communication tasks
TRANSCRIPT

Strategies and Spoken Production on Three Oral
Communication Tasks: A Study of High and Low
Proficiency EFL Learners
Sarah Khan
September 2010
Departament de Filologia Anglesa i Germanística Doctoral Thesis
Facultat de Filosofia i Lletres supervised by
Universitat Autònoma de Barcelona Dr. Mia Victori i Blaya


To Pep, Jasmine and Joui


Acknowledgements
I would like to thank my research supervisor, Mia Victori, for her constant support. Her genuine
dedication to the field of Applied Linguistics has been a source of inspiration. Her patience and time,
often out of hours, in revising manuscripts with muddled up contents and incomprehensible statistics and
her ability to fathom out what I’m saying in my leaves-a-lot-to-be-desired Catalan, has been truly
appreciated. Her sense of fairness, thoughtful criticisms and recognition of the work I’ve put in have been
essential to the progress and completion of this project.
A big thanks to the Universitat de Vic to whom I feel extremely grateful for facilitating the work
undertaken in terms of resources, time made available during the academic year and paid leave to finish
writing up. Without this essential support I would not have embarked on a PhD.
I would also like to thank the following people who took part in this study. Firstly, the teachers
in Osona for their enthusiasm and dedication to their work and giving up at least two English classes so
that I could pilot the strategy questionnaire with their students. Thanks also go to the UVIC students who
participated in the study and especially to those who did extra penitence in their free time.
Thanks to the following friends and dedicated colleagues, Debbie Price, Gonçal Calle, Fina
Guix, Steve Graham, Ma Carme Crivillés, Montse Corrius, Emma Hitchen, Anna Masferrer, Barbara
Jackson, Joan Masnou and Anna Vallbona and her colleagues in FE, for their participation and moral
support at various times. Special thanks to Rosa Licata for her invaluable help with the data collection
and to Daniel Nicholls, Paul Marshall, Gry Edwards and Sue Tyler for benchmarking. A huge thanks to
Victor Urrea in the Systems Biology department for solving SPSS problems and his brilliant educational
instruction on statistics.
I would also like to give a special thanks to the following people - for putting up with the
hysterical, unreasonable taciturn side of my nature which has reeled out of proportion as my deadline
has come nearer, and who have thankfully ignored it, without ignoring me. To Àngels, the “just do it”
girl who has bailed me out from many a situation, not least by reliably inter-rating and reading the
unreadable. Also, tusen takk to Sue and Gry for a million and one things, especially for all the laughs.
Finally, thanks to my family, Mum and Dad, who always appear miraculously in the hour of
need, in-laws, Teresa and Josep, for their unconditional support and kindness and my sister and Felix for
their sincerity and depth of vision. Thanks to Pep, Jasmine and Joui, whose combined talents have
worked their magic on these pages and who have lived this year in my psychological absence, with all
kinds of fun forsaken or put on hold. Without all these guardian angels this thesis would not have been
possible.
If you haven’t done one (PhD) and you think you’d like to, all I can say is it’s like being dealt
that fatal Chance card “Go to jail. Go directly to jail. Do not pass go. Do not collect £200”.


‘Then you should say what you mean,’ the March Hare went on. ‘I do,’ Alice hastily
replied; ‘at least – at least I mean what I say – that’s the same thing, you know’.
Lewis Carroll


Table of contents
LIST OF TABLES i
LIST OF FIGURES v
ABBREVIATIONS vi
Introduction
0.1 Oral communication in an EFL context 1
0.2 Justification for the study 4
0.3 Research questions 8
0.4 Organisation of the thesis 10
CHAPTER 1 Speech Production
1.1 First language speech production 14
1.2 Speech production models 16
1.2.1 Spreading activation 17
1.2.2 Modular theory 17
1.3 Monitoring 22
1.4 Second language speech production 24
CHAPTER 2 Strategies
2.1 Strategies within second language learning theory 31
2.2 Language Learner Strategies 34
2.2.1 Definition and classification 34
2.2.2 Limitations of Language Learner Strategy research 42
2.2.3 Language Learner Strategies and proficiency 48
2.2.4 Language Learner Strategies and tasks 53
2.2.5 Data collection methods in Language Learner Strategy research 58
2.2.6 Validating perceived strategy use 63
2.3 Communication Strategies 64
2.3.1 Definition and classification 66
2.3.1.1 Interactional approach 70

2.3.1.2 Psycholinguistic approach 73
2.3.1.3 Integrated approach 76
2.3.2 Limitations of Communication Strategies research 79
2.3.3 Communication Strategies across tasks and proficiency groups 82
CHAPTER 3 Task-based research
3.1 Definitions of task 91
3.2 Criteria for identifying tasks 93
3.3 Task classification systems 94
3.4 Tasks and cognition 97
3.4.1 Skehan’s Limited Attentional Capacity Model 97
3.4.1.1 Task features according to Skehan 100
3.4.2 Robinson’s Multiple Resources Attentional Model 101
3.4.2.1 Task features according to Robinson 102
3.5 Research into task dimensions 107
3.5.1 Cognitive dimensions of tasks 108
3.5.1.1 Number of elements 108
3.5.1.2 Reasoning demands 109
3.5.1.3 Prior knowledge 110
3.5.2 Interactional dimensions of tasks 113
3.5.2.1 Level of information exchange 113
3.5.2.2 Information flow 114
3.5.2.3 Goal orientation 115
3.5.3 Limitations of research into task dimensions 117
CHAPTER 4 Method
4.1 Design of the study 121
4.2 Instruments 123
4.2.1 The Strategy Questionnaire 123
4.2.1.1 The first pilot study 124
4.2.1.2 The second pilot study 128
4.2.1.3 The third pilot study 137

4.2.2 The three oral communication tasks 143
4.2.2.1 Task implementation 143
4.2.2.2 Task selection 144
4.2.2.3 Analysis of tasks 146
4.2.3 The Reflective Questionnaire 150
4.3 Participants 150
4.3.1 The Background Questionnaire 153
4.3.2 The placement test 153
4.3.3 The oral test 154
4.4 Data collection procedures 155
4.4.1 Whole sample 155
4.4.2 Sub-sample 158
4.5 Data analysis 160
4.5.1 Statistical analysis 160
4.5.2 Task transcription 161
4.5.3 Spoken production measures and coding 162
4.5.3.1 Basic unit of measure 165
4.5.3.2 Fluency 168
4.5.3.3 Accuracy 168
4.5.3.4 Complexity 170
4.5.3.5 Preliminary analysis of production measures 171
4.5.4 Strategy identification and coding 174
4.5.5 Stimulated recall 178
CHAPTER 5 Results
5.1 Across-task comparisons 180
5.1.1 Spoken production across tasks 180
5.1.1.1 High proficiency 181
5.1.1.2 Low proficiency 185
5.1.1.3 Native speaker benchmarks 189
5.1.2 Perceived strategy use across tasks 191
5.1.2.1 Whole sample 192

5.1.2.2 High proficiency group 200
5.1.2.3 Low proficiency group 205
5.1.2.4 Summary of perceived strategy use across tasks 208
5.2 Between-groups comparisons 209
5.2.1 Spoken production between proficiency groups 210
5.2.2 Perceived strategy use between proficiency groups 213
5.3 Summary of across-task and between-groups comparisons 219
5.3.1 Spoken production 219
5.3.2 Perceived strategy use 220
5.4 Perceived strategy use versus actual strategy use 221
5.4.1 Comparing PSU and ASU 222
5.4.1.1 Consistency 223
5.4.1.2 Discrepancy 225
5.4.1.3 Unconfirmable 226
5.4.2 High and low proficiency: PSU versus ASU 227
5.4.3 Reassessing PSU results 232
5.5 Additional Results 234
5.5.1 Pre-task planning 234
5.5.2 Task duration 236
5.5.3 Learners’ perceptions of the tasks 237
5.6 The Strategy Questionnaire as a predictor of spoken production 241
5.7 Chapter summary 244
CHAPTER 6 Discussion
6.1 Perceived strategy use versus actual strategy use 251
6.2 Across-task comparisons 258
6.2.1 Spoken production across tasks 258
6.2.1.1 Accuracy 259
6.2.1.2 Structural complexity 263
6.2.1.3 Lexical complexity 266
6.2.1.4 Fluency 270
6.2.1.5 Self-repair 273

6.2.2 Strategies across tasks 277
6.2.2.1 Low overall strategy use 277
6.2.2.2 Interactional strategies 280
6.2.2.3 Compensation strategies 283
6.2.2.4 Conversation-flow Maintenance strategies 285
6.2.2.5 Planning strategies 287
6.2.2.6 Evaluating strategies 289
6.2.2.7 Few differences across tasks 289
6.3 Between-groups comparisons 290
6.3.1 Spoken production 290
6.3.2 Strategies 296
6.4 The Strategy Questionnaire as a Predictor of Spoken Production 300
CHAPTER 7 Conclusion
7.1 Final conclusions 304
7.2 Limitations of the study 311
7.3 Pedagogical implications 313
7.4 Future research directions 316
References 320
Appendices
Appendix A Strategy Questionnaire 349
Appendix B Piloting Instruments 352
B1 Pilot Questionnaire 1 352
B2 Pilot Questionnaire 2 353
B3 Structured interview excerpts 357
Appendix C Scree Plot from principal components analysis 359
of Stratetgy Questionnaire data (N=330)
Appendix D Participant biodata 360
Appendix E Oral test 361
Appendix F Background Questionnaire 364

Appendix G Reflective Questionnaire 365
Appendix H Tasks 366
H1 Picture Story 366
H2 Art Description 367
H3 Information Gap 369
Appendix I Stimulated recall protocol 371
Appendix J CHAT transcription excerpt 372
Appendix K Transcription codes 373
Appendix L Instructions for coding spoken production 374
Appendix M Instructions for coding strategies 379
Appendix N Strategy identification 380
Appendix O Descriptive statistics of PSU for high proficiency group 390
Appendix P Descriptive statistics of PSU for low proficiency group 391
Appendix Q Descriptive statistics of ASU for high proficiency group 392
Appendix R Descriptive statistics of ASU for low proficiency group 393
Appendix S Descriptive statistics of spoken production measures for 394
whole sample
Appendix T Mann-Whitney tests for ASU differences between high 395
and low proficiency groups
Includes DVD/Audio CD

i
List of tables
Table 2.1 Definitions of Language Learner Strategies 35
Table 2.2 Types of classifications of Langauge Learner Strategies 39
Table 2.3 Comparisons of strategy-assessment types 59
Table 2.4 Definitions of Communication Strategies 67
Table 2.5 Various taxonomies of Communication Strategies 68
Table 3.1 Task complexity as proposed by Skehan 100
Table 3.2 A triad of task complexity, task condition and task 103
difficulty factors
Table 3.3 Summary of findings on cognitive task dimensions 112
Table 3.4 Summary of findings on interactional task dimensions 118
Table 4.1 Latin square design 122
Table 4.2 Consistency between perceived strategy use and 127
actual strategy use (N=4) in the first pilot study
Table 4.3 Second pilot study: scale interpretation on second 132
version of strategy questionnaire
Table 4.4 Item changes to the second version of the strategy 135
questionnaire
Table 4.5 Total variance explained by the five factors 138
on the Strategy Questionnaire
Table 4.6 Factor loadings for the 44-item Strategy Questionnaire 139
Table 4.7 Comparison of task complexity (cognitive factors) across 147
the three tasks
Table 4.8 Comparison of task conditions (interactional factors) 148
across the three tasks
Table 4.9 Number of pairs according to gender and oral proficiency 149
Table 4.10 Participants according to oral proficiency and gender 151
Table 4.11 Operationalisation of complexity, accuracy and fluency 163
Table 4.12 Percentage agreement of inter-rater scores 165
Table 4.13 Calculation of fluency 168
Table 4.14 Calculation of accuracy 169

ii
Table 4.15 Factor loadings for production measures 173
Table 4.16 Source of strategy identification in the qualitative data 176
Table 5.1 Descriptive statistics for spoken production measures 182
across tasks for high proficiency group (N=24)
Table 5.2 Friedman tests for spoken production measures across 182
tasks for high proficiency group (N=24)
Table 5.3 Wilcoxon tests for spoken production measures across 184
tasks for high proficiency group (N=24)
Table 5.4 Descriptive statistics for spoken production measures 186
across tasks for low proficiency group (n=24)
Table 5.5 Friedman tests for spoken production measures across 187
tasks for low proficiency group (N=24)
Table 5.6 Wilcoxon tests for spoken production measures across 188
tasks for low proficiency group (N=24)
Table 5.7 Descriptive statistics for spoken production measures 190
across tasks for native speakers
Table 5.8 Descriptive statistics of aggregated strategy use (N=48) 192
Table 5.9 Descriptive statistics of strategy use according 193
to factor (N=48)
Table 5.10 Results of tests of within-subjects contrasts 194
(univariate 2 by 2)
Table 5.11 Descriptive statistics for individual perceived 195
strategy use (N=48).
Table 5.12 Friedman tests for individual strategies showing 196
significant differences (N=48).
Table 5.13 Wilcoxon tests showing significant differences in 197
individual strategies (N=48)
Table 5.14 Summary of perceived strategy use for the 199
whole sample (N=48)
Table 5.15 Descriptive statistics for aggregated strategy use 200
of high (N=24) and low (N=24) proficiency groups
Table 5.16 Descriptive statistics of strategy use according to factor 201

iii
of high (N=24) and low (N=24) proficiency groups
Table 5.17 Friedman tests showing significant differences in 203
perceived strategy use of high proficiency group (N=24)
Table 5.18 Summary of perceived strategy use for high proficiency 204
group (N=24)
Table 5.19 Friedman tests showing differences in perceived 207
strategy use of low proficiency group (N=24)
Table 5.20 Summary of perceived strategy use for low group (N=24) 207
Table 5.21 Descriptive statistics for spoken production measures 210
for native speakers, high and low proficiency groups
Table 5.22 Mann-Whitney tests for high and low proficiency groups 213
Table 5.23 Mann-Whitney tests comparing aggregated strategy use 214
of high (N=24) and low (N=24) proficiency groups
Table 5.24 Mann-Whitney tests for strategy use between high and 217
low proficiency groups
Table 5.25 Summary of between-group differences 218
Table 5.26 Number of individual strategy differences across tasks 220
Table 5.27 Number and direction of individual strategy differences 220
between groups
Table 5.28 Low Group: PSU versus ASU for Item 22 224
Table 5.29 High Group: PSU versus ASU for Item 11 / 33 224
Table 5.30 Low Group: PSU versus ASU for Item 4 225
Table 5.31 Low Group: PSU versus ASU for Item 7 226
Table 5.32 Low Group: PSU versus ASU for Item 8 226
Table 5.33 ASU:PSU consistency for high proficiency group 228
Table 5.34 ASU:PSU consistency for low proficiency group 230
Table 5.35 Aggregated ASU and PSU for quantifiable 232
strategies (N=48)
Table 5.36 Mean pre-task planning time in seconds 235
Table 5.37 Mean task duration in minutes 236
Table 5.38 Task perception for high proficiency group (N=24) 238
Table 5.39 Task perception for low proficiency group (N=24) 238

iv
Table 5.40 Summary of multiple regression analysis (N=48) 242
Table 5.41 High proficiency: summary of significant differences 246
across tasks
Table 5.42 Low proficiency: summary of significant differences 248
across tasks
Table 5.43 Summary of between-groups comparisons 250
Table 6.1 Summary of differences in accuracy across tasks 259
Table 6.2 Summary of differences in structural complexity 263
across tasks
Table 6.3 Summary of differences in lexical complexity 266
across tasks
Table 6.4 Summary of differences in fluency across tasks 271
Table 6.5 Summary of differences in self-repair across tasks 273

v
List of figures
Figure 1.1 Levelt’s (1999) blueprint of the speaker 19
Figure 3.1 Theorising dimensions of performance based on 99
Skehan and Foster (2001:190)
Figure 4.1 Classroom setup during task performance 157
Figure 4.2 Setup in stimulated recall sessions 159
Figure 5.1 Mean ranks for spoken production measures across 183
tasks for high proficiency group (N=24)
Figure 5.2 Mean ranks for spoken production measures across tasks 187
for low proficiency group (n=24)
Figure 5.3. Individual strategy use of high proficiency group 202
across the three tasks
Figure 5.4 Individual strategy use of low proficiency group 206
across the three tasks
Figure 5.5 Picture Story: spoken production for low, high and 211
native speakers
Figure 5.6 Art Description: spoken production for low, high 211
and native speakers
Figure 5.7 Information Gap: spoken production for low, high 212
and native speakers
Figure 5.8 Aggregated PSU across tasks of high (N=24) 214
and low (N=24) proficiency groups
Figure 5.9 Picture Story: Mean strategy use for high and low 216
proficiency groups
Figure 5.10 Art Description: Mean strategy use for high and low 216
proficiency groups
Figure 5.11 Information Gap: Mean strategy use for high and low 216
proficiency groups
Figure 5.12 Pre-task planning time for low, high and native speakers 235
Figure 5.13 Mean task duration for low, high and native speakers 237

vi
Abbreviations
ALTE ...................... Association of Language Testers in Europe
AS ........................... Analysis of speech
ASU ........................ Actual strategy use
CAF ........................ Complexity, accuracy and fluency
CEFR ...................... Common European Framework for Languages
CS ........................... Communication strategies
EFL ......................... English as a foreign language
FCE ........................ First Certificate in English
GLM ....................... General linear model
L1 ........................... First language
L2 ........................... Second language
LLS ........................ Language learner strategies
MANOVA ............. Multiple analysis of variance
NNS ....................... Non-native speakers
NS .......................... Native speakers
PSU ........................ Perceived strategy use
SLA ........................ Second language acquisition
SQ .......................... Strategy Questionnaire
TOEFL ................... Test of English as a Foreign Language
UCLES .................. University of Cambridge Local Examinations Syndicate
UVIC ...................... Universitat de Vic

vii

Introduction
1
0.1 Oral communication in an EFL context
Learners of English as a foreign language (EFL) are often more preoccupied
with improving their speaking skills than any other language skills, something they
often voice in the classroom and which has been revealed in several studies where
learners have been asked to reflect on their language needs and learning (see for
example, Khan & Pinyana, 2004; Lafford, 2004; Victori, 1992). This is not surprising in
the foreign language context where there are fewer practice opportunities for
communicating in the target language than for those learning in the target community,
and so oral communication skills are harder to develop than the other language skills:
reading, listening and writing.
This need to speak English, particularly for business and travel has emerged
from advances in the speed of communication systems and mobility, which have
spurred globalization and have lead to the exponential growth of the use of English as a
lingua franca. Within the European community the standardization of academic
practices and quality control assurance across member states has meant that learning
English has become a major necessity. Several measures have been taken to encourage
exchanges between academics and professionals of the different European member
states to meet this need. These have been in the form of a number of linguistic and
educational policies and projects, such as Erasmus1 exchanges, the European Language
Portfolio2, the Bologna Accords3, the implementation of CLIL (Content and Language
Integrated Learning) in schools and the Comenious4 and Socrates5 projects.
1 The Erasmus Programme (European Region Action Scheme for the Mobility of University Students) is a student exchange programme established in 1987. 2 The European Language Portfolio is a personal document which provides information on its owner’s communicative competence in several languages. 3 The Bologna Accords aim to establish common standards in European higher education. 4 Comenious promotes mobility and co-operation in Europe within nursery, primary and secondary education. 5 Socrates was a European educational programme with an emphasis on language learning.
2
However, speaking still appears to be a difficult skill to develop in the foreign
language context, despite learners undergoing years of classroom instruction and despite
the many changes which have taken place to methodological approaches which claim to
enhance SLA and oral communication skills, such as communicative language learning,
task-based language learning and computer-mediated learning. In Spain, several reports
(for example, Pisa, 2006) have been published disclosing poor English language levels
among school-leavers and mainstream media attention has been given to the
population’s general lack of ability to communicate in English. Estimates put Spanish
school-leavers’ English level at A2 on the CEFR6 and, according to Silió (2008), only
1.7% of Spanish university students are capable of communicating in English. In
Catalonia, according to the latest Estadística de Usos Linguísticos, 21.7% of the
population claim to be able to speak English fluently, a figure which is slightly higher
(27%) for the whole of Spain. The cause of such poor figures clearly demands urgent
attention.
As many learners prioritise speaking but attaining a successful level of spoken
competence in the EFL classroom seems far from straight forward, further research into
oral communication seems vitally important. The fundamental motivation for this study,
therefore, was to gain a deeper understanding of the interplay between the many factors
involved in L2 oral communication and thereby inform the teaching and learning of
speaking. By helping teachers understand the difficulties learners come across when
learners communicate in the L2, teachers can provide the best possible conditions for
improving their learners’ spoken competence.
Communicating in a foreign language is a complex multi-faceted skill. The kind
of spoken output a learner produces may be determined by many factors. Individual
6 CEFR - Common European Framework for Languages. Levels range from A1 and A2 (Elementary) to B1 and B2 (Intermediate) and C1 and C2 (Advanced).

3
learner factors, such as L2 proficiency, age, gender, personality, culture, affective state
or motivation can affect spoken competence. Furthermore, as speech is essentially a
communicative act, the nature of the interaction between interlocutors is another crucial
consideration, as it can be determined by factors such as the power relationship between
interlocutors or their relative L2 proficiency levels. The type of task that a learner
undertakes, such as giving a speech or chatting with friends, is yet another determiner
that influences the nature of the oral communication that takes place.
Evidence that speaking a foreign language involves the aforementioned factors
has emerged from several branches of second language acquisition (SLA) research
which have examined oral communication from different perspectives. Not only SLA
research but also first language research and cognitive psychology have greatly
contributed to what we know today about L2 speaking. This research has stemmed from
the fields of speech processing (Dell, 1986; Levelt, 1989, 1999), interaction (Gass,
2002; Long, 1985; Pica & Doughty, 1985; Swain, 1985), discourse analysis (Kasper,
1985; Tarone, 1981), language learner strategies (LLS) (Cohen et al., 1996; Nakatani,
2006; O’Malley et al., 1985; Oxford, 1990), communication strategies (CS) (Dörnyei &
Scott, 1997; Færch & Kasper, 1983; Poulisse, 1990; Tarone, 1981), task-based research
(Bygate et al., 2001; Gilabert, 2004, 2007; Robinson, 1995; Garcia Mayo, 2007) and
oral proficiency testing (Lumley & O’Sullivan, 2006; O’Sullivan, 2000; Purpura, 1999;
Swain et al., 2009).
This study draws from three of these areas: LLS, CS and task-based research,
since it is concerned with examining strategies and spoken production measures across
different oral communication tasks. It also aims to see how task features and proficiency
influence the former variables. These areas will be briefly introduced here to point out

4
gaps in each field and justify the need for this study. More detailed explanations of each
field and further references are offered in the following chapters of the thesis.
0.2 Justification for the study
LLS research began by observing what good language learners do (Rubin, 1975;
Stern, 1975; Wong-Fillmore, 1979) in order to teach their strategies to less successful
learners. The most common conceptualization of LLS has been learners’ behaviours
and/or thoughts which they apply to help regulate the learning of the target language.
Therefore, LLS are cognitive in nature (O’Malley & Chamot, 1990; Macaro, 2006).
Apart from many studies which have investigated general approaches to language
learning, a substantial body of research exists for the different skills (see Cohen &
Macaro, 2007 for a review). Research on the writing process has been particularly
abundant (Manchón, 2009; Victori, 1999) as well as listening (Bacon, 1992; Goh, 2002;
Vandergrift, 2003) and reading (Anderson, 1999; Ikeda and Takeuchi, 2006; Oxford et
al., 2004). However, research on speaking strategies or oral communication strategies
has been scarcer (Cohen et al., 1996; Nakatani, 2006; O’Malley et al., 1985).
In one respect, oral communication strategies have been analyzed alongside
strategies used in the other language skills in questionnaires (Huang and Van Naerssen,
1987; Politzer, 1983; Politzer & McGroarty, 1985) especially the widely used SILL
developed by Oxford (1990). The use of self-report questionnaires has been particularly
popular as strategies are not always directly observable. Yet, as these questionnaires did
not focus on speaking, they have only been helpful in reporting the general strategic
behaviour in language learning, involving strategies such as “I looked for opportunities
to practise” rather than strategies employed in language use, such as “I used a more
general word because I couldn’t think of the specific one”. Furthermore, LLS

5
questionnaire studies have only been helpful in reporting strategies as relatively stable
aptitudes or traits with respect to general language learning (Tseng et al., 2006). They
have not usually taken into account that learners may adjust their strategic approach
depending on the situation or task, as suggested by an increasing amount of research in
L2 (Cohen et al., 1996; Hsiao & Oxford, 2002; Macaro, 2006; Oxford et al., 2004;
Phakiti, 2003) and L1 (Bråten & Samuelstuen, 2004; Hadwin et al., 2001). There is a
need, therefore, for more task-based strategy research in the LLS field.
Whereas CS research has actually examined language use strategies and
compared them on different tasks, this field has tended to focus on specific subsets of
strategies, such as the use of fillers (Dörnyei, 1995), holistic strategies (Littlemore,
2001), repair mechanisms (Gass, 2002) or reduction and achievement strategies (Færch
and Kasper, 1983; Poulisse, 1990), but few attempts have been made to consider and
integrate the whole range of strategies learners display in oral communication (Dörnyei
and Scott, 1997; Nakatani, 2006). To sum up, more studies are needed that focus on a
wide range of oral communication strategies and which use instruments that can be
administered in relation to specific tasks.
In task-based research, spoken performance has been investigated either in
terms of the type of interaction that occurs between participants, which is broken up into
different strategies for meaning negotiation such as comprehension checks and
clarification requests (Long, 1981; Pinyana, 2005) or in terms of linguistic measures of
spoken production: complexity, accuracy and fluency (Skehan, 1998a; Gilabert, 2004).
These studies have often ascribed their findings to the particular design features of the
task undertaken, such as its cognitive or interactional dimensions, which can make the
task more or less difficult, as well as to learner factors. However, very few studies so
far have attempted to examine the relationship between spoken performance and
6
strategies (Purpura, 1999; Swain et al., 2009) in undertaking different tasks. Therefore,
the present study will measure spoken production and strategies across three oral
communication tasks to analyze the interplay between the two factors.
Certainly, one important criticism of LLS questionnaires is their validity as
instruments measuring strategy use (Chaudron, 2003; Cohen et al., 1996; Cohen &
Macaro, 2007; Dörnyei, 2005; Tseng et al., 2006). Yet, despite calls for studies to use
data triangulation methods to test validity (Gao, 2007; Phakiti, 2003), very few studies
(Bråten & Samuelstuen, 2007; Victori et al., 2009) have done so. One of the reasons
why data triangulation has not been carried out is because of the difficulty associated
with analyzing strategy use. Strategies can be both consciously and unconsciously set
in motion and, moreover, some are observable and others are not. Therefore, tracing
actual strategy use and comparing it with perceived strategy use, as measured by
questionnaires, is a complex process. This study attempts to fill in this gap by
triangulating data obtained from questionnaires with other observable or measurable
methods.
Finally, one of the factors that has been most often investigated in relation to
learners’ strategy use is proficiency. However, findings concerning the quantity and
type of strategies used by high and low proficiency learners have so far been mixed,
possibly due to the different contexts and methods used in analyzing strategy use (see
Cohen & Macaro, 2007 for a review of studies). Grenfell and Harris (1999) concluded
that proficiency is not a sole determiner of strategy use. Therefore, it is still not clear
which proficiency levels use which strategies and why. Consequently, another rationale
for using task-based strategy research is to have better control over the context,
eliminating confounding variables and examine strategy use and proficiency more
reliably.

7
This study attempts to fill in the aforementioned gaps in second language
research in several ways. Firstly, it develops a task-based strategy questionnaire for
learners to report their perceived strategy use immediately after completing a task.
Secondly, it compares both perceived strategy use and spoken production across three
different tasks and between low and high proficiency levels. In terms of strategies, a
broad view of strategies, similar to Nakatani’s (2006), is taken, operationalising oral
communication strategies as the conscious thoughts or behaviours a learner employs in
order to engage in oral communication. Fourthly, a strategy questionnaire is validated
by using data triangulation and finally the relationship between strategies and spoken
production is examined.
In sum, this piece of research was undertaken to examine the following areas:
• across-task differences in spoken production and perceived strategy use
• between-proficiency-group differences in spoken production and perceived
strategy use
• the validity of an oral communication strategy questionnaire
• the potential of an oral communication strategy questionnaire to predict spoken
performance
This study contributes to previous research in several ways. Firstly, the findings
contribute to the new direction taken in LLS research towards investigating task-based
strategies (Cohen et al., 1996; Oxford et al., 2004) and extend previous research by
examining strategy use, not only in the context of one task but across different oral
communication tasks. Furthermore, the study forges a link between strategy use and
spoken production in oral communication, fields which have traditionally been
investigated separately, and finally, the study contributes further information about the

8
role of proficiency in task-based strategy use and spoken production. Last but not least,
it provides new evidence concerning the validity of strategy questionnaires, by
triangulating strategy data collected on a self-report oral communication strategy
questionnaire with strategy data identified in task transcripts and learners’ stimulated
recall comments.
0.3 Research questions
In order to achieve the objectives described above the following research
questions were posed:
Research Question 1 is concerned with differences in spoken production across tasks
for EFL learners. It is divided into the following parts:
RQ 1.1 Are there differences across tasks in spoken production (measured in
terms of complexity, accuracy, fluency and self repair) for high proficiency
learners?
RQ 1.2 Are there differences across tasks in spoken production (measured in
terms of complexity, accuracy, fluency and self repair) for low proficiency
learners?
Research Question 2 is concerned with differences in perceived strategy use across
tasks for EFL learners. It is divided into the following parts:
RQ2.1 Are there differences across tasks in perceived strategy use (measured
by an oral communication strategy questionnaire) for high proficiency
learners?

9
RQ2.2 Are there differences across tasks in perceived strategy use (measured
by an oral communication strategy questionnaire) for low proficiency
learners?
Research Question 3 is concerned with differences in oral communication between
proficiency groups of EFL learners. It is divided into the following parts:
RQ3.1 Are there differences between low and high proficiency learners’ spoken
production (measured in terms of complexity, accuracy, fluency and self repair)
on each task?
RQ3.2 Are there differences between low and high proficiency learners’
perceived strategy use (measured by an oral communication strategy
questionnaire) on each task?
Research Question 4 is concerned with the difference between perceived and actual
strategy use of EFL learners across three oral communication tasks.
RQ4. Does perceived strategy use (measured by an oral communication
strategy questionnaire) reflect actual strategy use (measured in task
performance and according to stimulated recall comments) for low and high
proficiency learners?
Research Question 5 links RQ2 and RQ3. It considers the predictive value of the
Strategy Questionnaire in determining proficiency level. In other words, what is the
relationship between perceived strategy use and spoken production.
RQ5. How well does perceived strategy use on the Strategy Questionnaire
(measured as five strategy groups) predict spoken production (measured as
eight spoken production measures) ?

10
0.4 Organisation of the thesis
This section provides an overview of the organisation of this thesis, which is
divided into seven chapters. The first three chapters lay the groundwork for the study,
describing the theoretical background and research carried out so far in relevant fields.
This is followed by the four chapters which describe the study: its method, the results
obtained, their interpretation and the conclusions reached.
Chapter 1 describes how language learners produce speech. The underlying
cognitive mechanisms which give rise to speech are described by drawing on L1 speech
production models, with particular emphasis on Levelt’s modular theory (Levelt, 1989,
1993; Levelt et al., 1999). The way in which L2 researchers have drawn on this model
to explain the characteristics which are particular to L2 oral communication is then
highlighted.
Chapters 2 goes on to introduce one of the characteristics of L2 oral
communication, which is the use of strategies. The ways in which two fields of strategy
research, language learner strategies and communication strategies, have deconstructed
strategies are described, with special attention being paid to data collection methods. In
language learner strategy research strategies have been mainly examined via learners’
perceptions, whereas in communication strategy research they have been measured by
researchers identifying them in task-based contexts. Some limitations in these fields are
discussed which to some extent justify the approach taken in this study and lead to a
review of related studies that have explored strategies in the context of tasks and/or have
considered proficiency level.
As much of strategy research considers task as pivotal in understanding oral
communication, Chapter 3 turns to the area of task-based research. Within this field,
tasks have been investigated not only in terms of the interactional strategies learners

11
employ but also in terms of the complexity, fluency and accuracy (spoken production)
of their speech. Firstly, the construct of task is defined including particular criteria for
identifying an activity as a task. Two influential cognitive theories (Robinson, 2001;
Skehan, 1998a) are described, which, drawing from previous task-based research,
dissect tasks according to certain features and predict how these features influence the
complexity, fluency and accuracy of speech. This chapter then ends with a review of
studies which have investigated the cognitive and interactional task dimensions most
relevant to the tasks employed in this study.
Chapter 4 explains the methodology undertaken in this study to examine strategy
use and spoken production on three oral communication tasks. Firstly, the instruments
are described, including the preliminary stage for developing and piloting the Strategy
Questionnaire (SQ), the three tasks with their particular features and the Reflective
Questionnaire for examining learners’ perceptions of the tasks. This is followed by a
description of how the 48 participants were selected and assigned to low and high
proficiency groups and how data was collected, from video recordings of task
performances, responses on the strategy questionnaire and audio recordings of
stimulated recall sessions. Finally, the data analysis is explained, including the
statistical analysis of the quantitative data as well as the transcription of tasks and
procedures for identifying and coding spoken production measures and strategies in the
qualitative data.
Chapter 5 presents the results of the study and answers to the research questions
posed. Firstly, across-task comparisons are made for spoken production and perceived
strategy use. This is followed by between-proficiency-group comparisons. Next, results
concerning the validity of the SQ are presented followed by additional results regarding
pre-task planning time, task duration and learners’ perceptions of the tasks. Finally, the

12
results regarding the potential of the SQ for predicting spoken production measures are
presented.
Chapter 6 analyses and interprets the results presented in the previous chapter.
Firstly, the validity of the SQ is addressed in order to take into account both PSU and
ASU in the subsequent interpretation of strategy use. This is followed by an analysis of
spoken production measures and strategies across tasks and between proficiency groups.
The chapter ends with an analysis of the relationship between strategy categories and
spoken production measures.
Finally, in Chapter 7, the main conclusions of the study are reached. After
acknowledging the limitations of the study, some pedagogical implications are
described and future research directions are proposed.


Chapter 1
Speech Production

13
This chapter sets out the theoretical grounding of this study, the purpose of which is to
gain an understanding of the underlying psycholinguistic mechanisms involved in
second language oral communication. Such an approach has been justified by other
researchers (Kormos, 2006; Skehan, 1998a) as much of second language acquisition and
speech production are psychological processes.
“By being familiar with the mental processes involved in producing L2
speech, teachers can understand the problems their learners have to face when
learning to speak, ...” (Kormos, 2006: xvii)
Research into first language speech production is an extensive and autonomous field
within cognitive psychology and it is drawn upon here to further our understanding of
L2 speech. Several theories exist which explain first language speech production but the
one which will be highlighted is Levelt’s modular theory (Levelt, 1989, 1993; Levelt, et
al., 1999). It is particularly relevant to this study as it has been used to explain L2
speech production (de Bot, 1992; Poulisse & Bongaerts, 1994), as well as being widely
cited to explain L2 strategies, L2 spoken production measures and task influences.
Communication strategies (Dörnyei & Kormos, 1998) have been explained by the
model, self-repairs (Kormos, 2000) and task based studies (Gilabert, 2004, 2007; Yuan
& Ellis, 2003) have used it to explain across-task differences in complexity, fluency and
accuracy. More recently, in a review of task-based studies, particular task features have
been linked to different processing stages (Skehan, 2009), based on findings for
complexity, accuracy and fluency of L2 speech. Therefore, Levelt’s model provides the
framework for understanding L1 speech production, as well as the distinctions between
L1 and L2 speech. This will then lead to a description of the main features of L2 speech.

14
1.1 First language speech production
Although research into speech production has become an extensive field, which
has become more and more accessible through digital technologies, the technical means
for studying speech processing, such as recording devices, only became available in the
latter half of the 20th century, so research was initially more prolific on written
language. This is why speech was originally seen in the same way as writing, reflected
in the teaching of speech in the classroom, taught through sentence patterns and scripted
dialogues (Bygate, 2003). Marked differences between written and spoken language
have been discovered. Firstly, discourse analysis and corpus-based approaches to speech
production have identified a number of oral genres and sub-genres, which are quite
distinct from those of written discourse. Secondly, developmental studies have shown
that there are distinctions between the written and spoken language of any particular
individual, and thirdly, many social and psychological differences have been found to
underlie the differences in processing for writing and speech.
From a purely linguistic standpoint, L1 speech has certain characteristics. It is
mostly effortless, fast and can be done in parallel with other activities such as watching
television, driving a car or listening to music (Brown & Yule, 1983). Speech is like this
as a result of speakers’ efforts to facilitate their speaking within the time constraints
imposed on them by the nature of oral communication: 1) syntax tends to be less
complicated than in written language as phrases tend to be linked by coordination (and,
or, but) rather than subordination (if, when) and ellipsis7 is prevalent, 2) instances of
ungrammatical utterances are common and 3) pauses, repetition and false starts are
rather frequent, as well as fillers and hesitations.
7 Ellipsis is the omission of elements in an utterance which can be inferred from the context.

15
These observable phenomena have been studied from a cognitive perspective to
understand the underlying speech processing mechanisms, which is the position taken in
this study. Cognitive theories view linguistic knowledge as part of other cognitive
faculties and work with information processing models to account for how linguistic
knowledge is manifested through performance. Nevertheless, alternative perspectives
exist such as nativist theories like Chomsky’s Universal Grammar (Chomsky, 1986),
which uphold that linguistic knowledge is represented in a unique faculty in the brain.
The common consensus within cognitive linguistics, at present, is that language
production in multi-faceted: generated, encoded and articulated at different interlocking
levels of processing (Levelt, 1989). These conclusions have been reached through years
of investigation, firstly through observation, then by experimental techniques, for
example reaction-times studies8, and later by neuroimaging. Speech errors or slips of
the tongue (for example spoonerisms9, tip-of-the-tongue10 phenomena and
malapropisms11), albeit infrequent in L1 speech, have been the focus of such research
and have provided the empirical data to support speech processing models. People with
speech disorders, for example with types of aphasia12, have also provided valuable
insights into the workings of the speech process. The systematic analysis of speech
errors, using such methods, has explained whether apparently separate functions fail
independently or in unison, and so whether these functions are derived from the same
process or from different ones. Further analysis can reveal which levels in speech
8 Reaction time studies measure the time a participant takes to react to a stimulus, such as the time taken to say the word represented in a picture. 9 A Spoonerism is an error in which word initial consonants, vowels or morphemes are switched. This type of error is named after the Reverend William Archibald Spooner (1844–1930) who was prone to such errors, for example "You were fighting a liar in the quadrangle." (lighting a fire). 10 Tip of the tongue (TOT) phenomena is the instance of knowing the word one wants to say but being unable to recall it. 11 Malapropism is the misuse of a word, particularly because of a similar sound, for example “we live in an effluent (affluent) society”. 12 Aphasia is an acquired language disorder. There are many types of aphasia, such as anomia, the inability to recall a word name.

16
processing are more closely linked, which form of encoding is passed between them and
which levels are more prone to damage.
1.2 Speech production models
Several models of speech processing have been put forward (Butterworth, 1985;
Dell, 1986; Donald, 1991; Fromkin, 1971; Garrett, 1990; Levelt, 1989; Levelt et al.,
1999; Mackey, 1970) to explain how humans produce language, a highly complex
process, at such a fast rate with the minimum of error. These models follow two main
trends according to Kormos (2006): the spreading activation theory (Dell, 1986) and the
modular theory of speech processing (Levelt, 1989).
“Researchers working in the spreading activation paradigm assume that
speech processing is executed in an interactive network of units and rules, in
which decisions are made on the basis of the activation levels of the so-called
nodes that represent these units and rules. Traditional modular theories, on the
other hand, postulate that the speech encoding system consists of separate
modules, in which only one way connections between levels are allowed.”
(Kormos, 2006: 3).
Both spreading activation and modular models assume four levels of knowledge:
semantic (word meaning), syntactic (phrase building, word-order rules), morphological
(word-building, affixation) and phonological (phonemes, phonological rules) levels but
the models differ in their description of how these processes work and how they are
interrelated. Although other theories exist, the focus in this study will be on Levelt’s
modular theory as it is based on extensive empirical findings and even incorporates
aspects of other theories.

17
1.2.1 Spreading activation
In the spreading activation model (Dell, 1986) the mental lexicon is a network of
interconnected units or nodes, such as concepts, words, morphemes, phonemes and
syllables. Sentence production occurs by spreading activation, in which the category
with the highest activation at each knowledge level is selected first. Activation spreads
within each level, therefore, any component can be activated from different sources.
Activation also spreads from one level to the next. It can be bidirectional with activation
spreading down from words to morphemes and so on, top-down in speech production,
and bottom up in speech perception, where it spreads up from sound to syllable to word
and so on. Monitoring is assumed to be performed in the same way for one’s own
speech as for another’s, an aspect which Levelt also assumes for monitoring. Levelt’s
model is called modular but it should be recognised that Dell’s model may also be
considered modular in the sense that it includes a hierarchical network of nodes.
However, unlike Levelt’s unidirectional model, where certain processing must occur at
a higher level before a lower level and the input or information which activates each
processing component is unique, Dell’s model allows for bi-directional interaction
between processing levels and activation by input from different sources.
1.2.2 Modular theory
Levelt (1989) published a major monograph "Speaking: From Intention to
Articulation" where he put forward his theory of L1 speech production (from conceptual
preparation to the initiation of articulation) based on empirical data on error analysis of
L1 adult speakers. As the model integrates and develops particular aspects of previous
research, as Levelt et al. (1999) themselves acknowledge, it has a sound
psycholinguistic basis grounded in empirical research which bestows it with greater

18
explanatory power. Levelt et al. (1999) further developed the model by investigating
reaction time/latencies and thereby expanding the methodological approach in the field,
traditionally based on speech errors. This was a necessary measure for two reasons.
Firstly, the test that a model is correct is that it accounts not only for infrequent speech
errors but that it explains the normal process itself. Secondly, reaction time studies
measure the real time course of a mental activity and can lead to real time process
models, which can predict outcomes and the time taken by different components in the
process. The model can account for the main observations in the domain of speech
errors. A schematic representation of the most recent version (Levelt et al., 1999) is
provided in Figure 1.1 and can be referred to in the following sections.
The model accounts for speech processing from conceptual preparation to
grammatical encoding, lexical selection, morphological and phonological encoding and
phonetic encoding before articulation can be initiated. However, it does not extend
further than the beginning of articulation and Levelt et al. (1999) admit that it is
incomplete and needs further development. In parallel to the aforementioned processes,
there is output monitoring involving the speaker's normal speech comprehension
mechanism. The model involves the stages of processes (in oval boxes) listed above and
the nature of information passed between them (arrows) or the output of each stage:
lexical concepts, lemmas, morphemes, phonological words and phonetic gestural scores
executed during articulation.
Levelt argues that speech processes are indeed modular and act relatively
autonomously within the system. The latest version of the model (Levelt et al., 1999)
includes five main processing components: conceptual preparation, grammatical
encoding, morpho-phonological encoding, phonetic encoding and articulation, and

19
three knowledge stores: mental lexicon, syllabary and knowledge of the internal and
external world.
Figure 1.1 Levelt’s (1999) blueprint of the speaker (based on Kormos, 2006: 8)

20
In speech production, according to Levelt’s model, a person decides what to say
(conceptual preparation), encodes this message in the form of language (grammatical,
morpho-phonological and phonetic encoding) and then articulates the message
(articulation). What is unique to Levelt’s model is that in speech perception a person
perceives speech through the acoustic-phonetic processor, decodes speech linguistically
by the parser and interprets the meaning by the conceptualising module. Speech
perception and production are integrated into one comprehensive system, which makes it
possible to connect discourse and psychological aspects of language to each other.
Perception and production are linked to the three knowledge stores and interaction
between the processing components and knowledge stores produces speech.
Levelt makes several assumptions in his model: 1) that each component is a
specialist, in other words, it doesn’t share functions with another component and only
begins processing when it receives the characteristic input, 2) processing is incremental,
which means that as soon as processing of a chunk of language in one component has
finished and passed on to the next component, processing in that component will
continue with the next in-coming chunk, even though processing in the following
component has not been completed and 3) parallel processing takes place, with the
processing components working simultaneously, which is only possible because much
of the processing is automatic. These features, incremental, parallel and automatic,
account for a speaker being able to articulate a message extremely rapidly, within the
time constraints of oral communication, and also mean that articulation of an utterance
can begin long before a speaker has completed planning the whole message.
Conceptual preparation generates the message through macro-planning and
micro-planning. Macro-planning is the elaboration of the communicative intention,
expressed as speech acts such as requesting, asking a question or giving a warning.

21
Micro-planning is deciding what structure to give the semantic representations
associated with the communicative intention: the perspective of message, the new and
old information in the message, the propositional content, the mood and tense. The
outcome of macro-planning and micro-planning is finalising the message for expression
as the preverbal message. This preverbal message is not linguistic in form, but contains
the necessary information for converting meaning into language.
The preverbal message is the output of conceptual preparation and input of the
grammatical encoding, which encodes the message grammatically, and to do so
retrieves information from the mental lexicon. If the preverbal message is to be
recognised for grammatical encoding it must contain lexicalisable chunks which are
recognised by corresponding lemmas13 from the mental lexicon. Lemma retrieval occurs
when the meaning of that lemma best matches the semantic information of the preverbal
message. Once a lemma is selected it becomes available for grammatical encoding,
which creates the appropriate syntactic environment for the word (in the case of a verb,
transitivity, tense, person, number and mood). Hence, Levelt assumes semantic
activation occurs primarily by form activation and that the mental lexicon is a mediator
between conceptualising and encoding the message.
The output of grammatical encoding is the surface structure which is “an ordered
string of lemmas grouped into phrases and sub-phrases” (Levelt, 1989: 11). This is
further processed by morpho-phonological encoding. The first step in this process is to
retrieve information from the mental lexicon (morpho-phonological codes) about the
morphological make up, metrical shape and segmental make up of a lexical item. In
phonological encoding the morphemes are accessed first, then features such as stress
13 Lemmas contain syntactic information of lexical entries.

22
and pitch and then the phonemes of the morpheme. The final result is the phonological
score (internal speech).
Levelt’s model only partially accounts for phonetic encoding and the initiation
of articulation. Phonetic encoding acts on the phonological score by drawing on the
gestural scores in the syllabary, a repository of highly learnt gestural scores for the
frequently used syllables of the language (Levelt et al., 1999). It is at this point just
before overt articulation that the speaker experiences internal speech. The gestural score
is finally executed by the articulatory system. The functioning of the articulatory system
goes beyond Levelt’s model and is not the focus of the present study, but, in short, it
consists of a computational neural system that controls a highly complex motor system
(lungs, larynx and vocal tracts).
So far, a short description of the processes in speech production has been made,
however, monitoring, which runs in parallel to these processes, is another important part
of speech production and will be described in the following section.
1.3 Monitoring
As will be seen throughout the following chapters, monitoring is an important
aspect in L2 oral communication as it determines if learners notice deficiencies in their
own speech or other’s, which in turn affects how the discourse develops. Some
researchers (Gilabert, 2007; Kormos, 2006) argue that Levelt’s is the best account of
monitoring so far.
Levelt drew from other theories of monitoring and spreading activation to
elaborate his own perceptual loop theory. In Levelt’s model the monitor is located
within the rhetorical/semantic/syntactic system at the conceptual preparation stage. As
mentioned previously the same knowledge stores (mental lexicon, syllabary, knowledge

23
of the external and internal world) are available for both perception and production.
Therefore, the same parser (speech comprehension system) is used for decoding one’s
own speech as well as another’s. Also, the same conceptual preparation process which
interprets another’s utterance generates the speaker’s own message. This parser is in
turn connected to the mental lexicon. Monitoring of one’s own overt speech occurs, as
is made apparent by self-repairs, but monitoring of internal speech, covert monitoring,
also occurs, so the speaker can correct a mistake in the speech process before it is
articulated. In Levelt’s perceptual loop theory, three monitor loops or direct feedback
channels for inspecting the outcome of the processing components exist, although they
are not included in Levelt’s diagram of the model. The first loop compares the preverbal
message with the speaker’s original intention, the second loop monitors internal speech
before articulation (covert monitoring) and the third and final loop monitors the
utterance after articulation. When an error is perceived in any of these three loops an
alarm signal is sent out which triggers the production mechanism for a second time. In
such cases, the speaker can either ignore the mistake and continue, they can alter the
preverbal message or they can replace it with a different one.
To sum up, the relevance of Levelt’s model (1989, 1993, 1995, Levelt et al.,
1999) to this study is that it describes the different stages in speech production and
perception, which provides a theoretical basis for explaining the influences on
performance measure (complexity, accuracy, fluency and strategies) examined in this
study. Due to its use as a theoretical framework to account for bilingual speech
production (de Bot, 1992; Poulisse & Bongaerts, 1994) it has been widely cited in L2
research and, therefore, results described within this framework may be more easily
comparable to the work of others.

24
1.4 Second language speech production
While L2 speech production shares many of the characteristics of L1 speech, as
outlined in the model above, there are some important differences. First of all, and most
obviously, learners’ knowledge of the L2 is not as broad as the L1. Lexical and
grammatical knowledge is poorer as specific information associated with grammatical
or lexical items, such as semantic, syntactic, morphological or phonological information,
may be missing, as well as the relationships between different items. This results in
more errors than those occurring in L1 speech and also a more frequent need for
speakers to change their original plan or intended message, if they lack the linguistic
resources to execute it. L2 speakers, therefore, use strategies to compensate for
limitations in lexical knowledge (Færch & Kasper, 1983; Poulisse, 1990) or to avoid L2
grammatical structures that they are unsure of. Otherwise, they may use words
erroneously and produce ungrammatical utterances.
Secondly, the degree of automatic information processing is lower in the L2 so
L2 speakers are less fluent. Speech rate is slower and more hesitant, which may be due
to more serial processing as the learner has to pay attention to grammatical and
phonological encoding phases. Studies have provided evidence of a higher level of
hesitation phenomena (repetitions, corrections, filled pauses, slips of the tongue) in the
L2, as well as slower articulation rate, longer pauses and shorter runs (Lennon, 1990;
Raupach, 1987; Towell, 1987; Weise, 1982).
Thirdly, the presence of L1 traces exists in L2 speech, either accidentally as
unintentional code switching, or on purpose, intentional code switching (Poulisse &
Bongaerts, 1994). Code switching may occur at the phonological, lexical, syntactic and
pragmatic level. It occurs because L2 knowledge is incomplete but also because of the
influence of the speaker’s complete L1 system. Unintentional code switching may occur

25
because of L1 transfer14, which is more common in low proficiency learners. Intentional
code switching may occur to solve a communication problem by, for example,
foreignising15, L1 translation16 or code switching17 due to the lack of a particular lexical
item in the speakers linguistic repertoire or for psychological or social reasons, for
example to mark the speakers’ identity, to emphasize a part of the message or to make
asides (Poulisse & Bongaerts, 1994).
As these differences are manifested in L2 speech compared to L1 speech, any
model of L2 speech production needs to have the explanatory power to account for
them. de Bot (1992) attempted to do this by drawing on Levelt’s model of first language
speech production, which he claimed could also explain second language production.
As Levelt’s model had a solid grounding in years of empirical research, de Bot made as
few changes as possible to adapt it to L2 speech.
One adaptation is that the decision to speak in one language or the other is
placed in conceptual preparation, as it is determined by the speaker’s knowledge of the
situation, the interlocutors and their knowledge of language. Poulisse and Bongaerts
(1994) assume that conceptual preparation is partly language specific, so the preverbal
message already contains language-specific information, which activates a separate
module for formulation and, therefore, different procedures are applied to phonological
and grammatical encoding of L1 and L2, which, as will be seen, explains how the L1
and L2 are generally kept separately and are not mixed up.
It is also assumed that languages are accessed in parallel. In this way, two
speech plans can be formulated simultaneously, one for the language being spoken and
14 L1 transfer is the incorporation of a feature of L1 into the L2 knowledge system. 15 Foreignising is using an L1/L3 word by adjusting it to the L2 phonology. 16 L1 Translation is translating literally a lexical item, an idiom, a compound word or structure from L1/L3 to L2. 17 Code switching is including L1/L3 words with L1/L3 pronunciation in L2 speech. (Dörnyei & Scott, 1997: 188).

26
one for the active language (the language not being spoken but which is the one in
regular use). This conceptualisation is important as it explains overt phenomena
particular to L2 speech. The availability of two speech plans makes it easy to stop
encoding one speech plan and continue with another, which makes code switching
possible.
A major question in L2 speech production research has been whether the mental
lexicon stores words of several languages, in other words, that there is a common
lexicon for all languages or whether there are separate lexicons for each language. This
has been the focus of a vast number of studies (see Kroll & Sunderman, 2003, for a
review). Research on the bilingual lexicon has accumulated evidence through reaction
time studies to give strong support to the non-selective lexical access hypothesis, which
claims that lemmas are activated in parallel. Lemmas carry syntactic information in the
mental lexicon (Levelt et al., 1999). When confronted with a word, for example, in a
picture naming task, the selective lexical access hypothesis predicts that a lemma from
one language is activated first followed by the lemma in another language. However
reaction time studies have shown that words from more than one language compete for
activation in production and perception, supporting the non-selective lexical access
view.
If it is assumed that multiple linking exists between lemmas and that there is
interaction between L1 and L2 lemmas, L2 lemmas are connected to their L1 cognates,
which explains L1-L2 interference. L1 and L2 lemmas are in cross-linguistic
competition but activation is not equal. There is a threshold level of activation or
proficiency for competition to occur. The most regularly used language is the most
active and the most difficult to suppress but if it is deactivated it takes much longer to
activate again.
27
L2 speakers, especially more advanced ones, are particularly good at keeping
languages apart when they want to. In order to explain this, while still accounting for
code switching, de Bot (1992), Poulisse (1993) and Poulisse and Bongaerts (1994)
adhere to Paradis’s (1987) subset hypothesis, maintaining that within the mental lexicon
elements from each language form different subsets, each of which can be activated in
its entirety when chosen for production. As they assume that the mental lexicon is
represented as a network from which words are accessed through spreading activation
(Dell, 1986), L1 and L2 lexical items belong to different subsets which are activated to
different extents, depending on the language being spoken. Poulisse and Bongaerts
(1994) explain intentional and unintentional code switching with this hypothesis. For
example if the speaker wants to say “She told me the story” the macro-plan during
conceptual preparation is the same for both L1 and L2 but if the speaker wants to speak
in L2 the micro-planning would involve tagging the conceptual information for the L2
language so that the preverbal message may then be encoded in the appropriate way for
the L2. Simple exchange of this tag results in code switching.
de Bot explains phonological interference by proposing that the articulator is
shared. In other words, shared forms at the phonological level of different languages
tend to be co-activated. A common set of sounds and pitch patterns stored in the
syllabary are drawn upon to produce overt speech. Some sounds and patterns may be
language specific, but especially for beginner L2 speakers many sounds will be used for
both languages and errors will occur because the phonological store for the L2 is
incomplete or not sufficiently specified. de Bot’s model suggests that the further into
the speech production process non-target language alternatives are active, the more
competition there will be between languages. Research into L2 speech shows that these
non-target language alternatives are indeed available, well into the production process,

28
at the conceptual level, at the lemma level and possibly all the way to the phonological
level.
Summing up, in L2 speech production, a speakers’ knowledge of the L2 is
incomplete, speech processing involves more serial processing steps and the L1 is also
active, creating certain competition with the L2. These factors mean that learners
struggle to conceptualise, formulate and articulate messages in their L2, compared to L1
with the result that their speech is less accurate, less fluent and less complex. It also
means that speech proves more problematic for L2 speakers and in response to these
problems they use strategies. How learners use these strategies to overcome problems
when speaking a foreign language is the focus of the following chapter.
This chapter has described overt features of L1 speech by comparing it to
writing. It has explained these features from a cognitive perspective in terms of Levelt’s
model of speech processing in order to gain an understanding of the different stages
involved (conceptual preparation, lexical retrieval, grammatical, morpho-phonological
and phonetic encoding through to articulation and speech perception). Levelt’s model
then provided the framework for describing the distinguishing features of L2 speech
processing compared to L1: the need for L2 speakers to change their original intended
message, lower automatisation of L2 speech processing and the presence of traces of
L1. These features are brought about because the speaker’s knowledge of the L2 is
narrower and their L2 speech is influenced by L1. An understanding of such processes
is essential with regards to this study, as it will be shown that differences in strategy use
or in fluency, accuracy and complexity of speech, elicited by different tasks, may be
interpreted according to variations in conceptual preparation, lexical retrieval,
grammatical, morpho-phonological and phonetic encoding and monitoring.

29
So far, only the theoretical background to speech production has been presented
without reference to the language learner or the context of communication. Hence, in
the following two chapters these areas will be developed. Firstly, strategy research will
be addressed to examine the part strategies play in L2 oral communication and then
task-based research will be discussed to study the role of context in determining strategy
use and the complexity, fluency and accuracy of speech.

Chapter 2
Strategies

30
This chapter discusses two areas of research which are relevant to L2 oral
communication: language learner strategies (LLS) and communication strategies (CS).
Both are relevant to this study on oral communication as the two perspectives
complement each other, providing a more comprehensive picture of oral
communication. The former field has been concerned with strategies learners use to
learn a language across all skills: reading, writing, listening and speaking, and it is in
this latter skill that it overlaps with CS research, whose focus has been on strategies
used only in oral communication. The two fields have differed in their methodologies.
Where CS research originated from identifying observable phenomena in L2 speech,
such as leaving a message unfinished or creating a non-existing L2 word, predominantly
identified in transcripts of spoken performance, LLS research has always taken into
account both observable as well as internal thought processes which are not necessarily
observable, such as evaluating yourself or managing your nerves, and has tended to rely
more on self-report methods such as questionnaires.
Firstly, the importance of strategies within second language learning will be
discussed. The next part of this chapter describes LLS in the historical context of
strategy research and discusses the challenges that have faced strategy researchers,
particularly the issue of defining strategies, as well as criticisms aimed at this field. This
is followed by factors which influence strategy use, with a particular emphasis on
proficiency and tasks. In the next part of the chapter, the focus is on CS and the three
main perspectives (psycholinguistic, interactional and integrative) from which they have
been studied. Limitations of CS research are discussed followed by a focus on research
that has investigated proficiency and task in relation to CS.

31
2.1 Strategies within second language learning theory
Strategy researchers became influential within the field of psychology in the
1970’s when language learning theory was moving away from behaviourist theory
(Brooks, 1960) or Universal Grammar (Chomsky, 1986) and moving towards more
social theories of learning. According to behaviourist theories language is a
psycholinguistic phenomenon to be manipulated by drilling (repetition) and stimulus
response. In contrast, Chomsky’s theory is a linguistic theory of the innate principles of
grammar common to all languages, which determine linguistic behaviour. Neither of
these theories take into account social or pragmatic aspects of learning, a new
perspective which was proposed by Hymes (1972) in his article “On communicative
competence”. Hymes distinguishes communicative competence from Chomsky’s
linguistic competence, claiming that effective performance is determined not only by
linguistic competence (linguistic universals or grammar rules) but also by knowledge of
the appropriate use of these rules in a particular social context. It was a notable shift in
perspective in language learning theory, moving from a focus on what learners learn
(product-orientated approach) to how learners learn (process-oriented approach). This
new perspective sparked off more and more interest into strategies.
Since Hymes (1972), other researchers (Halliday 1973; Munby, 1978; Savignon,
1983; Widdowson, 1983) have examined the idea of communicative competence.
However, Canale and Swain (1980), Canale (1983) and Bachman (1990) have been key
in developing and extending the notion. Canale and Swain’s (1980) seminal model of
communicative competence, includes strategic competence as well as sociolinguistic18,
18 Sociolinguistic competence “requires an understanding of the social context in which language is used: the roles of the participants, the information they share and the function of the interaction” (Canale & Swain, 1980: 29).

32
grammatical19, and discourse20 competence (Canale, 1983) as one of its four
components. Communicative competence is the learner’s ability to distinguish the
appropriateness of both the form and meaning of an utterance in a given situation and
the component of strategic competence is the ability of the learner to recognise and
repair breakdowns in communication by using appropriate CS, "verbal and non-verbal
strategies that may be called into action to compensate for breakdowns in
communication due to performance variables or to insufficient competence" (Canale &
Swain, 1980: 30).
Later, Bachman (1990), whose interest was in performance and measurement in
language testing, extended previous work and made strategic competence a central part
of his theory, an executive function for making a final decision (on wording, phrasing,
and other productive and receptive means) for negotiating meaning. He renamed
communicative competence as 1) language competence, divided into organizational
competence, (grammatical and discourse, or textual, competence) and pragmatic
competence (sociolinguistic and illocutionary competence) and 2) strategic competence,
which operated in terms of metacognitive principles with assessment, planning and
execution phases. Later again, Bachman and Palmer (1996) refined this framework
defining strategic competence as:
“a set of metacognitive components, or strategies, which can be thought of as
higher order executive processes that provide a cognitive management
function in language use” Bachman and Palmer (1996: 70).
Douglas (1997) also discussed the importance of the strategic component in the
testing of speaking and includes three types of processes in his model of speaking in
19 Grammatical competence is “knowledge of lexical items and of rules of morphology, syntax, sentence-grammar semantics and phonology” (Canale & Swain, 1980: 29). 20 Discourse competence concerns cohesion and coherence and is described as the ability to connect sentences in discourse and to form a meaningful whole out of a series of utterances.

33
academic contexts: metacognitive strategies, language strategies, and fundamental
cognitive strategies (Chapelle & Douglas, 1993; Douglas 1997).
The notion of strategic competence is found in another influential area of foreign
language education, the Council of Europe's Common European Framework of
Reference for languages: Learning, teaching, assessment (CEFR) (Various authors,
2001). It lists a series of can do statements, describing a student’s ability in using a
foreign language i.e. their communicative competence, which is defined in the CEFR as
linguistic, sociolinguistic and pragmatic competence. Interestingly, strategic
competence clearly underpins the three competencies defined, as this excerpt from the
CEFR illustrates:
Language use, embracing language learning, comprises the actions performed
by persons who as individuals and as social agents develop a range of
competences, both general and in particular communicative language
competences. They draw on the competences at their disposal in various
contexts under various conditions and under various constraints to engage in
language activities involving language processes to produce and/or receive
texts in relation to themes in specific domains, activating those strategies
which seem most appropriate for carrying out the tasks to be accomplished. The
monitoring of these actions by the participants leads to the reinforcement or
modification of their competences. (Various authors, 2001), [the underlined
section is my emphasis].
Strategy use seems to be viewed in a broad sense, not only in terms of repair in
communication breakdown, as communication strategies, but as an executive or
metacognitive function, planning, monitoring and evaluating the reception, production
and mediation of language. More recently, Fulcher (2003) expanding on Bachman and
Palmer (1996), includes strategic capacity (achievement strategies and avoidance
strategies) in his framework for describing speaking test scores and Swain et al. (2009)

34
have examined strategic behaviour on the speaking part of the TOEFL21, which shows
that the inclusion of strategies as an essential part of oral communication remains valid
up to the present day. These authoritative sources have established the importance of
strategies in language learning and are firm evidence that strategies remain a critical
component of oral communication, firmly grounded within the notion of communicative
competence.
2.2 Language Learner Strategies
2.2.1 Definition and classification
Strategies in language learning have been called learner strategy or learning
strategy, often used to refer to the same concept but sometimes the following distinction
is made: Learner strategy (McDonough, 1999; Wenden & Ruben, 1987) is a broader
term in which the focus is on the individual and any strategy that the individual uses for
producing the target language (a production strategy), for communicating in the target
language (a communication strategy)22 or for processing input in the target language (a
learning strategy). Learning strategy, in contrast, is used when the focus is only on
processing input to develop linguistic knowledge (Cohen et al., 1996) and is, therefore,
construed in a narrower sense. In this study the term language learner strategies (LLS)
will be used in its wider sense with the focus on the learner as an active participant in
the learning process to encompass the array of production, communication and learning
strategies they may use. Table 2.1 provides examples of LLS definitions. What
definitions have in common is the conceptualisation of strategies as behaviours
21 TOEFL – Test of English as a Foreign Language 22 Production and communication strategies are sometimes referred to as language use strategies (Tarone 1981, Cohen, Weaver & Li, 1998), production strategies being “attempts to use existing L2 knowledge efficiently and clearly with a minimum of effort” (Tarone, 1980: 419, cited in Ellis, 1994) whereas communication strategies are attempts to deal with problems in communication that have arisen during speech.

35
(techniques, steps or specific actions). However, definitions differ in terms of whether
they include thoughts or mental processes and whether they include the element of
consciousness as a factor in strategy use.
Table 2.1
Definitions of Language Learner Strategies
Researcher Definition
Rubin (1975: 43) techniques or devices which a learner may use to acquire knowledge.
Wenden and Rubin (1987: 6) language learning behaviors learners actually engage in to learn and
regulate the learning of second language
O'Malley and Chamot (1990: 1) special thoughts or behaviors that individuals use to help them
comprehend, learn or retain new information.
Oxford (1990: 1 & 8) steps taken by students to enhance their own learning...
...specific actions taken by the learner to make learning easier, faster, more
enjoyable, more self directed, more effective and more transferable to new
situations.
Chamot (2004: 1 ) the conscious thoughts and actions that learners take in order to achieve a
learning goal.
Cohen (1998: 5 ) (second language learning and second language use strategies)... are the
steps or actions consciously selected by learners either to improve the
learning of a second language, the use of it, or both
Descriptions of exactly what LLS are have been developed from over 40 years
of research work but the concept of learning strategy is not limited to language
learning. In fact, it stems from the fields of education and cognitive psychology where
the idea of learning to learn or improving study or thinking skills has been traced back
to the 19th century. Much research has been carried out in this field by some leading
experts (see for example, Dansereau, 1978; Dansereau, 1984; Weinstein & Hume, 1998;
Weinstein & Mayer, 1986; Weinstein & Underwood, 1985), which has lead to this more
recent definition:

36
“Learning strategies include any thoughts, behaviours, beliefs or emotions
that facilitate the acquisition, understanding or later transfer of new
knowledge and skills.” (Weinstein, Husman & Dierking, 2000: 727).
These researchers view strategies as skills or behaviours that learners apply
rather than self-regulation (Pintrich, 2000; Zimmerman, 1998, 2000), which is an
individual difference or inherent trait of an individual, not subject to change. They
distinguish between three characteristics of strategies: that they are goal directed,
intentional and require effort. This suggests that learning strategies can be learnt, are
variable, may fall into disuse and depend on learners’ attention and application of them.
Early research on LLS, as mentioned, began in the 1970’s from the studies on
good language learners (Rubin, 1975; Stern, 1975; Wong-Fillmore, 1979). Rubin (1975)
observed that good language learners could be characterised as willing and accurate
guessers, they used techniques to communicate, they were good at managing
inhibitions, they were willing to make mistakes, they focused on form by looking for
patterns and analyzing, they looked for practice opportunities, monitoring their own
speech as well as that of others and they paid attention to meaning. Stern (1975: 31)
listed the top-ten strategies of the good language learner according to his personal
experience and a review of the literature at that time:
1) A personal learning style or positive learning strategies
2) An active task approach
3) A tolerant and outgoing approach to the target language and empathy with its speakers.
4) Technical know-how about how to tackle a language
5) Strategies for experimentation and planning with the object of developing the new language
into an ordered system and/or revising this system progressively.
6) Constantly searching for meaning.
7) Willingness to practise.
8) Willingness to use language in real communication.
37
9) Self-monitoring and critical sensitivity to language use.
10) Developing the target language more and more as a separate reference system and learning to
think in it.
Two early studies (Cohen & Aphek, 1981; Hosenfeld, 1977 & 1979) were
important in establishing that strategies could not only be identified by observation but
also by asking the learner, which provided a more complete picture of the strategies
involved. Hosenfeld described grammar transformation and reading strategies using
learners’ retrospective accounts and Cohen and Aphek (1981) observed students
speaking in the classroom and interrupted the class to ask students for the rationale
behind what they had just done.
Much of this initial research involved identifying and describing the strategies
good learners use with the purpose of teaching them to less successful learners. The
rationale behind this approach was that it had immediate practical applications for
enhancing second language acquisition. Since then four books have been particularly
influential in the field: The Good Language Learner by Naiman et al., (1978), Learner
Strategies in Language Learning by Wenden and Rubin (1987) and later, Learning
Strategies in Second Language Acquisition by O'Malley and Chamot (1990) and
Language Learning Strategies: What every teacher should know by Oxford (1990).
These key researchers developed original LLS research through empirical investigation
and established classification systems (O’Malley & Chamot, 1990; Oxford, 1990;
Rubin, 1981; Wenden, 1991) as well as grounding LLS in a cognitive theory of SLA
(O'Malley & Chamot, 1990).
Rubin’s (1981) classification, as seen in Table 2.2, distinguished between direct
strategies which contribute directly to language learning, for example clarification
monitoring, guessing and indirect strategies which did not contribute directly but were

38
involved in language learning, such as creating opportunities for practice. Each of the
eight broad strategy categories subsumed more specific strategies.
O’Malley and Chamot’s (1990) contribution to LLS research was particularly
important as their classification of strategies was placed within a general framework of
cognitive theory, Anderson’s Adaptive Control of Thought (ACT), an information
processing model of L2 learning (Anderson, 1981, cited in O’Malley & Chamot, 1990).
O’Malley and Chamot’s classification of strategies falls into three broad categories
according to the level and type of information processing involved: metacognitive,
cognitive and social/affective strategies (see Table 2.2).
Metacognitive strategies are “higher order executive skills that may entail
planning for, monitoring or evaluating the success of a learning activity.” (Brown et al.,
1983, cited in O’Malley & Chamot, 1990: 44). Metacognitive strategies have an
executive function. They oversee, regulate or manage language learning through the
processes of planning, monitoring and evaluating and are applicable to a wide variety of
situations. Examples of metacognitive strategies for oral communication would be
planning what to say, monitoring how well you understand your interlocutor or how
well you speak or evaluating how well you spoke afterwards.
Cognitive strategies are “the steps or operations used in learning or problem-
solving that require direct analysis, transformation or synthesis of learning materials”
(Wenden & Rubin, 1987: 23), cognition being the process of obtaining knowledge from
input and manipulating it to achieve conceptual understanding and enhance learning.
Cognitive strategies are more limited by the particular learning task at hand. Types of
cognitive strategies for oral communication would be transfer - relating the task to
already acquired prior knowledge, task familiarity, or summarising – summarising parts
of the discourse to ensure the information has been retained.

39
Table 2.2 Types of classifications of Language Learner Strategies Rubin (1981: 124-126)
O’Malley & Chamot (1990: 198-199)
Oxford (1990: 18-21)
Stern (1992: 263)
Chamot et al., (1999: 15-17)
Direct Strategies clarification/ verification monitoring memorization guessing inductive inferencing, deductive reasoning practice Indirect Strategies create opportunities for practice production tricks
Metacognitive Strategies advance organisation advance preparation organizational planning selective attention self-monitoring self-evaluation self-management Cognitive Strategies resourcing grouping note taking summarizing deduction imagery auditory representation elaboration transfer inferencing Social and Affective Strategies questioning for clarification cooperation self-talk
Direct Strategies 1. Memory strategies creating mental linkages applying images and sounds reviewing well employing action. 2. Cognitive strategies practicing receiving and sending messages analysing and reasoning creating structure for input / output. 3. Compensation strategies guessing intelligently overcoming limitations in speaking and writing Indirect Strategies 4. Metacognitive strategies centering your learning arranging and planning your learning evaluating your learning 5. Affective strategies lowering your anxiety encouraging yourself taking your emotional temperature 6. Social strategies asking questions cooperating with others empathizing with others
1.Management and Planning Strategies 1. decide what commitment to make to language learning 2. set himself reasonable goals 3. decide on an appropriate methodology, select appropriate resources, and monitor progress 4. evaluate his achievement in the light of previously determined goals and expectation 2. Cognitive Strategies 1. Clarification / Verification 2. Guessing / Inductive Inferencing 3. Deductive Reasoning 4. Practice 5. Memorization 6. Monitoring 3. Communicative-Experiential Strategies circumlocution gesturing paraphrase asking for repetition and explanation. 4. Interpersonal Strategies 5. Affective Strategies
1. Planning 2. Monitoring 3.Problem-Solving 4. Evaluating 5. Remembering

40
Social-affective strategies are ways in which learners interact with others or
control their affective state to assist learning. Examples of social and affective strategies
for L2 speaking tasks would be cooperation with peers to decipher task instructions or
self-talk to reduce anxiety by using mental relaxation techniques. O’Malley and Chamot
(1990) recognised that this set of strategies were less important from a cognitive
standpoint, but important from the second language learning perspective, where they are
considered equally as important as metacognitive and cognitive strategies.
After studying LLS in different contexts (ESL & EFL) Chamot and O’Malley
(1994) drew up a list of core strategies thought to be useful for students learning English
in academic settings, and the CALLA (Cognitive Academic Language Learning
Approach) was developed, an instructional guide which incorporates strategy
instruction for English into the language curriculum. Chamot et al. (1999) refined
O’Malley & Chamot’s early classification into a Metacognitive Model of Strategic
Learning which highlights the four underlying recursive metacognitive processes
(planning, monitoring, problem solving and evaluating) and the inherent memory
strategies involved which oversee strategy use.
According to these researchers “a strategy may be used in more than one process
depending on the task and how the strategy is applied” (Chamot et al., 1999: 14). Thus,
strategies are viewed as functioning at different levels of cognitive processing at the
same time. For example the strategy imagery involves all levels: planning, monitoring,
problem solving, evaluating and remembering. This model was used as the basis for The
Learning Strategies Handbook (Chamot et al., 1999), which, like the CALLA, provides
learners with guidelines for strategy use. Both of these instruction manuals, among
others (Brown, 2002; Ellis & Sinclair, 1989), are products of research which, from its
beginnings, has advocated that learners can be taught strategies.

41
Another key researcher of the time was Oxford (1990) who developed the SILL
(Strategy Inventory for Language Learning) which expands on O’Malley & Chamot’s
classification. Its ESL/EFL version is a 50 item, 5-point Likert scale questionnaire
which has been widely used (Oxford, 1996a; Oxford 1996b) by strategy researchers.
Following Rubin (1981), Oxford classified strategies as direct and indirect strategies
with three strategy groups within each category (see Table 2.2). Direct strategies are
involved with manipulating the target language directly (memory, cognitive and
compensation) whereas indirect strategies (metacognitive, affective and social) support
and manage learning without involving language use directly. Oxford’s SILL was used
extensively in the 1990s, illustrated by the 50+ published papers and over 10,000
learners assessed by it (Oxford, 1996a).
Hsiao and Oxford’s (2002) comparative study of three classification systems:
O’Malley and Chamot (1990), Oxford (1990) and Rubin’s (1981), as seen in Table 2.2,
concluded through confirmatory factor analysis that Oxford’s (1990) 6-category system
was more accurate in accounting for the variety of strategies reported by language
learners. Their findings supported claims that strategies could be grouped and that the
use of particular strategies was related to the use of others in L2 performance. However,
their findings rejected viewing strategies “as a dichotomy between direct and indirect
dimensions” (Hsiao & Oxford, 2002: 378). They also suggested that some strategies
should be reclassified, implying that there were inconsistencies in the categories that
had been developed until then. This was because their confirmatory factor analysis
showed, via goodness-of-fit indexes, that their model did not have a fully acceptable fit
to the data. This brings us to some criticisms that have been aimed at strategy research
and how they have been accounted for in this study.

42
2.2.2 Limitations of Language Learner Strategy research
Up to the 1990s, LLS research had made the claims that 1) good language
learner strategies could be identified, 2) these strategies could be taught to less effective
learners and that 3) strategies could be classified into broad categories. However,
weaknesses in these claims have been acknowledged by researchers, to a greater or
lesser degree since the 1980s, and as more and more research has been carried out.
Firstly, the identification of a good language learner implies that a strategy is
either inherently good or bad. However, this claim has since been rejected by many
researchers (for example, Cohen, 1998; Macaro, 2001; McDonough, 1995) as several
findings have shown that this is not the case and that strategy use is determined by a
number of different factors.
Macaro (in Cohen & Macaro, 2007) pointed out that what many of the good
language learner studies were inadvertently doing was comparing high proficiency
learners (the “good” strategies) with low proficiency learners ( the “bad” strategies). In
other words proficiency was an important factor in determining strategy use. It has also
been by far the factor which has been investigated most.
In an early study, Vann and Abraham (1990) concluded that unsuccessful
learners used a variety of strategies, just as successful language learners did, but the
difference was not in the type of strategies used but how they were applied
appropriately to the task at hand. Therefore, it was important to consider the task or
context to assess whether strategies were effective or not.
Graham (1997) argued from her findings that, rather than advocating particular
strategies as being good, such as top-down over bottom-up strategies for receptive skills
(listening and reading), an interactive approach combining the two types of strategies
was more effective. In other words, the appropriate combination of strategies was also

43
important in determining whether strategies were effective or not, a view shared by
other researchers (for example Hsiao & Oxford, 2002; Macaro, 2006).
Neither do results from Chesterfield and Chesterfield (1985) support the finding
that strategies are good or bad, as in a study of interactive and learning strategies of pre-
school and first graders, strategies seemed to be related to developmental stages in
learning, with some strategies being more difficult to use than others. This implies that
easier strategies will be learnt first and more difficult ones at advanced levels, and that
different strategies are appropriate to different developmental stages of language
learning.
Research on strategy use in different learning environments or with different
groups of learners does not support the claim that strategies are good or bad either, as
strategies seem to be context specific (Graham, 1997; McDonough, 1995; Oxford and
Bury-Stock, 1995; Parks & Raymond, 2004; Wharton, 2000). The context, such as
formal or informal education or culturally approved or disapproved behaviour, seems to
be responsible for eliciting certain kinds of strategies.
Apart from some of the factors illustrated here, strategies have been investigated
in relation to motivation (Dörnyei, 2001; Tragant, 2006; Tragant & Muñoz, 2000; Yang,
1999), learner style (Cohen, 2003; Littlemore, 2001), gender (Green & Oxford, 1995),
attitude and beliefs (Cid, Grañena & Tragant, 2009; Horwitz, 1988; Victori, 1992, 1999;
Victori & Lockhart, 1995; Wenden, 1987; Yang, 1999) and personality (Ehrman &
Oxford, 1989; Wakamoto, 2000), all of which seem to have an influence on strategy
use.
The second claim from strategy research assumes that strategies can be taught.
However, strategy training or learner training has been criticized by some researchers
(Gu, 1996; Kellerman, 1991; Rees-Miller, 1993). Kellerman (1991), referring to

44
compensatory types of CS, dismissed strategy training because CS are known to exist in
L1 and can be transferred automatically to L2. Rees-Miller (1993) pointed out that
despite the popularity of LLS manuals for classroom teaching, research had not
provided any causal evidence that a higher awareness of strategies led to more
successful language learning, a view supported by Chaudron (2003), who claimed that
research had produced mixed results. However proving the causal relationship between
strategies and language learning is not a simple task as there is no direct linear
relationship due to the contextual and individual differences, as mentioned above.
Despite these criticisms, researchers have continued to advocate explicit training
within specific skills and training aimed at a student’s proficiency level (Chamot et al.,
1999; Cohen, 1998; Dörnyei, 1995; Grenfell and Harris, 1999; Nakatani, 2005, among
others) or to improve general approaches to language learning (Nunan, 1997; Victori &
Lockhart, 1995) in the light of findings of positive effects on performance, extent of
strategy use or motivation (Tragant, 2006).
The third claim, that strategies can be classified into groups, has also been
criticised, as the concept of strategy itself has been defined unclearly, imprecisely and
inconsistently between different researchers. Firstly, classification of strategies is
unreliable due to the “size-abstractness” dilemma (Stevick, 1990: 144), which is the
fact that some strategies refer to phenomena that are larger than others. For example, for
oral communication, cooperation, working together with peers, (O’Malley & Chamot,
1990; Oxford, 1990) is a larger concept and may entail the use of a combination of
strategies compared to word-coinage, creating a non-existing L2 (Oxford, 1990), which
is more specific. Secondly, the classification of strategies is unreliable due to the
internal-external characteristic of strategies: the fact that they are described as either
internal thoughts such as avoiding communication (Oxford, 1990) or external overt

45
behaviour such as circumlocution (Oxford, 1990) or as both, making classification
confusing and leading to categories filled with a mixture of concepts, as thoughts and
actions are interrelated.
Researchers have tried to find solutions to these dilemmas. For example, Dörnyei
and Skehan (2003) argued that a strategy cannot be defined as emotional, cognitive and
behavioural at the same time and suggest defining a strategy as either a neurological
process, cognitive operation or behavioural act involving motor skills. Macaro (2006),
drawing from previous research, suggests that strategies should be described in terms of
a goal, a situation and a mental action. However, none of these researchers provide
examples for strategies described in the way they suggest. Cohen (1998) and Ellis
(1994), among others, suggest distinguishing Oxford’s compensation strategies as
“language use” strategies, which are psycholinguistically different to other language
learning strategies and also Oxford’s other categories (metacognitive, cognitive,
memory, social, affective). However, this distinction is not clear either, as the use of
compensation strategies can promote language learning as well, and some language
learning strategies, such as the cognitive strategy “summarising”, cannot be separated
from language use.
Thirdly, apart from the features mentioned above (size-abstractness, external-
internal) the level of consciousness involved in strategy use has been in constant debate
among researchers. As illustrated by the definitions in Table 2.1, according to Cohen
(1998), Chamot (2004) and Oxford (1990) strategies are conscious, or in Oxford’s case
chosen by the learner which implies they are intentionally and therefore consciously
selected. Cohen (1998) claims that strategies must be defined as conscious and that
actions or behaviours which are employed unconsciously are processes, as “the element

46
of consciousness is what distinguishes strategies from those processes that are not
strategic” (Cohen et al., 1996: 4).
However, Bialystok (1990) pointed out that strategies may not always be under
conscious volitional control. Part of the problem in defining strategies as conscious
stems from the fact that the term conscious is itself multidimensional and has many
different connotations. Examining the notion of consciousness, Schmidt (1990)
deconstructs consciousness as awareness, intention, knowledge and control and within
awareness is noticing. Furthermore, a strategy may be used consciously initially and
then may drop from consciousness as it becomes automatised. Nevertheless, many of
the experts in LLS in a recent survey by Cohen (Cohen & Macaro, 2007) agreed that
strategies involve some level of consciousness.
Apart from the problems described above, a fundamental criticism of strategy
research is that it is unable to explain the difference between “engaging in an ordinary
learning activity and a strategic learning activity” (Dörnyei, 2005: 164), that is,
descriptions of strategic learning cannot be distinguished from the normal non-strategic
learning process. Dörnyei claimed that this is why some LLS researchers (for example,
Tseng et al., 2006) turned to the notion of self-regulation instead, which is a more stable
trait that learners either have or do not have.
However, although the concept of self regulation may explain trait-like strategies
which are typical of an individual, it still cannot explain why individuals change their
strategy use depending on particular situations or tasks. In an article entitled “Has
Language Learning Strategy Research Come to an End? A response to Tseng et al.
(2006)”, Gao (2007) claims that for this reason LLS research cannot be abandoned, as
LLS complement self-regulation; the level of self regulation determines the strategies
employed. In fact, Gao (2007) cites several educational psychologists who recognise

47
LLS as a component of self regulation. Furthermore, it is pointed out that the notion of
self-regulation already existed in the SLA field in similar terms such as metacognition
(Wenden, 1998, 2002) and strategic competence (Bachman and Palmer, 1996) and has
not elucidated more clearly what LLS are.
To sum up, the present consensus in strategy research seems to be that 1) strategies
are neither good or bad but are deployed effectively or ineffectively in a particular
situation, 2) strategy use and proficiency are linked, albeit not in a direct relationship
due to different factors which are also involved, such as the task or learner factors 3)
strategy training has had limited success but provides a learner-centred perspective and
insights into the process of language learning and 4) strategies can be identified, despite
difficulties with classification.
So far the concept of LLS has been described, the classifications systems
produced through research presented. This information has provided the essential
grounding for interpreting the findings concerning individual strategies or groups of
strategies from different researchers in the field, which will be presented in the next
sections. It is also fundamental for understanding how and why strategies are described
and grouped as they are in this study, as will be seen in the following chapters.
Although this study cannot attempt to overcome all the limitations concerning
strategies discussed, they have been presented to be taken into consideration in the
interpretation of results. The most important point to emerge from this discussion of the
limitations of strategy research, which are relevant to this study, is that research has
shown a number of factors which influence strategy use, which suggests that the
relationship between strategies and proficiency is non-linear. This also means that
controlling for these intervening factors is most important when investigating strategy
use and contextualisation is essential. In the following sections a brief summary of

48
research findings concerning LLS between proficiency groups is made. This is followed
by a more in-depth review of studies investigating between-proficiency group
differences and across- task differences, as well as one study that compares perceived
strategy use with actual strategy use.
2.2.3 Language Learner Strategies and proficiency
Early studies on the good language learner (Naiman et al., 1975; Ruben, 1975;
Stern, 1975) suggested there was a link between proficiency and strategy use. Since
then, proficiency has been the variable which has been investigated most in relation to
learner strategies (for example, Chamot et al., 1999; Cohen, 1998; Green & Oxford,
1995; O’Malley & Chamot, 1990; Oxford and Nyikos, 1989; Takeuchi, 1993).
However, mixed results have been obtained as to the frequency of strategy use and the
types of strategies employed by different proficiency levels. This may, in part, be due to
the different methods used for measuring proficiency (learners’ self reports, teacher
ratings or validated tests) or the different kinds of learners under study (learners in
primary, secondary and tertiary education or adult learners). As such a large number of
studies exist only a couple will be reviewed in this section to illustrate some of the
claims made.
Some studies have shown that higher proficiencies use strategies more
frequently (for example, Chamot et al., 1987; Green and Oxford, 1995; Griffiths, 2003;
Oxford and Crookall, 1989; Vogely, 1995), implying that there is a linear relationship
between strategy use and proficiency). A review of several SILL studies with such
results can be found in Oxford (1996a).
However, other studies have found different results. Intermediate level students
have been found to use more strategies than beginner or advanced proficiencies,

49
suggesting that strategy use is curvilinear (Chaudron 2003; Oxford & Ehrman, 1995;
Gardner et al., 1997; Phillips, 1991; Yamamori et al., 2003). Few or no differences in
strategy use between proficiency levels were found in other studies (Bremner, 1999;
Sanaqui, 1995; Wharton, 2000). These mixed results have led some researchers
(Grenfell & Harris, 1999; Macaro, 2006; Tragant & Victori, 2006) to point out that a
direct cause and effect relationship between strategy use and proficiency level cannot be
assumed. This is because, as pointed out in the previous section, external factors such as
task or internal learner factors such as learner style may also be significant in
determining strategy use.
As for differences in the types of strategies employed, there have also been some
discrepancies in findings. However, many studies both on general LLS and strategies
used within particular skills, with adult learners, have found that higher level students
use more metacognitive strategies (for example, Green & Oxford, 1995; Huang, 2004;
O’Malley et al., 1985; Purpura, 1999; Rahimi, Riazi & Saif, 2008; Rossi-Le, 1989).
Vandergrift (2003) found more metacognitive strategies used by higher skilled listeners,
as did Victori (1999) for writing and Ikeda and Takeuchi (2006) for reading strategies.
In fact, this has led some researchers (for example, Grenfell & Harris, 1999; Macaro,
2001) to postulate that high level learners are more effective because they exercise more
cognitive control over monitoring and adjusting a combination of strategies.
Functional practice strategies (Bialystok, 1981; Huang & Van Naerssen, 1987)
have also been reported, with higher proficiency levels seeking opportunities to use the
language. In a qualitative study of student portfolios (Takeuchi, 2003) higher
proficiencies reported that they valued accuracy over fluency in speaking. On the other
hand, low levels have reported using strategies more in isolation, such as memorisation

50
and vocabulary learning strategies (Griffiths, 2003; Takeuchi, 2003), and seem to
emphasize fluency over accuracy .
So far some general findings have been summarised concerning LLS and
proficiency. However, many of these studies have employed the SILL, which has
general statements about language learning but does not focus specifically on speaking.
In fact, most studies which have investigated strategies used in speaking have been from
the perspective of CS, which are the focus of the following section, but fewer studies
from the field of LLS have done so (for example, Cohen & Olshtain, 1993; Cohen et al.,
1996; Huang, 2004, 2010; O’Malley & Chamot, 1990; Oxford, 1990). Nevertheless,
two studies of most relevance to this thesis which have investigated LLS for oral
communication and their relationship to proficiency (Huang and Van Naerssen, 1987;
Nakatani, 2006) will be reviewed here.
Huang and Van Naerssen (1987) used a questionnaire and interviews to find out
about the strategies of 60 university level Chinese EFL learners. The questionnaire
contained a mixture of open and closed questions related to improving listening and
speaking abilities, based on inventories by Rubin (1975) and Stern (1975). Frequency of
strategy use was elicited and grouped according to formal practice, functional practice
and monitoring. Proficiency was measured by an oral test with an interview format.
Higher proficiency students reported more functional practice strategies, a finding
which was reinforced by multiple regression analysis which showed that functional
practice was the major predictor of proficiency. In other words, high proficiencies
tended to look for ways to interact or communicate in the target language. Another
difference was that the high levels reported taking risks in speaking more. There were
no significant differences between proficiency groups in terms of formal practice or
monitoring. In this study other LLS which were not directly related to oral

51
communication were also included. For example, high proficiency learners practised
reading more. In terms of skills practice, reading practice predicted oral proficiency
better than speaking practice, which the authors claimed was because it was a more
accessible source of input than speaking practice in an EFL context. One criticism that
has been made (Khan and Victori, in press; Nakatani, 2006) is that general learning
strategies rather than oral communication strategies were correlated with oral
proficiency and that not enough oral communication strategies were included in the
questionnaire. Furthermore, validity and reliability of the questionnaire was not
measured. Interestingly, one of the future research directions the authors suggested
taking was that their study serve as a basis for investigating LLS in the context of task.
This was a direction taken up in the following study by Nakatani (2006).
Much more recently, Nakatani (2006) used questionnaire methodology to examine
oral communication strategies of 62 female Japanese university students. This study
was a development on the previous study for several reasons 1) the questionnaire’s
validity was examined statistically 2) more oral communication strategies were included
and 3) strategy use was contextualised to a task. Nakatani developed the OCSI (oral
communication strategy inventory) which consisted of 32 items for “coping with
speaking problems” and 26 items for “coping with listening problems”, with Cronbach
alphas of .86 and .85 respectively. Factor analysis resulted in 8 factors for the speaking
strategies (social-affective, fluency-oriented, negotiation of meaning while speaking,
accuracy-oriented, message reduction and alteration, non-verbal strategies while
speaking, message abandonment and attempt to think in English) and 7 factors for the
listening strategies (negotiation for meaning while listening, fluency-maintaining,
scanning, getting the gist, non-verbal strategies while listening, less active listener, word
oriented). Participants completed the questionnaire immediately after performing a task

52
(role-play), which is said to improve the accuracy of claims made on a questionnaire
(Cohen, 1998; Victori, 2004; Victori et al., 2009). The roleplay was carried out in pairs,
with a non-native speaker teacher acting as interlocutor.
A multiple analysis of variance (MANOVA) on the 15 factors showed there were
differences between high and low levels for four factors. Three were for the speaking
part: social-affective, fluency-oriented and negotiation of meaning and one for the
listening part: fluency-maintaining. The high group used all these strategies
significantly more. Social-affective strategies included trying to relax, taking risks and
using fillers, among others. Fluency-oriented included paying attention to pronunciation
and taking time to express oneself and negotiation of meaning included strategies such
as comprehension checks, repetition and circumlocution. Among listening strategies,
fluency-maintaining included strategies such as asking for clarification and paying
attention. In brief in NS-NNS oral communication high proficiency learners reported
using more strategies to interact and maintain the conversation.
As the study’s focus was questionnaire design and comparing different
proficiencies, strategy use across different types of oral communication tasks was not
investigated, but Nakatani concluded that it was an area in need of investigation.
Furthermore, Nakatani advocated validating perceived strategy use with actual strategy
use in performance transcripts.
Despite some differences in design and content of these two questionnaire
studies on oral communication, they do not contradict in their findings. In Huang and
Van Naerssen’s study the high oral proficiency level reported looking for ways to
practise and use the language while in Nakatani’s study the high proficiency group
reported using more interactional types of strategies, when they actually used the

53
language in an oral communication task. What both studies called for in their
conclusions was the need to study strategies across different tasks.
2.2.4 Language Learner Strategies and tasks
The previous section illustrated two studies which used questionnaires to find
differences in oral communication strategy use between proficiency groups, but strategy
use across different tasks were not investigated. Although this has been a common area
of study in CS research, fewer LLS studies have done so. However, learners may use
different strategies, even within the same skill of speaking, for example to describe a
picture compared to explaining what they had done the previous weekend. Both tasks
have particular features which influence the kind of language and strategies used to
perform them. Therefore, in order to assess the effectiveness of strategies used, they
need to be considered in terms of the task. In this section, first, two questionnaire-based
studies will be reviewed which have examined strategies across tasks. In the first one,
reading strategies were compared and in the second one oral communication strategies.
This is followed by a review of three studies which have emerged only more recently
and which have correlated spoken performance and strategies in the same sample
population, in line with the present study (Huang, 2010; Nakatani, 2010; Swain et al.,
2009).
Firstly, Oxford et al. (2004) examined reading strategies of 36 adult ESL
students. Students were put into high and low proficiency groups according to their
scores on a reading test. A reading strategy questionnaire was adapted from Ikeda and
Takeuchi (2000). An easy task and a difficult task were designed by means of an
external test of reading difficulty. Participants completed the 35-item questionnaire after
54
“no task”, an “easy task” and a “difficult task” with a one-week gap between each
session.
Results from repeated measures ANOVA showed that there were no significant
main effects in aggregated strategy use across tasks or between proficiency levels.
However there was an interaction effect between task and proficiency. In sum, on the
difficult task the high proficiency group reported significantly lower aggregated strategy
use compared to the low group. Oxford et al. (2004) interpreted this result by saying
that the low group employed more strategies because the difficult task posed a greater
challenge to them. In contrast, the high group did not find the difficult task much more
challenging than the easy one and so did not need to use so many strategies.
In the analysis of individual strategies between groups, there were 2 out of 35
significant differences (p< .05) on the questionnaire on “no task” and the “easy task”
and there were seven differences on the “difficult task”. Oxford et al. (2004), in fact,
used a p< .1 level of significance and reported a few more differences, which they
focused on in their paper. Of the few differences found the general conclusion made
was that more top-down strategies were used by the high group and bottom up ones by
the low group. Nevertheless, results seem to suggest far more similarities between
groups and across tasks than differences, a point which was not highlighted. This could
have been due to similarity in the type of reading comprehension tasks employed or it
may mean that within a particular language skill and in the short term learners do not
vary their strategy use, regardless of the task. Strategy use may be linked to a learner’s
developmental stage in learning so differences would only be found in longitudinal
studies.
Whereas Oxford et al. (2004) compared proficiency across different reading
tasks, Cohen et al. (1996) compared strategy use on three different speaking tasks in a

55
strategy training study with experimental and control groups. Participants were 55
intermediate EFL students who had had no previous strategy instruction. They were
divided into an experimental group, who received 10 weeks of strategy-based
instruction (SBI) and a control group, who followed the standard language course. In a
pre-/post-test design, all participants were given three speaking tasks at the beginning of
the ten-week period and the same three tasks at the end: a self description, a story
retelling and a city description task. These tasks were recorded and assessed for
improvements in spoken performance. Furthermore, participants completed a task-based
strategy checklist at the end of each task. The checklist was divided into strategies used
before, during and after speaking and contained items such as rehearsal, note taking,
self-encouragement, word coinage, attention to grammatical forms, reflection on task
performance and plans for future learning. Frequency of strategy use, reported on the
checklists, was correlated with spoken performance ratings.
The results showed that there was no significant difference between
experimental and control group in terms of overall spoken performance after ten weeks
on the self-description and storytelling tasks, but there was a difference on the city
description task. After examining spoken performance rating scales separately, it was
found that the experimental group was rated better on grammatical accuracy for the city
description task and on vocabulary for the self description task. The authors concluded
that strategy training does favour language learning and may result in improved spoken
performance. By examining the individual strategies used on each task, some
correlations were found between strategy use and spoken performance but a complex
picture emerged with the increase in some strategies benefiting spoken production or
vice-versa. The conclusion made, however, was that strategy use seemed to be specific
to the types of tasks performed.

56
Huang (2010) investigated LLS across numerous oral tasks, exploring three
different modalities of reflection: written reflection, individual spoken reflection and
group spoken reflection. Participants were 20 intermediate L2 learners who carried out
oral tasks over a nine-week period and completed activities of reflection immediately
after each one. Strategies were coded in transcriptions of the oral and written reflections
of the learners and spoken performance was assessed by two native speaker raters, who
evaluated the weekly speech dataset according to TOEFL speaking rubrics. In this study
the task characteristics or proficiency effects were not investigated but the most
noteworthy finding of relevance to this study was that different individual strategies and
groups of strategies correlated either negatively, positively or not at all with raters
spoken performance scores. This could mean that some strategies work against spoken
performance, while others work in favour of it. However, the results provide added
support to claims in both LLS and CS fields (Dobao, 2000; Macaro, 2006; Tragant &
Victori, 2006) that the relationship between these two constructs (spoken performance
and strategies) is non-linear.
In Swain et al.’s (2009) report, perceived strategy use and test scores across six
different tasks and proficiency levels on the speaking test section of the TOEFL were
examined. Participants were 30 international university students in Canada, who did six
tasks individually, delivered over the Internet. The six tasks consisted of three task
types: tasks 1 and 2 were independent speaking tasks related to personal experience,
tasks 3 and 4 integrated reading, listening and speaking and tasks 5 and 6 integrated
listening and speaking. Of importance to this study was that strategy use varied across
the three task types with the more integrated tasks eliciting most strategy use. In
addition, correlation analysis revealed no direct relationship between total strategy use
and total speaking test scores. When individual strategies were correlated, cognitive and

57
communication strategies correlated positively and metacognitive and affective
strategies correlated negatively with spoken performance.
Nakatani (2010) examined strategies that facilitate oral communication by using
several data collection techniques similar to ones used in this study (an oral
communication strategy questionnaire, speaking test transcripts, retrospective
comments). He found that in terms of actual strategy use (ASU), strategies equivalent to
the conversation-flow maintenance strategies in this study were the best predictors of
oral test scores (assigned by English NS raters). Production rate (number of words per
c-unit) and signals for negotiation were also weaker predictors of oral proficiency. In
terms of perceived strategy use (PSU), there were positive correlations between PSU
(on the OCSI) and oral test scores for social-affective strategies (strategies while
speaking) and fluency-maintaining strategies and non-verbal strategies (strategies while
listening). As for Huang (2010), task and proficiency effects were not examined but the
correlation of the aforementioned groups of strategies with oral communication was
brought to light. However, Nakatani provides yet more evidence that all strategies do
not correlate with more effective oral communication.
Although these studies have correlated spoken performance with strategies, what
the present study adds to research in this field is to provide more multidimensional
measures of the construct of spoken performance: complexity, fluency and accuracy
(Skehan, 1998), rather than basing correlations on a single spoken performance measure
based on more subjective rater evaluations. This allows more precise claims to be made
about precisely which areas of spoken performance are associated with which strategies.

58
2.2.5 Data collection methods in Language Learner Strategy research
The following review of data collection methods highlights the advantages and
disadvantages of the different approaches in strategy research in order to justify the use
of data triangulation in this study by direct observation, the use of a strategy
questionnaire and stimulated recall. Data on strategies has been collected in different
settings, by direct observation in the classroom (Cohen & Aphek, 1981) or in
experimental settings, either in the language laboratory (Cohen, 1998) or in interviews
with the researcher (O’Malley & Chamot, 1990). It has also been collected using
different methods: questionnaires (Oxford, 1990; Politzer & McGroarty, 1985),
observations (O’Malley et al., 1985), interviews (O’Malley & Chamot, 1990), diaries
(Carson & Longhini, 2002; Halbach, 2000), recollective narratives (Poulisse, 1990),
think-aloud protocols (Anderson & Vandergrift, 1996) and strategy checklists (Cohen et
al., 1996).
Oxford (1996b) provides a useful summary of these instruments along with their
advantages and disadvantages. Table 2.3 shows an expanded version of Oxford’s
(1996b) table to include the type of data generated by each instrument (qualitative or
quantitative) and highlighting how the data collection method predetermines the type of
strategy data collected. Stimulated recall (Gass & Mackey, 2000), a more modern
method of retrospective verbal report has also been added. As can be seen, all methods
have advantages and disadvantages for collecting data on strategies, which is the reason
data triangulation is often recommended.
Direct observation may reveal some observable strategies such as an appeal for
help or gesture in oral communication but does not directly reveal unobservable
strategies such as evaluating the activity or approximation (using a more general word
when a specific word is unknown). In the latter case, for example, the observer

59
Table 2.3
Comparisons of strategy-assessment types (based on Oxford, 1996b: 38, with additions
by Khan in italics).
Type of assessment Appropriate uses Limitations of use Type of data generated
Strategy questionnaires
Identify "typical" strategies used by an individual; can be aggregated into group results; wide array of strategies can be measured by questionnaires.
Not useful for identifying specific strategies on a given language task at a given time. Strategies are predetermined by the researcher.
Quantitative (for closed questions) Qualitative (for open questions)
Observations Identify strategies that are readily observable for specific tasks.
Not useful for unobservable strategies (e.g., reasoning, analyzing, mental self-talk) or for identifying "typical" strategies.
Qualitative
Interviews Identify strategies used on specific tasks over a given time period or more "typically" used strategies; usually more oriented toward task-specific rather than "typical" strategies of an individual; depends on how interview questions are asked.
Usually less useful for identifying “typical" strategies because of how interviews are conducted, but could be used for either task-specific or "typical" Strategies.
Qualitative
Dialogue journals, diaries
Identify strategies used on specific tasks chosen by the learner over a given time period.
Less useful for identifying "typical" strategies used more generally.
Qualitative
Recollective narratives (language learning histories)
Identify "typical" strategies used in specific settings in the past. Settings are chosen by the learner.
Not intended for current strategies; depends on memory of learner.
Qualitative
Think-aloud protocols
Identify in-depth the strategies used in an ongoing task usually chosen by the researcher.
Not useful for identifying "typical" strategies used more generally
Qualitative
Strategy checklists
Identify strategies used on a just-completed task chosen by the researcher.
Not useful for identifying "typical" strategies used more generally across all skills. Strategies are predetermined by the researcher.
Quantitative
Stimulated recall Identify in-depth strategies used on a just-completed task chosen by the researcher.
Not useful for identifying "typical" strategies used more generally.
Qualitative

60
may hear the word ‘car’ but the learner may have originally wanted to say ‘lorry’.
Direct observation, however, if complemented with learner accounts, is a good method
for checking whether learners actually do what they claim to do, comparing learners’
perceived strategy use with their actual use of strategies.
With the exception of direct observation, all methods rely on learners’ verbal
reports. The assumption underlying this kind of introspective methodology is that it is
possible to observe internal thought processes and that learners are able to articulate
these thought processes to some extent. However, one criticism is that learners do not or
cannot report fully (Block, 1998; Cohen, 1998; Victori, 2004; Victori et al., 2009).
Strategies which have been learnt recently function as declarative knowledge23
(Anderson, 1981, cited in O’Malley & Chamot, 1990) and can be verbalised, whereas
strategies which have been used repeatedly become automatic, functioning as
procedural knowledge,24 and the learner loses the ability to verbalise them. Therefore,
verbal reports will tend to provide an incomplete picture of a learner’s repertoire of
strategies. Nevertheless, verbal report is one of the few methods of collecting data on
mental processing available.
Stimulated recall is a method of data collection suitable for just-completed tasks
and has proven very useful in cognitive psychology research. Within L2 research, it has
been used to examine the composing process in writing (DiPardo, 1994; Manchón,
2009; Smagorinsky, 1994; Victori, 1999). Within L2 speaking it has been used in the
study of speech acts (Cohen & Olshtain, 1993), strategy use, (Cohen et al., 1996),
acquisition strategies (Lennon, 1989), spoken production (Mackey et al., 2000),
23 Declarative knowledge (Anderson, 1983) is what we know about and constitutes static information in memory. It can usually be verbalised or ‘declared’. 24 Procedural knowledge (Anderson, 1983) is what we know how to do and constitutes dynamic information in memory. It cannot be verbalised.

61
communication strategies, (Poulisse, 1990) and oral interaction (Swain & Lapkin,
1998).
In this type of verbal report learners are asked to recall what they do
immediately after a task is carried out. They are supported or ‘stimulated’ to remember
or ‘recall’ their thought processes as they are shown the video recording of themselves
carrying out a task. Responses in stimulated recall may complement data collected on a
strategy questionnaire, verifying questionnaire responses and also, possibly, providing a
rationale for strategy use. Stimulated recall has been particularly suitable for obtaining
in-depth qualitative data when studying strategies for speaking. In her study, Poulisse
(1990) claimed that using this method nearly doubled the identification of compensatory
strategies. In contrast, eliciting strategies by the think aloud25 method is too intrusive for
research on speaking as learners would have to simultaneously talk to carry out the task
and think aloud, a problem not encountered with stimulated recall. Although stimulated
recall does also have some drawbacks it is one of the ways to understand learners’
mental processes which observation cannot capture. Grenfell and Harris (1999: 54)
stated:
“…it is not easy to get inside the ‘black box’ of the human brain and find out
what is going on there. We work with what we can get, which, despite the
limitations, provides food for thought.”
Questionnaires and checklists are the two instruments which have been most
frequently used in LLS studies as they are quick to administer and data is easier to
quantify than with the other instruments. Unlike questionnaires, checklists are used
immediately after a task is carried out, with the reasoning that if little time has elapsed
learners will make more accurate claims (Chamot & Küpper, 1989; O’Malley &
25 Think aloud is “human subjects’ verbalisation of their thoughts and successive behaviours while they are performing cognitive tasks” (Ericsson & Simon, 1993)

62
Chamot, 1990; Oxford et al., 2004; Cohen et al., 1996). Checklists also differ from
questionnaires in that questions in checklists all have the same format (yes/no answers
or a rating scale) whereas a questionnaire can contain both open and closed types of
questions (listing, categorising, ranking, scales, grids) or a mixture.
However, one drawback of questionnaires, as mentioned above, is that learners
may not respond accurately, because they don’t remember strategies or they may make
false claims responding according to what they think is expected of them (social
desirability bias). What is more, learners may not understand items if specialised
metalanguage is used, or they may misinterpret questionnaire items if the wording of an
item is ambiguous. Another drawback which has been brought to light more recently
(Chaudron, 2003; Dörnyei, 2005; Macaro, 2006; Tseng et al., 2003) has been made
against the assumption, initially made, that the more strategies used (adding up total
scores on questionnaires) the better the language learner. Such claims assumed that all
strategy use was effective. However, research has shown that strategy items are of a
very different nature and how effective they are depends on the particular context.
Therefore, a high overall score on the questionnaire does not necessarily equate with a
high achiever. These problems can be addressed by carefully piloting questionnaires to
ensure learners are interpreting items as intended, administering questionnaires
immediately after a task to ensure learners remember what they have done and using
data triangulation (with direct observation and stimulated recall) to validate
questionnaire responses, which were all measures taken in this study.
Although many LLS studies have used questionnaires to investigate proficiency
effects and, to a lesser extent, task in relation to strategies, none of them have actually
validated learners’ reports with actual strategy use, despite recognising that it is a

63
necessary measure. In the following section one such validation study for L1 reading
strategies will be summarised as it is comparable to the approach taken here.
2.2.6 Validating perceived strategy use
Perceived strategy use (PSU) and actual strategy use (ASU) have been compared
in the area of L1 reading strategies (Bråten & Samuelstuen, 2007). Participants were
177 Norwegian secondary school children around 15 years old. They were given an
expository style reading text on the topic of socialisation, which was assessed for
difficulty by a readability score and found to be appropriately challenging. Participants
completed a 20-item strategy questionnaire immediately after the task. The
questionnaire had already been validated and assessed for reliability by statistical means
and encompassed four groups of reading strategies obtained by factor analysis
(memorization, organization, elaboration and monitoring). Of these 20 items only three
were traced for actual strategy use: I wrote down keywords and main points, I wrote a
short summary of the most important ideas (organisational) and I underlined /
highlighted important words and/or sentences (memorisation). Bråten and Samuelstuen
compared self reports (PSU) with traces of underlining, highlighting, summarising and
note-taking strategies in the material (ASU) which had been provided to do the task.
Medium-level correlation (.3 - .5) was found between PSU and ASU, supporting
the validity of self-reports in the L1 context. Furthermore, both PSU and ASU predicted
performance on the same task and also on a different task, but data of traced strategies
turned out to be a better predictor than self reports. One limitation with this study,
however, is that only three of a possible twenty perceived strategies were traced.
Summing up, this section has provided essential background on LLS, by
describing how they have been defined and classified and discussing limitations of

64
research in this field. Studies relevant to the present task-based study, which have
investigated between-proficiency group differences and across-task differences with a
questionnaire, have been reviewed. Furthermore, data collection methods in strategy
research have been discussed to point out the need for data triangulation and the
suitability of stimulated recall and task observation as a complement to collecting oral
communication strategy data with a questionnaire. Finally, a study in which data
triangulation was carried out has been reviewed, comparing learners’ responses to a
questionnaire with actual strategy use found in traces in the task material.
2.3 Communication Strategies
Whereas the concept of LLS is quite broad, referring to the approach learners
have in learning and using a language in general, crossing all the different language
skills, CS are strategies related solely to oral communication. As mentioned earlier
some LLS researchers included CS in their taxonomies (Oxford, 1990) whereas others
regarded them as separate from learning strategies (Cohen, 1998; Tarone, 1981). This
section, therefore, focuses on the perspective of CS research. Firstly, a brief historical
introduction to CS research is provided in order to understand how research emerged
and developed in this field before entering into more details of how CS have been
defined and classified by different researchers, to understand the differences but also
significant overlap in perspectives. In addition, relevant findings from research which
has examined CS between proficiency groups and across tasks are presented and finally,
some strengths and limitations of CS research are discussed.

65
As mentioned in the previous section CS were included in Canale and Swain’s
(1980) model of communicative competence, where the term strategic competence26
was included as one of their sub competencies. After this, more importance was put on
CS research. Váradi was one of the first researchers to identify communication
strategies in the 1970s, although her work was not published until 1980. She was
followed by Tarone (1977) and Færch and Kasper (1983), who published some
important papers on CS in one volume. After that, a considerable number of studies
focused on identifying and classifying CS (Bialystok, 1990; Bialystok & Kellerman,
1987; Dörnyei & Scott, 1997; DeKeyser, 1988; Færch & Kasper, 1983, 1984;
Kumaravidelu, 1988; Paribakht, 1985, 1986; Poulisse, 1993; Tarone, 1981, 1985;
Tarone & Yule, 1989; Willems 1987; Yule & Tarone, 1990) and other studies debated
whether they could be taught (Dörnyei, 1995; Dörnyei & Thurell, 1991; Manchón,
1999; Rost & Ross, 1991; Tarone, 1984; Willems, 1987). Following these studies the
Nijmegen project on Dutch second language learners of English provided a wealth of
data on CS, describing factors related to CS use (Bongaerts & Poulisse, 1989;
Kellerman, 1991; Kellerman et al., 1987; Poulisse, 1990; Poulisse et al., 1987; Poulisse
& Schils, 1989) and proposing a new classification system with a theoretical grounding,
as it placed CS within Levelt’s (1989) model of L2 speech production. Bialystok also
published a strategy taxonomy in 1990, which was particularly influential. It placed CS
within her own theoretical framework of SLA. Further work on CS in the 1990s added
to the conceptual analysis of CS and further examined the relationship between CS and
task features or learner factors.
26 Strategic competence is “verbal and non verbal strategies that may be called into action to compensate for breakdowns in communication due to performance variables or to insufficient competence” Canale & Swain (1980: 30).

66
2.3.1 Definition and classification
The term communication strategy was introduced by Selinker in 1972, as one of
the five central processes involved in L2 learning. In Selinker’s (1972) interlanguage
theory, learner’s errors were not seen as negative but positive efforts made by learners
in an attempt to organise their interlanguage, their interim language in the process of
second language acquisition. Selinker took the view that learners make positive efforts
to control their learning, through the use of what he coined communication strategies,
according to him, a central process in SLA. As the language learner’s knowledge of the
L2 is incomplete, their speech is characterised by CS, special techniques learners use to
manage or overcome difficulties in oral communication due to these linguistic
shortcomings. For example, if a speaker cannot think of a particular word, phrase, tense
marker or structure they may use a CS to get around the problem such as saying “you
cut with it” instead of using the word “knife”. As Dörnyei and Scott (1997) point out,
one only has to make a brief analysis of spontaneous L2 speech to see how common
such CS are and how important they are in L2 communication.
Various definitions, as seen in Table 2.4, and their resulting taxonomies, as seen
in Table 2.5, have emerged which have conceptualised CS in different ways (Bialystok,
1983; Bialystok, 1990; Canale, 1983; Færch & Kasper, 1984; Poulisse, 1987; Poulisse,
1993; Raupach, 1983; Tarone, 1981; Tarone & Yule, 1989; Yule & Tarone, 1991). As
underlined in Table 2.4 the majority of definitions view CS as problem-solving devices.

67
Table 2.4
Definitions of Communication Strategies
Researcher Definition
Tarone (1980: 420) “mutual attempts of two interlocutors to agree on a meaning in situations
where the requisite meaning structures do not seem to be shared”
Færch & Kasper (1983: 36)
“potentially conscious plans for solving what to an individual presents itself
as a problem in reaching a particular communicative goal”
Stern (1983: 411)
“techniques of coping with difficulties in communicating in an imperfectly
known second language”
Poulisse (1990: 88) “strategies which a language user employs in order to achieve his intended
meaning on becoming aware of problems arising during the planning phase
of an utterance due to (his own) linguistic shortcomings”
Bialystok (1990: 138). “the dynamic interaction of the components of language processing that
balance each other in their level of involvement to meet tasks demands”
Corder (1981: 103) “a systematic technique employed by a speaker to express his [or her]
meaning when faced with some difficulty”
Table 2.5 shows that despite the existence of different taxonomies, the
differences are in the terminology and categorisation, rather than in the actual strategies
themselves (Bialystok, 1990). For example Tarone’s (1977) circumlocution is Færch
and Kasper’s paraphrase and Bialystok’s (1983) description. In addition Paribakht’s
(1985) distinguishes between different types of circumlocution, as does Willems for
paraphrase and Poulisse for reconceptualisation. Among these taxonomies, researchers
(Dörnyei & Scott, 1997; Ellis, 1994; Færch & Kasper, 1984; Nakatani and Goh, 2007)
have traditionally distinguished between two main approaches: interactional and
psycholinguistic. However, a third approach, the integrated approach, integrates these
two perspectives. The following paragraphs will summarise these perspectives,
highlighting the latter broader perspective, which is the one taken in this study.

68
Table 2.5 Various taxonomies of Communication Strategies (based on Dörnyei & Scott, 1997:
196-197) with addition of Problem Solving Mechanisms from Dörnyei & Kormos
(1998)

69
Table 2.5 (continued) Various taxonomies of Communication Strategies (based on Dörnyei & Scott, 1997: 196-197) with addition of Problem Solving Mechanisms from Dörnyei & Kormos (1998)
Dörnyei & Kormos (1998)
Problem-Solving Mechanisms
RESOURCE-DEFICIT
Lexical
message abandonment
message reduction
message replacement
code switching
approximation
use of all purpose words
complete omission
foreignising
word coinage
literal translation
restructuring
circumlocution
semantic word coinage
direct appeal for help
indirect appeal for help
Grammatical
grammatical substitution
grammatical reduction
Phonological and Articulatory
Retrieval -Tip-of-the-tongue phenomena
use of similar-sounding words
Mumbling
PROCESSING TIME PRESSURE
Pauses
Non-lexicalised pauses
unfilled pauses
umming and erring
sound lengthening
Lexicalised pauses
fillers
Repetitions
self repetition
other repetition
OWN PERFORMANCE
Self correction
error repair
appropriacy repair
different repair
rephrasing repair
Asking check questions
comprehension checks
own-accuracy checks
OTHER PERFORMANCE
Meaning Negotiation
asking for repetition
asking for clarification
expressing non-understanding
asking for confirmation
interpretative summary
guessing
other repair
feigning understanding
70
2.3.1.1 Interactional approach
From the interactional standpoint or linguistic view, strategies are described in
terms of negotiation of meaning, due to problems that have already manifested during
the course of the communicative interaction. Such research has mostly been in an
entirely different field known as Interaction research and has generally been considered
independent of CS research (see for example, Pica, 1994; Gass, 2002 for reviews). It
takes a product-orientated approach, describing CS in discourse terms and according to
conditional relevance27 (see Sperber & Wilson, 1987). Unlike the psycholinguistic view
which does not consider the engagement of the interlocutor, the interactional view
included discourse strategies, which are listener-orientated and require the cooperation
of an interlocutor.
Research in this field has revealed much about the nature of interaction and has
shown that strategies for meaning negotiation could facilitate SLA, as they occur at the
key moments when learners need to receive feedback, directing their attention to
problematic L2 form-meaning relationships and give learners opportunities to modify
their output.
Working with NNS-NS data, Long (1981) found that when NNS indicated
difficulty in following a conversation, NS adjusted their message so that they would be
understood better. Long (1983) argued that this type of negotiation leads to essential
comprehensible input which was necessary for SLA. Long identified two types of
interactional strategies, those that avoid or prevent problems arising, such as selecting
salient topics, treating topics briefly or avoiding topics and those that repair problems
27 By relevance it is meant whatever allows the most new information to be transmitted in that context on the basis of the least amount of effort required to convey it. As Skehan and Foster (2001) point out, language, unlike any other skill, such as playing tennis, driving or algebra, can work well even if it is not performed correctly. The meaning is evident even if the form is incorrect. This prioritisation of meaning according to Givon (1985) is a natural phenomenon and explains how pidgins are so easily created. Others (Corder, 1973; Selinker, 1972) say that it explains why second language learners never attain native-like proficiency.

71
that have arisen, including clarification requests, confirmation checks and tolerating
ambiguity. Generally, more attention has been paid to the latter group of strategies.
Signals for negotiation are illustrated in the following examples from the NNS-NNS
corpus in this study:
(1) Comprehension checks: Any expression a speaker uses which checks that the other has understood their preceding utterance.
*SAN: fence is like er er is like a protection of the house.
*JUD: oh ok .
*SAN: do you get it?
(2) Confirmation checks: Any expression that a speaker uses to confirm that they have understood or heard the other’s utterance correctly.
*CLA: er I think it's a mom sitting on a on a chair and she's kind of holding a dog and that
means that +/.
*KAS: a dog ?
*CLA: yes and I think that means that maybe...
(3) Clarification requests: Any expression that the speaker uses to ask for clarification of other’s preceding utterance.
*JUD: I don't have it because er in my in my: picture it's like if the light goes er goes by right
o@e sea@e if you have the light here.
*SAN: the light ?
*SAN: what do you mean the light ?
*JUD: or the sun or +/. [comprehensible input]
*SAN: oh !
Swain (1985) later argued that comprehensible input was not sufficient but
comprehensible output was also necessary. In other words, it was not only important for
learners to receive comprehensible input but they also needed to be pushed to produce
comprehensible output. When the NS signalled a need for clarification, the NNS
reformulated their initial utterances, producing more comprehensible output or pushed

72
output. If both interlocutors are language learners such exchanges provide both learners
with opportunities for comprehensible input and pushed output.
*DAN: not like a metal wall or something.
*SER: and: and can you describe it to me? [clarification request]
*DAN: no well +/.
*SER: it's made by: wood +/? [confirmation check]
*DAN: it's like sticks. [pushed output]
*DAN: it's made by er +/.
*SER: like er wood?
*DAN: yes.
Pica (1994) explained the importance of negotiation of meaning strategies by
showing that they promote SLA in three ways. Firstly, learners obtain comprehensible
input. When communication breakdowns occur, modifications made to the conversation
split up the input into parts that learners can process more easily, facilitating
comprehension and allowing learners to attend to form. Secondly, negotiation provides
learners with feedback on their own L2 output, as more competent interlocutors
frequently reformulate their problematic utterances, expressing what they think was
meant in another way and, in doing so, raising awareness to a particular problem.
Finally, negotiation pushes learners to adjust, manipulate and modify their own output.
It can be seen from this section that negotiation of meaning strategies play a significant
role in oral communication, which justifies including them in studies examining
strategy use.
Within CS research, Tarone’s perspective is interactional, as illustrated in the
definition in Table 2.4. She provided the first classification of CS, most of which were
later incorporated into other researchers’ taxonomies, as can be seen in Table 2.5,
including those working from a psycholinguistic perspective. Tarone claimed that “CS
are seen as tools used in a joint negotiation of meaning where both interlocutors are

73
attempting to agree as to a communicative goal” (Tarone, 1980: 420). Tarone divided
strategies into five main categories: intra-language based, interlanguage based, appeal
for assistance, mime and avoidance. She distinguished between CS, which were for
language use, and LLS, which were for developing linguistic and sociolinguistic
competence. Tarone’s work involved describing CS and identifying factors which affect
strategy choice such as L2 proficiency, personality, learning situation and the nature of
task.
2.3.1.2 Psycholinguistic approach
The psycholinguistic view is concerned with a non-linguistic approach. CS are
classified according to the internal cognitive processes underlying them. In other words,
observable behaviours are described according to their underlying mental processes and
grouped together according to these inherent similarities. This perspective is justified by
the claim that examining overt behaviour without considering underlying mental
processes leads to inconsistent taxonomies, which seems to have been reinforced by the
different product-oriented classification schemes that have emerged.
Færch and Kasper (1983) divided CS into two broad categories: reduction
strategies and achievement strategies, based on the location of CS within a general
model of speech production consisting of two phases: planning and execution. During
the planning phase the speaker selects the rules and items necessary to achieve a
communicative goal and during the execution phase this plan is executed through verbal
behaviour to achieve the goal. CS are believed to be placed within the planning phase of
speech production. For Færch and Kasper CS are characterised by problem orientation
and consciousness. Learners express CS consciously because they lack the L2 resources
to express the intended meaning or they cannot access these L2 resources.

74
Reduction strategies involve changing the original communicative goal, for
example, by avoiding language the speaker is unsure of, omitting a word or phrase
during an utterance and continuing as if it had been said or completely abandoning a
message. Reduction strategies are divided into formal reduction and functional
reduction strategies. Formal reduction involves avoidance of L2 rules the learner is
uncertain of whereas functional reduction involves avoidance of speech acts or topics.
Achievement strategies involve sticking to the original goal but finding an
alternative means of reaching it by using any available means. They are further divided
into compensatory and retrieval strategies. Compensatory strategies involve replacing
the original plan with a strategic one, for example, word coinage28 or code switching29
whereas retrieval strategies occur when learners persevere with their original plan by
trying to retrieve the item required.
Bialystok (1983) initially divided strategies into L1-based, L2-based and non-
linguistic strategies, as detailed in Table 2.5. However, these were later (Bialystok,
1990) redefined along the distinction between analysis and control, grounded in
cognitive psychology. Bialystok argued that CS are a result of the cognitive
mechanisms that operate on mental representations in linguistic processing. Within her
cognitive framework the two components of language processing, analysis of linguistic
knowledge and control of linguistic processing, give rise to two types of CS:
knowledge-based and control-based strategies (see Table 2.5). In knowledge-based CS
the learner adjusts the content of the message by exploiting knowledge of the concept,
as in giving a definition or using a circumlocution, whereas in control-based CS the
28 Word coinage is creating a non-existing L2 word based on a supposed rule, for example representor for representative. 29 Code switching is using a L1 word with L1 pronunciation.

75
learner holds the initial information constant and manipulates the means of expression
by integrating resources outside the L2, such as in the use of gesture or the use of L1.
The Nijmegen project (Bongaerts & Poulisse, 1989; Kellerman, 1991;
Kellerman et al., 1987; Poulisse, 1990) using the same theoretical framework as
Bialystok, developed another psycholinguistic model through an extensive study on CS,
reported in several papers by Bongaerts, Kellerman and Poulisse. They developed a
context-free process-oriented taxonomy. Three fundamental conditions are reflected: 1)
its psychological plausibility, strategies being compatible with what is known about
language learning in terms of language processing, cognitive processing and problem-
solving behaviour 2) parsimony, a preference for a taxonomy with as few categories as
possible and 3) generalisability across tasks, proficiency level, languages and learners.
This means that no strategy should be uniquely associated with a certain task, as in a
product-orientated approach.
The resulting simple taxonomy (see Table 2.5), according to the researchers,
reflects the nature of mental processing involved in the production of CS. It consists of
two archistrategies called conceptual and linguistic code, which Kellerman describes
as:
“Learners can either manipulate the concept so that it becomes expressible
through their available linguistic (or mimetic) resources, or they can manipulate
the language so as to come as close as possible to expressing their original
intention.” Kellerman (1991, cited in Ellis, 1994: 401)
The conceptual archistrategies are broken down into analytic and holistic, and the
linguistic ones into transfer and morphological creativity, where the dimensions
constitute poles on a continuum rather than discrete options. Within these categories,
many strategies are included which can be traced to other taxonomies and back to
Tarone (1977). Therefore, the Nijmegen categories reflect the common features between
76
discrete strategy types from other taxonomies. Conceptual strategies may involve an
analytic process, identified as word coinage, description, paraphrase or circumlocution
in other taxonomies. They may also involve a holistic process, for example, the use of a
superordinate, coordinate and subordinate term, identified as approximation in other
taxonomies. The linguistic code archistrategies may be transfer strategies, such as
borrowing, foreignising and literal translation or they may involve morphological
creativity, such as saying surprended instead of surprised.
Poulisse (1993) later placed compensatory strategies within Levelt’s (1989)
model of speech production (see Chapter 1, Figure 1.1), which allowed more detailed
psycholinguistic analysis of CS than was previously possible. The consequent
adjustments resulted in three categories: substitution, substitution-plus and
reconceptualisation strategies, as seen in Table 2.5. Substitution occurs during the
encoding of the preverbal message when a lemma is substituted for another or omitted
completely (code switching, approximation, use of all purpose words, complete
omission). Substitution-plus strategies involve the substitution of a lemma but also
accompanied by a modification, by application of grammatical or phonological
encoding (foreignising, word coinage, literal translation) and usually results in an
incorrect word and reconceptualisation involves a larger change to the preverbal
message at the conceptual preparation stage, for example as in circumlocution, where
more than a single chunk is altered or changed completely.
2.3.1.3 Integrated approach
The third standpoint in CS research integrates psycholinguistic and interactional
perspectives, in an attempt by some CS researchers to overcome the limitations within
the psycholinguistic view. In other words, the exclusion of strategies involved in

77
negotiation of meaning, repair or the use of discourse markers, which are widely used
by speakers as they deal with problems arising in the execution phase of an utterance.
Therefore, these strategies were included in other taxonomies (Canale, 1983; Dörnyei &
Scott, 1997; Rost & Ross, 1991; Savignon, 1983; Willems, 1987) in an attempt to
integrate problem-solving devices “to the various pre- and post-articulatory phases of
speech processing” (Dörnyei & Kormos, 1998: 350).
Canale’s (1983) framework, although among one of the earliest, was also the
broadest as it divided CS into 1) strategies to compensate for disruptions in
communication due to speakers’ lack of L2 linguistic resources and 2) strategies to
enhance the effectiveness of communication. The former set of strategies involve
negotiation of meaning: learners mutual attempts to avoid or repair impasses in their
conversations, whereas the latter set of strategies constitute non-problem solving
behaviour, involved in maintaining communication and gaining time to think. Since
then, the former (compensatory) strategies have been studied extensively in CS research
whereas the latter strategies, which enhance communicative effectiveness, have been
investigated much less (Clennell, 1995; Dörnyei & Kormos, 1998; Dörnyei & Scott,
1995; Nakatani, 2006; Olshtain & Cohen, 1989).
Clennell (1995) investigated strategies in an information-gap task and a
discussion task, grouping strategies into overcoming lexical problems, collaborative
facilitation and message enhancement strategies. Olshtain and Cohen (1989) looked at
strategy use in speech acts and the way learners learn about what constitutes good
performance.
In Dörnyei and Scott (1995) and Dörnyei and Kormos (1998) an integrated
taxonomy of CS was presented, based on the wealth of existing taxonomies that were
available (see Table 2.5), which included strategies related to the planning or pre-

78
articulatory stage of speech, such as those described so far within the psycholinguistic
view, but also those problems which arise during communicative interaction, described
within the interactional view. These strategies were called problem-solving mechanisms.
Like Poulisse, Levelt’s model of speech production was used to classify strategies,
except that a wider range of strategies were considered, as seen in Table 2.5. Their
perspective included three types of problem management: direct, indirect and
interactional, according to how strategies resolve the communication problem and
achieve understanding and four types of communication problem which are related to
different phases of speech processing and are illustrated below: 1) resource deficits 2)
processing time pressure 3) own performance problem 4) other performance problem.
Resource deficit problems occur during planning and encoding of the pre-verbal
message, processes illustrated in Levelt’s model (see Figure 1.1) and may be resolved
by lexical, grammatical or phonological problem-solving mechanisms.
“lexical problem-solving mechanisms handle the frequent inability to retrieve the
appropriate L2 lemma that corresponds to the concepts specified in the preverbal plan;
grammatical problem-solving mechanisms deal with the insufficient knowledge of the
grammatical form and the argument structure of the lemma, as well as the word-ordering
rules of the L2... and (c) phonological and articulatory problem-solving mechanisms help
to overcome difficulties in the phonological encoding and articulatory phases caused by the
lack of phonological knowledge of a word or connected speech” (Dörnyei & Kormos, 1998:
357).
Processing-time pressure also occurs during planning and encoding of the pre-
verbal message and is resolved by stalling strategies. These strategies are related to the
fact that L2 speech is much slower, requires more serial processing and attention, and
therefore more processing time than L1 speech. Therefore, lexicalised pauses including
fillers such as well and let me see and non-lexicalised pauses, unfilled or filled, with
sound lengthening or umming and erring are the strategies used to gain time for
79
processing. Own performance problems occur after the message has been encoded,
during monitoring the internal speech or during articulated speech and are resolved by
different types of self-repair (error repair, appropriacy repair, different repair,
rephrasing repair) or check questions (comprehension checks, own accuracy checks).
Other performance problems occur during post-articulatory monitoring or in the parser
(speech comprehension system) and are resolved by negotiation of meaning strategies
such as asking for repetition, expressing non-understanding, interpretative summary and
feigning understanding.
In Nakatani (2006), a study described in the previous chapter, an integrated
approach was also taken as both compensatory and interactional strategies
(comprehension checks, clarification requests) were included in a strategy
questionnaire. However, a further set of strategies, rarely investigated in the field of CS,
metacognitive strategies, were also included. Metacognitive strategies have traditionally
been investigated in LLS research, and are considered to be key factors in learners’ self-
regulatory processes as they plan, monitor and evaluate the learning task.
Summing up, the different conceptualisations and categorisations of CS, ranging
from a narrow (Poulisse, 1990) to a broad approach (Dörnyei & Scott, 1997) have been
described. This background information will serve as a guide for interpreting and
comparing the findings from the review of studies presented in Section 2.3.3.
2.3.2 Limitations of Communication Strategies research
Although CS are a component of strategic competence and have been essential
in understanding second language speech production, one main criticism has been that
despite over two decades of research, the field has generally not helped in explaining
second language acquisition. One limitation concerns the scope of research from the

80
psycholinguistic perspective, which has primarily been concerned with problems at the
lexical level (Bialystok, 1990; Chen, 1990; Færch & Kasper 1980; Kumaravidelu, 1988;
Manchón, 1989; Poulisse, 1990; Tarone, 1981), ignoring that learners can use CS to
overcome grammatical problems or at the pragmatic or sociocultural levels.
As for the interactional perspective, several criticisms have also been made.
Aston (1986) claimed that identification of negotiation sequences is not always clear
and that researchers may be making the wrong interpretations when identifying episodes
of negotiation. For example, Hawkins (1985) showed from retrospective comments that
speakers sometimes signalled comprehension in the negotiation, when in fact they had
not understood.
Foster (1998) showed that classroom learners did little negotiating. Other
researchers have found instances of unsuccessful negotiation, where the particular
communication problem is not resolved but the interlocutors give up the negotiation in
order to continue the conversation or instances have been recorded where learners have
been pushed to produce modified output, but have not done so (Aston, 1986). Also,
many forms and structures of language are redundant and will never become the focus
of negotiated interaction, as learners will adhere to Grice’s (1975) conversational
maxims such as brevity, communicating effectively but not necessarily grammatically.
Little research exists showing that negotiation leads to grammatical development. In
general these findings contradict the claim that negotiation of meaning promotes SLA.
Despite these limitations, interaction studies have provided theoretical
frameworks for analysing a part of discourse and there are many findings that indicate
that negotiation is involved in some aspect of SLA.
Further criticisms are that, particularly from the interactional perspective, CS
research has been based on analysis of transcribed oral interaction so learners’

81
intentions or underlying goals have not always been considered. Therefore, there is a
need for more studies which consider learner’s intentions through retrospective
methods. Secondly, a great many studies have been in experimental settings or between
NNS-NS dyads, so that firm conclusions about strategies used in NNS-NNS
communication, which is the norm in the EFL classroom, cannot be drawn. Strategies
have been shown to differ qualitatively and quantitatively with the setting and
depending on the interlocutors (DeKeyser, 1991; Lafford, 2004).
In order to address some of these limitations in this study, firstly, as broad an
approach as possible was taken to investigate strategy use across oral communication
tasks and proficiency groups. Therefore, the description of strategy items on the strategy
questionnaire drew from both the studies by Nakatani (2006) and Dörnyei & Scott
(1997) to include compensatory strategies occurring in the planning stage of speech
processing, interactional strategies occurring during articulation and the unfolding
discourse and hierarchical metacognitive strategies which oversee the processes of oral
communication. According to Bachman and Palmer (1996) and the CEFR authors
(2001) strategic competence is characterised by its metacognitive nature, involving
more global planning, monitoring and evaluation of the communicative event. In terms
of research, examining CS from this extended perspective may be more revealing of
processes involved in SLA and developing such strategic competence in learners will
make them more communicatively effective with the resources already at their disposal.
Secondly, data obtained from identification of strategies in task transcripts by the
researcher was triangulated with learners self reports on a questionnaire and in
stimulated recall sessions. Finally, NNS-NNS oral communication was investigated in
an EFL classroom setting to be able to draw practical conclusions for EFL language
teaching.

82
2.3.3 Communication Strategies across tasks and proficiency groups
As for LLS studies, studies on CS have predominantly investigated proficiency,
too (for example, Bialystok, 1983; Chen, 1990; Corrales & Call, 1989; Dobao, 2002;
Jourdain, 2000; Liskin-Gasparro, 1996; Manchón, 1989; Paribakht, 1985; Poulisse &
Schils, 1989; Poulisse, 1990; Ting & Phan, 2008) but in contrast to LLS studies, these
studies have generally been task-based. Furthermore, researchers have often
manipulated tasks in experimental settings to elicit particular strategies (Dörnyei, 1995;
Littlemore, 2001). As a detailed review of all the CS studies which have investigated
proficiency and task factors is beyond the scope of this thesis, this section first
summarises the trends among findings related to proficiency and reviews a recent study.
It then reviews three studies in depth to illustrate findings regarding proficiency and
task effects on CS use.
Firstly, findings concerning proficiency, in terms of frequency of CS use, have
generally provided evidence that lower proficiency learners use more CS, which has
been explained by the fact that they encounter more problems in oral communication
due to their more limited command of the L2 (Chen, 1990; Labarca & Khanji, 1986;
Liskin-Gasparro, 1996; Paribakht, 1985; Poulisse, 1990; Rossiter, 2005; Yoshida-
Morise, 1998). However other studies have shown no significant differences in CS use
(Corrales & Call, 1989; Ting & Phan, 2008) between proficiency groups.
Evidence has also been found which suggests that different proficiency levels
can be distinguished by the type of CS they select. For example, Bialystok’s (1983)
study showed that low proficiency learners used more L1-based strategies compared to
L2-based strategies, which has been supported by the findings of others (Liskin-
Gasparro, 1996; Manchón, 1989; Paribakht, 1985; Ting & Phan, 2008). Khanji (1996)
found low proficiency learners used repetition and message abandonment, intermediate
83
learners used transliteration, semantic contiguity and code switch and advanced learners
used topic shift and semantic contiguity. Some of these researchers have claimed that
CS are linked to developmental stages in language acquisition.
In an integrated approach to CS including psycholinguistic (Færch & Kasper,
1980), interactional (Tarone 1980) and discourse (Clennell, 1995) perspectives, Ting
and Phan (2008) examined proficiency effects on CS of 10 high and 10 low Malaysian
undergraduates on a NNS-NNS discussion task about dating at university. They did not
find differences in the total number of CS identified for low and high groups,
contradicting findings from other researchers. Restructuring30 was the strategy used
most by both proficiency groups, which was about 30% of the total number of strategies
identified, as in Lafford (2005) and Ting and Lau (2007). What is unique about this
study is the broad approach taken, which allowed for the identification of lexical
repetition for clarification, emphasis and topic maintenance, which were also commonly
used strategies. Furthermore, high proficiency learners were found to use tonicity31
more compared to low proficiency learners, a strategy studied in Clennell (1995), to
enhance communication. As found in other studies, low proficiency learners used L1
strategies more (code switching).
Other studies which have investigated the effects of both proficiency and task
(Corrales & Call, 1989; Dobao, 2002; Poulisse, 1990) have shown that task has a more
dominant effect on CS selection than proficiency. These studies are detailed below.
In a study by Corrales and Call (1989), intermediate and advanced Spanish ESL
learners lexical CS were examined on two tasks: answering comprehension questions
about a reading passage and a simulated telephone call. They also compared CS at the
30 Restructuring was defined as “The speaker reformulates the syntax of the utterance”. 31 Tonicity was defined as “The speaker uses stress and pitch to mark key information or to differentiate given from new information”.

84
beginning and end of a 5-week period of intensive study. CS were identified in
transcripts and classified as process oriented (transfer and overgeneralisations) and task-
influenced strategies (circumlocution, code switching, appeal for assistance and
avoidance).
In terms of proficiency, results showed no statistically significant difference in
the level of strategy use between the intermediate and advanced groups. In terms of
task, the more open unstructured telephone conversation task elicited more transfer
strategies (literal translation and foreignising) and in terms of time, the intermediate
group used more task-influenced strategies at the end of the 5-weeks but not such a
marked difference was found for the advanced group. The researchers explained that the
results related to proficiency in terms of developmental stages, claiming that CS peak at
a certain stage and then decline as learners develop greater L2 proficiency.
In a psycholinguistic study by the Nijmegen group reported in Poulisse (1990)
differences in lexical compensatory strategies were investigated across different tasks
and between proficiency groups. Participants were three groups of 15 Dutch ESL
learners at three different L2 proficiency levels. They performed four different tasks: 1)
a concrete picture description task, 2) an abstract figure description task, 3) a story
retelling task where participants listened to a story in Dutch and retold it in English with
the help of picture prompts and 4) an oral interview. Retrospective comments were
collected for the story retelling and oral interview tasks (the more natural tasks) as the
prediction of strategies to be used was more difficult on these tasks as problems could
not be predetermined or could be more easily avoided during the tasks. Lexical
compensatory strategies were identified in task transcripts and coded according to the
Nijmegen group’s classification system described above (Table 2.5).

85
Proficiency level findings were compared for the picture description, story
retelling and oral interview tasks. Less proficient learners used more lexical
compensatory strategies. The type of strategies used most by all proficiency levels were
analytical (word coinage, circumlocution) and the strategy used least was morphological
creativity. Therefore, the type of compensatory strategy selected was generally not
related to proficiency level. However, there were some differences in the realisation of
strategies with high proficiencies providing more properties in analytical strategies in
the picture description task. Also, the nature of the task had a marked effect on the type
of compensation strategies selected, overruling proficiency effects. The photo
description task resulted in more analytic strategies such as word coinage and
circumlocution, which are effortful and lengthy strategies. This was explained by the
task requirements, which demanded that all the lexical problems be solved, the time
constraints, which were unlimited, and the lack of context. Learners had to describe the
pictures with no interlocutor present, so they made the extra effort to make sure they
were understood. In contrast, in the oral interview and story- retelling more holistic
strategies such as approximation, non-verbal strategies and transfer strategies such as
foreignising or literal translation were elicited. In these tasks the task requirements did
not demand all strategies to be perfectly comprehensible as an interlocutor was present,
so learners could check if they had been understood and some problems could go
unresolved if they were considered of little relevance to the discourse. Also, these tasks
were more cognitively complex, so less attention was available for producing more
effortful processing strategies. Furthermore, time constraints were imposed by the
constraints of conversational rules (for example of turn taking) in the oral interview and
the discourse mode in the story retelling, which may also have prevented the use of
lengthier circumlocution strategies.

86
What is particularly convincing about this study is the explanation of the results
underlying strategy use. Poulisse (1993) later claimed that in choosing which CS to use,
speakers adhere to the general principles of communication, particularly the
Cooperative Principle and the Least Effort Principle (Grice, 1975). In other words,
speakers will use a CS which is comprehensible and requires the least effort first.
Poulisse’s (1993) reconceptualization strategies (circumlocution) are the most
comprehensible but require the most effort in terms of speech processing, therefore the
use of these strategies only occurs when economy has to be sacrificed in order to
achieve clarity.
Poulisse tested these predictions and found that learners did indeed adhere to the
above two principles. In the interactive task, learners could make sure they were being
comprehended because they could see the reactions of their interlocutor or check
comprehension verbally and, therefore, used substitution strategies (for example, code
switching, approximation, use of all purpose words) but in a non-interactive task,
carried out in a language laboratory, learners used reconceptualization strategies,
because they could not interact to make sure they were being understood. Therefore, in
this type of task they had to sacrifice economy to ensure clarity. If a choice has to be
made learners weigh up the importance of the communicative goal and choose either
economy (maybe avoiding the problem) or clarity (circumlocution).
In a study on interactional strategies by Dobao (2002), 15 Spanish students at
three different proficiency levels (elementary, intermediate and advanced) did three
different tasks: a picture story narrative, a photograph description and a ten-minute
conversation and took part in retrospective interviews afterwards, identifying in
transcripts where they had had communication problems. CS were identified in

87
transcripts and coded according to Tarone (1977, 1981), as described previously in
Table 2.5.
Results revealed that elementary students used most CS, which supports the
general trends found in CS research so far. However, advanced students also used a lot
of CS, more than the intermediate students, who used the least. Dobao explains this by
claiming that the advanced learners were highly motivated and in making more efforts
to express themselves they came across more communication problems which they had
to resolve. This was supported by the fact that these learners produced more language
and referred to more actions and objects. In contrast, intermediate learners were more
careful and just expressed the essential information.
As for differences in the types of CS used, elementary learners used more
avoidance and transfer strategies than the intermediate and advanced learners, which
supports previous research (Bialystok, 1983) and fewer paraphrase strategies than the
advanced learners. The explanation for this was that the former strategies require less
effort whereas the latter are more cognitively and linguistically demanding and may be
beyond the L2 resources of the elementary learners. Advanced learners used more
paraphrase than intermediate learners as they had more L2 resources to be able to use
these strategies. They also used slightly more transfer strategies because, as explained
above, in attempting to express more complex language they came across more lexical
problems that they could not resolve. What is unique about Dobao’s study is that she
relates strategy use to language production measures (the number of words and amount
and specificity of detail), which enriches our understanding of the complexity of the
relationship between CS and proficiency.
In sum, low proficiency learners generally use more CS than high proficiency
ones and different types of CS may be preferred by learners at different proficiency

88
levels, with low proficiency levels preferring L1-based and avoidance strategies.
However, the most important points that emerge from these findings relevant to this
study is that 1) the way learners choose to approach a task, which can be revealed from
spoken production measures, also determines the quantity and quality of CS used 2)
task has an overriding effect on CS use compared to proficiency and 3) the type of CS
chosen on a particular task may be governed by conversational principals which are
determined by the communicative features of the task demands. In this study one of the
aims, therefore, is to compare different proficiency levels to present further evidence for
the kinds of strategies each proficiency group employs but also to measure spoken
production in the same population of learners performing the same tasks in order to
provide support for why certain strategies are being used by one proficiency group and
not the other.
Chapter 2 has been concerned with LLS and CS and their role in oral
communication. In the first part, LLS were described and research developments were
summarised. Limitations of LLS research were considered and data collection methods
reviewed. This led to the conclusion that strategies should be investigated in context,
with researchers more recently advocating task-based studies. Proficiency emerged as a
decisive factor in strategy use, possibly linked to learners’ developmental stage in SLA.
Furthermore, because of the psychological nature of strategies, triangulation of data via
different data collection methods seemed to be essential for obtaining reliable and valid
results.
In the second part of Chapter 2 the discussion converged on strategies employed
in oral communication and the various conceptualisations of CS; interactional,
psycholinguistic and integrated perspectives were discussed. CS research, which unlike
LLS research has been predominantly task-based, shows that proficiency is involved in

89
determining CS use, too, but also that the task has an even greater influence, possibly
through particular requirements that the task imposes on the oral communication.
Limitations of CS research were identified which pointed to employing broader
frameworks for identifying strategies, considering learner’s intentions and performing
research in more authentic NNS-NNS settings. As both LLS and CS fields of study have
pointed to understanding task demands and characteristics as a crucial step in
understanding oral communication, this will be the focus of the following chapter.


Chapter 3
Task-based research

90
Task-based language learning is another rich area of language teaching and
research which is relevant to this study. Several books have been published concerning
teaching (for example, Ellis, 2003; Lee, 2000; Nunan, 1989; Willis, 1996) and research
(Bygate et al., 2001; Garcia Mayo, 2007; Skehan, 1998a), which illustrates the central
importance of tasks in the foreign language classroom and SLA research.
The use of tasks in the classroom lies on strong theoretical and pedagogical
bases. From a psycholinguistic perspective, by carrying out tasks learners notice gaps in
interlanguage, test hypotheses about language, receive feedback, confirm or reject
hypotheses and restructure them (Swain, 1995). From an interactional viewpoint tasks
provide learners opportunities for noticing gaps in interlanguage during meaning
negotiation (Long, 1985, 1989) and from a sociocultural perspective, group work on
tasks fosters interaction in which participants can co-construct knowledge (Donato,
1994).
From a research perspective, tasks elicit meaning-based samples of language
which are used to examine how SLA occurs and how best to teach and test with tasks.
Pica (1997, cited in Ellis, 2005) argues that in the field of task-based studies the
relationship between teachers and researchers is more highly compatible than in other
fields, as they pursue the same aims. Both are concerned with finding appropriate tasks
that lead to most effective language learning and manipulating tasks to focus learners’
attention, to varying extents, either on form or meaning. It is, maybe, for these reasons
that research on the impact of task variables on spoken performance has become so
prolific in recent years.
In this study tasks provide the context in which strategy use and spoken
production are examined and, as seen in previous chapters, this context plays a strong
role in shaping oral communication. The aim, therefore, in this chapter is to define the

91
concept of task, summarise the various ways in which tasks have been classified and
then focus on how various tasks dimensions have been identified and examined.
Findings from interactional and cognitive perspectives of tasks are included as they
have both contributed to our knowledge of the interplay between task dimensions and
negotiation of meaning strategies, in the case of interaction studies, and task dimensions
and spoken production, in the case of cognition. In terms of this study such research has
informed both the types of tasks employed and the interpretation of results regarding
strategy use and spoken production. What this chapter does not cover, however, is task-
based teaching methodology or syllabus design, which is not the focus of the study.
3.1 Definitions of task
Ellis (2003: 4-5) and Bygate et al. (2001: 9-10) list a number of definitions of
task, of which so many can be found in the literature (Bachman & Palmer, 1996; Breen,
1989; Bygate et al., 2001; Crookes, 1986; Long, 1985; Nunan, 1989; Prabhu, 1987;
Skehan, 1998b; Willis, 1996, among others) stemming from communicative language
teaching and SLA research fields. Only a few definitions will be presented here to help
understand the concept as used in this study. According to Ellis (2003) definitions of task
differ in the following respects: 1) the scope of activity that a task encompasses, 2) the
perspective from which a task is viewed (for example, from the teacher, learner or tester),
3) the authenticity of a task (a real-world task, such as making an airline reservation, is
situationally authentic whereas a pedagogic task, such as a spot-the-difference task, is
interactionally authentic, artificial, but eliciting language behaviour which may arise in
the real-world), 4) the linguistic skills required to perform a task, although tasks in both
teaching and research have been predominantly geared towards oral skills (Bygate et al.,
2001; Crookes & Gass, 1993; Klippel, 1998; Ur, 1981), 5) the psychological mechanisms

92
involved in performance and 6) the task outcome, the solution learners arrive at once the
task is completed, which is judged in terms of content and not merely language.
“A task is a piece of work undertaken for oneself or for others, freely or for
some reward. Thus examples of tasks include painting a fence, dressing a
child... making an airline reservation... In other words, by ‘task’ is meant the
hundred and one things people do in everyday life, at work, at play, and in
between.” Long (1985: 89).
Long provides a broad definition of task which doesn’t necessarily involve
language (painting a fence) whereas according to a narrower definition, such as the
following by Nunan (1989), a communicative task is a pedagogical tool which promotes
natural and communicative use of the target language:
“a piece of classroom work which involves the learners in comprehending,
manipulating, producing or interacting in the target language while their
attention is principally focused on meaning rather than form. The task should
also have a sense of completeness, being able to stand alone as a
communicative act in its own right” Nunan (1989: 10).
Bygate et al. (2001) pointed out that most definitions were context-free but that
definitions should differ according to the purpose for which the task is used,
differentiating between pedagogical and research tasks and also suggesting that within
each of these areas tasks could be defined according to whether they were concerned with
teaching, learning or testing. Many other definitions of task, as well as Nunan’s,
emphasise that meaning is primary (Bygate et al., 2001; Lee, 2000; Skehan, 1998).
Skehan’s (1998) definition is included here as it is the one adopted for this study.
Furthermore, it encompasses many of the features expressed in other definitions of task.
“a task is an activity in which meaning is primary; there is some kind of
communication problem to solve; there is some sort of relationship to
93
comparable real-world activities; task completion has some priority; the
assessment of the task is in terms of outcome”. Skehan (1998: 95)
In other words, as opposed to language drills, in tasks, language is used in context.
Learners are required to convey meaning but also attend to form in doing so, and the
extent to which learners attend to form or meaning varies with the kind of task
undertaken.
3.2 Criteria for identifying tasks
In order to further elaborate on the above definitions of task, some basic criterial
features for identifying a task, as described in Ellis (2003: 9-10), are summarised:
1) A task is a workplan
A task is the plan, in the mind of the teacher or in the form of materials, of what
the learners will do. The resulting “task in process”, however, may not match
that intended by the plan.
2) A task involves a primary focus on meaning
The task engages learners in using language in a meaningful context rather than
displaying it. Learners choose the resources they need to complete the task, in
the workplan, does not specify the language to be used. Nevertheless, a task
creates a semantic space and requires particular cognitive processes linked to
linguistic options. Therefore, the task puts some constraints on learners but
allows them to have the final choice of what resources they use.
3) A task involves real-world processes of language use
As described earlier a task may be found in the real world. In oral
communication this could be interpreting a piece of art. A task may also be
artificial, as in the spot-the-difference or narrative picture story tasks employed

94
in this study. However, in all cases the language use involved (asking questions,
clarifying or storytelling) will reflect those used in real life.
4) A task can involve any of the four language skills
A task may involve listening, reading, writing, speaking or a combination of all
four skills, as in Swain et al. (2009) and may be monologic or dialogic.
5) A task engages cognitive processes
Cognitive processes such as selecting, classifying, ordering, reasoning and
evaluating may be required to carry out the task, which will influence the
strategic approach but not necessarily determine learners’ actual choice of
language.
6) A task has a clearly defined communicative outcome
The workplan specifies a clear non-linguistic outcome for the task. For example,
in a spot-the-difference task the outcome would be that learners have to say
which pictures are the same and which are different.
3.3 Task classification systems
Tasks have been classified in a number of ways and there is currently no shared
consensus about how this should be done either for research or teaching. Tasks have
been classified according to information flow (for example, split tasks, shared tasks,
one-way or two-way tasks), according to learner activities (for example, role play,
decision-making) or according to discourse domain (for example, descriptive,
narrative). Tasks have also been described pedagogically according to the four language
skills (reading, listening, writing, speaking) and grammar and vocabulary, which has
been useful in designing traditional coursebooks.

95
Willis’s (1996) pedagogical classification is based on tasks commonly found in
textbooks and reflects the actions learners have to perform in doing a task: 1) listing, 2)
ordering and sorting, 3) comparing, 4) problem-solving, 5) sharing personal experiences
and 6) creative tasks.
A rhetorical classification distinguishes tasks according to discourse domains,
(for example, narrative, report or description), which is common in language courses for
academic purposes. Discourse domain has been shown to influence both negotiation of
meaning strategies and spoken production. Swales (1990) has used the concept of genre
to classify tasks rhetorically, examples of genres being recipes, political speeches, job
application letters and medical consultations.
A cognitive classification of tasks is based on the cognitive processes that the
tasks evoke. Prabhu (1987) distinguishes three types of activity: information gap,
reasoning gap and opinion gap, arguing that when learners engage in such cognitive
processes they become more open to learning.
A psycholinguistic classification of tasks is concerned with classifying tasks
according to their potential for learning. Pica et al. (1993) based their classification on
interactional categories, which, in interaction research, have shown to influence
opportunities for interaction: interactant relationship, interaction requirement, goal
orientation and outcome options. To illustrate with an information-gap task, for
example, the task can have an interactant relationship that is one-way, one participant
supplying the information or two-way, two participants supplying the information. It has
an interactional requirement as information must be requested and supplied. Its goal
orientation is convergent, as both participants must agree on a single outcome and its
outcome options are closed, as there is only one possible outcome

96
It is also worth highlighting the distinction between focused and unfocused tasks,
as much research has turned to examining focused tasks. Both focused and unfocused
tasks are regarded as types of task, as they adhere to the criteria previously described.
Unfocused tasks, however, are designed to promote communication with no particular
language form in mind whereas focused tasks are designed to elicit reception,
processing or production of a particular linguistic feature, such as past tense verb forms
or relative clauses. Focused tasks aim, therefore, to promote communication as well as a
focus on particular form-function-meaning relationships. The forms chosen by the
researcher for focused tasks may not arise during negotiation of meaning in unfocused
tasks, as they represent forms with low salience, for example, redundant grammar such
as articles, connectors or verb forms, or they may be forms which are difficult to master.
The theoretical justification for employing such tasks is that they promote noticing and
modified interaction, drawing learners’ attention to features which learners would
otherwise ignore.
Tasks can be focused by designing them so that they may only be performed if a
particular linguistic feature is used or by making the target language feature the topic of
the task, for example, the task may require the participants to talk about conditionals
and work out rules to describe how they are used. The talking about the language
involves the same kind of real-world language use or cognitive processes as any other
topic and so the talk is still meaning-centred. Ellis (1991) called these types of task CR
(consciousness-raising) tasks. Pica et al. (2006) have explained the methodology behind
the design of information-gap tasks for this purpose and have reviewed their role in
research and teaching. In this study, however, three pedagogical unfocused tasks (see
Section 4.2.2) are employed which satisfy the basic criteria described in the previous
section.

97
3.4 Tasks and cognition
Some researchers have taken a cognitive perspective to study tasks, focusing on
the psycholinguistic mechanisms learners engage in when undertaking them. By
studying how attention to complexity, accuracy and fluency is affected during
performance on easier or more difficult tasks, tasks may be chosen and sequenced more
appropriately for the foreign language classroom and according to learners’ stage of
interlanguage development.
Two well-known cognitive theories on task difficulty (or task complexity or
cognitive complexity) have been put forward by Robinson (2001) and Skehan (1998a)
respectively. Both theories are similar in that they are grounded in the consensus in
cognitive psychology that attention is limited, but they differ in their perceptions of how
attention is spread and allocated, as will be explained in the following sections.
A considerable number of studies have been dedicated to empirical
investigations of task difficulty, whose results have supported one or the other of these
theories. Nevertheless the investigation of task difficulty is not an easy endeavour, as
mentioned previously. What makes Task A more difficult than Task B depends on
several inter-related factors and conclusive support for one theory or another does not
yet exist. For this reason both theories are presented, as they have both contributed
greatly to our understanding of how learners perform tasks.
3.4.1 Skehan’s Limited Attentional Capacity Model
Skehan’s (1998a) Limited Attentional Capacity Model subscribes to the view
that there is one limited resource pool for attention in the mind (Van Patten, 1990) and
so attending to one aspect of performance (complexity or accuracy or fluency) may
limit the others. Skehan cites Van Patten’s (1990) work to support this theory. Van
98
Patten showed that when learners paid attention to language forms they could not pay as
much attention to content. In addition, when learners were free to choose how to
allocate attention, they choose to pay attention to content over form. Therefore,
limitations of attentional capacity result in trade-offs between attention to form and
content, and these are manifested in speech, effecting fluency, accuracy and complexity.
As task difficulty is related to attention, with more difficult tasks requiring more
attention than easy tasks, and content being prioritised over form (Van Patten, 1990),
researchers reasoned that task difficulty would be manifested as inadequate attention to
form resulting in dysfluency, inaccuracy and the use of simplified language
encompassed in communication strategies in order to convey meaning. In other words,
fluency is favoured over complexity. If the task is even more difficult, the lack of
attention to form may lead to more errors and a drop in all three performance areas.
Accuracy drops, as well as complexity and fluency, which is manifested as shorter
utterances, simpler structures and more frequent and longer pausing.
Spoken production has been traditionally measured by rating scales, global or
analytical in examinations (for example, UCLES, IELTS) but in task-based research, the
aforementioned three-way distinction of complexity, accuracy and fluency (CAF), a
more precise measure of linguistic performance, has been taken, which Skehan claims
has been justified theoretically and empirically (Crookes, 1989; Foster & Skehan, 1996;
Skehan & Foster, 1997). This construct has since been used in countless studies to
distinguish between more or less proficient language users or as performance
descriptors for written and spoken language (see Housen & Kuiken, 2009; Larsen-
Freeman, 2009; Norris & Ortega, 2009; Pallotti, 2009; Skehan, 2009, for recent reviews
which address the issues of the definition and operationalisation of CAF). Skehan
(2001), therefore, argued that tasks could be sequenced to promote balanced

99
development of these three areas and that a knowledge of task difficulty and task
conditions was essential to be able to promote the development of each of these aspects
of performance, separately or simultaneously.
According to Skehan and Foster (2001) complexity and accuracy are concerned
with language form as shown in Figure 3.1. Complexity represents organisation of
speech, the use of more elaborate language and variety of syntactic patterns. It is
associated with willingness to restructure, risk taking, change, development or extension
of existing resources and hypothesis testing with recently acquired language. Accuracy
represents freedom from error, less risk taking and therefore more conservatism and
control of existing resources or avoidance of error. Fluency is the capacity to cope with
real-time communication. It is more idiom-based, it emphasizes meaning rather than
rule-based language and reflects the effectiveness of the planning process in ongoing
discourse. It represents “getting the task done” compared to complexity and accuracy
which represent “language focus and development” (Skehan & Foster, 2001: 190).
performance dimensions
fluency form
accuracy complexity
Figure 3.1 Theorising dimensions of performance, based on Skehan and Foster
(2001:190)

100
3.4.1.1 Task features according to Skehan
Grounding his work in previous accounts of task characteristics from the field of
communicative language teaching (Candlin, 1987; Nunan, 1989), Skehan (1998)
proposed that task complexity could be assessed according to learner factors
(intelligence, breadth of imagination, personal experience) but also according to
language, cognition and performance factors, as detailed in Table 3.1. Skehan’s (1998)
classification of task characteristics, as well as claims by researchers before him were
based on intuitive observations of tasks in the absence of research support. In his
framework, Skehan distinguishes between code complexity, cognitive complexity and
communicative stress.
Table 3.1
Task complexity as proposed by Skehan (2001: 194-195)
Code complexity is concerned with the linguistic demands of the task, whether a
wide repertoire or density of structures and vocabulary is required. A task requiring
more complex sentences with subordination or embedded structures and less common
lexical features will be more difficult, and more so, if a lot of such features are required.
Cognitive complexity is concerned with the cognitive demands of the task
content. Complexity may be due to the level of cognitive familiarity. For example, if
Code Complexity Cognitive Complexity Communicative Stress Linguistic complexity and variety Vocabulary load and variety
Cognitive familiarity Familiarity of topic Familiarity of discourse genre Familiarity of task Cognitive processing Information organization Amount of computation Clarity of information Sufficiency of information
Time pressure Scale Number of participants Length of text used Modality Stakes Opportunity for control

101
participants have prior knowledge of the topic, discourse genre or task, the task will be
easier than if all this information were new. Also, complexity may be due to the level of
cognitive processing required, for example, if the information is highly structured, as in
recounting a story, the task may be easier than a problem-solving task where attention to
several pieces of information is required at the same time. Also, complexity may be due
to the amount of information which is already provided, because if some information is
missing or hidden the task will be more difficult to do.
Communicative stress concerns the type of pressure the task may impose on
participants due to the length of time available to do the task, the number of participants
involved in the communication, the length of texts involved, the mode of
communication (through reading, speaking, listening or writing or a combination of
skills), the stakes, such as doing an exam (high stakes) compared to an informal chat at
the end of a class (low stakes) or how much participants can control or change the task
implementation.
3.4.2 Robinson’s Multiple Resources Attentional Model
Robinson’s (2005) Multiple Resources Attentional Model considers that
attention is spread over multiple specific resource pools for processing stages and
modalities (visual, auditory, vocal, manual), based on Wickens (1984, 1989). According
to this view, form and meaning need not always be in competition for attentional
resources. This explains how attention-demanding activities can be carried out more
easily at the same time if they draw on different modalities than if they draw on the
same modality. As exemplified by Gilabert (2007) if someone is having two
conversations at once they draw on the same (vocal) resource pool, so competition for
these resources occur and performance is impoverished, but if a person is driving and

102
singing at the same time, as they are drawing on different resource pools (manual and
vocal), competition for attention will not happen. Therefore, when tasks are made
complex simultaneously along different dimensions which draw from different resource
pools, there should be no competition for attention. In this view, there is some flexibility
to capacity limitations but each resource pool still has its limitations.
Robinson, therefore, claims that learners can access multiple and non-competing
attentional pools. He makes the following predictions for monologic and interactive
tasks based on the assumption that functional complexity is accompanied by structural
complexity (Givon, 1985, 1989), in other words, the need to produce a more complex
message leads to a more linguistically complex message: 1) in simple monologic tasks
fluency will be high and accuracy and complexity low, 2) in complex monologic tasks
fluency will be low and accuracy and complexity high, 3) in simple interactive tasks
fluency will be high and accuracy and complexity low, as more negotiation of meaning
in the form of more clarification requests and comprehension checks reduce the length
of utterances and 4) in complex interactive tasks fluency will be low as well as
complexity (due to even more negotiation of meaning) while accuracy will be high.
3.4.2.1 Task features according to Robinson
Robinson proposes a triadic framework for investigating the effects of different
task dimensions on performance and learning. His framework is grounded in the
Cognition Hypothesis of L2 learning and stems from the perspective of task-based
syllabus design, which instead of designing tasks according to linguistic criteria claims
that “pedagogic tasks should be developed and sequenced to increasingly approximate
the demands of real-world tasks” (Robinson, 2005:1). As seen in Table 3.2, Robinson
distinguishes between three categories 1) task complexity or the cognitive features of the

103
task, which make a task intrinsically more or less difficult, 2) task conditions or
interactional factors determined by the participation conditions or relationship between
participants, which determine the type of interaction that unfolds and 3) task difficulty
or the learner factors such as motivation, anxiety, confidence, working memory
capacity, intelligence or aptitude, which determine the extent of difficulty faced by the
learners in performing the task. According to Robinson, it is the task complexity
features that are essential in choosing, designing and sequencing tasks for a language
course, as task conditions and task difficulty often cannot be predetermined before a
language course begins and so, in his view, these aspects are less important.
Task complexity is further sub-divided into resource-directing and resource-
dispersing dimensions. This is an important theoretical distinction as the former make
conceptual/linguistic demands on the learner whereas the latter make
performative/procedural demands, as illustrated below. Each dimension is viewed as a
continuum along which a feature is relatively more or less present or absent.
Table 3.2 A triad of task complexity, task condition and task difficulty factors (taken from
Robinson, 2005: 5)
Task complexity
(cognitive factors)
Task conditions
(interactional factors)
Task difficulty
(learner factors)
(a) resource-directing
e.g.±few elements
±Here-and-Now
±no reasoning demands
(a) participation variables
e.g.open/closed
one-way/two-way
convergent/divergent
(a) affective variables
e.g. motivation
anxiety
confidence
(b) resource-dispersing
e.g.±planning
±single task
±prior knowledge
(b) participant variables
e.g.same/different gender
familiar/unfamiliar
power/solidarity
(b) ability variables
e.g.working memory
intelligence
aptitude

104
The resource-directing dimension includes the number of elements in a task. If
more elements have to be referred to simultaneously, for example in a storytelling task,
it requires more mental effort in terms of attention and memory resources than if few
elements have to be referred to. The same applies to describing events happening now
[+ Here and Now], the knowledge of which is shared by participants, compared to
describing events that happened elsewhere or at another time [+There and Then]. For
example, a classroom task may typically include some type of non-verbal input (a
picture, a diagram or a map) which has to be communicated verbally to the interlocutor.
If the task allows the speaker to see the input during communication [+ Here and Now],
numerous studies (for example, Gilabert 2004; Robinson, 2005) have shown that it is
easier than if the input is removed [+There and Then] and speakers have to
communicate the information relying on memory. Similarly, tasks which have
reasoning demands or require justification to support statements are more cognitively
demanding than those requiring mere description.
If a task is made more complex in these resource-directing dimension, it means
that the learner requires more mental effort to express the more complex concepts
involved, which in turn directs their attention to aspects of the L2 linguistic system that
will permit them to convey this complexity. This directed attention to the linguistic code
promotes noticing of linguistic forms, which may lead to interlanguage development
(Robinson & Gilabert, 2007; Robinson, 2005; Schmidt, 2001). For example, the
requirement to refer to a past event [+There and Then] is likely to direct attention to
past tense verb forms and time expressions, reference to more than one element is likely
to direct attention to the use of relative clauses to distinguish between the elements, for
example, the girl who is wearing sunglasses, and greater reasoning may lead to more
subordination with the use of connectors such as so or because. Robinson, therefore,

105
predicts that increasing complexity in the resource-directing dimension will lead to a
loss of fluency but may facilitate accuracy and complexity as the learner is directed to
particular features of the linguistic code.
In the resource-dispersing dimension, if a task is made more complex it does not
direct learners to the language code, but removing planning time, doing a task without
prior knowledge or increasing the number of tasks which have to be carried out
simultaneously (single task) has the effect of dispersing attention and memory
resources, which also affects performance. Increasing cognitive complexity in this
dimension, therefore, is also important for improving performance as it simulates more
realistic communication which is often unrehearsed, occurs in novel circumstances and
is carried out while doing something else. However, it also means that all three aspects
of performance, complexity, accuracy and fluency will be affected negatively, resulting
in poorer performance as learners attention is dispersed across several non-linguistic
aspects of production, meaning less attention is available to access and formulate the
L2.
In an attempt to incorporate more task variables and refine the existing
dimensions, Robinson and Gilabert (2007) have since expanded the framework in Table
3.2. For task complexity (column 1) in the resource-directing dimension, reasoning
demands have been divided into spatial, causal and intentional reasoning and the
dimension of perspective taking has been added. In the resource-dispersing dimension
the amount of task structure, the number of steps the task has and the independency of
steps have been added.
For task conditions (column 2) in participation variables, the number of
participants, the number of contributions required and the amount of negotiation
required are added dimensions. As for participant variables, the dimensions that have

106
been added are whether participants are of the same proficiency, whether they share
content knowledge and whether they share cultural knowledge.
For task difficulty (column 3) affective variables which have been added are
whether learners are open to experience, how well they control emotion, and their
willingness to communicate. Among ability variables intelligence has been replaced
with ability to reason, mind-intention reading, field dependence/independence32 and
ability to switch tasks.
To sum up, Robinson’s and Skehan’s models of task difficulty make different
predictions concerning spoken production. Skehan and Foster (2001) argue that fluency
may correlate with either complexity or accuracy, but not both and that there is a natural
tension between complexity and accuracy, which are in competition for resources or
that there are trade-offs between these two dimensions. According to them, increasing
task demands in the resource-directing dimension affects both fluency and complexity
or fluency and accuracy negatively. In contrast, Robinson argues that fluency contrasts
with complexity and accuracy and that increasing task demands in this dimension
degrades fluency only and that accuracy and complexity will be enhanced. In the
resource-dispersing direction, Skehan and Robinson’s predictions are in agreement, as
all three aspects would be affected negatively by increasing task demands.
This study draws on Robinson’s (2005) framework of task features to describe
the tasks employed, as it seemed the most systematic, including both cognitive and
interactional features of tasks and distinguishing clearly between them. Furthermore,
not only is the framework theoretically motivated but the task features it encompasses
have been examined by a substantial body of empirical research.
32 Field independence is a cognitive style where learners act analytically whereas in field dependence learners act holistically.

107
3.5 Research into task dimensions
Initially, within SLA research tasks were employed as instruments in early
descriptive studies and later on in more theoretically-based ones. Only even later did
they become a research area in their own right. Much of task-based research has been
motivated by the Input (Krashen, 1985) and Interaction (Long, 1983) hypotheses. These
theories have fuelled research which has examined how input (modified, unmodified
and interactionally modified) is best for comprehension. Other task-based studies have
taken a Vygotskian perspective of language learning, that is, viewing learning as
socially constructed. Learners co-construct knowledge by interacting with others,
performing functions that they cannot perform alone. With time these functions are
internalised and learning involves progression from inter-mental to instrumental, a shift
from object and other-regulation to self-regulation. Studies on scaffolding33 and
collaborative learning have emerged from this perspective (Donato, 1994; Swain &
Lapkin, 1998). A number of studies have more recently examined the effectiveness of
focused tasks as described above. However, the research which is most closely
connected to this study is research on task dimensions themselves, which has examined
how they affect the nature of the language used in performance, either in terms of
spoken production measures (fluency, accuracy and complexity) or meaning negotiation
strategies. In the following sections findings from studies will be highlighted which
have investigated the cognitive and interactional dimensions of the tasks employed in
this study.
33 The concept of scaffolding comes from the Vygotskian perspective and refers to the support by adults, peers, or more capable others that is provided when learners have gaps in their thinking or in problem solving, and which aids cognitive development.

108
3.5.1 Cognitive dimensions of tasks
In this section particular cognitive dimensions of tasks will be described and
research findings from studies which have investigated these dimensions summarised.
Although research into many of the task features listed in Robinson’s (2005) framework
has been carried out for both spoken and written production, the focus here will be on
oral tasks and the dimensions which distinguish the three tasks in this study, which are
the number of elements, reasoning demands and prior knowledge. Findings concerning
the effects of these task dimensions on the complexity, accuracy and fluency of speech
or strategies are of particular relevance to this study. Results from the studies reviewed
are summarised in Table 3.3.
3.5.1.1 Number of elements
It has been claimed that increasing the number of elements that have to be
manipulated during a task and the kind of relationship between them influences
cognitive complexity (Brown et al., 1984). Robinson (2001) compared the effect of the
number of elements in a map task on CAF and some interactional strategies.
Participants were L1 Japanese language learners. The tasks were a map with few
elements [- elements] (which was of a small area containing few landmarks) and a map
with many elements [+ elements] (which was of a larger area with more landmarks).
One learner held a map with points A and B on it and had to give directions to another
who drew the route on an empty map. More fluency was found on the [- elements] task
and more lexical complexity and interaction (comprehension checks, clarification
requests) on the [+ elements] task. No differences were found in accuracy or structural
complexity, which did not fully support Robinson’s hypothesis that accuracy and
complexity would increase on the more complex task. However, learners had more prior

109
knowledge of the [- elements] task, which could have also contributed to greater
fluency. In addition, according to Robinson, the interactive nature of the tasks may have
interfered with learners attempts to be more structurally complex, particularly on the
more complex task, where listeners were more concerned with checking that they were
following the directions correctly.
Michel (2008) also examined the effect of manipulating the number of elements
in a decision-making task on CAF. Monologic and dialogic tasks were also compared.
Participants were Dutch L1 speakers and L2 learners. The [- elements] task involved
matching up two pairs to go on a date while the [+ elements] task involved matching up
three pairs. No significant differences in complexity or accuracy were found but fluency
(faster speech rate) was higher on the [+ elements] task, even in the interactive
condition, contradicting the above results from Robinson. These results also
contradicted results from Michel et al. (2007), where a task with [+ elements] elicited
more accuracy and more complexity but less fluency. Gilabert (2007) also found that a
map task with [+ elements] elicited more accuracy and self-repair.
In sum, studies on the number of elements have shown mixed results (see Table
3.3 on p.112). As these studies have differed in the types of tasks used or in the
interactive conditions (monologue or dialogue), it is difficult to generalise from the
results or reach firm conclusions as to the effects of this dimension on spoken
performance.
3.5.1.2 Reasoning demands
Increasing the reasoning demands of a task is also believed to increase cognitive
complexity (Prabhu, 1987). Robinson (2005) compared the effect of increasing
reasoning demands in an interactive picture-sequencing task on turn taking and uptake

110
of written input. Participants were 21 pairs of Japanese L1 learners of English. The
tasks were three picture stories which varied from easy [- reasoning] to difficult [+
reasoning]. In the [- reasoning] task it was easy to justify the sequence of the pictures
whereas in the [+ reasoning] task more reasoning was required. One learner had to tell
the story so that their interlocutor could sequence the pictures correctly. Findings
showed more turn taking, suggestive of more interactional strategies, and more uptake
of written input in the [+ reasoning] task.
Niwa (2000) also examined reasoning demands in a monologic picture-
sequencing task in relation to individual differences. Participants were Japanese learners
of English who did four tasks which varied from easy to difficult in terms of reasoning
demands. Although the focus of this study was individual differences, [+ reasoning]
seemed to result in lower fluency for learners who scored high on intelligence, aptitude
and working memory. Gilabert (2007) in a monologic decision-making fire chief task
found no effects on learner self-repairs in the [+ reasoning] task. Baralt (2009), in a
study of reasoning demands and convergent/divergent tasks, found less interaction
(fewer turns) and fluency (more false starts) but more complexity (words per utterance)
in the [+ reasoning] condition.
In sum, the effects of increasing reasoning demands have also been mixed.
Comparing studies is complex as different measures have been used, making it difficult
to generalise. However, it may be that increasing reasoning demands decreases fluency
(Baralt, 2009; Niwa, 2000).
3.5.1.3 Prior knowledge
Prior knowledge of a task’s topic has been found to affect task performance.
Lange (2000) examined decision-making tasks. A task on the topic of prison was

111
compared to a task on the topic of a heart transplant. The tasks only differed with
regards to the topic, as in both tasks participants had to choose the most deserving
candidate, in the former task, to release from prison and in the latter, to offer a heart
transplant to. Lange found greater amounts of talk on the prison task.
Pinyana (2009) studied learners’ oral self-assessments across five different
discussion tasks performed in pairs. The tasks differed only in the topics provided
(cosmetic surgery, music, risk sports, the Oscars, cannabis). Pinyana, in her qualitative
analysis, found that learners identified some topics as problematic because “they lacked
expertise in the topic or that they would rather talk about another topic” (Pinyana, 2009:
241). Although the focus of this study was self assessment rather than spoken
performance, learners assessed their own performance in terms of topic knowledge, the
presence or lack of L2 resources and motivation to talk about the topic, all of which
determined their performance. Teachers’ also rated learners’ performance lower when
the topic was unfamiliar to learners.
Gass and Varonis (1984) found less negotiation of meaning if the topic was
familiar. Bygate (in Bygate et al., 2001) examined the effect of task repetition on
performance of narrative and interview tasks and found task repetition provides task
background knowledge and increases fluency and complexity. However, no significant
effects were found on accuracy. All in all, these studies provide evidence that prior
knowledge of a task favours fluency.

112
Table 3.3 Summary of findings on cognitive task dimensions Task dimension Author & Year Task Measures Relevant Findings Number of elements
Robinson, 2001
Interactive map task CAF Interactional strategies
[-elements] + fluency [+elements] + lexical complexity, + interactional strategies
Michel, 2008 Interactive & monologic CAF [+elements] + fluency
Michel et al., 2007 Interactive & monologic CAF [-elements] + fluency [+elements] + accuracy, + complexity
Gilabert, 2007
Monologic map task CAF [+elements] + accuracy, + self-repair
Reasoning demands
Robinson, 2000
Interactive picture sequencing & storytelling
turn-taking uptake of input
[+ reasoning] +turn-taking, +uptake of written input
Niwa, 2000 Monologic picture sequencing & storytelling
CAF & IDs: intelligence, aptitude working memory
[+ reasoning] – fluency: for learners with high ID scores for intelligence, aptitude, working memory
Gilabert, 2007 Monologic fire chief task
Self-repairs self-repair: no significant difference
Baralt, 2009 Interactive discussion
CAF [+ reasoning] – interaction, -fluency + complexity
Prior knowledge Robinson, 2001
Interactive map task CAF [+prior knowledge] + fluency
Lange, 2000 Decision-making
Amount of talk [+prior knowledge] + amount of talk
Pinyana, 2009 Discussion
Self assessment [+prior knowledge] + self assessment
Gass & Varonis, 1984
Discussion Interactional strategies [+prior knowledge] – negotiation strategies
Bygate, 2001 Narrative & interview
CAF [+prior knowledge] + fluency + complexity

113
3.5.2 Interactional dimensions of tasks
Interaction research, as described in the previous chapter, has investigated how
certain task characteristics affect negotiation of meaning strategies, arguing that such
strategies favour SLA. Several task characteristics have been studied: the level of
information exchange (required or optional information exchange), information flow
(one-way or two-way), goal orientation (open or closed), the topic, discourse mode and
cognitive complexity. In this section, the focus is on the three key task dimensions
which characterise tasks in this study: level of information exchange, information flow
and goal orientation. Results from these studies are summarised in Table 3.4 on p.118.
3.5.2.1 Level of information exchange
Tasks may differ according to whether they require participants to exchange
information or whether this exchange is optional. In information-gap tasks information
exchange is a requirement as the information is split between participants and they can
only complete the task successfully if they exchange this information. A typical
example is the spot-the-difference task used in this study, where learners had a set of
pictures which they were not allowed to show to each other (split information) and they
had to exchange information about their pictures in order to work out if they were the
same or different. In opinion-gap tasks, on the other hand, learners go beyond the
information by supplying their own opinions, therefore this kind of information
exchange is optional. Many tasks are compound in nature, such as jigsaw tasks, which
involve required information exchange followed by optional information exchange. For
example, in a job recruitment task where each participant holds information about a
different candidate, learners may first have to exchange information about the different

114
candidates (required information exchange) and then decide who is the most suitable for
the job (optional opinion exchange).
Table 3.4 summarises some key studies on required and optional information
(Foster, 1998; Nakahama, Tyler & Van Lier, 2001; Newton, 1991; Pica & Doughty,
1988). Overall, these studies provide evidence that more negotiation occurs on required
information tasks. However, Foster (1998) found that learners in a classroom setting
used fewer strategies than in an experimental setting, which she justified as learners not
wanting to lose face in the classroom. Nakahama, Tyler and Van Lier (2001) found that
information-gap tasks provided more instances of negotiation of meaning than
conversation, but also that more discourse strategies were produced to maintain
interaction and improve mutual understanding during conversation tasks, as well as
learners taking longer and more complex turns. These studies have been important in
pointing out that negotiation of meaning is only part of the strategic picture in oral
communication and that although the required information dimension needs to be
considered in designing tasks, other factors, such as the setting, or other types of
strategies need to be considered.
3.5.2.2 Information flow
One-way and two-way tasks are both types of required information exchange. In
the former information is held by a single participant and in the latter information is
split equally between the participants. This dimension should be viewed as a continuum,
as interaction can take place to varying extents depending on how the tasks are
implemented (Gass & Varonis, 1985). For example, a university lecture would be a one-
way flow of information with little or no opportunity to interact, listening to a story
being told would also be one-way but with more opportunity to interact and, at the other

115
end of the continuum, an information-gap task with information split evenly between
participants would be a two-way task with equal opportunities for interaction by
participants. Another way of viewing such tasks has been according to the level of
reciprocity (Ellis, in Bygate et al., 2001). Reciprocal tasks require a two-way flow of
information between speakers whereas non-reciprocal tasks require only a one-way
flow of information from speaker to listener.
Table 3.4 illustrates some studies investigating this dimension. Although Long
(1980), among others (Aston, 1986; Yule & McDonald, 1990), has found more
negotiation on two-way tasks, this was not the case for other researchers (for example,
Gass & Varonis, 1985). The mixed results obtained may be due to other confounding
task variables, such as cognitive complexity, as in these early studies the one-way/two-
way dimension was not isolated from other task variables. Therefore, it may be a
simplification to conclude that a two-way dimension to tasks is a requisite for
promoting negotiation of meaning.
3.5.2.3 Goal orientation
Another dimension of tasks which has been examined is whether a task is open
or closed. In open tasks participants know that there is no pre-determined solution to the
task whereas in closed tasks participants have to reach a single correct solution or set of
solutions. This dimension may also be considered a continuum. Open tasks include
discussions, debates, ranking or decision-making tasks (Ur, 1981) while closed tasks are
spot-the-difference tasks, giving directions or discovering who committed a crime
among a number of possible suspects. In support of closed tasks, Long (1989) claims
that they are more motivating and challenging and that learners are less likely to give
up. This may be due to the clearly stated goals of such tasks, which focuses learners’

116
attention on reaching that objective. In open tasks learners can avoid difficult topics,
treat them briefly or change topics and thereby avoid negotiating and the effort it
entails.
Pica and Doughty (1988) found that closed tasks led to more negotiation.
Berwick (1990) found more interactional moves on a closed task (a Lego
reconstruction) compared to an open one (free discussion). Crookes and Rulon (1985)
compared NS feedback to NNS feedback in a conversation (open) task, a one-way task
and a two-way information-gap task (closed) and found that feedback was more
frequent on the more closed tasks. Rahimpour (1997) found more fluency on the closed
version of a narrative but no difference in complexity and accuracy. More recently,
Lambert & Engler (2007) investigated the dimensions of goal orientation (open/closed)
and information flow (shared/one way/two way) and found that information flow was
more closely related to CAF changes than the goal orientation dimension. The shared
task design led to more complexity whereas the one-way design led to more fluency and
accuracy and the two-way design led to more accuracy.
According to Ellis (2003), the divergent/convergent distinction could also be
considered a sub-category of open tasks. Convergent tasks require learners to reach a
common solution whereas divergent tasks require them to defend opposing views.
Closed tasks may lead to more negotiation of meaning, but open tasks which are
divergent, such as a debate, lead to more complex language production than convergent
tasks. Duff (1986) examined convergent and divergent tasks in a small scale study. The
convergent task was a desert island task requiring participants to agree on what items to
take with them and the divergent task was a debate about TV where students were
assigned different viewpoints. Duff found that the convergent task led to more turn
taking, shorter and less complex turns and more comprehensible input, but the divergent

117
task led to more comprehensible output and more structural complexity. However, Ellis
(2003) argued that Duff’s results could also have been explained by the different
discourse modes of the tasks: argumentative, in the case of the debate and discursive, in
the case of the desert island task. Baralt (2009), more recently examined the divergent
and convergent dimensions in terms of CAF and interactional measures and in this
study the tasks did share the same discourse mode. She found no differences in
interaction, except that more learners included personal anecdotes on the divergent task.
Most studies (Ellis, 2003) have shown that closed tasks lead to more negotiation
of meaning, however it has been seen that other strategies which are used in other kinds
of tasks, apart from negotiation of meaning, may also be beneficial to SLA. From this
review of task-based studies, it can be concluded that the task features that have been
found to promote negotiation of meaning are 1) tasks which require information
exchange, 2) two-way information-gap tasks, 3) tasks with closed outcomes and 4) tasks
which learners have prior knowledge of. These findings were an important
consideration in choosing the three oral communication tasks in this study, with features
that would elicit different levels of strategy use. Furthermore, in examining a wider
range of task-based strategies and not limiting strategies to those involved in negotiation
of meaning, this study addresses a gap in the literature.
3.5.3 Limitations of research into task dimensions
Although much research has been carried out whose findings have been
indicative of a particular dimension influencing oral communication, fewer studies have
manipulated tasks by isolating particular dimensions (for example, Gilabert, 2004;
Michel et al., 2007; Robinson, 2001) and even then it has still not been possible to

118
Table 3.4 Summary of findings on interactional task dimensions Task dimension Author & Year Task Measures Relevant Findings Level of information exchange
Newton, 1991 Split & shared tasks negotiation of meaning strategies
[+ required] +negotiation (on split tasks)
Foster, 1998 Required & optional information exchange tasks
negotiation of meaning strategies
[+ required] +negotiation, +modified output -modified output in classroom compared to experimental setting
Nakahama, Tyler and van Lier , 2001
Conversation & information gap
negotiation of meaning strategies
[+ required] + negotiation [+ optional] +discourse strategies (paraphrase), +longer complex turns, +negotiation of global problems and +range of opportunity for language use
Information flow Lambert & Engler, 2007
Picture sequencing, decision-making, arranging a time
CAF
[+ shared] [+ open] +complexity [+ one way] +fluency [+ one way] [+ two way] +accuracy
Long, 1980 Narrative, instructions, discussion
clarification requests confirmation checks comprehension checks
[+ two way] +meaning negotiation.
Yule & McDonald, 1990; Aston, 1986
One-way/two-way tasks negotiation of meaning strategies
[+ two way] +meaning negotiation.
Gass and Varonis, 1985
Picture drawing & information gap
negotiation of meaning strategies
[+ two way] -meaning negotiation.
Goal orientation
Pica and Doughty, 1988; Berwick, 1990 Crookes & Rulon, 1985
Decision making & gardening Lego reconstruction Conversation & information gap
interactional strategies
[+closed] +meaning negotiation [+closed] +feedback
Rahimpour, 1997 Narrative CAF negotiation of meaning strategies
[+closed] +fluency, +meaning negotiation
Duff, 1986 Baralt, 2009
Desert island & debate Interactive discussion
CAF CAF + interactional strategies
[+convergent] + turn taking, +shorter turns, +meaning negotiation [+convergent] no significant difference in interaction

119
reliably account for all other confounding variables. As can be seen from the examples
provided in this chapter the number of task variables that influence oral communication
is potentially enormous. Furthermore, neither the level of interaction between different
variables (for example between reasoning demands and goal orientation) is known, nor
which variable contributes most to the effects observed. Taken together these variables
make designing task-based research complicated, as there is no simple answer to the
question of which task is best for language learning. Although, this study does not
attempt to isolate task dimensions, it does take into consideration research findings in
this area in the interpretation of the results and apart from using the measures of CAF to
differentiate tasks it extends previous research by comparing a wider range of strategies,
not only those involved in meaning negotiation.
Summing up, Chapter 3 has defined the concept of task and presented some
basic criteria for identifying tasks. In doing so it was seen that there have been many
different ways in which researchers and teachers have classified tasks. In task-based
research, by taking a cognitive perspective, two models of attention have emerged: the
Limited Attentional Capacity Model (Skehan, 1998) and the Multiple Resources
Attentional Model (Robinson, 2001), which have been summarised and which are of
particular relevance because they make different predictions about how particular task
dimensions effect the complexity, fluency and accuracy of speech, as well as
interactional strategies. From the work of these researchers two different frameworks
for classifying task features have emerged. Particular emphasis was put on Robinson’s
framework because of its grounding in cognitive theory and because it was applied to
the description of tasks in this study. Research on some cognitive and interactional task
dimensions, which distinguish the tasks in this study, has been reviewed to shed light on

120
the influence they have on spoken production and strategy use and, finally, some
limitations of this field of research have been noted.
The chapters of this thesis, so far, have enlightened our understanding of speech
production and oral communication in a foreign language. Theories of speech
production (Levelt, 1989, Levelt et al., 1999) and cognitive theories of attention in L2
speech (Robinson, 2001; Skehan, 1998) have been drawn on to explain findings
regarding strategy use and the complexity, accuracy and fluency of speech. Links have
been drawn between three areas: language learner strategies, communication strategies
and tasks. From the reviews of these studies, it has been seen that considerable overlap
exists in these fields, with task and proficiency emerging as important dimensions in
strategy use, on the one hand, and spoken performance / proficiency and strategies
emerging in task-based studies, on the other hand. In the following chapters further
evidence is gathered which attempts to address how strategy use and spoken production
differ across three oral communication tasks and the role played by proficiency.

Chapter 4
Method

121
4.1 Design of the study
This chapter presents the methodological design of the study. Firstly, in order to
collect data on learners’ perceived strategy use, the preliminary stage of the study
involved the development of a strategy questionnaire through extensive piloting and
analyses of reliability and validity. Once a satisfactory instrument had been created the
main stage of the study was undertaken.
In order to collect data on spoken performance a sample of twenty-four high and
twenty-four low proficiency learners were recorded on video performing three
communicative tasks. Learners performed tasks in pairs and completed the strategy
questionnaire immediately after each one, in order to gather data on strategy use. From
this sample of learners a sub-sample of four were chosen from each of the proficiency
groups. This sub-sample, in addition to performing the tasks and completing the
questionnaire, participated in stimulated recall sessions after each task.
A repeated-measures design was used in this study. The independent variables
were task and proficiency. Task was the within-subjects factor, as the repeated-measures
design involved examining the same participants across three different tasks: a picture
story, an art description and an information-gap task. Proficiency was the between-
subjects factor, as two different groups of participants with low and high proficiency
levels were examined on each task.
The dependent variables were perceived and actual strategy use and spoken
production. Perceived strategy use was operationalised as a list of 44 statements such as
‘I spent a while thinking about what I was going to say’ and ‘I invented a word using a
structure from English’, which were rated by learners themselves on a 6-point scale on a
strategy questionnaire for each task. Actual strategy use was measured in task
performance transcripts and stimulated recall transcripts by the researcher. Spoken

122
production was operationalised as fluency, accuracy, complexity and self repair for each
task, as described in further detail in Section 4.5.3.
Given that participants were asked to carry out three tasks, practice and carry-
over effects needed to be considered. Practice effects are produced by participants
improving through repeated performance and carry-over effects are factors which affect
performance in subsequent tasks, for example, the performance of an extremely difficult
task first could reduce participants’ motivation in subsequent tasks. To counterbalance
such effects participants were assigned to one of three groups (A, B or C) in a Latin
square design, as shown in Figure 4.1. In this way the sequence in which each group
performed the tasks was different. As the between-subjects factor was proficiency,
within each group, half of the participants were low and the other half were high
proficiency students.
Table 4.1 Latin square design
Group First task Second task Third task
A Picture Story -Low
Picture Story –High
Art Description-Low
Art Description-High
Information Gap-Low
Information Gap-High
B Art Description-Low
Art Description-High
Information Gap-Low
Information Gap-High
Picture Story-Low
Picture Story -High
C Information Gap-Low
Information Gap-High
Picture Story-Low
Picture Story -High
Art Description-Low
Art Description-High
The strategy questionnaire provided the data to group strategies into categories
and compared learners’ perceived strategy use across tasks and between proficiency
groups. Transcripts of task performances and recall comments from the case studies
produced data on actual strategy use and spoken production. Actual strategy use was
then compared to perceived strategy use to examine the validity of the questionnaire and
spoken production measures were compared across the three tasks and between groups.

123
4.2 Instruments
This section describes the main instruments used to elicit and measure perceived
strategy use and spoken production across tasks. These instruments were a strategy
questionnaire, three communicative tasks and a reflective questionnaire. Firstly, a
substantial part of this section is dedicated to describing the development and piloting of
the questionnaire, which is followed by an interpretation of the results and justification
for the subsequent changes made. Secondly, the final questionnaire is presented along
with the findings obtained regarding its construct validity, in terms of the grouping of
strategy items into categories. Thirdly, the three communicative tasks are analysed in
terms of their characteristics and, finally, a description of a short questionnaire which
was used to gather information about learner’s perceptions of the tasks is provided.
4.2.1. The Strategy Questionnaire
The strategy questionnaire was developed through various pilot studies. In total
three versions were piloted with undergraduate students at the Universitat de Vic
(UVIC) in 2005, 2007 and 2008, as will be explained in the next section. As a large
number of strategy descriptions had been published, both in LLS and CS research, items
for the questionnaire were chosen from existing taxonomies, rather than following a
grounded approach. Hence, the questionnaire items were originally adapted from the
LLS research, mainly from Victori (1992) and Victori and Lockhart (1995), but also
from Cohen et al. (1996) and Oxford (1990), as well as Dörnyei and Scott (1997) from
the area of CS.
Each version of the questionnaire was administered in the learners’ L1, Catalan.
Strategy descriptions were written in English first, translated to Catalan by the
researcher and revised by an L1 Catalan speaker experienced in foreign language

124
research. As for the sequence of items on the questionnaire, items were grouped
together in chronological order to reflect the typical task process followed in the
language classroom: before, during and after the task, as in Cohen et al. (1996).
Participants were to respond to items on an even rating scale, in other words, one with
no midpoint, to prevent respondents from choosing a neutral response, which often
happens with Likert scales (Chaudron, 2003; Victori et al., 2009) and to force them into
choose either end of the scale.
For each version of the questionnaire items were written following questionnaire
construction guidelines as given in Dörnyei (2003) as far as possible. In other words,
strategy descriptions were made as student-friendly as possible by avoiding technical
language, simple sentences were used to aid comprehension of items, and parallel items
were included to check whether respondents answered consistently. Unlike many LLS
questionnaires which consist of general statements about strategy use, as the
questionnaire in this study was to be used immediately after a task, items were worded
in the past tense to make it clearer that they referred back to the particular task just
performed.
4.2.1.1 The first pilot study
In the first pilot study, a total of 244 undergraduate students participated with
various proficiency levels ranging from B1 to B2 on the CEFR. In this study they were
considered representative of the population of EFL students at the UVIC, as they came
from various degree courses, none of whom were specialising in English. The first
version of the questionnaire (see Appendix B1) contained thirty-seven items on a four-
point rating scale. The students completed the questionnaire after doing a
communicative task in pairs. The task was an 8-frame picture story about a group of

125
climbers who get lost on a mountain. Participants were asked to order the pictures
together and then tell the story to the researcher. The task required participants to agree
on a story and then describe the events together.
Data was collected over a two-month period in students’ respective classroom
hours. Teachers were given written instructions on how to administer the task and
questionnaire in order to standardise the procedure as far as possible. To ensure
participants responded according to their own perceptions and not according to what
they thought was expected, they completed the questionnaire anonymously without
conferring with other students. Also, students were reminded to respond according to
the task they had just done and not according to their usual or typical strategy use.
The first aim of this pilot study was to examine the underlying structure of the
questionnaire and to see if items could be grouped into factors by exploratory factor
analysis, according to the inter-relations between them. The quantitative data from the
244 questionnaires was entered into the SPSS 11.5.1 for Windows statistical package to
compute descriptive statistics and perform statistical tests for this purpose.
Results of the factor analysis showed that oral communication strategies could
be defined by four distinct categories: Factor 1: Evaluating and Affective, Factor 2:
Conversation-flow Maintenance, Factor: Compensation and Factor 4: Planning &
Overmonitoring. The categories were labelled according to the nature of the individual
strategies which loaded most strongly within each factor. The reliability of the
questionnaire, measured by Cronbach’s Alpha, was adequate34 [α = .76, N=244] for the
whole instrument. The four factors accounted for 34% of the variance and each had the
following Cronbach Alpha values: α = .76 for Factor 1, α = .70 for Factor 2, α = .69 for
Factor 3 and α = .64 for Factor 4.
34 According to Pallant (2005) the Cronbach alpha of a scale should ideally be above .7.

126
Four volunteers from this sample population took part in a more qualitative
study. They followed the same procedure as the larger sample except that they were
recorded doing the task on video and took part in stimulated recall sessions immediately
after completing the questionnaire. The stimulated recall sessions involved the learners
verbalising what they had been thinking while performing the tasks. The aim of this was
to examine whether perceived strategy use (PSU), measured on the questionnaire,
reflected actual strategy use (ASU), measured in task transcripts and stimulated recall
comments, and thereby identify consistencies or discrepancies on the questionnaire. The
qualitative data from the sub-sample was compared to their quantitative data for this
purpose. A total of 12 complete task transcripts (four participants across three tasks) and
accompanying recall sessions were transcribed and coded. For each of the participants a
coding sheet was devised (Gass & Mackey, 2000) where the task transcript was divided
into excerpts according to the recall comments referring to them. These excerpts were
then coded for the 37 strategies on the questionnaire. Inter-rater reliability was
measured between two researchers, the second of whom coded 25% of the data
following written guidelines. Percentage agreement over all the measures coded was
96%.
Table 4.2 summarises the qualitative analysis from the sub-sample. Of the thirty-
seven strategies on the questionnaire, thirty-two (86%) were identified in the data. For
fifteen items (41%) their extent of use was reflected on the questionnaire. Discrepancies
were found in the extent of use for fourteen items (38%) and extent of use could not be
confirmed for three items (8%). Recall comments pointed to multiple item
interpretations, item interpretations alternative to the one intended by the researcher and
an inability to assess strategy use accurately as possible sources of discrepancy.

127
Table 4.2 Consistency between perceived strategy use and actual strategy use (N=4) in the first
pilot study
Strategy Description PSU versus ASU Factor 1 Evaluating and Person Monitoring 34. I assessed how well I had done. consistent *37. I thought about the aspects I should improve... unconfirmed 35 I identified my problems. consistent 5. I tried to relax (breathing deeply, laughing etc). unconfirmed 6. I encouraged myself to do the activity well unconfirmed 20. I concentrated on the activity without feeling distracted consistent Factor 2 Conversation-Flow Maintenance 15. I used exclamations and other typical English expressions. discrepancy: PSU overestimated *33.I was satisfied with the way I had completed the activity consistent *16. I tried to speak like a native speaker. unconfirmed 13. I tried not to make mistakes discrepancy: ASU differences not captured *12.I used expressions I remembered discrepancy: PSU overestimated *14. When I realised I had made a mistake, I tried to correct it discrepancy: ASU differences not captured *22. I helped my conversation partner ... discrepancy: PSU overestimated Factor 3 Compensation *30. I used gestures to help my partner understand me. consistent *27. I used a word from my own language. consistent *26. I changed the topic consistent *28. I invented a word/phrase consistent *24. I asked my partner or someone else for help discrepancy: ASU differences not captured *25. I didn’t finish my sentence. consistent 32. I used a word from another language ... consistent *31. I used more general words ... discrepancy: ASU differences not captured Factor 4 Planning and Overmonitoring 8. I thought about how to structure sentences before speaking extent of use unconfirmed 9. I focused on grammar when I spoke extent of use unconfirmed *17. I only used language I was sure of discrepancy: ASU differences contradictory 11. I focused more on how I spoke than what I was saying discrepancy: ASU differences not captured 4. I thought about how to organise my ideas ... unconfirmed 3. I spent a while thinking about what I was going to say. discrepancy: ASU differences not captured 10. I avoided talking about topics ... extent of use unconfirmed *23. I adjusted my speech so that I would be understood ... discrepancy: PSU overestimated Unloaded items 1. I checked that I had understood the instructions. consistent *2. I recognised the task as I had done a similar one before. consistent *7. I thought ... in Catalan and then translated it. consistent 18. I summarised or repeated an idea I wanted to emphasize. discrepancy: PSU overestimated *19. I used words (like ‘well’, ‘so’) to fill pauses. discrepancy: PSU overestimated 21. When my conversation partner spoke, I paid attention. consistent 29. I used other ways of expressing what I wanted to say discrepancy: ASU differences not captured 36. I asked someone to tell me how I had done. consistent Note. PSU – Perceived strategy use (Measured in quantitative data from mean questionnaire responses) ASU – Actual strategy use (Measured in qualitative data by strategy coding in task transcripts and recall comments)

128
All in all, these results informed changes to the questionnaire to increase its
reliability and validity. Although the Cronbach alpha for the whole instrument was
adequate, the factors accounted for just 34% of variance in the data, values which could
be improved. Secondly, content validity of the questionnaire seemed to be threatened by
the discrepancies between PSU and ASU in the qualitative analysis. Ideally learners'
interpretations of each questionnaire item needed to be examined in order to improve
the reliability of items. Furthermore, in a related study (Khan, 2006) examining strategy
variation across different tasks with the same questionnaire, few differences in strategy
use were found, despite cognitive and interactional differences between tasks. One
reason for this may have been that interactional strategies had not been included.
Nakatani (2006), who included interactional strategies on his questionnaire, found some
differences in these kinds of strategies, therefore they were added in an attempt to elicit
more strategy differences across the tasks, which was one of the aims of the present
study. Consequently, a second questionnaire pilot was undertaken including a wider
range of strategies and item interpretation was examined by interviewing learners.
4.2.1.2 The second pilot study
For the second pilot, 331 undergraduates studying at the UVIC participated with
proficiency levels ranging from A1 to C1 on the CEFR. Two low and two high
proficiency students, who volunteered from the sample population and who were
representative of the two proficiency groups to be investigated in the main study, took
part in structured interviews.
The second version of the questionnaire (see Appendix B2) contained sixty-five
items on a 4-point scale, an expanded version of the first. More interactional strategies
were included. In this version each item was coded prior to piloting, according to the

129
three categories of CS (direct, indirect and interactional) and the four types of
communication problem (resource deficit, processing time pressure, own performance
problem and other performance problem) proposed by Dörnyei and Scott (1997).
Metacognitive strategies from the first version of the questionnaire were also retained to
capture the planning, monitoring and evaluating of the task process.
The communicative task used was a 12-frame picture story called The
Honeymoon (Fletcher & Birt, 1989), as seen in Appendix H1, which was also used in
the main study (Section 4.2.2 provides a more detailed description of the task’s features
and administration). In the piloting of the first version of the questionnaire an 8-frame
picture story had been employed, but had elicited small samples of spoken production in
some cases, which meant learners had less opportunity for using strategies. Therefore
four longer picture stories were piloted with 60 mixed-ability students. Both students
and teachers perceptions of the tasks were gathered for each story with the Reflective
questionnaire (RQ), also used in the main study (see Appendix G and Section 4.2.3, for
a description). The Honeymoon was the task chosen because it was easy enough for
even low proficiency participants to be able to produce some language in doing the task
but also varied and interesting enough to be challenging for the high level students.
Some changes were also made to the task administration procedure, which were
informed by the first pilot study. Participants took turns describing each picture in order
to give each interlocutor an equal opportunity to speak. They were explicitly told that
they had time to prepare, so that they wouldn’t feel obliged to begin the task
immediately and they were told to talk for about five minutes to ensure they would
provide a minimum response.
The quantitative data was collected over a three-month period from November
2007 to January 2008. Participants did the picture story task and then completed the

130
questionnaire during class time. The researcher supervised all these sessions herself and
ensured that both the task and questionnaire were employed in a standardised way.
Structured interviews, as suggested in Block (1998), were conducted to establish
the questionnaire content validity, in other words, to find out if learners were
responding to the questions as the researcher had intended. The reasons or motivations
behind the responses learners made could also be examined, as in Victori et al. (2009).
These interviews were conducted during classroom hours. Participants were videoed
doing the task in pairs. They then completed the questionnaire and were interviewed
individually by the researcher in their L1. Item and scale interpretation was elicited,
particularly for the strategies which did not involve overt behaviours and were more
difficult to identify in task transcripts. Interviews were digitally recorded and the four
twenty-minute (approx.) interviews were transcribed and translated into English by the
researcher.
Once again, quantitative data analysis of the questionnaire was in the form of
descriptive statistics and a factor analysis and the qualitative analysis of the transcripts
of the structured interviews involved dividing transcripts according to the strategy item
referred to on the questionnaire and assessing whether learners were interpreting the
item as intended. Also interpretations of each point on the scale were grouped together.
Firstly, the qualitative data analysis is described. Summarising findings from the
structured interviews, learners indicated which items were being interpreted in multiple
ways or in ways alternative to those expected by the researcher. Transcript excerpts
illustrating which questionnaire items were considered either problematic or
unproblematic can be found in Appendix B3. Interviews also revealed the following
insights about self-report instruments, some of which have been discussed before in the
literature in this field (Barcelos, 2003; Cohen, 2003; Victori et al., 2009): a) learners

131
could identify parallel items, b) learners found a few strategies difficult to distinguish
between, c) the strategy descriptions tapped into a variety of sources of experience
particularly concerning tasks, interlocutors, learning contexts and the strategies learners
recognised as typical of them and d) learners reported that they were not always
conscious of using particular strategies.
The interpretations of the 4-point scale, as gathered by the interviews with
students, also provided valuable information about the real scale of magnitude that
learners were using in describing strategy use. The researcher’s question was “What do
you mean by a 0 (or a 1, 2 or 3)?” regarding scale responses to each questionnaire item.
Responses to this question for all the different questionnaire items and interviewees
were gathered together and matched with the scale response they referred to. Table 4.3
illustrates the range of responses for each point on the scale.
When learners responded with a 0 (not at all), the bottom of the scale, they were
sure that they didn’t use that particular strategy and explained an alternative behaviour
or revealed a negative attitude towards the strategy.
A 1(a little) meant that the strategy was used once or twice in most cases, and in
fewer cases, two or three times. It meant not much for most learners. It also often meant
that the learner couldn’t remember if they had used the strategy. In a couple of cases the
learner hadn’t used the strategy but had marked a 1.
A 2 (quite a bit) was the most popular answer on the questionnaire and elicited
the widest range of interpretations. It meant that the strategy was used more than two or
three times in most cases. It meant that the strategy was used but not all the time or that

132
Table 4.3
Second pilot study: scale interpretation on second version of strategy questionnaire
Scale response Scale Interpretation What do you mean by a 3
(a lot)?
yes more than three times / more than three maybe four times more than five over several years it meant I concentrated fully quite a bit – no, a lot yes, this one yes / yes, I think so, yes. I do this, I did it here, I do it everywhere a lot sounds like you’re obsessed
What do you mean by a 2
(quite a bit)?
it means I looked (at the pictures) but I didn’t prepare it in detail I need a mid-scale point sometimes I did, sometimes I didn’t / yes but I didn’t want to spend too much time I was thinking of other things, so not a lot / I wasn’t fully concentrating because I was tired, so not a lot / I was concentrating but I was waiting for my partner to speak / yes, but as you think of other things, not a lot / yes, but I was thinking of how to go on too / yes, doing it, but not all the time / because I didn’t get obsessed about it. a few times, two or three / once or twice? three times, maybe /about two or three times /more than once, twice maybe / two, three times I did this 3 or 4 times Well, I find it difficult to put a lot, it’s like a lot, two or three or up to five would be quite a bit maybe four or five.
What do you mean by a 1
(a little)?
can’t remember / maybe, I don’t know / possibly / it’s possible, I can’t remember very well / maybe yes... or not much / Ok so even though you don’t remember you think you could have done it without realising. Yes no, but I’ll say a 1 / no, but I’m learning yes, a little but I didn’t do it all the time maybe once, yes but not much / Once? Well, not much but one maybe / yes, I did this once / well, maybe at one point / yes I did this once, not much / maybe once not much maybe once or twice. two or three times / No maybe two or three times. And little what would that be? That would be not thinking about it as carefully. look and not prepare at all
What do you mean by a 0
(not at all)?
no no, because I don’t like to. No I didn’t. I did it as I was going along. No, no. I thought about the story but not how I would tell it. No, I wouldn’t do it even if I had a dictionary next to me. Unconsciously I suppose I did, but it wasn’t like I’m going to think of an expression and use it. No, I didn’t do it. I said it all in one go and I didn’t want to repeat or highlight anything.
Note: Responses are translations from Catalan

133
the strategy was being used at the same time as learners were doing/thinking about other
things. Learners responded with a 2, if they had a negative attitude to a strategy. In other
words, they didn’t want to respond with a 3 (a lot) because it looked bad. Therefore, in
these cases, a 2 could also mean that the strategy was used a lot.
A 3 meant more than 3 or 4 times. It was for strategies that learners felt typified
themselves as expressed by the learner who said that a particular strategy had been used
over several years and had often been noticed. In contrast to the bottom of the scale,
which learners marked when they were confident or sure that they hadn’t used a
strategy, learners were reluctant to mark the top of the scale as for some strategies, a lot
held negative connotations.
Concluding from the scale interpretation, learners' responses revealed that when
learners could quantify their strategy use, the magnitude of the scale was from 0 to just
over 5. It showed that the low end of the scale was for strategies that learners were
certain they did not use or couldn’t remember using and that high strategy use was
represented by a 2 as well as a 3, the top end of the scale. Learners’ scale interpretation
also revealed their negative or positive attitudes to certain strategies. They preferred to
use some strategies and tried to avoid others, which biased their scale responses either
towards the low or high end of the scale.
Secondly, results of the quantitative analysis showed that oral communication
strategies could be defined by five distinct categories: Factor 1- Interactional, Factor 2-
Compensation, Factor 3-Planning, Factor 4-Evaluating and Overmonitoring and Factor
5-Conversation-flow Maintenance. Four of these categories were the same or similar to
categories from the first pilot study, and Factor 1 clearly encompassed the additional
interactional strategies included in this second pilot. The Cronbach alpha was very high
[α =.91, N=331] and the five factors, which accounted for 36% of the variance, had the

134
following Cronbach alpha values: α = .87 for Factor 1, α = .86 for Factor 2, α = .73 for
Factor 3 and α = .77 for Factor 4 and α = .74 for Factor 5.
These values had improved compared to the first version of the questionnaire.
Nevertheless, as students themselves remarked, the questionnaire was too long. It had
been lengthened to include interactional strategies but also to pick out the most reliable
items for the final version. Hence, items on the questionnaire were retained according to
an evaluation of the descriptive statistics, the factor analysis and structured interviews.
Descriptive statistics revealed strategies which were rarely used or not used at all.
Factor analysis detected items with low loadings on their respective factors, because
they contributed little to the underlying construct and structured interviews pointed to
items with problematic item interpretation. In these cases the items were deleted. The
item changes made to the second version of the questionnaire are described in Table 4.4.
As the pilot studies had only been based on the Picture Story task, the other tasks to be
used in the main study were taken into consideration before removing a strategy. If it
was believed that a strategy may be used on a different task type, it was not removed. In
this way a total of twenty-one items were removed from the second questionnaire.
Furthermore, the scale on the questionnaire was expanded from the original 4-point
scale to a 6-point scale in order to capture more overall variance in strategy use.

135
Table 4.4 Item changes to the second version of the strategy questionnaire Strategy Item Change made Reason for change 26. When I thought my partner didn’t understand... I used simpler words.
Removed Low factor loading Low mean use
59. When I had a problem with language... I repeated myself while I thought of what to say.
Removed Low factor loading Low mean use
64. I asked someone how I had done.
Reworded to... 41. I asked someone to tell me how I had done.
Low factor loading Low mean use
51. When I had a problem with language... I used a word from another language.
Removed Low factor loading Low mean use
34. When I didn't understand... I carried on as if I had understood.
Reworded to... 22. When I didn’t understand my partner I carried on as if I’d understood.
Low factor loading Low mean use
58. When I had a problem with language... I said a series of incorrect words before getting the right one.
Reworded to... 39. I tried various incorrect forms before I got to what I wanted to say.
Low factor loading Low mean use
6. I made notes to help plan the task. Reworded to... 4. I made notes to help me do the activity.
Low factor loading Low mean use
43. When I had a problem with language... I changed the subject
Removed Low factor loading Low mean use
50. When I had a problem with language... I used more general or simple words ...
Reworded to... 40. I used a more general or simple word when I didn’t know the specific one.
Low factor loading
14. I used language I was sure of. Retained 10. I used English I was sure of.
Low factor loading
53. When I had a problem with language... I used non-specific words like ‘thing’, ‘something’.
Removed Low factor loading Low mean use
1 I recognised the task as similar to one I had done before.
Reworded to... 1. I recognised the activity because I had done a similar one.
Unloaded item
5. I looked up words in my dictionary/book.
Removed Unloaded item Structured interviews
20. I made a mental note of a piece of language someone else used.
Removed Structured interviews
4. I encouraged myself to do well.
Removed Structured interviews
39. When I had a problem with language... I used a word which sounded the same...
Removed Structured interviews
21. I went on for too long explaining something.
Removed Structured interviews
22. I asked for help in English. Reworded to... 27. I asked for help.
Structured interviews
24. I asked for help in Catalan/Spanish.
Reworded to... 27. I asked for help.
Structured interviews

136
Table 4.4 (continued) Item changes to the second version of the strategy questionnaire Strategy Item Change made Reason for change 28. When I thought the others hadn't understood... I explained or gave an example.
Reworded to... 16. When my partner didn’t understand me I explained in another way.
Structured interviews
41. When I knew I had made a mistake I just left it because there wasn't time.
Removed Structured interviews
47. When I had a problem with language...I used a word from Catalan with English pronunciation.
Reworded to... 31. I used a Catalan / Spanish word but with English pronunciation.
Structured interviews
55. ...I translated a word, expression or structure.
Reworded to... 36. I translated literally from Catalan/Spanish.
Structured interviews
62. I assessed how well I had done.
Reworded to... 42. I thought about how I’d done in general.
Structured interviews
10. I focused on my pronunciation to try and sound like a native.
Removed Structured interviews
12. I summarised or repeated an idea to highlight its importance.
Removed Structured interviews
16. I corrected my partner. Removed Structured interviews Low mean use
19. When my partner spoke, I focused on what they said.
Removed Structured interviews
20. I focused on language my partner used that I didn’t know.
Removed Structured interviews
21. I spent too much time explaining something.
Removed Structured interviews Low mean use
23. When I spoke I looked at how my partner was reacting.
Removed Low factor loading
35. When I didn’t understand my partner... I asked questions to check that I had understood correctly.
Removed Low mean use
44. I said something completely different when I couldn’t find the words I needed.
Removed Low factor loading Low mean use
59. I repeated what my partner said until I thought of what I wanted to say.
Removed Low factor loading Low mean use
8. I used set expressions I remembered.
Reworded to... 5. I used expressions in English that I remembered.
Structured interviews

137
4.2.1.3 The third pilot study
After the previous two pilot studies only the most robust items were left on the
questionnaire for the third pilot study. The Strategy Questionnaire (SQ), as seen in
Appendix A, now consisted of 44 items on a 6-point rating scale (0-5). To check its
reliability it was administered to 375 students, whose English proficiency ranged from
A1 to C1 on the CEFR, and, as for the second pilot study, they carried out The
Honeymoon (Picture Story) task.
The quantitative data obtained was entered into SPSS 15 statistical package. To
run a factor analysis a total of 330 participants were retained from the original sample of
375 according to the following criteria: 1) they had completed at least 90% of the
questionnaire, 2) their L1 was either Spanish or Catalan, and 3) their ages were between
16 and 24.
The Cronbach alpha for the whole questionnaire was quite high [α = .90],
showing that the questionnaire’s internal consistency had barely been affected by the
removal of the 21 items from the second version of the questionnaire. This suggests that
the items on the final SQ reliably represent the underlying construct of oral
communication strategies: the conscious thoughts or behaviours learners employ in
order to engage in oral communication.
The SQ data was suitable for factor analysis as shown by the Kaiser-Meyer-
Olkin value (KMO= .861), exceeding the recommended value of .6. Also, Bartlett’s
test for sphericity reached statistical significance (p= .000). Initial principal components
analysis revealed the presence of 12 components with eigenvalues exceeding 1,
explaining 64.3% of the variance. A further Parallel Analysis recommended retaining 6
of these components: the eigenvalues of these 6 components exceeded the
corresponding criterion values for a randomly generated data matrix of the same size

138
(44 variables x 330 respondents). However, on examining the scree plot (see Appendix
C) and extracting four, five and six factors, five factors which could be interpreted most
reliably were retained. As shown in Table 4.5, these factors explained 44.5 % of the
total variance.
Table 4.5 Total variance explained by the five factors on the Strategy Questionnaire Factor Rotation Sums of Squared Loadings Total % of Variance Cumulative % 1 9.49 21.58 21.58 2 3.54 8.05 29.63 3 2.72 6.18 35.81 4 2.01 4.56 40.37 5 1.79 4.08 44.45
Extraction Method: Principal Component Analysis.
Cronbach alphas were: Factor 1 α = .91 (12 items), Factor 2 α =.87 (14 items),
Factor 3 α = .62 (8 items), Factor 4 α = .72 (5 items) and Factor 5 α = .71 (4 items) for
the 38 remaining items. These factors were labelled Factor 1: Interactional, Factor 2:
Compensation, Factor 3: Conversation-flow Maintenance, Factor 4: Planning and Factor
5: Evaluating strategies, according to the individual items which loaded most strongly
within them. Table 4.6 presents the strategies within each factor and their factor
loadings.
Factor 1 was labelled Interactional strategies as all but one item were items that
fitted into the previously described Interactional category of problem management in
Dörnyei and Scott’s (1997) taxonomy (see Chapter 2, Table 2.5), grounded in Levelt’s
(1989) model of speech production. These strategies occur during post-articulatory
monitoring of one’s own or the interlocutor’s speech. Twelve items loaded onto this
factor: Items 19 to 25 began with the stem When I didn’t understand my partner:

139
Table 4.6
Factor loadings for the 44-item Strategy Questionnaire
Strategy Factor Loading 1 2 3 4 5
Factor 1 Interactional (12 items) α =.909 21. When I didn't understand ... I asked him/her to repeat... .770 20. When I didn't understand ... I asked for an explanation... .758 24. When I didn't understand ... I told him/her ... .732 18. When my partner didn't understand ... I repeated ... .718 15. When my partner didn't understand ... I asked questions ... .702 19. When I didn't understand ... I asked them to speak slower .694 14. When my partner didn't understand ... I spoke slower. .685 16. When my partner didn't understand ... I explained in another way... .683 25. When I didn't understand ...I repeated ... in my own way... .669 23. When I didn't understand ... I guessed ... .622 22. When I didn't understand ... I carried on as if I'd understood... .448 .415 32. I used an example or a description to express a word. .356 Factor 2 Compensation (14 items) α =.868 29. When I had a problem ...I spoke in Catalan / Spanish ... .714 30. When I had a problem ...I invented a word ... .667 38. When I had a problem... I left out a word ... .644 36. When I had a problem ...I translated literally from Catalan/Spanish. .636 31. When I had a problem ...I used ... Catalan with English pronunciation .622 39. When I had a problem ... I tried various incorrect forms ... .609 28. When I had a problem ... I didn’t finish my sentence ... .601 37. When I had a problem ... I mumbled something .585 34. When I had a problem... I paused for a particularly long time ... .556 .425 17. When my partner didn’t understand...I explained in Catalan/Spanish. .374 .521 8. While speaking... I risked saying things... .491 35. When I had a problem... I started ... and then I restructured... .454 27. When I had a problem... I asked for help. .408 40. When I had a problem... I used a more general or simple word ... .406 Factor 3 Conversation Flow Maintenance (8 items) α =.624 11. While speaking... I used gesture... .648 33. When I had a problem... I used gesture... .357 .588 12. While speaking... I maintained the conversation... .539 7. While speaking... I used words or phrases like "well", "let me see"... .516 26. When I had a problem... when I made a mistake I corrected myself... .465 5. While speaking... I used expressions... .410 1. I recognised the activity because I had done a similar one. .339 6. I avoided errors. -.395 .323 Factor 4 Planning (5 items) α =.718 3. Before speaking... I thought about how I would explain... .717 2. Before speaking...I spent a while thinking ... .702 13. While speaking... I thought about how to structure sentences... .614 10. I used English I was sure of. -.314 .383 9. I focused on the activity without being distracted. .338 Factor 5 Evaluating (4 items) α =.707 43. After speaking... I remembered specific problems I'd had. .805 42. After speaking...I thought about how I'd done in general. .730 44. After speaking...I thought about which aspects I had to improve ... .699 41. After speaking...I asked someone to tell me how I had done. .410

140
Item 19 (asking to speak slower), Item 20 (asking for clarification), Item 21 (asking for
repetition), Item 22 (feigning understanding), Item 23 (guessing), Item 24 (expressing
non-understanding) and Item 25 (interpretative summary). Items 14, 15, 16 and 18
began with the stem When my partner didn’t understand me: Item 14 (speaking slower),
Item 15 (comprehension check), Item 16 (clarification by circumlocution) and Item 18
(clarification by repetition). Item 32, (circumlocution), which is often classified as a
compensation strategy, was the lowest loading strategy and may have loaded onto this
factor instead of the Compensation strategies factor, because it is distinct from the other
Compensation strategies. This distinction lies in the fact that it involves a larger change
to the preverbal message at the conceptual preparation stage of speech processing, a
distinction noted by other researchers, for example, it is distinguished from other
strategies, as a reconceptualisation strategy, by Poulisse (1993).
Factor 2 was labelled Compensation strategies as the majority of items (11) had
been previously coded as direct strategies, used to overcome a lack of L2 linguistic
resources, resource deficit strategies, according to Dörnyei and Scott (1997). These
strategies are employed mainly to overcome lexical deficits. Fourteen items loaded onto
this factor. These strategies included four L1-based strategies, where learners use their
L1 to overcome their resource deficits: Item 29 (code switching), Item 30 (word
coinage), Item 36 (literal translation) and Item 31 (foreignising). They also included
four avoidance-based strategies, in which the learner abandons trying to get their
message across: Item 38 (omission), Item 28 (message abandonment) Item 37
(mumbling) and Item 27 (direct appeal for help). They also included four L2-based
strategies, in which the learner continues with his/her original plan, using existing L2
knowledge to adapt the message: Item 39 (retrieval), Item 8 (risk taking), Item 40
(approximation) and Item 35 (restructuring). The remaining two strategies were Item 17

141
and 34. Item 34 (long pause) fits in with the L2-based strategies, as it doesn’t involve
overt use of L1, as well as compensating for resource deficits by providing the learner
with more time to process information (Dörnyei and Scott, 1997). Item 17 (clarification
by code switching), which is coded as an interactional strategy in Dörnyei & Scott
(1997), fits with the L1-based strategies as it involves using the L1 to overcome the
other participants’ comprehension problems.
Items within Factor 3 were Conversation-flow Maintenance (CFM) strategies.
Rather than Compensation strategies to overcome resource deficits, as in Factor 2, or
Interactional strategies as in Factor 1, these strategies maintained or enhanced the
conversation flow without resorting to L1. The top two loading items (Items 11 and 33)
were parallel items that involved maintaining the conversation flow by using non-verbal
means (gesture). The other six strategies were Item 12 (maintaining conversation), Item
7 (using fillers), Item 26 (self-repair), Item 5 (using expressions), Item 1 (task
familiarity) and Item 6 (avoiding error). These strategies involve using existing L2
knowledge, or in the case of Item 1, prior task/topic knowledge, to aid comprehension
and production (described as cognitive transfer strategies in O’Malley & Chamot,
1990).
Items in Factor 4 and 5 were both metacognitive in nature. They were indirect
strategies which do not involve target language use directly, but which are involved in
managing the communication task. In Factor 4 the top three items were Planning
strategies: planning how to structure what to say before the task (Item 3), planning the
content of what to say before the task (Item 2) and thinking about how to structure
sentences while speaking (Item 13), an online planning strategy. Item 10 (I used English
I was sure of) implies avoiding risks and Item 9 (I focused on the activity...), directed
attention, both of which may involve a degree of foresight and planning, too.

142
Factor 5 was labelled Evaluating strategies. The four items loading onto this
factor were the last four items on the questionnaire related to assessing the success of
the learning activity: Item 41 (other evaluation), Item 42 (self evaluation), Item 43
(identifying problems) and Item 44 (aspects to improve).
For the above mentioned reasons the five categories obtained were considered
plausible from a theoretical point of view. The five categories on the SQ were
comparable to those already established in the strategy literature (Dörnyei & Scott,
1997; Nakatani, 2006; O’Malley & Chamot, 1990; Oxford, 1990). For example,
Nakatani (2006), who also developed a strategy questionnaire for oral communication
(OCSI), obtained categories drawn up by factor analysis which overlapped with the
categories in this study, although categories were named differently. This gave further
support to the validity of the items on the SQ.
To sum up, developing the SQ involved piloting three different versions. The
first was administered to 244 students after they had completed a picture story task.
Four of these students participated in stimulated recall sessions. Results informed
changes to the SQ and the use of a different task in subsequent pilots. The second
version of the SQ was expanded to include interactional strategies. It was administered
to 365 students after the new picture story task. Four of these students took part in
structured interviews, revealing their interpretations of the SQ items and scale. Results
of the second pilot study led to the final 44-item SQ which was piloted with 375
students. The final pilot revealed that 1) there was a general consistency across the pilot
studies in the categories of strategies obtained, which suggests that the SQ structure is
fairly stable and has construct validity, with the variance explained by the factors
increasing from 34% to 44%, 2) the SQ categories were comparable to categories in

143
other existing taxonomies and 3) piloting improved the questionnaire’s overall
reliability, as Cronbach alphas went from α = .76 to α = .90.
4.2.2 The three oral communication tasks
The three oral communication tasks: a picture story, an art description and an
information-gap task, were chosen for the final study informed by the research literature
on tasks and by task piloting. Firstly, a brief description of the tasks and how they were
implemented is given; secondly the criteria used in selecting tasks are discussed and
finally the analysis of particular task characteristics is presented.
4.2.2.1 Task implementation
In the Picture Story (see Appendix H1) participants had a 12-frame picture story
about a couple who go on a honeymoon where everything goes wrong. They were asked
to tell the story together taking turns to describe each picture. The task required
participants to describe the events represented in the pictures. The Picture Story was
designed to be the least difficult of the three tasks.
In the Art Description (see Appendix H2) participants were asked to imagine
they were in an art gallery. One person was the Art Expert and the other the Art Novice.
The expert was asked to describe a contemporary painting to the novice (a picture was
provided for both participants), inventing their own personal interpretation. The novice
had to pretend to know nothing about art and ask questions about elements in the
painting. Participants then reversed roles (the first picture was replaced by a second
one). This task was considered to be the most difficult.
In the Information Gap (see Appendix H3) participants were given a series of
eleven pictures. They were asked not to show their partner their pictures but to describe

144
them in enough detail so that, they could determine whether they had the same or
different pictures. This task was considered of medium difficulty of the three.
4.2.2.2. Task selection
The main criterion for choosing the three task types (storytelling, role-play,
interactional) was that they were to be sufficiently different to elicit different responses
by the learners on the SQ. This criterion emerged from the findings of a previous study
(Khan, 2006) and task piloting sessions with the SQ.
In one particular task pilot very few differences in perceived strategy use were
found when only one task type had been employed. A narrative picture story task had
been manipulated for two dimensions, task complexity [+/- Here and Now] and
information flow [shared/split tasks], as task-based studies have found differences in
spoken production in such cases (e.g. Lambert & Engler, 2007). However, learners
perceived very few differences in terms of strategy use. Therefore, it was considered
best to use different task types in an attempt to elicit more strategy differences with the
SQ, as in Khan (2006), rather than manipulate dimensions of the same task type.
The Honeymoon picture story was chosen because of its length, the lack of
ambiguity of pictures and its appropriacy for all proficiency levels. Students perceived it
to be the easiest and most motivating of all the picture-story tasks.
The Art Description was chosen because of its difficulty compared to the other
two tasks. Task difficulty was confirmed in a previous study (Khan, 2006) where
learners’ perceived it to be significantly more difficult, and they also claimed in recall
comments that this was because of its abstract nature. Other researchers’ work, such as
Prabhu's (1987), support such findings, as they claim that degree of abstractness is a
factor that increases task difficulty. Task-based research has shown that task difficulty

145
affects fluency, accuracy and complexity of speech (Bygate et al., 2001; Robinson,
2005), which in turn may affect learners’ strategic approach.
The Information Gap was chosen because of its interactional nature, opportunity
for negotiation of meaning and its high number of uncommon lexical items compared to
the other tasks. Interaction studies have shown that information-gap tasks elicit more
negotiation of meaning (e.g. Brown & Yule, 1983; Gass, 1997, 2002; Pica and Doughty,
1985; Yule & McDonald, 1990) strategies. Furthermore, a previous study (Khan, 2006)
had shown that intermediate level students were not familiar with many of the lexical
items in the task, a factor which CS research has shown increases compensatory
strategy use (e.g. Littlemore, 2001; Poulisse, 1990).
Apart from the differences selected above, it was ensured that the tasks had the
following characteristics in common:
1) the tasks were communicative, as the aim was to reflect, as much as possible, the NNS-NNS
oral task format in the EFL classroom.
2) the tasks were suitable for mixed abilities, as both low and high proficiency groups were
being compared in the study, therefore the tasks needed to elicit at least a minimum
contribution from the low group while providing enough challenge for the high group.
3) the tasks provided each student with an equal opportunity to participate.
4) the task input was in the form of a visual prompt
Criterion 3) was necessary as the balance of participation can be affected if one
learner feels inhibited by another, if one learner takes on the role of helper for another
to communicate, making a limited contribution to the discussion themselves or if one
learner dominates the interaction (O’Sullivan, 2000). Therefore, measures were taken in
the task design to limit these effects.

146
4.2.2.3 Analysis of tasks
After the tasks had been selected they were analysed for a number of features,
which posed different constraints on the participants (Bygate et al., 2001; Gilabert,
2004; Robinson, 2005). Such an analysis provided a prediction of how the tasks were
expected to be performed in terms of fluency, accuracy and complexity. As will be
recalled, Robinson’s (2005) framework of task complexity (Chapter 3, Table 3.2) was
used. Robinson distinguishes between task complexity, task conditions and task
difficulty as the major factors which determine how learners perform on a task. Task
complexity is divided into resource directing and resource dispersing dimensions, the
former make conceptual/linguistic demands on the learner whereas the latter make
performative/procedural demands. Table 4.7 summarises the differences in task
complexity for each of the three tasks in the study.
In the resource-directing dimension, number of elements, ‘Here-and-Now’ and
reasoning demands were compared across tasks. The Picture Story had few elements:
only one honeymoon couple who acted together from one frame of the story to the next.
The Information Gap also had few elements in each set of pictures whereas the art
description had the most elements (at least five) which had to be referred to and
distinguished from each other simultaneously.
As for ‘Here-and-Now’, learners were allowed do all three tasks with the
pictures in front of them, using present tenses if they wished [+Here and Now], rather
than having the pictures removed and relying on working memory to do the tasks [-Here
and Now].
Reasoning demands were greatest in the Art Description as learners were
required to invent reasons for the relationship between elements in the picture or their
interpretations of the elements. Reasoning was less necessary in the Picture Story, as the

147
story sequence was clear enough so as not to require difficult reasoning or justification
of the order of events and reasoning was least necessary in the Information Gap as no
justification of picture differences or similarities was needed.
Table 4.7
Comparison of task complexity (cognitive factors) across the three tasks
Picture Story Art Description Information Gap (a) resource-directing Elements low high low Here-and-Now = = = reasoning demands medium high low (b) resource-dispersing Planning ? ? ? single task = = = prior knowledge high low medium
In the resource-dispersing dimension, planning, single task and prior knowledge
were considered. Planning time was unlimited for all three tasks in order to mimic
authentic classroom conditions and observe whether learners manipulated this
dimension depending on the task. This meant, for example, that learners could
compensate for the difficulty of the Art Description by taking more time to plan.
Planning time studies (Foster & Skehan, 1996; Gilabert, 2004; Robinson, 2005; Yuan &
Ellis, 2003) among others, have found that giving learners time to plan reduces task
demands. All three tasks were single tasks, as learners weren’t required to perform more
than one task simultaneously. It was predicted that learners would bring most prior
knowledge (world knowledge and linguistic knowledge) to the Picture Story, as the
situation, events and language needed were familiar, and least to the Art Description. In
the Information Gap, although the pictures consisted of familiar objects, learners were
required to describe particular parts of these objects, lexical items which they did not
know in the L2.

148
Table 4.8 Comparison of task conditions (interactional factors) across the three tasks Picture Story Art Description Information Gap (a) participation variables open medium high low one-way high medium low convergent medium low high (b) participant variables same/different gender = = = familiar/unfamiliar = = = power/solidarity = = =
Task conditions (interactional factors) are divided into the participation variables
and participant variables, as seen in Table 4.8. Participation variables include
open/closed, one-way/two-way and convergent/divergent dimensions. The Art
Description was the most open task, as participants were free to choose what to interpret
in the painting and how to interpret it. The Picture Story was less open, as the sequence
of pictures determined the language required. However, variations in the interpretation
of each picture or the storyline were possible. The Information Gap was a closed task,
as only one correct solution was possible, with much of the language required to fulfil
the task demands being predetermined.
The Picture Story was the most one-way task as turn taking was pre-established,
in other words, each participant could give information in turn to the other, and as the
information was shared, little negotiation was necessary. Nevertheless, participants
could respond or react to each other’s interventions. The Art Description was less one-
way as the task required participants to take on different roles: one to ask questions as a
novice and the other to give explanations as an expert. The Information Gap was the
least one-way as it was a split-information task where participants did not share the
information and, therefore, had to negotiate carefully to perform the task successfully.

149
The Information Gap had the most convergent goals, calling on a joint solution,
in other words, to agree on the picture differences. In the Picture Story there was a
possibility for divergence in the story’s interpretation, therefore it was less convergent.
In the Art Description, the task requirement of different roles, expert and novice, meant
that the goal was most divergent.
As for participant variables, gender ratios, participants' familiarity with each
other and power relationships were considered. Gender was controlled for but some
pairs were mixed male and female pairs because of the uneven numbers in a particular
class group; two low and four high proficiency pairs were mixed as shown in Table 4.9.
Table 4.9 Number of pairs according to gender and oral proficiency LowProficiency High Proficiency Male:Male 5 1 Female:Female 5 8 Male:Female 2 3
As all participants were university students on the same degree course of
approximately the same age, we assumed they were equally familiar with each other and
that there wasn’t an uneven power balance within the pairs. Pica (1987) argues that an
equal power balance is important in promoting interaction through negotiation of
meaning, as learners share the need and desire to understand each other, whereas an
uneven power balance makes it more difficult and even unnecessary to restructure
interaction.
Summing up, considering the cognitive (task complexity) and interactional (task
conditions) factors described, it was predicted that there were differences between the
tasks. Task complexity would be highest in the Art Description (abstract task), as it
contained a greater number of elements to distinguish between, greater reasoning

150
demands and learners’ lacked prior knowledge of describing art. Interaction would be
greatest in the Information Gap (interactional task) due to its closed, two-way
convergent features and task complexity and interaction would be lowest on the Picture
Story (narrative task) due to prior knowledge of the topic and its fixed turn taking
requirement.
4.2.3 The Reflective Questionnaire
The Reflective Questionnaire (see Appendix G) was administered to measure
participants' perceptions of the tasks, once they had performed them. Firstly, it was
important to find out learners’ perceptions of task difficulty as it would provide a
measure of validity to the predictions made by the researcher about the relative
difficulty of the three tasks. Secondly, anxiety, interest, self-efficacy and motivation are
known to affect spoken performance (Dörnyei, 2005; Gilabert, 2004; Robinson, 2005).
Therefore, it was necessary to consider the possibility of these confounding variables in
assessing spoken performance across the three tasks. The RQ consisted of five rating
scale questions which ranged from 0 (not at all) to 7 (a lot). The first question referred
to task difficulty and the other questions referred to affective factors: anxiety, interest,
self-efficacy and motivation. These questions were taken from an affective
questionnaire in Gilabert (2004) where he analysed a similar question.
4.3 Participants
In this section the participants of the main study are described followed by the
procedures used for their selection. New participants were drawn from the same sample
population as the SQ had been piloted with, in other words, EFL students at the UVIC.
Over 70 undergraduates enrolled in their first year of compulsory English classes at the

151
UVIC participated, 48 of which were selected for this study. These participants were
entirely from classes of Biotechnology students taught by the researcher and her
colleague.
Participants were L1 Catalan or Spanish speakers. The gender ratio was 25
females to 23 males. Ages ranged from 18 to 24 (M= 20.40) and self-reported exposure
to English ranged from 5 to 17 (M= 9.75) years. Participants spoke three languages
(Catalan, Spanish, English) or four, with the exception of one participant who spoke
five (see Appendix D for participant biodata).
Participants were placed into two groups with clear differences in their
command of English. Firstly, they were selected according to their scores on a
placement test (see Section 4.3.2 for a description) and then according to oral test scores
(see Section 4.3.3 for a description). Table 4.10 describes the participants according to
proficiency and gender.
Table 4.10
Participants according to oral proficiency and gender
Proficiency gender low high total male 12 5 17 female 12 19 31 total 24 24 48
The low group consisted of 24 pre-intermediate level participants: 12 female and 12
male with scores ranging from 2.5 to 4.5 out of 10 in the oral test and 14 to 23 out of 60
on the placement test (A1 to A2 on the CEFR) and the high group consisted of 24 upper
intermediate participants: 19 female and 5 male with scores ranging from 5 to 10 out of
10 in the oral test and 25 to 45 out of 60 on the placement test (B1 to C1 on the CEFR).

152
Oral test scores correlated significantly with placement test scores (r= .93) and a Mann-
Whitney test confirmed that there was a significant difference between the means of the
low and high groups, for the placement test [mean rank: Low= 13.10, High= 35.90,
Mann-Whitney: Z= -5.65, Asymp. sig. (2-tailed) p= .00] and oral test [mean rank: Low
= 13.29, High= 35.71, Mann-Whitney: Z= -5.56, Asymp. sig. (2-tailed) p= .00].
Among these participants a sub-sample of eight participants volunteered for
stimulated recall sessions: three female and one male from the high group and two
female and two males from the low group. The aim of the stimulated recall sessions was
to elicit further information from learners about their spoken performance to supplement
or verify the data collected on strategy use and spoken production.
In addition, four native speakers, two males and two females also participated in
the study. They were four university teachers who volunteered to participate with at
least 10 years teaching experience. By including native speaker performances in the
dataset, each proficiency group’s performance could be assessed more fairly:
“Especially for fluency and complexity, native speakers’ baseline data are
crucial, not because learners’ aim is necessarily to behave like native speakers,
but because looking at what native speakers do may overcome the researchers’
bias toward seeing learners as defective language users, who always need to
‘do more’ ” (Palotti, 2009: 598).
In addition, the relationship between spoken production measures and
proficiency is not assumed to be linear. Norris and Ortega (2009) have pointed out that
CAF should not be considered a static relationship but is dynamic and non-linear in
development. Both Foster and Tavakoli (2009) and Skehan (2009) have recently
criticised the lack of use of such benchmarks in studies on spoken production. In terms
of strategies, the native speaker benchmarks would allow us to distinguish between

153
strategies elicited by the task characteristics which were not related to an imperfect
command of the language and strategies related to L2 resource deficits, which would be
characteristic of the L2 speakers.
4.3.1 The Background Questionnaire
A Background Questionnaire (BQ) was designed to obtain personal information
about learners, as these variables could influence spoken production or strategy use (see
Appendix F). The BQ consisted of twenty-four questions. The first nine questions asked
participants about personal details, average marks at school (intelligence), average
marks for English (language aptitude) and English language exposure (language
learning experience). The remaining rating scale questions asked participants about
affective factors, also known to influence oral communication (Dörnyei, 2005; Gilabert,
2004; Robinson, 2005): their motivation for learning English, self-efficacy in English,
anxiety when speaking English and attitude towards learning English. Initially learners
were to be selected according to these criteria. However, in the end, only two
background criteria were considered in selecting participants 1) that their L1 was
Spanish or Catalan and 2) that their ages were between 18 and 24. Using further criteria
would have reduced the size of the sample too much.
4.3.2 The placement test
As the research questions posed required a comparison of high and low
proficiency groups, it was essential to ensure that the participants selected for each
group differed significantly in this respect. Therefore, general proficiency in English
needed to be measured. The paper and pen version of the revised Oxford Quick
Placement Test (UCLES, 2004) was used for this purpose. It measures grammatical and

154
lexical knowledge. The test takes about 30 minutes and consists of multiple choice
questions which become progressively more difficult. Part 1 (questions 1 to 40) leads
the test taker to an intermediate level and Part 2 (questions 41 to 60) to higher levels.
The scores obtained can be interpreted in terms of ALTE35 levels, CEFR levels or
UCLES36 examination levels.
4.3.3 The oral test
As well as selecting participants for general proficiency, they were selected for
oral proficiency, which the general proficiency test could not account for. As one of the
study’s aims was to make a comparison of low and high proficiency oral skills this
measure was necessary to ensure that low proficiency participants were also low in oral
proficiency and vice versa.
An FCE-style oral test (Appendix E) was designed so that students could
perform it autonomously in the classroom without the guidance of an examiner. As a
large number of students had to be assessed for the study, this seemed the least time-
consuming and least disruptive method for testing during classroom hours. The test
involved the participants taking turns to read out instructions or ask questions, which
would normally have been done by the FCE oral examiner. Students recorded
themselves performing the test with digital cameras in the classroom. As both the
researcher and her colleague were FCE oral examiners, the test was chosen for its
familiarity of format, rating scale and method of standardisation.
The test was divided into three parts, corresponding to the first three parts of the
FCE test, each with instructions and the approximate time students were to take. The
35 ALTE - Association of Language Testers in Europe. Descriptions range from Beginner (Breakthrough) to Very Advanced (Good User). 36 UCLES - University of Cambridge Local Examinations Syndicate. Examinations range from KET (Key English Test) to CPE (Cambridge Proficiency in English)

155
particular tasks and content selected were completely different from those in the main
study, ensuring that the participants wouldn’t be primed for those tasks. In the first part
learners asked and answered questions about their personal details. In the second part
each learner compared and contrasted two similar photographs and in the third part, a
collaborative task, learners discussed which improvements (prompted by a series of
photographs) would be the best for the university.
The test had been previously piloted with a pair of students from the target
population and adjustments had been made to instructions or format to improve clarity.
In a class preceding the test both the researcher and her colleague explained each part of
the test format, the timing, and the use of the digital cameras. In the following class
participants carried out the oral test in pairs, four pairs at a time, each pair in each of the
four corners of the class (see Figure 4.1). Sessions were supervised by the researcher or
her colleague. Test performances were later assessed by the researcher and another FCE
oral examiner, who assessed 50% of the recordings. Both were trained FCE oral
examiners with several years’ experience. Interrater reliability was high [r= .88, N= 24,
p= .000] according to the Pearson product-moment correlation coefficient.
4.4 Data collection procedures
4.4.1 Whole sample
Data collection took place in participant’s usual classroom and in class time,
except for stimulated recall sessions which were carried out after class. The researcher
and a colleague, who were also the students’ English teachers, collected all the data and
supervised the whole of each session for four groups, two groups at a time, as two
classes were held simultaneously. Data collection took place over five sessions as
follows:

156
Session 1: Week 1 Placement Test and Background Questionnaire
Session 2: Week 2 Oral Test
Session 3: Week 5 Task 1, SQ and RQ (& stimulated recall)
Session 4: Week 7 Task 2, SQ and RQ (& stimulated recall)
Session 5: Week 9 Task 3, SQ and RQ (& stimulated recall)
In Session 1 learners were told that some of the communicative activities they
did in class would be part of a research study on oral communication and that they
would be filmed doing them. To encourage maximum attendance in future sessions,
learners were told that their participation would count as part of their continual
assessment for the course. The placement test and BQ were completed individually,
which took less than an hour. An explanation of how the oral tests would be carried out
in the following week was given. This involved the teachers going through each part of
the test materials in front of the class and answering any queries. The students were also
shown how to use the digital cameras. Students were told that they would be filmed in
pairs and that they were not to ask for help, but had to do the activity from start to finish
as if it were a test.
In Session 2 participants were paired with a partner of the same English
proficiency and gender, if possible, to do the oral tests. Four pairs did the oral test
simultaneously, each pair in each corner of the classroom with small digital cameras
placed unobtrusively in front of each pair of students, as shown in Figure 4.1.
This arrangement was similar to the usual way oral pairwork activities were set
up, where students were spread across the classroom in pairs doing activities
simultaneously, as the teacher walked around and monitored. Therefore the authentic
classroom setting and routine was preserved as much as possible. One reason for such a

157
Figure 4.1 Classroom setup during task performance
design is because it has been claimed that using intact classes minimises the effect the
experimental conditions could have on participants’ performances (Foster and Skehan,
1996; Robinson, 2005, among others). In other words, participants are more likely to
perform naturally if they are familiar with the setting and their peers. Another reason is
that the applicability of results to the L2 classroom could be argued more convincingly.
First, the cameras were turned on, then the researcher handed out the oral test and the
students were told to begin when they were ready.
In the same session after the oral tests, the class were introduced to the SQ,
which they were to complete in subsequent sessions. Each student was given a copy of
the questionnaire as the teacher read through each item. This measure was taken, firstly,
to resolve any queries and secondly, to minimize the confounding effect of the repeated
measures design of the study. In short, as the SQ contained a detailed list of strategies
for speaking, it could implicitly raise learners’ awareness of these strategies. This would
mean that participants would complete the first SQ naively after the first task, but would

158
then have acquired strategy knowledge with which to complete the subsequent two SQs.
It was essential, therefore, to ensure an equal base level of strategy awareness before
data collection.
During the following three weeks the researcher and another FCE examiner
assessed the videos of the oral tests, so that in Session 3 participants could be paired up
with a partner of the same oral proficiency (low or high) and gender. During subsequent
data collection, although all class members were treated equally, only the data from 48
of the 76 class members, whose oral test and placement test scores fell within the ranges
given in Section 4.3, was included in the study.
Over Sessions 3 to 5 the participants carried out the three communicative tasks
following the same classroom set up as described above for the oral test. For these tasks,
however, participants were told that they were not being tested, and that they were to do
the tasks in the same way that they did oral tasks in class. This meant that they could
ask for help if they needed to. After each task an SQ and RQ were completed. Each of
these sessions was two weeks apart. The four native speaker benchmarks were also
recorded performing the three tasks in pairs during the same time period.
4.4.2 Sub-sample
Stimulated recall sessions, lasting between 20 and 30 minutes, were carried out
with each participant from the sub-sample (N=8) on the same day after each class
session, as illustrated in Figure 4.2. Although such retrospective reports cannot be
considered complete, due to the difficulty of recalling information from long-term
memory, they can provide further insights into strategy use and spoken performance on
the tasks. Sessions were recorded on an MP4 player. Participants were allowed to

159
switch to their L1 to facilitate the recall and verbalisation processes. Despite this, some
high proficiency participants preferred to do the sessions in English.
Figure 4.2 Setup in stimulated recall sessions
A written research protocol (see Appendix I) was developed as recommended in
Gass and Mackey (2000) to standardise the instructions and procedure as much as
possible. The protocol included instructions to the researcher for before and after the
recall session, as well as procedure to carry out in the case of unexpected eventualities.
The whole stimulated recall procedure had been piloted beforehand, with four
participants who were not part of the study, for reliability and to anticipate possible
problems. The clarity of the instructions was tested as well as technical equipment and
an estimate of the time each session would take.
As another measure of reliability, all participants read written instructions for the
procedure in their L1 at the beginning of the session. They were to pause the recording
whenever they wanted to comment on what they had been thinking at a particular
moment during the task. The researcher was also to pause the recording if she wanted to
ask a question. To check that participants had understood the procedure, the beginning

160
of the task recording was shown and the researcher modelled pausing and asking a
question. Participants practised pausing and explaining what they had been thinking.
Once this procedure was clear the sessions began.
4.5 Data analysis
Although both quantitative and qualitative data was collected in this study, the
approach taken was mainly quantitative. Rating scale responses on the SQ were
immediately quantifiable and spoken production measures and strategies were first
identified in task transcripts and recall comments before quantification. This section
describes the statistical procedures undertaken and the identification and coding of both
spoken production measures and strategies.
4.5.1 Statistical analysis
Participant background data (placement test scores, oral test scores, background
questionnaire responses) and the SQ responses for the three tasks were entered into
SPSS 15 statistical package and exported to Microsoft Excel for designing tables and
graphs. Firstly, descriptive statistics provided information about total scores, means and
standard deviations.
Secondly, non-parametric tests were run to make comparisons between low and
high proficiency groups and across tasks. The non-parametric alternative was chosen
over parametric tests as it is recommended for sample sizes (N<30) and when samples
cannot be considered independent (Pallant, 2005). This was the case in this study as
participants interacted in pairs, therefore the whole sample was not considered forty-
eight independent samples, but twenty-four. Friedman tests (non-parametric equivalent
of one-way repeated measures analysis of variance) identified if differences existed

161
between the three tasks and then post-hoc Wilcoxon tests (non-parametric equivalent of
a repeated measures t-test) made pairwise comparisons between tasks and identified
between which tasks differences lay. Mann Whitney U tests (a non-parametric
equivalent of an independent samples t-test) were used to make comparisons between
two groups, for example, low and high proficiency. Finally, the 5 factors obtained from
the factor analysis of the SQ were compared across tasks and between proficiency
groups by MANOVA37 tests.
4.5.2 Task transcription
Task recordings were transcribed into the CLAN (Computerized Language
Analysis) computer programme using the CHAT (Codes for the Human Analysis of
Transcripts) transcription method in CHILDES38 (MacWhinney, 2000). CHILDES was
originally conceived to analyse child language data in the study of first language
acquisition, but has also been used for research into language disorders and SLA. The
programme and manuals were downloaded and installed from the CHILDES website39.
The advantage of this system is that CLAN and CHAT are:
“a set of computational tools designed to increase the reliability of
transcriptions, automate the process of data analysis, and facilitate the sharing
of transcript data.” (MacWhinney, 2000: 5).
All transcriptions (see Appendix J for a CHAT transcription excerpt) were
carried out in Ariel Unicode to accommodate phonetic symbols describing phonetic
37 MANOVA is preferable to conducting a series of ANOVA’s for each variable as it controls for the risk of a Type 1 error (finding differences when there are none), which is more likely when there are many dependent variables (Pallant, 2005). 38 CHAT transcription is compatible with the CLAN analysis programmes, which consists of a series of computer commands for carrying out searches and counts, as well as a range of switches that can customise each command. 39 http://childes.psy.cmu.edu/

162
errors. Each transcript contained information about the participants, the languages
spoken, the task performed and timing in the file headers. Transcription and coding was
carried out in the main tier. Transcription codes (see Appendix K) were entered for the
ten measures representing the three dimensions of fluency, accuracy and complexity of
spoken production and all forty-four strategies from the SQ, as detailed in the following
sections. The CLAN commands were used as far as possible to count codes. Output
from commands was saved and the results were entered in a coding sheet for each
participant. After transcribing each task, the transcription was checked for errors in
punctuation, spelling and coding using the CHECK (Esc-L) function and FREQ
command.
Over 14 hours of task performances were transcribed by the researcher. In total
72 transcripts were produced, 24 transcripts for each task. Interrater measures were used
to examine transcription reliability, measured as percentage agreement on a random
sample40 of two low and two high pairs across three tasks (12 transcripts representing
17% of the data), transcribed by another researcher. Percentage agreement was 95.6%.
4.5.3 Spoken production measures and coding
The multi-dimensional measure of CAF (complexity, accuracy and fluency) was
employed in this study to measure linguistic spoken production. As seen in Table 4.11,
CAF may be operationalised in several ways, therefore part of the decision-making
process in using CAF was to decide which way to operationalise each dimension so that
the results obtained reflected the nature of the data examined as closely as possible.
In task-based research operationalising these variables depends on the research
questions to be investigated. If tasks are used to elicit specific forms, for example, use
40 Transcripts were numbered for high and low proficiency groups and random numbers were generated from these samples with SPSS

163
of articles or past tense verbs, then specific measures such as the error rate of these
same forms can be used. However, if more general tasks are used, as in this study, more
global measures can be used. Table 4.11 is an inventory, based on Ellis (2003) and
Wolfe-Quintero et al. (1998)41, which illustrates both the numerous specific and general
measures of CAF, quantified as frequencies, percentages, ratios or indexes.
Table 4.11
Operationalisation of complexity, accuracy and fluency based on Ellis, 2003: 117 and
Wolfe-Quintero et al. (1998: 137-144 )
Fluency Accuracy Complexity Ellis (2003) number of words per minute number of syllables per minute number of pauses of one/two second(s) or longer mean length of pauses number of repetitions number of false starts number of reformulations length of run i.e. number of words per pausally defined unit number of words per turn
number of self corrections percentage of error-free clauses target-like use of verb tenses target-like use of articles target-like use of vocabulary target-like use of plurals target-like use of negation ratio of indefinite to definite articles
number of turns per minute anaphoric reference (as opposed to exophoric reference) lexical richness e.g. number of word families used, percentage of lexical to structural words, type-token ratio, proportion of lexical verbs to copula percentage of words functioning as lexical verbs percentage of occurrence of multipropositional utterances amount of subordination e.g. total no clauses divided by total number of c-units frequency of use of conjunctions frequency of use of prepositions frequency of hypothesizing statements
41 Wolfe-Quintero et al. (1998) investigated writing development and made a detailed comparison of measures used to operationalise CAF. See also Polio (2001), Ellis and Barkhuizen (2005) and Iwashita et al. (2008) for inventories.

164
Table 4.11 (continued)
Operationalisation of complexity, accuracy and fluency based on Ellis, 2003: 117 and
Wolfe-Quintero et al. (1998: 137-144 )
Fluency Accuracy Complexity Wolfe-Quintero et al., (1998) Frequencies number of words, clauses, sentences, T-units number of words in T-units /clauses error free T units /clauses
error free T units /clauses number of errors per 100 words number of 1st, 2nd, 3rd degree errors correctly used connectors correctly used pronouns correctly used articles
number of reduced clauses number of dependent clauses number of passives number of adverbial clauses number of adjective clauses number of prepositional phrases number of pronouns number of articles number of subordinating connectors
Ratios number of words per minute/ clauses/sentences/T-units/error-free T- units / error-free clauses number of words in complex nominals per T unit/clauses
error-free T-units per T unit / sentence / word errors per T-unit / clause 1st, 2nd, 3rd degree errors per T-unit syntactic / morphological / lexical errors per clause
clauses per T-unit / sentence / error free T unit dependent clause per T-unit adverbial clauses per T unit
Indices
intelligibility index error index lexical quantity index lexical accuracy index
complexity formula complexity index
In this study, eleven measures were used to operationalise CAF. Complexity was
measured as lexical complexity (statistic D42) and structural complexity, the number of
clauses per AS unit. Accuracy was measured as the number of errors per 100 words,
percentage error-free clauses and percentage self-repairs. Fluency was measured as
speech rate, short, long and filled pauses, repetitions and reformulations. The criterion
for choosing these particular measures was to capture the maximum variance in the data
across tasks and proficiency levels.
Written instructions (Appendix L) provided raters with details and examples to
help identify these measures in transcripts, listed potential problems and gave step by
42 Statistic D is a statistical calculation of lexical diversity.

165
step instructions for coding. Inter-rater reliability, measured as percentage agreement
on the random sample described in the previous section, is shown in Table 4.12. In
subsequent paragraphs the criteria for choosing each particular measure and a
description of the measures is provided.
Table 4.12
Percentage agreement of inter-rater scores
Measure Percentage agreement Fluency words per min 97.7 Fluency Breakdown number of short pauses 80.5 number of long pauses 95.2 number of filled pauses 84.3 Fluency Repair number of repetitions 95.5 number of reformulations 93.4 Accuracy number of errors 90.6 number of self-repairs 91.3 Complexity number of clauses 98.0 number of AS units 96.0
4.5.3.1 Basic unit of measure
The first decision which had to be made in order to begin CAF coding was to
decide on a common unit against which CAF could be measured. The three basic units,
against which complexity, fluency and accuracy have been measured so far are the T-
unit, the C-unit and the AS-unit (Ellis, 2003). A T-unit is a main clause with an
embedded or attached subordinate clause (see Hunt 1965, 1966 and 1970, for exact
definitions). The T-unit has been used to analyse written production (Ishikawa, 2007;
Kuiken and Vedder, 2007; Storch and Wigglesworth, 2007; Wolfe-Quintero et al.,
1998) or monologic speech (Bygate, 2001; Crookes, 1989; Gilabert, 2004; Robinson,

166
2005). Gilabert used the T-unit because he examined monologic non-interactional tasks
therefore his unit of measure did not need to take into account phenomena found in
interactive communication where ellipsis or one-word responses are common. Bygate
(2001) examined the effect of oral task repetition using the T-unit because one of the
task types employed was a narrative, which also involved little interaction.
However, Tarone (1985) argued that her spoken discourse samples were not
easily analysed using the T-unit, as much of speech contained few complete sentences
and much hesitation and repetition. To account for these shortcomings the C-unit
(communication unit) was established which includes ellipsis. The C-unit, defined by
Pica et al. (1989: 72) is “utterances, for example, words, phrases and sentences,
grammatical and ungrammatical, which provide referential or pragmatic meaning”. For
example, Foster and Skehan (1996) have used the C-unit to investigate the effect of
planning time and task type on spoken production where learners performed tasks in
pairs, therefore the C-unit was used to capture the more interactive nature of the spoken
production data.
The problem with the C-unit, however, is that it has been defined differently by
different researchers and often not defined clearly enough. Consequently, Foster et al.
(2000) propose the AS-unit (Analysis of Speech unit) as an improvement on the C-unit,
illustrating that the C-unit, in practice, can be difficult to apply to oral data. They take
Hunt’s T-unit as their basis and elaborate it to deal with features of spoken data.
“An AS-unit is a single speaker’s utterance consisting of an independent
clause(s) or sub-clausal unit, together with any subordinate clause(s)
associated with either.” Foster et al. (2000: 365)
The following example from the Information Gap task in this study illustrates an AS-
unit with two clauses.

167
ok so my first picture is: a square: [= ::] which # is divided in # four triangles
[= ::] [= |]. [2 clauses, 1 AS-unit]
Key: [= ::] = clause boundary, [= ::] [= |] = AS boundary
Lambert and Engler (2007) used the AS-unit as the basis of their analysis of oral
pairwork: one-way/two way/shared and open/closed task dimensions were investigated.
Michel et al. (2007) also used the AS-unit to investigate task complexity in monologic
oral tasks with fewer or more elements and Tavakoli and Skehan (2005) employed it in
their study of the effect of task structure and planning on spoken production for
narrative tasks.
Considering the basic units employed so far, it seemed most appropriate to adopt
the AS-unit as the basic unit of analysis, as it reflected the interactional nature of our
data most closely. Much more of the data could be included in the analysis than if the T-
unit had been used, making the AS-units more representative of the data. Also it
avoided having to consider which variation of C-unit definition to apply. Furthermore,
the careful definitions and examples provided in Foster et al. (2000) provided a
comprehensible way of applying the AS-unit to the segmentation of the data. Foster et
al.’s level two analysis for highly interactional data seemed most appropriate. At this
level of analysis one-word utterances whose inclusion can distort the perception of the
performance are excluded. Examples of AS-units from this study’s corpus can be found
in Appendix L. The clause (or s-node) was the unit of measure used to subdivide AS-
units into smaller segments, “either a simple independent finite clause or a dependent
finite or non-finite clause” Foster and Skehan (1996: 310) or “s-nodes are indicated by
tensed or untensed verbs” (Ellis et al., 1994: 483).

168
4.5.3.2 Fluency
Ellis describes fluency as “the extent to which the language produced in
performing a task manifests pausing, hesitation, or reformulation” (Ellis 2003: 342).
Detailed analysis of fluency requires the use of separate measures to represent its
different sub-dimensions: a) silence (breakdown in fluency) b) reformulation,
replacement, false starts and repetition (repair in fluency) c) speech rate (words or
syllables per minute) and d) automatisation (length of run). The combination of these
measures provides the most comprehensive picture of fluency performance (Skehan,
2003). In this study three of these dimensions (fluency breakdown, fluency repair and
speech rate) were accounted for. Table 4.13 describes the formulas used to calculate the
six fluency measures.
Table 4.13
Calculation of fluency
Fluency Measures Calculation speech rate total number of tokens (words) / total task time (in minutes): wpm Fluency Breakdown short pauses total number of pauses of less than 1sec/ total number of AS units
long pauses total number of pauses of more than 1sec/ total number of AS units filled pauses total number of filled pauses / total number of AS units Fluency Repair repetitions total number of AS units / total number of repetitions
reformulations total number of AS units / total number of reformulations
4.5.3.3 Accuracy
Accuracy is described as the ability to produce error-free speech. General
measures of accuracy have been the percentage of error-free clauses (Foster & Skehan,
1996), error-free T-units (Ortega, 1999; Robinson, 1995), error-free AS-units (Lambert
& Engler, 2007), the number of errors per 100 words (Kuiken & Vedder, 2007; Wolfe
Quintero et al., 1998) or the number of errors per T-unit (Bygate, 2001). Specific

169
measures have been the target-like use of articles, verbs, negation or vocabulary
(Robinson, 1995). As general measures of accuracy have proved more sensitive to
treatments (Skehan, 2003) three were chosen for this study: the number of errors43 per
100 words, percentage of error-free clauses and percentage of self-repairs. Only error
repairs, as defined in Kormos (1999), were considered self-repairs. Error-repairs correct
an accidental lapse and are either lexical, grammatical or phonological. See Appendix L
for details of error coding. Table 4.14 describes the formulas used to calculate accuracy
measures:
Table 4.14
Calculation of accuracy
Accuracy Measures Calculation Number of errors per 100 words (total number of errors/ total number of words) x 100 % error-free clauses (number of error-free clauses/ total number of clauses) x 100 % self-repairs (number of self-repairs/ total number of errors) x 100
To capture the maximum variance in each of the low and high proficiency
groups, percentage error-free clauses were chosen over percentage error-free AS-units.
As the clause is shorter (Foster & Skehan, 1996), it allows more possibility for the low
group to get moderate scores. Whereas the first two measures reflect the final product of
spoken production (correct lexical, morphological and phonologic encoding during
speech processing), percentage self-repairs measure accuracy in process or post-
articulatory monitoring, as learners try to improve on their spoken performance
(Gilabert, 2004; Kormos, 1999).
43 An error was considered “a linguistic form or combination of forms, which in the same context and under similar conditions of production would, in all likelihood, not be produced by the speakers’ native speaker counterparts.” Lennon (1991: 182) Lexical, morphological, syntactical and phonological errors were considered (Kormos, 1999).

170
4.5.3.4. Complexity
Complexity has been described as the “extent to which the language produced in
performing a task is elaborate and varied” (Ellis, 2003: 340). To measure structural
complexity the amount of subordination has been commonly used (Crookes, 1989;
Foster & Skehan, 1996; Wigglesworth, 1997), as it reflects the degree of structuring of
speech. The number of clauses per unit (e.g. T-unit, C-unit or AS-unit) has been the
most common unit of measure. Therefore, this study employs the number of clauses per
AS-unit. The formula used to calculate structural complexity was total number of
clauses divided by total number of AS-units.
Lexical complexity can be measured by a range of specific syntactic forms. For
example verbs can be measured for tense, aspect, voice and modality. Connectors such
as coordinating conjunctions (and, but, so), adverbials (moreover, however) or
subordinating conjunctions (if, when, because) can be used. Relative pronouns,
restrictive devices (not only... but also, neither...nor, the... the ...), lexical variation or
prepositional phrases can also be used.
Traditionally, a general measure for lexical complexity has been the type-token
ratio or TTR (the number of different words in a monologic text divided by the total
number of words). However, it is sensitive to the length of the text (MacWhinney, 2000;
Skehan, 2003; Vermeer, 2000). The number of tokens increases if a text is long, giving
low TTR values. Therefore, TTR lacks reliability as any single value depends on the
length of the sample used. Guiraud’s index of lexical richness (the number of types of
words divided by the square root of the total number of words) (Gilabert, 2004; Michel
et al., 2007) or other mathematical transformations of the TTR (Kuiken and Vedder,
2007) are also prone to the same effect. The statistic D (Malvern and Richards, 2002),
which is available within the CLAN programmes of CHILDES (McWhinney, 2000) as

171
the VOCD command, is a relatively new and acceptable (Skehan, 2009) measure of
vocabulary diversity calculated from the text itself, a text internal measure44.
“The measure has three advantages: it is not a function of the number of
words in the sample; it uses all the data available; and it is more informative,
because it represents how the TTR varies over a range of token size. The
measure is based on the TTR versus token curve calculated from data for the
transcript as a whole, rather than a particular TTR value on it.” McWhinney
(2000: 113).
As task duration differed considerably in this study45, among participants doing
the same task and across tasks, it was felt that the D-statistic would be the best measure
of lexical complexity as the differing task durations could distort the results, if the TTR
based measures were used.
4.5.3.5 Preliminary analysis of production measures
One criticism of CAF studies (Norris & Ortega, 2009; Skehan, 2001) has been
that the majority do not consider the interdependence between CAF measures, but
consider these areas independently. Some researchers, however (Ortega, 1995; Skehan
and Foster, 1997; Tavakoli & Skehan, 2005; Zhang, 2007) have carried out factor
analyses on the range of measures that they used to operationalise CAF. Skehan and
Foster (1997) found that the three constructs had high loadings on three different
factors, providing support for the three-way distinction of CAF. Zhang (2007) studied
the effect of planning on L2 speech for a balloon debate task and obtained four factors:
Factor 1: structural complexity, Factor 2: turn length, Factor 3: repair fluency (repetition 44 An alternative measure of lexical complexity (Skehan, 2009) is obtained by employing a text external measure. This measure, taken from corpus analysis, reflects lexical sophistication rather than the lexical diversity of the D-statistic. Frequency lists of words in a spoken corpus are measured and low frequency words are identified. The occurrence of these more difficult or sophisticated words is then measured in a fixed length of the transcribed data of a study. 45 Range of task duration was 3.1m to13.5m (Picture Story), 5m to 20.4m (Art Description) and 5.9 to27m (Information Gap).

172
and reformulation) and Factor 4: accuracy (errors per 100 words), which supports
Skehan and Foster’s claim that complexity, accuracy and fluency are independent
constructs. Consequently, in this study a preliminary factor analysis was carried out on
the eleven measures of spoken production to see if the CAF measures used were
independent.
The Kaiser-Meyer-Olkin value (KMO =.624) in the exploratory factor analysis
ensured that the data was suitable for factor analysis, exceeding the recommended value
of .6. Also, Bartlett’s test for sphericity reached statistical significance (p= .000). Initial
principal components analysis revealed the presence of 5 components with eigenvalues
exceeding 1, explaining 77.7% of the variance. On examining the scree plot and
extracting 2, 3 and 4 factors with Varimax rotation, the three-factor solution was chosen
(Table 4.15), which explained 57.3% of the variance.
Error free clauses, speech rate (wpm), lexical complexity (high loadings between
.76 and .86.) and to a lesser extent, structural complexity (low loading of .35), loaded
onto Factor 1, with a noteworthy high negative loading for Errors per 100 words. This
factor suggests that when learners were more accurate they also spoke faster, used more
varied vocabulary and their utterances were more structurally complex. For this factor
the underlying construct seems to be proficiency, as more proficient students are
described as having more complex, accurate and faster speech (Skehan, 2009). All three
tasks underwent separate factor analyses and presented practically an identical pattern
of factor loadings, even when a factor analysis was undertaken with data from all three
tasks together. This suggests that the structure is fairly stable. However, as structural
complexity loaded much lower, it could be that it is less closely related to the construct
of proficiency than the other measures.

173
Long, short and filled pauses loaded onto Factor 2, with loadings between .47
and .62, and with negative loadings for structural complexity and self-repairs.
Repetition and reformulation loaded high (.83 and .56 respectively) and self-
repair (.37) loaded low on Factor 3, suggesting that it was not so closely related to the
other measures.
Table 4.15 Factor loadings for production measures Factor Loading
Production Measure Factor 1 Factor 2 Factor 3 Errors per 100 words -.902 Error free clauses .867 Speech rate .810 Lexical complexity .760 Structural complexity .353 -.626 -.334 Long pauses .622 Short pauses .320 .546 Filled pauses .470 Self-repairs .340 -.445 .371 Repetition .833 Reformulation .456 .560 Extraction Method: Principal Component Analysis. Rotation Method: Varimax with Kaiser Normalization.
In Skehan and Foster’s (2001) factor analysis, where CAF loaded high onto
three separate factors, accuracy was measured as error-free clauses, complexity as
structural complexity and fluency as pauses. A similarity with this analysis is that the
two dimensions of accuracy and structural complexity are independent from fluency (in
terms of pausing), with structural complexity loading negatively on Factor 2. However,
as structural complexity had a low loading on Factor 1, it suggests that it is related to
lexical complexity and accuracy, although not closely. These results, however, extend
Foster and Skehan’s results, as speed, a further subdimension of fluency, was measured,

174
and found to be related closely to accuracy and lexical complexity and unrelated to
pausing or repair. The results are also in line with Zhang (2007), who found repetition
and reformulation to be interrelated (repair fluency) and independent of pausing
(breakdown fluency).
Apart from serving to ascertain the interrelatedness between measures this factor
analysis was used to determine how to proceed with further analysis of spoken
production. Firstly, despite correlations between some measures, it was decided to
report measures separately in further analyses in order to make comparisons with other
published data. Secondly, to simplify interpretation of the data, some measures which
correlated highly, as they were measuring the same underlying construct, were removed.
Consequently, in the analysis of spoken production only the following eight of the
eleven measures are reported: Accuracy: error free clauses, Complexity: lexical
complexity, structural complexity, Fluency: speech rate, long pauses (Fluency
breakdown), repetition and reformulation (Fluency repair) and Self-repair: error repair.
4.5.4 Strategy identification and coding
In order to see how accurate perceived strategy use (PSU) reflected actual
strategy use (ASU), the strategies from the SQ were identified in task transcripts and
recall comments, adapting the coding scheme developed in the first pilot study.
However, in this study a larger dataset was available and so it was possible to identify
more strategies.
The second pilot study had shown that strategy identification was far from
straight-forward. Firstly, as the construct of strategy used included both conscious
thoughts and behaviours, recall comments were necessary to reveal thought processes
and uncover covert behaviour, such as planning, monitoring and evaluating, which were

175
not immediately evident from the task performance. Secondly, strategy descriptions on
the SQ were not always mutually exclusive, some referred to a behaviour, some to a
thought and others to both; some were verbal, some non-verbal and others were both;
some referred to one specific behaviour or thought and others to more than one.
Consequently, ASU was measured in different ways and could not always be quantified.
Instructions were written for raters as seen in Appendix M. Data sources from which
each strategy was identified are given in Table 4.16.
The majority of SQ strategies were quantifiable, according to counts identified
and coded in task transcripts, as in other CS studies (for example, Dörnyei & Scott,
1997; Lafford, 2003; Poulisse, 1990). Twenty-nine different strategies46 were coded in
this way and means and standard deviations were calculated for each strategy on each
task. Intra-rater percentage agreement for these strategies on 17% of the transcripts was
90%. A few examples of these quantifiable strategies are provided here, but the reader
should refer to Appendix N for the full list.
Item 28, message abandonment described as leaving a message unfinished because of
some language difficulty was identified as follows:
*LAU: it was supposed to be a paradisiac beach it was a normal beach with: beach
with: with: a lot of # .
*LAU: no sé com es diu. [I don’t know what it’s called].
Item 7, use of fillers, using gambits to fill pauses, to stall, and to gain time in order to
keep the communication channel open and maintain discourse at times of difficulty was
identified as follows:
46 Thirty of the SQ items were quantified, but as Item 11 and Item 33 were parallel items for gesture, they only represented 29 different strategies.

176
*FER: yes, probably it's a balcony.
*TOM: yes.
*FER: and # well maybe a garden or well there's a tank &=ges:rectangle +/.
Table 4.16
Source of strategy identification in the qualitative data
Strategy Group Strategy Item Source of Identification CFM 1. (task familiarity) recall Planning 2. (advance organisation) pre-task planning time Planning 3. (organisational planning) task planning content 4. (note taking) task observation CFM 5. (using expressions) recall CFM 6. (avoiding error) task coding: % error-free clauses CFM 7. (use of fillers) task coding Compensation 8. (risk taking) recall Planning 9. (directed attention) task observation Planning 10. (not taking risks) recall CFM 11. (gesture) task coding CFM 12. (maintaining conversation) task observation Planning 13. (planning sentence structure) recall Interactional 14. (clarification by speaking slower) task coding Interactional 15. (comprehension check) task coding Interactional 16. (clarification by circumlocution) task coding Compensation 17. (clarification by code switch) task coding Interactional 18. (clarification by repetition) task coding Interactional 19. (asking to speak slower) task coding Interactional 20. (clarification request) task coding Interactional 21. (asking for repetition) task coding Interactional 22. (feigning understanding) task coding Interactional 23. (guessing) task coding Interactional 24. (expressing non-understanding) task coding Interactional 25. (interpretive summary) task coding CFM 26. (self-repair) task coding: % self-repair Compensation 27. (appeal for help) task coding Compensation 28. (message abandonment) task coding Compensation 29. (code switching) task coding Compensation 30. (word coinage) task coding Compensation 31. (foreignising) task coding Interactional 32. (circumlocution) task coding CFM 33. (as for Item 11) task coding Compensation 34. (long pause). task coding: AS units/long pauses Compensation 35. (restructuring) task coding Compensation 36. (literal translation) task coding Compensation 37. (mumbling) task coding Compensation 38. (omission) task coding Compensation 39. (retrieval) task coding Compensation 40. (approximation) task coding Evaluating 41. (other evaluation) Recall Evaluating 42. (self evaluation) Recall Evaluating 43. (identifying specific problems) Recall Evaluating 44. (aspects to improve) Recall Key: task coding = quantifiable strategies identified in task transcripts Note: Unquantifiable strategies were measured in different ways

177
Item 16, clarification by circumlocution, described as circumlocution in response to an
expression of non-understanding is illustrated in the following example:
*QUE: ah because they don't want to see what's happening behind the: behind them.
*LLO: oh!
*LLO: you mean the face behind that &=ges:pointpic behind them?
*QUE: yes the black face with er I think a woman who: who's hungry and from
Africa.
*LLO: mmhm .
The remaining 14 strategies could not be coded in this way because they were
either not observable in task transcriptions, for example, evaluating strategies (Item 41-
44) or they did not refer to discrete behaviour which could be quantified, for example,
note-taking (Item 4) or directed attention (Item 9). Item 2 (advance organisation) was
measured as pre-task planning time47 and means and standard deviations were
calculated for each task. The remaining strategies were quantified as either low, medium
or high strategy use, according to the relative differences observed across tasks. Item 9
(directed attention), Item 4 (note taking) and Item 12 (maintaining the conversation)
were observable in the task performance. Item 3 (organisational planning) was
measured by analysis of the content of the pre-task planning stage (Dörnyei, 2003;
Miles & Huberman, 1994) as well as recall comments and the remaining nine strategies
were identified in recall comments of the sub-sample. Recall comments also provided
further confirmation of strategies already coded or observed in the task performances.
Some examples are given in the next section:
47 Pre-task planning or strategic planning time was measured from the second the researcher gave the task to the participants to the second before the first turn of the task.
178
4.5.5 Stimulated recall
Audio files of 24 stimulated recall sessions, lasting over 8 hours in total, were
listened to. Content analysis of the data was performed in the following way: 1)
Recordings were listened through to get a general idea of the contents, 2) Recordings
were listened to a second time and excerpts were transcribed which shed further light on
information gathered in task transcripts, such as particular strategies, learner attitudes or
rationales for strategy use, 3) Excerpts were matched to the part of the task transcript
they referred to, 4) Excerpts were coded for strategies, in particular the use of the
following covert strategies: task recognition (Item 1), guessing (Item 23), feigning
understanding (Item22), literal translation (Item36), approximation (Item 40), use of
expressions (Item 5), maintaining conversation (Item 12), planning sentence structure
(Item 13), evaluating (Items 41 to 44) and risk taking (Items 8 and 10), 5) Remaining
excerpts were grouped according to underlying and recurring themes.
The following examples illustrate how recall comments48 were coded. This first
extract was coded as low use for Item 3, organisational planning, which was verified
by the pre-task planning transcript.
Recall
NaAl0101: At the beginning I’m reading the instructions and looking at the pictures
trying to see what they’re about... When *SAB says “picture number one start
you”, I’m not ready. I haven’t prepared the pictures but as the camera is
recording...
Pre-task Planning
29 *NAT: er: +/.
30 *SAB: start you?
31 *NAT: no jo no estoy &=laughs .
32 *NAT: er lo podemos haber preparado antes?
33 *SAB: yes &=laughs .
48 Recall comments are translated from Catalan/Spanish.

179
34 *NAT: pero esto qué es?
35 *SAB: the travel.
36 *NAT: están mirando ah están mirando para el viaje después se casan i van al
37 aeropuerto.
38 *SAB: in English please!
39 *NAT: ah bueno!
40 *SAB: 0 [=! laughs].
41 *SAB: the picture one.
42 *NAT: a veure ?
This second example was coded as Item 8, risk taking:
Task
*SER: er xxx in the picture five the couple is: looking for the window # the the
the environment
Recall
SeRu010: Here ‘looking for’ I wasn’t sure if I had said it right or if it was right
for this context.
Summing up, Chapter 4 has described the methods employed to answer the
research questions posed. The instruments used in this study have been presented with
particular emphasis on the development of the SQ, the main instrument for gathering
data on perceived strategy use. An analysis of the features of the three oral
communication tasks (Picture Story, Art Description and Information Gap) has been
made using Robinson’s (2005) framework. The selection of participants and their
placement into low and high proficiency groups has been explained as well as the
procedures for data collection of strategy use and spoken performance. The chapter has
then ended by describing the means for undertaking the quantitative and qualitative
analyses of the data, the results of which will be the focus of the following chapter.

Chapter 5
Results

180
In this chapter the findings related to each research question will be presented.
Firstly, spoken production is compared across the three communicative tasks for high
and low proficiency groups, using production measures from native speakers as
benchmarks. Next, perceived strategy use, as measured by the Strategy Questionnaire
(SQ), is compared across tasks for the whole sample and for high and low proficiency
groups. Comparisons are then made between low and high proficiency groups on each
task, firstly, for spoken production and then perceived strategy use. Following this, the
validity of the SQ is explored by comparing perceived strategy use (PSU) with actual
strategy use (ASU) for each proficiency group on the three tasks. Additional results
comparing pre-task planning time, task duration and learners’ perceptions across the
three tasks are reported. Finally, the potential of the five strategy categories from the
Strategy Questionnaire to predict spoken production measures is examined. Task-based
results are summarised, firstly, across the three tasks for each proficiency group and
then between proficiency groups on each of the tasks.
5.1 Across-task comparisons
In this section a description of learners’ spoken production and strategy use
across the three tasks will be made in order to answer RQ1, concerned with differences
in spoken production across tasks and RQ2, concerned with differences in perceived
strategy use across tasks for EFL learners.
5.1.1 Spoken production across tasks
As described in the previous chapter participants’ task performance was assessed
by eight measures of spoken production, as justified by a factor analysis, to represent
the complexity-accuracy-fluency dimensions. The eight measures were 1) accuracy

181
(percentage error-free clauses), complexity: 2) lexical complexity (D-statistic) and 3)
structural complexity (number of clauses per AS-unit), fluency: 4) speech rate 5)
fluency breakdown (AS-units divided by long pauses) and fluency repair; 6) AS-units
divided by repetitions; 7) AS-units divided by reformulations and 8) self-repair
(percentage of self- repairs).
Firstly, production measures across tasks were examined for the whole group
and then for the high and low proficiency groups separately, using Friedman and post-
hoc Wilcoxon tests (see Appendix S, for descriptive statistics). As results turned out to
be similar the following sections only present the separate results of the high and low
proficiency groups. Four native speakers also did the three tasks in pairs to act as
benchmarks for spoken production. Means and standard deviations of these measures
across tasks are presented against which the two L2 proficiency groups are compared.
5.1.1.1 High proficiency
Spoken production was analysed for the high proficiency group (N= 24) across
tasks in answer to RQ1.1: Are there differences across tasks in spoken production
(measured in terms of complexity, accuracy, fluency and self-repair) for high
proficiency learners? Table 5.1 presents descriptive statistics of spoken production
measures for the high group and it indicates between which tasks significant differences
were found, according to Friedman and Wilcoxon tests.

182
Table 5.1 Descriptive statistics for spoken production measures across tasks for high proficiency
group (N=24)
Note: For long pauses, repetitions and reformulations the number of AS units was divided by the number of pauses, repetitions or reformulations, so high values represent high fluency. Significant difference between tasks (Friedman-Wilcoxon, p< .05): a - Picture Story and Art Description b - Picture Story and Information Gap, c - Art Description and Information Gap Table 5.2 Friedman tests for spoken production measures across tasks for high proficiency group
(N=24)
Mean Ranks Statistics
Picture Story
Art Description
Information Gap
Chi- Square df
Asymp. sig.
Accuracy error free clauses 1.46 1.83 2.71 19.75 2 .00* Complexity lexical complexity 1.96 2.71 1.33 22.75 2 .00* structural complexity 2.88 2.08 1.04 40.58 2 .00* Fluency speech rate 1.79 1.92 2.29 3.25 2 .20 long pauses 1.54 2.02 2.44 13.82 2 .00* repetition 1.38 1.96 2.67 20.08 2 .00* reformulation 1.67 1.92 2.42 7.15 2 .03* Self-repair Error-repair 2.13 1.92 1.96 0.64 2 .73 Note: For pauses, repetitions and reformulations high values represent high fluency. * Level of significance (Friedman, p< .05)
Picture Story Art Description Information Gap M SD M SD M SD Accuracy error free clauses 70.26 b 12.42 74.05 c 9.06 81.04 bc 8.32 Complexity lexical complexity 47.13 ab 12.00 55.27 ac 13.39 40.54 bc 9.07 structural complexity 2.49 ab .84 1.85 ac .74 1.27 bc .12 Fluency speech rate 50.73 12.61 51.75 11.63 54.37 9,75 long pauses 4.15 ab 9.45 18.64 a 30.57 28.46 b 38.86 repetition 3.04 b 2.86 4.65 c 4.67 7.54 bc 6.25 reformulation 7.86 b 6.15 7.18 c 2.95 13.09 bc 6.76 Self-repair error-repair 12.80 13.50 8.38 8.66 11.79 13.50

183
High Proficiency Group
0 1 2 3
% error-freeclauses
Lexicalcomplexity
Structuralcomplexity
Speech rate
Long pauses
Repetition
Reformulation
Error Repair
Acc
urac
yC
ompl
exity
Flu
ency
Sel
f-re
pair
Pro
du
ctio
n M
easu
res
Mean Ranks
Information Gap
Art Description
Picture Story
Friedman tests, presented in Table 5.2, show that there were significant
differences for all measures across the three tasks, except for speech rate and self-repair.
Figure 5.1 illustrates these differences according to mean ranks generated from the
Friedman tests for each measure.
Note: For pauses, repetitions and reformulations high values represent high fluency.
Figure 5.1 Mean ranks for spoken production measures across tasks for high
proficiency group (N=24)
Post-hoc Wilcoxon tests, presented in Table 5.3, were conducted to find out
between which tasks differences lay. Pairwise comparisons of tasks showed significant
or nearly significant (p< .1) differences49 between tasks for most measures. Looking
down the columns in this table, it can be seen that there were 3 differences between the
49 Pallant (2005) recommends reporting nearly significant differences for non-parametric tests, as they are less sensitive than parametric tests and may fail to detect differences that actually exist.

184
Picture Story and Art Description, 6 between the Picture Story and Information Gap and
5 between the Art Description and Information Gap.
Table 5.3
Wilcoxon tests for spoken production measures across tasks for high proficiency group
(N=24)
Picture Story & Art Description
Picture Story & Information Gap
Art Description & Information Gap
Z Asymp. sig. (2-tailed) Z
Asymp. sig. (2-tailed) Z
Asymp. sig. (2-tailed)
Accuracy error free clauses -1.74 .08 -3.46 .00* -3.14 .00* Complexity lexical complexity -3.09 .00* -2.43 .02* -4.17 .00* structural complexity -3.51 .00* -4.29 .00* -4.26 .00* Fluency long pauses -2.73 .01* -2.79 .01* -1.68 .09 repetition -1.83 .07 -3.69 00* -2.29 .02* reformulation -.91 .36 -3.24 .01* -2.54 .01* Note: For pauses, repetitions and reformulations high values represent high fluency. *Level of significance (Wilcoxon, p< .05)
The description of these pairwise comparisons of tasks can be followed by
referring to Figure 5.1 which visualises the direction of these significant differences.
Between the Picture Story and Art Description, as mentioned above, the high
proficiency group only varied in terms of three measures (p< .05). Structural complexity
was higher on the Picture Story (narrative task) while lexical complexity and fluency
(long pauses) were higher on the Art Description (abstract task). Therefore, the narrative
task elicited more structural complexity while the abstract task elicited more lexical
complexity and less pausing.
Between the Picture Story and Information Gap, accuracy and fluency was
significantly higher on the Information Gap (interactional task) while lexical and

185
structural complexity was lower. In other words, the interactional task elicited more
accuracy and fluency than the narrative task, which elicited more complexity.
Between the Art Description and Information Gap, practically the same
differences as in the previous task comparison were found. Accuracy and fluency were
significantly higher on the Information Gap (interactional task) than the Art Description
(abstract task), except that there was no significant difference for fluency breakdown
(long pauses) between these tasks. In addition, complexity was significantly higher on
the abstract task compared to the interactional one.
To conclude, in answer to RQ1.1, high proficiency learners do vary their spoken
production with the type of task they undertake. In this study the differences in spoken
production were most evident between the interactional task compared to the narrative
and abstract tasks, where learners’ spoken production did not vary as much. Task type
had a positive impact on production in the following ways: the interactional task
(Information Gap) promoted accuracy and fluency, the abstract task (Art Description)
promoted lexical complexity and the narrative task (Picture Story) promoted structural
complexity.
5.1.1.2 Low proficiency
Spoken production measures were analysed for the low proficiency group across
tasks in answer to RQ1.2: Are there differences across tasks in spoken production
(measured in terms of complexity, fluency, accuracy and self-repair) for low proficiency
learners? Table 5.4 presents descriptive statistics of spoken production measures for
the low group. Friedman tests, presented in Table 5.5, showed that these differences
were significant for all measures across tasks except for speech rate and Figure 5.2

186
illustrates these differences according to mean ranks on the Friedman test for each
measure.
Table 5.4 Descriptive statistics for spoken production measures across tasks for low proficiency
group (N=24)
Note: For pauses, repetitions and reformulations high values represent high fluency. Significant difference between tasks (Friedman-Wilcoxon, p< .05)
a - Picture Story and Art Description b - Picture Story and Information Gap c - Art Description and Information Gap Post-hoc Wilcoxon tests, presented in Table 5.6, showed that for the low
proficiency group, there were also several differences, as for the high proficiency group.
There were 2 differences between the Picture Story and Art Description, 6 between the
Picture Story and Information Gap and 6 between the Art Description and Information
Gap. Figure 5.2 visualises the direction of these significant differences, which are
described below.
Picture Story Art Description Information Gap M SD M SD M SD Accuracy error free clauses 42.60b 17.01 47.44c 13.65 54.62bc 13.13 Complexity lexical complexity 32.00a 11.08 35.87ac 9.84 29.21c 7.16 structural complexity 1.81ab .56 1.41ac .33 1.20bc .15 Fluency speech rate 33.79 7.88 32.74 11.33 33.82 11.56 long pauses 7.50b 11.36 13.35 13.55 16.92b 16.70 repetition 4.46b 4.95 2.77c 2.42 9.05bc 11.79 reformulation 6.84b 6.44 8.19c 8.01 16.30bc 15.06 Self-repair error-repair 10.71b 10.48 7.52c 5.69 3.37bc 3.33

187
Low Proficiency Group
0 1 2 3
% error-freeclauses
Lexicalcomplexity
Structuralcomplexity
Speech rate
Long pauses
Repetition
Reformulation
Error repair
Acc
ura
cyC
omp
lexi
tyF
luen
cyS
elf-
rep
air
Pro
du
ctio
n M
easu
res
Mean Rank
Information Gap
Art Description
Picture Story
Table 5.5 Friedman tests for spoken production measures across tasks for low proficiency group
(N=24)
Mean Ranks Statistics
Picture Story
Art Description
Information Gap
Chi-Square df
Asymp. sig.
Accuracy error free clauses 1.56 1.73 2.71 18.59 2 .00* Complexity lexical complexity 1.83 2.58 1.58 13.00 2 .00* structural complexity 2.83 2.04 1.13 35.08 2 .00* Fluency speech rate 2.00 2.00 2.00 .00 2 1.00 long pauses 1.54 2.23 2.23 8.25 2 .02* repetition 1.77 1.65 2.58 12.57 2 .00* reformulation 1.65 1.71 2.65 15.22 2 .00* Self-repair error-repair 2.25 2.25 1.50 9.60 2 .01* Note: For pauses, repetitions and reformulations high values represent high fluency. * Level of significance (Friedman, p< .05)
Note: For pauses, repetitions and reformulations high values represent high fluency.
Figure 5.2 Mean ranks for spoken production measures across tasks for low proficiency
group (N=24)

188
Between the Picture Story and Art Description, as mentioned, there were two
differences. Structural complexity was higher on the Picture Story (narrative task) while
lexical complexity was higher on the Art Description (abstract task). Therefore, as for
the high group, the narrative task elicited more structural complexity while the abstract
task elicited more lexical complexity.
Table 5.6
Wilcoxon tests for spoken production measures across tasks for low proficiency group
(N=24)
Picture Story & Art Description
Picture Story & Information Gap
Art Description & Information Gap
Z Asymp. sig. (2-tailed) Z
Asymp. sig. (2-tailed) Z
Asymp. sig. (2-tailed)
Accuracy error free clauses -1.55 0.12 -3.23 .00* -3.66 .00* Complexity lexical complexity -2.80 .01* -0.71 0.48 -3.49 .00* structural complexity -3.71 .00* -4.26 .00* -3.43 .00* Fluency long pauses -1.64 0.10 -2.03 .04* -0.54 0.59 repetition -1.25 0.21 -2.14 .03* -3.46 .00* reformulation -0.51 0.61 -2.74 .01* -2.90 .00* Self-repair error-repair -0.70 0.48 -3.22 .00* -2.71 .01*
Note: For pauses, repetitions and reformulations high values represent high fluency. * Level of significance (Wilcoxon, p< .05)
Between the Picture Story and Information Gap, there were differences in all
measures except for lexical complexity. Accuracy and fluency were significantly higher
on the Information Gap (interactional task) while structural complexity was higher on
the Picture Story (narrative task). In other words, as for the high group, the interactional
task elicited more accuracy and fluency than the narrative task, which elicited more
structural complexity. However, the difference between the narrative and interactional
tasks did not impact upon lexical complexity for the low proficiency learners.

189
Between the Art Description and Information Gap, virtually the same
differences as for the above task comparison were found. Accuracy and fluency repair
(repetition and reformulation) were significantly higher on the Information Gap,
however, both structural complexity, lexical complexity and self-repair, were lower and
there was no difference in fluency breakdown (long pauses). Therefore, the interactional
task elicited more accuracy and fluency repair (repetition and reformulation) than the
abstract task but less complexity and self-repair. As for the high proficiency group,
interactional or task difficulty features did not impact fluency breakdown.
Summing up, in answer to RQ1.2, the low proficiency learners also vary their
spoken production depending on the task type and this followed the same trend as the
way high proficiency learners varied spoken production across tasks. Once again
differences were more marked between the Information Gap and the other two tasks.
Task type had a positive impact in the following ways: the interactional task
(Information Gap) elicited accuracy and fluency, the abstract task (Art Description)
elicited lexical complexity and self-repair and the narrative task (Picture Story) elicited
structural complexity and self-repair.
5.1.1.3 Native speaker benchmarks
Table 5.7 presents descriptive statistics of production measures for the two pairs
of native speaker benchmarks. Differences across tasks can be seen by comparing
means. Firstly, three measures did not change across the three tasks: accuracy (error-
free clauses), fluency breakdown and self-repair. Accuracy did not change and was
consistently high (98-100% error-free clauses) regardless of the task. Fluency
breakdown and self-repair did not change as there were no instances of either long
pauses or error-repair found.

190
Five measures did change across tasks: lexical and structural complexity, speech
rate and fluency repair (repetition and reformulation). Between the Picture Story and
Art Description, structural complexity and fluency repair were lower on the Art
Description. Between the Picture Story and Information Gap structural and lexical
complexity were much lower and fluency repair and speech rate much higher on the
Information Gap. This was also true between the Art Description and Information Gap.
Comparisons with the NNS groups will be made in the between groups analysis in
Section 5.2.
Table 5.7
Descriptive statistics for spoken production measures across tasks for native speakers
Note: For pauses, repetitions and reformulations high values represent high fluency.
To sum up the findings for spoken production across tasks, there are significant
effects in terms of CAF and self-repair across the three task types. For both proficiency
groups differences were more marked between the interactional task (Information Gap)
and the other two tasks than between the narrative (Picture Story) and abstract task (Art
Description). In addition, for both proficiency groups the interactional task had a
Picture Story Art Description Information Gap M SD M SD M SD Accuracy error free clauses 98.28 3.45 100.00 .00 99.1 0.95 Complexity lexical complexity 68.04 19.36 70.30 14.87 49.92 7.02 structural complexity 2.20 1.76 1.78 0.45 1.31 0.24 Fluency speech rate 71.87 8.26 68.62 8.75 86.10 15.81 long pauses none - none - none - repetition 8.56 13.73 4.40 3.78 41.81 43.81 reformulation 9.30 13.30 5.74 3.54 25.07 27.13 Self-repair error-repair none - none - none -

191
positive impact on accuracy and fluency, the abstract task (Art Description) on lexical
complexity and the narrative task on structural complexity. For the low proficiency
group, the abstract and narrative tasks had a positive effect on self-repair. For native
speakers there was no difference in accuracy, self-repair or fluency breakdown across
tasks. However, as for the NNS groups, the interactional task had a positive effect on
fluency and the narrative and abstract tasks had a positive effect on lexical and
structural complexity.
5.1.2 Perceived strategy use across tasks
General to more detailed measures of PSU are presented and compared across
tasks in order to answer the research question, RQ2, concerned with differences in
perceived strategy use across tasks for EFL learners. The following analyses were
performed for the whole group and then each proficiency group independently. Unlike
the spoken production results, for perceived strategy use results from the whole sample
are included as they differed from the results of each proficiency group examined
separately, and help to explain the different patterns of strategy differences between
groups. Firstly, aggregated mean strategy use50 was calculated to compare the overall
level of strategy use across tasks. Then a comparison of strategy use according to the
five strategy categories, obtained from factor analysis was made, followed by a more
detailed comparison of individual strategies. These latter two analyses were made to
find out exactly which groups of strategies or which individual strategies were
associated with which task or task features and what proportion of the SQ strategies
differed across tasks.
50 All 44 strategies from the SQ grouped together.

192
5.1.2.1 Whole sample
By aggregating the forty-four strategies on the SQ, the overall level of strategy
use could be compared across tasks. As shown in the descriptive statistics in Table 5.8
aggregated mean strategy use ranged between 2.13 and 2.40, which was just below the
midpoint of the six-point rating scale which ranged from not at all (0) to a lot (5).
Strategy use was highest in the Information Gap and lowest in the Picture Story. The
Friedman test [chi square= 5.95, p= .05] showed that these differences were significant
and post-hoc Wilcoxon tests indicated that strategy use differed between the Art
Description and Information Gap [z= -2.50, p= .012] and between the Picture Story and
Information Gap [ z= -3.16, p= .002]. Strategy use was higher on the Information Gap
compared to both the Picture Story and Art Description.
Table 5.8
Descriptive statistics of aggregated strategy use (N=48)
Task M SD Picture Story 2.13b 1.39 Art Description 2.21c 1.36 Information Gap 2.40bc 1.37 Aggregated tasks 2.25 1.37 Significant difference (Wilcoxon, p < .05) between:
b - Picture Story and Information Gap c - Art Description and Information Gap
Next, an analysis of strategy use according to factor was conducted. Table 5.9
presents mean perceived strategy use of the five factors identified in the pilot study:
Interactional, Compensation, Conversation-flow Maintenance (CFM), Planning and
Evaluating strategies. A GLM (General Linear Model) repeated measures multivariate
analysis of variance (MANOVA) was performed to see if there were statistically
significant differences between the five strategy groups (dependent variables) across the
three tasks (independent variable). Initial assumptions testing was carried out to check

193
the data in terms of normality, linearity, univariate or multivariate outliers, homogeneity
of variance matrices and multicollinearity. No violations were noted.
Table 5.9
Descriptive statistics of strategy use according to factor (N=48)
Key: CFM-Conversation-Flow Maintenance Significant differences (MANOVA: Univariate tests + within-subjects-contrasts, p< .05) between:
b - Picture Story and Information Gap c - Art Description and Information Gap
Multivariate tests showed that globally task had a significant effect on the five
groups of strategies [Wilks’ Lambda= .53, F= 3.36, p= .003, partial eta squared= .47].
Univariate tests showed that this difference in strategy use was due to Interactional
[Sphericity Assumed p = .00, Greenhouse-Geisser p = .00, Huynh-Feldt p = .00, Lower-
bound p = .00] and Compensation strategies [Sphericity Assumed p = .02, Greenhouse-
Geisser p = .02, Huynh-Feldt p = .02, Lower-bound p = .05] whereas for CFM,
Planning and Evaluating strategies no differences were found.
Tests of within-subjects contrasts, shown in Table 5.10, indicated significant
differences between the Picture Story and Information Gap for Interactional and
Compensation strategies and between the Art Description and Information Gap for
Interactional strategies. By examining the means for each factor, as seen in Table 5.11,
it can be seen that Interactional and Compensation strategies were significantly higher
on the Information Gap compared to the Picture Story, and Interactional strategies were
significantly higher on the Information Gap compared to the Art Description.
Factor 1
Interactional* Factor 2
Compensation* Factor 3
CFM Factor 4 Planning
Factor 5 Evaluating
Task M SD M SD M SD M SD M SD
Picture Story 1.54b 1.48 2.06b 1.43 2.48 1.36 2.23 1.38 2.63 1.40 Art Description 1.74 c 1.41 2.18 1.40 2.73 1.31 2.23 1.28 2.68 1.37 Information Gap 2.03bc 1.39 2.30b 1.45 2.67 1.35 1.84 1.36 2.64 1.33 Aggregated tasks 1.77 1.43 2.18 1.43 2.63 1.34 2.10 1.34 2.65 1.37

194
Table 5.10
Results of tests of within-subjects contrasts (univariate 2 by 2)
Strategy group Task
comparison df
Mean square
F p Partial
Eta squared
Interactional PS vs AD 1 2.129 3.100 .085 .062 PS vs IG 1 17.752 16.200 .000* .256 AD vs IG 1 7.586 10.112 .003* .177 Compensation PS vs AD 1 .463 1.077 .305 .022 PS vs IG 1 3.837 7.337 .009* .135 AD vs IG 1 1.634 3.269 .077 .065 CFM PS vs AD 1 .044 .103 .749 .002 PS vs IG 1 .351 .534 .469 .011 AD vs IG 1 .643 1.874 .178 .038 Planning PS vs AD 1 .120 .150 .700 .003 PS vs IG 1 1.470 2.442 .125 .049 AD vs IG 1 2.430 3.402 .071 .068 Evaluating PS vs AD 1 .689 .693 .410 .015 PS vs IG 1 .105 .101 .752 .002 AD vs IG 1 .255 .306 .583 .006
Key: PS-Picture Story, AD-Art Description, IG–Information Gap, CFM-Conversation Flow Maintenance * Significant difference between tasks (p < .05)
The third analysis undertaken was with individual strategies. Table 5.11 shows
descriptive statistics for individual strategy use on the three tasks. Non-parametric tests
were conducted to examine if there were any significant differences across tasks for
these individual strategies.
Table 5.12 shows the results of the Friedman tests with mean ranks, chi square
and Asymp. sig. values for the individual strategies which showed significant
differences (p < .05) across the three tasks. Sixteen strategies (36% of SQ) showed a
significant difference: Items 1, 3, 7, 11, 17, 18, 20, 21, 23, 24, 25, 29, 30, 32, 33 and 34,
which are highlighted in grey in Table 5.11. As Items 11 and 33 were parallel items
coding for the strategy gesture, only fifteen different types of strategies actually varied
across tasks.

195
Table 5.11
Descriptive statistics for individual perceived strategy use (N=48). Picture Story Art Description Information Gap Strategy Item M SD M SD M SD 1. CFM (task familiarity) 3.25 1.67 2.02 1.84 2.52 1.96 2. P (advance organisation) 2.23 1.37 2.40 1.43 1.79 1.40 3. P (organisational planning) 1.98 1.44 2.19 1.14 1.60 1.35 4. (note taking) .47 1.06 .27 .84 .44 1.11 5. CFM (using expressions) 1.94 1.34 1.83 1.51 1.92 1.56 6. CFM (avoiding error) 2.94 .99 2.73 1.05 2.98 1.30 7. CFM (fillers) 2.10 1.55 2.71 1.56 2.13 1.47 8. C (risk taking) 3.00 1.07 3.04 1.24 3.29 1.11 9. P (directed attention) 3.96 1.03 3.69 1.01 3.96 .90 10. P (avoiding risk) 3.25 1.18 3.15 1.09 3.13 .98 11. CFM (gesture) 2.54 1.41 2.85 1.27 3.21 1.54 12. CFM (maintaining conversation) 3.10 1.04 3.23 1.08 3.17 .93 13. P (planning sentence structure) 2.19 1.28 2.44 1.17 2.25 1.23 14. I (clarification by speaking slower) 1.90 1.36 2.17 1.34 2.15 1.09 15. I (comprehension check) 1.50 1.52 1.77 1.48 2.17 1.51 16. I (clarification by circumlocution) 1.96 1.50 2.00 1.32 2.63 1.30 17. C (clarification by code switch) 1.13 1.41 1.56 1.64 1.92 1.84 18. I (clarificaiton by repetition) 1.90 1.59 2.17 1.46 2.90 1.24 19. I (asking to speak slower) 1.02 1.42 .94 1.21 1.00 1.03 20. I (clarification request) 1.35 1.44 1.92 1.58 2.38 1.65 21. I (asking for repetition) 1.46 1.52 1.70 1.47 2.34 1.56 22. I (feigning understanding) 1.23 1.40 1.31 1.52 .94 1.12 23. I (guessing) 1.57 1.53 1.90 1.48 2.42 1.53 24. I (expressing non-understanding) 1.13 1.48 1.42 1.51 1.81 1.53 25. I (interpretive summary) 1.46 1.38 1.52 1.29 2.48 1.53 26. CFM (self-repair) 3.13 1.33 3.00 1.19 3.02 1.14 27. C (appeal for help) 2.23 1.59 2.21 1.75 2.69 1.76 28. C (message abandonment) 2.94 1.51 2.98 1.28 3.29 1.35 29. C (code switching) 1.46 1.64 1.71 1.68 2.25 1.76 30. C (word coinage) 1.46 1.46 1.60 1.51 1.94 1.60 31. C (foreignising) 1.17 1.39 1.08 1.29 1.56 1.64 32. I (circumlocution) 2.08 1.38 2.52 1.43 3.35 1.21 33. CFM (as for Item 11) 2.23 1.45 2.63 1.42 3.00 1.40 34. C (long pause). 2.60 1.47 3.08 1.25 2.90 1.22 35. C (restructuring) 2.79 1.18 2.98 1.10 2.77 1.29 36. C (literal translation) 2.04 1.49 1.90 1.39 2.15 1.54 37. C (mumbling) 1.60 1.48 1.77 1.51 1.48 1.40 38. C (omission) 1.56 1.51 1.54 1.27 1.60 1.35 39. C (retrieval) 2.23 1.48 2.08 1.20 2.02 1.33 40. C (approximation) 2.85 1.40 2.90 1.48 3.17 1.06 41. E (other evaluation) 1.25 1.52 1.13 1.33 1.35 1.38 42. E (self evaluation) 3.33 1.24 3.17 1.34 3.21 1.25 43. E (identifying problems) 3.21 1.22 3.04 1.41 3.08 1.40 44. E (aspects to improve) 3.17 1.45 3.15 1.46 3.13 1.35 Key: I-Interactional, C-Compensation, CFM-Conversation-Flow Maintenance, P-Planning, E-Evaluating. Significant differences across tasks (Friedman, p< .05) are shaded in grey.

196
Table 5.12
Friedman tests for individual strategies showing significant differences (N=48).
Mean ranks Statistics
Strategy Item Picture Story
Art Description
Information Gap
Chi-square
df Asymp.
sig. 1 CFM (task familiarity) 2.36 ab 1.66 a 1.98 bc 17.04 2 .000 3 P (organisational planning) 2.06 2.23c 1.71c 9.588 2 .008 7 CFM (fillers) 1.80a 2.26ac 1.94c 7.406 2 .025 11 CFM (gesture) 1.73b 2.01 2.26b 8.979 2 .011 17 C (clarification by code switch) 1.74ab 2.00a 2.26b 10.25 2 .006 18 I (clarification by repetition) 1.68b 1.92c 2.41bc 17.56 2 .000 20 I (clarification request) 1.72ab 2.09a 2.19b 8.22 2 .016 21 I (asking for repetition) 1.71b 2.01c 2.28bc 10.65 2 .005 23 I (guessing) 1.82b 1.92c 2.27bc 6.79 2 .034 24 I (expressing non-understanding) 1.76b 2.03 2.21b 7.57 2 .023 25 I (interpretive summary) 1.77b 1.80c 2.43bc 17.79 2 .000 29 C (code switching) 1.74b 1.98c 2.28bc 11.61 2 .003 30 C (word coinage) 1.78b 1.96 2.26b 8.08 2 .018 32 I (circumlocution) 1.51ab 1.99ac 2.50bc 29.70 2 .000 33 CFM (gesture) 1.67ab 2.06a 2.27b 11.75 2 .003 34 C (long pause) 1.78a 2.23a 1.99 6.71 2 .035 Key: I-Interactional, C-Compensation, CFM-Conversation-Flow Maintenance, P-Planning, E-Evaluating. Significant difference (Wilcoxon, p< .05) between:
a = Picture Story and Art Description b = Picture Story and Information Gap c = Art Description and Information Gap
Wilcoxon tests indicated between which tasks significant differences lay. Table
5.13 shows the z scores and associated significance levels, presented as Asymp. sig. (2-
tailed). Non-significant results have been omitted from the table. Table 5.15 indicates
that between the Picture Story and Art Description there were seven significant
differences (16% of SQ). Six of these strategies were used more on the Art Description
as can be seen from the mean ranks in Table 5.12. These were Interactional:
clarification request (Item 20) and circumlocution (Item 32), Compensation:
clarification by code switching (Item 17) and long pause (Item 34) and CFM strategies:
fillers (Item 7) and gesture (Item 11/33). In contrast, task familiarity (Item 1) was
significantly less on the Art Description.

197
Table 5.13
Wilcoxon tests showing significant differences in individual strategies (N=48)
Picture Story & Art Description
Picture Story & Information Gap
Art Description & Information Gap
Strategy Item Z Asymp. sig. (2-tailed)
Z Asymp. sig. (2-tailed)
Z Asymp. sig. (2-tailed)
1. CFM (task familiarity) -4.06 .00 -2.10 .04 -1.87 .06* 3. P (organisational planning) -2.58 .01 7. CFM (use of fillers) -2.57 .01 -2.41 .02 11. CFM (gesture) -2.67 .01 17. C (clarification by code switch) 2.04 .04 -2.80 .01 18. I (clarification by repetition) -3.71 .00 -3.14 .01 20. I (clarification request) -2.09 .04 -3.28 .00 21. I (asking for repetition) -3.53 .00 -2.86 .06* 23. I (guessing) -2.84 .00 -2.17 .03 24. I (expressing non-understanding) -2.58 .01 25. I (interpretive summary) -3.48 .00 -3.48 .00 29. C (code switching) -3.71 .00 -2.32 .02 30. C (word coinage) -2.12 .04 32. I (circumlocution) -1.95 .05 -4.55 .00 -3.34 .00 33. CFM (gesture) -2.11 .03 -3.24 .00 34. C (long pause) -2.61 .01 Key: I-Interactional, C-Compensation, CFM-Conversation-Flow Maintenance, P-Planning, E-Evaluating. Level of significance: p< .05, * p< .1
The highest number of strategy differences, thirteen (30% of SQ), were found
between the Picture Story and Information Gap. Mean ranks in Table 5.12 show that
twelve of these strategies were used more on the Information Gap. Seven Interactional
strategies: clarification by repetition (Item 18), clarification request (Item 20), asking
for repetition (Item 21), guessing (Item 23), expressing non-understanding (Item 24),
interpretive summary (Item 25) and circumlocution (Item 32) as well as three
Compensation strategies: clarification by code switch (Item 17), code switching (Item
29) and word coinage (Item 30) and two CFM strategies: gesture (Items 11/33). In
contrast, task familiarity (Item 1) was lower on the Information Gap.
Between the Art Description and Information Gap there were seven significant
differences (p< .05) and two nearly significant differences (p< .1) (20% of SQ). Mean
ranks in Table 5.12 show that five strategies were used more on the Information Gap.

198
These were four Interactional strategies: clarification by repetition (Item 18), guessing
(Item 23), interpretive summary (Item 25) and circumlocution (Item 32) and one
Compensation strategy: code switching (Item 29). On the other hand, two strategies
were used more on the Art Description: organisational planning (Item 3) and fillers
(Item 7).
Table 5.14 sums up the results for the whole sample described from the three
perspectives: aggregated strategy use, groups of strategies and individual strategies. It
shows that: a) learners perceive using strategies most on the Information Gap, less on
the Art Description and least on the Picture Story, b) this increase in strategy use on the
Information Gap, according to the analysis by groups of strategies, was due to
Interactional and Compensation strategy types, and c) within these groups of strategies,
according to the analysis of individual strategies, the particular Interactional and
Compensation strategies which differed are the ones shown in Table 5.14, as well as
other strategies from the CFM and Planning strategy groups: task familiarity (Item 1),
fillers (Item 7), gesture (Item 11/33) and organisational planning (Item 3).
Despite these differences, it must also be recognised that they only represented
sixteen out of forty-four strategy items (36%) of the SQ, compared to 64%, which
remained stable across the three tasks. In pairwise comparisons between tasks, the
differences were for 16% (Picture Story & Art Description), 30% (Picture Story &
Information Gap) and 16% (Art Description & Information Gap) of strategies.
Therefore, in answer to RQ2, according to the oral communication strategy
questionnaire, there are some differences in strategy use across task types but the
majority of strategies do not vary.

199
Table 5.14
Summary of perceived strategy use for the whole sample (N=48)
Key: high = strategy use significantly higher, low = strategy use significantly lower, med = strategy use significantly different from other tasks, – = no significant difference in strategy use
As seen from the results for RQ2, 36% of the SQ strategies differed across task
types. Further comparisons were then made to see if low or high proficiency level
determined these results in any way. Differences are examined with high-proficiency
learners and then with low-proficiency learners. Once again a three level comparison is
presented of aggregated strategies, groups of strategies and individual strategies at each
proficiency level.
Picture Story
Art Description
Information Gap
Aggregated strategies low low high Groups of strategies Factor 1.Interactional low low high Factor 2.Compensation low - high Factor 3.CFM - - - Factor 4.Planning - - - Factor 5.Evaluating - - - Individual strategies Factor 1.Interactional Item 18 clarification by repetition low low high Item 20 clarification request low high high Item 21 asking for repetition low low - Item 23 guessing low low high Item 24 expressing non-understanding low - high Item 25 interpretive summary low low high Item 32 circumlocution low med high Factor 2. Compensation Item 17 clarification by code switch low high high Item 29 code switching low low high Item 30 word coinage low - high Item 34 long pause low high - Factor 3.CFM Item 1 task familiarity high low med Item 7 use of fillers low high low Item 11 gesture low - high Item 33 gesture low high high Factor 4. Planning Item 3 organisational planning - high low

200
5.1.2.2 High proficiency group
This section presents the results from analyzing the question, RQ2.1: Are there
differences across task types in perceived strategy use (measured by an oral
communication strategy questionnaire) for high proficiency learners? Table 5.15
presents the descriptive statistics for aggregated strategy use across tasks and
proficiency groups.
Table 5.15
Descriptive statistics for aggregated strategy use of high (N=24) and low (N=24)
proficiency groups
Task Proficiency M SD Picture Story High 1.97b 1.39 Low 2.29 1.34 Art Description High 2.07c 1.32 Low 2.35 1.35 Information Gap High 2.33bc 1.39 Low 2.46 1.30 Aggregated tasks High 2.13 1.37 Low 2.37 1.33 Significant difference (Wilcoxon, p < .05) between:
b - Picture Story and Information Gap
Aggregated strategy use for the high proficiency group was compared across
tasks by Friedman tests which revealed that there was a nearly significant difference
across tasks [Friedman: chi square= 5.44, p= .066]. This difference lay between the Art
Description and Information Gap [Wilcoxon: z= -2.04, p= .041] and the Picture Story
and Information Gap [Wilcoxon: z= -2.57, p= .010]. Strategy use was higher on the
Information Gap compared to the other two tasks for the high group.
Multivariate tests showed that there was a significant difference across tasks,
taking the five groups of strategies together [Wilks’ Lambda= .21, F= 5.36, p= .002,
partial eta squared= .79]. When the five groups of strategies were considered separately,

201
univariate tests showed that the difference was significant for Interactional strategies
[F= 14.707, p= .00 (sphericity assumed), partial eta squared= .39] and Planning
strategies [F= 3.55, p= .037 (sphericity assumed), partial eta squared= .13].
Table 5.16
Descriptive statistics of strategy use according to factor of high (N=24) and low (N=24)
proficiency groups
* significant difference (MANOVA + between subjects effects, p< .05) between proficiency levels. Significant difference (MANOVA: Univariate +within subjects contrasts, p< .05) between:
b Picture Story and Information Gap c = Art Description and Information Gap
In pairwise comparisons of tasks, tests of within-subjects contrasts showed that
these differences were between the Picture Story and Information Gap for Interactional
strategies [F(1,23 = 21.08), p= .00, partial eta squared= .478], Planning strategies
[F(1,23 = 8.75), p= .01, partial eta squared= .276] and Compensation strategies
[F(1,23 = 4.32), p= .05, partial eta squared= .158]. They were also between the Art
Description and Information Gap for Interactional strategies [F(1,23 = 13.75), p= .00,
partial eta squared= .374] and Planning strategies [F(1,23 =6.03), p= .02, partial eta
squared= .208].
By examining means for each factor in Table 5.16, it can be seen that
Interactional strategies were higher on the Information Gap compared to the Art
Factor 1
Interactional Factor 2
Compensation Factor 3
CFM Factor 4 Planning
Factor 5 Evaluating
Task Group M SD M SD M SD M SD M SD
Picture Story High 1.29b 1.08 1.79b .82 2.66 .79 2.83b .76 2.44 1.05 Low 1.70 1.07 2.37 .98 2.65 .74 2.62 .84 3.04a .76 Art Description High 1.55c .97 1.84* .84 2.63 .70 2.81c .66 2.65 1.07 Low 1.87 .87 2.51* .88 2.63 .77 2.73 .76 2.59a .89 Information Gap High 2.26bc .80 2.10b .86 2.80 .78 2.41bc .58 2.45 1.11 Low 1.95 .86 2.62 1.01 2.68 .87 2.68 .79 2.94 .81 Aggregated tasks High 1.70 1.03 1.91 .84 2.70 .75 2.68 .69 2.51 1.07 Low 1.84 .93 2.50 .95 2.65 .79 2.68 .79 2.86 .83

202
0
0,5
1
1,5
2
2,5
3
3,5
4
4,5
1 3 5 7 9 11 13 15 17 19 21 23 25 27 29 31 33 35 37 39 41 43
Strategy
Mea
n lev
el o
f use
Picture Story
Art Description
Information Gap
Description or Picture Story. Compensation strategies were also higher on the
Information Gap compared to the Picture Story and Planning strategies were lower on
the Information Gap compared to both Art Description and Picture Story.
Figure 5.3 illustrates individual strategy use for the high proficiency group
across the three tasks51.
Figure 5.3 Individual strategy use of high proficiency group across the three tasks
The results of Friedman and post-hoc Wilcoxon tests, summarised in Table 5.17
reveal that fifteen strategies (34% of SQ) were used significantly differently. Once
again, as these strategies included the parallel Items 11 and 33 for gesture, only fourteen
different types of strategies actually varied across tasks.
As can be seen in Table 5.17, between the Picture Story and Art Description
there were two differences: task familiarity (Item 1) was higher for the Picture Story and
circumlocution (Item 32) was higher for the Art Description.
51 Associated descriptive statistics can be found in Appendix O.

203
Table 5.17
Friedman tests showing significant differences in perceived strategy use of high
proficiency group (N=24)
Mean ranks Statistics
Strategy Item Picture Story
Art Description
Information Gap
Chi-Square df
Asymp. sig.
1. (task familiarity) 2.50 ab 1.54 a 1.96 b 15.20 2 .00 3. P (organisational planning) 2.15 b 2.29 c 1.56 bc 9.80 2 .01 11. CFM (gesture) 1.65 b 1.85 c 2.50 bc 11.87 2 .00 15. I (comprehension check) 1.69 b 2.00 2.31 b 7.03 2 .03 16. I (clarification by circumlocution) 1.67 b 1.85 c 2.48 bc 12.09 2 .00 18. I (clarification by repetition) 1.67 b 1.90 c 2.44 bc 10.17 2 .01 20. I (clarification request) 1.71 b 1.88 c 2.42 bc 8.00 2 .02 21. I (asking for repetition) 1.72 b 1.96 2.33 b 6.12 2 .05 23. I (guessing) 1.74 b 1.78 c 2.48 bc 10.40 2 .01 24. I (expressing non-understanding) 1.69 b 1.94 c 2.38 bc 8.86 2 .01 25. I (interpretive summary) 1.77 b 1.71 c 2.52 bc 13.27 2 .00 29. C (code switching) 1.81 b 1.81 c 2.38 bc 11.05 2 .00 30. C (word coinage) 1.63 b 1.90 c 2.48 bc 12.19 2 .00 32. I (circumlocution) 1.48 ab 2.04 abc 2.48 bc 15.24 2 .00 33. CFM (gesture) 1.61 b 1.93 c 2.46 bc 10.90 2 .00 Key: I-Interactional, C-Compensation, CFM-Conversation-Flow Maintenance, P-Planning, E-Evaluating. Significant difference (Wilcoxon, p< .05) between:
a - Picture Story and Art Description b - Picture Story and Information Gap c - Art Description and Information Gap
Between the Picture Story and Information Gap there were fifteen differences.
Item 1 (task familiarity) and Item 3 (organisational planning) were higher for the Picture
Story whereas nine Interactional, two Compensation (code switching and word coinage)
and two CFM strategies (gesture, Items 11 & 33) were used more on the Information
Gap.
Between the Art Description and Information Gap there were twelve strategy
differences. Planning (Item 3) was used more on the Art Description but the other
eleven strategies were used more on the Information Gap: seven Interactional, two
Compensation (code switching and word coinage) and gesture (Items 11 & 33).

204
Table 5.18
Summary of perceived strategy use for high proficiency group (N=24)
Key: high = strategy use significantly higher, low = strategy use significantly lower, med = strategy use significantly different from other tasks, – = no significant difference in strategy use
Table 5.18 sums up the results for the high proficiency group across tasks. It
shows that: a) high proficiency learners perceive using strategies significantly more on
the Information Gap, in line with the whole sample results; however, in contrast to the
whole sample, there was only a negligible difference in strategy use between the Picture
Story and Art Description; b) the increase in strategy use on the Information Gap was
due to higher use of Interactional and Compensation strategies, once again in line with
whole sample results; c) among Interactional and Compensation strategies, according to
the analysis of individual strategies, the particular strategies which differed were those
Picture Story
Art Description
Information Gap
Aggregated strategies - - - Groups of strategies Factor 1.Interactional low low high Factor 2.Compensation low - high Factor 3.CFM - - - Factor 4.Planning high high low Factor 5.Evaluating - - - Individual strategies Factor 1.Interactional Item 15 comprehension check low - high Item 16 clarification by
circumlocution low low high
Item 18 clarification by repetition low low high Item 20 clarification request low low high Item 21 asking for repetition low - high Item 23 guessing low low high Item 24 expressing non-
understanding low low high
Item 25 interpretive summary low low high Item 32 circumlocution low medium high Factor 2. Compensation Item 29 code switching low low high Item 30 word coinage low low high Factor 3.CFM Item 1 task familiarity high low low Item 11 gesture low low high Item 33 gesture low low high Factor 4. Planning Item 3 organisational planning high high low

205
shown in Table 5.18, as well as task familiarity (Item 1), gesture (Item 11/33) and
organisational planning (Item 3), which is also in line with whole sample results.
Again, despite the differences highlighted by Table 5.18, it must be recognised
that they only represented fifteen out of forty-four strategy items (34%) on the SQ,
compared to 66%, which remained stable across tasks. In pairwise comparisons between
tasks, differences were 4.5% (Picture Story & Art Description), 34% (Picture Story &
Information Gap) and 27% (Art Description & Information Gap). Therefore, in answer
to RQ2.1, according to an oral communication strategy questionnaire, high proficiency
learners perceived using strategies differently on an Information Gap task type
compared to a narrative (Picture Story) or abstract task (Art Description) but overall
these differences represented less than half of strategies on the SQ.
5.1.2.3 Low proficiency group
In this section the following research question is examined, RQ2.2: Are there
differences across task types in perceived strategy use (measured by an oral
communication strategy questionnaire) for low proficiency learners? For the low
proficiency group there was no significant difference [Friedman: chi square= 1.34, p=
.51] in aggregated strategy use across tasks, as comparisons of means in Table 5.15 in
the previous section suggest. Despite not being significantly different, the trend in
aggregated strategy use was in line with previous results for the whole sample and high
proficiency group: lowest in the Picture Story, higher in the Art Description and highest
in the Information Gap.
Descriptive statistics for groups of strategies can be seen in Table 5.16 in the
previous section. Means were compared for the low proficiency group, once again,
using repeated measures MANOVA. Preliminary assumptions testing was carried out

206
0
0,5
1
1,5
2
2,5
3
3,5
4
4,5
1 3 5 7 9 11 13 15 17 19 21 23 25 27 29 31 33 35 37 39 41 43
Picture Story
Art Description
Information Gap
with no violations for normality, linearity, univariate and multivariate outliers,
homogeneity of variance-covariance matrices. Multivariate tests showed that there was
no significant difference across tasks, taking the five groups of strategies together
[Wilks’ Lambda= .47, F= 1.59, p= .206, partial eta squared= .53].
Figure 5.4 illustrates individual strategy use for the low proficiency group across
the tasks52. Table 5.19 summarises results of the Friedman and post-hoc Wilcoxon tests.
These tests confirmed that only four strategies (9% of SQ), three Interactional and one
Compensation strategy, were used significantly differently across tasks for the low
group. Between the Picture Story and Art Description, two strategies, Item 20
(clarification request) and Item 34 (long pausing), were used more in the Art
Description. Between the Picture Story and Information Gap, two strategies, Item 18
(clarification by repetition) and Item 32 (circumlocution), were used more on the
Information Gap and between the Art Description and Information Gap, one strategy,
Item 34 (long pause), was used more in the Art Description.
Figure 5.4 Individual strategy use of low proficiency group across the three tasks
52 Associated descriptive statistics can be found in Appendix P.

207
Table 5.19
Friedman tests showing differences in perceived strategy use of low proficiency group
(N=24)
Mean ranks Statistics
Strategy Item Picture Story
Art Description
Information Gap
Chi-Square
df Asymp.
sig. 18. I (clarification by repetition) 1.69 b 1.94 c 2.38 bc 7.54 2 .02 20. I (clarification request) 1.73 a 2.31 a 1.96 6.75 2 .03 32. I (circumlocution) 1.54 b 1.94 c 2.52 bc 14.71 2 .00 34. C (long pause) 1.63 a 2.25 ab 2.13 b 8.13 2 .02 Key: I-Interactional, C-Compensation. Significant difference (Wilcoxon, p< .05) between:
a - Picture Story and Art Description b - Picture Story and Information Gap c - Art Description and Information Gap
To conclude from the low proficiency group results summarised in Table 5.20,
task had a negligible effect on the strategy repertoire of the low proficiency group, as
they generally perceived using strategies to the same extent across all three tasks.
Table 5.20
Summary of perceived strategy use for low group (N=24)
Key: high = strategy use significantly higher, low = strategy use significantly lower, med = strategy use significantly different from other tasks, – = no significant difference in strategy use
Picture Story
Art Description
Information Gap
Aggregated strategies - - - Groups of strategies Factor 1.Interactional - - - Factor 2.Compensation - - - Factor 3.CFM - - - Factor 4.Planning - - - Factor 5.Evaluating - - - Individual strategies Factor 1.Interactional Item 18 clarification by repetition low - high Item 20 clarification request low high - Item 32 circumlocution low - high Factor 2. Compensation Item 34 long pausing low high low

208
According to the analysis of individual strategies, the few strategies that did vary
(9%) were Interactional and Compensation strategies, which is in line with the whole
sample and high group results. Therefore in answer to RQ2.2, according to an oral
communication strategy questionnaire, for low proficiency learners there is negligible
difference in strategy use between an interactional (Information Gap), a narrative
(Picture Story) and an abstract task (Art Description).
5.1.2.4 Summary of perceived strategy use across tasks
Findings from the three-way comparisons, aggregated strategy use, groups of
strategies and individual strategies, for the whole group, the high group and the low
group across tasks can now be summarised. Aggregated strategy use showed us that the
extent of strategy use was generally low across all tasks and it was lowest on the Picture
Story, higher on the Art Description and highest on the Information Gap. Analysis of
low and high proficiency groups separately showed that this result was produced by
different patterns of strategy use from the respective groups. The high group had low
strategy use on the Picture Story and Art Description but used significantly more
strategies on the Information Gap whereas the low group had consistently higher
strategy use across all three tasks which did not differ very much.
Comparing groups of strategies it was seen that the higher strategy use on the
Information Gap was due to comparatively greater use of Interactional and
Compensation strategies by the high group. It also showed that this group used Planning
strategies significantly more on the Picture Story and Art Description.
Individual strategy use confirmed which particular Interactional and
Compensation strategies were used more by the high proficiency group on the
209
Information Gap and also showed that this was accompanied by less organisational
planning and more gesture.
It is worth highlighting one final point. As will be recalled, for the high group
34% of strategies differed compared to 9% for the low group across tasks. In such a
case we would expect to find fewer than 34% differences in strategy use when
considering the whole group, as the differences created by the high group would be
diluted by the few differences of the low group. However, this was not the case. When
considering the larger whole sample, the result revealed more differences (36%), which
must have meant that the low group were also varying their strategy use across tasks
and contributing to this higher result. In fact, by comparing individual PSU means for
the low group (see Appendix P) there were several strategies where differences existed
(Items 1, 7, 15, 21, 24, 25, 31, 40) but which had not reached significance.
5.2 Between-groups comparisons
So far spoken production and perceived strategy use have been compared across
the three tasks, for both high and low proficiency groups separately, and pairwise
comparisons (Picture Story-Art Description, Picture Story-Information Gap, Art
Description-Information Gap) have revealed between which tasks differences exist and
in which direction. However, comparisons between low and high proficiency groups on
each task have not been made. In this section a description of between-groups
differences in spoken production and strategy use are given in order to answer RQ3,
concerned with differences between low and high proficiency learners’ spoken
production and perceived strategy use. Firstly, differences in spoken production
measures will be presented followed by strategy use.

210
5.2.1 Spoken production between proficiency groups
Spoken production by high and low proficiency groups was compared and set
against the production measures of NS benchmarks in order to answer RQ3.1: Are there
differences between low and high proficiency learners’ spoken production (measured in
terms of complexity, accuracy, fluency and self-repair)? Table 5.21 and Figures 5.3, 5.4
and 5.5 present the means for high and low proficiency groups and native speakers on
each of the three tasks. As will be recalled, the inclusion of NS benchmarks was to
assess how each of the spoken measures was differentiating between proficiency
groups.
Table 5.21
Descriptive statistics for spoken production measures for native speakers, high and low
proficiency groups
Note: For pauses, repetitions and reformulations high values represent high fluency. * Significant difference between low and high groups (Mann-Whitney, p<.05)
Picture Story Art Description Information Gap NS
(N=4) High
(N=24) Low
(N=24) NS High Low NS High Low
Accuracy error free clauses 98.28 70.26* 42.60* 100.00 74.05* 47.44* 99.18 81.04* 54.62* Complexity lexical complexity 68.04 47.13* 32.00* 70.30 55.27* 35.87* 49.92 40.54* 29.21* structural complexity 2.20 2.49* 1.81* 1.78 1.85* 1.41* 1.31 1.27* 1.20* Fluency speech rate 71.87 50.73* 33.79* 68.62 51.75 32.74* 86.10 54.37* 33.82* long pauses 18 4.15 7.50 36.25 18.64 13.35 60.25 28.46 16.92 repetition 8.56 3.04 4.46 4.40 4.65* 2.77* 41.81 7.54 9.05 reformulation 9.30 7.86 6.84 5.74 7.18 8.19 25.07 13.09 16.30 Self-repair error-repair none 12.80 10.71 none 8.38 7.52 none 11.79* 3.37*

211
Spoken Production on Picture Story
0 20 40 60 80 100
Error freeclauses
Lexicalcomplexity
Structuralcomplexity
Speech rate
Long pauses
Repetition
Reformulation
Error repair
Acc
urac
yC
ompl
exity
Flu
ency
Sel
fre
pair
Pro
du
ctio
n m
easu
res
Mean
Low
High
Native Speaker
Spoken Production on Art Description
0 20 40 60 80 100
Error freeclauses
Lexicalcomplexity
Structuralcomplexity
Speech rate
Long pauses
Repetition
Reformulation
Error repair
Acc
urac
yC
ompl
exity
Flu
ency
Sel
fre
pair
Pro
du
ctio
n m
easu
res
Mean
Low
High
Native Speaker
Figure 5.5 Picture Story: spoken production for low, high and native speakers
Figure 5.6 Art Description: spoken production for low, high and native speakers

212
Spoken Production on Information Gap
0 20 40 60 80 100
Error freeclauses
Lexicalcomplexity
Structuralcomplexity
Speech rate
Long pauses
Repetition
Reformulation
Error repair
Acc
urac
yC
ompl
exity
Flu
ency
Sel
fre
pair
Pro
du
ctio
n m
easu
res
Mean
Low
High
Native Speaker
Figure 5.7 Information Gap: spoken production for low, high and native speakers
Significant differences between measures for high and low proficiency groups
on each task were established with Mann-Whitney tests, presented in Table 5.22. These
tests showed that there were significant differences between low and high proficiency
groups for accuracy, complexity and speech rate measures on all three tasks. As can be
seen in Figures 5.3, 5.4 and 5.5, in all three tasks accuracy, lexical complexity,
structural complexity and speech rate were consistently lower for the low proficiency
group. In contrast, there was no significant difference in fluency breakdown between
groups on any task. As for fluency repair, there was only a difference between groups
on the Art Description, where the high group were more fluent as they used
significantly less repetition. As for self-repair, the high group used significantly more
on the Information Gap.
Therefore, in answer to RQ3.1, there are differences between high and low
proficiency groups’ spoken production measures, with accuracy, lexical complexity,

213
structural complexity and speech rate being consistently higher for the high group on all
tasks. However, there were fewer differences between proficiency groups in terms of
fluency breakdown, fluency repair and self-repair.
Table 5.22
Mann-Whitney tests for high and low proficiency groups
Picture Story Art Description Information Gap
Z Asymp. Sig.
(2-tailed) Z Asymp. Sig.
(2-tailed) Z Asymp. Sig.
(2-tailed) Accuracy error free clauses -5.37 .00* -5.37 .00* -5.46 .00* Complexity lexical complexity -3.79 .00* -4.58 .00* -4.12 .00* structural complexity -3.22 .00* -2.85 .00* -2.33 .02* Fluency speech rate -4.45 .00 -4.60 .00 -4.93 .00* long pauses -1.84 .07 -1.16 .25 - .32 .75 repetition -2.10 .56 -2.10 .04* - .39 .70 reformulation -.70 .48 -1.08 .28 .62 .95 Self-repair error-repair -.21 .84 -.04 .97 -3.42 .00* * Level of significance (Mann-Whitney, p< .05)
Setting these results against the native speaker benchmarks, Figures 5.3, 5.4 and
5.5 show that the native speakers did not self-repair or make long pauses on any task.
They scored higher in most fluency measures, accuracy and lexical complexity than
both NNS groups but scored lower than the high group on structural complexity on the
Picture Story and Art Description. They also reformulated more than both NNS groups
on the Art Description.
5.2.2 Perceived strategy use between proficiency groups
Comparisons of perceived strategy use are now examined between proficiency
groups to answer RQ3.2: Are there differences between low and high proficiency
learners’ perceived strategy use (measured by an oral communication strategy

214
Aggregated Strategy Use
0
0,5
1
1,5
2
2,5
3
Picture Story Art Description Information Gap
Task
PS
U High
Low
questionnaire)? As seen from the descriptive statistics for aggregated PSU, illustrated in
Figure 5.8, between-groups comparisons show that strategy use was higher for the low
group on all three tasks. However, Mann-Whitney tests, shown in Table 5.23 below,
revealed that these differences were not significant (p< .05).
Figure 5.8. Aggregated PSU across tasks of high (N=24) and low (N=24)
proficiency groups
Table 5.23
Mann-Whitney tests comparing aggregated strategy use of high (N=24) and low (N=24)
proficiency groups
Picture Story Art Description Information Gap Mann-Whitney U 199.50 214.00 252.00 Wilcoxon W 499.50 514.00 552.00 Z -1.83 -1.53 -.75 Asymp. Sig. (2-tailed) .07* .13 .46 * Nearly significant difference between proficiency groups
In Table 5.16 (p.201) the descriptive statistics for groups of strategies were
presented for both proficiency groups. A one-way between-groups MANOVA was
conducted to examine if these differences were significant. The five dependent variables

215
were the strategy groups: Interactional, Compensation, CFM, Planning and Evaluating
and the independent variable was proficiency level. Preliminary assumptions testing
found no violations for normality, linearity, univariate and multivariate outliers,
homogeneity of variance-covariance matrices. Multivariate tests showed that there was
a significant main effect on strategy use [Wilks’ Lambda= .46, F= 2.46, p= .016, partial
eta squared= .54] when the five groups of strategies and three tasks were considered
together. Subsequently, when the five groups of strategies were considered separately,
tests of between-subjects effects, using a Bonferroni53 adjusted alpha level of p< .01,
showed that the difference between high and low proficiencies was only significant for
Compensation strategies on the Art Description [F(1,46=7.308), p= .01, partial Eta
squared= .137]. Comparing the means for Compensation strategy use on this task in
Table 5.18 (p.204), strategy use was significantly higher for the low proficiency group.
Individual strategies were examined to find out exactly which particular
Compensation strategies differed. Figures 5.9, 5.10 and 5.11 illustrate mean individual
strategy use for low and high proficiency groups on the Picture Story, Art Description
and Information Gap, respectively54.
Mann-Whitney tests, as seen in Table 5.24, confirmed individual strategy
differences between the two proficiency groups. There were eight strategy differences
on the Picture Story, six on the Art Description and seven on the Information Gap. In
other words, between 14% and 18% of the SQ strategies differed significantly between
proficiency groups.
53 Pallant (2005) recommends using the Bonferroni adjustment to reduce the chance of a Type I error (finding a significant result when in fact there isn’t one). The simplest version of the Bonferroni is to divide the original alpha level of .05 by the number of dependent variables. In this case 5 dependent variables were examined; therefore .05 divided by 5 gave the new alpha level of .01. 54 As will be recalled descriptive statistics of individual strategies for high and low groups are in Appendix N and O, respectively.
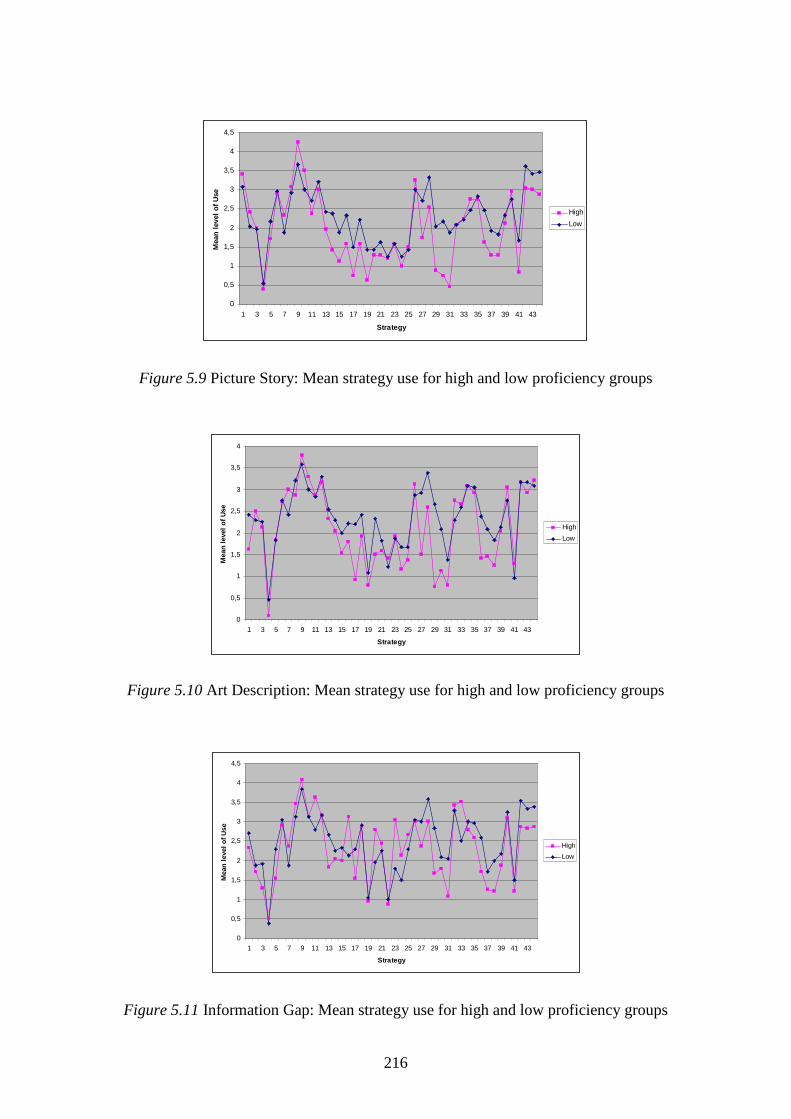
216
0
0,5
1
1,5
2
2,5
3
3,5
4
4,5
1 3 5 7 9 11 13 15 17 19 21 23 25 27 29 31 33 35 37 39 41 43
Strategy
Mea
n l
evel
of
Use
High
Low
0
0,5
1
1,5
2
2,5
3
3,5
4
1 3 5 7 9 11 13 15 17 19 21 23 25 27 29 31 33 35 37 39 41 43
Strategy
Mea
n le
vel
of
Use
High
Low
0
0,5
1
1,5
2
2,5
3
3,5
4
4,5
1 3 5 7 9 11 13 15 17 19 21 23 25 27 29 31 33 35 37 39 41 43
Strategy
Mea
n l
evel
of
Use
High
Low
Figure 5.9 Picture Story: Mean strategy use for high and low proficiency groups
Figure 5.10 Art Description: Mean strategy use for high and low proficiency groups
Figure 5.11 Information Gap: Mean strategy use for high and low proficiency groups

217
Figures 5.9, 5.10 and 5.11 indicate the direction of these differences showing
that the low proficiency group perceived using the majority of these strategies more on
all three tasks, which fits with previous results obtained for aggregated strategy use.
Table 5.24
Mann-Whitney tests for strategy use between high and low proficiency groups
Picture Story Art Description Information Gap Strategy Item
z Asymp sig. (2-tailed)
z Asymp sig. (2-tailed)
z Asymp sig. (2-tailed)
11. CFM (gesture) -2.09 .04 13. P (planning sentence structure) -2.26 .02 14. I (clarification by speaking slower) -2.48 .01 16. I (clarification by circumlocution) -2.63 .01 17. C (clarification by code switch) -2.43 .02 -2.58 .01 19. I (asking to speak slower) -1.99 .05 23. I (guessing) -2.57 .01 27. C (appeal for help) -2.13 .03 -2.77 .01 28. C (message abandonment) -2.18 .03 29. C (code switching) -2.87 .01 -4.26 .00 -2.35 .02 30. C (word coinage) -3.21 .00 -2.02 .04 31. C (foreignising) -3.59 .00 -2.16 .03 33. CFM (gesture) -2.41 .02 36. C (literal translation) -2.34 .02 41. E (other evaluation) -2.07 .04 Key: I-Interactional, C-Compensation, CFM-Conversation-Flow Maintenance, P-Planning, E-Evaluating. Non-significant results have been omitted from the table.
To follow the description of individual strategy differences the reader may find
it easier to refer to Table 5.25, which summarises the results for between-groups
differences. On the Picture Story the low proficiency group used all eight strategies
more. These were Interactional: speaking slower (Item 14) and asking to speak slower
(Item 19), Compensation: clarification by code switch (Item 17), appeal for help (Item
27), code switching (Item 29), word coinage (Item 30) and foreignising (Item 31) and
other evaluation (Item 41).
On the Art Description, the low proficiency group again used all six strategies
more. These were all Compensation strategies: clarification by code switch (Item 17),

218
appeal for help (Item 27), message abandonment (Item 28), code switching (Item 29),
word coinage (Item 30) and literal translation (Item 36).
Table 5.25
Summary of between-group differences
Picture Story
Art Description
Information Gap
Aggregated strategy use - - - Strategy groups Factor 1.Interactional - - - Factor 2.Compensation - Low group - Factor 3.CFM - - - Factor 4.Planning - - - Factor 5.Evaluating - - - Individual strategies Factor 1.Interactional Item 14 clarification by speaking
slower Low group - -
Item 16 clarification by circumlocution High group Item 19 asking to speak slower Low group - - Item 23 guessing - - High group Factor 2. Compensation Item 17 clarification by code switch Low group Low group - Item 27 appeal for help Low group Low group - Item 28 message abandonment - Low group - Item 29 code switching Low group - - Item 30 word coinage Low group Low group Item 31 foreignising Low group Low group Low group Item 36 literal translation - Low group - Factor 3.CFM Item 5 use of expressions - - Low group Item 11 gesture - - High group Item 33 gesture - - High group Factor 4.Planning Item 13 planning sentence structure - - Low group Factor 5. Evaluating Item 41 other evaluation Low group - - Key: Low group = strategy use was significantly higher for the low proficiency group
High group = strategy use was significantly higher for the high proficiency group - = no significant differences between proficiency groups
On the Information Gap, the low proficiency group used three strategies more:
use of expressions (Item 5), thinking of sentence structure (Item 13) and foreignising
(Item 31) and the high proficiency group used four strategies more: gesture (Item 11/
33), clarification by circumlocution (Item 16) and guessing (Item 23).

219
Table 5.25 sums up the between-groups comparison, showing that there were
few differences between high and low proficiency groups in strategy use on any task
and the few differences were mainly for Compensation strategies (five on the Picture
Story and six on the Art Description) where the low group used them more. All in all, in
answer to RQ3.2, according to an oral communication strategy questionnaire, there are
very few differences (18% of SQ, maximum) between the strategy use of high and low
learners on the three task types: interactional (Information Gap), a narrative (Picture
Story) and an abstract task (Art Description).
5.3 Summary of across-task and between-groups comparisons
5.3.1 Spoken production
Summing up the findings for spoken production across tasks and between groups,
firstly, there seem to be more differences across tasks. Across tasks, the Information
Gap task distinguishes itself from the other two tasks, eliciting more accuracy and
fluency from NNS and more fluency from NS. The Picture Story and Art Description
are more similar in terms of spoken production measures, the former eliciting structural
complexity and the latter lexical complexity from both NNS groups and NS
benchmarks. One distinguishing feature of the low proficiency group is that these two
tasks also favoured self-repairs.
Between proficiency groups there are also differences in spoken production and
the magnitude of difference is high, mainly consistently higher accuracy, lexical
complexity, structural complexity and speech rate for the high group across all tasks. In
comparison to NS benchmarks, NNS were less fluent overall, less accurate and less
lexically complex, but they were sometimes more structurally complex and more fluent
in terms of reformulating less.

220
As some spoken production measures differed across tasks, even in some cases
for native speakers, it does imply that the particular task features influenced the type of
spoken performance which took place. Therefore, further analysis of the strategies
which differed across the tasks and between proficiency groups would enrich our
understanding of which task features could be involved and how these features affect
strategy use for learners of different proficiency.
5.3.2 Perceived strategy use
The findings from the across-task and between-groups analysis of PSU are now
summarised. Tables 5.26 and 5.27 summarise the across-tasks and between-groups
findings respectively.
Table 5.26
Number of individual strategy differences across tasks
Picture Story & Art Description
Picture Story & Information Gap
Art Description & Information Gap
High proficiency 2 15 12 Low proficiency 2 2 1
As can be seen from the across-task differences in Table 5.26, there were few
differences between the Picture Story and Art Description for both groups. On the
Information Gap, the high group increased their use of strategies compared to the other
two tasks but the low groups’ strategy use barely differed.
Table 5.27
Number and direction of individual strategy differences between groups
Picture Story Art Description Information Gap High proficiency 4 Low proficiency 8 6 3

221
In the between-groups analysis summarised in Table 5.27, it can be seen that the
low groups’ strategy use was higher, particularly on the first two tasks. Although this
difference didn’t reach significance for aggregated strategy use, it was significant for 8
and 6 individual strategies on the Picture Story and Art Description respectively,
manifested as higher use of mainly Compensation strategies. These combined results
suggest that the high groups’ Compensation strategy use is low on both Picture Story
and Art Description whereas the low groups’ Compensation strategy use is high on both
tasks, resulting in few differences across tasks but differences between groups. On the
Information Gap both groups increase their strategy use, resulting in across task
differences for the high group but there were no between-groups differences because the
low groups’ level of use of these strategies was already high.
In fact, as seen in aggregated strategy use, shown in Figure 5.8 (p.214), it was
not only the high group that increased their strategy use but both groups; strategy use
being lowest on the Picture Story, higher on the Art Description and highest on the
Information Gap, although not all of these differences were significant. This explains
why more differences were found for the whole sample (36%) than for the low (9%)
and high groups (34%) analysed separately.
5.4 Perceived strategy use versus actual strategy use
In order to answer the fourth research question, RQ4: Does perceived strategy
use (measured by an oral communication strategy questionnaire) reflect actual strategy
use (measured in task performance and according to stimulated recall comments) for
low and high proficiency learners? actual strategy use (ASU) was measured and
compared with PSU. As results for PSU had shown that there were some differences in
Compensation strategy use between groups, the two proficiency groups were considered

222
separately from the beginning. Firstly, a description is provided of how PSU and ASU
were compared across tasks. Then, results for each proficiency group are presented in
terms of the number of consistencies, discrepancies and unconfirmable strategies
between PSU on the SQ and ASU. Finally, differences in strategy use across tasks and
between groups are re-assessed in light of these new findings.
5.4.1 Comparing PSU and ASU
In Chapter 4 an explanation was provided of how individual strategies from the
SQ were identified as ASU, either in task performance data or stimulated recall
comments (Table 4.16). Examples of how all the strategies were identified can be found
in Appendix N. As will be recalled, twenty-nine out of the forty-four strategies were
quantifiable by identifying discrete instances in task transcripts and coding them
(labelled as task coding in Table 4.16). Descriptive statistics were calculated for ASU
for the high and low proficiency groups (see Appendix Q and R respectively) and
compared with descriptives for PSU. The quantifiable strategies were from three of the
five strategy groups as follows: Interactional strategies (all twelve strategies): Items 14-
25 and Item 32, Compensation strategies (thirteen out of fourteen strategies): Item 17,
Items 27-31 and Items 34-40, and CFM strategies (four out of eight strategies): Item 6
(avoiding errors), Item 7 (use of fillers), Item 11 (gesture) and Item 26 (self-repair).
The remaining unquantifiable strategies (14) were identified by task observation,
in pre-task planning or in the comments from the stimulated recall group. They were
classified as low-, medium- or high-use strategies by comparing their relative use across
the three tasks within each proficiency group55. These values were then compared with
55 PSU was reported on the SQ on a 6-point scale ranging from not at all (0) to a lot (5). However, for ASU, as described, means could not be calculated for all the strategies. For this reason statistical correlations could not be made in the comparison of PSU and ASU.

223
the trends in mean PSU across tasks, as illustrated in the next section. Unquantifiable
strategies included all the Planning (Items 2, 3, 9, 10 and 13) and Evaluating (Items 41-
44) strategies, the three remaining CFM strategies (Items 1, 5 and 10), one
Compensation strategy: Item 8 (risk taking), and Item 4 (note-taking), which had not
been included in any factor.
Taking into account the difficulty of self report for oral communication, a
certain level of inconsistency with ASU was expected. As indicated by the second pilot
study, examining the interpretation of the rating scale on the SQ (see Chapter 4 Section
4.2.1.2), participants were reluctant to mark the top of the scale for some strategies,
even though they had used a particular strategy a lot. It also showed that learners
marked a 1 rather than a 0 for other strategies, even when they hadn’t used them. This
information was taken into consideration so that, if the mean level of PSU was between
0-1.99, it was considered Low, means between 2 and 3 were considered Medium and
means above 3 were considered High.
Results from the comparison of PSU and ASU are summarised in Tables 5.33
and 5.34 for high and low proficiency groups, respectively. The tables show the three
possible conclusions reached: that a strategy was consistent with PSU, that a strategy
was discrepant with PSU or that a strategy was unconfirmable. The following examples
illustrate how these classifications were reached.
5.4.1.1 Consistency
For quantifiable strategies, PSU and ASU was classed as consistent when the
means followed the same trends across tasks, as in the following two cases:

224
1) There was no change in PSU or ASU and the extent of strategy use (low, medium or
high) matched.
For example, for the low proficiency group for feigning understanding (Item 22)
both PSU and ASU was low (see Table 5.28) and did not change significantly across
tasks, so this item was classed as consistent.
Table 5.28
Low Group: PSU versus ASU for Item 22
Picture Story Art Description Information Gap M M M PSU 1.25 1.21 1 ASU 0 0 .04
2) There was a difference in PSU and ASU across tasks and this difference across tasks
matched.
For example, for the high group for gesture (Item 11/33) strategy use was lowest
in the Picture Story and highest in the Information Gap (see Table 5.29). This was also
true for ASU. As these general trends across tasks matched, gesture was also classed as
consistent.
Table 5.29
High Group: PSU versus ASU for Item 11 / 33
Picture Story Art Description Information Gap M M M PSU (Item 11) 2.38 2.88 3.63 PSU (Item 33) 2.25 2.67 3.52 ASU 3.54ab 11.71ac 32.29bc Significant difference (Friedman-Wilcoxon) p< .05 between:
a - Picture Story and Art Description b - Picture Story and Information Gap c - Art Description and Information Gap

225
For unquantifiable strategies, the extent of strategy use observed was compared
to PSU means in the following ways. For example for Item 4 (note taking) for the low
group, PSU was low and did not change significantly across tasks. ASU, identified in
observation of pre-task planning, confirmed that ASU was also low across tasks (see
Table 5.30), as none of the participants made extensive notes in doing the task. At most,
a few learners noted down some key words. Therefore, this strategy was classified as
consistent.
Table 5.30
Low Group: PSU versus ASU for Item 4
Picture Story Art Description Information Gap M M M PSU .54 .46 .38 ASU* low low low * task observation of note taking
5.4.1.2 Discrepancy
For quantifiable strategies, means for PSU and ASU were classed as discrepant
if there was a difference between the level of ASU or PSU on each tasks and if the
trends across tasks differed.
For example, for the low group, for use of fillers (Item 7), PSU was lower on the
Art Description than the other two tasks, but ASU was significantly higher on the Art
Description, contradicting PSU results (see Table 5.31). Therefore, PSU was classed as
discrepant with ASU for Item 7.

226
Table 5.31
Low Group: PSU versus ASU for Item 7
Picture Story Art Description Information Gap M M M PSU 1.88 1.47 1.88 ASU .04a .83 a .21 Significant difference (Wilcoxon) p< .05 between:
a - Picture Story and Art Description
For unquantifiable strategies, they were classed as having a discrepancy if the
information provided in the data sources contradicted the trends in means for PSU
across tasks. For example for the low group, for risk taking (Item 8), the mean level of
PSU was medium to high (2-3) with no significant differences between tasks (see Table
5.32). ASU, however, measured in terms of the number of recall comments referring to
risk-taking, indicated most risk-taking on the Art Description (9 comments) compared
to the Information Gap (6 comments) and Picture Story (4 comments) . Therefore, Item
8 was classed as having a discrepancy.
Table 5.32
Low Group: PSU versus ASU for Item 8
Picture Story Art Description Information Gap M M M PSU 2.92 3.21 3.13 ASU* low high medium * recall comments referring to risk taking
5.4.1.3 Unconfirmable
Finally, strategies were unconfirmable if they could not be reliably identified in
the qualitative data or if they were identified but insufficient data was available to make

227
comparisons across tasks. An example is using expressions (Item 5). Task transcripts
were examined for collocations and set expressions and very few were found,
particularly for the low group. Furthermore, it was impossible to know if expressions
had been used strategically, in a conscious way, in an effort to sound more native-like or
whether the expressions had been used unconsciously, as part of the learner’s normal
repertoire of language. Only one recall comment confirmed that a high participant had
used an expression strategically on the Picture Story:
Task
*IGN: so as they did everything they could imagine they could do in the
hotel they er spent the rest of the: honeymoon burning time til the: the: plane
took them home back home because because of the: Tom's state
Recall
Researcher: What were you thinking here?
Student: to burn time I I thought of it before saying and I look for a
sentence where I could put it because it sounds great to me.
5.4.2 High and low proficiency: PSU versus ASU
Firstly, results are presented for the high proficiency group. Table 5.33 shows
that PSU was consistent with ASU for 28 strategies (63% of SQ), extent of strategy use
was unconfirmable for 5 (11.5% of SQ) and there were discrepancies for 11 (25% of
SQ) strategies. The high group were consistent in reporting some strategies that did not
change across tasks: eight strategies that they didn’t use or rarely used: note taking
(Item 4), Interactional (Items 14, 19), Compensation (Items 22, 36, 37, 38) and other

228
Table 5.33
ASU:PSU consistency for high proficiency group Strategy ASU:PSU Extent of strategy use *1. (task familiarity) consistent High in PS, Low in AD 2. P (advance organisation) consistent Low *3. P (organisational planning) consistent Low in IG 4. (note taking) consistent Low 5. CFM (using expressions) unconfirmable *6.CFM (avoiding errors) discrepancy ASU difference not reflected: ASU low in PS,
medium in AD, high in IG, PSU medium 7. CFM (use of fillers) discrepancy ASU overestimated: ASU low, PSU medium, 8. C (risk taking) unconfirmable 9. P (directed attention) consistent High 10. P (avoiding risk) unconfirmable *11/33. CFM (gesture) consistent Low in PS, High in IG 12. CFM (maintaining the conversation) unconfirmable 13. P (thinking of sentence structure) unconfirmable 14. I (speaking slower) consistent Low *15. I (confirmation check) consistent Low in PS, High in IG *16. I (clarification by paraphrase) consistent Low in PS & AD, High in IG 17. C (clarification by code switch) discrepancy ASU: PSU inconsistent: ASU low, PSU high in IG *18.I (clarification by repetition) consistent High in IG 19.I (ask to speak slower) consistent Low *20. I (clarification request) consistent High in IG 21. I (asking for repetition) consistent High in IG 22. I (feigning understanding) consistent Low *23. I (guessing) consistent High in IG *24 I (expressing non understanding) consistent High in IG 25. I (interpretive summary) discrepancy ASU: PSU inconsistent: ASU low, PSU high in IG 26.CFM (self-repair) consistent Medium *27. C (appeal for help). discrepancy ASU difference not reflected: ASU high in IG *28. C (message abandonment) discrepancy ASU difference not reflected: ASU high in IG *29. C (code switching) consistent High in IG 30. C (word coinage) discrepancy ASU: PSU inconsistent:
ASU low, PSU high in IG *31. C (foreignising) discrepancy ASU difference not reflected: ASU high in IG *32. I (circumlocution) consistent High in IG *33. As for Item 11 consistent Low in PS, High in IG *34. C (long pausing) discrepancy ASU difference not reflected: ASU high in IG 35. C (restructuring) consistent Medium 36. C (literal translation) consistent Low 37. C (mumbling) consistent Low 38. C (omission) consistent Low *39. C (retrieval) discrepancy ASU difference not reflected: high in PS and AD *40. C (approximation) discrepancy ASU difference not reflected: ASU low in PS, high
in IG 41. E (other evaluation) consistent Low 42. E (self-evaluation) consistent High 43. E (problem identification) consistent High 44. E (aspects to improve) consistent High Key: PS- Picture Story, AD- Art Description, IG – Information Gap. ASU:PSU consistencies are shaded in grey. * Differences in ASU across tasks 56 56 For quantifiable strategies differences across tasks were established using Friedman-Wilcoxon tests and for unquantifiable strategies differences were established from transcripts and recall comments. In total 20 strategies differed out of 44 strategies on the questionnaire.

229
evaluation (Item 41), two medium-use strategies, self-repair and restructuring (Items
26 and 35) and three high-use Evaluating (Item 42, 43, 44) strategies.
The high group were also accurate in reporting differences in strategy use across
tasks even when the extent of strategy use was quite low. There were 14 strategies that
differed and were reported accurately: task familiarity (Item 1), Planning (Items 2, 3, 9)
gesture (Items 11/33), Interactional (Items 15, 16, 18, 20, 21, 23, 24, 32) and code
switching (Item 29).
Nevertheless, there were discrepancies for 11 strategies, 7 of which did not
change across tasks but differences in ASU were found. These strategies were avoiding
error (Item 6, CFM) and Compensation strategies: appeal for help (Item 27), message
abandonment (Item 28) foreignising (Item 31), long pause (Item 34), retrieval (Item 39)
and approximation (Item 40). The remaining 4 discrepancies were inconsistencies,
where ASU across tasks did not follow the same pattern as PSU. These strategies were
the use of fillers (Item 7), clarification by code switching (Item 17) interpretive
summaries (Item 25) and word coinage (Item 30).
Results from the low proficiency group are presented in Table 5.34, which
shows that, for the low group, PSU was consistent with ASU for 21 out of 44 strategies
(48% of SQ), there were discrepancies for 19 (43% of SQ) strategies and extent of
strategy use was unconfirmable for 4 (9% of SQ).
The low group were consistent in reporting ten low-use strategies: Planning
(Item 3), note taking (Item 4), Interactional (Items 14, 19, 21, 22, 23), Compensation
(Items 37, 38) and other evaluation (Item 41). They were also consistent for two
medium-use strategies: message abandonment and code switching (Items 28, 29,
Compensation) and four high-use strategies directed attention (Item 9, Planning) and
Evaluating (Items 42, 43, 44). They were also consistent in reporting five strategy

230
Table 5.34
ASU:PSU consistency for low proficiency group Strategy ASU:PSU Extent of Strategy Use *1. (task familiarity) discrepancy ASU difference not reflected: ASU low in AD *2. P (advance organisation) consistent High in AD, Low in IG & PS 3. P (organisational planning) consistent Low 4. (note taking) consistent Low 5. CFM (using expressions) unconfirmable *6.CFM (avoiding errors)
discrepancy ASU difference not reflected: ASU high in IG, med in AD, low in PS
*7. CFM (use of fillers) discrepancy Overestimate of ASU: ASU low, PSU medium *8. C (risk taking) consistent ASU: Low in PS, High in AD 9. P (directed attention) consistent High 10. P (avoiding risk) unconfirmable *11/33. CFM (gesture) discrepancy ASU difference not reflected: ASU high in AD & IG 12. CFM (maintaining the conversation) unconfirmable 13. P (thinking of sentence structure) unconfirmable 14. I (speaking slower) consistent Low *15. I (confirmation check) discrepancy ASU difference not reflected: ASU high in AD *16. I (clarification by paraphrase) discrepancy ASU difference not reflected: ASU high in IG *17. C (clarification by code switch) consistent High in AD & IG *18.I (clarification by repetition) consistent Low in PS, High in IG 19.I (ask to speak slower) consistent Low *20. I (clarification request) discrepancy ASU: PSU inconsistent:
ASU high in IG, PSU high in AD 21. I (asking for repetition) consistent Low 22. I (feigning understanding) consistent Low 23. I (guessing) consistent Low *24 I (expressing non understanding) discrepancy ASU difference not reflected:
ASU high in AD & IG *25. I (interpretive summary) discrepancy ASU: PSU inconsistent: ASU low, PSU high in IG *26.CFM (self-repair) discrepancy ASU difference not reflected: ASU high in AD *27. C (appeal for help). discrepancy ASU difference not reflected: ASU high in IG & AD 28. C (message abandonment) consistent Medium 29. C (code switching) consistent Medium 30. C (word coinage) discrepancy ASU overestimated: ASU Low, PSU Medium, *31. C (foreignising) discrepancy ASU difference not reflected: ASU, high in IG *32. I (circumlocution) consistent Low in PS & AD, High in IG *33. As for Item 11 discrepancy ASU difference not reflected: ASU high in AD & IG *34. C (long pausing) discrepancy PSU High in AD, ASU in PS *35. C (restructuring) discrepancy ASU difference not reflected: ASU high in IG *36. C (literal translation) discrepancy ASU difference not reflected: ASU high in AD 37. C (mumbling) consistent Low 38. C (omission) consistent Low *39. C (retrieval) discrepancy ASU difference not reflected: ASU high in PS & AD *40. C (approximation) discrepancy ASU overestimated: ASU low & higher in AD, PSU:
high 41. E (other evaluation) consistent Low 42. E (self-evaluation) consistent High 43. E (problem identification) consistent High 44. E (aspects to improve) consistent High Key: PS- Picture Story, AD- Art Description, IG – Information Gap. ASU:PSU consistencies are shaded in grey. * Differences in ASU across tasks 57
57 For quantifiable strategies differences across tasks were established using Friedman-Wilcoxon tests and for unquantifiable strategies differences were established from transcripts and recall comments. In total 22 strategies differed out of 44 different strategies on the questionnaire.

231
differences across tasks in advance organisation (Item 2, Planning), Compensation
(Items 8, 17) and Interactional (Items 18, 32) strategies.
In terms of the nineteen discrepancies, thirteen were differences in ASU which
were not reflected by PSU, as little difference in PSU was observed across tasks. These
strategies were task familiarity (Item 1), the CFM strategies: avoiding error (Item 6),
gesture (Item 11/33) and self-repair (Item 26), the Interactional strategies:
comprehension check (Item 15), clarification by circumlocution (Item 16), expressing
non-understanding (Item 24) and the Compensation strategies: appeal for help (Item
27), foreignising (Item 31), restructuring (Item 35), literal translation (Item 36) and
retrieval (Item 39).
The further six discrepancies were that the low group overestimated use of fillers
(Item 7), word coinage (Item 30) and approximation (Item 40) and differences across
tasks were inconsistent for interpretive summary (Item 25), clarification request (Item
20) and long pause (Item 34).
In answer to RQ4, perceived strategy use (measured by an oral communication
strategy questionnaire) reflects at least half of the actual strategy use (measured in task
performance and according to stimulated recall comments) both low and high
proficiency learners employ: 63% for the high group and 48% for the low group. These
strategies included all the very low - use strategies, Planning strategies, Evaluating
strategies and code switching for both groups. The high group were also consistent in
reporting eight Interactional strategies, as well as gesture, self-repair and restructuring
and the low group were consistent in reporting two Interactional strategies as well as
message abandonment. Strategies which showed discrepancies for both groups were
mainly differences in strategy use across the three tasks which had not been gauged with
the questionnaire. Finally, strategies which could not be confirmed with the dataset

232
were the CFM strategies: use of expressions and maintaining the conversation and
Planning strategies: risk taking, avoiding risks, and thinking of sentence structure.
5.4.3 Reassessing PSU results
As the focus of this study was to describe differences in strategy use across tasks
as precisely as possible, the discrepancies found in PSU as a result of the analysis of
ASU for each proficiency group needed to be taken into consideration before further
interpretation of strategy differences could be made. This involved readjusting the PSU
results across task for each proficiency group in three ways: 1) adding the strategies
which differed according to ASU, 2) removing strategies which had been found to differ
significantly according to PSU, but which had not actually differed and 3) changing the
direction of difference for strategies which had been found to differ significantly, but
where PSU and ASU were inconsistent. The readjusted strategy differences across tasks
can be seen in Tables 5.41 and 5.42 for high and low proficiency groups, respectively
and between-group differences can be seen in Table 5.43.
Firstly, for the quantifiable strategies, aggregated ASU and PSU were consistent,
as Table 5.35 indicates. ASU was low across the three tasks ranging between 0.55 and
2.56 strategies per task, which was in line with aggregated PSU, just below the midpoint
of the SQ rating scale, ranging from 1.54 to 2.37, indicating generally low strategy use.
Table 5.35
Aggregated ASU and PSU for quantifiable strategies (N=48)
Picture Story Art Description Information Gap M SD M SD M SD High ASU .55 0.91 1.04 2.34 2.56 6.30 PSU 1.54 0.66 1.75 0.72 2.21 0.79 Low ASU .68 1.04 1.49 2.64 1.71 3.44 PSU 2.37 0.72 2.41 0.72 2.22 0.88

233
In terms of individual strategies, for the high proficiency group, as will be
recalled from Section 5.1.2.2, fifteen strategies (34% of SQ) differed across the three
tasks according to PSU, whereas according to ASU twenty strategies (45%) differed.
This meant that seven items were added to the list of strategy differences across tasks
and two items were removed (see Table 5.41 for the readjusted strategy differences).
The added items were six Compensation strategies: retrieval, long pause, appeal for
help, message abandonment, foreignising, approximation and one CFM strategy,
avoiding error and the items removed were interpretive summary and word coinage.
For the low proficiency group, as will be recalled from Section 5.1.2.3, only four
strategies (9% of SQ) differed significantly across the three tasks according to PSU,
whereas according to ASU twenty-two strategies (50%) differed. This meant that
eighteen strategies were added to the list and the direction of difference across tasks was
changed for two strategies (see Table 5.42 for the readjusted strategy differences). The
strategies added were advance organisation, four Interactional strategies: interpretive
summary, comprehension check, clarification by circumlocution, expressing non-
understanding, eight Compensation strategies: clarification by code switching retrieval,
foreignising, restructuring, literal translation, appeal for help, risk taking and
approximation five CFM strategies: task familiarity, use of fillers, self-repair, avoiding
error, gesture and the strategies whose direction of difference across tasks changed
were clarification request and long pause.
As for between-group differences, six perceived differences were removed
(Items 14, 19, 23, 31, 5, 13: clarification by speaking slower, asking to speak slower,
guessing, foreignising, use of expressions, planning sentence structure) and three
strategy differences were added: use of fillers, self-repair and clarification request as

234
seen in Table 5.43 ( See also Appendix T for significant differences in quantifiable ASU
between groups).
5.5 Additional results
Results of further variations between tasks and groups are presented in this
section, specifically on pre-task planning time, task duration and learners’ perceptions
of the tasks. This data may complement the findings for spoken production or strategies
analyzed in previous sections.
5.5.1 Pre-task planning
As will be recalled the strategy advance organisation (Item 2) was
operationalised as pre-task planning time. It was measured from the moment the
participants received the task material to when they began the task. Table 5.36 shows
means and standard deviations for pre-task planning time and Figure 5.12 illustrates
differences between means for each group. The high group took about half the time to
plan each task on average compared to the low group and this was significant for the
Picture Story [Mann-Whitney: Z= -2.35 and Asymp. sig. (2-tailed) p= .02] and Art
Description Part 1 [Mann-Whitney: Z= -2.11 and Asymp. sig. (2-tailed) p= .03].
Figure 5.12 shows that there was very little difference in planning time between the
high proficiency group and native speakers.
Comparing planning time across tasks, Figure 5.12 shows that all groups took
the most time to plan the first part of the Art Description and the least time to plan the
second part of this task, compared to the other tasks. For the low group, the difference
in planning time between the first and second parts of the Art Description was
significant, with longer planning for the first part [Friedman: chi square= 8.16 df(3)

235
Pre-task Planning
020406080
100120140160
Picture Story ArtDescription1
ArtDescription 2
InformationGap
Sec
on
ds
LowHighNative Speakers
p=.04, Wilcoxon: Z= -2.04, p= .04] but for the high group there was no significant
difference in planning time between tasks globally [Friedman: chi square= 6.66 df(3) p=
.08].
Planning time across tasks ranged from 35.5 to 70.17 seconds for the high group,
similar to native speakers (36 to 63 seconds) and from 68.54 to 137.93 seconds for the
low group, altogether not exceeding more than 2.5 minutes.
Table 5.36
Mean pre-task planning time in seconds
Picture Story Art Description Information Gap
Group M SD Part 1
M
SD Part 2
M SD M SD Low proficiency 106* 64.85 138*a 119.99 69 a 63.97 112 107.34 High proficiency 58* 61.02 70* 49.42 36 17.97 54 35.55 Native Speaker 36 5.66 63 33.94 37 22.63 38 4.95 Note. NS= Native Speaker *- significant difference between high and low groups (Mann Whitney-U, p< .05) a- significant difference (Friedman-Wilcoxon, p< .05) between Part 1 and Part 2 Art Description
Figure 5.12 Pre-task planning time for low, high and native speakers
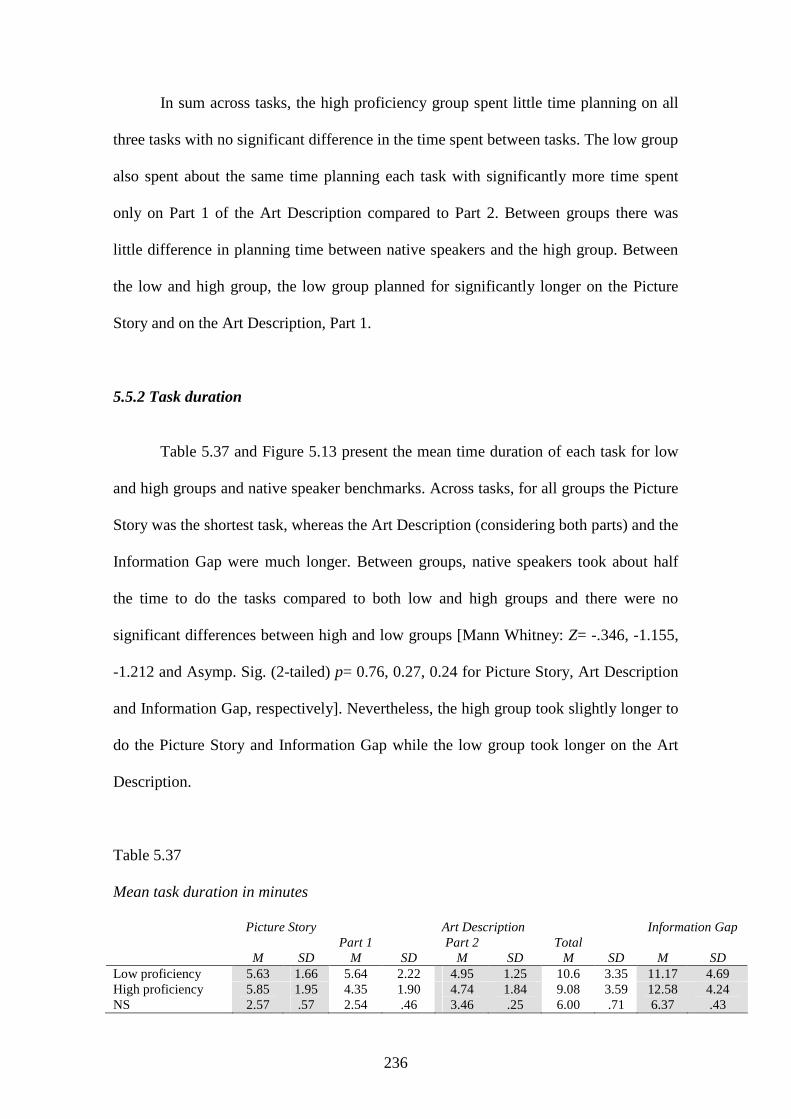
236
In sum across tasks, the high proficiency group spent little time planning on all
three tasks with no significant difference in the time spent between tasks. The low group
also spent about the same time planning each task with significantly more time spent
only on Part 1 of the Art Description compared to Part 2. Between groups there was
little difference in planning time between native speakers and the high group. Between
the low and high group, the low group planned for significantly longer on the Picture
Story and on the Art Description, Part 1.
5.5.2 Task duration
Table 5.37 and Figure 5.13 present the mean time duration of each task for low
and high groups and native speaker benchmarks. Across tasks, for all groups the Picture
Story was the shortest task, whereas the Art Description (considering both parts) and the
Information Gap were much longer. Between groups, native speakers took about half
the time to do the tasks compared to both low and high groups and there were no
significant differences between high and low groups [Mann Whitney: Z= -.346, -1.155,
-1.212 and Asymp. Sig. (2-tailed) p= 0.76, 0.27, 0.24 for Picture Story, Art Description
and Information Gap, respectively]. Nevertheless, the high group took slightly longer to
do the Picture Story and Information Gap while the low group took longer on the Art
Description.
Table 5.37
Mean task duration in minutes
Picture Story Art Description Information Gap
M SD Part 1
M
SD Part 2
M
SD Total
M
SD
M
SD Low proficiency 5.63 1.66 5.64 2.22 4.95 1.25 10.6 3.35 11.17 4.69 High proficiency 5.85 1.95 4.35 1.90 4.74 1.84 9.08 3.59 12.58 4.24 NS 2.57 .57 2.54 .46 3.46 .25 6.00 .71 6.37 .43

237
Task Duration
0
2
4
6
8
10
12
14
Picture Story Art DescriptionPart 1
Art DescriptionPart 2
Information Gap
Min
ute
s Low
High
Native Speakers
Figure 5.13 Mean task duration for low, high and native speakers
5.5.3 Learners’ perceptions of the tasks
As will be recalled, learners’ perceptions of the tasks were obtained from their
responses to the Reflective Questionnaire (RQ) after each task had been performed.
This was in case learners’ perceptions could account for possible variation in strategy
and spoken production results and also to validate the assumptions made about task
complexity. As described in the previous chapter, task complexity was predicted to be
greatest on the Art Description.
First, within-group comparisons are described followed by between-group
comparisons. Table 5.38 shows descriptive statistics for the high group. Friedman tests
showed that there was a significant difference across tasks for task difficulty [Chi-
Square=16,244, df(2), p=.04]. Post-hoc Wilcoxon tests showed that this difference was
between the Picture Story and Art Description [ Z= -2.245, Asymp. sig.= 0.02]. By
comparing means in Table 5.38, it can be seen that the high proficiency group perceived
the Art Description to be significantly more difficult than the Picture Story.

238
Table 5.38
Task perception for high proficiency group (N=24)
Picture Story Art Description Information Gap M SD M SD M SD Task Difficulty: easy (0) – difficult (7) 2.58a 1.69 4.00 a 1.78 3.42 1.77 Anxiety: relaxed (0) – anxious (7) 2.67 1.81 3.05 1.86 2.79 1.98 Interest: interesting (0)-boring (7) 2.96 2.12 3.02 2.07 2.52 1.60 Self Efficacy: I did well (0)-I did badly (7) 3.58* 1.53 3.86 1.46 3.50 1.64 Future Motivation: motivated (0)–not motivated (7) 2.46 2.04 2.86 1.93 2.35 1.83 *Significant difference (Mann Whitney, p< .05) between low and high proficiency groups. Significant difference (Friedman-Wilcoxon Tests, p< .05) between: a - Picture Story and Art Description
For the low group, descriptive statistics are presented in Table 5.39. Friedman
tests showed that there was a significant difference across tasks for task difficulty [Chi-
Square=16.800, df(2), p= .00]. Post-hoc Wilcoxon tests showed differences were
significant between the Picture Story and Art Description [ Z= -3.69, Asymp. sig.= .00]
and between the Art Description and Information Gap [ Z= -2.73, Asymp. sig. = .01].
By comparing means in Table 5.39, it can be seen that the low proficiency group found
both the Picture Story and Information Gap significantly easier than the Art Description.
Table 5.39
Task perception for low proficiency group (N=24)
Picture Story Art Description Information Gap M SD M SD M SD Task Difficulty: easy (0) – difficult (7) 3.33a 1.17 4.82 ac 1.47 3.54 c 1.64 Anxiety: relaxed (0) – anxious (7) 3.88 2.23 3.77 2.09 3.33 2.06 Interest: interesting (0)-boring (7) 2.79 1.64 3.00 1.38 3.04 1.78 Self Efficacy: I did well (0)-I did badly (7) 4.79* 1.47 4.55 1.63 3.75 1.78 Future Motivation: motivated (0)–not motivated (7) 2.54 2.00 2.23 2.00 2.33 1.66 *Significant difference (Mann Whitney, p< .05) between low and high proficiency groups. Significant difference (Friedman-Wilcoxon Tests, p< .05) between: a - Picture Story and Art Description c–Art Description and Information Gap

239
Stimulated recall comments from all eight (4 low and 4 high) participants in the
sub-sample supported these results for task difficulty. Task transcripts of native
speakers also confirmed learners’ perceptions that the Art Description was difficult.
These excerpts are representative of the causes of difficulty that learners identified in
the tasks:
Picture Story
(1) Recall (High Proficiency)
MiGu0103: yes, this was the easiest, yes it was the easiest of all because there were
things like here, where you can see the vocabulary in the pictures and it’s not
difficult and if you saw something and you didn’t know it, well ,you just
didn’t say it and that was it.
(2) Recall (High Proficiency)
Researcher: so this was definitely the easiest (Picture Story)
BeGa0103: yes maybe because the activity was familiar.
Art Description
(3) Recall (Low Proficiency)
Researcher: was it really difficult?
NaAl0202: yes first you had to think about what you were imagining then you had to
think of it in Spanish and then turn it into English and then say it correctly.
Researcher: of course a lot of steps
NaAl0202: yes a lot of steps in too little time.
(4) Recall (High Proficiency)
BeGa0202: First I thought I’ve got no idea about art and when you have to do
something like this and you don’t know even in Spanish the vocabulary so in
English it’s really difficult to think about what you have to say.

240
On the Information Gap stimulated recall comments from three of the four
participants in the high group referred to the overall difficulty of the task whereas the
low group commented about difficulty of comparing particular pictures but there were
no comments about the overall task difficulty, except for the following participant, who
found the task easy:
Information Gap
(5) Recall 1(Low Proficiency)
GeMu0303: No I didn’t think it was that difficult you had to compare certain words but
more or less.
(6) Recall 2 (High Proficiency)
MiGu0202: After the activity I thought it was a lot more difficult that I had imagined.
You see the pictures and you think oh it’s easy but when you do it you realise
that we lacked a lot of vocabulary a lot a lot. They are like little kiddie pictures
and you can’t describe them and you feel useless because it’s not easy.
Between-groups comparisons were made with Mann-Whitney tests. One
difference in task perception was found on the Picture Story. As can be seen by
comparing the means in Tables 5.38 and 5.39, the high group reported higher self
efficacy [Mann-Whitney: Z= -2.70 and Asymp. sig. (2-tailed) p= .01] on the Picture
Story. Otherwise, there were no significant differences between groups.
The following conclusions can be made from the RQ results: 1) for both groups,
the Picture Story was the easiest task and the Art Description was the most difficult one,
which confirms the predictions made before the study was carried out, 2) the
Information Gap posed some difficulty for the high group compared to the Picture Story
whereas the low group perceived it to be equally easy and, 3) self efficacy was higher
on the Picture Story for the high group.

241
5.6 The Strategy Questionnaire as a predictor of spoken production
So far, spoken performance has been described in terms of spoken production
measures and strategy use on three different tasks. The last question that remains is
RQ5: How well does perceived strategy use on the Strategy Questionnaire (measured as
five strategy groups) predict spoken production (measured as eight spoken production
measures)? as it provides a measure of the predictive power of the SQ. Multiple
regression was carried out to find out how much variance in the eight spoken production
measures could be explained by the five strategy groups on the SQ and which strategy
group was the best predictor of which spoken measure. A standard multiple regression
was carried out for each spoken production measure on each task. The five strategy
groups were the independent variables and each spoken production measure the
dependent variable. Assumptions testing showed that the data did not violate
assumptions of multicolinearity and that there were no major deviations in terms of
outliers, normality, linearity, homoscedasticity and independence of residuals. Standard
multiple regression gives rise to a model with an R square value that explains how
much variance in the data is explained by the model. As the sample size was small, the
adjusted R square value is presented, which corrects the possible overestimation by the
R square of the true population value. Results are presented in Table 5.40. By using the
enter method, it shows that a significant model emerged for lexical complexity,
accuracy and speech rate on each task, as shown in the column labelled Model (p< .05) .
On the Picture Story the five strategy groups on the SQ predict 15% (Adjusted R
square = .15 x 100) of the variance in lexical complexity, 21% of the variance in
accuracy and 31% of speech rate. Of the 5 strategy groups, Compensation strategies
(beta = -.36, p= .02) make the strongest unique contribution of 10.9% [Part correlation
coefficient: (.33 x .33) x 100] to the variance in lexical complexity. As the B value is

242
Table 5.40
Summary of multiple regression analysis (N=48)
Model Adjusted R
square.
Unstandardised B
coefficient
Standardized Coefficient
ß
Sig.
Part correlation coefficient
Unique contribution
Picture Story Lexical Complexity
F5,42=2.61, p < 0.04
.15
Compensation: -5.25
-.36 .02 -.33 10.9%
Accuracy F5,42=3.51, p < 0.01
.21 Compensation: -2.28
-.35 .02* -.32 10.2%
Evaluating: -1.79
-.28 .06* -.26 6.8%
Speech rate F5,42=3.11 p < 0.03
.31 Compensation: -8.66
-.56 .02 -.45 20.2%
Planning: -7.21
-.43 .03 -.40 16.0%
Art Description Lexical Complexity
F5,42=6.19, p < 0.00
.36 Compensation: -9.27
-.56 .00 -.45 20.2%
CFM: 6.23
.30 .03 .26 6.8%
Planning: 5.43
.25 .04 .24 5.8%
Accuracy F5,42=3.35, p < 0.01
.20 Compensation: -9.48
-.49 .00 -.39 15.2%
Speech rate F5,42=3.34, p < 0.01
.20 Compensation: -7.27
-.45 .01 -.36 13.0%
Information Gap Lexical Complexity
F5,42=6.04, p < 0.00
.35 Interactional: 4.92
.42 .00 .35 12.3%
Compensation: -5.79
-.56 .00 -.49 24.0%
Evaluating: -2.77
-.28 .04 -.24 5.8%
Accuracy F5,42=3.79, p < 0.01
.23 Compensation: -8.37
-.47 .00 -.41 16.8%
Speech rate F5,42=2.72, p < 0.03
.15 Compensation: -6.02
-.39 .02 -.34 11.6%
negative it means that the more Compensation strategies learners perceive using, the
lower their lexical complexity will be. Compensation and Evaluating strategies account
for 10.2% and 6.8% of the unique variance in accuracy, respectively. Again, as values
are negative it means that the more learners perceive using Compensation and
Evaluating strategies, the lower their accuracy will be. In addition, Compensation and
Planning strategies account for 20.2% and 16% of the unique variance in speech rate,
with the more Compensation and Planning strategies perceived, the slower the speech.

243
On the Art Description the SQ predicts 36% of lexical complexity, 20% of
accuracy and 20% of speech rate. For lexical complexity, Compensation strategies make
the strongest unique contribution of 20.2%, followed by CFM strategies with 6.8% and
Planning strategies with 5.8%. Once again, the B value for Compensation strategies is
negative, therefore the more Compensation strategies the less lexical complexity. In
contrast, the B value for CFM and Planning strategies is positive, so the more use of
these strategies, the more lexical complexity. Again for accuracy and speech rate
Compensation strategies predict 15.2% and 13% of unique variance, respectively, with
the more Compensation strategies perceived, the less accuracy and the slower the
speech.
On the Information Gap the SQ predicts 35% of lexical complexity, 23% of
accuracy and 15% of speech rate. Lexical complexity is predicted uniquely by
Compensation (24%), Interactional (12.3%) and Evaluating (5.8%) strategies and
accuracy and speech rate are predicted by Compensation strategies (16.8% and 11.6%,
respectively). The more learners report using Interactional strategies and the less they
report Evaluating and Compensation strategies, the higher the lexical complexity. Also,
as for the other tasks, the less they report using Compensation strategies the higher the
accuracy and faster the speech.
Concluding from the findings of the regression analysis, the SQ is a weak
predictor of three of the eight spoken production measures on all of the three tasks:
lexical complexity (15-36%), accuracy (20-23%) and speech rate (15-31%).
Furthermore, the SQ seems to be a better predictor of these measures on tasks where
more strategies are used (Art Description and Information Gap). However, the SQ does
not predict structural complexity, fluency breakdown (pausing), fluency repair
(repetition and reformulation) or self-repair in any way. Compensation strategies make

244
the strongest unique contributions in predicting lexical complexity, accuracy and speech
rate. In other words, the more frequently learners perceive using Compensation
strategies the lower their accuracy, lexical complexity and speech rate is likely to be.
5.7 Chapter summary
This chapter has presented the across-task comparisons for spoken production
and PSU, for both high and low proficiency groups. Comparisons of spoken production
and PSU were also made between proficiency groups. The extent to which PSU reflects
ASU was described for each proficiency group and the potential of the SQ to predict
spoken production was then analysed. In this section a summary of the most relevant
results is provided.
Firstly, the findings for PSU versus ASU are addressed as further strategy
comparisons are made, taking these results into account. PSU was consistent with ASU
for 48% of strategies for the low group and 63% of strategies for the high group. In
other words the SQ accurately reflected at least half of the strategies learners employed.
When differences across tasks and between groups were reassessed in light of these
results, it was confirmed that, on the whole, strategy use was indeed generally low, as
learners had perceived and more differences were found across tasks. For the high group
there were actual differences for 20 strategies (compared to 15 strategies on the SQ) and
for the low group there were 22 strategies (compared to 4 strategies on the SQ). The
between-groups analysis of PSU revealed some discrepancies with ASU but confirmed
that there was little difference in strategy use between proficiency groups on any one
task.
Results which, so far, have been presented separately are now brought together.
Table 5.41 and Table 5.42 combines the across-task differences in strategy use, spoken

245
production and additional results for the high and low proficiency groups, respectively,
and Table 5.43 presents the between-groups differences.
For the high group, as shown in Table 5.41, the Picture Story was the most
familiar, the easiest and shortest task. Compared to the Information Gap, the use of
Interactional, and Compensation strategies and gesture was low and organisational
planning was medium. Structural complexity was highest on this task, lexical
complexity was medium and accuracy and fluency were low.
In contrast, the Art Description was the least familiar, the most difficult and took
longer compared to the Picture Story. The use of Interactional and Compensation
strategies was also mainly low, although there were more comprehension checks and
expressions of non-understanding. Organisational planning was medium, as for the
Picture Story, but gesture was higher on this task. Lexical complexity was highest in
this task, structural complexity and fluency were medium and accuracy was low.
The Information Gap was more familiar and easier than the Art Description but
less familiar and more difficult than the Picture Story. The task took about as long as the
Art Description and so was longer compared to the Picture Story. The contrast with this
task compared to the others was that Interactional, Compensation strategies and gesture
were all highest and organisational planning was lowest. This was accompanied by
high accuracy and fluency and low structural complexity and lexical complexity.

246
Table 5.41 High proficiency: summary of significant differences across tasks
Level of strategy use Additional Results Strategies Spoken Production
Factor 1 Interactional Factor 2 Compensation
Factor 3 CFM Factor 4 Planning
Picture Story High retrieval* long pause*
task familiarity structural complexity
Medium organisational planning lexical complexity
Low task difficulty task duration
comprehension check clarification by circumlocution clarification by repetition clarification request asking for repetition guessing expressing non-understanding circumlocution
code switching appeal for help* message abandonment* foreignising* approximation*
gesture avoiding error*
accuracy fluency
Art Description High task difficulty task duration
comprehension check
retrieval* lexical complexity
Medium expressing non-understanding long pause* avoiding error* gesture
organisational planning structural complexity fluency
Low
clarification by circumlocution clarification by repetition clarification request asking for repetition guessing circumlocution
code switching appeal for help* message abandonment* foreignising*
task familiarity accuracy
Information Gap
High task duration
comprehension check clarification by circumlocution clarification by repetition clarification request asking for repetition guessing expressing non-understanding circumlocution
code switching appeal for help* message abandonment* foreignising* approximation*
gesture avoiding error*
accuracy fluency
Medium task difficulty task familiarity
Low retrieval* long pause*
organisational planning structural complexity lexical complexity
*strategy differences found in ASU, Strategies in italics overlap with spoken production measures
247
Table 5.42 shows that there are many similarities to the high group in the results
for the low group across tasks, particularly on the Picture Story and Information Gap.
As for the high group, the Picture Story was the most familiar and easy. On the whole,
Interactional and Compensation strategies and gesture were used to a lesser extent
compared to the Information Gap. Structural complexity and self-repair were high while
lexical complexity, accuracy and fluency were low. Differences with the high group
were that self-repair was high compared to the Information Gap, advance organisation
was medium and risk-taking was low compared to the Art Description.
The Art Description was the least familiar, most difficult and longer task
compared to the Picture Story, as for the high group. The low group used a few more
Interactional and Compensation strategies and risk-taking was higher compared to the
Picture Story. As for the Picture Story, advance organisation was medium. In terms of
spoken production, lexical complexity and self-repair were high, structural complexity
medium and accuracy and fluency low. Self-repair was higher than on the Information
Gap and fluency was low, as for the Picture Story.
The Information Gap was also more familiar than the Art Description, as for the
high group. Interactional, Compensation strategies and gesture were highest on this task
accompanied by high accuracy and fluency and low lexical complexity, structural
complexity and self-repair. The low group perceived this task as equally easy as the
Picture Story. Advance organisation was low compared to the Art Description and
Picture Story and risk taking was medium, more than the Picture Story but less than the
Art Description.

248
Table 5.42 Low proficiency: summary of significant differences across tasks
Level of strategy use
Additional Results
Strategies Spoken Production
Factor 1 Interactional Factor 2 Compensation Factor 3 CFM Factor 4 Planning Picture Story
High long pause, retrieval* task familiarity* self-repair*
structural complexity self-repair
Medium
advance organisation (pre-task planning time)
Low task difficulty task duration
comprehension check* clarification by circumlocution* clarification by repetition clarification request* expressing non understanding* circumlocution
foreignising*, restructuring* literal translation*, clarification by code switch, appeal for help*, approximation*, risk taking
avoiding error* use of fillers* gesture*
lexical complexity accuracy fluency
Art Description
High task difficulty task duration
comprehension check* expressing non understanding* clarification by circumlocution*
literal translation*, retrieval* clarification by code switch appeal for help*, risk taking
use of fillers* self-repair* gesture*
advance organisation
lexical complexity self-repair
Medium clarification by repetition
avoiding error*
structural complexity
Low
circumlocution clarification request*
restructuring*, foreignising* task familiarity* accuracy fluency
Information Gap
High task duration
clarification by repetition clarification by circumlocution* clarification request* expressing non understanding* circumlocution
foreignising*, restructuring* clarification by code switch appeal for help*, approximation*
avoiding error* gesture*
accuracy fluency
Medium risk taking task familiarity* advance organisation
Low task difficulty long pause, literal translation* retrieval* self-repair*
structural complexity lexical complexity self-repair
*significant differences found in ASU as seen in Friedman-Wilcoxon tests in Appendix x. Strategies in italics overlap with spoken production measures

249
Table 5.43 highlights the differences between groups. As can be seen, the low
group took significantly longer to plan the Picture Story and the high group felt more
confident about their performance (self-efficacy). The low group used code switching
and appeal for help more whereas use of fillers was higher for the high group.
On the Art Description the low group took longer planning the first part and
used clarification request, guessing, code switching and appeal for help strategies more
whereas the high group used more interpretive summary.
On the Information Gap the high group found the task more difficult and used
clarification by circumlocution, restructuring and gesture strategies more whereas the
low group used more clarification by code switch and code switching. In terms of
spoken production, the high group were more accurate, structurally and lexically
complex and spoke faster across all three tasks. They used more repetition on the Art
Description and more self-repair on the Information Gap.
Finally, the last set of results presented in this chapter were those for the
multiple regression analysis which examined the relationship between the five strategy
categories on the SQ and the eight spoken production measures. The SQ seemed to be a
weak predictor of accuracy, lexical complexity and speech rate with Compensation
strategies making the strongest unique contribution to these predictions.

250
Table 5.43 Summary of between-groups comparisons Higher results Higher use of strategies Higher Spoken Production
Factor 1 Interactional Factor 2 Compensation Factor 3 CFM
Factor 5 Evaluation
Picture Story Low Group pre-task planning
code switching appeal for help word coinage*
other evaluation
High Group self efficacy use of fillers*
accuracy lexical complexity structural complexity speech rate
Art Description Low Group pre-task planning in Part 1
clarification request* guessing*
clarification by code switch* code switching* appeal for help literal translation
High Group interpretive summary*
accuracy lexical complexity structural complexity repetition speech rate
Information Gap Low Group clarification by code switch* code switching
High Group task difficulty clarification by circumlocution
restructuring message abandonment*
gesture self-repair
accuracy lexical complexity structural complexity self-repair speech rate
*significant differences found in ASU see Appendix x for Mann Whitney Tests

Chapter 6
Discussion

251
In light of the main findings from this study, the research questions posed at the
beginning of this thesis are discussed. The results of this study centred on EFL learners’
strategy use and spoken production as well as strategy questionnaire validity. In this
chapter the validity of the SQ is discussed first, so that the implications can be
incorporated into the subsequent analysis of strategy use across tasks and between
proficiency levels. This is followed by across-task comparisons for spoken production
and then for strategies for each proficiency group. Next, between-groups comparisons
are discussed, once again, for spoken production and strategy use. Additional results are
incorporated into the discussion where relevant. Finally, the value of the SQ as a
predictor of spoken production is considered. Findings are discussed from a cognitive
perspective, in terms of speech processing mechanisms (Kormos, 2006; Levelt, 1999)
and task features (Robinson, 2005; Skehan, 1998) and compared with claims made in
related fields.
6.1 Perceived strategy use versus actual strategy use
Research Question 4: Does perceived strategy use reflect actual strategy use for low
and high proficiency learners?
This question was analysed by comparing learners’ perceived strategy use,
gathered on the strategy questionnaire, with actual strategy use, identified from task
performances and in learners stimulated recall comments. Data from the two sources
was quantified and compared, not only on one task but across three different tasks. The
answer to this research question, according to findings in this study, is that perceived
strategy use reflected learners’ actual strategy use, on the whole, and that the strategy

252
questionnaire was quite consistent. This claim has been made with the support of the
several findings. Firstly, there was PSU:ASU consistency for both low and high
proficiency groups for at least half the strategies on the SQ (high group: 63%
PSU=ASU, low group: 48% PSU=ASU). Secondly, significant differences were found
in actual strategy use across three different tasks, some of which were also reflected on
the SQs for both groups, which shows that the SQ could also discriminate between
tasks. Thirdly, for the high group, the majority of actual differences (15 out of 20)
across tasks were reflected on the SQ at a statistically significant level, showing that the
high group could report strategy use very accurately.
This claim is also based on the particularly rigorous procedures that were used to
establish consistency between ASU and PSU. ASU was collected from the whole
sample of 48 participants, rather than a smaller sub-sample and an attempt was made to
trace all the 44 strategies on the SQ rather than a representative sample from each
strategy group. Furthermore, consistency was based not only on one task but on
comparisons between three different tasks, which permitted a more accurate
interpretation of learners’ PSU. Comparing these procedures with those of others
(Bråten & Samuelstuen, 2007; Khan & Victori, in press), they seem more thorough.
Khan and Victori (in press) compared ASU and PSU of four intermediate proficiency
learners. Fewer (86%, compared to about 90% in the present study) of the
questionnaire’s strategies were traced in the qualitative data and lower consistency
(41%, compared to 48% and 63% in the present study) was found. In contrast, in a study
by Bråten and Samuelstuen (2007) a larger sample was used (N=177) but only three of a
possible twenty strategies were traced on an L1 reading strategy questionnaire to
validate it.

253
A crucial question often posed in the literature is how precise learners’ responses
on strategy questionnaires really are. Triangulation of strategy data has often been
proposed (Macaro, 2006; Gao, 2007; Phakiti, 2003; Victori, 2004; Victori et al., 2009)
to validate questionnaire findings, but it has less frequently been carried out (Bråten &
Samuelstuen, 2007) and, to the author’s knowledge, it has not been carried out for oral
communication strategies. It would be unrealistic to expect learners to report their
strategies with a hundred percent accuracy, even immediately after doing a task,
because of the difficulty of recalling cognitive processes and the speed and automaticity
of much of speech processing (Cohen, 1998; O’Malley & Chamot, 1990).
Nevertheless, the objective of gauging the extent to which questionnaire data was
consistent with actual strategy use was achieved, as well as gaining insights into the
nature of the consistencies and discrepancies.
As for these consistencies and discrepancies, among the consistencies for both
proficiency groups were strategies which learners either did not use or used very little.
These strategies were a mixture of Interactional and Compensation strategies and other
evaluation. Therefore, it seems that learners can report strategies that they do not put
into practice precisely. This finding is supported by the results from the structured
interviews carried out during questionnaire piloting (see Section 4.2.1.2 and Table 4.2,
for rationales for a “0” scale response). When learners were interviewed about scale and
item interpretation, they never doubted or hesitated about strategies that they had not
used.
On the whole, both groups were also consistent in reporting Evaluating
strategies and some Planning strategies. These metacognitive strategies may be easier to
report because they are not language specific but they manage the task of oral
communication more generally and require conscious reflection. The distinct

254
hierarchical nature of these strategies and the fact that they do not involve language
directly may make them easier to distinguish compared to Interactional, Compensation
and CFM strategies.
Code-switching was also reported consistently by both groups. One reason
learners were accurate in recalling this strategy may have been because, at moments
when this strategy was employed, learners were made aware of what they were doing by
the fact that they were not able to find a way of expressing themselves in English. Also,
code switching involved a complete language switch, and as learners had to do the tasks
in English, they may have regretted that they were not complying with the task demands
when employing this strategy.
Learners were also accurate in reporting various Interactional and Compensation
strategies and even gauging differences across the three tasks. As mentioned for the
high proficiency group significant differences in ASU (20) were also significant in PSU
(15). The low group also gauged differences, as seen by comparing means for PSU
across tasks (see Appendix P), although not as many (4 out of 22) came out as
statistically significant.
Another point worth noting is that the high group were slightly more accurate in
reporting strategies (63% compared to 48% for the low group). One reason, which has
been recognised in the strategy literature (Grenfell & Harris, 1999; Macaro, 2001;
Pinyana, 2009, among others) could be that for high proficiency learners L2 oral
communication poses a lower cognitive challenge than for low proficiency learners. As
high proficiency learners have a wider knowledge of the L2 and greater control over
their L2 linguistic resources, it leaves more attentional capacity free for them to be more
aware of their performance. In contrast, for the low group who have fewer L2 resources
at their disposal and less control over them, their attentional capacities are more fully

255
absorbed by doing the task and less attention remains for recalling strategy use. LLS
researchers have described such differences in terms of higher or lower metacognitive
awareness (Green & Oxford, 1995; Purpura, 1999; Victori, 1999).
Turning to the discrepancies in PSU, the reasons for these also need to be
addressed. Neither group reported the following strategies accurately: avoiding error
(CFM), appeal for help (C)58, foreignising (C), retrieval (C), approximation (C), use of
fillers (CFM), interpretive summaries (I)59 and word coinage (C). As well as the above
strategies, both groups reported various other Compensation strategies inaccurately and
the low group reported some Interactional strategies inaccurately, too.
One reason for these discrepancies could be that learners lack awareness of some
strategies. As noted by some scholars, it could be that the nature of oral communication
makes it difficult to complete a task and report strategies accurately afterwards (Cohen
& Macaro, 2007; Victori, 2004). In the case of Compensation strategies, such as
foreignising, approximation or word coinage, they often involve the inability to access a
single L2 lexical item. Therefore, they may be easier to forget as these strategies
originate in the planning stage of speech, involve little or no change in the ongoing
discourse and so may be less accessible to verbal report. This is in line with Khan
(2006), who found that learners reported difficulty in recalling Compensation strategies.
Lack of awareness of strategy use may also be true for strategies which involve no overt
speech, such as gesture, feigning understanding, message abandonment and long pause,
which showed discrepancies for one proficiency group or the other. In contrast,
Interactional strategies occur in the post-articulatory phase of speech processing,
triggering negotiation of meaning sequences which are more time consuming and may
occur over a number of turns. Consequently, these strategies may be more memorable
58 C=Compensation strategy 59 I = Interactional strategy

256
as they trigger a change in the conversation and as they are embedded in a larger
articulated sequence of speech.
A second reason could be that learners’ interpretations of some strategy
descriptions on the SQ differed from how the researcher identified them in the
qualitative data. This is another drawback with questionnaires based on psychological
constructs, often reported in the literature (Block, 1998; Dufva, 2003; Kalaja and
Barcelos, 2003). For example, this may have been the case for use of fillers, which both
proficiency groups overestimated. ASU for this item had been measured as L2 fillers
such as well and one moment, however, task transcripts revealed that learners used
several L1 fillers such as bueno, pues, espera’t and a veure. Therefore, learners might
not have distinguished between L1 and L2 fillers when recalling strategy use. Another
example is avoiding errors, where differences across tasks were not perceived.
However, this may have been because only overt errors60 were identified in ASU,
whereas in reporting their strategies learners may have taken into account covert errors61
which they may have corrected before articulation (Kormos, 2006). Another case could
have been that of interpretive summaries, which was perceived to be used more on the
Information Gap task. ASU was consistently low for both groups across tasks.
Therefore, it could be that learners misunderstood the strategy description, which was
“When I didn’t understand my partner I repeated what he/she had said in my own way
to ensure that I had understood”. By focusing on the first part of the description “...I
repeated...” instead of reading to the end “ I repeated in my own way...”, learners may
have interpreted this item as clarification by repetition, which was used more on the
Information Gap. The fact that students draw on a variety of sources when answering
60 Overt errors occur in articulated speech and so can be detected in transcripts. 61 Covert errors occur during the planning phase of speech production and are detected before speaking.

257
questionnaire items and ignore the specificity of a prompt is a problem which has
already been acknowledged (Barcelos, 2003; Victori et al., 2009).
A third reason for discrepancies could be due to social desirability bias
(Dörnyei, 2003), which refers to the natural tendency for people to present themselves
in a good light. This may have been the case, for example, for the low group, who
overestimated their use of some Interactional strategies: comprehension checks,
clarification by circumlocution and clarification requests, because they may have
viewed them as positive or desirable strategies for oral communication, but which they
had not used. In contrast, they underestimated expressing non-understanding, which
they may have viewed negatively.
Learners not responding sincerely to the SQ items was not considered a major
reason for the discrepancies, as the learners were filmed doing the tasks, which made
them aware that if they had reported falsely it would become evident to the researcher
by watching their task performance.
This part of the study has delimited the scope of the strategy questionnaire
pointing to its strengths and weaknesses. The results show that within the context of a
task, a strategy questionnaire is a general indicator of what learners actually do, with
learners accurately reporting a mixture of Planning, Evaluating, Compensation and
Interactional strategies and high proficiency learners being more accurate in reporting
particular Interactional and CFM (self-repair and gesture) strategies. As for
discrepancies, they could be due to the nature of some strategies (particularly
Compensation strategies) which make them difficult to recall or social desirability bias,
which are inherent problems for all questionnaire-based data. On the other hand, the
means used to measure some strategies in the qualitative data may not always have been

258
equivalent to learner’s interpretations of those particular strategies, which could have
lead to discrepancies in this particular study.
6.2 Across-task comparisons
6.2.1 Spoken production across tasks
Research Question 1.1 Are there differences across tasks in spoken production for
high proficiency learners?
Research Question 1.2 Are there differences across tasks in spoken production for low
proficiency learners?
In order to answer these questions, descriptive statistics of the spoken production
measures representing the dimensions of CAF and self-repair were examined across the
three tasks and statistical comparisons were made with Friedman-Wilcoxon tests.
Results were presented for high and low groups separately in relation to native speaker
benchmarks. As will be recalled, there were significant differences in several spoken
production measures across tasks. As the pattern of differences was similar for both
proficiency groups, in the following sections the spoken production dimensions:
accuracy, complexity, fluency and self-repair are addressed for both proficiency groups
at the same time and findings are interpreted according to the characteristics of the tasks
performed in the study, which were described in Chapter 4, as well as with reference to
Levelt’s (1999) model of speech processing. Additional results are included where
relevant.

259
6.2.1.1 Accuracy
As will be recalled accuracy was reported as error-free clauses, where errors
were considered grammatical, lexical and phonological errors. Accuracy represents
freedom from error, control of existing resources and conformity to L2 rules. Skehan
(2009), using Levelt’s (1989) model of speech production, assumes that accuracy is the
consequence of attention being available when the speaker is encoding their message in
the form of language, after the pre-verbal message has been conceptualised. In other
words, accuracy requires attention during message formulation.
In sum, for native speakers accuracy was high (see Table 6.1) and did not
change across tasks. For both proficiency groups accuracy was significantly higher on
the Information Gap, compared to the Art Description and Picture Story. However, for
both groups, accuracy was also slightly higher on the Art Description, although not
significantly so.
Table 6.1
Summary of relative differences in accuracy across tasks
Accuracy Picture Story Art Description Information Gap Native Speakers high high high High proficiency low low high Low proficiency low low high
Firstly, accuracy was significantly higher on the Information Gap compared
to the other two tasks. One reason may have been the interactional features of the task
[closed/two-way/convergent] with the subsequent requirement for precise information
exchange. These features resulted in the most negotiation of meaning, reflected in
Interactional strategy use, which were highest on this task (see Section 6.2.2.2). This

260
kind of result has been found in numerous interaction studies (for example, Gass &
Varonis, 1985; Long, 1980; Pica & Doughty, 1988; Yule & McDonald, 1990) for
information gap tasks. These researchers claim that as learners repeat or rephrase what
they say to make sure that their information is accurate and understood, they
simultaneously pay more attention to the forms encoded in their utterances, which
prompts them to be more accurate in their language use. Lambert and Engler’s (2007)
results concur with those in this study as they also found more accuracy in tasks where
information was split compared to shared information tasks.
Another explanation for higher accuracy on the Information Gap may be that it
was a relatively easy task, compared to the Picture Story, which required some simple
reasoning for the events in the story and compared to the Art Description, which
required even more complex reasoning. In these latter tasks, a more complex pre-verbal
message had to be formulated placing greater demands on the learner’s mental lexicon
and so message formulation was more easily disrupted (Skehan, 2009), which resulted
in lower accuracy. In contrast, message conceptualisation on the Information Gap was
limited. Learners often had to repeat the same syntactic structure, which was simple.
This was reflected in the low lexical and structural complexity scores on this task, even
for native speakers. Simple message conceptualisation allowed learners to pay more
attention to formulating an accurate message. The following extracts illustrate
differences in meaning negotiation and reasoning on the three tasks for a high
proficiency pair.
Picture Story [+reasoning/-meaning negotiation]
(7) Task (High Proficiency)
*FER: ok so in the second picture I think it's the day when: they marry and: I think they look
very happy because they are looking forward to arrive to the honeymoon in the paradise.

261
The learner is describing the second picture in the sequence (see Appendix H1).
Art Description [++reasoning/+meaning negotiation]
(8) Task (High Proficiency)
*FER: and about the reason that he needs to wear these so old fashioned sunglasses?
*TOM: no my friend you are mistaken because these are retro glasses and they are very very
[///] they are only on the: [/] on the top now so the painter is also interested in fashion so
also try to [/] to [/] er # to: # impress other people with his knowledge of fashion.
The learner is describing the sunglasses in Part 1 (see Appendix H2).
Information Gap [- reasoning/++meaning negotiation]
(9) Task (High Proficiency)
*FER: ok so the third one I think it's er mountains and: there are three [/] three mountains one
two on the front and one in the back in the middle.
*TOM: on the bottom there is a flat line.
*FER: yes.
*TOM: yes I think it's the same.
*TOM: it's not coloured or anything?
*FER: not at all.
*TOM: yes I think that it's [/] it's the same.
The learner is describing the third picture (see Appendix H3).
As noted after each extract, each extract refers to one particular element in the
visual input. By comparing the task excerpts it can be seen that on the Picture Story and
Art Description longer turns are taken and connectors such as because and so mark
where the speaker gives reasons. In contrast, in the Information Gap, turns are mostly
shorter and less complex as no reasoning is given, simply description.
Secondly, accuracy was slightly higher on the Art Description compared to
the Picture Story, although differences were not significant. As the Art Description
was the more difficult of these two tasks, one would expect lower rather than higher
accuracy on this task, as learners attention to form is compromised by complex message

262
formulation (Skehan, 1998). The Art Description was the most cognitively complex task
[+reasoning/+number of elements/-prior knowledge] as established by the researcher
and according to learners’ own perceptions of task difficulty. However, slightly more
accuracy was found on this task. One explanation could be that it was the more open
nature of the Art Description that elicited more accuracy compared to the Picture Story.
Learners could covertly avoid explaining certain elements in the painting or delay
discussing them until they had prepared an explanation, which was not possible on the
Picture Story, where participants were constrained to describe the particular events in
the pictures in the order that they had been assigned. This meant that participants could
not easily change the topic or avoid using problematic language and so they had to
persevere in trying to express themselves with the consequence of being less accurate
(Gass & Varonis, 1985).
An alternative explanation could be that the task difficulty, imposed by the
resource-directing dimensions [+reasoning/+number of elements] of the task, elicited
slightly more accuracy compared to the Picture Story. According to Robinson (2005),
among others, this dimension directs learners’ attention to the way concepts are
linguistically coded in the L2 and so may elicit greater accuracy. The fact that there
were more instances of Interactional strategies (comprehension checks and expressions
of non understanding) on this task supports such an explanation, as such strategies also
direct learners’ attention to form. However, a drawback of this explanation is that it
does not explain why accuracy was lower on the Picture Story [+reasoning] compared
to the Information gap [-reasoning].
For native speakers accuracy was not affected by the three task characteristics,
as their L1 mental lexicon is more complete, with lexical items being fully specified
compared to L2 speakers (who may lack some of the rules associated with an item) and

263
therefore they are far less prone to the type of low level structural errors identified in
this study to measure accuracy.
6.2.1.2 Structural complexity
Structural complexity was measured as the level of subordination in utterances:
the number of clauses per AS-unit. Structural complexity is thought to originate from
the formulation of a more complex idea at the conceptual preparation stage of speech. It
represents the use of more elaborate language and syntactic patterns and involves the
development, restructuring or extension of existing resources and so may lead to
interlanguage development (Housen & Kuiken, 2009; Skehan, 2001). For both
proficiency groups and native speakers, structural complexity was highest on the Picture
Story, lower on the Art Description and lowest on the Information Gap, as summarised
in Table 6.2.
Table 6.2
Summary of differences in structural complexity across tasks
Structural Complexity Picture Story Art Description Information Gap Native Speakers high medium low High proficiency high medium low Low proficiency high medium low
The Picture Story elicited high structural complexity. Other researchers have
found high structural complexity in narrative tasks (Foster & Skehan, 1996; Skehan &
Foster, 1997; Swain & Lapkin, 2001), such as this one. This is because storytelling, as a
discourse mode, involves the linking together of the events in time and justification of
the characters actions which gives rise to structural complexity and extended turns. Both
Skehan (2003) and Robinson (2005) claim that the need for justification leads to greater

264
linguistic complexity. Furthermore, learners found the Picture Story to be the easiest
task, which meant more attention was available for more complex message formulation
on this task. These examples from the first picture frame in the Picture Story task
illustrate the high structural complexity elicited for all groups62:
Picture Story
(10) Task (Native Speaker)
*DAN: er: well first of all er Tom and Judy er plan their honeymoon by er [= ::] looking
through brochures [= ::] which is [///] er looks like a very enjoyable part of the er
process [= ::] [= |].
(11) Task (High Proficiency)
*IGN: yes so Tommy and Judy started their trip their honeymoon by going to a travel
agent [= ::] and looking for a place to go after their: marriage [= ::] they have
just arranged [= ::] and they looked for several pri(ce) [//] for several price and
several opportunities [= ::] and they decided to go to [/] to a: paradisiac: island in
the Mediterranean sea [= ::] [= |] .
(12) Task (Low Proficiency)
*LAU: in the picture one er: ## er Tom and Judy er # look at the diary er or or the
catalogue of the: of travel for: for: their married [= ::] and you: and you have the:
in the in your honeymoon [= ::] [= |].
Structural complexity was lower on the Art Description than the Picture
Story because message conceptualisation may have been more complex. As participants
had to express abstract concepts, it involved more complex reasoning than the Picture
Story. It is more difficult to justify interpretations of art than to justify concrete actions
in a simple story retelling. As participants struggled more to express their ideas they
changed their original intentions or reduced or repeated what they wanted to say or
62 [= ::] = clause boundary, [= |] = AS-boundary.

265
replaced their original intentions with more simple language. The examples below
illustrate disruptions to structural complexity on the Art Description for all groups.
Art Description: Part 2
(13) Task (Native Speaker)
*DAN: well I think [= ::] this goes back to the artist's childhood [= ::] [= |] the er figure
in the chair is definitely an older figure a figure of power [= ::] and is connected
to a young girl by a line [= ::] [= |] ok it's control over the young girl [= ::]
[= |] no I think [=::] that this is a reference to the artist's childhood [= ::] and
how older people are in a position [= ::] to repress children er: [= ::] and this
has consequences later in life [= ::] which we see in in other parts of the painting
[= ::] [= |].
*PAU: ok yes that sounds plausible.
(14) Task (High Proficiency)
*MAR: it means the: relationship between two: people [= ::] one is in love [= ::] and:
another # looking &=ges:handmoves +/.
*MAR: it's a: representation [//] representation of life in general [= ::] [= |] # you must
feel the +/.
*ANN: 0 [=! laughs].
*MAR: I can't explain &=ges:handsplay [= ::] [= |] .
Art Description Part 1
(15) Task (Low Proficiency)
*SER: be(cause) [//] why the background is blue [= ::] [= |] ?
*SEP: er .
*SER: sí que xx xx .
*SEP: er if [///] because +/.
*SEP: perque es veu a darrere no? [Why you can see it behind, no?]
*SER: xx xx xx sí. [yes]
*SEP: because [/] er because is # er symbolise +/.
*SEP: the: [/] the [///] these people are: good people &=laughs [= ::] [= |] .
*SER: 0 [=! laughs]

266
Least structural complexity was found on the Information Gap, as it did not
require reasoning, as the other two tasks did. Therefore, message conceptualisation and
formulation were a lot simpler. Furthermore, the two-way task design elicited shorter
turns, which also compromised structural complexity. These features are illustrated in
Excerpt 9 from the Information Gap above (p.261). These results provide further
evidence in line with other research which claims that the narrative discourse mode
promotes structural complexity (Ellis, 2003; Foster & Skehan, 1996) and interactional
features [closed/two-way/convergent] detract from it (Robinson, 2001). The presence of
reasoning demands (Robinson, 2005) also seems to be a crucial factor in promoting
structural complexity as illustrated in the Art Description task. The fact that even native
speakers displayed the same pattern across tasks for structural complexity as NNS
groups gives further support that it was the task features and not proficiency that
determined the degree of structural complexity.
6.2.1.3 Lexical complexity
Lexical complexity was measured as the statistic D, a formula which measures
the lexical diversity in a given length of transcript. It reflects the ability to successfully
retrieve and encode a variety of lexical items during performance. Summarising results
across tasks, Table 6.3 shows that lexical complexity was lowest on the Information
Gap and highest on the Art Description for both proficiency groups and native speakers.
Table 6.3
Summary of differences in lexical complexity across tasks
Lexical Complexity Picture Story Art Description Information Gap Native Speakers high high low High proficiency medium high low Low proficiency low high low

267
The Information Gap elicited the least lexical complexity, even for native
speakers. This seemed to be due to the task topic, which limited participants to a
particularly narrow lexical domain, the description of particular parts, positions and
dimensions in each picture. Furthermore, participants could not change the topic
without deviating from the task goal of finding out if the pictures were the same or
different. In other words, the closed feature of the task as well as topic seemed to limit
the language used.
The Art Description elicited most lexical complexity, possibly because it was
the most open task. Learners were not limited to a lexical domain, such as the fixed
storyline in the Picture Story, or to specific descriptions in the Information Gap. Instead
they could use their imaginations and their world knowledge, activating a lot more of
their mental lexicon in order to explain how they interpreted elements in a painting in
any way that they wanted to.
Another explanation for the high lexical complexity could, therefore, also be the
reference to abstract concepts, outside what was visible in the picture, such as death,
oppression, suffering, poverty and power. As abstract concepts are more difficult, both
to express and comprehend, they involve elaboration, reformulation or reasoning, which
requires more lexical variety. Abstract concepts require more complex conceptual
preparation which drive the retrieval and encoding of a greater variety of lexical forms
(Skehan, 2009). The excerpts below illustrate lexical complexity in the description of
one element on the Information Gap compared to one element on the Art Description
for low proficiency learners:
Information Gap
(16) Task (Low Proficiency)
*SEP: in picture six I can see a cube with six face and the top face er have a cross in the
centre.

268
*SER: er and in the: [/] in the face of: bueno in the: [//] in the front face or side ano(ther)
there [//] joder are there some triangle?
*SEP: no its er only have a cross in the top part.
*SEP: the other faces are [/] are white.
*SER: ok in my picture I see a [///] bueno two triangles in [/] in fronts face or side.
*SEP: ok it’s the difference .
In the above excerpt from picture-frame six in the task (see Appendix H3), it can
be seen that there is reference to lexis which is repeated by the participants in the
interaction. Much of the same language was also used in describing the other pictures in
the task. These factors led to low lexical complexity.
Art Description
(17) Task (Low Proficiency)
*SEP: no because have [/] er have a plant in her mouth?
*SER: yes er: this man er means +/.
*SEP: un naturalista +/.
*SER: the: [/] the wrath of the pers(ons) [//] of the people
*SER: we can see a plant in his mouth and its mean the nature that try to [/] to [/] to go
out of our and we: [/] we # for(bid) +/.
*SER: forbid és prohibir ? [Does forbid mean prohibit?]
*SEP: for(bid) [/] forbid [/] forgive.
*SEP: ah no, és perdò. [Oh no, it’s forgive]
*SER: and we forgive [//] forbid [/] forbid er er [= ::] that the nature go out.
*SER: ok .
*SER: er I think that also means er the soul [/] the soul of the [/] of the per(sons) people
that er try to [/] to go out.
The learner is referring to the person with a plant coming out of their mouth in Part 2 (see
Appendix H2).
In Excerpt 17, the Art Expert (*SER) refers to more abstract concepts (soul,
wrath), less common words, which is even surprising to hear a low proficiency learner

269
using. In fact, stimulated recall comments showed how participants tapped into their
world knowledge more in this task, as the following example shows:
Art Description
(18) Recall and Task (low proficiency)
*SER: we can see that [/] that er this person have a dog er it er [/] # it er: means the
bueno i [///] we can compare this dog with Cervero the [/] the [/] the
guardian of hell [= ::] [= |] .
SeRu0202: It’s from mythology I think I wanted to say Cervero, the guardian the dog
with three heads that guards the gates to heaven and I think maybe it’s like a
metaphor or something like that.
Unlike the Information Gap, totally different language was used in interpreting
each of the elements in the Art Description, which altogether resulted in high lexical
complexity. Other researchers (Read, 2000) have found more complex tasks (such as the
Art Description in this study) lead to greater lexical complexity.
The Picture Story elicited higher lexical complexity than the Information
Gap, for the high group, but, for the low group, lexical complexity was equally low
on both tasks. Firstly, the high group had produced higher lexical complexity on the
Picture Story because it was more open than the Information Gap, allowing them to use
a wider range of lexis. It also had higher reasoning demands, which may also have
contributed to lexical complexity. This leads to the question of why there was not the
same increase in lexical complexity for the low group due to these task features
[+open/+reasoning]. On the more difficult task, the Art Description, the low group had
shown higher lexical complexity, therefore it cannot be said that they had reached their
maximum threshold and could not have produced more complex language on the Picture
Story.

270
One explanation could be the fact that the Picture Story depicted a familiar
situation and events, information which both participants shared. This meant that even if
a speaker was incomprehensible, the listener could understand what they were saying by
looking at the pictures and did not need to ask for clarification. It also meant that little
elaboration was actually necessary to complete the task, resulting in low lexical
complexity. On the Art Description, in contrast, the speaker had to explain abstract
ideas which were not visible in the picture and for that reason was encouraged to use
more elaborate language. As the Picture Story did not pose too much of a challenge to
the high group, it may be that they set themselves higher communicative goals and
chose to give more detailed accounts, resulting in more lexical complexity, an
explanation put forward by Dobao (2000) for similar results in her study.
6.2.1.4 Fluency
Fluency was measured in terms of several different subdimensions: speech rate,
fluency breakdown (long pauses) and fluency repair (repetitions and reformulations).
Speech rate reflects the speed of speech processes. Fluency breakdown reflects the
ability to speak without disruption by pausing and fluency repair the ability to speak
without disruption by repetition or reformulation. It has been proposed (Gilabert, 2007;
Levelt, 1989) that fluency is not a result of paying attention to speech processing
mechanisms but that it is the consequence of effective (quick and easy) conceptual
planning and lexical access, selection and encoding. It is the capacity to cope with real-
time communication.
Fluency, in terms of speech rate, did not vary across tasks, which suggests
that speech rate may be a more stable trait which is only susceptible to change in the
long term, as learners’ overall L2 proficiency improves.

271
Table 6.4 summarises results across tasks for fluency breakdown and repair,
which was low on the Picture Story and high on the Art Description for both groups.
Table 6.4
Summary of differences in fluency across tasks
Fluency Breakdown & Fluency Repair Picture Story Art Description Information Gap Native Speakers low low high High proficiency low - high Low proficiency low low high
Firstly, fluency was highest on the Information Gap for both proficiency
groups and native speakers in terms of less frequent breakdown, repetition and
reformulation. Again, this must have been due to the [closed/two-way/convergent]
interactional nature of the task which led to shorter turns and meant that speakers could
take advantage to think at natural pausing positions, such as AS boundaries63, of which
there were many more than for the other tasks. Some other researchers have found more
fluency on closed interactional tasks (Rahimpour, 1997) compared to more open tasks.
Furthermore, the absence of reasoning demands and the low number of elements made
this task less cognitively complex than the other tasks, meaning conceptual preparation
was simpler, reducing pressure on speech processing mechanisms and leading to greater
fluency. Other researchers of task complexity who have investigated the dimensions of
[+/- elements], and [+/- reasoning] (Niwa, 2000; Robinson, 2005) have found that
reducing task complexity increases fluency.
Secondly, fluency was lowest on the Picture Story. Low fluency suggests that
participants required more online planning. This was necessary for two reasons. First,
turns were longer, placing greater demands on the learner’s speech processing
63 As will be recalled, pausing at AS boundaries was not included as a dysfluency marker.

272
mechanisms and working memory. Participants had to conceptualise, retrieve and
encode a longer message or more than one message during their turn. Therefore, more
long pauses occurred as learners needed time to recall a greater quantity of information.
Secondly, although the story was sequenced, participants could only continue the story
appropriately if they had paid attention to what their partner had said, in order to link
the parts of the story together. Consequently, during performance, pre-established turn
taking restrictions interfered with preparing and rehearsing their own turn.
On the Art Description fluency (in terms of less breakdown) was higher for
both proficiency groups than on the Picture Story, although not significantly so for
the low group, despite the task’s difficulty and the fact that the task was less familiar.
Once again the explanation for this could be that the Art Description was more open so
learners could avoid certain elements, as described earlier in relation to accuracy and
complexity, which was not possible on the Picture Story. For the same reason, learners
were free to use any method of expression and could keep talking about anything, which
led to fewer long pauses.
Fluency was low on the Art Description and Picture Story (in terms of more
repetition and reformulation) compared to the Information Gap. This could, once
again, be put down to the higher reasoning demands of these two tasks, which meant
more attention was needed for the conceptual planning phase of speech processing
leading to more complex output, but at the same time interfering with attention to form
and resulting in more repetition and reformulation as message articulation was
disrupted.
Finally, as most empirical research has shown that planning improves fluency
(Foster & Skehan, 1996; Gilabert, 2004; Mehnert, 1998; Ortega, 1999; Skehan and
Foster, 1997; Wendel, 1997; Yuan and Ellis 2003; Zhang, 2007), this factor will be

273
considered here. In this study there was no significant difference in planning time across
tasks for the high group. Therefore, the effect of planning time on fluency can be
considered to be equal on all tasks. For the low group, however, there was significantly
more planning on Part 1 of the Art Description compared to Part 2, and fluency was
higher than the Picture Story. Therefore, for this group, the extra planning time may
have also contributed to higher fluency on the Art Description.
6.2.1.5 Self-repair
Self-repair reflects the level that learners monitor the speech production process.
It reflects post-articulatory monitoring of overt speech and requires attention (Gilabert,
2007; Kormos, 1999; Poulisse & Bongaerts, 1994). Self-repair, measured as the
percentage of errors repaired, was nil for native speakers, did not vary significantly for
the high group across tasks and was significantly lower on the Information Gap for the
low group.
Table 6.5
Summary of differences in self-repair across tasks
Self-repair Picture Story Art Description Information Gap Native Speakers - - - High proficiency - - - Low proficiency high high low
In other words, the three tasks posed no differences in constraints on native
speakers’ or the high proficiency group’s attentional resources for post-articulatory
monitoring. However, low proficiency learners self-repaired significantly less on the
Information Gap compared to the other two tasks, which suggests that some

274
characteristic of the Information Gap removed attentional resources from the self-repair
behaviour for this group.
The low group self-repaired less on the Information Gap. This may be
because turns were shorter compared to the other tasks, as seen above. This meant
learners had less time available to monitor their output before their partners responded
to them. Turns were shorter because learners had to convey precise information to their
partners and listen carefully to their partners’ responses in order to do the task. As low
proficiency learners carry out more speech processing mechanisms serially rather than
in parallel, both in speech production and speech perception, the time pressure created
by the shorter turns and requirement for precise information exchange caused more
problems for monitoring their overt speech.
It must be noted that the level of self-repair was generally low for both
proficiency groups across tasks [High proficiency: 12.80%; Low proficiency: 10.71%,
maximum across the three tasks]. This may have been because many errors did not
obscure the meaning of the message, so speakers were not prompted to self-repair.
Other researchers have pointed out that the discourse salience of a linguistic form
affects how much attention is paid to its correct production (Kormos, 1999; Poulisse &
Bongaerts, 1994; Tarone, 1985). As learners shared a common L1 (Catalan), many
errors could be understood, as they often derived from L1. Furthermore, the salience of
incorrect utterances was aided by the visual input provided in the tasks. The following
excerpt illustrates these features as this low proficiency pair make several erorrs but still
understand each other.

275
Art Description
(19) Task (Low Proficiency)
Key: [*] error, [//] self-repair, [/] repetition, &=ges: gesture
*NAT: be(cause) [/] because [* l:why] [* ms:does] the [/] the person in on [* ms:in] the
picture is: [//] bueno have yellow hair?
*SAB: who person [* l:which] ?
*NAT: er: &=ges:pointpic +/.
*SAB: the man or the woman?
*NAT: both.
Summing up the discussion for spoken production across tasks, for both
proficiency groups the fewest differences were found between the Picture Story and Art
Description whereas the Information Gap was the task that differed most. The fact that
many of the same trends in spoken production measures were found for both
proficiency groups, as well as native speakers is strong evidence that it was the task
constraints that had the greater influence on the type of oral communication than
proficiency level. For example, when complexity was high, it was high for both
proficiency groups and native speakers, high on the Picture Story for structural
complexity and on the Art Description for lexical complexity, and when structural
complexity was low (Information Gap) it was also low for all groups. In other words,
the three tasks could be distinguished as particular types of task, which elicited
characteristic and predictable language production, even from native speakers.
To end the discussion on spoken production, the implications of the findings for
Skehan’s Limited Attentional Capacity Model (Skehan, 1998) and Robinson’s Multiple
Resources Attentional Model (2001) are discussed. On the whole for both proficiency
groups low structural complexity was generally accompanied by high accuracy or vice
versa. These results sit well with the Limited Attentional Capacity Model, which
predicts that there is a trade-off between accuracy and complexity, which are in
competition for attentional resources.

276
Comparing the Picture Story with the other two tasks, learners produced
structurally complex speech to the detriment of fluency and accuracy. In other words,
the extra attention needed to produce a more complex message meant more time was
required for speech processing (reducing fluency) and less attention was available to
focus on language form (reducing accuracy).
A similar picture emerged on the Art Description for both groups with respect to
the Information Gap, as the Art Description had a positive impact on lexical complexity
and structural complexity but negative effects on accuracy and fluency. Comparing it
with the Picture Story, the Art Description had a positive impact on fluency, accuracy
and lexical complexity but negative effects on structural complexity. In line with
Skehan’s Limited Attentional Capacity Model, structural complexity and accuracy seem
to be in competition. However, in a small respect, one result seem to be in line with
Robinson’s predictions, as greater task difficulty elicited both more lexical complexity
and accuracy on the Art Description.
Finally, the Information Gap had a positive impact on accuracy and fluency but
a negative impact on structural and lexical complexity compared to the other two tasks.
This could be interpreted according to Skehan, as more attention to accuracy provoked
by the requirement for precise information exchange detracted attention from
complexity. However, I would argue that, as even native speakers had lower complexity
scores on this task, it was the closed two-way design of the task that compromised
complexity, rather than competition for scarce attentional resources between accuracy
and complexity. In other words, the task was easy enough (as perceived by learners
themselves) so that there was no strain on forming a complex message, but learners
could not be more complex because of the task design.

277
6.2.2 Strategies across tasks
6.2.2.1 Low overall strategy use
As described in the previous chapter, aggregated strategy use, was just below the
midpoint (2.5) on a scale which ranged from not at all (0) to a lot (5) for PSU. This
meant that learners perceived using strategies to some extent on these particular tasks
but that they were not used extensively. These results were confirmed by ASU (see
Table 5.35), where the means for individual quantifiable strategies ranged between .55
and 2.56 strategies per task. In other words, despite the differences in strategy use found
across tasks, these differences occurred mainly within a low level of strategy use.
One explanation for low overall strategy use given by other researchers has been
the classroom context. Some studies on interaction (Aston, 1986; Foster, 1998) have
found that learners use few interactional strategies in NNS-NNS interaction in the
classroom compared to NS-NNS interaction. The reasons given were that learners fear
losing face in front of their peers (looking ridiculous by expresssing non-understanding)
or because they find negotiation of meaning episodes (for example, being continually
asked for clarification) frustrating. Further support for such an explanation comes from
LLS studies that have used general strategy questionnaires. Higher overall frequency of
strategy use has been found in second language contexts (Chaudron, 2003; Oxford,
1996a) where learners use the L2 for daily survival, rather than in foreign language
contexts such as the one in this study, where the L2 is used in NNS-NNS interaction and
is rarely used outside the language classroom.
Another reason for low strategy use in the EFL classroom context, which
emerged from findings in this study, can be put down to empathy between participants.
In other words, the fact that participants empathised with the difficulty that L2 oral
communication posed for their partners led to generally lower strategy use. This was not

278
just the researcher’s intuition, but was supported by task transcripts and stimulated
recall comments, as the Excerpts 20 and 21 illustrate. The task difficulty meant that the
Art Experts often got lost while delivering their explanations (Excerpt 20) or gave up. In
Excerpt 20 *GEM admits in the recall session that she did not understand what her
partner was trying to say, but instead of asking for clarification she went on with the
task, asking him a different question, not to save face, as Foster (1998) suggested, but to
save her partner the trouble of having to provide a difficult explanation.
Art Description
(20) Task & Recall (low proficiency)
*EST: I think that the [/] the painter try to says that someone is looking [/] # looking
him &=ges:hands but they [/] ## they don't know who is and [/] ## and [///] +/.
*EST: I don't know
*GEM: 0 [=! laughs].
...
*GEM: and er w(hy)[/] why the man # &=ges:handeye wear sunglasses ?
GeMu0202: I asked him just to start up but I knew that I was putting him in a position
that he wouldn’t know what to say.
Researcher: Did you understand what he was trying to say?
GeMu0202: No
(21) Task (low proficiency)
*GEM: I don't think [///] I don't know about the: [/] the meaning of these [///] of two
persons but I think er ## the [///] there are ##
*GEM: I don't know
*EST: ja pots tirar.
*EST: ja has dit algo no passa res.
Finally, another contributing factor to low overall strategy use was that the
strategy questionnaires were completed in relation to a task. The context which learners
refer to is narrower, in this case a specific oral task, compared with general
questionnaires, where learners refer to the whole of their language learning experience

279
and take into account all their language skills. Findings from Ikeda & Takeuchi (2000)
support this explanation, as they found learners reported between 30% and 40% more
reading strategies when no task was provided.
Research Question 2.1 Are there differences across tasks in perceived strategy use for
high proficiency learners?
Research Question 2.2 Are there differences across tasks in perceived strategy use for
low proficiency learners?
Descriptive statistics of perceived strategy use were examined across the three
tasks. As will be recalled a three-level analysis was undertaken of aggregated strategy
use, strategy groups and individual strategies, and results were presented for the whole
sample as well as high and low proficiency groups separately. Firstly, aggregated PSU
was generally low across tasks, as described above but within this low strategy use there
were some differences across the three tasks according to both PSU and ASU for both
low and high proficiency groups, supporting claims that strategy use is task-based
(Cohen et al., 1996; Nakatani, 2006; Swain et al., 2009). Fewest differences were found
between the Picture Story and Art Description. The strategies which differed were
mainly due to Interactional and Compensation strategies, which were used more on the
Information Gap according to both ASU and PSU. However, ASU, for the high group,
revealed even more Compensation strategy use on the Information Gap and, for the low
group, more Compensation and Interactional strategies on the Art Description as well as
the Information Gap.

280
The following sections discuss reasons for the differences in strategy use for
both proficiency groups, taking into account ASU of Interactional, Compensation,
CFM, Planning and Evaluating strategies, as summarised in Tables 5.41 and 5.42 in
Chapter 5, and, once again, drawing from research into task features and theory on
speech processing64.
6.2.2.2 Interactional strategies
As described in Chapter 4, these strategies occur during post-articulatory
monitoring of speech, when a problem is noticed during one’s own or the interlocutor’s
speech (Dörnyei & Scott, 1997). They are also known as strategies for negotiating
meaning (Long, 1983) and include strategies such as clarification requests and
comprehension checks. On the whole, for both proficiency groups, as seen in Tables
5.41 and 5.42, Interactional strategy use was lowest on the Picture Story, higher in the
Art Description and highest on the Information Gap.
The reason Interactional strategy use was low on the Picture Story can be put
down to lower task difficulty. As both proficiency groups found it easy, they did not
come across as many communication problems arising from the discourse. What made
the task easy could have been the visual input, which was shared, the content, which
was familiar, and the fact that the story was ordered, which meant that the structure of
the output was pre-established to some extent. Stimulated recall comments support
these claims as illustrated in Excerpts 1 and 2 (Chapter 5, p239). These results are in
line with task-based research by Wigglesworth (2001) and Skehan (1998, 2001), who
conclude that structured tasks are easier. This may be because they require less macro-
64 It must be noted that the strategies long pause, avoiding error and self-repair are not included in this analysis as they have been discussed as fluency breakdown, accuracy and self-repair, respectively, among the spoken production measures.

281
planning and, therefore, free up more attention for smooth message formulation and
comprehension (Skehan, 2001, 2009). Even if the participants came across a
communication problem; if they didn’t understand their interlocutor or if they found it
difficult expressing themselves, they could rely on the ordered picture sequence to
deduce or convey meaning and so did not need to use Interactional strategies to
explicitly negotiate meaning.
For the same reason, greater task difficulty led to the higher use of
Interactional strategies (comprehension checks and expressing non-understanding)
on the Art Description for both groups. Other researchers (Brown et al., 1984; Prabhu,
1987) have claimed that the more abstract a task is, the more difficult it is. In this study
such claims are supported by learners’ perceptions of the Art Description as illustrated
in Excerpts 3 and 4, (Chapter 5, p. 239). These strategies may have been necessary,
because the interpretations of the paintings by the Art Experts involved reference to
abstract ideas which were not visible in the pictures, therefore, Art Experts felt the need
to overtly check that they had been understood, as their interpretations were not obvious
from the visual input. For example, Art Experts tapped into their world knowledge,
making analogies with films and stories or by referring to famous people, as seen in
Excerpt 22 below. Therefore, whether their partners understood them also depended on
how much of this world knowledge they had in common.
Art Description
(22) Task (low proficiency)
*JAU: that's the influence er # of Warhol.
*JAU: do you know Warhol? [Comprehension check]
*FRA: Warhol, yes it's a play [the speaker means a computer game called
Warlords].
*JAU: no it's another artist.
*FRA: oh ok &=laughs .

282
In addition, there were many elements in the pictures of the Art Description that
were not easy to distinguish from one another. For example, whether the person being
referred to was at the back or front of the picture or whether something was an animal
or human or male or female was open to interpretation, as described by a learner in
Excerpt 19 (p.275). Therefore checking comprehension and expressing non-
understanding could clarify these issues. These results are in line with Robinson (2001),
who found more comprehension checks and clarification requests on a map task with
more elements.
For the same reason (greater task difficulty), the low group used clarification
more on the Art Description (clarification by repetition, clarification by code
switching and clarification by circumlocution) than on the Picture Story. More
clarification was required to distinguish between elements or clarify abstract ideas
which were not evident in the visual support.
In contrast, the high group used Interactional strategies more on the
Information Gap, but this was not due to inherent task complexity (learners found the
task easier than the Art Description) but rather to the closed, split, two-way design of
the task. As described in the previous section, and in Chapter 3, such results are in line
with much of the empirical research in Interaction studies (for example, Long, 1980;
Newton, 1991; Pica, 1993; Pica & Doughty, 1988; Rahimpour, 1997) who claim that
two-way/required information/closed tasks lead to more negotiation of meaning. Further
support for these results comes from psycholinguistic research, where Poulisse and
Schils (1989) found a higher use of analytic compensatory strategies such as
circumlocution (included as an Interactional strategy in this study) on a picture naming
task, similar to the Information Gap in this study.

283
On the Information Gap, as learners could not look at each other’s pictures, there
was no shared context, so they were forced to admit that they did not understand and
they had to ask for clarification (asking for repetition, guessing, clarification request,
comprehension checks) and give clarification (by code switching or circumlocution) in
order to compare their pictures, as precise information exchange was required.
Furthermore, they had to use circumlocution as the task had been designed to elicit this
strategy by including lexical items participants were not familiar with.
6.2.2.3 Compensation strategies
As previously mentioned Compensation strategies are used to overcome lexical
deficits, known as resource deficit strategies by Dörnyei and Scott (1997). They
included strategies such as L1-based (code switching, literal translation) L2-based
(approximation, restructuring) and avoidance strategies (omission and message
abandonment). Whereas Interactional strategies arise from problems detected during
post-articulatory monitoring, Compensation strategies are mainly related to lexical
deficits which occur during the planning and encoding phase of the pre-verbal message
(Poulisse, 1990), when a speaker cannot access a lemma in their mental lexicon.
Compared to the Interactional strategies (such as circumlocution and clarification by
circumlocution) these types of strategies have been described as less cognitively
demanding (Dobao, 2000; Poulisse, 1993) as they require smaller changes to the pre-
verbal plan or they are less time consuming.
For both groups, more Compensation strategies were used on the
Information Gap than for the other two tasks, as shown in Tables 5.41 and 5.42. This
was expected from the task design. As learners had to describe the pictures precisely to
achieve the task goal of finding differences if they existed, they could not avoid

284
referring to certain lexical items, as they could in the other tasks. In addition, as they
sometimes did not know the lexical items in the L2, they used Compensation strategies
as illustrated in Excerpts 23 and 24:
Information Gap
(23) Task (low proficiency)
*CRI: I see: a: +/. [message abandonment]
*CRI: como se llama [appeal for help] ?
*ALB: a reptile [* p:Ȏepti:l] . [approximation]
(24) Task (high proficiency)
*GIS: er what you put to limitate a garden &=ges:handturns. [word coinage]
*MAR: a fence.
For both proficiency groups, retrieval was higher on both Picture Story and
Art Description compared to the Information Gap. Retrieval is an attempt to retrieve a
lexical item uttering a series of incomplete or wrong forms or structures before reaching
the optimal form (Dörnyei & Scott, 1997), as shown in the following excerpt for a low
proficiency pair:
Art Description
(25)Task (low proficiency)
*SUS: espera't er er # the picture is er [///] the style [/] the: [///] # of the [/] the: create
[* l:child] [///] the face is ma [//] is more er ah [///] I don't know stay one
moment. [retrieval]
*SUS: ah !
*SUS: ah &=ges:clicksfingers er the art style is style &=ges:handsplay I not explain.
This may have been due to the longer turns in these tasks arising from more complex
message formulation, which put more pressure on the smooth flow of lexical retrieval.

285
In the above excerpt it seems as though retrieval occurs because the speaker cannot find
the next words she wants to use, which causes disruptions in the articulation of previous
words the speaker has already retrieved. In other words, parallel processes of lexical
retrieval and articulation are disrupted. As the speaker dedicates more attention to trying
to access less frequently used lexical items, less attention can be paid to smooth
articulation of already retrieved lexis and syntactic encoding, and errors occur.
For the low group literal translation and risk taking were high on the Art
Description in comparison to the other two tasks. This was because the low group
were challenged to use language they were less familiar with in this task. As they lacked
these items they used literal translation to get their meaning across, which was a
successful strategy, as it was understood by their partners due to their shared L1. For the
same reason, they felt they were taking more risks as they were less sure that they had
retrieved the correct lexical items, as revealed in stimulated recall comments such as the
following:
Art Description
(26) Task & Recall (low proficiency)
*SEP: er er what simbolitzise er this bird ?
*SEP: the bird of the door [//] in the door.
SePi0202: We were saying simbolitzise the whole time but we didn’t know if it was
right...yes I risked a a bit with symbolising.
6.2.2.4 Conversation-flow Maintenance strategies
CFM strategies included strategies to maintain or enhance the conversation,
keeping the channel of communication open as the speaker searched for a way to
overcome their L2 resource deficits. Among these strategies gesture and task familiarity
differed across tasks, as well as use of fillers for the low group. For gesture, as will be

286
recalled, two types of strategy were coded, gestures which accompanied the utterance to
elaborate on what the speaker was saying (McNeill, 2000) and a gesture which was
used in place of a word or phrase, which substituted language.
Both proficiency groups used gesture most on the Information Gap. This
seemed to be because a lot of the information they had to relay was either spatial
(behind, to the right, in the corner) or related to shapes (square, triangular, spiral) on
the Information Gap or motion (through the door, out of the mouth) on the Art
Description, which typically elicits ionics which “simulate or portray movement or
objects” (McCafferty, 1998:78), as this example from high proficiency learners
indicates:
Information Gap
(27) Task (High Proficiency)
*SAN: ok I think that my: [/] my picture is different because I have first a cross and then
I have that square with the four triangles but I have the [/] the [/] the
&=ges:handhoriz top one painted.
On the Art Description learners also used more gesture than on the Picture
Story. On the former task they may have felt the need to elaborate on the difficult
concepts which they could not fully express in speech, as seen in Excerpt 25 above. As
described by Kellerman (1992) gesture reduces ambiguity in the verbal message and
enhances comprehension by increasing redundancy. In contrast, on the Picture Story
gesture was not as necessary as participants could both see the task, they did not have to
differentiate between spatial referents and did not have to express difficult concepts.
Task familiarity was higher on the Picture Story, lower on the Information
Gap and lowest on the Art Description, which was confirmed in recall comments.

287
Therefore, more strategies were used on the less familiar tasks. As described in Chapter
3, many task-based researchers (Bygate, 2001; Foster & Skehan, 1996; Prabhu, 1987;
Robinsion, 2001; Skehan, 2009) have acknowledged task familiarity or prior knowledge
as one of the factors that makes tasks easier, because when a task is more familiar the
cognitive load is lower, so fewer communication problems arise, which leads to lower
strategy use. This was also confirmed by learners perceptions in this study, as task
difficulty was lowest on the Picture Story where familiarity was high, and highest on the
Art Description, where familiarity was low.
For the low group use of fillers occurred more frequently on the Art
Description. As the task was difficult and required reasoning, learners needed time to
think about what to say, as well as search for the necessary language, so they used
fillers to hold the floor while they completed their turns. This is illustrated in Excerpt
25, above. When *SUS says “I don't know stay one moment”, she is asking her partner
to wait while she thinks of what to say before she continues her turn.
6.2.2.5 Planning strategies
Planning strategies were metacognitive strategies not directly involved in
language use. Strategies which differed were organisational planning, which was
planning the macro-structure of the task and order of what was to be said.
Organisational planning was higher for the high group on both Picture
Story and Art Description compared to the Information Gap. On the Picture Story pre-
task planning transcripts showed that learners discussed what was happening in the
story, usually by following the order of the picture frames or they referred to certain
picture-frames or between pictures where they could not work out the connection, as
illustrated in Excerpt 28. Recall comments suggested that planning was carried out

288
online, as learners were performing the tasks, as well as pre-task planning, before the
tasks, as shown in Excerpt 29:
Picture Story
(28) Task (High Proficiency)
...
*TOM: he's drunk already
*FER: no
*TOM: I know because he fell but what's the bottle doing
*FER: and he break +/.
*TOM: look at this .
*FER: ok so
*TOM: I don't know if he's suffering from the fall or alcohol poisoning.
*FER: I don't know [=! whispers] .
*FER: I expect it's not blood.
*FER: well anyway he broke his leg.
*TOM: I I I don't understand the picture before this one so he fell and after
that he was +/.
*FER: I think she's trying to help him to arrive to the hotel or something .
*TOM: ah, ok.
...
(29) Recall (High Proficiency)
Researcher: Did you think about how you would explain it beforehand?
MaVi0202: Well I thought about it while not before.
The reason organisational planning was higher on the Picture Story and Art
Description compared to the Information Gap was because they were more open tasks
so learners could prepare a lot more beforehand: either their part of the story for the
Picture Story or interpretations for the Art Description. On the Information Gap, due to
its more closed interactive design, far less planning could be done as the task was
developed in the course of the interaction, which could not be predicted beforehand.

289
Advance organisation was higher for the low group on the Art Description.
This may have been because they needed more time to think about the meaning of the
elements in the task, as well as the language. In contrast, in the other tasks meaning was
evident and they only needed to search for the appropriate language.
6.2.2.6 Evaluating strategies
Evaluating strategies are also hierarchical metacognitive strategies. Task had no
effect on Evaluating strategies. As recall comments concerning evaluating were of the
same nature across tasks for both proficiency groups; learners evaluated by either
making a general negative or positive judgement, or by identifying one particular
problem, it was decided that PSU and ASU were consistent, as the quality of evaluation
did not change across tasks. The reason for no change in evaluating strategies may be
that they are more trait-like strategies than state-like ones, determined more by internal
learner factors (cognitive learning style, intelligence, personality) than external ones.
Although, as some strategy training studies have shown, these strategies can change in
the long term with awareness raising and instruction (see for example, Cohen, 1998;
Dörnyei, 1995, for strategy training studies, and Foster & Skehan, 1996; Gilabert, 2004
and Zhang, 2007, for strategic planning studies).
6.2.2.7. Few differences across tasks
As previously described, according to PSU less than half of the individual
strategies (34%: high proficiency, 9%: low proficiency) on the SQ differed across the
three tasks. ASU revealed that PSU underestimated differences, as 45% differed for the
high group whereas 50% differed for the low group. Nevertheless, between any two
tasks it was still less than half of the strategies that differed, with most differences being

290
between the Information Gap and the other two tasks. These results are also in line with
a previous questionnaire study (Khan & Victori, in press) where even fewer differences
in PSU were observed for intermediate proficiency learners across the same three tasks.
However, as in the present study, PSU was confirmed by ASU, it brings further
evidence forward to suggest that strategies do not vary much between tasks in this
context.
One explanation why many strategies did not change may be that although the
three tasks differed in particular characteristics, other variables, such as the task
conditions, were the same, overriding the influence of task features on strategy use. As
will be recalled from Chapter 4, the tasks had other factors in common: they were all
communicative, they involved interaction, participants interacted with the same partner
on each task, the tasks were performed in the classroom and the tasks had been designed
to provide each learner with an equal opportunity to participate. These factors may have
had a stronger influence in determining strategy use than the specific features of each
task. A pilot study (Khan, 2006) supports this argument, as only very few differences in
individual strategies and no significant differences across groups of strategies were
found when a narrative task was manipulated for certain cognitive and interactional
characteristics.
6.3 Between-groups comparisons
6.3.1 Spoken Production
Research Question 3.1: Are there differences between low and high proficiency
learners’ spoken production on each task?

291
In order to answer this question statistical comparisons between the two
proficiency groups were made for all the spoken production measures with Mann-
Whitney tests. Findings showed that there were differences in accuracy, lexical
complexity, structural complexity and speech rate, which were consistently higher for
the high group on all tasks. However, there was little difference between proficiency
groups in terms of fluency breakdown and fluency repair. In terms of self-repair the
only difference was that the low group used less self-repair on the Information Gap.
Native speaker benchmarks served to see if the spoken production measures were
distinguishing between proficiency levels, which was found to be true for fluency,
accuracy and lexical complexity, as NS scored higher than both NNS groups for these
measures. However, it was not so for structural complexity, where NS scored slightly
lower than the high group on the Picture Story and Art Description. Neither was it so for
reformulation, as NS reformulated more than both NNS groups on the Art Description.
Firstly, regarding the differences between low and high proficiency groups, the
high group were found to have more accuracy, lexical complexity, structural
complexity and faster speech rate on each task. This was to be expected due to their
more efficient speech processing mechanisms, greater L2 resources and more parallel
processing (Poulisse & Bongaerts, 1994). Native speakers scored higher on all these
measures than the high proficiency group. This suggests that these production measures
were suitable indicators of proficiency, with more error-free, fluent and lexically
complex speech denoting more proficiency.
In terms of fluency breakdown and fluency repair, on the whole, there was
little difference in long pauses, repetition and reformulation between groups on all
three tasks. However, there were significant differences in speech rate, with speech rate
being consistently and significantly higher for the high proficiency group across all

292
tasks. Therefore, these results must be interpreted with caution. Speech rate clearly
distinguished between the fluency of low and high proficiency groups, but the number
of long pauses, repetitions and reformulations did not distinguish well between
proficiency groups. Other researchers have found similar results for fluency breakdown
(Niwa, 2000; Skehan, 2009) and have claimed that different proficiency levels may
pause and repair for different reasons. For the low group they may have come across
more problems in lexical access due to their smaller L2 resources. In contrast, for the
high group pausing and repair may have allowed them more time to produce more
complex output, as they made greater efforts to meet the demands of the tasks. Niwa
(2000) came to a similar conclusion when finding that learners with high aptitude were
less fluent on a complex narrative task compared to low aptitude learners.
On the Art Description, for native speakers, fluency in terms of
reformulation was lower65 in comparison to both NNS groups [NS: M= 5.74, High
group: M= 7.18, Low group: M= 8.19]. In other words NS reformulated more. The
reason for this could be that the task also posed a challenge to NS in terms of how to
interpret the paintings, as confirmed in task transcripts. As native speakers did not make
long pauses to think about what to say, they thought about what to say while articulating
their messages and this interfered with smooth articulation, resulting in more
reformulation.
The level of self-repair was not significantly different between the low and
high groups on the Picture Story and Art Description although the low group made
more errors on these tasks. As previously reported, self-repair was measured as
correction of lapses in lexical, grammatical and phonological errors (Kormos, 1999).
Similar results have been found by other researchers studying self-repair (Gilabert,
65 As will be recalled reformulation was a fluency measure, measured as AS units divided by the number of reformulations. Therefore, a low mean represents low fluency, or more reformulation.

293
2007; Kormos, 1998; O’Connor, 1988). O’Connor (1988) found that the nature of self-
repair differed between high and low proficiencies rather than the number of self-
repairs, with advanced learners paying more attention to monitoring discourse level
aspects of speech rather than lexical and grammatical accuracy. Both Kormos (1998)
and Gilabert (2007) also explained their results in this way, as they found no difference
in the number of self-repairs of low level structural errors for low and high level
learners.
On the Information Gap, however, the low group self-repaired significantly
fewer errors [High: M= 11.79%, Low: M= 3.37%]. The reason for this may be found
by turning to learners’ perceptions of this task and the task duration. The low group
found the Picture Story and Information Gap easy compared to the Art Description,
whereas the High Group only found the Picture Story easier. Furthermore, the high
group took slightly longer to do the Information Gap (High group: M= 12.58m, Low
group: M= 11.16m). These findings imply that the high group perceived difficulty in the
Information Gap and, possibly, in making more effort to meet the task demands they
took longer compared to the low group, and self-repaired more. In other words, as
argued before in Section 6.2.13, the high group had higher communicative goals on the
Picture Story but possibly on the Information Gap, as well. This meant they tried to be
more precise and compared their pictures more thoroughly, which resulted in more self-
repair. This finding is complemented by the high group’s higher lexical complexity [M=
40.54] and accuracy [M= 81.04] scores compared to the low group’s [lexical
complexity: M= 29.21, accuracy: M= 54.62], which were nearly as high as the NS
benchmarks [lexical complexity: M= 49.92, accuracy: M= 99.18]. These excerpts,
comparing a high and low proficiency pair describing the same element in a picture,
illustrate this:

294
Information Gap
(30) Task (High Proficiency)
*TOM: do you have er: [///] does this truck er carry something some luggage or
something like that?
*FER: yes .
*FER: yes it's like a: little mountain +/.
*TOM: like a sand [//] like a pile of sand or something like that or the earth or something
similar ?
*FER: well yes like er [/] it's like [///] yes probably it's like ear(th) [/] like earth you
know &=ges:handcup.
(31) Task (Low Proficiency)
*JOS: the: number two have got a: [/] # a: little truck with er # something [/] with
something +/.
*JOR: object &=ges:back.
*JOS: yes .
As for native speakers, they did not self-repair on any of the tasks as they did not
make any of the types of errors identified in the study. In a study by Kormos (2000)
native speakers used self-repair less than L2 speakers but they corrected the
informational content of their speech more. This could have been the case in this study
as several instances of self rephrasing were identified, as this excerpt illustrates:
Information Gap
(32) Task (Native Speakers)
*GRY: ok I've got that in the second column +/.
*SUE: three windows a door well a door on the right hand side.
In terms of structural complexity, NS scores were lower than for the high group
on both the Picture Story and Art Description. Other studies have found similar results
(Ortega, 1999; Skehan, 1998) for oral performance. Considering structural complexity
was measured as the amount of subordination, native speakers used subordination less,
in other words, fewer clauses per AS unit. Therefore, subordination seems to be a way

295
for high proficiency learners to express complexity. However, native speakers may take
other routes towards complexity. In fact Norris and Ortega (2009) have pointed out
some of the limitations of the clauses per unit measure used in this and many other
studies, one of these being that a clause may be lengthened by several non-
subordinating means. For example, adding adjectives or prepositional phrases modifies
and complexifies elements, but this will not alter the score for the number of clauses per
AS unit. Subclausal complexification such as this may be evident in lexical complexity
scores, and this was indeed the case in this study where native speakers’ lexical
complexity scores were significantly higher across all tasks than the high proficiency
group.
Some spoken production measures did not distinguish between the two different
proficiency levels on the same task. In addition, it seemed as though some tasks were
more appropriate than others in distinguishing proficiency levels. On the Information
Gap, differences in accuracy and lexical complexity were small between NS and the
high group, as described above, and differences in structural complexity were small
between all groups [NS: 1.31, High: 1.27, Low: 1.20 clauses per AS unit]. In other
words highly controlled tasks, such as the Information Gap in this study, in constraining
language use, do not distinguish well between different proficiency levels. This has
important implications for oral language testing (Bachman & Palmer, 1996; Swain et
al., 2009).
In the few CAF studies which have included native speakers (Davies, 2003;
Skehan and Foster, 2008; Skehan 2009), Skehan (2009) describes fluency and lexis as
the main difference between native and non-natives, which is in line with the results of
this study, where accuracy, fluency (speech rate) and lexical complexity were
consistently higher for native speakers. Skehan claims that for fluency, it is the position

296
of pauses rather than the quantity which distinguishes NS from NNS (Davies, 2003;
Skehan & Foster, 2008), with NS pausing more at the end of clauses at AS boundaries,
probably for online planning. NNS, in contrast, pause more mid-clause, probably due to
less smooth speech processing caused by lexical deficits. As for lexis, Skehan (2009)
claims that “the value of D was not particularly revealing regarding task effects” in
comparing NS and NNS. This did not seem to be the case in this study, however, as the
three task types were clearly distinguished by different D values (the measure used to
measure lexical complexity), with scores being significantly higher for NS across all
three tasks.
Summing up, expected differences between proficiency groups were found in
terms of overall accuracy, speech rate and complexity with high groups scoring higher
due to more efficient speech processing. On the other hand fluency breakdown, fluency
repair and self-repair did not distinguish between proficiency levels, possibly because
the underlying reasons for these phenomena occurring are different. Including native
speaker benchmarks also helped to reveal that structural complexity does not distinguish
between learners at high proficiency levels and that accuracy and complexity are not
reliable measures for distinguishing proficiency on information-gap type tasks.
6.3.2. Strategies
Research Question 3.2: Are there differences between low and high proficiency
learners’ perceived strategy use on each task ?
As previously described, high and low proficiency learners’ PSU was compared
on each task. Firstly, between-group comparisons of PSU revealed that there were few
significant differences between proficiency groups on any task. Secondly, the few

297
differences were mainly for Compensation strategies, of which the low group used
more. ASU confirmed these results as summarised in Table 5.41.
Firstly, the majority of strategies did not differ between proficiency groups.
This suggests that task characteristics determine the extent of strategy use more strongly
than proficiency. When each group performed a task they adjusted their strategy use in
the same way, resulting in few between-group differences. These results contradict
some general LLS questionnaire studies which have claimed that high proficiency or
more effective learners use more strategies (Chamot et al., 1987; Green & Oxford,
1995; Griffiths, 2003; Oxford & Crookall, 1989; Vogely, 1995). However, such studies
focused on general language learning strategies and did not contextualise strategy use to
a task, as in this study, which could have caused this discrepancy.
However, it must be recognised that results in strategy research have been
mixed. The finding that there were few differences in strategy use between proficiency
groups is in line with results from other studies, such as Sanaqui (1995), for example,
who did not find differences in vocabulary strategy use between proficiency groups and
Oxford et al. (2004), who found few differences in reading strategy use between
proficiency groups. In terms of speaking, Swain et al. (2009) found no difference in
perceived strategy use between proficiency levels on TOEFL speaking tests. Nakatani
(2006), who contextualised oral communication strategies to an oral roleplay task,
found that, of the 15 strategy categories on the OCSI, there were significant differences
between proficiency levels for only four categories.
Secondly, the one difference that was found was that the low group used more
Compensation strategies on the Picture Story and Art Description. This was
possibly because they encountered more lexical problems, due to their smaller set of L2
lexical resources compared to the high group. Also, as described in the previous section,

298
these strategies were less cognitively demanding than Interactional strategies and
therefore more accessible to the less proficient learners. These are some of the reasons
other researchers, with similar results, have given (Chen, 1990; Labarca & Khanji,
1986; Liskin-Gasparro, 1996; Paribakht, 1985; Poulisse, 1990; Rossiter, 2005; Victori,
Tragant & Thompson, 2008; Yoshida-Morise, 1998).
On the Information Gap, as the task design specifically elicited Compensation
strategy use, the high group increased their use of these strategies, which they had not
needed on the other tasks, and the low group continued to use them as they had done on
the other tasks. The types of Compensation strategies differed, however. Whereas the
low group continued to use code switching and clarification by code switching more
than the high group, the high group used restructuring and message abandonment more.
This is in line with other studies which have found that low proficiency learners used
more L1-based strategies compared to L2-based strategies (Bialystok, 1983; Liskin-
Gasparro, 1996; Manchón, 1989; Paribakht, 1985; Ting & Phan, 2008).
Apart from Compensation strategies, there were a few differences in individual
Interactional strategies on the Art Description and Information Gap tasks. These
strategies were used to overcome comprehension problems which were caused by the
task difficulty. However, it seems that the low group used less cognitively challenging
strategies (clarification requests and guessing) more suitable to their particular
developmental stage of learning while the high group used a more cognitively
challenging strategy, interpretive summary, as they had sufficient L2 resources to
employ it. This explanation is in line with claims made in other studies (Corrales &
Call, 1989; Khanji, 1996; Oxford et al., 2004).
As for CFM strategies, the high group employed use of fillers more on the
Picture Story and gesture more on the Information Gap. On the Picture Story use of

299
fillers was employed more because the high group were able to explain a lot more of the
story more quickly, without coming across as many lexical problems, so, at the end of
utterances they tended to use fillers as they thought of more details to add. In contrast,
the low group required all their attention to just explain the basic events and they took
much longer to do this. Therefore, instead of using fillers to extend their turns they
handed over the floor to their partners. This is also reflected in the lower structural
complexity scores of the low group on this task. The following excerpts from the second
picture in the sequence illustrate these differences:
Picture Story
(33) Task (low proficiency)
*CRI: they: decided goes to the beach and when [/] when [/] when they arrive at the
beach they see very many #2 +/.
*CRI: basura?
*ALB: dirty.
*CRI: dirty.
*CRI: the [/] the beach is very: dirty and [/] and they: er are very: surpren(ded) [/]
surprended +/.
(34) Task (high proficiency)
*FER: ok and in the next one I think they have decided go to the beach but another time
they have realised that the beach is very dirty so it's impossible to swim and: # I
don't know maybe they want to try to clean but it's a bit difficult because it's
really dirty so maybe they decide to go to another place to follow with the her
honeymoon.
As for more gesture being used on the Information Gap by the high group, it
may have been because the high proficiency group were generally more concerned to
elaborate on details, and so using gesture was another means for doing this. Gregersen
et al. (2009) also found that advanced learners of Spanish used more gesture that
accompanies speech (illustrators) than lower levels.

300
Advanced learners, for instance, often had adequate lexicons to retrieve low-
frequency words and were using a combination of the verbal and nonverbal in
tandem to create meaning through the use of illustrators. Gregersen et al.
(2009:201)
It may be that the low group tried not to use gesture, if they viewed it as a
negative strategy which would undermine their spoken performance. However,
following Gregersen et al. (2009) it could be that learners’ increased verbal proficiency
is accompanied by a corresponding improvement in their non-verbal prowess. Another
explanation, noticed during strategy coding, was that specific participants tended to use
gesture more than others. If more of these participants happened to be in the high group,
this would have skewed the results in this way.
In sum, the higher use of Compensation strategies by the low group can be
explained in terms of their smaller L2 lexicon and the difference in use for the few other
strategies can be explained by the ability of the high group to carry out faster speech
processing, to use more cognitively challenging strategies and having higher
communicative goals. As for the strategies which did not differ, it may be that different
proficiency levels use the same type and quantity of strategies but they may be
employing them in different ways or for different reasons, as the clear differences in
spoken production imply.
6.4 The Strategy Questionnaire as a predictor of spoken production
Research Question 5: How well does perceived strategy use on the Strategy
Questionnaire predict spoken production?

301
As described, perceived strategy use, in terms of the five factors (Interactional,
Compensation, Conversation-flow Maintenance, Planning and Evaluating strategies) on
the SQ, was examined to see how much the questionnaire could predict the eight
measures of spoken production (error-free clauses, lexical complexity, structural
complexity, speech rate, long pauses, repetition, reformulation and self-repair). Findings
revealed that the five factors or strategy categories on the SQ are a weak predictor of
three of the eight spoken production measures: lexical complexity (15%-36%), accuracy
(12%-23%) and speech rate (15-31%) and that the SQ is a better predictor of these
measures on tasks where more strategies are used, which, in this study, were the Art
Description and Information Gap.
Compensation strategies made the strongest unique contribution to these
predictions. In other words, the more learners perceived using Compensation strategies
on the SQ the lower their accuracy, lexical complexity and speech rate was likely to be.
As will be recalled from Chapter 4, Compensation strategies are strategies employed
mainly to overcome lexical deficits. Therefore, it is not surprising that their use is
associated with lower lexical complexity. Compensation strategies in this study were
L1-based strategies such as code switching and literal translation, avoidance-based
strategies such as omission and message abandonment and L2-based strategies such as
approximation and restructuring. As previously explained these strategies involve small
changes to the preverbal message compared to Interactional strategies. As these
strategies interrupt the smooth flow of the L2, as learners switch to L1, abandon
simplify or restructure their message, it seems fitting that their use results in lower
accuracy and speech rate, too.
In this study accuracy, lexical complexity and speech rate have distinguished
clearly between learners’ proficiency levels. Considering this, these results provide

302
further evidence that the more CS used, the lower the proficiency (Chen, 1990; Labarca
& Khanji, 1986; Liskin-Gasparro, 1996; Paribakht, 1985; Poulisse, 1990; Rossiter,
2005). For example, Labarca and Khanji (1986) found negative correlation between CS
use (Tarone’s taxonomy), equivalent to the Compensation strategies in this study, and
oral test scores.
As for metacognitive strategies, on two tasks (Picture Story, Information Gap)
the more learners used metacognitive strategies (Planning or Evaluating) the less
accurate they were or the slower the spoke. In contrast, on the Art Description planning
strategies correlated positively with lexical complexity. Therefore, where Compensation
strategies appeared clearly to be detrimental across the three tasks, mixed results were
obtained for metacognitive strategies. Many strategy researchers have advocated that
metacognitive strategies have a positive impact on performance (for example, O’Malley
et al., 1985; Victori, 1999; Wenden, 1998). However, what distinguishes the present
study from these ones is that the results are concerned only with spoken performance.
Two recent studies on strategies and spoken performance also found negative effects of
metacognitive strategies (Huang, 2010; Swain et al., 2009). Huang found Evaluating
content, planning and setting goals (metacognitive strategy categories) were negatively
correlated with oral production scores for some tasks. Also, Swain et al., (2009) also
found negative correlations with some metacognitive strategies and speaking test scores.
It may be that the unique nature of spoken performance, which requires fast and parallel
speech processing mechanisms, means that attention to metacognitive strategies detracts
attention from producing fluent, complex and accurate speech, and so metacognitive
strategies may be detrimental, particularly for low proficiency levels or, as this study
shows, for particular tasks. Therefore, the present study does not advocate across-the-
board use of metacognitive strategies in the case of oral communication.

303
The regression analysis in this study also provides further confirmation of other
results in the study, such as the between-groups analysis, where the low proficiency
group used more Compensation strategies and had lower accuracy and complexity
scores. In addition, the fact that the SQ is only a weak predictor of accuracy, lexical
complexity and speech rate and the presence of negative correlations between some
groups of strategies and spoken production measures further contradicts claims that the
relationship between strategies and proficiency is linear or that the more strategies used
the better.

Chapter 7
Conclusion

304
7.1 Final conclusions
This final chapter draws conclusions from the multiple findings in this
investigation and acknowledges the limitations of the study. Some implications for
learning and teaching in the EFL classroom are put forward and suggestions are made
for future research directions within this field of enquiry.
The motivation for this research was to find out what learners do when they
perform oral tasks in pairs in the EFL classroom. Performance was examined in terms
of language learner strategies and spoken production measures (complexity, fluency and
accuracy) in the context of three different tasks. As for strategies, those that were
reported by learners (PSU) were compared with those actually used (ASU), primarily to
test the validity of a strategy questionnaire but also to obtain deeper insights into
strategy use. Particular task characteristics were considered as well as learners’
proficiency levels, to see if they affected the outcomes in spoken performance.
Although many studies have investigated either strategy use or spoken production
across different tasks, few studies, such as this one, have considered both of these
aspects of oral communication and even fewer have contrasted PSU and ASU. Hence,
five main research questions guided this study, which were introduced and elaborated in
Section 0.3. In brief these were:
1) Are there differences across tasks in spoken production for high and low
proficiency learners?
2) Are there differences across tasks in perceived strategy use for high and low
proficiency learners?
3) Are there differences between low and high proficiency learners’ spoken
production and perceived strategy use?

305
4) Does PSU reflect ASU for low and high proficiency learners?
5) How well does PSU on the SQ predict spoken production?
The following conclusions drawn from this study are presented in relation to these
questions:
1) Across-task differences in spoken production and strategy use can be predicted
from task characteristics
One conclusion which emerged from findings in answer to Research Questions 1
and 2 is that across-task differences in spoken production and strategy use can be
predicted from task characteristics, particularly in terms of CAF and to some extent in
terms of strategy use. Task-based researchers have generally come to the same
conclusion and justify researching task features in order to make more informed
decisions about task sequencing in the language classroom.
Closed, two-way, split information tasks (Information Gap) elicit more accuracy,
fluency and Interactional strategies, as the tasks require information exchange and
meaning negotiation. If such tasks also include unknown lexical items, as in this study,
it is predictable that the task will elicit Compensation strategies. Such tasks will result in
low lexical complexity as they are usually limited to focusing on a particular
grammatical structure or lexical domain, and also structural complexity due to their
interactive nature (Robinson 2001). In contrast, tasks with abstract concepts (Art
Description) elicit the greatest lexical complexity. Tasks which require reasoning
promote structural complexity, which is higher if simple reasoning is required (Picture
Story) compared to complex reasoning (Art Description). Task complexity (Art

306
Description) promotes accuracy and Interactional and Compensation strategy use, but to
a lesser extent than if tasks are designed to be more interactive (Information Gap). More
one-way/+reasoning tasks (Picture Story, Art Description) elicit more pre-task planning
and long pauses (online planning), whereas little or no pre-task planning is possible for
two-way Information Gap tasks. All in all these findings add to the evidence that
strategy use is an integral part of the task being performed. Task designers can
manipulate tasks to elicit certain strategies and strategic competence is indeed an
important component of communicative competence, as Bachman (1990) and Bachman
and Palmer (1996) claim..
Furthermore, spoken production results mainly support Skehan’s (2001) Limited
Attentional Capacity Model which predicts a trade-off between accuracy and
complexity which are in competition, because when complexity was high, accuracy was
low and vice-versa. However, comparing the Picture Story and Art Description, both
accuracy and lexical complexity were higher on the latter more complex task, which
also supports Robinson’s (2005) claim that accuracy and complexity are not always in
competition.
Although many of these findings have already been reported in other task-based
research, as cited in previous sections, what distinguishes our results from these studies
is that both strategies and spoken production measures were examined together in the
same sample population and for the same tasks, allowing us to observe directly how
differences in accuracy, fluency or complexity were accompanied by differences in
strategy use. Furthermore, the strategies were not only identified in transcripts by the
researcher, but also perceived by the learners themselves as reported on a strategy
questionnnaire. Their reports described predictable differences across tasks on the basis
of speech processing theory and cognitive and interactional task characteristics. All in

307
all, analysing tasks according to strategy use as well as spoken production measures
provides a richer picture of spoken performance.
2) Strategy use for oral communication in the EFL classroom context is low but
highly diverse
The generally low level of strategy use on the three tasks was put down to
certain learner factors in the EFL context which remove the need to employ strategies.
These were identified as the need to save face, frustration that may be caused by
negotiating meaning and learner’s empathy for each other. As previously mentioned,
similar results were found by Khan and Victori (in press). Therefore it is important to
take this into account when designing strategy research, as NNS-NS speaker contexts
may be more fruitful in eliciting strategies than NNS-NNS contexts.
Poulisse (1993) describes the motivations learners have for using certain
strategies as based on Grice’s conversational maxims. It is easy to see the Least Effort
Principle (Grice, 1975) at work in the EFL classroom where performing oral
communication tasks, particularly for low proficiency learners, involved a great deal of
L1 strategies. If learners came across a problem they reverted to L1 to resolve it,
sometimes even carrying out parts of the task in L1. They prepared the task in their L1
and they even negotiated meaning in their L1. It seems to be that the lack of purpose for
authentic communication and the artificial classroom context has an important effect on
strategy use.
As the focus of this study has been mainly on differences between tasks and
proficiency groups and not describing the strategies on each task, it is easy to overlook
the diversity of strategy use. About 90% of the 44 strategies on the questionnaire were

308
confirmed in the qualitative data, as well as, at least, eight additional strategies which
have not been reported in this study, for both proficiency groups. This shows that,
between them, the 48 participants brought a broad range of about 50 kinds of strategies
to the tasks, despite low extent of strategy use. This result is in line with Swain et al
(2009) who identified 49 different strategies from stimulated recall sessions after 30
participants performed the six tasks in their study.
3) Task characteristics influence strategy use more than proficiency
Another conclusion reached from findings to Research Question 3 is that
strategy use, despite being low, is determined more by the task undertaken than by a
learner’s proficiency level. This was drawn from the fact that there were fewer
differences in strategy use between low and high proficiency learners on each task than
across tasks. In other words, both proficiency groups altered their strategy use in a
similar way in response to the task demands. It was suggested that different proficiency
levels use the same type and quantity of strategies, but they may be employing them in
different ways or for different reasons, as the significant differences in spoken
production between proficiency levels imply. The few strategy differences between
groups were explained by the low proficiency group’s smaller L2 resources and the
ability of the high group to carry out faster speech processing, to use more cognitively
challenging strategies and having higher communicative goals.

309
4) Task-based strategy questionnaires are moderate indicators of actual strategy
use
One important outcome from this study is concerned with the strategy
questionnaire and the validity of perceived strategy use. Concluding from the results
from Research Question 4, task-based strategy questionnaires are a moderate indicator
of actual strategy use as learners reported about half the strategies on a questionnaire
consistently, as well as detecting actual differences in strategy use across three different
tasks. These findings have important practical implications concerning the use of
strategy questionnaires in strategy research, which have so far been the predominant
method of data collection. Firstly, providing learners with a task, which has not always
been done in LLS research, seems to be crucial in obtaining accurate reports on strategy
use, as it ensures that all learners draw from the same source (the just-completed task).
Our findings show that learners can correctly report the extent of use of a mixture of
strategies, even when strategy use is low. Furthermore, making statistical comparisons
across tasks with a task-based questionnaire is more accurate with higher proficiency
levels as low proficiency learners were less precise in reporting differences across tasks
in this study. In addition, in terms of validation, the task provides the essential source
from which a researcher can trace strategy use, especially if complemented with
stimulated recall. Also, comparing more than one tasks allows for a more precise
assessment of validity than if only one task is used.
As explained above, very few strategy studies have examined the validity of
strategy questionnaires (Bråten & Samuelstuen, 2007), despite calls by strategy
researchers for the need to do so (Gao, 2007; Nakatani, 2006; Phakiti, 2003). This lack
of validation carried out so far may be due to the difficulty in tracing strategies (thought

310
processes or behaviours) in qualitative data to be able to contrast them with learners’
reports as well as the fact that it is time consuming. Considering no other studies, to the
author’s knowledge, have undertaken validity measures with such a big sample (N=48),
and taking into account that an attempt was made to trace all the strategies on a
questionnaire, this study brings fresh evidence and a unique contribution to research in
this area.
5) The relationship between strategies and spoken production in non-linear.
The conclusion drawn from Research Question 5 was that the SQ could only
serve as a weak predictor of spoken production as it was mainly Compensation
strategies that were the strongest predictors of accuracy, lexical complexity and speech
rate. These results confirmed the between-groups results of this study, as it was
Compensation strategies, accuracy, lexical complexity and speech rate that
distinguished most between proficiency groups. The lack of correlation between the
other strategy groups and spoken production measures suggests that the relationship
between them is non-linear and complex. Other results in this study generally point to
the same conclusion, as some spoken production measures, such as structural
complexity between NS and high proficiency levels and fluency breakdown and fluency
repair between low and high proficiency levels, and most strategy groups (Planning,
Interacational, CFM and Evaluating) did not distinguish between proficiency groups.
This means that learners may use the same strategy for different reasons and achieve
different results in terms of spoken production. It also supports those researchers
(Grenfell & Harris, 1999; Macaro, 2006; Tragant & Victori, 2006) who claim that
strategies cannot be viewed as inherently good or bad.

311
These results have important implications for research into oral communication.
Firstly, more representative ways of measuring complexity and fluency need to be
found. For example Skehan (2009) suggests comparing the position of pauses rather
than the number of pauses for fluency and Norris and Ortega (2009) suggest accounting
for sub-clausal complexity as well as subordination for complexity. Secondly, results
suggest that a strategy questionnaire is put to better use to study task effects rather than
proficiency ones and that more qualitative studies would shed light on between
proficiency group differences.
7.2 Limitations of the study
Some limitations of the present study will be acknowledged in this section. They
are concerned with the generalisation of the findings to larger groups, the need to isolate
the influence of particular task variables and some more minor considerations of task
design and performance.
Firstly, the most obvious limitation concerns generalisation of the findings from
the SQ to a broader group. As participants were university EFL students, findings can
only be generalised to this context. Furthermore, although the sample of 48 was large
for the qualitative analysis of actual strategy use, perceived strategy use was collected
from relatively small samples (N=24, for each proficiency group), and in such cases
non-parametric tests had to be used, with which differences may not reach significance
(Pallant, 2005). If the SQ had been administered to a larger sample population after the
three tasks, more significant differences may have been observed between tasks.
Questionnaires are ideal for gathering large amounts of quantitative data, so in future
research, this factor should be capitalised on.

312
Another limitation was that a few strategies on the strategy questionnaire could
not be identified in the dataset, which meant some items were unconfirmable. For these
items (use of expressions, avoiding risks, planning sentence structure) not enough
evidence had been found in the stimulated recall sessions. A more intrusive approach,
involving the researcher asking more probing follow-up questions, and stopping the
video at crucial moments during these sessions, may be required to elicit more
substantial information about them.
Finally, a minor limitation concerns the tasks employed. The design of the Art
Description meant that the participant who described their piece of art second was at an
advantage as they had already heard the task being performed by their partner, despite
the content of the two paintings being different. This advantage is reflected in the
shorter pre-task planning time for the second part of the task compared to the first (M=
104.05s for Part 1, M= 52.02s for Part 2, for the whole group). However, this factor is
only likely to have had a small effect on individual learners’ strategy use and spoken
production, but would not have had a notable effect on the combined scores of the
groups analysed.
As for the Information Gap, the split information design made it the only task
where participants could not share their information, but despite being told not to look
at each others’ pictures and despite being filmed on camera, some students couldn’t
resist the temptation. Such behaviour cut short or completely cut out negotiation of
meaning sequences and the Interactional or Compensation strategies involved, a factor
which would affect strategy use or spoken production results. Nevertheless, the results
of this study do reflect task performance as it would occur in an EFL classroom, rather
than in an experimental setting, so in this sense they provide a more realistic picture of
task performance.

313
7.2 Pedagogical implications
This study gives several indications of the appropriacy of certain task types and
possible applications for strategy questionnaires in the EFL classroom. Firstly, the
question of which task in this study is more appropriate for language learning is
addressed, according to the kinds of strategies and spoken production that were elicited.
In my opinion, of the three tasks examined, the Art Description was the best
choice. The need to explain abstract concepts clearly stretches learners to tap into more
of their world knowledge, which has a clear positive impact on lexical complexity. This
was particularly evident for the low group, as greater lexical complexity occurred
despite greater use of some Compensation strategies (literal translation, appeal for
help, clarification by code switch) and this was the only task of the three that enhanced
the low group’s lexical complexity. Furthermore, for both groups, accuracy, fluency and
structural complexity were not severely compromised as they were “medium”, between
the Picture Story and Information Gap, despite the task’s complexity. Besides, longer
pauses, despite having a negative effect on fluency scores on the Art Description, may
not necessarily have been detrimental to language learning, as it gave learners time to
produce more complexity and accuracy. In terms of strategies some Interactional
strategy use was enhanced, which could also be positive for language learning if the
resulting meaning negotiation sequences led to learners focusing on form, and even
more so if meaning negotiation sequences were correctly resolved. Therefore, this task
provided the most equal balance between the different spoken dimensions and strategy
use.
As for the Picture Story, although structural complexity was high, it was to the
detriment of both accuracy and fluency. Therefore, narrative tasks such as this one,

314
which was already sequenced and have a clear storyline, seem to be suitable for
focusing on this aspect of spoken production, developing more extended speech.
The Information Gap had the greatest impact on accuracy and fluency, which
represents learners using their existing L2 knowledge efficiently. Therefore,
information-gap tasks may be suitable for learners to practise what they already know or
perfect their knowledge of a particular L2 rule, as the closed split-information format
focuses learners on a particular aspect of the language. However, the task in this study
sacrificed both lexical and structural complexity, which are aspects of spoken
production that push learners to extend their existing L2 knowledge and lead to
interlanguage development. Furthermore, Interactional and Compensation strategy use
was high on this task for both proficiency groups. As will be recalled, the task was
designed purposely to elicit Compensation strategy use and these strategies seemed to
“get the task done” but seemed negative in terms of language learning, as at the end of
the Information Gap task, learners still did not know most of the lexical words required.
It may be justifiable to elicit Compensation strategies in tasks for research purposes but
from a pedagogical point of view, if task design encourages learners to use such
strategies, learners may come to depend on avoidance and L1-based strategies such as
code switching, literal translation and foreignising if they share the same L1, and they
could become a permanent part of their interlanguage, possibly leading to
fossilization66. It could leave learners ill-prepared for communication with native
speakers in more authentic contexts.
In the same way that meaning negotiation promotes noticing of correct form-
meaning relationships and so encourages SLA, it may also promote noticing and
acquisition of incorrect forms. For this reason, Interactional strategies could be
66 Fossilization occurs when language errors become a permanent feature of a learners’ interlanguage system (Canale & Swain, 1980; Selinker, 1972).
315
detrimental to learners of similar levels. This is particularly evident in cases of
pronunciation. As learners share the same L1, they can understand each other even
when their pronunciation is unacceptable to the native speakers.
This study also provides valuable insights for designers of task-based tests of
spoken language, particularly because NNS-NNS pairs are a commonly employed
format, such as in the speaking section on the UCLES EFL examinations. It has
furthered our understanding of how different task features influence spoken output and
the underlying speech processing mechanisms involved in NNS-NNS interaction.
Drawing from these findings, more informed decisions can be made regarding the task
features that make a task more cognitively complex or more interactive. More accurate
predictions can be made concerning the type of speech that will be elicited in order to
design effective test tasks which will, on the one hand, bring out the best in all three
CAF performance areas and strategy use and on the other hand distinguish well between
different proficiency levels.
Another question concerns the value of the SQ as an instrument for strategy
training. Firstly, the results of this study clearly show that prescribing particular
strategies to learners or warning learners not to use strategies would not be an advisable
approach, even in relation to particular tasks, as there was no direct linear relationship
between individual strategies and spoken proficiency. This stance, therefore, does not
favour the type of strategies-based instruction (SBI) (Cohen et al., 1996) where learners
are introduced to individual strategies and then given situations in which to practise
them. However, learners could certainly use the SQ to develop their own effective
selection and orchestration of strategies in conjunction with specific oral tasks they are
required to perform in class.

316
One argument which has been used to justify strategy training and is also relevant
for the SQ, is that heightening awareness to strategies focuses learners’ attention on the
process of language learning and their stage in L2 acquisition, improving
comprehension, storage, retrieval and use of the learning material and ultimately
improving language learning (Oxford, 1990). This contrasts to a product-oriented
approach of feedback in the classroom. For this reason, strategy training with the SQ
may be fruitful, by making learners more aware of why they are doing a particular
learning task (for example to practise fluency, to use newly learnt vocabulary or
grammatical structures) and allowing them to reflect on the choice of strategies
available, which will determine how successfully they do the task. It may allow learners
to critically evaluate which strategies are effective or ineffective for them on any
particular task and may guide them more precisely towards the areas they need to
change or improve.
Another argument in favour of strategy training is that it gives learners the tools
to be more self-directed or autonomous and less dependent on the teacher. Using a
strategy questionnaire encourages a learner-orientated approach to learning. Researchers
in this field (Benson & Voller, 1997; Dickinson, 1987; Holec, 1981) claim that learners
who are responsible for their own language learning, take control of how, where and
when they learn the language, they are more aware of their language learning goals and
are consequently more effective at attaining them, independently of a teacher.
7.3 Future research directions
As with many such investigations, some findings have provided answers to
questions but others have been less conclusive and have given rise to even further
questions. These could be addressed in future research. Firstly, further research could be

317
undertaken with the dataset already available in this study. A large quantity of data was
collected, only a part of which has actually been examined to answer the research
questions posed. It became apparent during data analysis, however, that the seeds for
future research had already been planted, by taking alternative approaches to analysing
the same data.
For example, the content of pre-task planning could be compared across the
three tasks to examine its possible influence on spoken performance or strategy use.
Another line of investigation would be to measure successfully resolved negotiation of
meaning sequences across tasks and compare them to unresolved sequences. As
resolved sequences represent incidental focus on form and involve the resolution of
correct form-meaning relationships, the assumption is that they will lead to
comprehensible input (Long, 1980) and output (Swain, 1985) which in turn leads to
SLA. Hence, this would be a more effective way of determining which tasks were more
suitable for language learning, as it does not assume that more interactional strategies
leads to more SLA, but takes into consideration the quality and outcome of negotiated
sequences.
An interesting question which arose by comparing the study’s results with the
researcher’s impressions of how learners performed the tasks is to examine how
successfully the task outcomes were achieved by each proficiency group. Although
spoken production and strategies were examined in this study, successful task
completion or communicative success was not. By studying this essential side to task
performance the more effective learners in each proficiency group could be identified
and characterised according to their distinguishing features in terms of spoken
production scores and strategies.

318
In this study the stimulated recall comments which were required to validate the
SQ have been reported. However, a more in-depth analysis of this data could shed light
on more qualitative differences across tasks and between proficiency levels.
Apart from continuing the analysis on the data in this study, further studies on
task characteristics are needed. As particular task features, such as reasoning or
planning time, had not been examined in isolation, the interpretation of the results could
not be conclusive about which of several possible task variables was responsible for the
results obtained. Already a great deal of research has been done (see Robinson &
Gilabert 2007; Robinson, 2007 for a review) to identify task variables which are
involved in the nature of oral communication. Although it is very difficult to design
research tasks so that particular variables may be studied in isolation, this is an area
which is particularly interesting because of its immediate implications in classroom
practice and syllabus design.
Furthermore, what is essential in making results from different studies on oral
communication comparable is the standardisation of both tasks and the task-based
strategy questionnaires employed. In other words, future researchers should use the
same tasks or strategy questionnaires, such as Nakatani’s (2006) OCSI and the SQ in
this study, as previous researchers.
With regard to questionnaire validity, another question to address would be the
influence of the SQ on learners’ reports. Some influence of the SQ was noted by the
researcher in analysing the stimulated recall comments, as there were a few instances of
learners paraphrasing the SQ strategy descriptions when they were making their
comments. Therefore, by identifying strategies in tasks and in stimulated recall sessions,
strategy use across tasks with and without filling in questionnaires can be compared.

319
Finally, longitudinal studies which address the question of how task sequencing
could lead to second language acquisition would be of great importance both in research
and teaching. Most studies, like this one, have been transversal and, therefore, can at
most explain which tasks, for example, will elicit fluency or Interactional strategies.
However, acquisition of a second language is not directly examined. To this end
longitudinal studies examining task effects on spoken production and strategies are
needed. Taking on the approaches outlined here would certainly enrich our knowledge
of the complex interplay between task, learner and oral communication in the EFL
classroom.


References

320
Abraham, R. G., & Vann, R. J. (1987). Strategies of two language learners: A case study.
In A. Wenden, & J. Rubin (Eds.), Learner strategies in language learning (pp.
85-102). Englewood Cliffs, NJ: Prentice Hall.
Anderson, J. R. (1983). The Architecture of Cognition. Cambridge: Harvard University
Press.
Anderson, N. J. (1999). Exploring Second Language Reading: Issues and Strategies.
TEFL-EJ. Retrieved May 25, 2005 from www-writing.berkeley.edu/TESL-
EJ/ej13/r7.html
Anderson, N. J., & Vandergrift, L. (1996). Increasing metacognitive awareness in the L2
classroom by using think-aloud protocols and other verbal report formats. In R. L.
Oxford (Ed.), Language learning strategies around the world: Cross-cultural
perspectives (pp. 3-18). National Foreign Language Resource Center. Manoa:
University of Hawai'i Press.
Aston, G. (1986). Trouble-shooting in interaction with learners: the more the merrier?
Applied Linguistics, 7 (2), 113-127.
Bachman, L. (1990). Fundamental Considerations in Language Testing. Oxford: Oxford
University Press.
Bachman, L. F., & Palmer, A. S. (1996). Language testing in practice: Designing and
developing useful language tests. Oxford: Oxford University Press.
Bacon, S. M. (1992). Authentic listening in Spanish: How learners adjust their strategies
to the difficulty of the input. Hispania, 75, 398-412.
Baralt, M. (2009). Reasoning and convergence: The effects of task complexity and task
conditions on L2 oral production. Retrieved January 25, 2010 from
http://209.85.229.132/search?q=cache:_DWz24WKLPYJ:www.lancs.ac.uk/fass/e
vents/tblt2009/presentations/BARALT.pptx+Robinson,+P.+(2008)+task&cd=1&
hl=ca&ct=clnk&gl=es&client=firefox-a
Barcelos, A. M. F. (2003). Researching beliefs about SLA: A critical review. In P.Kalaja,
& A. Barcelos (Eds.), Beliefs about SLA. New Research Approaches (pp.7-33).
New York: Springer Science and Business Media.
Benson, P., & Voller, P. (Eds.). (1997). Autonomy and Independence in Language
Learning. London: Longman.

321
Berwick, R. (1990). Task variation and repair in English as a Foreign Language. Kobe
University of Commerce: Institute of Economic Research.
Bialystok, E. (1981). The role of conscious strategies in second language proficiency.
Modern Language Journal, 65, 24-35.
Bialystok, E. (1983). Some factors in the selection and implementation of communication
strategies. In C. Færch, & G. Kasper (Eds.), Strategies in interlanguage
communication (pp. 100-118). Harlow, England: Longman.
Bialystok, E. (1990). Communication strategies: A psychological analysis of second-
language use. Oxford: Blackwell.
Bialystok, E., & Kellerman, E. (1987). Language strategies in the classroom. In B. K.
Das (Ed.), Communication and learning in the classroom community (pp. 160-
175). Singapore: SEAMEO Regional Language Centre.
Block, D. (1998). Exploring interpretations of questionnaire items. System, 26, 403-425.
Bongaerts, T., & Poulisse, N. (1989). Communication strategies in L1 and L2: Same or
different? Applied Linguistics, 10 (3), 253- 268.
Bråten, I., & Samuelstuen, M. S. (2007). Measuring strategic processing: Comparing
task-specific self-reports to traces. Metacognition Learning, 2, 1-20.
Breen, M. (1987). Learner contributions to task design. In C. N. Candlin, & D. Murphy
(Eds.), Language Learning Tasks (pp.5-22). Englewood Cliffs, NJ: Prentice Hall
International.
Bremner, S. (1999). Language learning strategies and language proficiency: Investigating
the relationship in Hong Kong. Canadian Modern Language Review, 55, 490-514.
Brooks, N. (1960). Language and Language Learning: Theory and Practice. New
York: Harcourt, Brace & World.
Brown, A., Bransford. J. D., Ferrara, R., & Campione, J. C. (1983). Learning,
remembering and understanding. In J. H. Flavell, & E. M. Markham (Eds.),
Carmichael’s manual of child psychology (pp. 77-166). New York: Wiley.
Brown, H. B. (2002). Strategies for Success: A practical guide to learning English.
London: Longman.
Brown, G. A., Anderson, R., Shilcock, R., & Yule, G. (1984). Teaching talk: Strategies
for production and assessment. Cambridge: Cambridge University Press.

322
Brown, G., & Yule, G. (1983). Teaching the spoken language. New York: Cambridge
University Press.
Brown, R. (1991). Group work, task difference, and second language acquisition. Applied
Linguistics, 11, 1-12.
Butterworth, B. (1985). Jargon aphasia: Processes and strategies. In S. Newman, & R.
Epstein (Eds.), Current perspectives in dysphasia. Edinburgh: Churchill-
Livingstone.
Bygate, M. (2001). Effects of task repetition on the structure and control of language. In
M. Bygate, P. Skehan, & M. Swain (Eds.), Researching pedagogic tasks:
second language learning, teaching and testing (pp. 23-48). Harlow: Pearson
Education.
Bygate, M. (2003). Spoken language. Retrieved June 25, 2005 from
http://www.llas.ac.uk/resources/goodpractice.aspx?resourceid=1446
Bygate, M., Skehan, P., & Swain, M. (2001). Researching pedagogic tasks: Second
language learning, teaching and testing. Harlow: Pearson Education.
Canale, M. (1983). From communicative competence to communicative language
pedagogy. In J. C. Richards and R. W. Schmidt (Eds.), Language and
communication (pp.2-27). London & New York: Longman.
Canale, M., & Swain, M. (1980). Theoretical bases of communicative approaches to
second language teaching and testing. Applied Linguistics, 1, 1-47.
Candlin, C. N. (1987). Towards task-based learning. In C. N. Candlin & D. Murphy
(Eds.), Lancaster Practical Papers in English Language Education. Vol. 7.
Carson, J.G., & Longhini, A. (2002). Focusing on learning styles and strategies: A diary
study in an immersion setting. Language Learning, 52 ( 2), 401-438.
Chapelle, C., & Douglas, D. (1993). Interpreting L2 performance data. Second Language
Research Colloquium, Pittsburgh, PA.
Chamot, A. U. (2004). Issues in Language Learning Strategy Research and Teaching.
Electronic Journal of Foreign Language Teaching, 1 (1), 14-26.
Chamot, A. U., Barnhardt, S., El-Dinary, P. B., & Robbins, J. (1999). The Learning
Strategies Handbook. White Plains New York: Addison-Wesley Longman.

323
Chamot, A. U., & Kupper, L. (1989). Learning Strategies in Foreign Language
Instruction. Foreign Language Annals, 22 (1), 13-24.
Chamot, A. U., Kupper, L.& Impink-Hernandez, M. (1987). A study of learning
Strategies in foreign language instruction: First year report. Rosslyn, VA:
InterAmerican Research Associates.
Chamot, A. U., & O'Malley, J. M. (1994). The CALLA Handbook: Implementing the
Cognitive Language Learning Approach. Reading, MA: Addison Wesley.
Chang. Y. (1999). Discourse topics and interlanguage variation. In P. Robinson (Ed.),
Representations and Process: Proceedings of the 3rd Pacific Second Language
Research Forum Vol. 1 (pp. 235-241). Tokyo: PacSLRF.
Chaudron, C. (2003). Learner Strategies. Review paper commissioned by the Diagnostic
Assessment Procedure Project. Centre for Advanced Language Studies.
University of Hawai’i.
Chen, S. Q. (1990). A study of communication strategies in interlanguage production by
Chinese EFL learners. Language Learning, 40, 155-187.
Chesterfield, R., & Chesterfield, K. B. (1985). Natural order in children's use of second
language learning strategies. Applied Linguistics, 6 (1), 45-59.
Chomsky, N. (1986). Knowledge of Language: its Nature, Origin and Use. New York:
Praeger.
Cid, E., Grañena, G., & Tragant, E. (2009). Constructing and validating the foreign
language attitudes and goals survey (FLAGS). System, 37 (3), 496-513.
Clennell, C. (1995). Communication strategies of adult ESL learners: A discourse
perspective. Prospect, 10 (3), 4-20.
Cohen, A. D. (1998). Strategies in learning and using a second language. London; New
York: Longman.
Cohen, A. D. (2003). The learner’s side of foreign language learning: Where do styles,
strategies and tasks meet? International Review of Applied Linguistics, 41, 279-
291.
Cohen, A. D., & Aphek E. (1981). Easifying Second Language Learning. Studies in
Second Language Acquisition, 3 (2), 221-235.
Cohen, A. D., & Macaro, E. (Eds.) Language Learner Strategies: 30 Years of Research

324
and Practice, Oxford: Oxford University Press.
Cohen, A. D., & Olshtain, E. (1993). The production of speech acts by EFL learners.
TESOL Quarterly, 27, 33-56.
Cohen, A. D., Weaver, S. J., & Li, T. Y. (1996). The impact of strategies-based
instruction on speaking a foreign language. In A. D. Cohen (Ed.), Strategies in
learning and using a second language (pp. 107-156). Harlow, Essex: Longman.
Corder, S. P. (1981). Error analysis and interlanguage. Oxford: Oxford University Press.
Corrales, O., & Call, M. E. ((1989).). At a loss for words: The use of communication
strategies to convey lexical meaning. Foreign Language Annals, 22, 227-240.
Council of Europe. Common European Framework of Reference for Languages:
Learning, teaching, assessment. (2001). Cambridge University Press / Council of
Europe.
Crookes, G. (1986). Task classification: A cross-disciplinary review. Technical Report
No. 4, The Center for Second Language Classroom Research, Social Science
Research Insititute, University of Hawai'i at Manoa.
Crookes, G. (1989). Planning and interlanguage variation. Studies in Second Language
Acquisition, 11 (4), 367-383.
Crookes, G., & Gass, S. M. (Eds.). (1993). Tasks in a Pedagogical Context. Integrating
theory and practice. Clevedon: Multilingual Matters.
Crookes, G., & Rulon, K. (1985). Incorporation of corrective feedback in native
speaker/non-native speaker conversation. Technical Report No. 3, The Center for
Second Language Classroom Research, Social Science Research Institute,
University of Hawai'i at Manoa.
Dansereau, D. (1978) The development of a learning strategies curriculum. In H. O'Neill
(Ed.), Learning Strategies, (pp. 1-30). New York: Academic Press.
Dansereau, D. F. (1985). Learning strategy research. In J. W. Segal, S. F. Chipman & R.
Glaser (Eds.), Thinking and learning skills: Relating instruction to research. Vol.1
(pp.209-239). Hillsdale, NJ: Erlbaum.
Davies, A. (2003). The native speaker: Myth and reality. (2nd ed.) Clevedon:
Multilingual Matters.
De Bot, K. (1992). A bilingual production model: Levelt’s ‘speaking’ model adapted.

325
Applied Linguistics, 13 (1), 1-24.
De Bot, K., Cox, A., Ralston, S., Schaufeli, A., & Weltens, B. (1995). Lexical processing
in bilinguals. Second Language Research, 11, 1–19.
DeKeyser, R. M. (1988). Communicative Processes and strategies. Annual Review of
Applied Linguistics, 9, 108-121.
DeKeyser, R. (1991). Foreign language development during a semester abroad. In B. F.
Freed (Ed.), Foreign language acquisition: Research and the classroom (pp. 104-
119), Lexington, MA: D. C. Heath.
Dell, G. S. (1986). A spreading-activation theory of retrieval in sentence production.
Psychological Review, 93 (3), 283-321.
Dickinson, L. (1987). Self-Instruction in Language Learning. Cambridge. Cambridge
University Press.
DiPardo, A. (1994). Stimulated recall in research on writing: An antidote to "I don't
know, it was fine". In P. Smagorinsky (Ed.), Speaking about writing:
Reflections on research methodology (pp. 163-184). Thousand Oaks, CA: Sage.
Dobao, A. M. (2002). The effect of language proficiency on communication strategy use:
A case study of Galician learners of English. Miscelánea: A Journal of English
and American Studies, 25, 53-75.
Donald, M. W. (1991). Origins of the modern mind. Cambridge, MA: Harvard University
Press.
Donato, R. (1994). Collective scaffolding in second language learning. In J. P. Lantolf
& G. Appel (Eds.), Vygotskian Approaches to Second Language Research (pp.
33-56). Norwood, NJ: Ablex.
Dörnyei, Z. (1995). On the teachability of communication strategies. TESOL Quarterly,
29, 55-85.
Dörnyei, Z. (2001) Motivational strategies in the language classroom. Cambridge: CUP.
Dörnyei, Z. (2003). Questionnaires in second language research: Construction,
administration and processing. Mahwah, NJ: Lawrence Erlbaum Associates.
Dörnyei, Z. (2005). The psychology of the language learner: Individual differences in
second language acquisition. Mahwah, NJ: Lawrence Erlbaum.
Dörnyei, Z., & Kormos, J. (1998). Problem-solving mechanisms in L2 communication: A
326
psycholinguistic perspective. Studies in Second Language Acquisition, 20 (3),
349-385.
Dörnyei, Z., & Scott, M. L. (1997). Communication strategies in a second language:
Definitions and taxonomies. Language Learning, 47 (1), 173-210.
Dörnyei, Z. & Skehan. P. (2003). Individual differences in Second Language Learning.
In C. J. Doughty & M. H. Long (Eds.), The Handbook of Second Language
Acquisition. Oxford: Blackwell.
Dörnyei, Z., & Thurrell, S. (1991). Strategic competence and how to teach it. ELT
Journal, 45 (1), 16-23.
Doughty, J., & Long, M. (2003). The handbook of second language acquisition. Malden,
MA: Blackwell Publishing.
Doughty, C. & Pica, T. (1986). ‘Information-gap' tasks: Do they facilitate second
language acquisition? TESOL Quarterly, 20 (2), 305-326.
Douglas, D. (1997). Testing speaking ability in academic contexts: Theoretical
considerations. TOEFL Monograph Series Rep. No. 8. Princeton, NJ: ETS.
Duff, P. (1986). Another look at interlanguage talk: taking task to task. In R. Day (Ed.),
Talking to Learn: Conversation in Second Language Acquisition. Rowley, MA:
Newbury House.
Dufva, H. (2003). Beliefs in dialogue: A Bakhtinian view. In P. Kalaja, & A. M. F.
Barcelos (Eds.), Beliefs about SLA: New research approaches (pp. 131-153).
Dordrecht: Kluwer Academic Press.
Ehrman, M. E. & Oxford, R. L. (1990). Effects of sex differences, career category, and
psychological type on adult language learning strategies. Modern Language
Journal 73 (1), 1-13.
Ellis, R. (1991). Second Language Acquisition and Language Pedagogy. Clevedon:
Multilingual Matters.
Ellis, R. (1994). The study of second language acquisition. Oxford: Oxford University
Press.
Ellis, R. (2003). Task-based language learning and teaching. Oxford: Oxford University
Press.
Ellis, R. (2005). Planning and task performance in a second language. Amsterdam: John

327
Benjamins.
Ellis, R., & Barkhuizen. G. (2005). Analysing Learner Language. Oxford: Oxford
University Press.
Ellis, G., & Sinclair, B. (1989). Learning to Learn English: A course in learner training.
Cambridge: Cambridge University Press.
Ellis, R., Tanaka, Y., & Yamazaki, A. (1994). Classroom interaction, comprehension, and
the acquisition of L2 word meanings. Language Learning, 44, 449-491.
Ericsson, K. A., & Simon, H. A. (1993). Protocol analysis: Verbal reports as data. Rev.
ed. Cambridge, MA: MIT Press.
Færch, C., & Kasper, G. (1983). Plans and strategies in foreign language communication.
In C. Færch, & G. Kasper (Eds.), Strategies in interlanguage communication (pp.
20-60). London: Longman.
Færch, C., & Kasper, G. (1984). Two ways of defining communication strategies.
Language Learning, 34, 45-63.
Fletcher, M., & Birt, D. (1989). Newsflash. London: Edward Arnold.
Foster, P. (1998). A classroom perspective on the negotiation of meaning. Applied
Linguistics, 19 (1), 1-23 .
Foster, P., & Skehan, P. (1996). The influence of planning on performance in task-based
learning. Studies in Second Language Acquisition, 18, 299-324.
Foster, P. & Tavakoli. P. (2009). Native speakers and task performance: Comparing
effects on complexity, fluency and lexical diversity. Language Learning, 59 (4),
866–896.
Foster, P., Tonkyn, A., & Wigglesworth, G. (2000). Measuring spoken language: A unit
for all reasons. Applied Linguistics, 21 (3), 354-375.
Fowler, W. S., & Coe, N. (1987). Quickcheck placement test. London: Thomas Nelson.
Fromkin, V. A. (1971). The non-anomalous nature of anomalous utterances. Language,
47, 27–52.
Fulcher, G. (2003). Testing second language speaking. London: Longman/Pearson
Education.
Gao, X. (2007). Has language learning strategy research come to an end? A response to
Tseng et al. (2006). Applied Linguistics, 28 (4), 615-620.

328
García Mayo, M. P. (2007). Investigating tasks in formal language learning. Clevedon:
Multilingual Matters.
Gardner, R., Tremblay, P.F., & Masgoret, A. (1997). Towards a full model of second
language learning: An empirical investigation. The Modern Language Journal,
81, (3), 344-362.
Garrett, M. F. (1990). Sentence processing. In D. Osherson & H. Lasnik (Eds.), An
invitation to cognitive science: Language. Cambridge, MA: MIT Press.
Gass, S. (1997). Input, interaction, and the second language learner. Mahwah, NJ:
Lawrence Erlbaum.
Gass, S. (2002). Interactionist perspectives in SLA. In R. Kaplan (Ed.), Handbook of
Applied Linguistics (pp. 170-181). Oxford: Oxford University Press.
Gass, S. A., & Mackey, A. (2000). Stimulated recall methodology in second language
research. Mahwah, NJ: Lawrence Erlbaum Associates.
Gass, S., & Madden, C. (Eds.). (1985). Input in Second Language Acquisition. Rowley,
MA: Newbury House.
Gass, S., & Varonis, M. (1984). The effect of familiarity on the comprehension of non-
native speech. Language Learning, 34. 65-89.
Gass, S. M. & Varonis, E. M. (1985) Task variation and nonnative/nonnative
negotiation of meaning. In S. M. Gass & C. Madden (Eds.), Input in Second
Language Acquisition (pp. 149-161). Rowley, MA: Newbury House.
Gilabert, R. (2004). Task complexity and L2 narrative oral production. Unpublished
doctoral thesis, Universitat de Barcelona, Spain.
Gilabert, R. (2007). Effects of manipulating task complexity on self-repairs during L2
oral production. International Review of Applied Linguistics, 45, 215–240.
Givon, T. (1985). Function, Structure and Language Acquisition. In D. I. Slobien (Ed.),
The Crosslinguistic Study of Language Acquisition. Vols. 1 & 2, Hillsdale, NJ:
Lawrence Erlbaum Associates.
Givon, T. (1989). Mind, code and context: Essays in pragmatics. Hillsdale, NJ: Erlbaum.
Goh, C. C. M. (2002). Exploring listening comprehension tactics and their interaction
patterns. System, 30, (2), 185-206.

329
Graham, S. (1997). Effective language learning. Clevedon, England: Multilingual
Matters.
Green, J. M., & Oxford, R. (1995). A closer look at learning strategies, L2 proficiency,
and gender. TESOL Quarterly, 29 (2), 261-297.
Gregersen, T., Olivares-Cuhat, G., & Storm, J. (2009). An examination of L1 and L2
gesture use: What role does proficiency play? Modern Language Journal, 93 (2),
195-208.
Grenfell, M., & Harris, V. (1999). Modern languages and learning strategies: In theory
and practice. London: Routledge.
Grice, H. P. (1975). Logic and conversation. In P. Cole, & J. Morgan (Eds.), Syntax and
semantics 3: Speech acts. New York: Academic Press.
Griffiths, C. (2003). Patterns of language learning strategy use. System, 31, 367-383.
Gu, Y. (1996). Robin hood in SLA: What has the learning strategy researcher taught us?
Asian Journal of English Language Teaching, 6, 1-29.
Hadwin, A. F., Winne, P. H., Stockley, D. B., Nesbit, J. C., & Woszczyna, C. (2001).
Context moderates students’ self-reports about how they study. Journal of
Educational Psychology, 93, 477–487.
Halbach, A., (2000). Finding out about students' learning strategies by looking at their
diaries: a case study. System, 28 (1), 85-96.
Halliday, M. (1971). Explorations in the Functions of Language. London: Edward
Arnold.
Hawkins, B. (1985). Is the appropriate response always so appropriate? In S. Gass & C.
Madden (Eds.), Input in Second Language Acquisition. Rowley, MA: Newbury
House.
Holec, H. (1981). Autonomy and Foreign Language Learning. Oxford: Pergamon. (First
published [1979], Strasbourg: Council of Europe).
Horwitz, E. K. (1988). The beliefs about language learning of beginning university
foreign language students. Modern Language Journal, 72 (3), 283–294.
Hosenfeld, C. (1977). A Preliminary Investigation of the Reading Strategies of
Successful and Non-successful Second Language Learners. System, 5, 110-23.

330
Hosenfeld, C. (1979). A Learning-Teaching View of second Language Instruction.
Foreign Language Annals, 12 (1), 51-5.
Housen, A., & Kuiken, F. (Eds.), (2009). Complexity, accuracy, and fluency in second
language acquisition: Theoretical and methodological perspectives. Special Issue
of Applied Linguistics, 30 (4), 461-473.
Hsiao, T. Y., & Oxford, R. (2002). Comparing theories of language learning strategies. A
confirmatory factor analysis. Modern Language Journal, 86 (3), 368-383.
Huang, L.-S. (2004). Focus on the learner: Language learning strategies for fostering
selfregulated learning. Contact [Special Research Symposium Issue], 30, 37–54.
Huang, L.-S. (2010). Do different modalities of reflection matter? An exploration of adult
second-language learners’ reported strategy use and oral language production.
System, 38, 245-261.
Huang, X. H., & Van Naerssen, M. (1987). Learning strategies for oral communication.
Applied Linguistics, 8, 287–307.
Hunt, K. (1965). Grammatical structures written at three grade levels. NCTE Research
report No. 3. Champaign, IL, USA: National Council of Teachers of English.
Hunt, K. (1966). Recent measures in syntactic development. Elementary English, 43,
732-739.
Hunt, K. (1970). Syntactic maturity in school children and adults. Monographs of the
Society for Research in Child Development, 35 (Serial No. 134).
Hymes, D. (1972). On communicative competence. In J. B., Pride & J. Holmes (Eds.),
Sociolinguistics. Harmondsworth: Penguin.
Ikeda, M., & Takeuchi, O. (2000). Tasks and strategy use: Empirical implications for
questionnaire studies. JACET Bulletin, 31, 21-32.
Ikeda, M. & O. Takeuchi (2006). Clarifying the differences in learning EFL reading
strategies: An analysis of portfolios. System, 34 (3), 384-398.
Ishikawa, (2007). The effect of manipulating task complexity along the +/- here-and-now
dimension on L2 written narrative discourse. In M. P. Garcia Mayo (Ed.),
Investigating Tasks in Formal Language Learning. Clevedon: Multilingual
Matters.

331
Iwashita, N., A. Brown, T. McNamara, & S. O’Hagan. (2008). Assessed levels of
second language speaking proficiency: How distinct? Applied Linguistics, 29, 24–
49.
Jourdain, S. (2000.). A native-like ability to circumlocute. The Modern Language
Journal, 84 (2), 185-195.
Kalaja, P., & Ferreira Barcelos, A. M. (2003). Beliefs about SLA: New research
approaches.
Kellerman, E. (1991). Compensatory strategies in second language research: a critique,
a revision, and some (non-) implications for the classroom. In R. Phillipson,
E. Kellerman, L. Selinker, M. Sharwood Smith, & M. Swain (Eds.), Foreign
Second Language Pedagogy Research. Clevedon, Avon: Multilingual Matters.
Kellerman, E., Bongaerts, T., & Poulisse, N. (1987). Strategy and system in L2
referential communication. In R. Ellis (Ed.), Second language acquisition in
context (pp. 100-112). London: Prentice Hall.
Kellerman, S. (1992). I see what you mean: The role of kinesic behaviour in listening and
the implications for foreign and second language learning. Applied Linguistics,
13, 239–258.
Khan, S. (2006, March). Investigating EFL learners reported strategy use over three
different speaking tasks. Paper presented at XXIV Congreso Internacional
AESLA, UNED, Madrid, Spain.
Khan S., & Pinyana, A. (2004). Investigating Independent Language Learning in
Classroom-Based EFL-Learners. In: Handle, 2072/129, 2004
[http://hdl.handle.net/2072/129]
Khan, S., & Victori, M. (in press). Perceived versus actual strategy use across three
oral communication tasks. International Review of Applied Linguistics.
Khanji, R. (1996). Two perspectives in analysing communication strategies.
International Review of Applied Linguistics, 34 (2), 144-154.
Klippel, F. (1998). Keep Talking. Cambridge: Cambridge University Press.
Kormos, J. (1998). Self-repair in the speech of Hungarian learners of English.
Unpublished doctoral thesis, University of Budapest, Budapest.

332
Kormos, J. (1999). The effect of speaker variables on the self-correction behaviour of L2
learners. System, 27, 207-221.
Kormos, J. (2000). The role of attention in monitoring second language speech
production. Language Learning, 50 (2), 343-384.
Kormos, J. (2006). Speech production and second language acquisition. Mahwah, NJ:
Lawrence Erlbaum.
Krashen, S. (1985). The Input Hypothesis: Issues and Implications. London: Longman.
Kroll, J. F., & Sunderman, G. (2003). Cognitive processes in second language learners
and bilinguals: The development of lexical and conceptual representations. In C.
Doughty, & M. Long (Eds.), Handbook of second language acquisition.
Cambridge, MA: Blackwell Publishers.
Kuiken, F., & Vedder, I. (2007). Cognitive task complexity and linguistic performance
in French L2 writing. In M. P. Garcia Mayo (Ed.), Investigating Tasks in Formal
Language Learning. Clevedon: Multilingual Matters.
Kumaravidelu, B. (1988). “Communication strategies and psychological processes
underlying lexical simplification”. International Review of Applied Linguistics,
26 (4), 309-319.
Labarca, A. & Khanji, R. (1986). On communication strategies: Focus on interaction.
Studies in Second Language Acquisition, 8, 68-79.
Lafford, B. (2004). The effect of the context of learning on the use of communication
strategies by learners of Spanish as a second language. Studies in Second
Language Acquisition, 26 (3), 201-225.
Lambert, C. P., & Engler, S. (2007). Information distribution and goal orientation in
second language task design. In M. P. García Mayo (Ed.), Investigating Tasks in
Formal Language Learning. Clevedon: Multilingual Matters.
Lange, M. (2000). Factors affecting communication task performance in small groups.
Unpublished Masters dissertation, University of Auckland, Auckland, New
Zealand.
Larsen-Freeman, D. (2009). Adjusting Expectations: The Study of Complexity,
Accuracy, and Fluency in Second Language Acquisition. Applied Linguistics, 30
(4), 579-589.

333
Lee, J. F. (2000). Task and communicating in language classrooms. Boston: McGraw
Hill.
Lennon, P. (1989). Introspection and intentionality in advanced second-language
acquisition. Language Learning, 39, 375-95.
Lennon, P. (1990). Investigating fluency in EFL: A Quantitative Approach. Language
Learning, 40 (3), 387-417.
Lennon, P. (1991). Error elimination and error fossilization: A study of an advanced
learner in the L2 community. Review of Applied Linguistics, 93-94, 129-151.
Levelt, W. J. M. (1989). Speaking: From intention to articulation. Cambridge, MA: MIT
Press.
Levelt, W. J. M. (1993). Language use in normal speakers and its disorders. In G.
Blanken, J. Dittmann, H. Grimm, J. C. Marshall & C. W. Wallesch (Eds.),
Linguistic disorders and pathologies (pp. 1-15). Berlin: de Gruyter.
Levelt, W. J. M. (1995). The ability to speak: From intentions to spoken words.
European Review, 3, 13-23.
Levelt, W. J. M. (1999). Language production: A blueprint for the speaker. In C. Brown,
& P. Hagoort (Eds.), Neurocognition of Language. Oxford: Oxford University
Press.
Levelt, W. J. M., Roelofs, A., & Meyer, A. S. (1999). A theory of lexical access in
speech production. Brain and Behavioural Sciences, 22, 1-75.
Liskin-Gasparro, J. E. (1996.). “Circumlocution, communication strategies, and the
ACTFL proficiency guidelines: An analysis of student discourse”. Foreign
Language Annals, 29 (3), 317-330.
Littlemore, J. (2001). An empirical study of the relationship between cognitive style
and the use of communication strategy. Applied Linguistics, 22, 241-265.
Long, M. H. (1980). Inside the "black box": methodological issues in classroom research
on language learning. Language Learning, 30 (1), 1-42.
Long, M. H. (1981). Input, interaction and second language acquisition. In H. Winitz
(Ed.), Native language and foreign language acquisition (pp. 259-78). Annals of
the New York Academy of Sciences, 379.
Long, M. H. (1983). Linguistic and conversational adjustments to non-native speakers.

334
Studies in Second Language Acquisition, 5, 177–194.
Long, M. H. (1985). A role for instruction in second language acquisition: Task-based
language teaching. In K. Hyltenstam, & M. Pienemann (Eds.), Modeling and
assessing second language development (pp. 77-99). Clevedon, Avon:
Multilingual Matters.
Long, M. H. (1989). Task, group, and task-based interactions. Working papers in ESL
(pp. 1-26). Hawai’i: University of Hawai’i.
Loschky, L., & Bley-Vroman, R. (1993). Grammar and task-based methodology. In G.
Crookes, & S. Gass (Eds.), Tasks and language learning: Integrating theory and
practice (pp. 123-167). Clevedon: Multilingual Matters.
Lumley, T., & O’Sullivan, B. (2006). The Impact of Test Taker Characteristics on
Speaking Test Task Performance. Language Testing, 22 (4), 415–437.
Macaro, E. (2001). Learner Strategies in second and foreign language classrooms.
London: Continuum.
Macaro, E. (2006). Strategies for language learning and for language use: Revising the
theoretical framework. Modern Language Journal, 90 (3), 320-337.
Mackay, D. G. (1970). Spoonerisms: The structure of errors in the serial order of speech.
Neuropsychologia, 8, 323-350.
Mackey, A., Gass, S., & McDonough, K. (2000). How do learners perceive interactional
feedback? Studies in Second Language Acquisition, 22 (4), 471-497.
MacWhinney, B. (2000). The CHILDES project: Tools for analyzing talk. Third edition.
Mahwah, NJ: Lawrence Erlbaum Associates.
Malvern, D. & Richards. B. (2002). Investigating accommodation in language
proficiency interviews using a new measure of lexical diversity. Language
Testing, 19 (1), 85–104.
Manchón, R. M. (1989). Competencia estratégica y evolución de la interlengua del
aprendiz de una L2. Proceedings of the VI National Conference of the Spanish
Association of Applied Linguistics (pp. 377-388), Santander: AESLA.
Manchón, R. M. (1999). Fostering the autonomous use of strategies in the foreign
language classroom: The why and how of communication strategies training.
Links & letters, 7. Universitat Autónoma de Barcelona.

335
Manchón R. M. (2009). Writing in foreign language contexts: Learning, teaching, and
research (pp. 102-129). Clevedon: Multilingual Matters.
McCafferty, S. G. (1998). Non-verbal expression and L2 private speech. Applied
Linguistics, 19, 73-96.
McDonough, S. H. (1995). Strategy and skill in learning a foreign language. London:
Edward Arnold.
McDonough, S. H. (1999). Learner Strategies. Language Teaching, 32, 1-18.
McNeill, D. (Ed.). (2000). Language and gesture. Cambridge: Cambridge University
Press.
Mehnert, U. (1998). The effects of different lengths of time for planning on second
language performance. Studies in Second Language Acquisition, 20, 52-83.
Michel, M. C., Kuiken, F., & Vedder, I. (2007). The influence of complexity in
monologic versus dialogic tasks in Dutch L2. International Review of Applied
Linguistics, 45, 241–59.
Michel, M. C. (2008). Effects of task complexity and interaction in Dutch L2-learners.
Paper presented at XVth World Congress of Applied Linguistics, Essen, Germany.
Miles, M. B., & Huberman, A. M. (1994). Qualitative data analysis: An expanded
sourcebook. Thousand Oaks, CA: SAGE.
Munby, J. (1978). Communicative Syllabus Design. Cambridge: Cambridge University
Press.
Muñoz Lahoz, C. (2006). Age and the rate of foreign language learning. Clevedon:
Multilingual Matters.
Naiman, N., Frohlich, M., Stern, H. H., & Todesco, A. (1978). The Good Language
Learner. Toronto: Ontario Institute for Studies in Education.
Nakahama, Y., Tyler, A., & Van Lier, L. (2001). Negotiation of meaning in
conversational and information gap activities: A comparative discourse analysis.
TESOL Quarterly, 35 (3), 377-405.
Nakatani, Y. (2005). The effects of awareness raising on oral communication strategy
use. The Modern Language Journal, 89 (1), 76-91.
Nakatani, Y. (2006). Developing an oral communication strategy inventory. The Modern
Language Journal, 90 (2), 151-168.

336
Nakatani, Y. (2010). Identifying Strategies that Facilitate EFL Learners' Oral
Communication: A Classroom Study Using Multiple Data Collection Procedures.
Modern Language Journal, 94 (1), 116-136.
Nakatani, Y., & Goh, C. M. (2007). A review of oral communication strategies. In A. D.
Cohen, & E. Macaro (Eds.), Language learner strategies (pp. 207-227). Oxford:
Oxford University Press.
Newton, J. (1991). Negotiation: negotiating what? Paper presented at SEAMEO
Conference on Language Acquisition and the Second/Foreign Language
Classroom, RELC, Singapore.
Niwa, Y. (2000). Reasoning demands of L2 tasks and L2 narrative production: Effects of
individual differences in working memory, intelligence, and aptitude.
Unpublished MA dissertation, Aoyama Gakuin University, Tokyo.
Norris, J. M., & Ortega, L. (2009). Measurement for understanding: An organic approach
to investigating complexity, accuracy, and fluency in SLA. Applied Linguistics,
30 (4), 555-578.
Nunan, D. (1989). Designing tasks for the communicative classroom. Cambridge:
Cambridge University Press.
Nunan, D. (1997). Does learner strategy training make a difference? Lenguas Modernas,
24, 123-142.
Olshtain, E., & Cohen, A. D. (1989). Speech act behavior across languages. In H. W.
Dechert & M. Raupach (Eds.), Transfer in production (pp. 53-67). Norwood, NJ:
Ablex.
O'Malley, J. M., & Chamot, A. U. (1990). Learning strategies in second language
acquisition. Cambridge: Cambridge University Press.
O'Malley, J. M., Chamot, A. U., Stewner-Manzanares, G., Kupper, L., & Russo, R. P.
(1985). Learning strategies used by beginning and intermediate ESL students.
Language Learning, 35 (1), 21-46.
Ortega, L. (1995). Planning and second language oral performance. Unpublished
doctoral thesis, University of Hawai’i, Hawai’i.
Ortega, L. (1999). Planning and focus on form in L2 oral performance. Studies in Second
Language Acquisition, 21, 109–48.

337
O'Sullivan, B. (2000). Exploring gender and oral proficiency interview performance.
System, 28 (3), 373-386.
Oxford, R. (1990). Language learning strategies: What every teacher should know. New
York: Newbury House / Harper and Row.
Oxford, R. L. (Ed.). (1996a). Language Learning Strategies around the World. Cross
Cultural Perspectives. Technical Report #13, Second Language Teaching and
Curriculum Centre. Honolulu: University of Hawai’i.
Oxford, R. L. (1996b). Employing a questionnaire to assess the use of language learning
strategies. Applied Language Learning, 7 (1&2), 25-45.
Oxford, R. L., & Burry-stock, J.A. (1995). Assessing the use of language learning
strategies worldwide with the ESL/EFL version of the Strategy Inventory for
Language Learning (SILL). System, 23 (1), 1-23.
Oxford, R., Cho, Y., Leung, S., & Kim, H. J. (2004). Effect of the presence and difficulty
of task on strategy use: An exploratory study. International Review of Applied
Linguistics, 42, 1-47.
Oxford, R. L., & Crookall, D. (1989). Research on language learning strategies: methods,
findings, and instructional issues. Modern Language Journal, 73, 404-419.
Oxford, R. L., & Ehrman, N. E. (1995). Adults language learning strategies in an
intensive foreign language program in the United States. System, 23 (3), 359-
386.
Oxford.R. L., & Nyikos (1989). Variables affecting choice of language learning
strategies by university students. The Modern Language Journal, 73 (3), 291-
300.
Pallant, J. (2005). SPSS survival manual, 2nd edition. Maidenhead: Open University
Press.
Paradis, M. (1987). The assessment of bilingual aphasia. Hillsdale, NJ: Erlbaum.
Paribakht, T. (1985). Strategic Competence and Language Proficiency. Applied
Linguistics, 6, 132-146.
Paribakht, T. (1986). On the pedagogical relevance of strategic competence. TESL
Canada Journal 3, 53-66.
Parks, S. & Raymond, P. M. (2004). Strategy use by non-native English speaking

338
students in an MBA program: Not business as usual. The Modern Language
Journal, 88, 374–89.
Phakiti, A. (2003). A closer look at gender differences in strategy use in L2 reading.
Language Learning, 53 (4), 649-702.
Phillips, V. (1991). A look at learner strategy use and EFL proficiency. The CATESOL
Journal, 57–67.
Pica, T. (1987). Second language acquisition, social interaction, and the classroom.
Applied Linguistics, 8 (1), 1-25.
Pica, T. (1994). Research on negotiation: What does it reveal about second language
learning, conditions, processes, outcomes? Language Learning, 44, 493-527.
Pica, T., & Doughty, C. (1988). Variations in classroom interaction as a function of
participation pattern and task. In J. Fine (Ed.), Second Language Discourse: A
Textbook of Current Research (pp. 41-55). Norwood, NJ: Ablex.
Pica, T., Holliday, L., Lewis, N., & Morgenthaler, L. (1989). Comprehensible output as
an outcome of linguistic demands on the learner. Studies in Second Language
Acquisition, 11 (1), 63-90.
Pica, T., Kanagy, R., & Falodun, J. (1993). Choosing and using communication tasks for
second language instruction and research. In G. Crookes & S. M. Gass (Eds.),
Tasks and language learning (pp. 9-33). Clevedon: Multilingual Matters.
Pica, T., Kang, H., & Sauro, S. (2006). Information gap tasks: Their multiple roles and
contributions to interaction research methodology. Studies in Second Language
Acquisition, 28, 301-338.
Pintrich, P. R. (2000). The role of goal orientation in self-regulated learning. In M.
Boekaerts, P. R. Pintrich & M. Zeidner (Eds.), Handbook of self-regulation (pp.
451–502). San Diego, CA: Academic.
Pinyana, A. (2005). Negotiation of Meaning among non native speakers sharing L1 and
proficiency level. Unpublished Masters Thesis. Universitat Autònoma de
Barcelona, Spain.
Pinyana, A. (2009). Self-assessment of foreign language oral production: Assessment
accuracy, the role of proficiency level and implicit training. Unpublished doctoral
thesis, Universitat Autònoma de Barcelona, Spain.

339
Polio, C. (2001). Research methodology in second language writing research: The case of
textbased studies. In T. Silva & P. K. Matsuda (Eds.), On Second Language
Writing (pp.91-116). Mahwah, NJ: Lawrence Erlbaum Associates.
Politzer, R. L. (1983). An exploratory study of self reported language learning behaviors
and their relation to achievement. Studies in Second Language Acquisition, 6, 54–
67.
Politzer, R. L., & McGroarty, M. (1985). An exploratory study of learning behaviours
and their relationship to gains in linguistic and communicative competence.
TESOL Quarterly, 19, 103–123.
Poulisse, N. (1987). Problems and solutions in the classification of compensatory
strategies. Second Language Research, 3, 141-153.
Poulisse, N. (1990). The use of compensatory strategies by Dutch learners of English.
Berlin: Mouton de Gruijter.
Poulisse, N. (1993). A theoretical account of lexical communication strategies. In R.
Schreuder & B. Weltens (Eds.), The bilingual lexicon (pp. 157-190). Amsterdam:
John Benjamins.
Poulisse, N. (1997). Compensatory strategies and the principles of clarity and
Economy. In G. Kasper & E. Kellerman (Eds.), Communication Strategies
Psycholinguistic and Sociolinguistic Perspectives (pp. 49-64). London and New
York: Longman.
Poulisse, N. (1999). Slips of the tongue: Speech errors in first and second language
production. Amsterdam: Benjamins.
Poulisse, N., & Bongaerts, T. (1994). First language use in second language production.
Applied Linguistics, 15 (1), 36-57.
Poulisse, N., Bongaerts, T., & Kellerman, E. (1987). The use of Retrospective Verbal
Reports in the Analysis of Compensatory Strategies. In C. Faerch & G. Kasper
(Eds.), Introspection in Second Language Research. Clevedon: Multilingual
Matters.
Poulisse, N., & Schils, E. (1989) The influence of task and proficiency-related factors
on the use of communication strategies. A quantitative analysis. Language
Learning, 39, 15-48.

340
Prabhu, N. S. (1987). Second language pedagogy. Oxford: Oxford University Press.
Purpura, J. E. ((1999).). Learner strategy use and performance and language tests: A
structural equation modeling approach. Cambridge, England: University of
Cambridge Local Examinations Syndicate and Cambridge University Press.
Rahimi, M., Riazi, A., & Saif, S. (2008). Factors affecting the use of language learning
strategies by Iranian EFL learners. Canadian Journal of Applied Linguistics, 11,
31-60.
Rahimpour, M. (1997). Task condition, task complexity and variation in L2 discourse.
Unpublished doctoral thesis, University of Queensland, Australia.
Raupach, M. (1983). Analysis and evaluation of communication strategies. In C. Færch
& G. Kasper (Eds.), Strategies in interlanguage communication (pp. 199-209).
Harlow, England: Longman.
Raupach, M. (1987). Procedural learning in advanced learners of a second language. In J.
Coleman, & R. Towell (Eds.), The advanced language learner (pp. 123-155).
London: Read
Rees-Miller , J. (1993). A critical appraisal of learner training: theoretical bases and
teaching implications. TESOL Quarterly, 27 (4), 679-689.
Robinson, P. (1995). Task complexity and second language narrative discourse.
Language Learning, 45, 99-140.
Robinson, P. (2001). Task complexity, cognitive resources, and syllabus design: A triadic
framework for examining task influences on SLA. In P. Robinson (Ed.),
Cognition and second language instruction (pp. 287-318). Cambridge: Cambridge
University Press.
Robinson, P. (2005). Cognitive complexity and task sequencing: Studies in a
componential framework for second language task design. International
Review of Applied Linguistics in Language Teaching, 43 (1), 1-32.
Robinson, P., & Gilabert, R. (2007). Task complexity, the cognition hypothesis and
second language instruction. Guest-edited special issue of International Review of
Applied Linguistics, 45 (3), 161-284.
Robinson, P. S., Ting, C. C., & Urwin, J. J. (1996). Investigating second language task
complexity. RELC Journal., 26, 62-79.

341
Rossi-Le, L. (1989). Perceptual learning style preferences and their relationship to
language learning strategies in adult students of English as a second language,
Unpublished doctoral thesis, Drake University, Iowa.
Rossiter, M. J. (2005). Developmental sequences of L2 communication strategies.
Applied Language Learning, 15 (1-2), 55-66.
Rost, M., & Ross, M. (1991). Learner use of strategies in interaction: typology and
teachability. Language Learning, 41, 235-273.
Rubin, J. (1975). What the "good language learner" can teach us. TESOL Quarterly, 9,
41-51.
Rubin, J. (1981). Study of cognitive processes in second language acquisition. Applied
Linguistics, 11, 117-131.
Sanaqui, R. (1995). Adult learners' approaches to learning vocabulary in second
languages. The Modern Language Journal, 79 (1), 15-28.
Savignon, S. J. (1983). Communicative competence: theory and classroom practice
Reading, MA: Addison Wesley.
Schmidt,. R. (1990). The role of consciousness in second language learning. Applied
Linguistics,11, 129-158.
Schmidt,. R. (2001). Attention. In P. Robinson, (Ed.), Cognition and second language
instruction. Cambridge: Cambridge University Press.
Selinker, L. (1972). Interlanguage. International Review of Applied Linguistics, 10, 209-
231.
Skehan, P. (1996). A framework for the implementation of task-based instruction.
Applied Linguistics, 17, 38-62.
Skehan, P. (1998a). A cognitive approach to language learning. Oxford: Oxford
University Press.
Skehan, P. (1998b). Task-based instruction. Annual Review of Applied Linguistics, 18,
268-286.
Skehan, P. (2001). Task and language performance assessment. In M. Bygate, P. Skehan
& M. Swain (Eds.), Researching pedagogic tasks: second language learning,
teaching and testing (pp. 167-185). Harlow: Pearson Education Ltd.
Skehan, P. (2003). Task-based instruction. Language Learning, 36, 1-14.

342
Skehan, P. (2009). Modelling second language performance: Integrating complexity,
accuracy, fluency and lexis. Applied Linguistics, 30 (4), 510-532.
Skehan, P., & Foster, P. (1997). The influence of planning and post-task activities on
accuracy and complexity in task-based learning. Language Teaching Research,
1(3).
Skehan, P., & Foster, P. (2001). Cognition and tasks. In P. Robinson (Ed.), Cognition and
second language instruction (pp. 183-205). Cambridge: Cambridge University
Press.
Smagorinsky, P. (Ed.), (1994). Speaking about writing: Reflections on research
methodology. Thousand Oaks, CA: Sage.
Sperber, D., & Wilson, D. (1987). Precis of relevance: Communication and cognition.
Behavioral and brain sciences. (pp. 697-754)
Stern, H. H. (1975). What can we learn from the Good Language Learner? Canadian
Modern Language Review, 31, (4), 304-318.
Stern, H. H. (1983). Fundamental Concepts of Language Teaching, Oxford: Oxford
University Press.
Stern, H. H. (1992). Issues and options in language teaching. Oxford: Oxford University
Press.
Stevick, E. W. (1990). Research on what? Modern Language Journal, 74 (2), 143-152.
Storch, N., & Wigglesworth, G. (2007). Writing tasks: Comparing individual and
collaborative writing. In M. P. Garcia Mayo (Ed.), Investigating tasks in
formal language learning. Clevedon: Multilingual Matters.
Swain, M. (1985). Communicative competence: Some roles of comprehensible input and
comprehensible output in its development. In S. M. Gass, & C. G. Madden (Eds.),
Input in Second Language Acquisition (pp. 235-253). Rowley, MA: Newbury
House.
Swain, M. (1995). Three functions of output in second language learning. In G. Gook, &
B. Seidlhofer (Eds.), Principle and practice in applied linguistics (pp. 125–144).
Oxford: Oxford University Press.
Swain, M. (1998). Focus on form through conscious reflection. In C. Doughty, & J.
Williams (Eds.), Focus on form in classroom second language acquisition (pp.

343
64-81). Cambridge: Cambridge University Press.
Swain, M., & Lapkin, S. (1998). Interaction and second language learning: Two
adolescent French immersion students working together. Modern Language
Journal, 82 (3), 320-337.
Swain, M., & Lapkin, S. (2001). Focus on form through collaborative dialogue:
Exploring task effects. In M. Bygate, P. Skehan & M. Swain (Eds.), Researching
pedagogic tasks: Second language learning, teaching and assessment (pp. 99-
118). London, UK: Pearson International.
Swain, M., Huang, L.-S., Barkaoui, K., Brooks, L., Lapkin, S. (2009). The Speaking
Section of the TOEFL_ iBT _ (SSTiBT):Test-Takers’ Strategic Behaviours. In:
TOEFLiBT _ Research Series No. TOEFLiBT-10. Educational Testing Service,
Princeton, NJ.
Swales, J. M. (1990). Genre analysis: English in academic and research settings.
Cambridge: Cambridge University Press.
Takeuchi, O. (1993). Language learning strategies and their relationship to achievement
in English as a foreign language. Language Laboratory, 30, 17-34.
Takeuchi, O. (2003). What can we learn from good foreign language learners? A
qualitative study in the Japanese foreign language context. System, 31, 385-
392.
Tarone, E. (1977). Conscious communication strategies in interlanguage: A progress
report. In H. D. Brown, C. A. Yorio, & R. C. Crymes (Eds.), On TESOL ’77 (pp.
194-203). Washington, DC: TESOL.
Tarone, E. (1980). Communication strategies, foreigner talk and repair in interlanguage.
Language Learning, 30, 417-431.
Tarone, E. (1981). Some thoughts on the notion of communication strategy. TESOL
Quarterly, 15 (3), 285-295.
Tarone, E. (1984). Teaching strategic competence in the foreign-language classroom. In
S. J. Savignon & M. S. Berns (Eds.), Initiatives in communicative language
teaching (pp. 127-136). Reading, MA: Addison-Wesley.
Tarone, E. (1985). Variability in interlanguage use: A study of style shifting in
morphology and syntax. Language Learning, 35, 373-403.

344
Tarone, E., & Yule, G. (1989). Focus on the Language Learner. Oxford: Oxford
University Press.
Tavakoli, P., & Skehan, P. (2005). Planning, task structure, and performance testing. In
R. Ellis (Ed.), Planning and task performance in a second language (pp. 239-
273). Amsterdam: John Benjamins.
Tavakoli, P. (2009). Assessing L2 task performance: Understanding effects of task
design. System, 37 (3), 482-495.
Taylor, L. (2001). The paired speaking test format recent studies. University of
Cambridge Research Notes, 6, 15-17.
Ting, S. H., & Lau, C. E. L. Y. (2007, April). The influence of sociocultural context on
the discourse structure of telephone enquiries and the use of communication
strategies. Paper presented at the Conference on Social and Cognitive Aspects of
Second Language Learning and Teaching, University of Auckland, New Zealand.
Ting, S. H., & Phan, G. Y. L. (2008). Adjustment in communication strategy use to
interlocutor’s language proficiency. Prospect (Australian TESOL Journal), 23(1)
Towell, R. (1987). Variability and progress in the language development of advanced
learners of a foreign language. In R. Ellis, & C. Roberts (Eds.), The social context
of second language acquisition. Oxford: Prentice Hall.
Tragant, E. (2006). Motivation towards English at school. In M. Juan, &
Salzar J. (Eds.), Adquisición y enseñanza de lenguas en contextos plurilingües.
ensayos y propuestas aplicadas. Palma de Mallorca, Spain: Universitat de les
Illes Balears.
Tragant, E., & Muñoz, C. (2000). La motivación y su relación con la edad en un contexto
escolar de aprendizaje de lengua extranjera. In C. Muñoz (Ed.), Segundas
lenguas. adquisición en el aula. Barcelona: Ariel.
Tragant, E., & Victori, M. (2006). Reported strategy use and age. In C. Munoz (Ed.), Age
and the rate of foreign language learning. Clevedon: Multilingual Matters.
Tseng, W. T., Dörnyei, Z., & Schmitt, N. (2006). A new approach to assessing strategic
learning: The case of self-regulation in vocabulary acquisition. Applied
Linguistics, 27 (1), 78-102.
University of Cambridge Local Examinations Syndicate. (2004). Quick placement test:

345
Paper and pen test. Oxford: Oxford University Press.
Ur, P. (1981). Discussions that Work. Cambridge University Press.
Vandergrift, L. (2003). Orchestrating strategy use: Towards a model of the skilled L2
listener. Language Learning, 53, 461-494.
Vann R. J., & Abraham, R. G.(1990). Strategies of unsuccessful language learners,
TESOL Quarterly, 24 (2), 177-198.
Van Patten, B. (1990). Attending to content and form in the input: An experiment in
consciousness. Studies in Second Language Acquisition, 12, 287-301.
Varonis, E. M., & Gass, S. M. (1985). Non-native/non-native conversation: A model for
negotiation of meaning. Applied Linguistics, 6 (1), 71-90.
Vermeer, A. (2000). Coming to grips with lexical richness in spontaneous speech data.
Language Testing, 17, 65-83.
Victori, R. M. (1992). Investigating the metacognitive knowledge of students of English
as a second language. Unpublished doctoral thesis, University of California,
California.
Victori, M. (1999). An analysis of writing knowledge in EFL composing: A case study of
two effective and two less effective writers. System, 27 (4), 537-555.
Victori, M. (2004). Eliciting and fostering learners' metacognitive knowledge about
language learning in self-directed learning programs. Vic: Universitat de Vic.
Victori, M., & Lockhart, W. (1995). Enhancing metacognition in self-directed language
learning. System, 23 (2), 223-234.
Victori, M., Pinyana, A., & Khan, S. (2009). Using structured and open-ended procedures
for eliciting data on learners’ metacognitive knowledge: A qualitative
comparative study. In C. B. Larson (Ed.), Metacognition: New research
developments (pp. 153-182). New York: Nova Publishers.
Victori, M., & Tragant, E. (2003). Learner strategies: A cross-sectional and longitudinal
study of primary and high-school EFL teachers. In M. P. Garcia Mayo, & M. L.
Garcia Lecumberri (Eds.), Age and the acquisition of English as a foreign
language. Clevedon: Multilingual Matters.
Victori, M., Tragant E., & Thompson, X., (2008, August). The interplay between
language learning strategies, motivation and linguistic achievement in foreign

346
language learners. Paper presented at XVth World Congress of Applied
Linguistics, Essen, Germany.
Vogely, A. (1995). Perceived strategy use during performance on three authentic
listening comprehension tasks. Modern Language Journal, 79 (1), 41-56.
Wakamoto, N. (2000). Language learning strategy and personality variables: Focusing on
extroversion and introversion. International Review of Applied Linguistics 38 (1),
71-81.
Wang, J., Spencer, K., & Xing, M. (2009). Metacognitive beliefs and strategies in
learning chinese as a foreign language. System, 37 (1), 46-56.
Warschauer, M. (1998). Researching technology in TESOL: Determinist, instrumental,
and critical approaches. TESOL Quarterly, 32 (4), 757-761.
Weinstein, C. E., & Hume, L. M. (1998). Study strategies for lifelong learning.
Washington: American Psychological Association.
Weinstein, C. E., Husman, J., & Dierking, D. R. (2000). Interventions with a focus on
learning strategies. In M. Boekaerts, P. R. Pintrich & M. Zeidner (Eds.),
Handbook of self-regulation (pp. 727-747). San Diego: Academic Press.
Weinstein, C. E., & Mayer, R. E. (1986). The teaching of learning strategies. In M.C.
Wittrock, (Ed.), Handbook of Research on Teaching. London: Macmillan. 315-
327.
Weinstein, C. E., & Underwood, V. L. (1985). Learning strategies: The how of learning.
In J. W. Segal, S. F. Chapman & R. Glaser (Eds.), Thinking and learning skills
(pp. 241-258). Hillsdale, NJ: Lawrence Erlbaum Associates.
Wendel, J. (1997). Planning and second language production. Unpublished doctoral
dissertation, Temple University, Tokyo, Japan.
Wenden, A. L. (1987). Metacognition: An expanded view on the cognitive abilities of L2
learners. Language Learning, 37 (4), 573-597.
Wenden, A. L. (1991). Learner Strategies in Language Learning. Englewood Cliffs, NJ:
Prentice Hall.
Wenden, A. (1998). Metacognitive knowledge and language learning. Applied
Linguistics, 19, 515–37.
Wenden, A. (2002). Learner development in language learning. Applied Linguistics, 23,

347
32–55.
Wenden, A., & Rubin, J. (Eds.). (1987). Learner Strategies in Language Learning
Englewood Cliffs, NJ: Prentice Hall.
Wharton, G. (2000). Language learning strategy use of bilingual foreign language
learners in Singapore. Language Learning, 50 (2), 203-244.
Wickens, C. D. (1984). Processing resources in attention. In R. Parasuraman, & R.
Davies (Eds.), Varieties of attention (pp. 63-101). New York: Academic Press.
Wickens, C. D. (1989). Attention and skilled performance. In D. Holding (Ed.), Human
Skills (pp. 71-105). New York: Wiley & Sons.
Widdowson, H. G. (1983). Learning Purpose and Language Use. Oxford: Oxford
University Press.
Wiese, R. (1982). Pyscholinguistische aspekte der sprachproduktion: Sprechverhalten
und verbalisierungsprozesse. Düsseldorf: Dissertation Universität de Bielefeld.
Wigglesworth, G. (1997). An investigation of planning time and proficiency level on oral
test discourse. Language Testing, 14, 85-106.
Wigglesworth, G. (2001). Influences on performance in task-based oral assessment. In M.
Bygate, P. Skehan & M. Swain (Eds.), Researching pedagogic tasks: Second
language learning, teaching and testing (pp. 186-209). Harlow: Longman.
Willems, G. (1987). Communication strategies and their significance in foreign language
teaching. System, 15, 351-364.
Willis, J. (1996). A framework for task-based learning. Harlow: Addison-Wesley
Longman.
Wolfe-Quintero, K., Inagaki, S., & Kim, H.-Y. (1998). Second language development in
writing: Measures of fluency, accuracy and complexity. Technical Report 17.
Manoa, Hawai'i US: University of Hawai'i Press.
Wong-Fillmore, L. (1979). Individual Differences in Second Language Acquisition. In C.
J. Fillmore, D. Kempler, & W. S. Y. Wang (Eds.), Individual Differences in
Language Ability and Language Behavior. New York: Academic Press.
Yamamori. K., Isoda. T., Hiromori. T., & Oxford, R. (2003). Using cluster analysis to
uncover L2 learner differences in strategy use, will to learn, and achievement over
time. International Review of Applied Linguistics, 41, 379-407.

348
Yang, N. D. (1999). The relationship between EFL learners’ beliefs and learning strategy
use. System, 27 (4), 515-536.
Yoshida-Morise, Y. (1998). The use of communication strategies in LPIs. In R. Young,
& W. He (Eds.), Talking and testing: Discourse approaches to the assessment of
oral proficiency (pp. 205–238). Amsterdam: John Benjamins.
Yuan F., & Ellis, R. (2003). The effects of pre-task planning and on-line planning on
fluency, complexity, and accuracy in L2 monologic oral production. Applied
Linguistics, 24 (1), 1-27.
Yule, G., & MacDonald, D. (1990). Resolving referential conflicts in L2 interaction: The
effect of proficiency and interactive role. Language Learning, 40, 539–556.
Yule, G., & Tarone, E. (1990). Eliciting the performance of strategic competence. In R.
C. Scarcella, E. S. Andersen, & S. D. Krashen (Eds.), Developing communicative
competence in a second language (pp. 179-194). New York, NY: Newbury
House.
Yule, G., & Tarone, E. (1991). The other side of the page: Integrating the study of
communication strategies and negotiated input in SLA. In R. Phillipson, E.
Kellerman, L. Selinker, M. Sharwood Smith, & M. Swain (Eds.), Foreign/
second language pedagogy research: A commemorative volume for Claus Færch
(pp.162-171). Clevedon: Multilingual Matters.
Zhang, R. (2007, May). The Influence of Source of Planning on Senior High School
Learners’ Oral FL Performance. Paper presented at 5th International Conference
on ELT. 1st Chinese Congress of Applied Linguistics, Beijing, China.
Zimmerman, B. J. (1998). Developing self-fulfilling cycles of academic regulation: An
analysis of exemplary instructional models. In D. H. Schunk, & B. J. Zimmerman
(Eds.), Self-regulated learning: From teaching to self-reflective practice (pp. 1–
19). New York: Guilford Press.
Zimmerman, B. J. (2000). Attaining self-regulation: A social cognitive perspective. In M.
Boekaerts, P. R. Pintrich & M. Zeidner (Eds.), Handbook of self-regulation (pp.
13–39). San Diego, CA: Academic.

Appendices

349
Appendix A. Strategy Questionnaire (English translation)
Date: ................................... Identity number: ...................................
HOW DO YOU SPEAK IN A FOREIGN LANGUAGE?
We would like you to help us by answering this questionnaire about the strategies you use when you speak English. This questionnaire is part of the GRAAL (Grup de recerca en autonomia i aprenentatge de llengües) at the University of Vic. It’s not a test so there aren’t any correct or incorrect answers. We’re just interested in your perceptions. Please answer sincerely because only that will guarantee the success of our study. ........................................................................................................................................................ Here is a list of strategies that students use when they speak a foreign language in class. Think about the speaking activity you’ve just done and circle an answer (from 0 to 5) corresponding to your level of strategy use. When you answer don’t think about what you normally do or what you think you should do, simply mark what you have just done in the speaking activity. BEFORE SPEAKING
Not at all--------------------------------------------A lot
1. I recognised the activity because I had done a similar one. 0 1 2 3 4 5
2. I spent a while thinking about what I was going to say. 0 1 2 3 4 5
3. I thought about how I would explain (how to begin, how to end). 0 1 2 3 4 5
4. I made notes to help me do the activity. 0 1 2 3 4 5
WHILE SPEAKING
Not at all--------------------------------------------A lot
5. I used expressions in English that I remembered.
(“That’s just the tip of the iceberg”, “It came out of the blue” ). 0 1 2 3 4 5
6. I avoided errors. 0 1 2 3 4 5
7. I used words or phrases like (“well.”, “ let me see” ) to
Gain time while I thought of what to say. 0 1 2 3 4 5
8. I risked saying things even though I wasn’t sure they
were correct. 0 1 2 3 4 5
9. I focused on the activity without being distracted. 0 1 2 3 4 5
10. I used English I was sure of. 0 1 2 3 4 5
11. I used gesture to help my partner understand me
(eye contact, gesture). 0 1 2 3 4 5
12. I maintained the conversation as much as possible. 0 1 2 3 4 5
13. I thought about how to structure sentences before saying them. 0 1 2 3 4 5

350
When my partner didn’t understand me properly...
Not at all--------------------------------------------A lot
14. When my partner didn’t understand me I spoke slower. 0 1 2 3 4 5
15. When my partner didn’t understand me I asked questions to
check if she had understood (“Ok?” “Do you understand?”). 0 1 2 3 4 5
16. When my partner didn’t understand me I explained in
another way. (“The ice melts”... “ I mean, It’s when
ice turns to water”. 0 1 2 3 4 5
17. When my partner didn’t understand me I explained in
Catalan / Spanish. 0 1 2 3 4 5
18. When my partner didn’t understand me I repeated
The word or phrase. 0 1 2 3 4 5
When I didn’t understand my partner... Not at all--------------------------------------------A lot
19. When I didn’t understand my partner I asked him/her to
speak slower. 0 1 2 3 4 5
20. When I didn’t understand my partner I asked for
an explanation. (“What do you mean?” “What?”) 0 1 2 3 4 5
21. When I didn’t understand my partner I asked him/her
to repeat. (“What?” “Can you repeat that please?”) 0 1 2 3 4 5
22. When I didn’t understand my partner I carried on
as if I’d understood. (“Yes... yes”) 0 1 2 3 4 5
23. When I didn’t understand my partner I guessed what
He/she was trying to say (“Do you mean ‘car park’?”). 0 1 2 3 4 5
24. When I didn’t understand my partner I told him/her
(“I don’t understand”, “ I don’t know what you mean”,
arronsava les celles). 0 1 2 3 4 5
25. When I didn’t understand my partner I repeated what he /
she had said in my own way to ensure that I had understood.
(“So... you mean that something bad happened.”) 0 1 2 3 4 5
When I had a problem with language...
Not at all--------------------------------------------A lot
26.When I made a mistake I corrected myself
Out loud. (“The weather get... gets better”). 0 1 2 3 4 5
27. I asked for help. ( “It’s a ... com es diu ‘rellotge’?”) 0 1 2 3 4 5
28. I got stuck in the middle of a sentence (“It’s a... I don’t know”). 0 1 2 3 4 5
29. I spoke in Catalan / Spanish (words, sentences or whole turns). 0 1 2 3 4 5

351
Not at all--------------------------------------------A lot
30. I invented a word using a structure from English
(“It’s a bromation”, per a ‘una broma’). 0 1 2 3 4 5
31. I used a Catalan / Spanish word but with English
pronunciation ( “I reparo the car”). 0 1 2 3 4 5
32. I used an example or a description to express a word
(“It’s a type of yellow flower”). 0 1 2 3 4 5
33. I used gesture to get my meaning across. 0 1 2 3 4 5
34. I paused for a particulary long time to think about what I
wanted to say. 0 1 2 3 4 5
35. I started saying something and then I restructured the
sentence (“If he leaves...well... he’s walking in the mountain”). 0 1 2 3 4 5
36. I translated literally from Catalan/Spanish. (To say ‘safe deposit box’
I said ‘strong box’ (un caixa forta). 0 1 2 3 4 5
37. I mumbled something because I wasn’t sure about what I was
saying. (“It’s a type of XXX) 0 1 2 3 4 5
38. I left out a word and continued as if I had said it
(The sun is... and people are walking). 0 1 2 3 4 5
39. I tried various incorrect forms before I got to what
I wanted to say (They break... broke... broken.). 0 1 2 3 4 5
40. I used a more general or simple word when I didn’t
know the specific one. (To say ‘beak’, I said ‘mouth’) 0 1 2 3 4 5
AFTER SPEAKING
Not at all--------------------------------------------A lot
41. I asked someone to tell me how I had done. 0 1 2 3 4 5
42. I thought about how I’d done in general. 0 1 2 3 4 5
43. I remembered specific problems I’d had. 0 1 2 3 4 5
44. I thought about which aspects I had to improve
for the next time. 0 1 2 3 4 5
If you think of other strategies which are not listed, note them down here:.
45. ...........................................................................................
................................................................................................. 0 1 2 3 4 5
46. ...........................................................................................
................................................................................................. 0 1 2 3 4 5
Thank you!
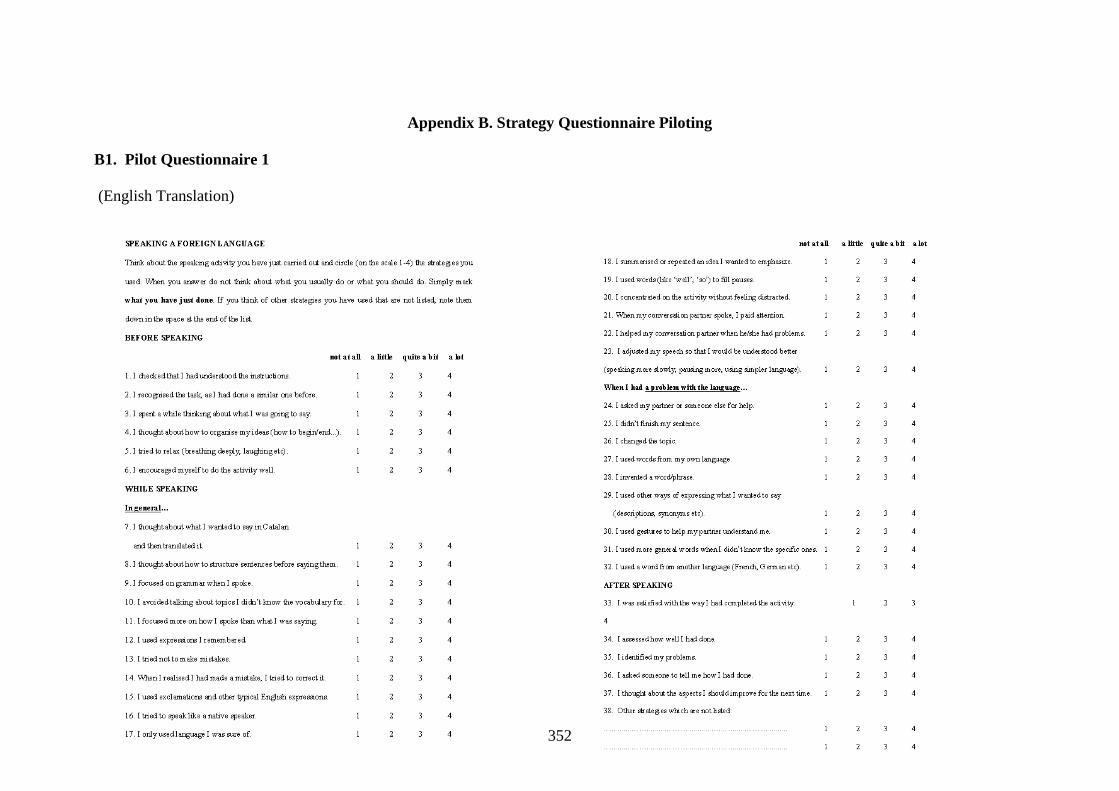
352
Appendix B. Strategy Questionnaire Piloting
B1. Pilot Questionnaire 1
(English Translation)

353
B2. Pilot Questionnaire 2
COM PARLES EN UNA LLENGUA ESTRANGERA?
Ens agradaria que ens ajudéssiu responent aquesta enquesta sobre les estratègies que utilitzeu quan parleu en anglès. Aquest enquesta forma part de la recerca del GRAAL (Grup de recerca en autonomia i aprenentatge de llengües) de la Universitat de Vic. No és una prova per tant no hi ha respostes correctes o incorrectes. Simplement ens interessen les vostres percepcions. Si us plau respongueu amb sinceritat perquè només això ens garanteix l’èxit del nostre estudi. Data: ................................ Carrera: ................................ ............................................................................................................................................... Aquí tens una llista de les estratègies que els estudiants fan servir quan parlen en la llengua estrangera a classe. Pensa en l’activitat oral que acabes de fer i encercla una resposta (de 0 a 3) sobre el teu nivell d’ús de les estratègies. Quan contestis, no ho facis pensant en el que fas normalment, ni en el que creus que hauries de fer, sinó simplement en el que acabes de fer en aquesta activitat. ABANS DE PARLAR
Gens Poc Bastant Molt
1. He reconegut el tipus d’activitat perquè n’havia
fet alguna de semblant. 0 1 2 3
2. He estat una estona planejant què diria. 0 1 2 3
3. He pensat en com ho diria (com començaria, com acabaria etc). 0 1 2 3
4. M’he donat ànims a fer l’activitat ben feta. 0 1 2 3
5. He buscat ajuda al diccionari / al llibre. 0 1 2 3
6. He escrit notes per ajudar-me planejar l’activitat. 0 1 2 3
EN GENERAL MENTRES PARLAVA...
7. Pensava com construir les frases abans de dir-les. 0 1 2 3
8. Feia servir expressions en anglès que recordava. 0 1 2 3
9. Intentava evitar errors. 0 1 2 3
10. Em fixava en la meva pronunciació per parlar com un nadiu. 0 1 2 3
11. M’arriscava a dir coses, encara que no sabés si eren correctes. 0 1 2 3
12. Resumia o repetia una idea, perquè volia destacar la
seva importància. 0 1 2 3
13. Feia servir paraules o frases (well... let me see... ) per
guanyar temps mentre pensava què havia de dir. 0 1 2 3

354
Gens Poc Bastant Molt
14. Només feia servir llenguatge del que estava segur. 0 1 2 3
15. Em centrava en l’activitat sense distreure’m. 0 1 2 3
16. Corregia la meva parella. 0 1 2 3
17. Intentava mantenir la conversa com fos. 0 1 2 3
18. Feia servir gestos per fer-me entendre (contacte d’ulls, un gest). 0 1 2 3
19. Quan la meva parella parlava, em fixava en el que deia. 0 1 2 3
20. Em fixava en el llenguatge que feia servir la meva parella,
i que no coneixia. 0 1 2 3
21. M’enrotllava massa per explicar una cosa. 0 1 2 3
22. Demanava ajuda en anglès. 0 1 2 3
23. Quan parlava jo, mirava com reaccionava la meva parella. 0 1 2 3
24. Demanava ajuda en català/castellà. 0 1 2 3
Quan pensava que no m’entenien bé...
25. Parlava més a poc a poc. 0 1 2 3
26. Feia servir paraules més senzilles. 0 1 2 3
27. Feia preguntes per comprovar si m’entenia (M’entens? Saps?). 0 1 2 3
28. M’explicava utilitzant un exemple o explicació. 0 1 2 3
29. M’explicava en català/castellà. 0 1 2 3
30. Repetia la paraula o frase. 0 1 2 3
Quan no entenia una cosa...
31. Demanava la meva parella que parlés més a poc a poc. 0 1 2 3
32. Demanava una explicació. 0 1 2 3
33. Demanava que ho repetís. 0 1 2 3
34. Continuava la conversa fent veure que seguia. 0 1 2 3
35. Feia preguntes per confirmar que ho havia entès bé. 0 1 2 3
36. Endevinava, en veu alta, el que volia dir (Vols dir ‘car park’?). 0 1 2 3
37. Deia (verbalment o no) que no ho entenia. 0 1 2 3
38. Repetia el que em deia a la meva manera, per
assegurar si ho havia entès bé. 0 1 2 3

355
Gens Poc Bastant Molt
Què feia quan tenia un problema amb el llenguatge?
39. Feia servir una paraula que sonava com la que necessitava
(Volia dir ‘coat’ però he dit ‘boat’). 0 1 2 3
40.Quan m’equivocava m’he autocorregit
en veu alta. (The weather get... gets better). 0 1 2 3
41. Quan m’equivocava, no deia res perquè no hi havia temps. 0 1 2 3
42. Quedava parat a mitja frase (Its a... I don’t know). 0 1 2 3
43. Canviava de tema. 0 1 2 3
44. Deia una cosa totalment diferent perquè no trobava la
paraula que buscava. 0 1 2 3
45. Parlava en la meva llengua materna (paraules, frases o
intervencions senceres). 0 1 2 3
46. Inventava una paraula fent servir alguna estructura en
anglès (‘It’s a bromation’, per a una broma). 0 1 2 3
47. Feia servir una paraula del català però amb la
pronunciació anglesa ( I reparo the car). 0 1 2 3
48. Feia servir altres maneres (un exemple, descripcions)
d’expressar el que volia dir. 0 1 2 3
49. Utilitzava gestos per ajudar a fer-me entendre. 0 1 2 3
50. Feia servir paraules més generals o senzilles quan
desconeixia les paraules específiques. 0 1 2 3
51. Feia servir una paraula d’una altra llengua (francès...)
expressament perquè pensava que m’entendrien. 0 1 2 3
52. Feia una pausa especialment llarga per pensar en el que volia dir. 0 1 2 3
53. Feia servir paraules més generals (that thing...
it’s something...) perquè no sabia la paraula exacta. 0 1 2 3
54. Començava a dir una cosa i llavors he reestructurat
la frase (We can see a... so he’s walking in the mountain). 0 1 2 3
55. Traduïa una paraula, expressió o estructura del català 0 1 2 3
56. Parlava baix menjant algunes paraules perquè no estava
segur del que deia. 0 1 2 3
57. Ometia una paraula i continuava com si l’hagués
dit (The sun is... and people are walking). 0 1 2 3
58. Provava varies formes incorrectes abans d’arribar
a la que volia dir (It’s break... broke... broken.) 0 1 2 3
59. Repetia el que havia dit la meva parella mentre pensava què volia dir. 0 1 2 3

356
Gens Poc Bastant Molt
60. Repetia una cosa que havia dit la meva parella
mentre guanyava temps per respondre. 0 1 2 3
61. Quan dubtava, repetia el que deia en forma de pregunta
(A It’s a horse. B A horse?) per confirmar si ho havia dit bé. 0 1 2 3
DESPRÉS DE PARLAR
62. He avaluat com ho havia fet. 0 1 2 3
63. He recordat els problemes que havia tingut. 0 1 2 3
64. He demanat a la meva parella que em digués com ho havia fet. 0 1 2 3
65. He pensat en quins aspectes havia de millorar per
a la pròxima vegada. 0 1 2 3
Si penses en altres estratègies que has fet servir i que no estan llistades, anota-les aquí.
66. ...........................................................................................
................................................................................................. 0 1 2 3
67. ...........................................................................................
................................................................................................. 0 1 2 3
Moltes gràcies!

357
B3. Structured interview excerpts
Structured interviews were carried out during the second pilot study with the 65-item strategy questionnaire on a 4-point rating scale (0-3). Two high proficiency students, Student HD and Student HM, and two low proficiency students, Student LD and Student LS, were interviewed. The following translated excerpts illustrate items which were considered either problematic or unproblematic. Problematic items Item 4 (I encouraged myself to do well) [Multiple item interpretation, comprehension problems- REMOVED]
High Proficiency
Student HD I don’t understand this very much. (repeats question). Do you mean before starting... You encouraged yourself - like you can do it - like I motivated myself to do it well? Well no. Not much. Maybe a “1”.
Researcher Because did you think about how you were feeling? Student HD Well I always try to do it well and maybe because it was a test I tried to do it a
bit better than usual. (Scale score = 1).
Student HM Well... “encouragement” (laughs)? Researcher How do you understand this one? Student HM Like you’re thinking that it has to turn out perfect. And it doesn’t have to be
perfect but you think up a new story and it comes out how it comes out and that’s it. So, not at all.
(Scale score = 0). Low Proficiency
Student LD yes. Researcher How do you understand this question? Student LD Well, that I came and did it enthusiastically. I didn’t say well I can’t be
bothered or I came... Researcher Ok
(Scale score = 3).
Student LS Yes, this one yes, yes, a lot. Researcher How do you understand this one? Student LS If I was into it or not. Researcher Ok
(Scale score = 3). Item 12 (I summarised or repeated an idea to highlight its importance) [Alternative item interpretation - REMOVED] High Proficiency
Student HD No, I didn’t do it. I said it all in one go and I didn’t want to repeat or highlight anything. (Scale score = 0).
Student HM Quite a bit. And especially when you don’t know how to say it, I repeat it again to see if they’ll really understand.
Researcher But here I wanted to say repeat when you want to highlight an idea. Do you know what I mean? Like you want to say my argument is really important or my point.
Student HM Oh I don’t know.

358
Researcher So you didn’t understand this sentence this way? Student HM I understood that if you’ve got an idea instead of looking for a difficult
explanation to explain it you repeat it, trying to say it in another way. (Scale score = 3).
Low Proficiency
Student LS Yes, especially for the “he broke his leg”. I was three hours saying he’d broken his leg because you keep saying it and then you think about what you’ve said after. (Scale score = 3).
Unproblematic items Item 49 (I used gesture to make myself understood) High Proficiency
Student HD No. Researcher A book (gesture). Student HD No.
(Scale score = 0).
Student HM No, I don’t know, no, maybe a little with my hand. Researcher So why haven’t you put “not at all” because? Student HM Because of the non-verbal vocabulary “the beach, the rubbish” and you use
gestures. (Scale score = 1).
Low Proficiency
Student LD when the word wouldn’t come out. Yes. (Scale score = 3).
Student LS Yes, I do this a lot. I won’t put a lot because in this case... Researcher Ok
(Scale score = 2). Item 50 (...I used more general or simple words when I didn't know the specific one) High Proficiency
Student HD Yes this one yes. Sometimes you want to say something specific and you end up saying “big”.
(Scale score = 2). Student HM No. Little. Researcher Ok. Student HM Because my vocabulary isn’t that broad. I use general words usually and then
its the opposite I try to put in a more complicated one, you know. (Scale score = 1).
Low Proficiency
Student LD Yes. (Scale score = 3).
Student LS Yes, maybe four times. (Scale score = 3).

359
Component Number44
4342
4140
3938
3736
3534
3332
3130
2928
2726
2524
2322
2120
1918
1716
1514
1312
1110
98
76
54
32
1
Eig
enva
lue
10
8
6
4
2
0
Scree Plot
Appendix C. Scree plot from principal components analysis of Stratetgy
Questionnaire data (N=330)

360
Appendix D. Participant biodata
Name Code QPT
CEFR level
Oral Test Sex Age Nationality
University Entrance
Marks Years of
Instruction 1 BeGa 31 B2 7 F 19 E 6 12 2 AnOt 23 A2 5.5 F 20 C 5 6 3 JoGo 14 A1 3.77 M 20 E 6 7 4 JoMa 17 A2 3.69 M 21 E 4 5 5 MaAr 30 B2 6.58 F 18 C 7 10 6 GiGa 29 B1 6.95 F 18 E 6 10 7 SePi 16 A2 3.4 M 20 C 5 11 8 SeRu 19 A2 4.1 M 18 E 6 11 9 MaVi 30 B2 5.25 F 18 C 8 11
10 AnFe 32 B2 5.95 F 18 C 8 11 11 ToSm 50 C1 10 M 23 C 7 6 12 FeFe 50 C1 9 M 22 C 5 14 13 AlGa 21 A2 4 M 20 C 5 9 14 AdSa 21 A2 3.25 M 19 E 5 9 15 CrRa 15 A1 4 F 22 C 5 7 16 AlFe 19 A2 3.25 F 20 E 5 12 17 GeMu 19 A2 2 F 19 C 6 11 18 EsCa 28 B1 4.25 M 20 C 4 10 19 LaPa 15 A1 3.5 F 24 C 5 11 20 SuCo 17 A2 2.94 F 21 E 4 9 21 AnSe 19 A2 3.75 F 20 C 4 9 22 MaPa 19 A2 3.75 F 20 C 4 9 23 DaAm 27 B1 7.25 M 19 E 5 13 24 SeGu 27 B2 6 M 19 C 9 13 25 EmRi 23 A2 6 F 19 C 5 9 26 ElBa 26 B1 5.75 F 20 E 5 9 27 SeMa 23 A2 4.5 M 19 C 5 11 28 LlLi 17 A2 3.98 M 24 E 5 11 29 FrTr 21 A2 4 M 24 E 5 14 30 JaVi 21 A2 4.5 M 20 C 4 17 31 JaPu 24 B1 4.75 M 19 C 5 10 32 AlMa 29 B1 4.25 M 19 E 5 10 33 JuEs 24 B1 6.25 F 19 C 6 10 34 SaPe 34 B2 8 F 19 C 8 11 35 SaCi 17 A2 3.4 F 24 E 4 5 36 NaAl 15 A1 2.5 F 19 E 6 5 37 SaAl 14 A1 4 M 24 C 5 5 38 MoOr 15 A1 2.5 F 24 C 4 9 39 GeSo 25 B1 6.5 F 20 C 7 9 40 MiGu 33 B2 7.5 F 19 E 7 10 41 LoBa 33 B2 8.3 M 19 C 6 6 42 QuCa 33 B2 5 F 21 C 5 14 43 LaJi 40 B2 8 F 21 E 8 7 44 IgTo 45 C1 10 M 21 C 6 15 45 MaCo 50 C1 10 M 23 E 8 6 46 JoTu 45 C1 10 M 23 C 7 12 47 CaSu 48 C1 10 M 23 E 8 9 48 ClAu 50 C1 10 F 18 C 9 11

361
Appendix E. Oral test

362

363

364
Appendix F. Background Questionnaire

365
Appendix G. Reflective Questionnaire
Date: ................................... Identity number: ...................................
Encercleu la resposta adient:
Gens--------------------------------Molt L’activitat era fàcil 0 1 2 3 4 5 6 7 L’activitat era difícil Em sentia relaxat 0 1 2 3 4 5 6 7 Em sentia nerviós L’activitat no era interessant 0 1 2 3 4 5 6 7 L’activitat era interessant Ho he fet bé 0 1 2 3 4 5 6 7 Ho he fet malament Vull fer més d’aquests activitats 0 1 2 3 4 5 6 7 No vull fer més d’aquests activitats ..........................................................................................................................................................................

366
Appendix H. Tasks
H1. Picture Story

367
H2. Art Description
PART 1 Student A The Art Expert Here is one of your favourite paintings in the art gallery. You are an art expert - you have a good knowledge of the art world. You are looking at this painting in the art gallery with a friend who knows nothing about art. With the confidence of an expert CREATE AN EXPLANATION for the painting (e.g. the artist, the style, the colours) and GIVE YOUR ‘EXPERT’ OPINION of it. Student B (your friend) will start the conversation and ask you questions.

368
H2. Art Description (continued)
PART 2 Student A The Art Novice Now you have reversed your roles. Here is an interesting painting in the art gallery. You are an art novice – you have no knowledge of the art world. You are looking at this painting with your friend who is an art expert. ASK your friend QUESTIONS about the picture because you don’t understand what it means. Include the 5 numbered elements you see. You start the conversation.

369
H3. Information Gap
Student A Look at the pictures below. DO NOT show them to your partner. DESCRIBE each picture to your partner IN DETAIL and decide together if you have the same or different pictures. Circle the number next to the pictures which are different. Student B starts. When you have finished, look at each other’s pictures and check your answers.

370
H3. Information Gap (continued) Student B Look at the pictures below. DO NOT show them to your partner. DESCRIBE each picture to your partner IN DETAIL and decide together if you have the same or different pictures. Circle the number next to the pictures which are different. You start. When you have finished, look at each other’s pictures and check your answers.

371
Appendix I. Stimulated recall protocol
STIMULATED RECALL: RESEARCHER INSTRUCTIONS
1 READ OUT THE INSTRUCTIONS TO THE PARTICIPANT: El que farem ara és mirar la gravació. M’interessa el que pensaves en el moment que parlaves
durant l’activitat. Sentim el que deies i veiem el que has fet però no sabem el que pensaves. Per tant, m’agradaria que m’expliquessis el que pensaves, el que tenies al cap mentres parlaves.
Posaré la càmera aquí, davant teu i pots fer pausa en qualsevol moment. Per tant, si pots
explicar en què pensaves, pitja la pausa. Si jo tinc una pregunta sobre què pensaves pitjaré la pausa i et demanaré que parlis sobre aquella part de l’activitat.
2 MODEL STOPPING THE RECORDING AND ASKING A QUESTION: Play a segment, YOU stop the recording and ask a question: En què pensaves en aquest punt/moment? Digues en què pensaves aquí. Aquí rius / fas una cara / fas aquest gest, en què pensaves? Play another segment, THE PARTICIPANT stops the recording and explains. 3 PLAY THE RECORDING AS IN 2. Non-responses by the researcher are preferable to answers or extended responses. TROUBLESHOOTING
a) If participants say ‘I DON’T KNOW’ leave it there, don’t fish for answers.
b) If participants don’t stop the recording, stop it yourself and DIRECT ATTENTION by asking the following possible questions:
Recordes el que estaves pensant quan ella/ell ha repetit això? Recordes en què pensaves quan ha dit aquelles paraules? Recordes en què pensaves quan ha dit això?
Recordes el que estaves pensant quan has repetit això? Recordes en què pensaves quan has dit aquelles paraules? Recordes en què pensaves quan has dit això?
c) If the participant talks over the recording without pausing, pause and place the camera so that the
participant can release the pause when they finish.

372
Appendix J. CHAT transcription excerpt
1 @Begin 2 @Languages: en, ca, es 3 @Participants: SEP XXXX Student, SER XXX Student, SAR Teacher 5 @ID: en|khan|SEP||male|low||Student|| 6 @ID: en|khan|SER||male|low||Student|| 7 @Date: 06-NOV-2008 8 @Coder: Sarah Khan 9 @Location: EPS, Universitat de Vic, Vic, Spain 10 @Warning: overlaps, phonetic transcriptions and gestures are not coded 11 accurately. 12 @Activities: Task 1 Picture Story 13 @Tape Location: tape 1.1 14 @Time Duration: 00:02:14-00:10:27 15 *SER: er er in picture one er we can see: a: a: ## +/. 16 *SER: pareja &=whispers ? 17 *SEP: a couple [* p:ku:pə] &=whispers [= ::] [= |] . 18 *SER: a couple [* p:ku:pə] er: [= ::] looking for er a journal [= item40] 19 doing his honeymoon in their honeymoon er: # they # they are: doing # plans 20 # for do this trip for doing this trip . 21 *SER: no@c sé@c. 22 *SEP: that's all. 23 *SEP: ok. 24 *SER: sí@c. 25 *SEP: ok. 26 *SEP: in the picture two we can see: this couple [* p:ku:pə] that er in 27 the day of his: marry ?
28 *SER: wedding [* p:wɪdɪŋ]. 29 *SEP: oh wedding [* p:wɪdɪŋ] oh ok wedding [* p:wɪdɪŋ] . 30 *SEP: er er we can see the: the # er his friends. 31 *SER: throw rice. 32 *SEP: throw rice and er do photos . 33 *SER: take take pictures . 34 *SEP: take pictures &=whispers . 35 *SER: yes. 42 *SEP: oh sí@c és@c veritat@c &=whispers . 43 *SER: torna@c a@c començar@c . 44 *SEP: tu@c tu@c va@c . 45 *SER: er in the picture three [* ms:art] we can see er the car er 46 the [/] the car [= ::] [= |] er # it: go [* ms:goes] to the airport 47 [= ::] [= |] . 48 *SER: I suppose [= ::] that: [/] er that: er they start their trip 49 [/] # er their trip er [/] [= item28] [= ::] [= |] ## . 50 *SER: com@c es@c diu@c agafar@c un@c avió@c &=whispers [= item24] ?

373
Appendix K. Transcription codes
yes - all types of ‘yes’ including ‘yep’, ‘yeah’ @c - Catalan @e - Spanish @u - unfinished words which cannot be guessed from context : - lengthening at the end of a word / syllable eh? - What do you mean? mmhm - uhuh etc, showing attentiveness oh - surprise, all types of ‘puf’ ‘uf’ ‘ah’ +/ - interruption: line terminator for an interrupted utterance [=! whispers] - action simultaneous with speech &=laughs - action after speech &=ges:* - gesture: type of gesture # - less than 1 sec pause ## - more than 1 sec pause ### - more than 2 sec pause er - filled pause [/] - repetition [//] - correct self-repair [///] - reformulation of own utterance [////] - incorrect self-repair +< - lazy overlap +// - self interruption xx -indecipherable word in L1 (not counted in TTR) xxx -indecipherable word in L2 (counted in TTR) 0 - action not accompanied by speech 0 - [=! reads instructions] [= |] -delimits AS unit [= ::] -delimits clause / s-node

374
Appendix L. Instructions for coding spoken production
You are going to code students doing three oral tasks (Picture Story, Art Description, Information Gap). Code the following 12 task transcriptions Group1 Tape Group2 Tape________ ClAu1& CaRi1 17,5/ 12,1/ 18,1 SaCi2 & NaAl2 7,2/ 15,3/ 23,2 DaAm1& SeGu1 6,1/ 15,2/ 17,2 FrTr2 & JaVi2 7,3/ 22,1/ 10,5 Code all Picture Story tasks first, then Art Descriptions and then Information Gaps. See Transcription Codes to familiarise yourself with codes for pauses, gesture etc. An example of a coded transcript is provided in ExampleCoding.doc.
1 Read through the transcript once to get a general idea and look at the task at the same time so you can see what students are talking about. This way you will be able to recognise errors, repair and reformulation more accurately.
2 Accuracy
Read through the transcript again, looking at the task and code for errors [*] using the guidelines provided.
3 Read through the transcript again and code for codeswitching using the guidelines provided. Add c for Catalan or e for Spanish to the end of L1 words.
4 Fluency
Read through it again and code for repetition [/], self-repair [//] and reformulation [///] using the guidelines provided.
5 Complexity Read through it again and code AS-units [= |] and s-nodes [= ::] using the guidelines provided.
In the following guidelines excerpts from transcripts in this study are provided as examples. 1) Accuracy Errors An error is “a linguistic form or combination of forms, which in the same context and under similar conditions of production would, in all likelihood, not be produced by the speakers’ native speaker counterparts.” Lennon (1991: 182) Lexical, morphosyntactic and phonological errors are considered (Kormos, 1999) as the following examples illustrate:
Lexical error [*l:] ... the down [* l:bottom] rectangle oh, I think the rows coz # coz there's no one [* l:nothing] there.
Morphosyntactic error [*ms:]
-agreement + missing object and there are [* ms:is] a triangle in front of [* ms:odrop] .

375
-incorrect preposition on the left from [* ms:of] the snake
-missing article
yes I would say it's [* ms:artdrop] Aladdin lamp -incorrect word order
but I can see as well the other lines [* ms:wo]
These types of question tags are not counted as errors:
the six ropes, no ? Phonological error [*p:]
of triangle [* p:tri:æŋgəl] in front of .
yes striped [* p:stri:pt] yes
DO NOT include fine appropriacy errors. DO NOT include use of L1 as an error. 2) Fluency Repetitions [/] A repetition is when the speaker repeats previously produced speech. Only count dysfluency repetitions [/].
Complete repetitions so, what's your [/] your picture like ?
Partial repetitions
is a thee dimensional sha(pe) [/] shape? Repetitions which do not represent dysfluency are the following: DO NOT include repetitions for emphasis.
he’s a very very nice man . / yes yes yes!
DO NOT include repetitions in response to a clarification request.
A: a fence . B: sorry? . A: a fence .
DO NOT include repetitions which are overlaps A: +< it's a snake . B: +< it's a snake .
DO NOT include repetition caused by interruption
A: in the +/. B: and the four triangles &=ges:fingers B: er yes yes. A: in the: [/] the top of triangle

376
Reformulations [///] A reformulation is considered to be an instance when the speaker changes their original utterance to say something completely different. They could be considered “different repair” Levelt 1983 . There is no overt error involved in the first version, for example:
an envelope which seems to be open by: [///] in the: [/] # in the upper. how do you count the [///] er them ? INCLUDE false starts er: in the [* ms:art] picture one er I s:@u [///] I can see a: square...
yes, I [///] in this picture is a chimney and er in two parts. Reformulations which do not represent dysfluency are the following: DO NOT include reformulations which are made to elaborate meaning to improve the precision of their message (appropriacy repairs) (Levelt, 1983). In these cases the original message is not changed but elaborated. Part of the first version is repeated in the second version. Such phenomena represent complexity rather than disfluency, for example:
and then in the fifth and the fourth one I have the same one as you, that tube or kind of a cake ...
the fifth picture is an eye a female eye .
DO NOT include code switches, for example: and well the line of the: [/] of the: # del@c terra@c .
Self-repair [//] This is when the speaker changes their utterance to correct an error due to a lapse (Kormos, 1999). These may be lexical, morphosyntactic or phonological.
Morphosyntactic repair there is [* ms:agr] dark hairs [//] dark hair I mean. yes in the centre of [* ms:art] triangle [//] of the triangle Lexical repair These are both covert repairs that you can only detect by looking at the pictures for the task. there's another small room [* l:roof] [/] oh room [//] roof ? it's er on the bottom [* l:top] of the tent [//] er on the top of the tent. Phonological repair
I can see a snake [* p:snaik] [//] # snake.
er: my eye [* p:ei] seems [* ms:like] a woman's aye [= ::] [= |]. Incorrect repairs [////]
so at [* ms:in] [////] on [* ms:in] the first picture when you go to a camping [* l:campsite] [////] to camping [* ms:prep] ?

377
3) Structural Complexity: AS units and Clauses.
An AS-unit: a single speaker’s utterance consisting of an independent clause(s) or sub-clausal unit, together with any subordinate clause(s) associated with either. Examples of both simple and potentially difficult coding sequences are given. An AS-unit is marked by an upward slash in square brackets at the end of the unit.
[= |]
A clause is marked by double colon in square brackets at the end of a clause. [= ::]
An independent clause is minimally a clause including a finite verb:
it's definitely not mine [= |] [= ::]. 1 clause, 1 AS unit I don't know [= |] [= ::] . 1 clause, 1 AS unit
no it isn't [= ::] [= |]. 1 clause, 1 AS unit
An independent sub clausal unit will consist of: either one or more phrases which can be elaborated to a full clause by means of recovery of ellipted elements from the context of the discourse or situation.
er the columns or the rows [= |] [= ::] ? 1 clause, 1 AS unit (Do you count the columns or the rows?) A: some curve lines on: like a [= |] [= ::] +/. 1 clause, 1 AS unit (they are some curvy lines on like a ...) ok the: [/] the first one [= |] [= ::] . 1 clause, 1 AS unit (Let’s do the first one) picture number six [= ::] [= |] . 1 clause, 1 AS unit
sorry sorry [= ::] [= |]. (non sentences) 1 clause, 1 AS unit
A subordinate clause will consist minimally of a finite or non-finite verb element plus at least one other clause element (Subject, Object, Complement, Adverbial).
ok so my first picture is: a square: [= ::] which # is divided in # four triangles [= ::] [= |]. 2 clauses, 1 AS-unit
oh, I think [= ::] the rows [= ::] coz [/] # coz there's no one there [= ::] [= |]. 3 clauses, 1 AS-unit
bueno in my figure it looks like a cake like a: typical cake from here from Catalunya [= ::] called Braçdegitano [= ::] [= |]. 2 clauses, 1 AS-unit
Co-ordinated verb phrases belong to the same AS unit unless the first phrase is marked by falling or rising intonation and followed by a pause of greater than 0.5 second.
it cannot be yours [= |] [= ::] # but I think [= ::] that the second is the same as your first [= ::] because it's a square [= ::] and divided into er one two three four triangles [= ::] and one is black [= |] [= ::] . 6 clauses, 2 AS-units

378
“it cannot be yours” is counted as an AS-unit as the next clause “ but I think that the second is the same as your first” is not linked to it although it begins with the linker “but”. It is a separate piece of micro-planning/thinking marked by intonation change/pause. Inaudible turns INCLUDE turns coded as xxx xxx xxx, as 1 clause, 1 AS unit. (xx are inaudible transcriptions of L1 and should not be included) Interruptions
Own interruption A: I've got +//. A: wait a second [= |] [= ::] one two three four five # er six seven eight nine ten eleven [= |] [= ::]. (2 clauses, 2 AS-units)
Other interruption
Interrupted but completed utterance
A: ok is [* s:sdrop] the: same +/. 0 AS units B: er +/. 0 AS units A: picture [= |] [= ::] ? 1 clause, 1 AS unit Interrupted and incompleted utterances A: mine is [///] +/. 0 AS units B: it's left [= ::] because on the right side the: [/] # the lines are er connected more sharply
than on the left [= ::] [= |] (2 clauses, 1 AS unit) DO NOT include the following as an AS-unit:
1 one-word utterances: yes, ok, no, er, right, so Except INCLUDE one word utterances which represent comprehension checks, if they are in the form of a question, marked by rising intonation.
Yes? (do you agree?) elephant? (do you mean elephant?)
2 echo responses which are verbatim:
A: on the ten there's this elephant [=::] [= |] B: elephant .
3 False starts, repetitions and self-repair.
A false start is an utterance which is begun and then either abandoned or reformulated in some way. A repetition is when the speaker repeats previously produced speech. Only dysfluency repetitions (as described above) are excluded from the AS-unit, coded as [/]. INCLUDE repetitions for emphasis, repetitions in response to a clarification request and repetitions which are overlaps. A self-repair,coded as [//], occurs when a speaker identifies an error during or immediately after articulation. The errors are excluded from the AS-unit but the final version is counted in.
4 Reading aloud.

379
Appendix M. Instructions for coding strategies
1 Take an uncoded transcript to code strategies. DO NOT code strategies on the same transcript copy as Fluency-Accuracy-Complexity.
2 Use the list of strategies provided (StrategyCodingTable.doc) and write the number of the
strategy after it occurs on the transcript.
3 StrategyIdentification.doc contains examples of each strategy to help you identify them.
4 First read through the transcript to identify episodes of non-comprehension (items15-25). It may be that no such episodes occur.
One problem is identifying instances of feigning understanding (item22) or guessing (item23), as these aren’t always obvious. They are usually caused by some kind of phonological or lexical error in a previous utterance.
5 Then read the transcript again for strategies 27-40.
One problem is identifying instances of Item 40: using a more general or simple word. These are instances where the student isn’t using exactly the right word, as you can see from the visual and they must be preceded by pausing or hesitation.
6 For lexical strategies, for example if a student invents a word, only code the word once, do
not code repetitions of the word in the remaining transcript.

380
Appendix N. Strategy identification
Transcript excerpts are coded with the same participant name codes eg.*MIR:, as used in the CLAN programme. For an explanation of transcription codes see Appendix K, however, most codes have been removed for easier readability. Recall comments are translated from Catalan. Recall excerpts are coded with participants’ initials, proficiency group (H- high proficiency, L- low proficiency), the task (01- Picture Story, 02- Art Description, 03- Information Gap) and the sequence of task performance (01- first, 02- second, 03- third), for example: ClAuH0103. ClAu is the student’s name, H means high proficiency group, 01 means the Picture Story and 03 means that this student performed the task third. 1. I recognised the activity because I had done a similar one.
CFM: task familiarity Relating the material to prior knowledge of the task or of the world.
Researcher: Have you done an activity like this before? SePiL0202: No I’ve never done this before LaJiH0303: This was more interesting than the others because I’ve never seen this before. I’ve
never done anything like this. 2. I spent a while thinking about what I was going to say.
PLANNING: advance organisation (O’Malley & Chamot,1990: 137; Oxford, 1990; Stern, 1992; Chamot et al.,1999). Previewing the organising concept or principle of an anticipated learning task.
GeMu0303: We looked at it and had an idea, more or less, of what it was about but we didn’t spend a long time preparing each picture, SePi010: Here we were looking at the pictures trying to see a bit what was going on... but of
course you think in Catalan and you think well its easy. 3. I thought about how I would explain (how to begin, how to end).
PLANNING: organisational planning (O’Malley & Chamot,1990: Oxford, 1990; Stern, 1992; Chamot et al.,1999). Proposing strategies for handling an upcoming task; generating a plan for the parts, sequence, main ideas, or language functions to be used in handling the task.
NaAl0101: At the beginning I’m reading the instructions and looking at the pictures trying to see
what they’re about... When XXX says “picture number one start you”, I’m not ready. I haven’t prepared the pictures but as the camera is recording.
Pre-task planning A: *JOR: ok. *JOS: ok. *JOR: 0 [= reading instructions]. *JOS: 0 [= reading instructions]. *JOS: I start. *JOR: ok. @End

381
Pre-task planning B: *SER: veu es lo que t'he dit es casen i desprès els hi plou. *LLU: estan com a dintre d'una botiga aquí em sembla, no? *SER: no no això és llegan al aeropuerto. *LLU: a vale. *SER: i després don compta que plovia es que ja m'ho ha explicat ja. *LLU: és Madrid això. *SER: 0 [= laughs]. *SER: plou. *LLU: llavors. *SER: llavors volen +/. *LLU: volen anar a comprar er cap allà a la platja això és Benidorm i després fan un viaje a Torrevieja.
4. I made notes to help me do the activity.
note taking (O’Malley & Chamot, 1990: 138, Oxford, 1990). Writing down key words, and concepts in abbreviated verbal, graphic or numerical form to assist performance of a language task.
Identified by direct observation
5. I used expressions in English that I remembered.
CFM: using expressions (Oxford, 1990). Placing a word or phrase in a meaningful sentence, conversation or story to remember it.
IgTo0101: Yes here at the beginning I was thinking of expressions like check in and these things
but in that moment I didn’t er thought of it and then I was thinking of the Spanish you know deshacer la maleta and you know put the clothes in the wardrobe so I didn’t get to those expressions.
*IGN: finally they: they found another hotel where: they were able to stay for the whole
honeymoon and: which was very close to the sea and they had beautiful views from from their room and they were very excited about going to the beach and so: er as soon as they: had: finished with their luggage they went straight to the beach.
6. I avoided errors.
CFM: avoiding error/self monitoring (O’Malley & Chamot,1990: Oxford, 1990; Stern, 1992; Chamot et al.,1999). Checking verifying or correcting one’s langauge production. Researcher: You said you avoided errors a bit? BeGa0201: Yes I tried. Sometimes I did, sometimes not. Also identified as % error-free clauses.
7. I used words or phrases like (“well”, “ let me see” ) to gain time.
CFM: use of fillers (Dörnyei & Scott, 1997). Using gambits to fill pauses, to stall, and to gain time in order to keep the communication channel open and maintain discourse at times of difficulty. *BEG: I have # well a cross &= ges:cross and next &= ges:handmove to the cross I have er:
like a box... *ANN: yes. *JAU: at in the # &=ges:lefthandraw in the hand hand in the right hand there have an antenna

382
that it will be a a continue of the the line &=ges:hand er one moment eh.
8. I risked saying something even though I wasn’t sure it was correct.
COMPENSATION: risk taking GeMu0303: I didn’t know if triangle was a Catalan word or if it was different. *GEM: in the picture one I can see an square with four # triangles [* p:tri:æŋgəlz]and one of
them are painted in black.
SeRu010: Here ‘looking for’ I wasn’t sure if I had said it right or if it was right for this context. *SER: er xxx@e in the picture five the couple is: looking for the window # the the the
environment. 9. I focused on the activity without being distracted.
PLANNING: directed attention (O’Malley & Chamot, 1990: 137; Oxford, 1990). Deciding in advance to pay attention in general to a learning task and to ignore distractors; maintaining attention during task execution. SePi0202: Focus on the activity – yes more because the other one was familiar but this one we
focused a bit before on what we would say. 10. I used English I was sure of.
CFM: avoiding risk MiGu0301: I think here we’re both thinking whether it was called triangle or not *GEM: an envelope which seems to be open by: in the: # in the upper. IgTo0101: I didn’t know if I was going to say that they were going to get a limousine or
something but I wasn’t sure if limousine was the correct word so I said a taxi although there wasn’t any taxi sign.
*IGN: and the day after the wedding they: took a taxi at nine am in the morning to the airport
where: they: took off from Barcelona to the island of er: Las Palmas Gran Canaria. 11/33. I used gesture to help my partner understand me.
CFM: Mime (Dörnyei & Scott, 1997; Tarone, 1977: Faerch & Kasper, 1983; Bialystok, 1990; Paribakht, 1985; Willems, 1987; Nijmegen group). Two types of gesture were coded:
Elaborating *QUE: er: when they: arrive at the room they saw the beach and: but behind other buildings &=ges:handsout.
Substituting *FER: and there are like one two three three lines in the: pot # er well not different well there's
a &=ges:grasp. *FER: how do you say handle ?
Deictic gesture (interlocutors pointing to pictures, objects or to each other) was not included.
12. I maintained the conversation as much as possible.
CFM: maintaining conversation LaJiH010: The picture didn’t have much in it but as I saw that *XXX had talked a lot I tried to
say more things but I just repeated what I has said ...

383
*LAU: er because of they had nothing to do in the hotel because Tom was very bad er they
decided to write some postcards to their family and they: they explained that they had a wonderful time there but it's not true as we know and: they wrote a lot of postcards to friends and # and family.
13. I thought about how to structure sentences before saying them.
PLANNING: planning sentence structure
NaAl0202: I was thinking about how to structure the question. First the auxiliary then... *NAT: er: # what ## &=ges:handstop what have #6 what #4 *NAT: what er: er &=ges:pointpic do: make #3 that er the boy &=ges:pointpic have: the
sunglass ? The following Interactional strategies (Item14-Item25) were only coded if preceded by an expresssion of non-comprehension such as er or eh?. 14. When my partner didn’t understand me I spoke slower.
INTERACTIONAL: clarification by speaking slower Speaking slower in response to an expression of non-understanding.
*SAB: and why oh er: &=ges:pointpic the plant isn't green? *NAT: 0 [=! confused] *SAB: 0 [=! laughs]. *SAB: why &=ges:pointpic the plant isn't green [=! speaks slower] ?
15. When my partner didn’t understand me I asked questions to check.
INTERACTIONAL: comprehension check Asking for confirmation in response to an expression of non-understanding.
*MIR: er this thing that you # your where you put inside when you go to a camping to
camping? *GEM: yes . *MIR: do you know what I mean? *MIR: like a bed.
16. When my partner didn’t understand me I explained in another way.
INTERACTIONAL: clarification by circumlocution Circumlocution in response to an expression of non-understanding.
*QUE: ah because they don't want to see what's happening behind the: behind them. *LLO: oh! *LLO: you mean the face behind that &=ges:pointpic behind them? *QUE: yes the black face with er I think a woman who: who's hungry and from Africa. *LLO: mmhm .
17. When my partner didn’t understand me I explained in Catalan / Spanish.
COMPENSATION: clarification by code switch Code switching in response to an expression of non-understanding.
*SEP: and the between mountain is in the behind ? *SER: què@c ? *SEP: in the between mountain in the +/.

384
*SER: behind és@c ? *SEP: és@c darrera@c . *SER: sí@c .
18. When my partner didn’t understand me I repeated the word or phrase.
INTERACTIONAL: clarification by repetition Repetition in response to an expression of non-understanding. *SAN: legs ok. *MON: what? *SAN: legs four legs.
19. When I didn’t understand my partner I asked him/her to speak slower.
INTERACTIONAL: asking to speak slower Strategy not identified
20. When I didn’t understand my partner I asked for an explanation.
INTERACTIONAL: clarification request Requesting an explanation when not understanding properly.
*NAT: be(cause) because the the person in on the picture is: bueno@e have ## yellow hair? *SAB: who person ? *NAT: er: &=ges:picpoint +/. *SAB: the man or the woman ? *NAT: both.
21. When I didn’t understand my partner I asked him/her to repeat.
INTERACTIONAL: asking for repetition Requesting repetition when not hearing or understanding properly.
By repeating the stem
*GIS: er: my eye seems a woman's eye. *MAR: sorry your eye seems? *GIS: a woman's eye a woman's eye. Explicitly *SEP: er in picture two er er is a: a lorry and a driver and the lorry buy a: something and: and
no more. *SER: er could you repeat?
22. When I didn’t understand my partner I carried on as if I’d understood.
INTERACTIONAL: feigning understanding Making an attempt to carry on the conversation by pretending to understand, in spite of not understanding.
Researcher: Did you know what background meant? SePi0202: I wasn’t sure no. *SER: be(cause) why the background is blue? *SEP: er . *SER: si@c que@c xx xx . *SEP: er if because... SePi0202: I didn’t realise what sand meant.

385
*SEP: sand for example. *SER: is full ? *SEP: is: +... *SER: or empty? *SEP: empty . *SEP: full full full.
23. When I didn’t understand my partner I guessed what he/she was saying
INTERACTIONAL: guessing Guessing is similar to a confirmation check/request but implies a greater degree of uncertainty and indecision regarding the key word.
*TOM: something similar to pie? *TOM: rollade ? *FER: yes, yes yes like a roll &=ges:roll yes yes and: +/. *JUD: it's black but only on it # oh +/. *SAN: the top the top of the skin +/? *JUD: the top yes the: the top of the skin ...
24. When I didn’t understand my partner I said so (“I don’t understand”... ).
INTERACTIONAL: confirmation check Requesting confirmation that one heard or understood something correctly.
*SER: on the: higher part &=ges:handup. *DAN: the higher ? *SER: yes . *DAN: or the lower? *SER: no the higher &=ges:handuphoriz .
25. When I didn’t understand my partner I repeated what he /she had said in my own way to ensure that I had understood.
INTERACTIONAL: interpretive sumnmary Extended paraphrase of the interlocutors message to check that the speaker has understood correctly.
*LLO: I think it's something about that &=ges:pointpic this this won (derful) wonderful
nightlife. QuCa0103: well they go to a club or a disco or something... *QUE: ah because they don't want to see what's happening behind the: behind them. *LLO: oh you mean the face behind that &=ges:pointpic behind them ?
26. When I made a mistake I corrected myself out loud.
CFM: self-repair Identified as % self-repair. .
27. I asked for help.
COMPENSATION: appeal for help Indirect appeal for help Trying to elicit help from the interlocutor indirectly by expressing the lack of a needed L2 item, either verbally or non-verbally.
*GEM: and once in the room &=ges:pointpic we can see how they # they er: ###

386
*GEM: 0 [=! looks at Miriam] . *MIR: xx xx sorry! *GEM: they unpack &=ges:pointpic their... Direct appeal for help Turning to the interlocutor for assistance by asking explicitly a question concerning a gap in the speaker’s L2 knowledge.
*FER: and that's all well there are like &=ges:fingerpoint two er how do you say it two
&=ges:fingerwave ? *TOM: I don't know.
28. I didn’t finish my sentence.
COMPENSATION: message abandonment Leaving a message unfinished because of some language difficulty.
*JIT: yes but they decided to: take it er easy and he: jumped over some: fence and he was
making silly things and they were er: er: # . *MAR: they wanted to celebrate it there. *JIT: they wanted to celebrate it. *LAU: it was supposed to be a paradisiac beach it was a normal beach with: beach with: with: a
lot of # . *LAU: no@c se@c com@c es.@c diu@c.
29. I spoke in Catalan / Spanish (words, sentences or whole turns).
COMPENSATION: code switching Including L1/L3 words with L1/L3 pronunciation in L2 speech; may involve stretches of discourse ranging from single words, to whole chunks and even complete turns.
NaAl0103: I was trying to think of ‘travel brochure’ and I said catàleg. I spoke under my breath
in Spanish. *NAT: is look the: catàleg@c of the: the travel for er: ## their their honey er honeymoon.
*EMM: perquè@c son@c tots@c the same!
*NAT: er and use of the: for &=ges:handsplay building the: house. *SAB: 0 [=! ges:confused]. *NAT: yes . *NAT: xx ? *SAB: es@c utiliza@c para@e casas@e.
30. I invented a word using a structure from English.
COMPENSATION: word coinage Creating a non-existing L2 word by applying a supposed L2 rule to an existing L2 word.
*GEM: and picture three &=ges:pointpic we can see how Tom and Judy leaves to the airport going to: the: hotel Paradise with a lots of globes &=ges:handcups in the car and flowers. Catalan: globus English: balloons *GIS: er what you put to limitate a garden &=ges:handturns. *MAR: a fence. *GIS: yes this

387
Catalan: limitar English: limit
31. I used a Catalan / Spanish word but with English pronunciation.
COMPENSATION: foreignising Using an L1/L3 word by adjusting it to L2 phonology ie with L2 pronunciation and or morphology.
*LLO: well then back in their room they write er postals to their friends saying that they have a wonderful time. Catalan: postals English: postcards 131 *ANN: and: in eight I have a: familiar house. Catalan: familiar English: family
32. I used an example or a description to express a word.
INTERACTIONAL: circumlocution Exemplifying illustrating or describing the properties of the target object or action.
This resourse deficit strategy was distinguished from Item 16 which was an interactional strategy in response to an expression of non-understanding.
SERU0303: I couldn’t think of handle *SER: and the teaboat is dark # and have a # something er for for for catch the teapot . MiGu0301: We don’t know how to say that it’s moving, that it’s got those bumps. (referring to
the slithering snake). *GEM: yes I think and it seems to be walking &=ges:handwaves well.
33. I used gesture to get my meaning across. (As for Item 11) 34. I paused for a particulary long time to think about what I wanted to say.
COMPENSATION: long pause
Identified as AS-units per long pause
35. I started saying something and then I restructured the sentence.
COMPENSATION: restructuring Abandoning the execution of a verbal plan because of language difficulties, leaving the utterance unfinished, and communicating the intended message according to an alternative plan
Message replacement Substituting the original message with a new one because of not feeling capable of executing it.
*CLA: er ok so # in the ninth picture he: [///] I don't know where they're going. *CLA: maybe they're drunk.
*GEM: are very luxury hotels and wonderful nightlife and ### and an special atmosphere and they &=ges:pointpic are very ## [///] they are looking forward to go to this paradise...
Message reduction Reducing the message by avoiding certain language structures or topics considered problematic because a lack of linguistic resources

388
*SAN: it was a bit difficult it's difficult to explain because it it [///] it's difficult to explain &=laughs. *JUD: ok then: er: they: they think that they can go to the beach and they: [///] they go &=laughs.
36. I translated literally from Catalan/Spanish. (As for Items 30 and 31 above).
COMPENSATION: literal translation
37. I mumbled something because I wasn’t sure about what I was saying.
COMPENSATION: mumbling Swallowing or muttering inaudibly a word whose correct form the speaker is unsure of.
See the recall comment for Item 29 above.
38. I left out a word and continued as if I had said it.
COMPENSATION: omission Leaving a gap when not knowing a word and carrying on as if it had been said.
*NAT: most singer that the other people er of er of [= item38:go] out the: the room. *EST: and her mouth to throw the: [= item38:tea] and nothing else.
39. I tried various incorrect forms before I got to what I wanted to say.
COMPENSATION: retrieval (tip-of-tongue phenomenon) In an attempt to retrieve a lexical item saying a series of incomplete or wrong forms or structures before reaching the optimal form.
*JAU: what part the part are painted are the hi [/] the hi [/] &=ges:handup the high part. *MAR: how many twists do does it have?
40. I used a more general or simple word when I didn’t know the specific one.
COMPENSATION: approximation Using a single alternative lexical item such as a superordinate or a related term which shares semantic features with the target word or structure.
SeRu0303: I didn’t know how to say eyelashes. *SER: a eye with bueno@e a open eye er: with with hair in in in the skin of of top of the eye. *EST: in picture ten we can see an elephant with her nose # up # and +... *GEM: a water.
41. I asked someone to tell me how I had done.
Researcher: Did you ask someone to tell you how you had done (Art Description)? SePi0202: how we had done? Less. We talked about it but not as much this time. Researcher: Did you ask someone to tell you how you had done (Art Description)? BeGaH0201: Yes, we (with partner) talked about it together.
42. I thought about how I’d done in general.

389
EVALUATING
BeGaH0302: I thought it was difficult (Information Gap) because I didn’t have the vocabulary or maybe you do have it but at the moment I couldn’t find it.
Researcher: Did you think about how you did in general (Art Description)? SePiL0202: Worse, as I didn’t have any idea about painters and that. 43. I remembered specific problems I’d had. EVALUATING
Researcher: What did you think in the beginning (Information Gap)? BeGa0302: That I didn’t have the vocabulary of the prepositions. I saw the pictures and I thought how will I describe it without any prepositions! The only thing that I could say was top, bottom, left and right and more things came up so it’s difficult when you don’t have any prepositions.
Researcher: What about specific problems? SePi0202: yes the Catalan words I used like simbolise (invented) and destacar. 44. I thought about which aspects I had to improve for the next time. EVALUATING
Researcher: Did you think about how you could improve for the next time? SePiL0202: improve, yes I think we should have more practice improvising in English as we usually explain things we’ve prepared.

390
Appendix O. Descriptive satistics of PSU for high proficiency group
Strategy Picture Story Art Description Information Gap M SD M SD M SD 1. (task familiarity) 3.42 1.72 1.63 1.86 2.33 2.08 2. P (advance organisation) 2.42 1.18 2.50 1.44 1.71 1.37 3. P (organisational planning) 2.00 1.44 2.13 1.03 1.29 1.20 4. (note taking) .39 1.12 .08 .28 .50 1.29 5. CFM (using expressions) 1.71 1.33 1.83 1.52 1.54 1.53 6. CFM (avoiding error) 2.92 1.02 2.71 .91 2.92 1.41 7. CFM (use of fillers) 2.33 1.61 3.00 1.62 2.38 1.50 8. C (risk taking) 3.08 1.10 2.88 1.26 3.46 1.02 9. P (directed attention) 4.25 .68 3.79 1.14 4.08 .83 10. P (not taking risks) 3.50 1.32 3.29 1.12 3.13 1.03 11. CFM (gesture) 2.38 1.53 2.88 1.15 3.63 1.53 12. CFM (maintaining conversation) 3.00 1.29 3.17 1.24 3.17 1.09 13. P (planning sentence structure) 1.96 1.46 2.33 1.31 1.83 1.24 14. I (clarification by speaking slower) 1.42 1.41 2.04 1.49 2.04 1.20 15. I (comprehension check) 1.13 1.45 1.54 1.41 2.00 1.59 16. I (clarification by circumlocution) 1.58 1.64 1.79 1.35 3.13 1.23 17. C (clarification by code switch) .75 1.39 .92 1.25 1.54 1.77 18. I (clarificaiton by repetition) 1.58 1.69 1.92 1.61 2.88 1.26 19. I (asking to speak slower) .63 1.13 .79 .93 .96 1.16 20. I (clarification request) 1.29 1.55 1.50 1.44 2.79 1.74 21. I (asking for repetition) 1.29 1.52 1.58 1.50 2.43 1.65 22. I (feigning understanding) 1.21 1.44 1.42 1.44 .88 1.08 23. I (guessing) 1.57 1.70 1.92 1.61 3.04 1.40 24. I (expressing non-understanding) 1.00 1.41 1.17 1.24 2.13 1.70 25. I (interpretive summary) 1.50 1.47 1.38 1.41 2.67 1.58 26. CFM (self-repair) 3.25 1.39 3.13 1.26 3.00 1.35 27. C (appeal for help) 1.75 1.67 1.50 1.59 2.38 1.74 28. C (message abandonment) 2.54 1.53 2.58 1.38 3.00 1.47 29. C (code switching) .88 1.42 .75 1.15 1.67 1.71 30. C (word coinage) .75 .94 1.13 1.19 1.79 1.47 31. C (foreignising) .46 .78 .79 .93 1.08 1.53 32. I (circumlocution) 2.08 1.32 2.75 1.26 3.42 1.21 33. CFM (as for Item 11) 2.25 1.45 2.67 1.31 3.52 1.12 34. C (long pause). 2.75 1.51 3.08 1.47 2.79 1.38 35. C (restructuring) 2.75 1.26 2.92 1.32 2.58 1.38 36. C (literal translation) 1.63 1.44 1.42 1.25 1.71 1.65 37. C (mumbling) 1.29 1.37 1.46 1.32 1.25 1.19 38. C (omission) 1.29 1.46 1.25 1.15 1.21 1.02 39. C (retrieval) 2.13 1.70 2.04 1.33 1.88 1.30 40. C (approximation) 2.96 1.46 3.04 1.57 3.08 1.25 41. E (other evaluation) .83 1.31 1.29 1.49 1.21 1.44 42. E (self evaluation) 3.04 1.46 3.17 1.43 2.88 1.45 43. E (identifying specific problems) 3.00 1.38 2.92 1.47 2.83 1.55 44. E (aspects to improve) 2.88 1.70 3.21 1.59 2.88 1.45 Note. Significant differences across tasks (Friedman, p< .05) are shaded in grey

391
Appendix P. Descriptive satistics of PSU for low proficiency group
Strategy Picture Story Art Description Information Gap M SD M SD M SD 1. (task familiarity) 3.08 1.64 2.42 1.77 2.71 1.85 2. P (advance organisation) 2.04 1.55 2.29 1.43 1.88 1.45 3. P (organisational planning) 1.96 1.46 2.25 1.26 1.92 1.44 4. (note taking) 0.54 1.02 0.46 1.14 0.38 0.92 5. CFM (using expressions) 2.17 1.34 1.83 1.52 2.29 1.52 6. CFM (avoiding error) 2.96 0.98 2.75 1.19 3.04 1.20 7. CFM (use of fillers) 1.88 1.48 2.42 1.47 1.88 1.42 8. C (risk taking) 2.92 1.06 3.21 1.22 3.13 1.19 9. P (directed attention) 3.67 1.24 3.58 0.88 3.83 0.96 10. P (not taking risks) 3.00 0.98 3.00 1.06 3.13 0.95 11. CFM (gesture) 2.71 1.30 2.83 1.40 2.79 1.47 12. CFM (maintaining conversation) 3.21 0.72 3.29 0.91 3.17 0.76 13. P (planning sentence structure) 2.42 1.06 2.54 1.02 2.67 1.09 14. I (clarification by speaking slower) 2.38 1.13 2.29 1.20 2.25 0.99 15. I (comprehension check) 1.88 1.51 2.00 1.53 2.33 1.43 16. I (clarification by circumlocution) 2.33 1.27 2.22 1.28 2.13 1.19 17. C (clarification by code switch) 1.50 1.35 2.21 1.74 2.29 1.88 18. I (clarificaiton by repetition) 2.21 1.44 2.42 1.28 2.92 1.25 19. I (asking to speak slower) 1.42 1.59 1.08 1.44 1.04 0.91 20. I (clarification request) 1.42 1.35 2.33 1.63 1.96 1.46 21. I (asking for repetition) 1.63 1.53 1.83 1.47 2.25 1.51 22. I (feigning understanding) 1.25 1.39 1.21 1.61 1.00 1.18 23. I (guessing) 1.58 1.38 1.88 1.36 1.79 1.41 24. I (expressing non-understanding) 1.25 1.57 1.67 1.74 1.50 1.29 25. I (interpretive summary) 1.42 1.32 1.67 1.17 2.29 1.49 26. CFM (self-repair) 3.00 1.29 2.88 1.12 3.04 0.91 27. C (appeal for help) 2.71 1.37 2.92 1.64 3.00 1.77 28. C (message abandonment) 3.33 1.40 3.38 1.06 3.58 1.18 29. C (code switching) 2.04 1.65 2.67 1.58 2.83 1.63 30. C (word coinage) 2.17 1.55 2.08 1.67 2.08 1.74 31. C (foreignising) 1.88 1.51 1.38 1.53 2.04 1.63 32. I (circumlocution) 2.08 1.47 2.29 1.57 3.29 1.23 33. CFM (as for Item 11) 2.21 1.47 2.58 1.56 2.50 1.47 34. C (long pause). 2.46 1.44 3.08 1.02 3.00 1.06 35. C (restructuring) 2.83 1.13 3.04 0.86 2.96 1.20 36. C (literal translation) 2.46 1.44 2.38 1.38 2.58 1.32 37. C (mumbling) 1.92 1.56 2.08 1.64 1.71 1.57 38. C (omission) 1.83 1.55 1.83 1.34 2.00 1.53 39. C (retrieval) 2.33 1.24 2.13 1.08 2.17 1.37 40. C (approximation) 2.75 1.36 2.75 1.39 3.25 0.85 41. E (other evaluation) 1.67 1.63 0.96 1.16 1.50 1.32 42. E (self evaluation) 3.63 0.92 3.17 1.27 3.54 0.93 43. E (identifying specific problems) 3.42 1.02 3.17 1.37 3.33 1.20 44. E (aspects to improve) 3.46 1.10 3.08 1.35 3.38 1.21 Note. Significant differences across tasks (Friedman, p< .05) are shaded in grey
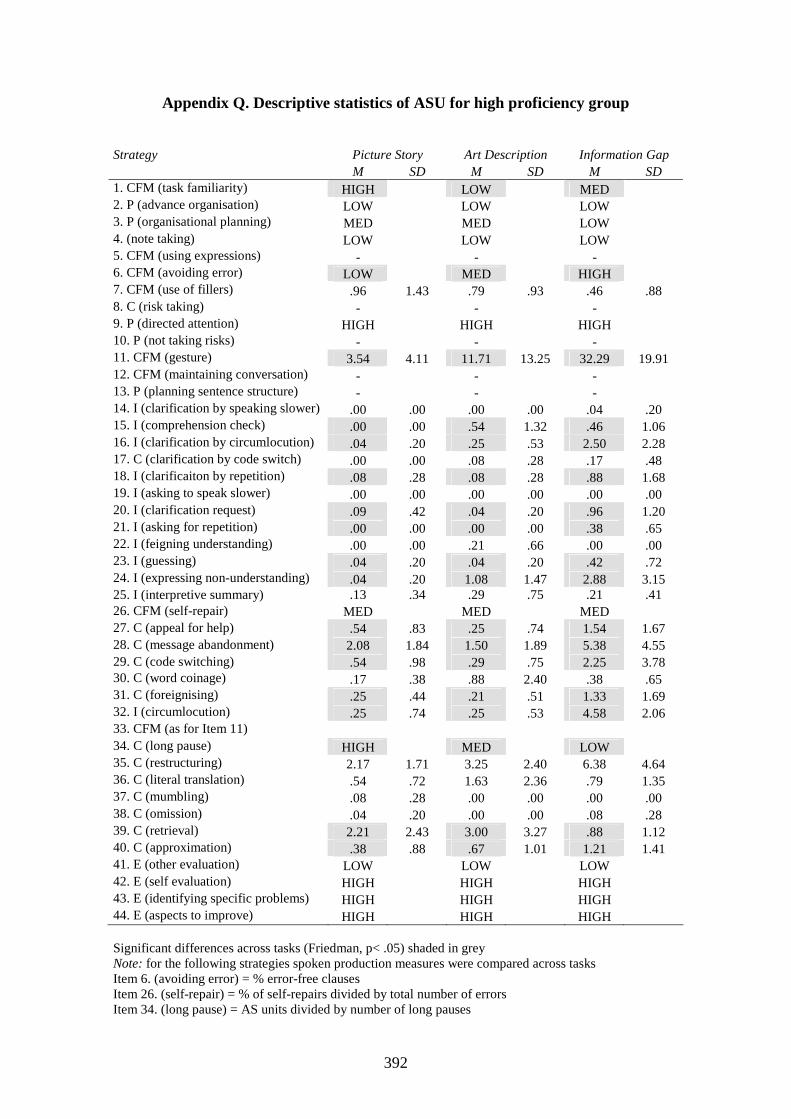
392
Appendix Q. Descriptive statistics of ASU for high proficiency group Strategy Picture Story Art Description Information Gap M SD M SD M SD 1. CFM (task familiarity) HIGH LOW MED 2. P (advance organisation) LOW LOW LOW 3. P (organisational planning) MED MED LOW 4. (note taking) LOW LOW LOW 5. CFM (using expressions) - - - 6. CFM (avoiding error) LOW MED HIGH 7. CFM (use of fillers) .96 1.43 .79 .93 .46 .88 8. C (risk taking) - - - 9. P (directed attention) HIGH HIGH HIGH 10. P (not taking risks) - - - 11. CFM (gesture) 3.54 4.11 11.71 13.25 32.29 19.91 12. CFM (maintaining conversation) - - - 13. P (planning sentence structure) - - - 14. I (clarification by speaking slower) .00 .00 .00 .00 .04 .20 15. I (comprehension check) .00 .00 .54 1.32 .46 1.06 16. I (clarification by circumlocution) .04 .20 .25 .53 2.50 2.28 17. C (clarification by code switch) .00 .00 .08 .28 .17 .48 18. I (clarificaiton by repetition) .08 .28 .08 .28 .88 1.68 19. I (asking to speak slower) .00 .00 .00 .00 .00 .00 20. I (clarification request) .09 .42 .04 .20 .96 1.20 21. I (asking for repetition) .00 .00 .00 .00 .38 .65 22. I (feigning understanding) .00 .00 .21 .66 .00 .00 23. I (guessing) .04 .20 .04 .20 .42 .72 24. I (expressing non-understanding) .04 .20 1.08 1.47 2.88 3.15 25. I (interpretive summary) .13 .34 .29 .75 .21 .41 26. CFM (self-repair) MED MED MED 27. C (appeal for help) .54 .83 .25 .74 1.54 1.67 28. C (message abandonment) 2.08 1.84 1.50 1.89 5.38 4.55 29. C (code switching) .54 .98 .29 .75 2.25 3.78 30. C (word coinage) .17 .38 .88 2.40 .38 .65 31. C (foreignising) .25 .44 .21 .51 1.33 1.69 32. I (circumlocution) .25 .74 .25 .53 4.58 2.06 33. CFM (as for Item 11) 34. C (long pause) HIGH MED LOW 35. C (restructuring) 2.17 1.71 3.25 2.40 6.38 4.64 36. C (literal translation) .54 .72 1.63 2.36 .79 1.35 37. C (mumbling) .08 .28 .00 .00 .00 .00 38. C (omission) .04 .20 .00 .00 .08 .28 39. C (retrieval) 2.21 2.43 3.00 3.27 .88 1.12 40. C (approximation) .38 .88 .67 1.01 1.21 1.41 41. E (other evaluation) LOW LOW LOW 42. E (self evaluation) HIGH HIGH HIGH 43. E (identifying specific problems) HIGH HIGH HIGH 44. E (aspects to improve) HIGH HIGH HIGH Significant differences across tasks (Friedman, p< .05) shaded in grey Note: for the following strategies spoken production measures were compared across tasks Item 6. (avoiding error) = % error-free clauses Item 26. (self-repair) = % of self-repairs divided by total number of errors Item 34. (long pause) = AS units divided by number of long pauses

393
Appendix R. Descriptive statistics of ASU for low proficiency group Strategy Picture Story Art Description Information Gap M SD M SD M SD 1. (task familiarity) HIGH LOW MED 2. P (advance organisation) MED HIGH MED 3. P (organisational planning) LOW LOW LOW 4. (note taking) LOW LOW LOW 5. CFM (using expressions) - - - 6. CFM (avoiding error) LOW MED HIGH 7. CFM (use of fillers) .04 .20 .83 1.52 .21 .51 8. C (risk taking) LOW HIGH MED 9. P (directed attention) HIGH HIGH HIGH 10. P (not taking risks) - - - 11. CFM (gesture) 3.13 3.57 13.21 11.95 17.33 1.12 12. CFM (maintaining conversation) - - - 13. P (planning sentence structure) - - - 14. I (clarification by speaking slower) .00 .00 .08 .28 .04 .20 15. I (comprehension check) .13 .61 .58 1.14 .21 .66 16. I (clarification by circumlocution) .04 .20 .58 .72 1.08 1.56 17. I (clarification by code switch) .04 .20 .38 .77 .63 1.01 18. I (clarificaiton by repetition) .04 .20 .42 .88 1.08 1.28 19. I (asking to speak slower) .00 .00 .00 .00 .00 .00 20. I (clarification request) .13 .45 .42 .65 .63 1.13 21. I (asking for repetition) .00 .00 .00 .00 .17 .48 22. I (feigning understanding) .00 .00 .00 .00 .04 .20 23. I (guessing) .08 .28 .29 .46 .42 .78 24. I (expressing non-understanding) .42 1.18 2.29 3.11 2.33 2.93 25. I (interpretive summary) .00 .00 .00 .00 .04 .20 26. CFM (self-repair) HIGH HIGH LOW 27. C (appeal for help) 1.42 1.82 2.58 2.78 1.91 2.00 28. C (message abandonment) 2.83 2.44 1.92 1.44 3.00 2.40 29. C (code switching) 3.00 3.45 3.50 3.60 5.04 5.53 30. C (word coinage) .42 .83 1.21 2.21 .21 .41 31. C (foreignising) .29 .46 .33 .64 1.38 1.79 32. I (circumlocution) .29 1.04 .38 .88 2.71 3.26 33. CFM (as for Item 11) 34. C (long pause) HIGH LOW 35. C (restructuring) 1.21 1.35 2.38 2.24 3.58 2.67 36. C (literal translation) .83 1.01 2.29 3.06 .58 1.25 37. C (mumbling) .04 .20 .00 .00 .00 .00 38. C (omission) .00 .00 .04 .20 .04 .20 39. C (retrieval) 2.71 1.97 3.67 2.60 .79 1.14 40. C (approximation) .17 .56 1.46 1.59 1.08 1.18 41. E (other evaluation) LOW LOW LOW 42. E (self evaluation) HIGH HIGH HIGH 43. E (identifying specific problems) HIGH HIGH HIGH 44. E (aspects to improve) HIGH HIGH HIGH Significant differences across tasks (Friedman, p< .05) shaded in grey Note: for the following strategies spoken production measures were compared across tasks: Item 6. (avoiding error) = % error-free clauses Item 26. (self-repair) = % of self-repairs divided by total number of errors Item 34. (long pause) = AS units divided by number of long pauses

394
Appendix S. Descriptive statistics of spoken production measures for whole sample
Picture Story Art Description Information Gap M SD M SD M SD Accuracy error free clauses 56,43 20,31 60,75 17,67 67,83 17,22 Complexity lexical complexity 39,56 13,75 45,57 15,20 34,88 9,91 structural complexity 2,15 0,79 1,63 0,61 1,23 0,14 Fluency long pauses 5,83 10,48 16,00 23,55 22,69 30,16 repetition 3,75 4,06 3,71 3,80 8,30 9,37 reformulation 7,35 6,25 7,68 6,00 14,70 11,66 Self-repair error repair 11,76 12,00 7,95 7,27 7,58 10,61

395
Appendix T. Mann-Whitney tests for ASU differences between high and low proficiency groups
Strategy Item Picture Story Art Description Information Gap z Asymp sig.
(2-tailed) z Asymp sig.
(2-tailed) z Asymp sig.
(2-tailed) 7 CFM (using fillers) -3.78 .00* 11 CFM (gesture) -3.04 .00* 16 I (clarification by paraphrase) -2.54 .01* 17 C (clarification by code switch) -2.01 .04* 20 I (clarification request) -2.58 .01* 23 I (guessing) -2.30 .02* 25 I (interpretive summary) -2.06 .04* 26 CFM (self-repair) -3.42 .00* 27 C (asking for help) -1.95 .05* -4.70 .00* 29 C (code switching) -3.19 .00* -5.29 .00* -2.64 .01* 32 I (circumlocution) -2.79 .01* 35 C (restructuring) -2.06 .04* Key: I – Interactional, C- Compensation, CFM – Conversation-Flow Management, P- Planning and E- Evaluating.