strategies for detecting and identifying biological
TRANSCRIPT

METHODOLOGY ARTICLE Open Access
Strategies for detecting and identifyingbiological signals amidst the variationcommonly found in RNA sequencing dataWilliam W. Wilfinger1* , Robert Miller2, Hamid R. Eghbalnia3,4, Karol Mackey1 and Piotr Chomczynski1
Abstract
Background: RNA sequencing analysis focus on the detection of differential gene expression changes that meet atwo-fold minimum change between groups. The variability present in RNA sequencing data may obscure thedetection of valuable information when specific genes within certain samples display large expression variability.This paper develops methods that apply variance and dispersion estimates to intra-group data to identify geneswith expression values that diverge from the group envelope. STRING database analysis of the identified genescharacterize gene affiliations involved in physiological regulatory networks that contribute to biological variability.Individuals with divergent gene groupings within network pathways can thereby be identified and judiciouslyevaluated prior to standard differential analysis.
Results: A three-step process is presented for evaluating biological variability within a group in RNA sequencingdata in which gene counts were: (1) scaled to minimize heteroscedasticity; (2) rank-ordered to detect potentiallydivergent “trendlines” for every gene in the data set; and (3) tested with the STRING database to identify statisticallysignificant pathway associations among the genes displaying marked trendline variability and dispersion. Thisapproach was used to identify the “trendline” profile of every gene in three test data sets. Control data from an in-house data set and two archived samples revealed that 65–70% of the sequenced genes displayed trendlines withminimal variation and dispersion across the sample group after rank-ordering the samples; this is referred to as alinear trendline. Smaller subsets of genes within the three data sets displayed markedly skewed trendlines, widedispersion and variability. STRING database analysis of these genes identified interferon-mediated responsenetworks in 11–20% of the individuals sampled at the time of blood collection. For example, in the three controldata sets, 14 to 26 genes in the defense response to virus pathway were identified in 7 individuals at falsediscovery rates ≤1.92 E-15.
Conclusions: This analysis provides a rationale for identifying and characterizing notable gene expression variabilitywithin a study group. The identification of highly variable genes and their network associations within specificindividuals empowers more judicious inspection of the sample group prior to differential gene expression analysis.
Keywords: Scaling, Rank-order, Trendline, Biological variability, Biological pathway analysis, RNA sequencing, STRING-db, Minimum value adjustment, White blood cells
© The Author(s). 2021 Open Access This article is licensed under a Creative Commons Attribution 4.0 International License,which permits use, sharing, adaptation, distribution and reproduction in any medium or format, as long as you giveappropriate credit to the original author(s) and the source, provide a link to the Creative Commons licence, and indicate ifchanges were made. The images or other third party material in this article are included in the article's Creative Commonslicence, unless indicated otherwise in a credit line to the material. If material is not included in the article's Creative Commonslicence and your intended use is not permitted by statutory regulation or exceeds the permitted use, you will need to obtainpermission directly from the copyright holder. To view a copy of this licence, visit http://creativecommons.org/licenses/by/4.0/.The Creative Commons Public Domain Dedication waiver (http://creativecommons.org/publicdomain/zero/1.0/) applies to thedata made available in this article, unless otherwise stated in a credit line to the data.
* Correspondence: [email protected] Research Center, Inc., Cincinnati, USAFull list of author information is available at the end of the article
Wilfinger et al. BMC Genomics (2021) 22:322 https://doi.org/10.1186/s12864-021-07563-9

BackgroundA major goal of RNA-seq studies is to improve and extendour understanding of gene expression responses amidst thechallenging variability commonly found in sequencing data.Although numerous factors are known to affect sequencingresults such as the reference genome, the read processingpipeline, internal references, read fragment size, and the se-lected data analysis algorithms, among others [1], thus far ithas been difficult to discern how these sequencing proce-dures combined with intrinsic biological variability mightimpact differential analysis. For example, many softwarepackages commonly employ different normalization proce-dures that are designed to mitigate read count variability;however, these strategies are known to yield dissimilar dif-ferential expression analysis results [2–6]. Biological vari-ation is considered to be larger than technical variation [3,6–8], but the biological implications associated with readcount normalization are not well-understood. Previousstudies have suggested that increasing the sequencing depth(read coverage) and/or the number of biological replicatesgenerally improves estimates of biological variation [6–8].Conclusions relating to biological variation are usually
based on Analysis of Variance (ANOVA) Sums ofSquares estimations. Although increasing the level ofreplication may increase the Between Sums of Squaredifference and provide a more definitive statisticalconclusion about an identified biological response (e.g.larger F-value), an increase in the Sums of Squares doesnot identify the factor(s) contributing to the variability.More broadly untangling the impact of variability oneach step of the RNA-seq pipeline is difficult. One mustidentify specific sources of biological variability in thedata set and consider how the normalization processimpacts the overall results. This problem becomesincreasingly difficult to resolve in samples in which cellnumber and cell type fluctuate significantly. Identifyingand quantifying significant variability within RNA se-quencing data sets would provide information thatwould be very useful for evaluating the robustness ofcomputational steps, for example, devising and evaluat-ing methodologies for determining how normalizationprotocols impact technical and biological variation.Van den Berg et al. [9] have employed various scaling
strategies to their metabolomics data and examined theirusefulness in categorizing the relative importance of vari-ous metabolites identified in these studies. They deter-mined that scaling normalizations performed better thanother strategies because they removed the dependence ofthe metabolites initial ranking based on the magnitude ofa quantitative response. The scaled metabolites were eval-uated in relation to their sample-to-sample response rangewhich also reduced the heteroscedasticity (mean and vari-ance dispersion) within the data set. Since these data setswere qualitatively similar to the data obtained in RNA
sequencing studies, we applied an approach similar toscaling normalization to evaluate RNA sequencing results.Blood from 35 healthy adults was extracted and proc-
essed for RNA sequencing [10, 11]. The read counts werescaled to establish a uniform starting point across all genesand rank-ordered to characterize gene expression in thesample group as a “trendline” pattern for each gene.Excel-based tools were employed to analyze and cataloguethe resulting gene trendlines [12]. Utilizing trendline ana-lysis, we determined that 65–70% of the genes in our con-trol data set follow a linear relationship with minimalvariance when the genes were scaled and rank-ordered.However, other genes that did not follow this linear profiledisplayed markedly higher levels of dispersion and vari-ability that diverged significantly from the genes in a nor-mally distributed control sample. We identified standardstatistical measures that characterize and catalogue thesedifferent trendlines and utilized this information to iden-tify factors that may contribute to this heightened bio-logical variability. When genes displaying the mostvariable and dispersed trendline expression patterns wereevaluated with the STRING database [13–15], distinct bio-logical regulatory pathways were identified in some indi-viduals, thereby providing an explanation for some of thevariability in the sample group.We also demonstrate that the scaling normalization
strategy employed in our study reduced gene expressionheteroscedasticity within three different control data setsas previously demonstrated by van den Berg et al. [9].Scaling adjustments in conjunction with rank-order ana-lysis clarify and extend the analysis of inter-individualvariations relating to differential gene expression previ-ously described by Whitney et al. [16], Savelyeva et al.[17], Preininger et al. [18] and Jaffe et al. [19] to within-the-group analysis. STRING-db analysis of genesdisplaying the most variable and dispersed trendlines re-vealed that 11–20% of the individuals in our controlsample and two archived control data sets, identified aprominent network of interferon-stimulated genes. Theinterferon-induced genes identified in this analysis play apivotal regulatory role in three Gene Ontology pathways[20–22] that include response to virus, defense responseto virus and the type I-interferon signaling/regulatoryresponse pathways. The evaluation of gene trendline re-sponses within a group and across individuals identifiessources of previously unrecognized biological variabilitythat now can be detected and appraised. This method ofanalysis can be applied to archived RNA sequencing datato detect previously unrecognized sources of biologicalvariability that may have impacted differential analysisand physiological conclusions. The methods outlined inthis report will be useful in identifying within groupvariability commonly found in RNA sequencing datasets and when employed in conjunction with established
Wilfinger et al. BMC Genomics (2021) 22:322 Page 2 of 19

data processing pipelines, they are likely to improve therobustness of these studies.
ResultsRank-ordering RNA sequencing counts graphicallyportrays the impact of sample dispersion on genetrendline profilesDeSeq-normalized TPM (Transcripts Per kilobase Million)gene counts for 35 individuals were processed through our
pipeline [23] and the count data were rank-ordered to con-struct a unique trendline for each gene. Figure 1a depicts abox plot of data for five example genes displaying increas-ing variance where the box boundaries identify gene countsin the 2ed and 3rd quartiles (25th–75th percentile). Thebreadth of the box illustrates the degree of countdispersion across the 35 data points for each gene. Themean for the INTS6 gene is 10.52 ± 1.88 (1 SD) countsand plotting the counts for the 35 samples in ascending
Fig. 1 Rank-ordering RNA sequencing counts identifies individuals displaying gene count divergence. a Box plots of sequencing counts for fivegenes INTS6, AKAP13, KCNJ2, IFIT3 and EIF1AY depicting increasing levels of sample dispersion with computed coefficient of variation valuesranging from 17.9 to 171.2% of the unadjusted TPM gene counts (Mean ± 1SD). Box boundaries exclude individuals in the first and fourth quartilefor each gene. b Rank-ordering the unadjusted counts of 35 individuals delineates different gene trendline patterns for the five genes. Gene rank-order position is established in relation to the gene expression level for an individual gene within the sample group, therefore the ranking orderdoes not identify the same individual at each position along the various gene trendlines since the relative level of gene expression for anindividual changes across genes. c Minimum Value Adjusted (MVA) gene counts significantly improve count heteroscedasticity (5-fold scalereduction) without altering the incremental trendline profiles within the sample group. Rank-order analysis extends the descriptive sampleinformation available from a box plot by: defining the number of data points within the sample that deviate from the count level in the 2nd and3rd quartiles; identifying their inflection point(s) and providing an estimate of the relative change in gene expression based on the computedslope ratio change. Black vertical lines identify quartiles 1, 2–3 and 4. See Additional file 1 for a more detailed discussion
Wilfinger et al. BMC Genomics (2021) 22:322 Page 3 of 19

rank-order created a linear INTS6 trendline as illustrated inFig. 1b. A coefficient of variation (CV) of 17.9% and the co-efficient of determination (R2) of 0.9498 further supportsthe linear profile of the INTS6 trendline. This trendlineprofile was identical to the pattern obtained when numberswere randomly selected from a normally distributed popu-lation within a defined range of values and rank-ordered(see Additional file 1 for a detailed discussion). Therefore,we conclude that genes displaying a linear trendline profileacross a defined range of expression values represent a“normally distributed control envelope” grouping of expres-sion values within the identified samplying window.The mean counts for genes AKAP13 and KCNJ2 were
18.26 ± 4.47 and 12.88 ± 3.82, respectively (Fig. 1a).While these genes showed slightly more dispersionacross the 35 samples (Panels a and b, with CV valuesof 25.26 and 29.62% and R2 values of 0.8499 and 0.8418,respectively), rank-ordering the counts revealed morecomplex trendlines where the slope of the line for samplesin quartiles 1 and/or 4 deviated from the slope of the linefor samples in quartiles 2 plus 3 (Fig. 1, panel b).The last two example genes, IFIT3 and EIF1AY, displayed
much greater deviation from the linear trendline model(Fig. 1a; 21.96 ± 25.52 and 26.88 ± 46.03, respectively). Therank-ordered IFIT3 trendline depicted in Fig. 1b, identifiedindividuals in quartile 4 with markedly different expressionlevels when compared to individuals in quartiles 1–3. Thefinal example gene, EIF1AY, is located on the Y chromo-some and is expressed only in males. The gene trendline inFig. 1b, shows an expected bimodal pattern with samples24–35 comprising the eleven males in the sample group.The R2 values for these two genes were 0.429 and 0.5923,respectively, which denotes a significant deviation from lin-earity (CV 116.18 and 171.24%, respectively).These five example genes exhibit increasing degrees of
gene expression variability among the individuals inquartiles 1 and 4. The observed trendline profiles illus-trate how rank-ordering of RNA sequencing counts canidentify marked changes in gene expression variabilityamong some of the 8746 protein coding genes identifiedin our study. Based on linear regression analysis, 65–70% of the 8000 to 10,000 evaluated genes (3 data sets)displayed trendlines where the incremental difference ingene expression across the group followed a linear pat-tern resulting in R2 values that were ≥ 0.9 (e.g. INTS6,Fig. 1, panel b). Under ideal conditions with minimalwithin sample variation, one might expect all of the se-quenced genes in the control sample to follow this linearpattern but this is not the case. Our subsequent analysisattempts to provide some explanation for the heightenedvariability noted for genes such as IFIT3 in Fig. 1.Figure 1c depicts the Minimum Value Adjusted
(MVA) TPM counts which substantially reduce therange of gene expression (e.g. > 5-fold decrease in scale);
however, the unique incremental sample-to-sample geneexpression relationship of the 35 rank-ordered sampleswas maintained irrespective of the trendline profile(Fig. 1, panels b vs. c). When the quartile slopes forindividuals in quartiles 1 and/or 4 deviates from those inquartiles 2 plus 3, a “tailing” profile was established asillustrated by the genes depicted in panels b and c ofFig. 1. Due to random chance, it would be difficult andunlikely to find several hundred genes displaying 4–8“outliers” in a common subset of 35 individuals. Further-more, we will now demonstrate how these “tailing response”profiles, as illustrated for the IFIT3 gene, can be used toidentify other genes sharing comparable trendline profiles,and thereby identify sources of biological variation amongselected individuals in a sample group.
Statistical characterization of trendline “tailing responses”identify gene pathway regulatory groupings thatcontribute to biological variabilityAfter rank-ordering unadjusted and MVA gene countsto create gene trendlines, standard Excel functions wereused to perform a variety of statistical calculations [12].Mean and median calculations measure aspects ofdispersion and skewness, standard deviation, range, andslope measure dispersion, and skewness measures theunevenness of dispersion. Ranking these statistical pa-rameters characterizes the degree to which this disper-sion impacts gene expression levels for various genes.Calculations were computed for each of the 8746 genesand the results were ranked in descending order(Additional file 2, sheet 6). The 300 genes displaying thelargest numerical values for each calculation were sub-jected to STRING-db analysis and the identified geneswere surveyed for pathway affiliations (Additional file 2,sheet 7). The results were summarized and presented inAdditional file 4A and B.The unadjusted and MVA gene counts identified Bio-
logical Gene Ontology (GO) pathways associated withcotranslational protein targeting to membrane (section4A) or immune system process pathways (section 4B)when the largest means representing the various statis-tical calculations were evaluated for the two groups. Theunadjusted mean counts identified gene pathway group-ings having the largest relative gene expression levels.When the gene counts are scaled by MVA to reflect thesample-to-sample incremental changes of each gene, theresulting trendline means identified immune pathwayclassifications rather than the highly expressed genes as-sociated with protein synthesis (Additional file 4, panelA vs. B). The identification of markedly different path-way affiliations following MVA is consistent with thefindings reported by van den Berg et.al [9].. When theunadjusted gene counts were used for these calculations,parameters that measure the relative magnitude of the
Wilfinger et al. BMC Genomics (2021) 22:322 Page 4 of 19

count, such as mean, standard deviation, maximum, me-dian, quartile 1, quartile 3, slope etc. all select highlyexpressed genes in Biological GO pathways associatedwith protein synthesis and targeting proteins to differentareas of the cell (Panel 4A vs 4B). However, when statis-tical parameters such as range/median, skewness andkurtosis were used that characterize the “tailedness” andthe unevenness of sample dispersion, identical pathwayresults were obtained with either unadjusted or MVAcounts (Panel 4A vs 4B). Therefore, the type of measure-ment used for gene trendline characterization prior toSTRING-db analysis impacts pathway selection if theheteroscedastic nature of the raw counts was not ad-dressed prior to pathway analysis.Other statistical calculations that measure sample
variability and trendline asymmetry such as coefficient ofvariation, maximum/minimum ratio, range/median, skew-ness, kurtosis, range/quartile 3, and R2 all identifiedimmune-related GO pathways with FDR’s ranging fromE-6 to E-32 (Panel 4B). The 300 genes displaying thelargest range/Q3 (FDR = 6.22 E-32), range/median (FDR =5.33 E-26) and kurtosis values (FDR = 6.85 E-27) detectedthe greatest trendline variability and had the smallest R2
values ranging from 0.2253 to 0.8754. These three statis-tical calculations selected trendline “tailing” patterns withthe greatest fidelity that were similar to the profile previ-ously depicted by the IFIT3 gene in Fig. 1c.The statistical parameters depicted in file 4 illustrate
that some measures identified a larger number of gene as-sociations with lower False Discovery Rates (FDR) basedon the observed “tailing” patterns. Range/Q3, range/me-dian and kurtosis measures detected 122, 113 and 105 im-mune system process (GO:0002376) pathway genes,respectively. Although all three parameters demonstratedproficiency in selecting genes with “tailing” profiles, only 8of the top 10 pathways were identical among the three cal-culations and 7–14% fewer total genes were identifiedwhen either kurtosis or range/median measures wereemployed. Although a variety of calculations can be usedfor identifying gene pathway affiliations in addition torange/Q3, range/median and kurtosis, the other parame-ters selected fewer genes, different rank-orders, and al-ternative pathways when these parameters wereemployed to identify gene affiliations based on genetrendline tailing response profiles (Additional file 4).Changes in the order of the top 10 identified pathwayswere impacted by the number of known genes in a des-ignated pathway and the selected measure used toidentify the pathway-related genes in the sample. Forexample, the identification of 50 genes in a pathway of200 genes provides a lower FDR than the detection of50 genes in a pathway containing 2000 genes.The identification of the top 300 computed trendline
values, as outlined above, was also used to evaluate gene
groupings that were selected using various combinationsof sample size (e.g. 250–450 genes) and statistical par-ameter groupings (combine 1–3 measures for pathwayselection). STRING-db analysis of 250–300 genes basedon trendline kurtosis estimates selected identical path-ways (data not shown). Samples of 300 genes surveyedat various rank position locations, ranging from 1 to6000, selected different GO pathways with lower FDR’sfollowing STRING-db analysis. Sampling genes at lowergene rankings identified large pathways involved in cel-lular metabolism and function. These pathways involvethousands of genes and due to the size of the pathwaysmuch lower FDR’s were observed (e.g. FDR > E-15).The application of the MVA scaling reduced heterosce-
dasticity as previously noted [9] while preserving importantsample-to-sample incremental changes that contributed tothe rank-ordered trendline profiles. In our sample of 35individuals, MVA reduced Total Sums of square by 960-fold and Within Group Sums of Square by 303-fold (seeAdditional file 1). The various statistical parameters testedin our studies revealed that range/Q3, range/median andkurtosis were the most sensitive and robust parameters foridentifying “tailedness” in unadjusted as well as MVAapplications (Additional file 4B).
Correlation analysis identifies genes displaying similartrendline profiles and regulatory pathway associationsThe previous analysis demonstrated that ranking certainstatistical measures in a sample of 35 individuals identi-fied genes with “tailed” trendlines and affiliated pathwaygroupings. To further evaluate this result, we employedcorrelation analysis to identity genes that might displaysimilar associations to the trendline profiles previouslynoted for the IFIT3 gene (Fig. 1b and c). We used Excelto perform Pearson correlation analysis on the MVAcounts of 8746 genes in our study [12]. To limit the sizeof the correlation matrix (> 78 × 106 values) to a morediscernable number of terms, estimated values for thehighest correlation and anticorrelation range was usedto provide a count of the number of genes displayingcorrelation values > or < input values and the number ofgenes assigned r values ≥ or ≤ the input terms were iden-tified [12]. After the initial analysis, the input correlationvalues are adjusted up or down to limit the number ofgenes assigned to a smaller correlation subset matrix.Using this rationale, we identified a subset of 500 geneswith correlation values ≥0.95725 or ≤ − 0.524674. Withinthis group of genes, the IFIT3 gene was positively corre-lated with the largest cluster of genes including IFIT1and 12 other genes. STRING-db analysis indicated thatthese 14 genes were associated with 24 GO pathwayscontaining multiple regulatory protein associations asdepicted in Fig. 2. The top 3 GO pathways with FDR ≤E-15 were GO:0009615, response to virus, 5.33 E-21;
Wilfinger et al. BMC Genomics (2021) 22:322 Page 5 of 19

GO:0051607, defense response to virus, FDR 1.13 E-20and GO:0060337, type 1 interferon signaling pathway,2.64 E-17. The correlation results were identical wheneither the original counts or MVA counts were evaluatedwith an equivalent number of genes (i.e. 500). STRING-db analysis of the most highly correlated genes withinthe entire data set identified gene pathways that wereactivated in response to virus exposure.Based on the STRING-bd results presented in Fig. 2, 7
genes displaying two or more pathway affiliations were se-lected and their expression profiles were plotted in the 35unranked control samples. The gene expression profiles forour control group and two additional archived control datasets are presented in Fig. 3. The average baseline expressionlevel for most of these genes is ~ 5 counts, so gene expres-sion levels of 30–110 counts represent markedly elevatedlevels of gene expression in certain individuals. Interferoninduced IFI44L and ISG15 genes are markedly elevated inindividuals 6, 9 and 12 in panel a, sample 7 in panel b andsamples 3 and 4 in panel c, and the coordinated response issuggestive of individuals responding to the presence of avirus. It is important to emphasize that the elevated level ofgene expression of these 7 genes is confined to specific indi-viduals in the sample group and the non-random nature ofthe response is unlikely due to methodological variability.In addition to the 14 positively correlated genes,
there were also several gene clusters in which more
than 30 genes were identified with negative correla-tions (r ≤ −.52465; TMEM38B, 43 genes; MMP9, 39genes and CLEC4D,36 genes). The list of 43 genesassociated with TMEM38B were evaluated with theSTRING-db to determine if any of these genes sharedpathway relationships and the results are depicted inFig. 4. These 44 genes form associations with 145different Biological GO pathways with PPI enrichment< 1.0 E-16 and they appear to be primarily involvedin mediating immune responses (GO:0006955).
Localization of highly correlated gene groupings inspecific individuals is used to construct a scoring functionThe highly correlated cluster of genes identified in Fig. 2,and their coordinated expression responses within cer-tain individuals as depicted in Fig. 3, suggested a secondavenue for analysis. The rationale was based on thepremise that the coordinated gene activity within abiological pathway would involve multiple genes and thisshould result in a higher rank-order position for thegenes in the activated pathway as well as an increase inthe relative number of positionally ranked genes repre-senting that pathway. To explore this possibility, a “Scor-ing Function” depicting the gene rank position listingwas determined for every gene and this analysis is de-scribed in Additional file 2, sheet 7 and file 6. Table 1provides an abbreviated summary of the results. Based
Fig. 2 Listing of highly correlated genes identified by correlation analysis and their known integrated network affiliations within the immunesystem. STRING database analysis of the 13 genes found to be highly correlated (r ≥ 0.95725) with the IFIT3 gene. This regulatory cluster isassociated with 24 GO pathways that are primarily involved in response to virus (red, GO:0009615), defense response to virus (blue, GO:0051607)and type 1 interferon signaling (green, GO:0060337). Eight of the highlighted genes (red, blue and green) form statistically significant groupingswith False Discovery Rates ranging from E− 17 to E− 21 that may collectively integrate the activity of all three pathways
Wilfinger et al. BMC Genomics (2021) 22:322 Page 6 of 19
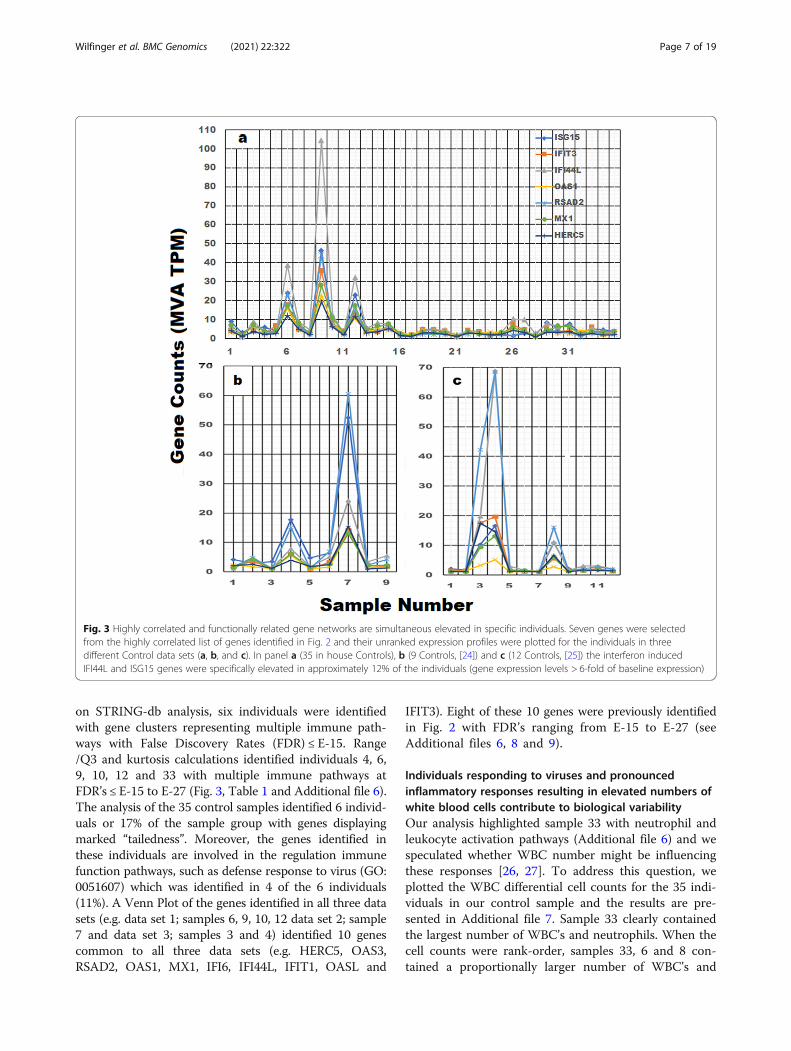
on STRING-db analysis, six individuals were identifiedwith gene clusters representing multiple immune path-ways with False Discovery Rates (FDR) ≤ E-15. Range/Q3 and kurtosis calculations identified individuals 4, 6,9, 10, 12 and 33 with multiple immune pathways atFDR’s ≤ E-15 to E-27 (Fig. 3, Table 1 and Additional file 6).The analysis of the 35 control samples identified 6 individ-uals or 17% of the sample group with genes displayingmarked “tailedness”. Moreover, the genes identified inthese individuals are involved in the regulation immunefunction pathways, such as defense response to virus (GO:0051607) which was identified in 4 of the 6 individuals(11%). A Venn Plot of the genes identified in all three datasets (e.g. data set 1; samples 6, 9, 10, 12 data set 2; sample7 and data set 3; samples 3 and 4) identified 10 genescommon to all three data sets (e.g. HERC5, OAS3,RSAD2, OAS1, MX1, IFI6, IFI44L, IFIT1, OASL and
IFIT3). Eight of these 10 genes were previously identifiedin Fig. 2 with FDR’s ranging from E-15 to E-27 (seeAdditional files 6, 8 and 9).
Individuals responding to viruses and pronouncedinflammatory responses resulting in elevated numbers ofwhite blood cells contribute to biological variabilityOur analysis highlighted sample 33 with neutrophil andleukocyte activation pathways (Additional file 6) and wespeculated whether WBC number might be influencingthese responses [26, 27]. To address this question, weplotted the WBC differential cell counts for the 35 indi-viduals in our control sample and the results are pre-sented in Additional file 7. Sample 33 clearly containedthe largest number of WBC’s and neutrophils. When thecell counts were rank-order, samples 33, 6 and 8 con-tained a proportionally larger number of WBC’s and
Fig. 3 Highly correlated and functionally related gene networks are simultaneous elevated in specific individuals. Seven genes were selectedfrom the highly correlated list of genes identified in Fig. 2 and their unranked expression profiles were plotted for the individuals in threedifferent Control data sets (a, b, and c). In panel a (35 in house Controls), b (9 Controls, [24]) and c (12 Controls, [25]) the interferon inducedIFI44L and ISG15 genes were specifically elevated in approximately 12% of the individuals (gene expression levels > 6-fold of baseline expression)
Wilfinger et al. BMC Genomics (2021) 22:322 Page 7 of 19

Fig. 4 STRING database analysis of 44 genes found to be negatively correlated (r ≤ − 0.52465) with the TMEM38B gene. This regulatory cluster isassociated with 145 GO pathways that are primarily involved with immune responses such as leukocyte activation (blue, GO:0045321), neutrophildegranulation (red, GO:0043312) and immune system process (green, GO:0002376)
Wilfinger et al. BMC Genomics (2021) 22:322 Page 8 of 19

neutrophils than the other 32 samples and the removalof those three individuals markedly improved the WBC vari-ation explained by the regression line (WBC R2 improvesfrom 0.8492 to 0.9824). This analysis demonstrates that adisproportionate number of WBC’s can also impact genepathway analysis when the cell numbers are elevated above10 million WBC’s / ml of blood. The survey of gene tren-dlines such as IFIT3 based on range/Q3, range/median andkurtosis (Table 1) provided a strategy to identify pathways inwhich groups of genes appeared to display coordinated ex-pression patterns. The highly correlated group of genes
identified in Fig. 2 form multiple protein interactions involv-ing an assortment of different biological pathways as previ-ously illustrated Additional files 4 and 6. The genes identifiedin Fig. 2 represent virus-induced interferon-stimulated genes[27–30]. When the individuals identified as having coordi-nated immune responses were removed from the analysis(e.g. individuals 6, 9, 10, 12 and 33, Additional file 6 andTable 1) and the correlations were re-evaluated in theremaining 30 samples, the genes previously correlatedwith IFIT1 (e.g. r ≥ 0.9579) were reduced from 14 genes to0. Furthermore, the R2 values for the genes identified in
Table 1 Summary of Sample Positional Rank Assignments
Protein coding gene counts in three data sets were Minimum Value Adjusted (MVA) and rank ordered. The individual with the highest read count for any givengene was assigned a positional rank of 1, the second highest count was assigned a rank of 2, etc. until all of the samples received a positional gene assignmentranking (see Additional file 6). A scoring function was employed to identified a minimum of 1000 positionally ranked genes for each individual. The positionallyranked genes were evaluated to determine if any genes with range/median, range/Q3, kurtosis and Q4/Q(2 + 3) slope values were within a group of the top 300genes previously identified for each of the selection parameters. For example, in a list of 1000 positionally ranked genes, only genes with a range/median value ≥to the computed value of the 300th gene would be identified. The genes identified with these four parameters were subsequently evaluated with the STRING dbto determine if they were associated with known biological pathways. The black font represents the number of times the designated pathway was ranked in thetop 10 pathways in the 35 samples. The number highlighted in red font represents the number of individuals with a False Discover Rate (FDR) < E-15. Samples 4,6, 9, 10, 12 and 33 all contained one or more pathways with FDR < E-15 to E-42 (Additional files 6, 8, 9). Range/Q3 and range/median calculations were the mostrobust parameters and identifying the largest number of pathway genes with the smallest FDR. Immune function pathways relating to defense response to virus,response to virus and type I interferon signaling pathways were highlighted in individuals 6, 9,10 and 12 with FDR’s from E-15 to E-26 when range/Q3, range/median or kurtosis values were used for gene identification and STRING-db analysis
Wilfinger et al. BMC Genomics (2021) 22:322 Page 9 of 19

Fig. 2 ranged from 0.295 to 0.426 in the sample of 35 indi-viduals were significantly improved to 0.931 to 0.965 afterremoving the 5 highlighted individuals from the analysis.
Application of positional rank analysis to survey trendlinepatterns in control archived RNA-Seq data setsWe retrieved archived Control peripheral blood RNAsequencing files from the GEO database [24, 25, 31](GSE109313 and GSE112057), processed the raw countsthrough our pipeline and evaluated genes with mean TPMcounts ≥0.5 in the two control data sets (Additional file 11).The resulting lists of genes were filtered to remove non-protein coding genes and the most robust trendline selec-tion measures including range/median, range/Q3, kurtosisand Q4/(Q2 +Q3) slope values were used to identifygenes with the highest positional rank assignments as pre-viously outlined (Additional file 5). A detailed summary ofthe results is presented in (Additional files 6, 8 and 9).Since we previously identified individuals in our 35-
member Control group that were likely responding tovirus-mediated immune challenges (Table 1 and file 6), weevaluated two additional archived Control data sets to de-termine if the smaller sample groups also contained similarindividuals. Employing the 4 parameters used in our previ-ous study (Table 1), a list of positionally ranked genes wasassembled with each of the screening parameters. The as-sembled positionally ranked gene lists were evaluated withthe STRING-db [13] to determine if any Biological GOpathways were specifically highlighted in these individuals.STRING-db analysis of the positionally ranked genes iden-tified one individual in Control group b (sample 7, Fig. 3),and 2 individuals in Control Group c (samples 3 and 4,Fig. 3) in which the defense response to virus pathway wassignificantly elevated (see Table 1 and Additional files 8and 9 for a detailed summary of the pathway results).The combined data summarized in Table 1, files 6, 8
and 9 and Fig. 3 demonstrate that positional rank ana-lysis identified from 11 to 17% of the individuals in thethree control data sets with gene associations represent-ing virus activated immune pathways. We selected arelatively high benchmark with pathway FDR’s < E-15;but if PPI values < 1.0 E-16 were used for evaluating thegene listings, ~ 20% of the surveyed samples containedindividuals in which viral induced immune pathwayswere identified. The individuals identified as undergo-ing viral-induced immune responses significantly im-pact gene expression levels in the pathways that wereidentified by our analysis, thereby increasing the bio-logical variability of the control sample groups. Inaddition, the noted increases in the number of WBC’sin some of these individuals were also identified asanother source of biological variability in our data set(Additional file 7).
Can the detected biological responses be explained bytechnical variability?It is always important to consider how the application ofan analytical strategy may impact the results and conclu-sions of any study. In three separate RNA-seq studies,we noted that 65–70% of the genes follow lineartrendline profiles with R2 values ≥0.9. We selected 4genes with unadjusted mean counts ranging from 9 to3836 to determine if consistent trendline linearity ex-tended across a broad range of gene expression values.The trendline expression profiles for these genes and 4ERCC standards with similar expression levels are pre-sented in Fig. 5. Similar linear trendlines were observedfor both the selected genes and the ERCC standards withthe exception of sample 35, representing sample 7,(rank-ordered samples are not listed in numeric se-quence, 1–35), in which the ERCC values were consist-ently larger. The marked deviation from the computedtrendline observed in ERCC sample 35 is not reflected inthe 4 selected genes in the left panel of Fig. 5, whichsuggests a potential spike-in issue with little or no tech-nical impact on gene counts.To further evaluate technical and biological variability,
we normalized the CBX3, IFIT3, IFI44L and DEFA3gene expression in relation to the stable ATG3 gene (seeAdditional file 10). This normalization was performed bycalculating gene expression ratios for each of the 35samples and evaluating the degree of count dispersionacross samples when the counts are expressed in relationto a known stable gene. In panel a of Fig. 6, the CBX3/ATG3 gene ratios for two stable genes are presented.The gene ratios for these two genes range from 1.2 insample 8 to 2.4 in sample 14 (2X range). When thehighly correlated and variable expression profiles of theIFIT3 and IFI44L genes, previously identified in Figs. 2and 3, were evaluated in relation to the ATG3 gene(Fig. 6, panels b and c) the sample gene ratios rangefrom 0.59 in sample 21 to 10.62 in sample 9 (17.9 Xrange) for IFIT3 and from 0.08 in sample 2 to 4.1 insample 9 (51 X range). It is also important to note thatsamples 9, 6 and 12 displayed the largest relative expres-sion levels for both genes as we previously reported inFig. 3a. Although the highly variable DEFA3 gene dis-playing an R2 value of 0.3956 was not identified amongthe genes highlighted in Figs. 2 and 3, it also displayedDEFA3/ATG3 gene ratios that varied from 0.2 in sample9 to 23.1 in sample 13 (116X range). The DEFA3 defen-sin gene belongs to a family of microbiocidal/cytotoxicpeptides found in neutrophile granules that are thoughtto be involved in host defense responses. The gene ex-pression ratios for the IFIT3 and IFI44L genes identi-fied in samples 9, 6 and 12 (Fig. 6, panels b and c) weresubstantially greater than the range of values identifiedamong the 35 CBX3/ATG3 gene ratios presented in
Wilfinger et al. BMC Genomics (2021) 22:322 Page 10 of 19

Fig. 5 Trendline gene expression profiles remain consistent over a wide range of RNA-seq expression levels. Four genes displaying unadjustedgene counts ranging from 9 to 3836 counts were rank-ordered (left panel). Gene trendline linearity was independent of the level of geneexpression. ERCC spike-in standards also showed linearity but the ERCC standard in index 35 (sample 7) was markedly elevated (right panel).However, sample 7 did not display similar deviations in any of the four genes depicted in the left panel of Fig. 5, which suggest a spike-in issuewith little or no technical impact on gene counts. Red circles identify sample 7
Wilfinger et al. BMC Genomics (2021) 22:322 Page 11 of 19

panel a of Fig. 6. Presumably, the heightened gene ra-tio responses reflect increased variability resultingfrom the coordinated biological responses impactinggene expression in samples 9, 6 and 12. In contrast,although the DEFA3/ATG3 gene expression ratiosalso displayed marked variability, the largest gene ra-tios were observed in different individuals (samples13, 28, 34 and 35) suggesting that the biological vari-ability contributing to these changes were different tothose impacting samples 9, 6 and 12. Representativesample gene ratio profiles of other stable genes aswell as the various genes identified in Fig. 2 wereidentical to those depicted in Fig. 6, in panels a, band c. This analysis demonstrates that the relativemagnitude of the gene ratio responses identified insamples 9, 6 and 12 were much larger than the 2-foldrange of sample-to-sample variation observed for 65–70% of the sequenced genes as depicted in panel a ofFig. 6, and they are unlikely due to technicalvariability.
DiscussionRNA-sequencing technology has the potential to con-tribute significantly to our ability to diagnose and treatmany diseases. As clinical medicine relies more heavilyon this technology for the application of personalizedtreatment strategies, it becomes increasingly importantto identify and disentangle sources of technological errorwhile preserving and identifying intrinsic sources ofbiological variability. As previously noted, differential ex-pression tools are impacted by a variety of factors andthey are not universally robust to the presence of outlierresults from divergent expression data [3, 4, 32–36].While tools such as EBSeq [33], LFCseq [35], leave-one-out methods [34], median-based approaches, and othersoftware [36, 37], may detect and manage outliers basedon the software’s defined criteria, they operate primarilyas a “black box” during the differential expression ana-lysis step. These tools may or may not report the outlier,and to our knowledge, they do not provide an intra-group outlier explanation that is readily available to the
Fig. 6 Gene count ratio estimates identify the specific individuals previously identified by String-db analysis. Stable genes identified in three data setswere used to normalize gene expression (see Additional file 10). In panel a, the CBX3/ATG3 gene ratios of two highly stable genes are plotted for eachof the 35 samples in our study. A 2-fold range of variation is noted between samples 8 and 14. In contrast, when two of the interferon regulatedgenes were normalized in relation to the ATG3 gene (panels b and c) samples 9, 6 and 12 were highlighted with ratios 2 to 5-fold higher than notedin panel a. The relative response profile of samples 9, 6 and 12 in panels b and c correspond to the genes correlated with IFIT3 gene previouslyidentified in Fig. 3. In contrast to the IFIT3 and IFI44L response profiles, when the DEFA3 gene was normalized in relation to ATG3, samples 13, 34, 28and 35 were highlighted. When evaluated in relation to highly stable genes within the data set, the nonlinear gene trendlines identified in our analysishighlight meaningful inter-individual changes in gene expression that cannot be explained on the basis of technical variation
Wilfinger et al. BMC Genomics (2021) 22:322 Page 12 of 19
investigator. Moreover, any outlier detection by currentsoftware during DGE is performed at the gene level only.Our approach is focused on providing complementaryinformation prior to DGE. We have evaluated the possi-bility of creating a methodology that uses existing pack-ages such as Deseq2 [37] or Cuffdiff [36] for intra-groupanalysis (for example, by using variable-leave-k-outcomparisons, where k varies over sample subsets). Inour analysis, such an approach was computationally verycostly (exploring the set of subsets of 35 samples), andnot as descriptively informative. Moreover, our approachextends beyond the gene-level view and reports on thepotential impact of divergent values at the network level.RNA sequencing counts routinely display large differ-
ences in their relative gene expression levels, which scaleswith the mean of the sequenced counts. In previous re-ports, we developed strategies for stabilizing RNA in wholeblood samples and significantly improving RNA recoveryduring extraction [10, 11]. Here, we used ERCC spike-instandard concentration ratios to minimize amplificationand dilutional errors across samples [23], noting thatERCC spike-in mixes were not used in the archived datasets. We also addressed heteroscedasticity by using MVAscaling. This method of scaling is suitable for variabilityanalysis because individual sample-to-sample gene expres-sion levels are adjusted to a common starting point acrosssamples while maintaining the incremental trendline fluc-tuations of individual genes [23]. In our Control sample,MVA of the 8746 genes reduced the mean and standarddeviation by an average of 3.9-fold; however, in highlyexpressed genes such as B2M the mean and variance arescaled down by as much as 1316-fold (Additional file 2,sheet 3). Nevertheless, the important incremental sample-to-sample gene expression changes were maintained afterMVA scaling as illustrated by the gene profiles depicted inpanels b and c of Fig. 1. After MVA, these incrementalchanges form the basis for identifying the trendline expres-sion profiles (Additional file 4, Panel A vs B). We note thatwhile MVA-scaled data is suitable for trendline analysis, itis important to follow the correct scaling protocol for dif-ferential expression analysis by following the specific guide-lines of the software that is being employed.After performing MVA scaling on our data set, we
determine that ~ 70% of the 8746 genes in our samplegroup displayed trendline linearity as assessed by R2
values ≥0.9. The application MVA in conjunction withrank-order trendline analysis illustrated that gene ex-pression in this group of genes is consistent with theprofile obtained from a normally distributed sample.Moreover, the remaining 30% of the genes that deviatefrom this linear profile were easily identified and evalu-ated due their increased variability and dispersion. Ouranalysis demonstrated that a subset on individuals withtailed gene trendlines in quartile 4, similar to IFIT3
(Fig. 1c), contribute significantly to the variability in thecontrol data set (see Additional file 1). The approachemployed in our manuscript is designed to provide anexplanatory (and visually inspectable) methodology thatcan augment existing tools and guide the decisions ofthe investigator. The statistics used are based on thequantile function [38] and higher moments of distribu-tions (skew) which are readily available in a number ofstandard statistical software packages. A dramatic ex-ample of the variability associated with these genes isdepicted by the marked increase in their computed coef-ficient of variability (Additional file 1, Fig. 4).By rank-ordering the incremental change in gene ex-
pression across samples, we created a unique snapshot or“trendline”. Statistical evaluation of the trendlines identi-fied several robust measures that provided the greatestability to characterize the biological variability or “tailed-ness” of the expression values. STRING-db analysis of thegenes exhibiting the most pronounced “tailedness” expres-sion profile revealed that these genes were associated withimportant regulatory networks (Additional file 4). We alsodemonstrated that positional rank analysis could be usedto further evaluate RNA-seq data and identify gene ex-pression variability within specific individuals in the group(see Additional files 6, 8 and 9). The ability to identify andcharacterize gene trendline properties provides a new andpowerful strategy to detect pathway-affiliated genes, andquantify the significance of their associated biological re-sponses via the computed False Discovery Rate in any tis-sue or sample. To our knowledge, this is the first study inwhich variability that diverges from standard technicalvariability has been identified (e.g. The number of Ob-served Genes per Pathway are identified and statisticallyquantified by the calculation of False Discovery Rates).Trendline slope analysis of our 35 control samples
identified individuals with gene expression rates in quar-tiles 1 and 4 that were more than 6-fold greater than thecomputed slope in quartiles 2 + 3 (32 and 351 genesidentified in Q1 and Q4, respectively). Although higheror lower rates of relative gene expression for any givengene in the sample set will contribute to increased vari-ability, rank-order quartile analysis was useful in furthercharacterizing this variation (Fig. 1, panels b and c). Oneexplanation for this response profile is that certaincritical regulatory genes were governed by positive ornegative regulatory signals [39].The expression profile of genes such as IFIT3 (Fig. 1b)
are difficult to explain on the basis of sample-to-samplevariability. The “tailing” trendline observed for the IFIT3gene indicates that gene expression in about 25% of theindividuals was markedly different from the othermembers of the sample group. These gene trendlinesdisplayed significant non-uniformity (high variability) asillustrated by range/median, range/Q3, skewness and
Wilfinger et al. BMC Genomics (2021) 22:322 Page 13 of 19

kurtosis measures. Although, kurtosis and skewness cal-culations identified the degree of “tailedness” of the genesample distribution, quartile slope analysis provided amore direct measure of these changes. Calculating theslope ratios of Q1/(Q2 +Q3) or Q4/(Q2 + Q3) identifiedindividuals that deviated from the central core of thesample group. STRING-db analysis of the genes display-ing these non-linear trendline profiles identified highlyintegrated pathway associations, as depicted in Figs. 2, 3and 4, that are involved in the detection and response toa virus. We note that the robustness of the slope ratiocalculations is dependent on the size of the samplegroup (e.g. n ≥ 16, Additional file 3).The characterized gene trendline patterns provided a
strategy for evaluating gene associations displayingsimilar trendline profiles [12]. In our sample group,range/median, range/Q3 and kurtosis calculations werealso used to identify gene trendlines displaying markeddispersion and “nonlinearity”. Gene clusters identifiedwith these parameters were subsequently evaluated withthe STRING-db and the results were summarized inTable 1. STRING-db analysis as well as correlation stud-ies demonstrated that the genes displaying pronouncednon-linear trendline properties resembling the IFIT3gene, play a prominent role in the mobilization and acti-vation of specific immune pathways (Additional files 4,6, 8 and 9 and Figs. 2, 3 and 6). We identified specificindividuals in the control data sets expressing a dispro-portionate number of genes in the defense response tovirus pathway (GO:0051607) with Observed Gene Countpathway assignments ranging from 4 to 29 genes andFDR’s from E-2 to E-26 in a pathway containing only181 genes. Our results are suggestive of intra-group differ-ences beyond technical variability. Under the assumptionthat “methodological variability” is mostly stochastic, theemergence of highly correlated regulatory pathways (Fig. 2)with significant FDR’s identified during STRING-dbanalysis (Additional file 6) would be highly unlikely. Thisobservation was further supported by noting that whenthe interferon-mediated genes identified in Fig. 2 wereexpressed in relation to highly stable genes such as ATG3(Fig. 6), samples 9, 6 and 12 were consistently identifiedwith the largest gene ratios. Moreover, random selectionsof 300 genes from the entire list of 8746 genes neverresulted in FDR’s ≤ E-6 (n = 5, Additional file 3). While wecannot exclude the possibility that technological andmethodological error may influence our findings, theresults presented in Table 1 and in Figs. 5 and 6 supportthe conclusion that technical and methodological errorhad nominal impact on our findings.Intra-group identification of 11–20% of the individuals
in three separate data sets as responding to a viral-induced immune response is an important observationthat should be considered prior to differential expression
analysis. In addition, other related pathways involvingdefense response (GO:0006952), response to virus (GO:0009615) and the type 1 interferon signaling (GO:0009615) pathways were also routinely found among thetop 10 identified pathways in conjunction with thedefense response to virus pathway. Identification ofindividuals that exhibit a defense-related response withinan experimental group is consistent with the time-dependent activation and transition of the immune sys-tem from the detection of a foreign object to a definedimmune response [27–30].We have noted that changes in gene expression may
represent 5 to 50-fold deviations from the median ex-pression level as illustrated for the IFIT3 gene in panel cof Fig. 1. Current analytical pipelines for DGE are de-signed to remove “outliers” which display more than30% disagreement [1]. Based on our results, these proto-cols remove the gene counts of individuals displayingthe greatest biological variability thereby diminishing theopportunity to detect cases of interest wherein a contrib-uting physiological basis for variability may be at work.The removal of specific individuals that appear to beresponding to a viral challenge may remove a previouslyunrecognized source of biological variation. While ourapproach informs the investigator about these cases, it isbeyond the scope of this report to determine how themitigation of this source of biological variability will in-fluence DGE during principal component analysis.Identifying and characterizing the genes assigned to
the highest positional ranks enabled us to identify indi-viduals with an increased number of genes in certainGO pathways in our control group (Additional file 6) aswell as in the archived data sets (files 8, and 9). Our ana-lysis identified asymptomatic individuals who may havebeen responding to an immune challenge; for example, arecent infection, an immunization, or a response to oneof the many latent viruses we commonly harbor in ourbodies [40]. A broad array of genes in alternative geneexpression pathways were also identified in our analysisbut they did not reach a statistical level of significance(see Additional files 6, 8 and 9). These genes alsocontribute to the biological variability in the varioussample groups but they do not appear to introduce aninordinate degree of variability. Although the impact ofdifferences in WBC number and the detection ofinterferon-regulated genes involved in inflammatory re-sponse have been previously described [26–30], we believethis is the first report in which these responses have beenquantified and localized to specific individuals withincontrol data sets.After MVA and establishing trendlines, several calcula-
tions including estimates of R2 were prepared. R2, ameasure of the variance explained by regression, pro-vided an estimate of the linearity of every gene in the
Wilfinger et al. BMC Genomics (2021) 22:322 Page 14 of 19
data set. We have ranked the R2 values for the three datasets in descending order and identified 15 genes with R2
values > 0.96 that had raw mean counts > 5 and thatwere common to all three data sets (Additional file 10).Within this group of genes, MVA reduced the rawmeans by 12-fold and identified genes with very stabletrendlines that may be useful as internal reference genecandidates for evaluating RNA sequencing results (e.g.Fig. 6) or as qRT-PCR gene markers as previously sug-gested by Stamova et al. [41].The application MVA in conjunction with rank-order
trendline analysis provides a strategy for identifying previ-ously unrecognized sources of biological variation. How-ever, it should be noted that the expression levels ofERCC spike-in standards, as depicted by sample 7 in Fig. 5,may also be impacted by the initial composition of theRNA sample [3, 19]. Our approach is helpful towardstackling the difficult question of how variability mayimpact the conclusions of previous studies. This analysisis simple to perform and requires a minimal amount ofcomputational time. Therefore, it may significantly con-tribute to the clarity of our understanding of the mannerin which previously unrecognized sources of biologicalvariability may have biased or confounded the experimen-tal analysis with minimal overhead. Although differentialgene expression analysis remains an important applicationin RNA-seq studies, the detection of regulatory pathwayscontaining genes that may not otherwise be identified asdifferentially expressed provides new insight into thecomplex mechanisms governing human diseases.
ConclusionsRank-order analysis of the MVA gene expression valuesin conjunction with R2 calculations revealed that 65–70% of the sequenced genes display a linear “baseline”level of gene expression across the data set. Statisticalmeasures, such as range/median, range/ Q3 and kurtosis,that characterize the “tailing” properties of some genetrendlines, were used in conjunction with databases suchas STRING-db or PANTHER-db to identify and quantifygene pathways contributing to biological variabilitywithin and across three different sample groups. Pathwaysrelating to viral-induced immunological responses wereidentified in 11–20% of the 54 individuals evaluated in ourcombined studies. This previously unrecognized source ofvariability may confound or obscure DGE results andmask important conclusions obtained from immuno-logical studies.Minimum Value Adjustment (MVA) scaling signifi-
cantly reduced the average mean and standard deviationin the data set by 3.9-fold among the 8746 protein-coding sequenced genes. However, MVA preserved theunique incremental sample-to-sample changes in geneexpression across individuals following rank-ordering.
Furthermore, the resulting range and magnitude of theincremental changes in gene expression following MVAwere markedly similar even though the RNA was ex-tracted and processed differently in the three data setsevaluated in our study. While MVA may also reducesome of the variability that is commonly introducedwhen data sets are sequenced in different laboratoriesand at different times, its designated utility in our studiesis in the analysis of intra-group comparisons.
MethodsSample collection, RNA extraction, sequencing and dataanalysisBlood samples were collected from 35 healthy adults ac-cording to a protocol approved by Chesapeake ResearchReview, LLC (#Pro:00009509). Blood samples were used forcomplete blood cell analysis and RNA extraction [10, 11].RNA was DNase-treated and submitted to the University ofCincinnati Genomics, Epigenetics and Sequencing Core Fa-cility for RNA sequencing. The computational pipelineemployed in this study has been previously described [23].The RNA extracted from the 35 control samples passed
quality control assessment prior to the addition of Exter-nal RNA Controls Consortium ExFold RNA spike-inmixes (ERCC: Ambion, 4,456,739; Foster City CA) and re-moval of ribosomal and globin RNA from the samples(Illumina GZG1206; San Diego, CA). The cDNA librarieswere processed according to standardized Illumina proto-cols and sequenced on the Illumina HiSeq 2000 platform.Fastq data files containing 53–77 million single-end readswere trimmed and processed for data analysis. Reads werealigned to reference genome GRCh37.p13[hg19] using theBowTie2 aligner supporting gapped alignments as previ-ously described [23, 36].
Processing RNA sequencing data filesData files containing 10–13 thousand transcripts wereimported into an Excel spreadsheet and matched to a listof human protein coding genes identified at the GeneOntology website [20–22]. To optimize our analysis indatabases such as STRING [13–15] and PATHER [42,43], we removed noncoding genes (filter) from furtherconsideration [12]. When noncoding genes were re-moved, False Discovery Rate (FDR) estimates were im-proved during STRING-db pathway analysis therebyincreasing the sensitivity of gene pathway identification.Transcripts that were not identified as protein-codinggenes were assigned to a separate “Discard” data sheet.After identifying the protein coding genes, samples withgene counts < 0.5 were replaced with 0 and genes withmeans < 0.5 counts were eliminated from further ana-lysis [12].Single genes that mapped to multiple genomic locations
(Copy Number Variants, CNV [44]) were identified and
Wilfinger et al. BMC Genomics (2021) 22:322 Page 15 of 19

read counts were combined under a single identificationconvention (e.g. The Control data set contained 66 CNVgenes with duplicate/triplicate gene location listings).The final raw data processing step was the Minimum
Value Adjustment scaling procedure described below(MVA, Additional files 1 and 3). More detained informa-tion relating to the data entry process is provided inAdditional file 2.
Data processing, normalization strategies and statisticalanalysisIn our control data set, an iterative correction of thelength-adjusted ERCC spike-in concentration ratios wasused to proportionally adjust for sample processingeffects, pipetting errors, dilutional differences and othersources of methodological variability while the archiveddata sets that did not contain ERCC spike-ins werelimited to size factor normalization using the median-to-ratio method as previously outlined [23]. Data wereadjusted for sequencing depth and normalized using theDeseq2 median of ratios method [36] before the reads(in units of transcript per kilobase million or TPM) wereused in trendline analysis. Our objective was tominimize the impact of methodological variability beforeapplying trendline analysis.Read counts for various genes ranged over a 5
Log10 scale thereby creating large differences in thevariance within the sequenced data set. To address theheteroscedastic nature of the raw data, we applied Mini-mum Value Adjustment (MVA) scaling normalizationstrategy to our counts. The smallest count for each genewas identified and used to proportionally adjust theremaining samples. MVA=Gene A (Sample Counts (1 to
n) / Gene A Minimum Value Count). This adjustment as-signs a value of 1 to the smallest count value for everygene. After MVA, all of the incremental changes for the8746 protein-coding genes across the 35-sample data setfall within a numeric range of 1–60 relative counts. Thisadjustment of every gene to its lowest common denomin-ator eliminated large comparative differences in the rela-tive magnitude of the observed counts between geneswithin and across individuals while maintaining the im-portant incremental changes when the adjusted counts arerank-ordered. In addition, the trendline starting point isidentical for every gene in the analysis. The removal of in-ordinately low (counts < 0.5) and nonsignificant genecounts minimized the possibility of inflating the magni-tude of the sample-to-sample incremental changes thatcan be sensitive to very small outliers during scaling ad-justments [9].Statistical calculations were performed using the resi-
dent statistical macros provided with Windows 10 Excelsoftware.
Trendline identification and AnalysisFor statistical analysis, the Microsoft Windows ExcelPlatform and its statistical and mathematical functionswere used. In order to organize and manage the data,software was developed to streamline and augment ouranalysis [12]. RNA sequencing counts were importedinto Excel, duplicate gene entries were identified and re-moved, gene counts that were below a user defined valuewere checked for meaningful gene expression levels andnonprotein coding genes were removed (optional) beforeperforming Minimum Value Adjustment scaling (seeAdditional file 2 for details and examples of data output).A primary objective of our study was to determine
whether rank-order analysis was a useful strategy toidentify sources of intra-group biological variability thatotherwise remain difficult to detect in RNA-seq data. Inorder to omit nonprotein coding genes from the sequen-cing results, each gene was surveyed to determinewhether the transcript was a known protein coding gene.We used the Gene Ontology website to provide a list of19,623 known human protein coding genes [20–22].Genes that were not recognized as protein coding genesare listed as “filtered units” and they can be further ana-lyzed if desired.Two markedly different gene trendline expression
profiles are presented in supplement 1 to illustrate howlinear regression analysis and other calculations can beused to analyze rank-ordered gene count data. Tren-dlines were constructed for each gene by ranking the ad-justed and unadjusted gene counts for the 35 samples inascending order as described in Additional files 1, 2, 3and 4. From our list of 35 samples, we identified 15genes with the largest mean expression values beforeand after MVA (Additional file 2, sheets 2 & 3). MVAsignificantly reduced the mean and standard deviationamong these genes by 67 to 1316-fold but the Coefficientof Variation was unchanged. Genes were identified in theunadjusted and MVA data sets with R2 > 0.9 (linearprofile) and R2 < 0.9 (nonlinear) trendline patterns. Thesemathematical calculations were used to further characterizegene trendlines and identify gene groupings (clusters) thatshared similar mathematical features. This analysisidentified relational associations among genes that wouldotherwise be indiscernible using more classical analyticalprocedures. Supplement file 2 describes additional softwareprograming features and examples of data output. An over-view of the data input and processing pipeline is summa-rized in sheet 1 of file 2.
Gene pathway associations identified by comparingsimilarities in Trendline characteristicsA variety of statistical calculations were performed onthe trendline of each gene. Our results were based on alist of 8746 protein-coding genes with a mean baseline
Wilfinger et al. BMC Genomics (2021) 22:322 Page 16 of 19
count ≥0.5 counts that were rank-ordered to identifygenes with the most prominent trendline property (e.g.range/Q3, kurtosis, R2, etc.). Prominent genes consid-ered for additional analysis fell among the top 300 genescharacterized by the largest or smallest measurementsfor any of the computed parameters. For each computedstatistical parameter, the identified genes were importedinto the STRING database (db) to determine if thatparameter linked genes to functionally related proteinassociations. For example, 300 genes that displayed thelargest computed means were identified and importedinto the STRING database version 11 [13–15] to deter-mine if the highlighted genes formed known associationswithin any biological pathway(s). STRING-db analysiswas performed using the “high confidence setting of0.7”. Using various statistical tests, the STRING-db iden-tified the Number of Observed Gene Counts within theoriginal list of 300 submitted genes that were associatedwith known GO pathways and assigned a False Discov-ery Rate based on the Observed Gene Count and thetotal number of known genes in the pathway. Al-though algorithms employed to compute False Dis-covery Rates in the STRING-db and Panther-db [13–15, 42, 43] databases are different, False DiscoveryRates < E-15 are generally considered significant andthe identified Observed Gene Count groupings cannotnot be attributed to random gene associations (seefile 2 for additional detail).
Analysis of archived RNA Seq data filesAn identical method of analysis was used to evaluate se-quencing data obtained from peripheral blood samplesextracted and processed with different methodologies inorder to determine whether the MVA scaling and rank-ordering methods could identify similar changes in genepathway affiliations among Control samples in twoarchived data sets. We downloaded data files from theNCBI Gene Expression Omnibus site [31] containingsequencing data obtained from the peripheral blood of 9Controls (GSE109313, [24]) in one data set and 12Controls in a second data set (GSE112057, [25]). Bloodsamples in the first data set were extracted with thePAXgene RNA blood extraction kit and further proc-essed to prepare poly(A) selected and ribo-depletedRNA-seq libraries. In data set 2, blood was collected viaTempus Tubes and RNA was extracted with the TempusSpin RNA isolation kit.
AbbreviationsFDR: False Discovery Rate; GO: Gene Ontology; MVA: Minimum ValueAdjustments; RNA-seq: RNA sequencing; SD: Standard Deviation;CV: Coefficient of Variation; db: Database; WBC: White blood cells;DGE: Differential gene expression
Supplementary InformationThe online version contains supplementary material available at https://doi.org/10.1186/s12864-021-07563-9.
Additional file 1. Rationale for identifying sources of biological variationin RNA sequencing data.
Additional file 2. Summary of Statistical Measures used to EvaluateGene Expression before and after Minimum Value Adjustment (MVA).
Additional file 3. The Identification of Gene Trendlines with “Tailing”Profiles Using Quartile Slope Analysis.
Additional file 4. STRING db Pathway Identification Based on theAnalysis of the Top 300 Genes Identified by the Designated StatisticalMeasures.
Additional file 5. Examination of Intraindividual Gene Rankings toIdentify Individuals Displaying Coordinated Gene Regulatory Activity.
Additional file 6. STRING db Analysis of Intra-individual Positional GeneRankings in 35 Control Samples Based On Range/Median, Range/Q3, Kur-tosis and Q4/Q(2 + 3) Slope Calculations.
Additional file 7. Rank-Ordered Distribution of White Blood CellsAmong 35 Control Samples.
Additional file 8. STRING db Analysis of Intra-individual Positional GeneRankings In 9 Archived Controls Based on Range/Median, Range/Q3, Kur-tosis and Q4/Q(2 + 3) Slope Calculations.
Additional file 9. STRING db Analysis of Intra-individual Positional GeneRankings In 12 Archived Control Samples Based On Range/Median,Range/Q3, Kurtosis and Q4/Q(2 + 3) Slope Calculations.
Additional file 10. Reference Genes with Raw Counts Greater than 5and R2 Values > 0.9 in three separate RNA sequencing Studies.
Additional file 11. Control Reference Data Files.
AcknowledgementsWe acknowledge the assistance of Dr. Xiang Zhang and his staff at theGenomics, Epigenomics and Sequencing Core, University of Cincinnati fortheir assistance in providing the RNA sequencing results used in this report.
Authors’ contributionsKM and PC were involved in the design of the sample collection protocoland IRB approval process. WW, KM and PC participated in the sampleextraction and processing of the RNA samples. HE assembled the dataprocessing and analysis pipeline through which the sequenced data wereprocessed. WW, HE and PC contributed to the development of the dataanalysis rationale outline in the manuscript. RM provided the programmingfor the RAnGER software. WW wrote the manuscript and all the authorsassisted in the review, edits and final approval of the manuscript.
Funding“Not applicable”.
Availability of data and materialsCopies of the three processed unadjusted data files that were used in thisstudy are provided in Additional file 11. Sheet 1 contains our control datafiles and sheets 2 and 3 contain the Control data files from the Mangul et.al[24]. and Mo et.at. reports [25] that were processed through our pipeline.The original RNA sequencing data files for the 35 controls described in thisstudy have been archived at the NCBI Gene Expression Omnibus site withaccession number GSE169359 (https://www.ncbi.nlm.nih.gov/geo/query/acc.cgi?acc=GSE169359). The additional archived data files referenced in ourstudy are available at NCBI Gene Expression Omnibus site (https://www.ncbi.nlm.nih.gov/geo/) containing sequencing data obtained from the peripheralblood of 9 Controls (https://www.ncbi.nlm.nih.gov/geo/query/acc.cgi?acc=GSE109313) [24] in one data set and 12 Controls in a second data set(https://www.ncbi.nlm.nih.gov/geo/query/acc.cgi?acc=GSE112057) [25].
Wilfinger et al. BMC Genomics (2021) 22:322 Page 17 of 19

Declarations
Ethics approval and consent to participateThe blood samples reported in this study were collected in accordance withthe approved protocol provided by the Chesapeake Research Review, LLC.CIRBI Protocol # Pro 00009509. Participants provided witnessed signedinformed consent documents specifically approved by Chesapeake IRBguidelines. The approval for the other archived data cited in this report isincluded in the original publications.
Consent for publication“Not applicable”.
Competing interestsThe authors declare that they have no competing interests.
Author details1Molecular Research Center, Inc., Cincinnati, USA. 2Robert Miller Enterprises,LLC, Cincinnati, USA. 3University of Wisconsin-Madison, Madison, USA.4University of Cincinnati, Cincinnati, USA.
Received: 5 November 2020 Accepted: 29 March 2021
References1. Conesa A, Madrigal P, Tarazona S, Gomez-Cabrero D, Cervera A, McPherson
A, et al. A survey of best practices for RNA-seq data analysis. Genome Biol.2016;17(1):13. https://doi.org/10.1186/s13059-016-0881-8.
2. Robinson MD, Oshlack A. A scaling normalization method for differentialexpression analysis of RNA-seq data. Genome Biol. 2010;11(3):R25. https://doi.org/10.1186/gb-2010-11-3-r25.
3. Bullard JH, Purdom E, Hansen KD, Dudoit S. Evaluation of statistical methodsfor normalization and differential expression in mRNA-Seq experiments.BMC Bioinformatics. 2010;11(1). https://doi.org/10.1186/1471-2105-11-94.
4. Dillies MA, Rau A, Aubert J, Hennequet-Antier C, Jeanmougin M, Servant N,et al. A comprehensive evaluation of normalization methods for Illuminahigh-throughput RNA sequencing data analysis. Brief Bioinform. 2013;14(6):671–83. https://doi.org/10.1093/bib/bbs046.
5. Zyprych-Walczak J, Szabelska A, Handschuh L, Górczak K, Klamecka K,Figlerowicz M, et al. The impact of normalization methods on RNA-Seqdata Analysis. Biomed Res Int. 2015;2015:1–10. https://doi.org/10.1155/2015/621690.
6. Rapaport F, Khanin R, Liang Y, Pirun M, Zumbo P, Mason CE, et al.Comprehensive evaluation of differential gene expression analysismethods for RNA-seq data. Genome Biol. 2013. https://doi.org/10.1186/gb-2013-14-9-r95.
7. McIntyre LM, Lopiano KK, Morse AM, Amin V, Oberg AL, Young LJ, et al.RNA-seq: technical variability and sampling. BMC Genomics. 2011;12(1).https://doi.org/10.1186/1471-2164-12-293.
8. Hansen K, Wu Z, Irizarry R, Leek J. Sequencing technology does noteliminate biological variability. Nat Biotechnol. 2011;29(7):572–3. https://doi.org/10.1038/nbt.1910.
9. van den Berg RA, Hoefsloot HC, Westerhuis JA, Smilde AK, van der Werf MJ.Centering, scaling, and transformations: improving the biologicalinformation content of metabolomics data. BMC Genomics. 2006;7(1).https://doi.org/10.1186/1471-2164-7-142.
10. Chomczynski P, Wilfinger WW, Kennedy A, Rymaszewski M, Mackey K.RNAzol©BD: a reagent for the effective isolation of RNA from whole blood.Nat Methods. 2013;10(5):ii. https://doi.org/10.1038/nmeth.f.364.
11. Chomczynski P, Wilfinger WW, Eghbalnia HR, Kennedy A, Rymaszewski M,Mackey K. Inter-individual differences in RNA levels in human peripheral blood.PLoS One. 2016;11(2):e0148260. https://doi.org/10.1371/journal.pone.0148260.
12. Miller R. RAnGER© (Rank, Analyze, Graph and Evaluate Results), 2021 (http://www.rmiller-llc.com).
13. Protein-Protein Interaction Networks Functional Enrichment Analysis, STRING-db (https://string-db.org/cgi/input?sessionId=bpH5iTmmOFi1&input_page_active_form=multiple_identifiers), Version 11.0.
14. Szklarczyk D, Gable AL, Lyon D, Junge A, Wyder S, Huerta-Cepas J, et al. STRING v11: protein-protein association networks with increased coverage,supporting functional discovery in genome-wide experimental datasets.Nucleic Acids Res. 2019;47(D1):D607–13. https://doi.org/10.1093/nar/gky1131.
15. Szklarczyk D, Morris JH, Cook H, Kuhn M, Wyder S, Simonovic M, et al. TheSTRING database in 2017: quality-controlled protein-protein associationnetworks, made broadly accessible. Nucleic Acids Res. 2017. https://doi.org/10.1093/nar/gkw937.
16. Whitney AR, Diehn M, Popper SJ, Alizadeh AA, Boldrick JC, Relman DA, et al.Individuality and variation in gene expression patterns in human blood.PNAS. 2003;100(4):1896–901. https://doi.org/10.1073/pnas.252784499.
17. Savelyeva AV, Kuligina EV, Bariakin DN, Kozlov VV, Ryabchikova EI,Richter VA, et al. Variety of RNAs in peripheral blood cells, plasma, andplasma fractions. Biomed Res Int. 2017;2017:1–10. https://doi.org/10.1155/2017/7404912.
18. Preininger M, Arafat D, Kim J, Nath AP, Idaghdour Y, Brigham KL, et al.Blood-informative transcripts define nine common axes of peripheral bloodgene expression. PLoS Genet. 2013;9(3):e1003362. https://doi.org/10.1371/journal.pgen.1003362.
19. Jaffe AE, Irizarry RA. Accounting for cellular heterogeneity is critical inepigenome-wide association studies. Genome Biol. 2014;15(2):R31. https://doi.org/10.1186/gb-2014-15-2-r31.
20. Carbon S, Ireland A, Mungall CJ, Shu S, Marshall B, Lewis S, AmiGO Hub,Web Presence Working Group. AmiGO: online access to ontology andannotation data. Bioinformatics. 2009;25(2):288-9 The Gene OntologyResource (http://geneontology.org).
21. Ashburner M, Ball CA, Blake JA, Botstein D, Butler H, Cherry JM, et al. Geneontology: tool for the unification of biology. The Gene OntologyConsortium. Nat Genet. 2000. https://doi.org/10.1038/75556.
22. The Gene Ontology Consortium. Expansion of the Gene Ontologyknowledgebase and resources. Nucleic Acids Res. 2017;45(D1):D331–8.https://doi.org/10.1093/nar/gkw1108.
23. Eghbalnia HR, Wilfinger WW, Mackey K, Chomczynski P. Coordinatedanalysis of exon and intron data reveals novel differential geneexpression changes. Sci Rep. 2020;10(1):15669. https://doi.org/10.1038/s41598-020-72482-w.
24. Mangul S, Yang HT, Strauli N, Gruhl F, Porath HT, Hsieh K, et al. ROP:dumpster diving in RNA-sequencing to find the source of 1 trillion readsacross diverse adult human tissues. Genome Biol. 2018;19(1):36. https://doi.org/10.1186/s13059-018-1403-7.
25. Mo A, Marigorta UM, Arafat D, Chan LHK, Ponder L, Jang SR, et al. Disease-specific regulation of gene expression in a comparative analysis of juvenileidiopathic arthritis and inflammatory bowel disease. Genome Med. 2018;10(1):48. https://doi.org/10.1186/s13073-018-0558-x.
26. Zhang X, Kluger Y, Nakayama Y, Poddar R, Whitney C, DeTora A, et al. Geneexpression in mature neutrophils: early responses to inflammatory stimuli. JLeuk Biol. 2004;75(2):358–72. https://doi.org/10.1189/jlb.0903412.
27. Jiang K, Sun X, Chen Y, Shen Y, Jarvis JN. RNA sequencing from humanneutrophils reveals distinct transcriptional differences associated withchronic inflammatory states. BMC Med Genet. 2015;8(1):55. https://doi.org/10.1186/s12920-015-0128-7.
28. Schoggins JW, Rice CM. Interferon-stimulated genes and their antiviraleffector functions. Curr Opin Virol. 2011;1(6):519–25. https://doi.org/10.1016/j.coviro.2011.10.008.
29. Schreiber G. The molecular basis for differential type 1 interferon signaling.JBC. 2017;292(18):7285–94. https://doi.org/10.1074/jbc.R116.774562.
30. Schoggins JW. Interferon-stimulated genes: what do they all do? AnnRev Virol. 2019;6(1):567–84. https://doi.org/10.1146/annurev-virology-092818-015756.
31. Barrett T, Wilhite SE, Ledoux P, Evangelista C, Kim IF, Tomashevsky M,Marshall KA, Phillippy KH, Sherman PM, Holko M, Yefanov A, Lee H, ZhangN, Robertson CL, Serova N, Davis S, Soboleva A. NCBI GEO: archive forfunctional genomics data sets--update. Nucleic Acids Res. 2013 Jan;41(Database issue):D991-5. Gene Expression Omnibus database, a publicfunctional data repository. (https://www.ncbi.nlm.nih.gov/sites/GDSbrowser/).
32. Charlotte S, Mauro D. A comparison of methods for differential expressionanalysis on RNA-seq data. BMC Bioinformatics. 2013. https://doi.org/10.1093/bioinformatics/btt087.
33. Ning L, Dawson John A, Thomson James A, Victor R, Rissman Anna I, SmitsBart MG, et al. EBSeq: an empirical bayes hierarchical model for inference inRNA-seq experiments. Bioinformatics. 2013. https://doi.org/10.1093/bioinformatics/btt087.
34. George NI, Bowyer JF, Crabtree NM, Chang CW. An iterative leave-one-outapproach to outlier detection in RNA-Seq data. PLoS One. 2015;10(6):e0125224. https://doi.org/10.1371/journal.pone.0125224.
Wilfinger et al. BMC Genomics (2021) 22:322 Page 18 of 19

35. Lin B, Li-Feng Z, Xin C. LFCseq: a nonparametric approach for differentialexpression analysis of RNA-seq data. BMC Genomics. 2014;15(Suppl 10):S7.https://doi.org/10.1186/1471-2164-15-S10-S7.
36. Anders S, Huber W. Differential expression analysis for sequence count data.Genome Biol. 2010;11(10):R106. https://doi.org/10.1186/gb-2010-11-10-r106.
37. Love MI, Huber W, Anders S. Moderated estimation of fold change anddispersion for RNA-seq data with DESeq2. Genome Biol. 2014;15(12):550.https://doi.org/10.1186/s13059-014-0550-8.
38. Gilchrist WG. Statistical Modelling with Quantile Functions. London: Chapman &Hall/CRC. 2000. p. 1–52.
39. Anisur R, Abhinav T, Jatin N. Hickling timothy. importance of feedback andfeedforward loops to adaptive immune response modeling. CPTPharmacometr Syst Pharmacol. 2018. https://doi.org/10.1002/psp4.12352.
40. Wylie KM, Mihindukulasuriya KA, Zhou Y, Sodergren E, Storch GA, WeinstockGM. Metagenomic analysis of double-stranded DNA viruses in healthyadults. BMC Biol. 2014;12(1):71. https://doi.org/10.1186/s12915-014-0071-7.
41. Stamova BS, Apperson M, Walker WL, Tian Y, Xu H, Adamczy P, et al.Identification and validation of suitable endogenous reference genes forgene expression studies in human peripheral blood. BMC Med Genet. 2009;2(1). https://doi.org/10.1186/1755-8794-2-49.
42. Attrill H, Gaudet P, Huntley RP, Lovering RC, Engel SR, Poux S, Van Auken KM,et al. The Gene Ontology Consortium, Annotation of gene product functionfrom high-throughput studies using the Gene Ontology, Database, Volume2019, 2019, baz007, https://doi.org/10.1093/database/baz007 PantherClassification System Tool for grafting sequences (http://www.pantherdb.org/).
43. Mi H, Muruganujan A, Huang X, Ebert D, Mills C, Guo X, et al. ProtocolUpdate for large-scale genome and gene function analysis with the PANTHER classification system (v.14.0). Nat Protoc. 2019. https://doi.org/10.1038/s41596-019-0128-8.
44. Sudmant PH, Kitzman JO, Antonacci F, Alkan C, Malig M, Tsalenko A, et al.Diversity of human copy number variation and multicopy genes. Science.2010. https://doi.org/10.1126/science.1197005.
Publisher’s NoteSpringer Nature remains neutral with regard to jurisdictional claims inpublished maps and institutional affiliations.
Wilfinger et al. BMC Genomics (2021) 22:322 Page 19 of 19