strategist's handbook: chart updates · may 17, 2020 / strategist’s handbook: chart updates...
TRANSCRIPT

Strategist’s Handbook:Chart Updates
Yardeni Research, Inc.
May 21, 2020
Dr. Edward Yardeni516-972-7683
Please visit our sites atwww.yardeni.comblog.yardeni.com
thinking outside the box

Table Of Contents Table Of ContentsTable Of Contents
May 21, 2020 / Strategist’s Handbook: Chart Updates www.yardeni.com
Yardeni Research, Inc.
S&P 500 Stock Price Index 1S&P 500 Earnings, Revenues, Margins 2S&P 500 Revenues & Earnings Growth 3-4S&P 500 Revenues & Earnings 5S&P 500/400/600 Quarterly Earnings Growth Rates 6S&P 500 Forward Earnings & Blue Angels 7S&P 500/400/600 Valuation 8Investment Styles: Stay Home vs Go Global 9Investment Styles: LargeCaps vs SMidCaps 10Investment Styles: Growth vs Value 11Bond Yields 12Bond Yield Spreads 13Dollar & Commodities 14Inflation 15US Economy 16US Monetary Policy 17US Fiscal Policy 18China 19Eurozone 20Global Demography 21

2015 2016 2017 2018 2019 2020 20211700
1900
2100
2300
2500
2700
2900
3100
3300
3500
1700
1900
2100
2300
2500
2700
2900
3100
3300
3500
5/20
S&P 500 INDEX(daily) 3386.15
2237.4
Latest (2971.61)
Source: Standard & Poor’s.Note: Dotted lines show previous years’ closing prices.
yardeni.com
Figure 1.
2008 2009 2010 2011 2012 2013 2014 2015 2016 2017 2018 2019 2020 2021 2022500
750
1000
1250
1500
1750
2000
2250
2500
27503000325035003750
500
750
1000
1250
1500
1750
2000
2250
2500
27503000325035003750
S&P 500 BULL & BEAR MARKETS & CORRECTIONS: 2008-2020(daily ratio scale)
5/20
-56.8% (517)
-16.0% (70)
-19.4% (157)
-9.8% (28)
-9.9% (60)
-7.7% (62)
-5.8% (34)
-5.8% (19)
-7.4% (27)
-12.4% (96)
-13.3% (100)
-10.2% (13)
-19.8% (95)
-6.8% (34)
-33.9% (33)
Note: Corrections are declines of 10% or more, but less than 20%, while minor ones are 5%-10% (all in blue shades). Bear markets are declines of 20%or more (in red shades). Number of calendar days in parentheses.Source: Standard & Poor’s.
yardeni.com
Figure 2.
S&P 500 Stock Price Index
Page 1 / May 21, 2020 / Strategist’s Handbook: Chart Updates www.yardeni.com
Yardeni Research, Inc.
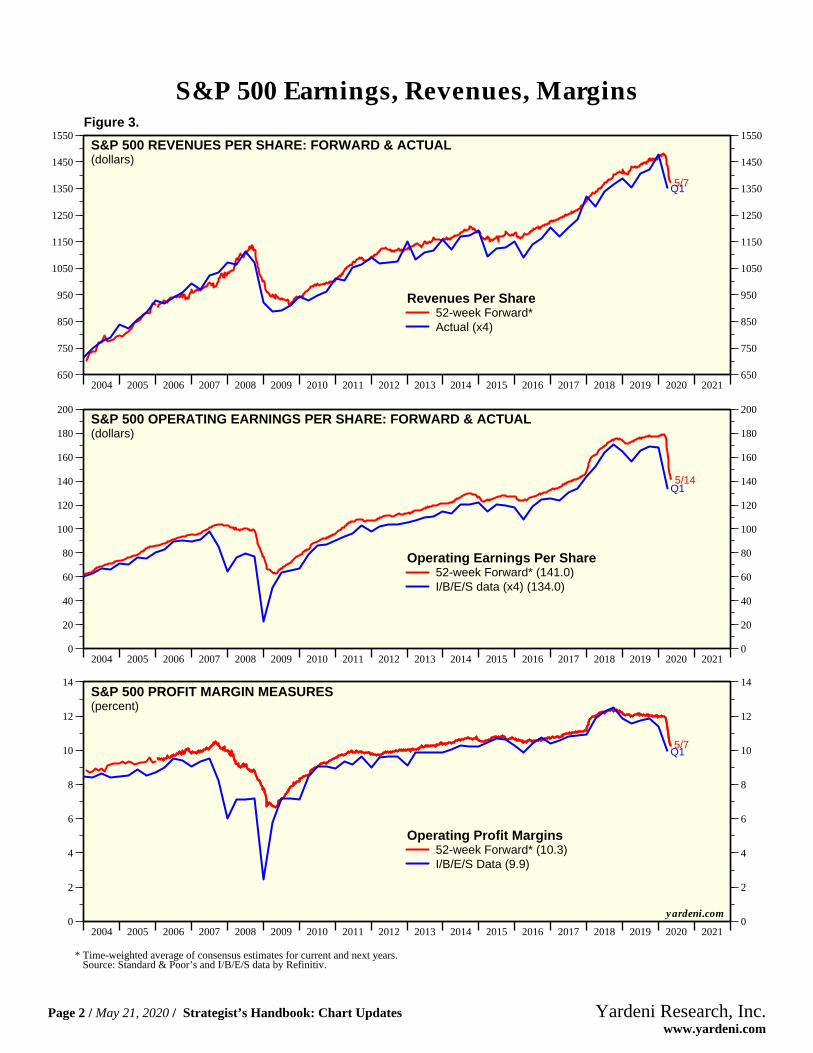
Figure 3.
2004 2005 2006 2007 2008 2009 2010 2011 2012 2013 2014 2015 2016 2017 2018 2019 2020 2021650
750
850
950
1050
1150
1250
1350
1450
1550
650
750
850
950
1050
1150
1250
1350
1450
1550
5/7Q1
S&P 500 REVENUES PER SHARE: FORWARD & ACTUAL(dollars)
Revenues Per Share52-week Forward*Actual (x4)
2004 2005 2006 2007 2008 2009 2010 2011 2012 2013 2014 2015 2016 2017 2018 2019 2020 20210
20
40
60
80
100
120
140
160
180
200
0
20
40
60
80
100
120
140
160
180
200
Q15/14
S&P 500 OPERATING EARNINGS PER SHARE: FORWARD & ACTUAL(dollars)
Operating Earnings Per Share52-week Forward* (141.0)I/B/E/S data (x4) (134.0)
2004 2005 2006 2007 2008 2009 2010 2011 2012 2013 2014 2015 2016 2017 2018 2019 2020 20210
2
4
6
8
10
12
14
0
2
4
6
8
10
12
14
5/7Q1
S&P 500 PROFIT MARGIN MEASURES(percent)
Operating Profit Margins52-week Forward* (10.3)I/B/E/S Data (9.9)
* Time-weighted average of consensus estimates for current and next years. Source: Standard & Poor’s and I/B/E/S data by Refinitiv.
yardeni.com
S&P 500 Earnings, Revenues, Margins
Page 2 / May 21, 2020 / Strategist’s Handbook: Chart Updates www.yardeni.com
Yardeni Research, Inc.

95 96 97 98 99 00 01 02 03 04 05 06 07 08 09 10 11 12 13 14 15 16 17 18 19 20 21 22-25
-20
-15
-10
-5
0
5
10
15
20
-25
-20
-15
-10
-5
0
5
10
15
20
Q1
S&P 500 REVENUES PER SHARE(yearly percent change)
Latest (-0.4)
Source: Standard & Poor’s.
yardeni.com
Figure 4.
95 96 97 98 99 00 01 02 03 04 05 06 07 08 09 10 11 12 13 14 15 16 17 18 19 20 21 22-50
-40
-30
-20
-10
0
10
20
30
40
50
60
70
-50
-40
-30
-20
-10
0
10
20
30
40
50
60
70
Q1
S&P 500 OPERATING EARNINGS PER SHARE (I/B/E/S data by Refinitiv)*(yearly percent change)
Latest (-14.5)
* Due to extreme values, Q4-2008’s -65.2% is capped at -40% and Q4-2009’s +198.9% is capped at 60%.Source: I/B/E/S data by Refinitiv.
yardeni.com
Figure 5.
S&P 500 Revenues & Earnings Growth
Page 3 / May 21, 2020 / Strategist’s Handbook: Chart Updates www.yardeni.com
Yardeni Research, Inc.

2006 2007 2008 2009 2010 2011 2012 2013 2014 2015 2016 2017 2018 2019 2020 2021 2022-10
-5
0
5
10
15
20
-10
-5
0
5
10
15
20
07 08
1011
12 13
14
15
18
19
20
21
09
16
17
yardeni.com
Source: I/B/E/S data by Refinitiv.
S&P 500 ANNUAL REVENUE GROWTH FORECASTS*(based on analysts’ consensus estimates, percent, weekly)
2007 (6.0)2008 (5.5)2009 (-7.7)2010 (8.9)2011 (9.9)2012 (1.5)2013 (1.7)2014 (3.1)
2015 (-3.7)2016 (1.9)2017 (6.4)2018 (8.9)2019 (4.1)2020 (-4.8)2021 (8.3)
Latest data thru 05/07/20
Figure 6.
2006 2007 2008 2009 2010 2011 2012 2013 2014 2015 2016 2017 2018 2019 2020 2021 2022-30
-25
-20
-15
-10
-5
0
5
10
15
20
25
30
35
40
45
50
-30
-25
-20
-15
-10
-5
0
5
10
15
20
25
30
35
40
45
50
07
08
10
11
12 13 14
15
18
19
20
21
09 16
17
yardeni.com
Source: I/B/E/S data by Refinitiv.
S&P 500 ANNUAL OPERATING EARNINGS GROWTH FORECASTS*(based on analysts’ consensus estimates, percent, weekly)
2007 (-2.9)2008 (-15.3)2009 (2.0)2010 (44.1)2011 (14.9)2012 (6.0)2013 (6.1)2014 (7.0)
2015 (0.5)2016 (1.5)2017 (11.2)2018 (23.8)2019 (1.4)2020 (-21.5)2021 (28.2)
Latest data thru 05/07/20
Figure 7.
S&P 500 Revenues & Earnings Growth
Page 4 / May 21, 2020 / Strategist’s Handbook: Chart Updates www.yardeni.com
Yardeni Research, Inc.
2007 2008 2009 2010 2011 2012 2013 2014 2015 2016 2017 2018 2019 2020 2021 2022900
1000
1100
1200
1300
1400
1500
1600
900
1000
1100
1200
1300
1400
1500
1600
20
21
19
Latest data thru 05/07/20yardeni.com
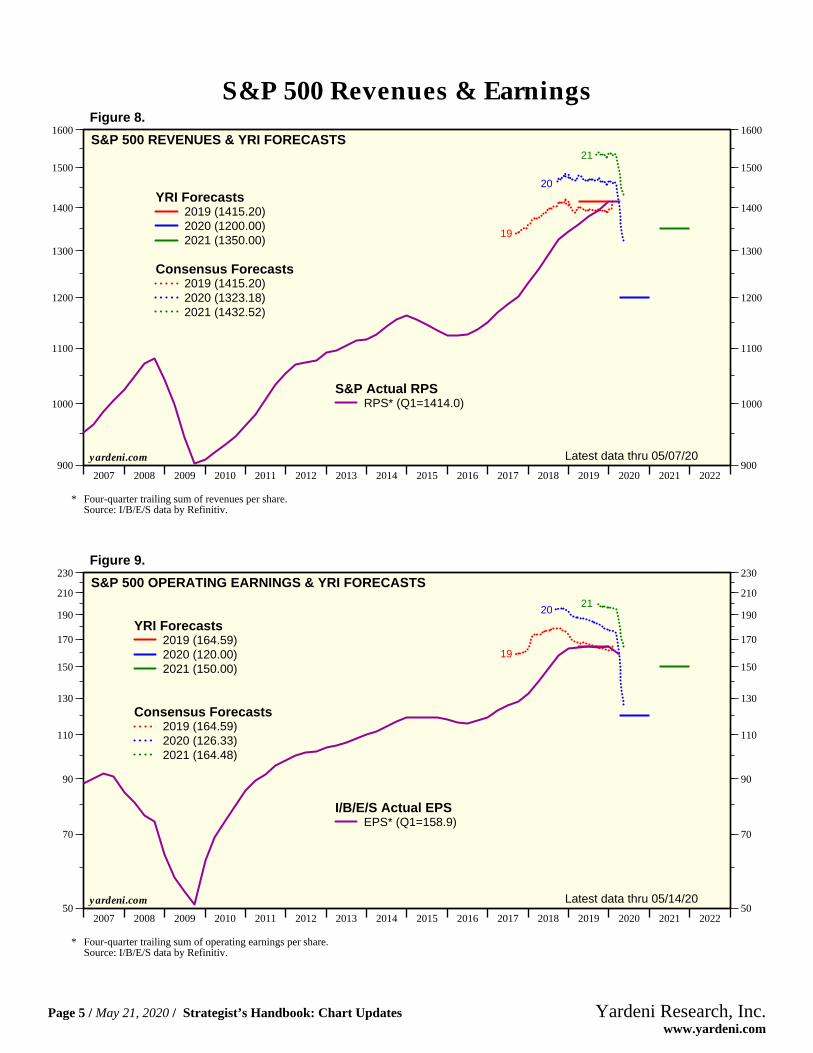
S&P 500 REVENUES & YRI FORECASTS
RPS* (Q1=1414.0)S&P Actual RPS
YRI Forecasts2019 (1415.20)2020 (1200.00)2021 (1350.00)
Consensus Forecasts2019 (1415.20)2020 (1323.18)2021 (1432.52)
* Four-quarter trailing sum of revenues per share.Source: I/B/E/S data by Refinitiv.
Figure 8.
2007 2008 2009 2010 2011 2012 2013 2014 2015 2016 2017 2018 2019 2020 2021 202250
70
90
110
130
150
170
190
210
230
50
70
90
110
130
150
170
190
210
230
2021
19
Latest data thru 05/14/20yardeni.com
S&P 500 OPERATING EARNINGS & YRI FORECASTS
EPS* (Q1=158.9)I/B/E/S Actual EPS
YRI Forecasts2019 (164.59)2020 (120.00)2021 (150.00)
Consensus Forecasts2019 (164.59)2020 (126.33)2021 (164.48)
* Four-quarter trailing sum of operating earnings per share.Source: I/B/E/S data by Refinitiv.
Figure 9.
S&P 500 Revenues & Earnings
Page 5 / May 21, 2020 / Strategist’s Handbook: Chart Updates www.yardeni.com
Yardeni Research, Inc.

Figure 10.
I II III IV I II III IV I II2019 2020 2021
-50
-40
-30
-20
-10
0
10
20
30
40
-50
-40
-30
-20
-10
0
10
20
30
40
COVID-19
Q1 Q2 Q3 Q4 May 7 -15.2 -40.8 -23.2 -11.6 May 14 -14.5 -42.4 -24.3 -12.7
Q1
S&P 500 CONSENSUS QUARTERLY Y/Y EPS GROWTH 2020(consensus analysts’ estimates in percent, weekly)
Q2
Q3
Q4
2020 By Quarter as of 05/14/20
I II III IV I II III IV I II2019 2020 2021
-80
-60
-40
-20
0
20
40
-80
-60
-40
-20
0
20
40
COVID-19
Q1 Q2 Q3 Q4 May 7 -20.3 -58.6 -26.9 -13.6 May 14 -24.9 -64.3 -30.4 -15.9
Q1
S&P 400
Q2
Q3
Q4
2020 By Quarter as of 05/14/20
I II III IV I II III IV I II2019 2020 2021
-100
-75
-50
-25
0
25
50
-100
-75
-50
-25
0
25
50
COVID-19
Q1 Q2 Q3 Q4 May 7 -45.6 -74.9 -33.6 -9.8 May 14 -54.3 -82.4 -37.3 -11.5
Q1
S&P 600
Q2
Q3
Q4
2020 By Quarter as of 05/14/20
Source: I/B/E/S data by Refinitiv.
yardeni.com
S&P 500/400/600 Quarterly Earnings Growth Rates
Page 6 / May 21, 2020 / Strategist’s Handbook: Chart Updates www.yardeni.com
Yardeni Research, Inc.
2003 2004 2005 2006 2007 2008 2009 2010 2011 2012 2013 2014 2015 2016 2017 2018 2019 2020 2021 202250
75
100
125
150
175
200
225
50
75
100
125
150
175
200
225
COVID-19
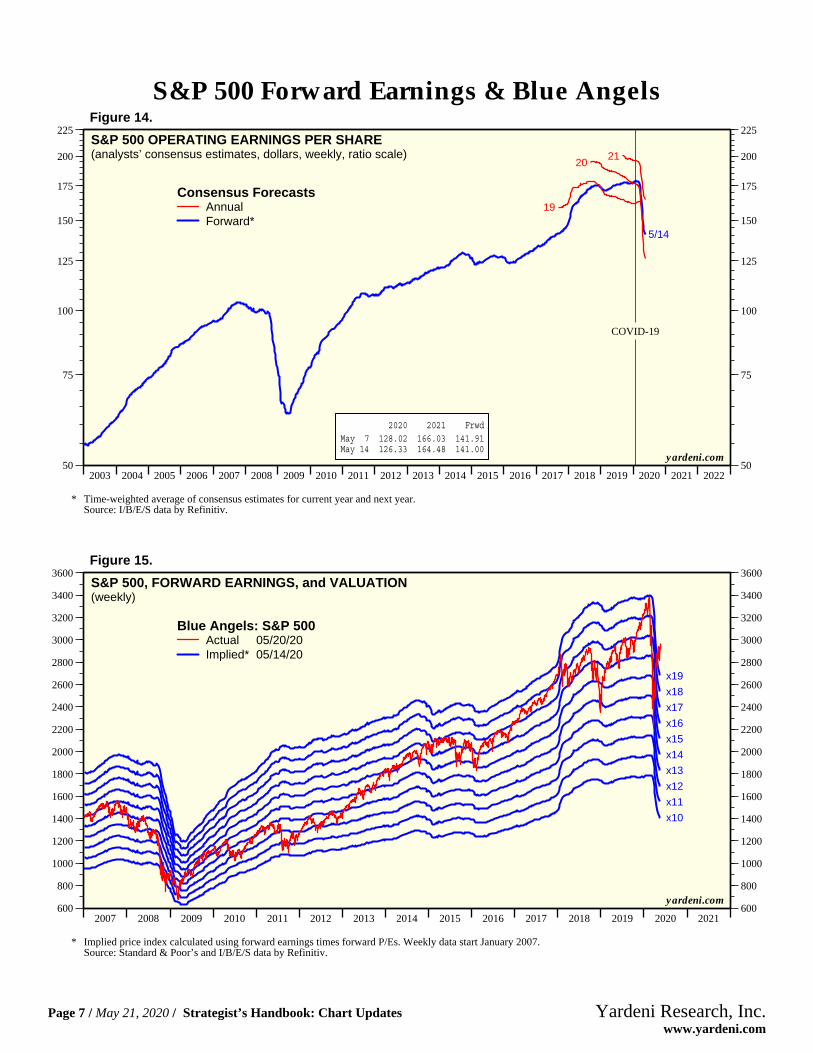
2020 2021 Frwd May 7 128.02 166.03 141.91 May 14 126.33 164.48 141.00
19
2021
5/14
S&P 500 OPERATING EARNINGS PER SHARE(analysts’ consensus estimates, dollars, weekly, ratio scale)
Consensus ForecastsAnnualForward*
* Time-weighted average of consensus estimates for current year and next year.Source: I/B/E/S data by Refinitiv.
yardeni.com
Figure 14.
2007 2008 2009 2010 2011 2012 2013 2014 2015 2016 2017 2018 2019 2020 2021600
800
1000
1200
1400
1600
1800
2000
2200
2400
2600
2800
3000
3200
3400
3600
600
800
1000
1200
1400
1600
1800
2000
2200
2400
2600
2800
3000
3200
3400
3600
x10
x11
x12
x13
x14
x15
x16
x17
x18
x19
S&P 500, FORWARD EARNINGS, and VALUATION(weekly)
Actual 05/20/20Implied* 05/14/20
* Implied price index calculated using forward earnings times forward P/Es. Weekly data start January 2007.
Blue Angels: S&P 500
Source: Standard & Poor’s and I/B/E/S data by Refinitiv.
yardeni.com
Figure 15.
S&P 500 Forward Earnings & Blue Angels
Page 7 / May 21, 2020 / Strategist’s Handbook: Chart Updates www.yardeni.com
Yardeni Research, Inc.
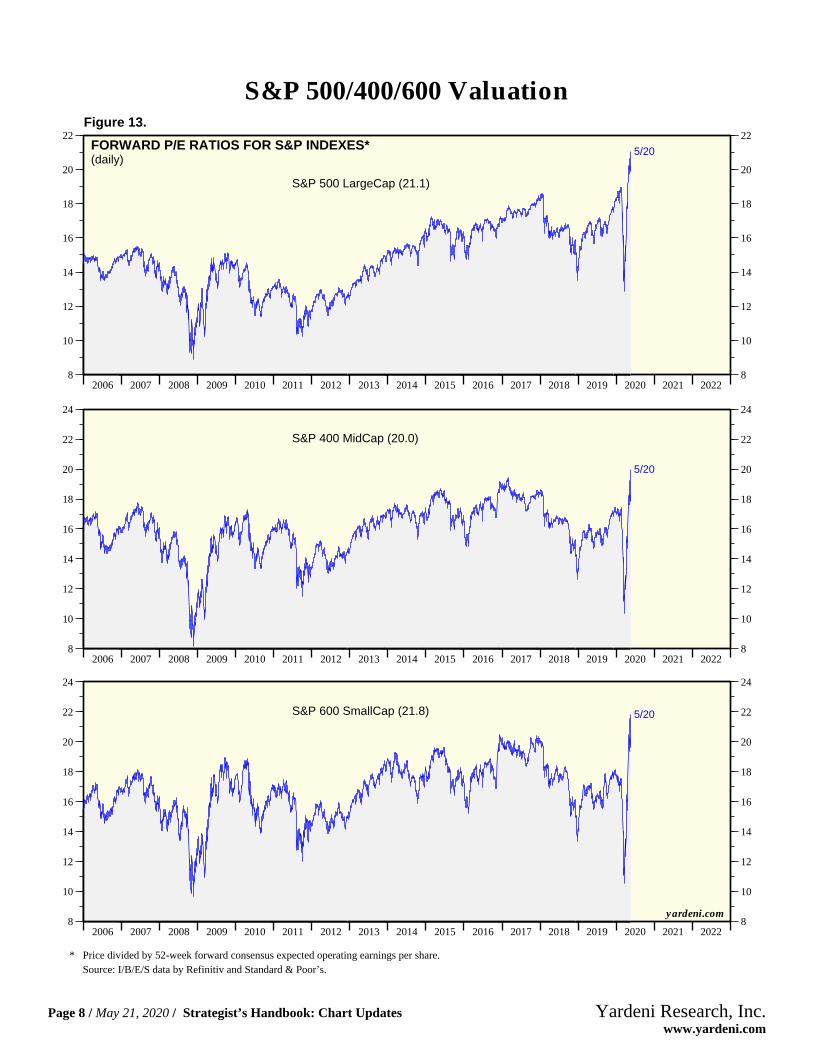
Figure 13.
2006 2007 2008 2009 2010 2011 2012 2013 2014 2015 2016 2017 2018 2019 2020 2021 20228
10
12
14
16
18
20
22
8
10
12
14
16
18
20
22
5/20FORWARD P/E RATIOS FOR S&P INDEXES*(daily)
S&P 500 LargeCap (21.1)
2006 2007 2008 2009 2010 2011 2012 2013 2014 2015 2016 2017 2018 2019 2020 2021 20228
10
12
14
16
18
20
22
24
8
10
12
14
16
18
20
22
24
5/20
S&P 400 MidCap (20.0)
2006 2007 2008 2009 2010 2011 2012 2013 2014 2015 2016 2017 2018 2019 2020 2021 20228
10
12
14
16
18
20
22
24
8
10
12
14
16
18
20
22
24
5/20S&P 600 SmallCap (21.8)
* Price divided by 52-week forward consensus expected operating earnings per share. Source: I/B/E/S data by Refinitiv and Standard & Poor’s.
yardeni.com
S&P 500/400/600 Valuation
Page 8 / May 21, 2020 / Strategist’s Handbook: Chart Updates www.yardeni.com
Yardeni Research, Inc.

97 98 99 00 01 02 03 04 05 06 07 08 09 10 11 12 13 14 15 16 17 18 19 20 21 22 233
4
5
6
7
8
9
10
11
12
3
4
5
6
7
8
9
10
11
12
5/20
5/20
STYLE RATIOS: US MSCI DIVIDED BY ALL COUNTRY WORLD EX US MSCI(daily)
US MSCI / ACW ex-USIn dollarsIn local currencies
Source: MSCI.
yardeni.com
Figure 14.
2006 2007 2008 2009 2010 2011 2012 2013 2014 2015 2016 2017 2018 2019 2020 2021 20225
10
15
20
25
5
10
15
20
25
5/7
MSCI FORWARD P/E(weekly)
Forward P/E*
EMU (14.9)Emerging Markets (12.2)
US (20.3)
Japan (13.6)UK (13.8)
Capped at 20
yardeni.com
* Price divided by 12-month forward consensus expected operating earnings per share.Source: I/B/E/S data by Refinitiv.
Figure 15.
Investment Styles: Stay Home vs Go Global
Page 9 / May 21, 2020 / Strategist’s Handbook: Chart Updates www.yardeni.com
Yardeni Research, Inc.

.2
.3
.4
.5
.6
.7
.8
.2
.3
.4
.5
.6
.7
.8
5/19
1999 2000 2001 2002 2003 2004 2005 2006 2007 2008 2009 2010 2011 2012 2013 2014 2015 2016 2017 2018 2019 2020 2021 2022.1
.2
.3
.4
.1
.2
.3
.4
5/19
S&P 600 DIVIDED BY S&P 500(daily)
STYLE RATIOS: S&P 400 DIVIDED BY S&P 500(daily)
Source: Standard & Poor’s.
yardeni.com
Figure 16.
1999 2000 2001 2002 2003 2004 2005 2006 2007 2008 2009 2010 2011 2012 2013 2014 2015 2016 2017 2018 2019 2020 2021 202210
40
70
100
130
160
190
10
40
70
100
130
160
190
5/14
S&P 500/400/600 FORWARD EARNINGS(dollars per share, ratio scale)
Forward Earnings*S&P 500 LargeCap (141.00)S&P 400 MidCap (84.40)S&P 600 SmallCap (35.30)
* Time-weighted average of consensus estimates for current year and next year.Source: I/B/E/S data by Refinitiv.
yardeni.com
Figure 17.
Investment Styles: LargeCaps vs SMidCaps
Page 10 / May 21, 2020 / Strategist’s Handbook: Chart Updates www.yardeni.com
Yardeni Research, Inc.

95 96 97 98 99 00 01 02 03 04 05 06 07 08 09 10 11 12 13 14 15 16 17 18 19 20 21 22.8
.9
1.0
1.1
1.2
1.3
1.4
1.5
1.6
1.7
1.8
1.9
2.0
.8
.9
1.0
1.1
1.2
1.3
1.4
1.5
1.6
1.7
1.8
1.9
2.0
5/20
STYLE RATIO: S&P 500 GROWTH DIVIDED BY VALUE(daily)
yardeni.com
Source: Standard & Poor’s and Haver Analytics.
Figure 18.
95 96 97 98 99 00 01 02 03 04 05 06 07 08 09 10 11 12 13 14 15 16 17 18 19 20 21 225
10
15
20
25
30
35
40
45
5
10
15
20
25
30
35
40
45
5/20
FORWARD P/E RATIOS FOR S&P 500 GROWTH & VALUE*(daily)
Growth (25.9)Value (16.5)
* Price divided by 12-month (52-week) forward consensus expected operating earnings per share. Monthly data through December 2005, then daily.Source: I/B/E/S data by Refinitiv.
yardeni.com
Figure 19.
Investment Styles: Growth vs Value
Page 11 / May 21, 2020 / Strategist’s Handbook: Chart Updates www.yardeni.com
Yardeni Research, Inc.

2005 2006 2007 2008 2009 2010 2011 2012 2013 2014 2015 2016 2017 2018 2019 2020 2021 2022-1.5
-1.0
-.5
.0
.5
1.0
1.5
2.0
2.5
3.0
3.5
4.0
4.5
5.0
5.5
6.0
-1.5
-1.0
-.5
.0
.5
1.0
1.5
2.0
2.5
3.0
3.5
4.0
4.5
5.0
5.5
6.0
5/20
5/20
5/20
10-YEAR GOVERNMENT BOND YIELDS(percent)
10-Year YieldsGermany (-0.47)Japan (0.01)US (0.68)
Source: Haver Analytics.
yardeni.com
Figure 20.
2007 2008 2009 2010 2011 2012 2013 2014 2015 2016 2017 2018 2019 2020 2021 2022.0
.5
1.0
1.5
2.0
2.5
3.0
3.5
4.0
4.5
5.0
5.5
6.0
.0
.5
1.0
1.5
2.0
2.5
3.0
3.5
4.0
4.5
5.0
5.5
6.0
5/20
10-YEAR US TREASURY BOND YIELD(percent, daily)
Yield (0.68)
yardeni.com
Source: Federal Reserve Board.
Figure 21.
Bond Yields
Page 12 / May 21, 2020 / Strategist’s Handbook: Chart Updates www.yardeni.com
Yardeni Research, Inc.

62 64 66 68 70 72 74 76 78 80 82 84 86 88 90 92 94 96 98 00 02 04 06 08 10 12 14 16 18 20 22 24-800
-700
-600
-500
-400
-300
-200
-100
0
100
200
300
400
500
600
700
800
-800
-700
-600
-500
-400
-300
-200
-100
0
100
200
300
400
500
600
700
800
1970Penn
Central
1974FranklinNational
1980SilverBubble
1982Drysdale& Mexico
1984Continental
Illinois
1987Black
Monday
1990S&LCrisis
1994Mexican
Peso
1997Pacific
Rim
1998Russia& LTCM
2000Tech
Bubble
20019/11
Attacks 2007SubprimeMeltdown
2008Lehman & AIG
US YIELD CURVE* & FINANCIAL CRISES(basis points, weekly)
5/15
* 10-year US Treasury yield less federal funds rate.Note: Blue shaded areas denote periods of monetary easing between cyclical peaks and troughs in the federal funds rate. Red shaded areas denotemonetary tightening periods.Source: Federal Reserve Board.
yardeni.com
Figure 22.
97 98 99 00 01 02 03 04 05 06 07 08 09 10 11 12 13 14 15 16 17 18 19 20 21 22200
400
600
800
1000
1200
1400
1600
1800
2000
2200
2400
200
400
600
800
1000
1200
1400
1600
1800
2000
2200
2400
YIELD SPREAD US HIGH-YIELD CORPORATE LESS 10-YEAR US TREASURY BONDS(basis points, daily)
5/20
Spread (688)
Note: Shaded areas denote recessions according to the National Bureau of Economic Research.Source: Bank of America Merrill Lynch and Federal Reserve Board.
yard
eni.c
om
Figure 23.
Bond Yield Spreads
Page 13 / May 21, 2020 / Strategist’s Handbook: Chart Updates www.yardeni.com
Yardeni Research, Inc.

94 95 96 97 98 99 00 01 02 03 04 05 06 07 08 09 10 11 12 13 14 15 16 17 18 19 20 21 2280
90
100
110
120
130
140
100
200
300
400
500
600
700
800
900
1000
5/20
5/20
S&P GOLDMAN SACHS COMMODITY INDEX & TRADE-WEIGHTED DOLLAR(daily)
Goldman SachsCommodity Index(nearby futures price)
JP Morgan NominalBroad EffectiveExchange Rate*
Source: Standard & Poor’s, JP Morgan, and Haver Analytics.
yardeni.com
Figure 24.
2004 2005 2006 2007 2008 2009 2010 2011 2012 2013 2014 2015 2016 2017 2018 2019 2020 2021 2022100
200
300
400
500
300
350
400
450
500
550
600
650
700
5/20
INDUSTRIALS COMMODITY PRICE INDEX & COPPER FUTURES PRICE
Copper Futures Price**(cents per pound)
CRB Raw IndustrialsSpot Price Index*(1967=100)
* Includes copper scrap, lead scrap, steel scrap, tin, zinc, burlap, cotton, print cloth, wool tops, hides, rosin, rubber, and tallow.** Nearby futures contract.
Source: Commodity Research Bureau and Haver Analytics.
yardeni.com
Figure 25.
Dollar & Commodities
Page 14 / May 21, 2020 / Strategist’s Handbook: Chart Updates www.yardeni.com
Yardeni Research, Inc.
90 91 92 93 94 95 96 97 98 99 00 01 02 03 04 05 06 07 08 09 10 11 12 13 14 15 16 17 18 19 20 21 22-1.5
-1.0
-.5
.0
.5
1.0
1.5
2.0
2.5
3.0
3.5
4.0
4.5
5.0
5.5
6.0
6.5
7.0
-1.5
-1.0
-.5
.0
.5
1.0
1.5
2.0
2.5
3.0
3.5
4.0
4.5
5.0
5.5
6.0
6.5
7.0
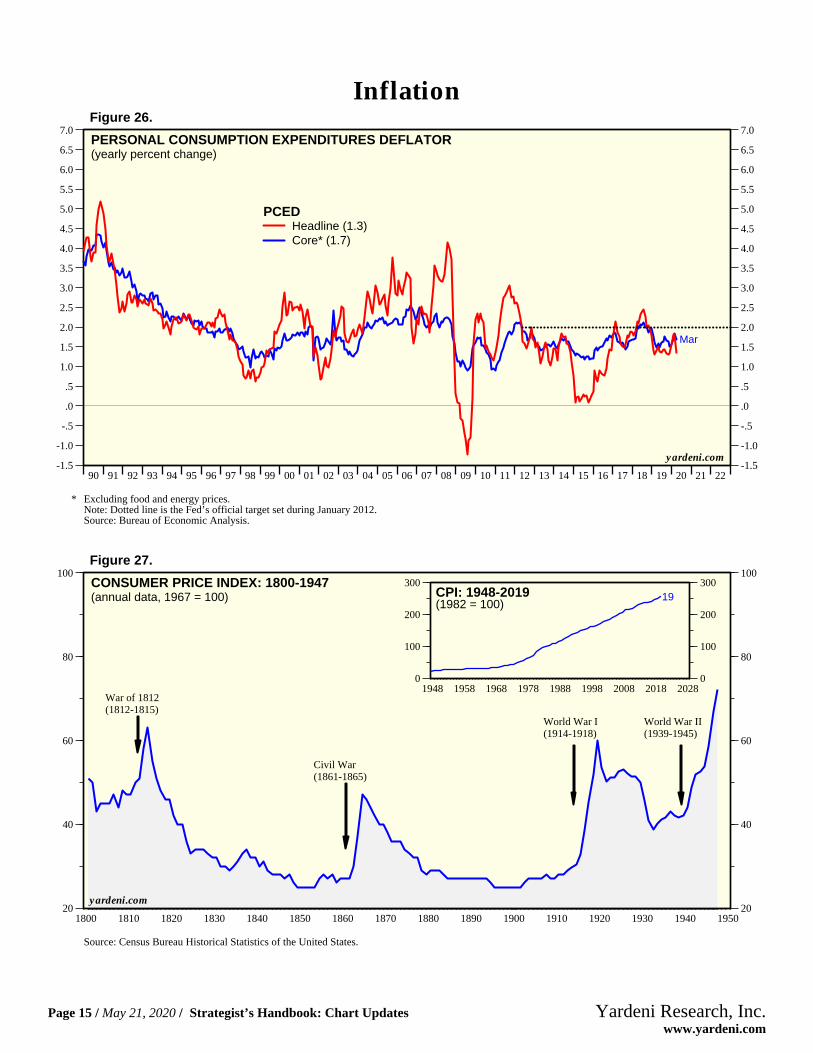
Mar
PERSONAL CONSUMPTION EXPENDITURES DEFLATOR(yearly percent change)
PCEDHeadline (1.3)Core* (1.7)
* Excluding food and energy prices.Note: Dotted line is the Fed’s official target set during January 2012.Source: Bureau of Economic Analysis.
yardeni.com
Figure 26.
1800 1810 1820 1830 1840 1850 1860 1870 1880 1890 1900 1910 1920 1930 1940 195020
40
60
80
100
20
40
60
80
100CONSUMER PRICE INDEX: 1800-1947(annual data, 1967 = 100)
War of 1812(1812-1815)
Civil War(1861-1865)
World War I(1914-1918)
World War II(1939-1945)
Source: Census Bureau Historical Statistics of the United States.
yardeni.com
1948 1958 1968 1978 1988 1998 2008 2018 20280
100
200
300
0
100
200
30019CPI: 1948-2019
(1982 = 100)
Figure 27.
Inflation
Page 15 / May 21, 2020 / Strategist’s Handbook: Chart Updates www.yardeni.com
Yardeni Research, Inc.

59 61 63 65 67 69 71 73 75 77 79 81 83 85 87 89 91 93 95 97 99 01 03 05 07 09 11 13 15 17 19 21 2325
35
45
55
65
75
85
95
105
115
125
25
35
45
55
65
75
85
95
105
115
125
68 Months1/08-10/1333 Months
2/01-11/03
23 Months7/90-6/92
25 Months8/81-9/83
32 Months11/73-7/76
19 Months10/69-5/71
30 Months5/71-11/73
61 Months7/76-8/81
82 Months9/83-7/90
104 Months6/92-2/01
50 Months11/03-1/08
Mar
COINCIDENT ECONOMIC INDICATORS: RECOVERIES & EXPANSIONS*(2016=100, sa, ratio scale)
* Red horizontal lines span cyclical peaks through subsequent cyclical recoveries. Green horizontal lines are expansion periods following recoveries.Source: Conference Board, Haver Analytics, and YRI calculations.
yardeni.com
Figure 28.
48 50 52 54 56 58 60 62 64 66 68 70 72 74 76 78 80 82 84 86 88 90 92 94 96 98 00 02 04 06 08 10 12 14 16 18 20 22 2410
30
50
70
90
110
130
150
10
30
50
70
90
110
130
150
CMANUFACTURING PRODUCTION & CAPACITY
(2012 = 100, ratio scale)
Apr
Apr
ManufacturingProductionCapacity
yardeni.com
Note: C = China joined WTO on December 11, 2001. Shaded areas denote recessions according to the National Bureau of Economic Research.Source: Federal Reserve Board.
Figure 29.
US Economy
Page 16 / May 21, 2020 / Strategist’s Handbook: Chart Updates www.yardeni.com
Yardeni Research, Inc.
2008 2009 2010 2011 2012 2013 2014 2015 2016 2017 2018 2019 2020 2021 2022.4
.8
1.2
1.6
2.0
2.4
2.8
3.2
3.6
4.0
4.4
4.8
5.2
5.6
6.0
6.4
6.8
7.2
.4
.8
1.2
1.6
2.0
2.4
2.8
3.2
3.6
4.0
4.4
4.8
5.2
5.6
6.0
6.4
6.8
7.2
QE1
QE1+
QE2 QE3
QE3+ QT RM
QE4
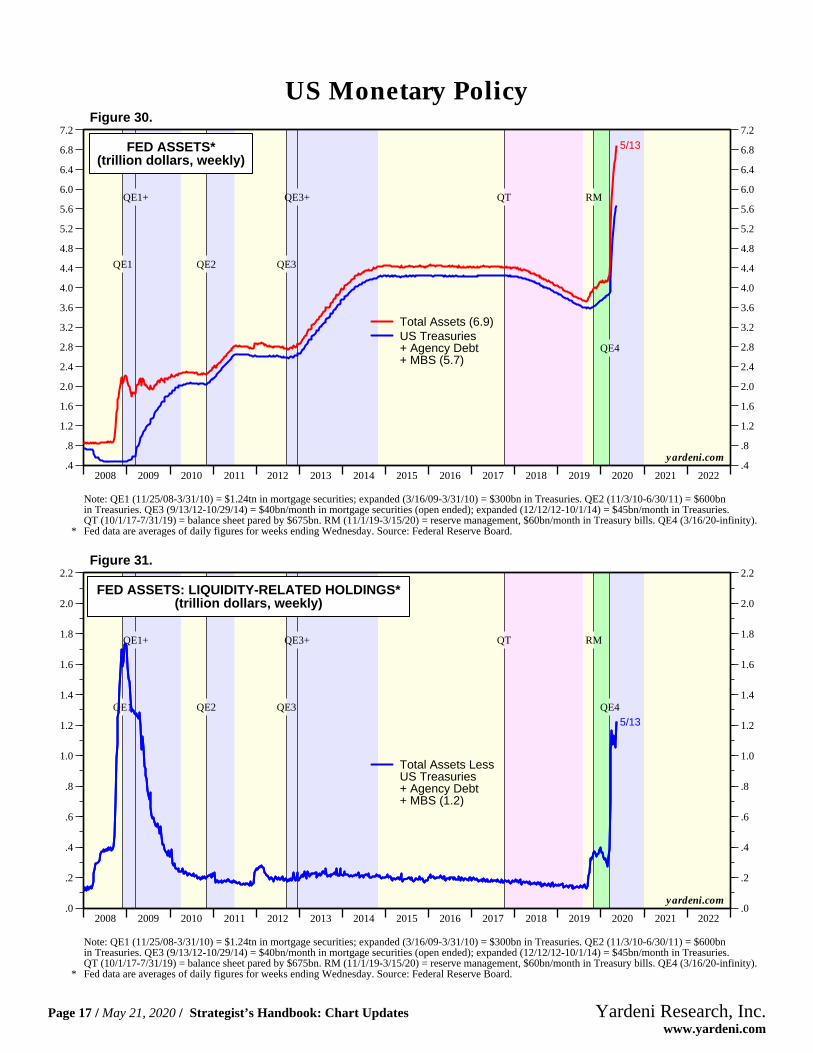
FED ASSETS*(trillion dollars, weekly)
5/13
Total Assets (6.9)US Treasuries+ Agency Debt+ MBS (5.7)
Note: QE1 (11/25/08-3/31/10) = $1.24tn in mortgage securities; expanded (3/16/09-3/31/10) = $300bn in Treasuries. QE2 (11/3/10-6/30/11) = $600bnin Treasuries. QE3 (9/13/12-10/29/14) = $40bn/month in mortgage securities (open ended); expanded (12/12/12-10/1/14) = $45bn/month in Treasuries.QT (10/1/17-7/31/19) = balance sheet pared by $675bn. RM (11/1/19-3/15/20) = reserve management, $60bn/month in Treasury bills. QE4 (3/16/20-infinity).
* Fed data are averages of daily figures for weeks ending Wednesday. Source: Federal Reserve Board.
yardeni.com
Figure 30.
2008 2009 2010 2011 2012 2013 2014 2015 2016 2017 2018 2019 2020 2021 2022.0
.2
.4
.6
.8
1.0
1.2
1.4
1.6
1.8
2.0
2.2
.0
.2
.4
.6
.8
1.0
1.2
1.4
1.6
1.8
2.0
2.2
QE1
QE1+
QE2 QE3
QE3+ QT RM
QE4
FED ASSETS: LIQUIDITY-RELATED HOLDINGS*(trillion dollars, weekly)
5/13
Total Assets LessUS Treasuries+ Agency Debt+ MBS (1.2)
Note: QE1 (11/25/08-3/31/10) = $1.24tn in mortgage securities; expanded (3/16/09-3/31/10) = $300bn in Treasuries. QE2 (11/3/10-6/30/11) = $600bnin Treasuries. QE3 (9/13/12-10/29/14) = $40bn/month in mortgage securities (open ended); expanded (12/12/12-10/1/14) = $45bn/month in Treasuries.QT (10/1/17-7/31/19) = balance sheet pared by $675bn. RM (11/1/19-3/15/20) = reserve management, $60bn/month in Treasury bills. QE4 (3/16/20-infinity).
* Fed data are averages of daily figures for weeks ending Wednesday. Source: Federal Reserve Board.
yardeni.com
Figure 31.
US Monetary Policy
Page 17 / May 21, 2020 / Strategist’s Handbook: Chart Updates www.yardeni.com
Yardeni Research, Inc.

86 87 88 89 90 91 92 93 94 95 96 97 98 99 00 01 02 03 04 05 06 07 08 09 10 11 12 13 14 15 16 17 18 19 20 21 22-2200
-2000
-1800
-1600
-1400
-1200
-1000
-800
-600
-400
-200
0
200
400
600
800
-2200
-2000
-1800
-1600
-1400
-1200
-1000
-800
-600
-400
-200
0
200
400
600
800
US FEDERAL GOVERNMENT BUDGET BALANCE(billion dollars, 12-month sum)
Apr
Note: Shaded areas denote recessions according to the National Bureau of Economic Research.Source: US Treasury Department.
yardeni.com
Figure 32.
86 87 88 89 90 91 92 93 94 95 96 97 98 99 00 01 02 03 04 05 06 07 08 09 10 11 12 13 14 15 16 17 18 19 20 21 22.7
1.1
1.5
1.9
2.3
2.7
3.1
3.5
3.9
4.34.75.15.55.9
.7
1.1
1.5
1.9
2.3
2.7
3.1
3.5
3.9
4.34.75.15.55.9
US FEDERAL GOVERNMENT OUTLAYS & RECEIPTS(trillion dollars, 12-month sum, ratio scale)
Apr
Apr
Outlays (5.2)Receipts (3.3)
Note: Shaded areas denote recessions according to the National Bureau of Economic Research.Source: US Treasury Department.
yardeni.com
Figure 33.
US Fiscal Policy
Page 18 / May 21, 2020 / Strategist’s Handbook: Chart Updates www.yardeni.com
Yardeni Research, Inc.

1998 1999 2000 2001 2002 2003 2004 2005 2006 2007 2008 2009 2010 2011 2012 2013 2014 2015 2016 2017 2018 2019 2020 2021 2022-30
-25
-20
-15
-10
-5
0
5
10
15
20
25
-30
-25
-20
-15
-10
-5
0
5
10
15
20
25CHINA RETAIL SALES & CPI(yearly percent change)
CPI (Apr=3.3)Retail Sales (Apr=-7.5)
Real Retail Sales* (Apr=-10.8)
* Yearly percent change in retail sales minus yearly percent change in CPI.Source: China National Bureau of Statistics.
yardeni.com
Figure 34.
2000 2001 2002 2003 2004 2005 2006 2007 2008 2009 2010 2011 2012 2013 2014 2015 2016 2017 2018 2019 2020 20210
5
10
15
20
25
30
35
0
5
10
15
20
25
30
35
Apr
Apr
Apr
BANK LOANS & MONEY SUPPLY(trillion US dollars)
China: Bank Loans (nsa) (22.9)US: Bank Loans (sa) (10.8)China: M2 (29.6)
Source: Federal Reserve Board and People’s Bank of China.
yardeni.com
Figure 35.
China
Page 19 / May 21, 2020 / Strategist’s Handbook: Chart Updates www.yardeni.com
Yardeni Research, Inc.

2000 2001 2002 2003 2004 2005 2006 2007 2008 2009 2010 2011 2012 2013 2014 2015 2016 2017 2018 2019 2020 2021 2022-8
-6
-4
-2
0
2
4
6
60
70
80
90
100
110
120
130
Apr
Q1
EUROZONE: ECONOMIC SENTIMENT INDICATOR* & REAL GDP
Real GDP(yearly percent change) (-3.2)
Economic Sentiment Indicator*(long-term average=100, sa) (67.0)
* The overall economic sentiment indicator (ESI) is derived from the industrial (weight 40%), service (30%), consumer (20%), construction (5%), andretail trade (5%) confidence indicators.Source: Statistical Office of the European Communities, European Commission, and Haver Analytics.
yardeni.com
Figure 36.
2005 2006 2007 2008 2009 2010 2011 2012 2013 2014 2015 2016 2017 2018 2019 2020 2021 202260
70
80
90
100
110
60
70
80
90
100
110
Apr
GERMANY: IFO BUSINESS CONFIDENCE INDEX*(2015=100, sa)
German Ifo IndexTotal (74.3)Current Situation (79.5)Expectations (69.4)
* Ifo introduced new series, which include services for the first time, drastically reducing the weight of the manufacturing sector within the measures.Source: Ifo-Institut Fur Wirtschaftsforschung.
yardeni.com
Figure 37.
Eurozone
Page 20 / May 21, 2020 / Strategist’s Handbook: Chart Updates www.yardeni.com
Yardeni Research, Inc.

1955 1965 1975 1985 1995 2005 2015 2025 2035 2045 2055 2065 2075 2085 20951
2
3
4
5
6
7
8
1
2
3
4
5
6
7
8FERTILITY RATES*(children per woman)
2019 Values 2095 ValuesWorld (2.5) (2.0)US (1.8) (1.8)Europe (1.6) (1.8)Africa (4.5) (2.2)Latin Am** (2.1) (1.7)China (1.7) (1.8)India (2.3) (1.7)
Source: United Nations.
* Estimates through 2019 (solid line). Projections 2020 through 2095 (dotted line).** Including the Caribbean.
yardeni.com
Figure 38.
1955 1965 1975 1985 1995 2005 2015 2025 2035 2045 2055 2065 2075 2085 20950
5
10
15
20
25
0
5
10
15
20
25WORLD: ELDERLY DEPENDENCY RATIO & PROJECTIONS(number of workers per senior)
2019 Values 2095 ValuesWorld (7.2) (2.7)US (4.0) (2.1)Europe (3.5) (1.8)Africa (16.1) (5.0)Latin Am** (7.7) (1.8)China (6.2) (1.7)India (10.5) (2.3)
* Estimates through 2019 (solid line). Projections 2020 through 2095 (dotted line).** Including the Caribbean.
Source: United Nations.
yardeni.com
Figure 39.
Global Demography
Page 21 / May 21, 2020 / Strategist’s Handbook: Chart Updates www.yardeni.com
Yardeni Research, Inc.

http://blog.yardeni.com
http://blog.yardeni.com
Copyright (c) Yardeni Research, Inc. 2020. All rights reserved. The informationcontained herein has been obtained from sources believed to be reliable, but is notnecessarily complete and its accuracy cannot be guaranteed. No representation orwarranty, express or implied, is made as to the fairness, accuracy, completeness, orcorrectness of the information and opinions contained herein. The views and the otherinformation provided are subject to change without notice. All reports and podcasts posted onwww.yardeni.com, blog.yardeni.com, and YRI’s Apps are issuedwithout regard to the specific investment objectives, financial situation, or particular needsof any specific recipient and are not to be construed as a solicitation or an offer to buy or sellany securities or related financial instruments. Past performance is not necessarily a guideto future results. Company fundamentals and earnings may be mentioned occasionally, butshould not be construed as a recommendation to buy, sell, or hold the company’s stock.Predictions, forecasts, and estimates for any and all markets should not be construed asrecommendations to buy, sell, or hold any security--including mutual funds, futurescontracts, and exchange traded funds, or any similar instruments.
The text, images, and other materials contained or displayed on any Yardeni Research, Inc.product, service, report, email or website are proprietary to Yardeni Research, Inc. andconstitute valuable intellectual property. No material from any part of www.yardeni.com, blog.yardeni.com, and YRI’s Apps may be downloaded, transmitted,broadcast, transferred, assigned, reproduced or in any other way used or otherwisedisseminated in any form to any person or entity, without the explicit written consent ofYardeni Research, Inc. All unauthorized reproduction or other use of material from YardeniResearch, Inc. shall be deemed willful infringement(s) of this copyright and other proprietaryand intellectual property rights, including but not limited to, rights of privacy. YardeniResearch, Inc. expressly reserves all rights in connection with its intellectual property,including without limitation the right to block the transfer of its products and services and/orto track usage thereof, through electronic tracking technology, and all other lawful means,now known or hereafter devised. Yardeni Research, Inc. reserves the right, without furthernotice, to pursue to the fullest extent allowed by the law any and all criminal and civilremedies for the violation of its rights.
The recipient should check any email and any attachments for the presence of viruses.Yardeni Research, Inc. accepts no liability for any damage caused by any virus transmittedby this company’s emails, website, blog and Apps. Additional information available onrequest.