strategy and financials - gerry...
TRANSCRIPT

1
Strategy and FinancialsJune 2013

2
„What we stand for:“
growing business
high brand awareness
middle price segment
modern and trend oriented
fashion
perfect fit
high quality standards

3
Agenda
(1) Unique Business Model Page 4(2) Key Financials Page 15(3) GERRY WEBER Share Page 21(4) Outlook Page 23(5) Appendix Page 25

4
GERRY WEBER an Overview
1973 Company established by Gerhard Weber and Udo Hardieck
1986 Brand name GERRY WEBER introduced
1989 Foundation of TAIFUN
1989 Going Public as GERRY WEBER International AG
1994 Foundation of SAMOON
1999 Opening of the first HOUSE OF GERRY WEBER
2001 Sublabel GERRY WEBER EDITION established
2003 Sublabel G.W. established
2011 New Design Centre in Halle, Listing in M-Dax
2011 Acquisition of 20 former DON GIL stores in Austria
2012 Acquisition of 200 former WISSMACH stores and conversion into GERRY WEBER brand stores
HISTORY
Business
Global German fashion and lifestyle company with five strong brands:GERRY WEBERGERRY WEBER EditionG.W.TAIFUNSAMOON
Retail532 own Houses of GERRY WEBER and MonolabelStores as well as some 70 concessions stores. Three own online shops. (May 2013)
WholesaleMore than 286 Franchise Houses of GERRY WEBER and round about 2,840 Shop-in-Shops. (May 2013)
Financials
2011/12Revenues: EUR 802.3 mnEBIT Margin: 14.5% Net income: EUR 78.8 mnEPS: EUR 1,72
COMPANY PROFILE
BoardGerhard Weber (CEO)Doris SträtkerDr. David FrinkShare
Stable share price development in the last two years.Dividend payment 2013: EUR 0.75 per share

5
Unique Business Model
Production
DesignOperational Excellence
Market PositioningDistribution
Brand Universe
- five strong brands- unique brand positioning
- unique market positioning- well established customer
base with a considerably high purchasing power
- own cutting and sewing department which give us sovereignty about our own cuts
- high standards and flexibility in the selection of production
companies
- standardized processes to open new stores
- highest and most cost effective IT standards
- strong and growing own retail business
- preferred partner of wholesale

6
GERRY WEBER Brand Universe
Modern, high quality, feminine. Most of the items can be combined with each other
Customer target group starting at mid thirties
Fresh and more casual
Coordinated single items
EDITION offers the possibility for systems business in the competence departments
Most trend oriented collection
Shortest development and production cycle
Full vertical integration. Most price sensitive brand
12-month programmes
Young Modern Woman Fashion
Trendy and stylish, tailored silhouettes, slim cuts – casual and business items
Targeting younger “modern woman” starting at beginning of thirties
Plus size collection
Femininity underlined by trendy cuts, high-quality materials, excellent fitsPerfect
interpretations of current trends, put curves in the right light
Modern Women Fashion
7
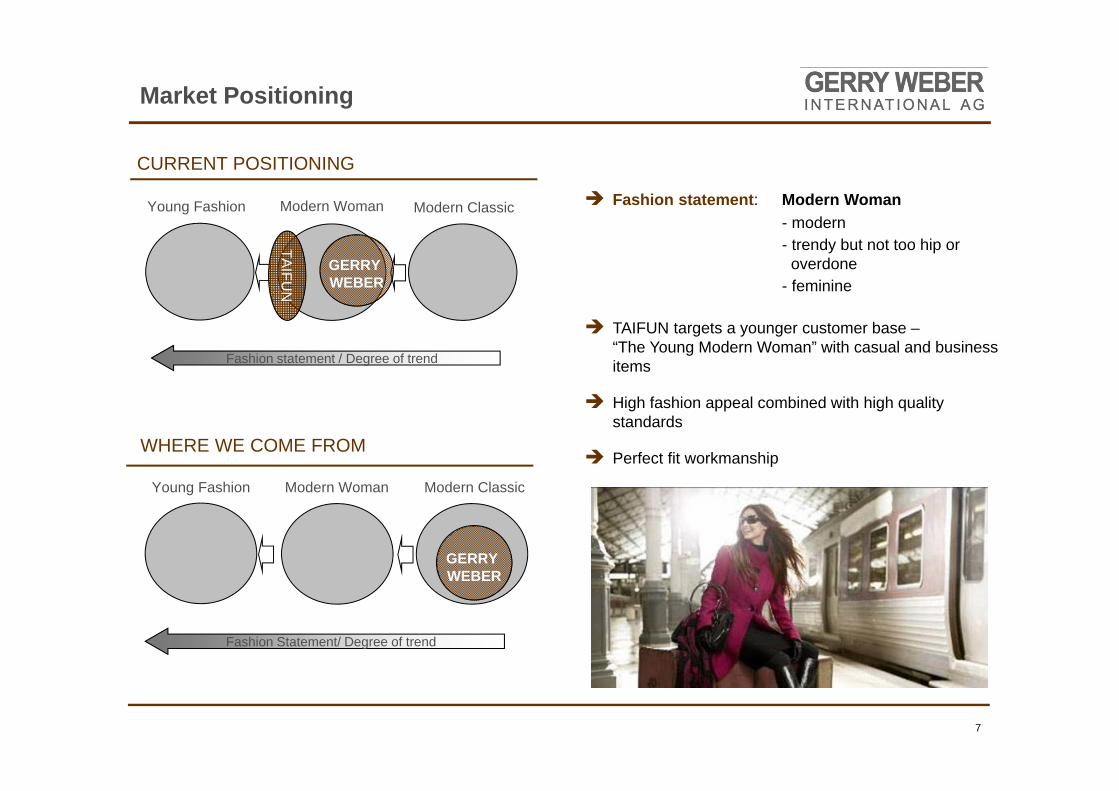
CURRENT POSITIONING
WHERE WE COME FROM
Fashion Statement/ Degree of trend
GERRY WEBER
Modern ClassicModern WomanYoung Fashion
Fashion statement / Degree of trend
GERRY WEBER
TAIFU
N
Modern ClassicModern WomanYoung Fashion Fashion statement: Modern Woman- modern- trendy but not too hip or
overdone- feminine
TAIFUN targets a younger customer base –“The Young Modern Woman” with casual and business items
High fashion appeal combined with high quality standards
Perfect fit workmanship
Market Positioning

8
Market Positioning
Bridge segment between the middle price segment and the premium segment
Unique market positioning
Look like premium with similar quality but lower price
Loyal customer base with higher income level
SEGMENT AND PRICE POSITIONING
Classic Modern Women Young Fashion
FASHION STATEMENT
PRIC
E LE
VEL
Low
Mid
dle
Pre
miu
m /
Luxu
ry
Hugo Boss Max Mara
Gucci PradaMarc Jacobs
H&MAdlerZARA Mango
BananaRepublic
Basler
Jil Sander
Classic Modern Women Young Fashion
FASHION STATEMENT
PRIC
E LE
VEL
Low
Mid
dle
Pre
miu
m /
Luxu
ry
Hugo Boss Max Mara
PradaMarc Jacobs
Ralph Lauren
H&MAdler
Tom Tailor Banana
Republic
EspritBonita
Jil SanderTom Ford
Escada
Armani
Talbot
Anne Taylor

9
Operational Excellence
RFID –RADIO FREQUENCE INFORMATION TECHNOLOGY
Six collections per year and brand (except G.W.); three spring/summer and three autumn/winter collections
The collections comprise three themes, each consists of about 30 – 35 single items
COLLECTIONS
micro chip
radio antenna
New items are delivered to the shops and stores almost every two to three weeks
Since mid of 2010 RFID tags are sewed in all single items directly at the production stage
Combination of the fabric care label, the goods tracking functionality and the electronic product code directly into the product
GERRY WEBER is the first manufacturer to use sewed-in RFID tags to use RFID for product tracking to support the full textile chain from production
to the POS with RFID to use RFID tags as retail security system

10
GERRY WEBER Distribution
RETAIL
Own Retail Stores
Houses of GERRY WEBER
Monolabel Stores
Concessions
Shop-in-Shop systems
managed by GERRY WEBER
Factory Outlets
National andinternational
special sales areas
E-commerce/ Online shops
Online Shopnationally or internationally
integrated
WHOLESALE
Franchise
FranchisedHouses of
GERRY WEBER
Trusted Wholesale CustomersWholesale customers transfer the order process
to GERRY WEBER
Shop-in-Shop
Branded Shop-in-Shops,
which are Managed by our
wholesale partners
Multi Label
Stores where several labels are presented simultaneously; noseparate branding
DISTRIBUTION CHANNELS
Wholesale 58,8 %
Retail41,2 %
11
GERRY WEBER Retail
RETAIL BUSINESS
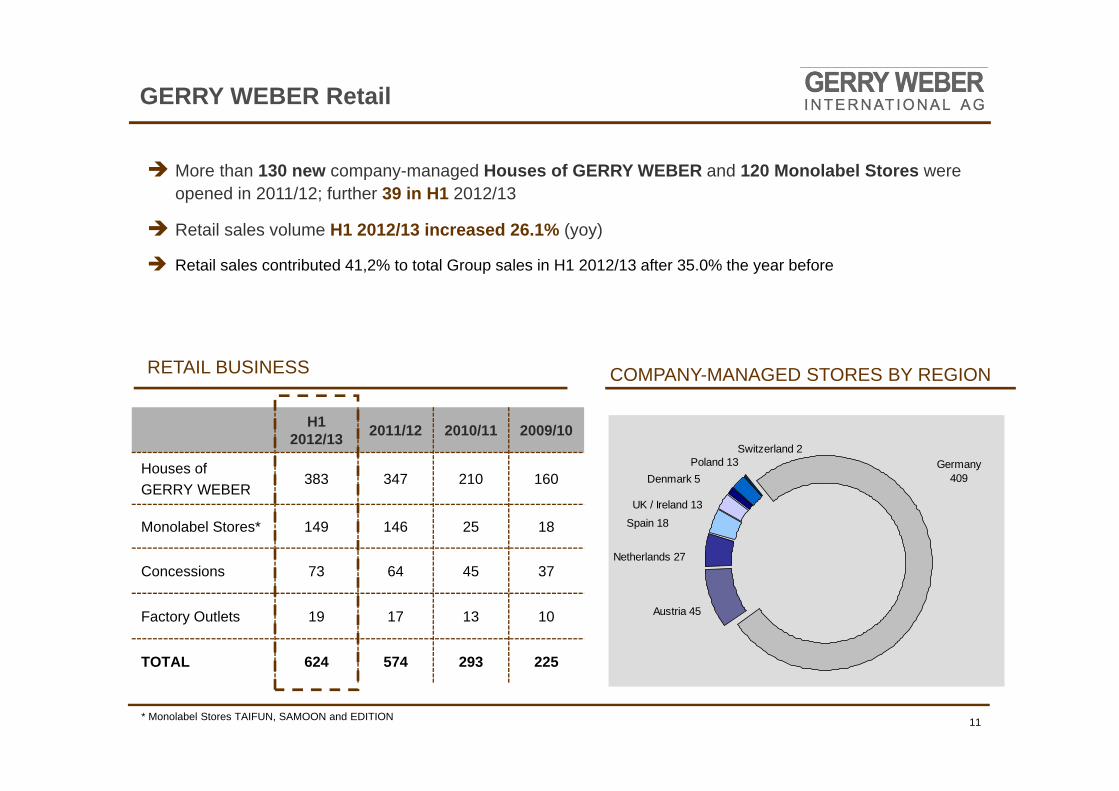
More than 130 new company-managed Houses of GERRY WEBER and 120 Monolabel Stores were opened in 2011/12; further 39 in H1 2012/13
Retail sales volume H1 2012/13 increased 26.1% (yoy)
Retail sales contributed 41,2% to total Group sales in H1 2012/13 after 35.0% the year before
COMPANY-MANAGED STORES BY REGION
* Monolabel Stores TAIFUN, SAMOON and EDITION
H1 2012/13 2011/12 2010/11 2009/10
Houses of GERRY WEBER
383 347 210 160
Monolabel Stores* 149 146 25 18
Concessions 73 64 45 37
Factory Outlets 19 17 13 10
TOTAL 624 574 293 225
Denmark 5Poland 13
Switzerland 2
UK / Ireland 13
Spain 18
Netherlands 27
Austria 45
Germany409

12
WHOLESALE BUSINESS
42 franchised Houses of GERRY WEBER were opened in 2011/12
Nine new Franchise openings in H1 2012/13, thereof two HoGWs in France and Russia
Wholesale segment contributed 58.8% to total Group sales in H1 2012/13 after 64.9% in H1 of the previous year
FRANCHISE HoGWs BY REGION
GERRY WEBER Wholesale
*2010/11 included 25 Dutch HoGWs which were acquired by GERRY WEBER in 2011/12 and are now part of the Retail segment
H1 2012/13
2011/12 2010/11 2009/10
Houses of GERRY WEBER
286 277 260 227
Shop-in-Shops 2,841 2,767 2,292 2,003
Germany; 71
Russia; 47
BeNeLux; 36Poland; 17
Middle East; 22
Italy; 7
France; 13
East Europe; 21
Austria/Switzerland; 13
Baltic Coutries; 12
Scandinavia; 11
Others; 16

13
INTERNATIONALISATION
More than 330 Houses of GERRY WEBER and Mono-label Stores are located out of Germany (= 41%)
Round about 2,800 shop-in-shop areas worldwide, thereof some 490 out of Germany
Sales Split H1 2012/13
Distribution structures in more than 62 countries
International partners like El Corte Inglès (Spain), John Lewis (UK), De Bijenkorff (NL), Magasin du Nord (DK) as well as Bloomingdale’s and Dillard’s (US)
GERRY WEBER Worldwide
Germany66.0 %
nternational34.0 %

14
Agenda
(1) Unique Business Model Page 4(2) Key Financials Page 15(3) GERRY WEBER Share Page 21(4) Outlook Page 23(5) Appendix Page 25

15
Key Financials 2011/12
SALES DEVELOPMENT KEY FIGURES DEVELOPMENT 2011/12
EBIT 99,6115,9
SALES 702,7802,3
NET PROFIT67,0
78,8
+14,2
+16,4
+17,6
2010/11 2011/12
EBITDA111,6
132,3
+18,5
SALES 2011/12 BY BRAND
G.W. 5,4%
GERRY WEBER EDITION
32,6%
GERRY WEBER 38.4%
TAIFUN; 18.3%
SAMOON 5,3%
802,3
702,7
621,9594,1
570
2007/08 2008/2009 2009/10 2010/11 2011/12
in EUR million
+4,2%
+4,7%
+13.0%
+14.2%

16
Key Financials 2011/12 - EBIT
EBIT AND EBIT MARGIN
EBIT in EUR million
EBIT-Margin in %
Continuous improvement of earnings situation due to enlargement of the own Retail business and professionalization of the Wholesale business.
Net profit increased 17.6% to EUR 78.8 million. This results in an EPS of 1.72 per share.
570594,1
621,9
702,7
802,3
11,0%12,0%
13,4%14,2%
14,5%
400
450
500
550
600
650
700
750
800
850
2007/08 2008/2009 2009/10 2010/11 2011/126,0%
7,0%
8,0%
9,0%
10,0%
11,0%
12,0%
13,0%
14,0%
15,0%
Sales EBIT-Margin

17
Key Financials 2011/12 – Balance Sheet
BALANCE SHEET 2011/12
Strong balance sheet structure with an equity ratio of 75,1%
Total investment volume of EUR 84.8 mn in 2011/12 financed by our operating cash flow and own liquid funds
Currentliabilities
Equity
Non-currentliabilities
Cash
Current assets
Non-currentassets
in EUR million ASSETS EQUITY & LIABILITIES
49,2
188,4
246,0
35,4
85,2
363,0

Key Financials H1 2012/13 Sales by Quarter
H1 2012/13: Sales increased 12.0% in Q1 and 3.8% in Q2 2012/13 to EUR 403.9 million (prev. year: EUR 376.0 million)
Q4 strongest quarter of the fiscal year
Improvement of the Retail stake in Group turnover
165.1
247.9
211.0178.4 185.0
219.0
in EUR million
41.2%35.0%
H1 2012/13
Sales Development
Q1 2011/12 Q2 2011/12 Q3 2011/12 Q4 2011/12 Q1 2012/13 Q2 2012/13
Retail Wholesale

Key Financials H1 2012/13 – EBIT
EBIT negative effected by:- lower than expected Retail sales due to bad weather conditions in the last six month
- longer winter sales period with higher discounts
- lower reorder volume of the wholesale customers
- ongoing Retail expansion
Net profit EUR 29.3 million. This results in an EPS of 0.64 per share in H1 2012/13 (H1 2011/12: EUR 0.69/share)
17,7
29,3
19,7
49,3
17,8
25,6
10,7%
13,9%
11,0%
19,9%
9,6%
11,7%
0,0%
5,0%
10,0%
15,0%
20,0%
25,0%
10,0
15,0
20,0
25,0
30,0
35,0
40,0
45,0
50,0
55,0
Q1 2011/12 Q2 2011/12 Q3 2011/12 Q4 2011/12 Q1 2012/13 Q2 2012/13
H1 2012/13

20
Agenda
(1) Unique Business Model Page 4(2) Key Financials Page 15(3) GERRY WEBER Share Page 21(4) Outlook Page 23(5) Appendix Page 25

21
GERRY WEBER Share
SHARE PERFORMANCE
Strong share performance in the last two years
Outperformer in comparison to the MDAX
Payout ratio between 40% and 45% every year
Dividend yield of round about 2.3%
SHAREHOLDER STRUCTURE DIVIDEND PAYMENTS
Gerhard Weber28,97%
Udo Hardieck17,42%
Freefloat53,62%
0,380,43
0,55
0,65
0,75
2007/08 2008/09 2009/10 2010/11 2011/12
22
Agenda
(1) Unique Business Model Page 4(2) Key Financials Page 15(3) GERRY WEBER Share Page 21(4) Outlook Page 23(5) Appendix Page 25

23
Update Short-term Targets 2012/13
updated forecast 2012/13
originally forecast 2012/13
Sales (in EUR million) 860 - 870 890 - 900
EBIT (in EUR million) around 120 131 - 135
Openings new Retail stores (in units) 65 - 75 65 - 75
Building on our unique brand positioning, our operational strengths, our customer structure and the growth opportunities to be tapped in the international markets, the successful “GERRY WEBER” growth story continuous.
In the coming months, the strategic thrust of the GERRY WEBER Group will primarily focus on the following:- Expansion of the Retail operations, - Ongoing internationalisation of the distribution structures - Deepening the international market penetration of TAIFUN and SAMOON

24
Thank you for your attention
To be always updated, please have a look on our website
www.gerryweber.com
GERRY WEBER International AGClaudia KellertHead of Investor RelationsNeulehenstraße 8, D-33790 Halle / WestphaliaTel: +49 (0)5201 185 8422E-Mail: [email protected]
FINANCIAL CALENDAR
Analyst conference 25 June 2013
Bank of America Merrill Lynch Conf., London 27 June 2013
Commerzbank Conference, Frankfurt 29 August 2013
Publication of the Nine Month Report 2012/13 13 September 2013
End of the fiscal year 2012/13 31 October 2013

25
Appendix
KEY FIGURES2011/12 2010/11 2009/10 2008/09 2007/08
in EUR million
Sales 802,3 702,7 621,9 594,1 570,0
Domestic 491,0 420,8 370,1 355,6 315,9
International 311,3 281,9 251,8 238,5 254,1
Sales by segment 802,3 702,7 621,9 594,1 570,0
Wholesale 502,8 484,7 441,7 444,4 455,2
Retail 299,5 218,0 173,6 143,8 112,5
Others 0,0 0,0 6,6 5,9 2,3
Earnings key figures
EBITDA 132,3 111,6 95,2 83,6 74,0
EBITDA margin 16,5% 15,9% 15,3% 14,1% 13,0%
EBIT 115,9 99,6 83,3 71,2 62,7
EBIT margin 14,5% 14,2% 13,4% 12,0% 11,0%
EBT 113,7 97,6 79,6 66,4 57,4
EBT margin 14,2% 13,9% 12,8% 11,2% 10,1%
Net income of the year 78,8 67,0 54,0 43,0 39,4
Earnings per share in Euro 1,72 1,48 1,29 2,083 1,754
4 2007/08 on basis 22.508.820
3 2008/09 on basis of 20.661.848

26
Appendix
CONSOLIDATED INCOME STATEMENT 2011/12
in EUR million 2011/12 2010/11 Changes in %
Sales 802,3 702,7 14,2%
Other operating income 20,6 12,7 62,3%
Changes in inventories 28,5 14,2 100,4%
Cost of materials -404,8 -361,5 12,0%
Personnel expenses -125,8 -103,3 21,8%
Depreciation/Amortisation -16,3 -11,9 37,3%
Other operating expenses -187,6 -152,2 23,3%
Other taxes -0,9 -1,1 -19,9%
Operating result 115,9 99,6 16,4%
Financial result -2,2 -2,0 9,6%
Result from ordinary activities 113,7 97,6 16,5%
Taxes on income -34,9 -30,6 14,1%
Net income of the year 78,8 67,0 17,6%

27
Appendix
CONSOLIDATED INCOME STATEMENT H1 2012/13