strategy & economy - ambitreports.ambitcapital.com/reports/ambit_strategyeconomy_thematic... ·...
TRANSCRIPT

STRATEGY &ECONOMY
Research Analysts:
India - A Billion Splendid Suns!
Ritika Mankar Mukherjee, [email protected]: +91 22 3043 3175
January 2018
Phase 1: 1965 - 1980 Phase 2: 1980 - 1995
Phase 3: 1995 - 2017 Phase 4: 2017 - ?
Sumit [email protected]: +91 22 3043 3229
Aditi [email protected]: +91 22 3043 3284
ConsultantAnupam [email protected]

Strategy & Economy
January 09, 2018 Ambit Capital Pvt. Ltd. Page 2
CONTENTS Section 1 of PAGES: Why India made the POLICY choices ………………………7 it did and what happens next?
Policy phase#1: India accords top priority to agriculture ……………………….7 (and unknowingly breaks away from socialism) (FY1965-1980)
Section A: The political backdrop – a country mocked by the world …………………19
Section B: Detailing the policy changes ………………………………………………….22
Section C: The economic impact - India became self-sufficient on ………………….25 food, inequality reduced but headline GDP growth remained weak
Impact on GDP growth - Whilst farm sector growth picked up, …………………25 non-farm sector growth decelerated!
Impact on inflation - Low oil prices and improvement in food …………………..26 supply lowered inflation
Impact on equality - The reforms of FY1965-80 lowered inequality ……………27
Policy phase#2: From socialism to liberalisation (FY1980-95) ………………27
Section A: The political backdrop – Rising political competition ……………………..28 and the rise of classical liberalism globally
Section B: Detailing the policy changes ………………………………………………….30
Section C: The economic impact - GDP growth improved but the ………………….33 distribution of GDP growth was highly inequitable
Impact on GDP growth: The change in philosophy yielded a ……………………33 tangible boost in GDP growth
Impact on inflation: Interest rate deregulation and reigning …………………….35 n the fiscal deficit helped control inflation
Impact on inequality: The reforms of FY1980-95 ………………………………….35 exacerbated inequality
Policy phase#3: India creates networks (FY1995-2018) ……………………….37
Section A: The political backdrop – Two non-Congress ………………………………..38 Governments complete a full term and usher in a focus on networks
Section B: Detailing the policy changes …………………………………………………41
Section C: The economic impact - GDP growth scaled new highs …………………..50 but once again the distribution of the growth was highly inequitable
Impact on GDP growth: GDP growth scaled new highs …………………………..50
Impact on inflation: Institutional reforms helped India …………………………..51 lower inflation structurally
Impact on inequality: Inequality remained elevated and ………………………..52 in fact widened over this policy phase
Where is policy making headed now? ……………………………………………..52
What has driven policy making in India thus far? …………………………………53
Where do we go from here? ………………………………………………………….54

Strategy & Economy
January 09, 2018 Ambit Capital Pvt. Ltd. Page 3
Section 2 of PAGES: The ASPIRATIONS that defined India ……………………11 over FY1960-2018
Aspiration phase #1: Discontent and frustration (1965-80) ……………………..60
Aspiration phase#2: Reimagining India (1980-95) ………………………………64
Aspiration phase#3: A billion mutinies now! (1995-2017) ……………………..71
What is the future of aspirations in India? ………………………………………….13
Section 3 of PAGES: What is likely to be the impact …………………………….14 of these changes in POLICY and ASPIRATIONS on GDP growth?
Section A: Capturing the transition of India’s supply-side ………………………86 GDP over the three policy-phases
Section B: Capturing the transition of the demand-side over …………………..87 the three policy-phases
Section C: Forecasting GDP growth and its constitution in ………………………88 India over FY17-22
Section 4 of PAGES: Earnings growth over the next ten years ……………….91
Are Sensex earnings and nominal GDP growth correlated? Yes ………………91
What does the regression tell us? 9% earnings growth ahead …………………91
The future of stock returns in India – lower than in the past ……………………92
Section 5 of PAGES: The Sensex’s constitution over the next ten years ……..93
Tracing the evolution of the Sensex …………………………………………………93
What is the constitution of Sensex likely to look like in FY30?……………………98
What stocks are likely to enter and exit the Sensex? ……………………………..100

Strategy & Economy
January 09, 2018 Ambit Capital Pvt. Ltd. Page 4
This page has been intentionally left blank

Ambit Capital and / or its affiliates do and seek to do business including investment banking with companies covered in its research reports. As a result, investors should be aware that Ambit Capital may have a conflict of interest that could affect the objectivity of this report. Investors should not consider this report as the only factor in making their investment decision.
India - A Billion Splendid Suns!
With a headstrong PM in charge, it is easy to assume that this strongman will shape India’s narrative in the near future. However, our deep-dive into India’s Policies, Aspirations, GDP growth, Earnings and Sensex constitution (i.e. PAGES) over FY65-18 points to a clear multi-decadal pattern to India’s development process. Hereon, we expect the Aspirations of India’s billion plus population to come to life, resulting in the Government continuing to build networks as well as pursuing Policies aimed at reducing inequality. This Policy thrust is likely to result in India’s real GDP growth being recorded at 8.1%, nominal Earnings growing at 9% and 50% of the Sensex undergoing churn over FY18-30.
Three distinct Policy and Aspirations’ phases from FY65-17 India’s history over the last five decades can be divided into three policy phases (see exhibit A), namely: Policy phase#1 from FY65-80 when Independent India pursued reforms to boost agricultural productivity, Policy phase#2 from FY80-95 when India transitioned from socialism to a mixed economy, and Policy phase#3 from FY95-18 when India created networks and infrastructure. As the Indian economy changed so did the Aspirations of its people. Policy phase#1 was characterised by a great deal of discontent and political volatility in a country which was in that era mocked by the world; policy phase#2 is when Indians began reimagining their identity, and finally policy phase#3 marked the beginning of a confident, assertive India finding its feet in the world.
Where do we go from here? The CY14 General Elections resulted in the rise of an all-powerful PM in India. Heuristically, it is convenient today to believe that this strongman will shape India’s narrative for the next decade. However, India’s evolution shows that not only are policies more powerful than personalities, but also that there is a clear multi-decadal pattern to India’s ‘PAGES’. With income inequality in India rising consistently for more than 30 years, we expect the Government to continue to clamp down on black money. This along with a concerted effort to build networks is likely to remain a focus area for politicians as more than a billion upwardly mobile people assert their need to communicate, to travel, to sell their produce and their labour and to find their place in the world.
How will these Policies & Aspirations impact GDP growth and Earnings? Assuming that the Government continues to build ‘networks’ and formalise the economy, we expect GDP growth over FY18-30 to be recorded at an average of 8.1% YoY, marking a 150bps acceleration as compared to FY95-18. History points to a surprisingly strong relationship between nominal GDP growth and Sensex earnings (65% correlation). Using this relationship and assuming 12% nominal GDP growth (8% real growth + 4% inflation), we expect earnings growth and, hence, Sensex returns to be around 9% p.a. over FY18-30.
50% of the Sensex to undergo churn over FY18-30 We expect the Sensex’s churn to rise to 50% over the next ten years (compared to 33% over the preceding decade) with major names (RIL, Yes Bank, Infosys and M&M amongst others) exiting whilst better capital allocators (HCL Tech, Eicher Motors, Pidilite, HDFC Life and SBI Life amongst others) enter the Sensex (see the right margin for a full list of entrants and section 5 for the list of exits). Sectors that will gain the most market-cap share over the next ten years are Consumer Discretionary, Financial services, Industrials, Materials and Energy whilst sectors that will lose share are Consumer Staples, IT, and Telecom.
THEMATIC January 09, 2018
Strategy & Economy
Exhibit A: India has undergone three policy phases thus far
Source: CEIC, Ambit Capital research
Exhibit B: Sector market cap share weights in the Sensex will change
Dec ‘17
FY30E Change
(FY30-Dec17)
Cons. Disc + Fin. Services
49% 57% +8%
Industrials+ Materials+Energy 21% 25% +5%
IT + Telecom 13% 5% -8%
Cons. Staples
12% 7% -5%
Healthcare 3% 3% 0%
Utilities 3% 3% 0%
Source: Ambit Capital research
Exhibit C: Potential entrants into the Sensex over the next decade
IOCL Ambuja Cements Torrent Pharma
HCL Pidilite Page
Ultratech HDFC Standard Life LIC
BPCL SBI Life Paytm
Eicher Titan Flipkart
Source: Ambit Capital research
Research Analysts
Ritika Mankar Mukherjee, CFA +91 22 3043 3175 [email protected]
Sumit Shekhar +91 22 3043 3229 [email protected]
Aditi Singh +91 22 3043 3284 [email protected]
Consultant Anupam Gupta [email protected]
3.2%4.7%
6.6%8.1%
0%
4%
8%
12%
FY65-8
0
FY80-9
5
FY95-1
8
FY18-3
9 (E
)Rea
l GD
P g
row
th(Y
oY c
ha
ng
e, i
n%
)

Strategy & Economy
January 09, 2018 Ambit Capital Pvt. Ltd. Page 6
Summary of the forward looking implications Policy: From a forward-looking perspective, we expect four trends to emerge in India on the policy making front:
Trend#1: We expect subsequent Indian Governments to continue focusing on the pursuance of a black money crackdown. This can be a key tool that political parties deploy to weaken the Opposition’s access to election funding and to boost acceptability amongst the economically backward classes.
Trend#2: Creation of networks will be a fundamental trend wherein the Government will focus on infrastructure creation to boost growth and to meet aspirations of an increasingly mobile and connected India.
Trend#3: Politically, the rise of the Right is likely to continue following a 70-year period that saw the Congress and Congress-like parties dominate Indian politics.
For instance, it is worth noting that the BJP and its allies control 18 Indian States which account for 60% of India’s GDP. This kind of entrenched dominance in Indian politics was last seen in 1967 when the Congress controlled a similar number of states.
Trend#4: “Strongman economics”, i.e. ad-hoc policy-making, is likely to remain the flavour of the coming decade at the national as well as state level as compared to capitalism or socialism being the dominant economic philosophies in the previous few decades.
Aspirations: From a forward-looking perspective, we expect three trends to emerge, namely: A shift towards a broader and muscular assertion of India’s greatness from the
Nehruvian era of liberal-secular ideals. The lower middle class and poor will demand better services and aspire for a
better quality of life in the next decade. Asset ownership aspirations will shift from traditional physical assets (like homes)
to financial assets (like mutual funds).
GDP growth: The pick-up in GDP growth over FY18-30 (to 8.1% p.a.) is likely to be driven by three sets of factors namely, (1) the continued creation of physical, financial and virtual networks which in turn is likely to drive productivity growth, (2) the continued focus of subsequent Governments on a black money crackdown is likely to formalize the economy, and (3) liberalization continuing to be a policy theme thereby resulting in the continued opening up of the broader economy.
Earnings: Our forecast of 12% (8% real + 4% inflation) nominal GDP growth implies 9% Sensex earnings growth over FY18-30E. Hence, Sensex returns will moderate to 9% over FY18-30E as a maturing economy shifts cost of capital lower in the next two decades. (Note: FY95-2018 Sensex returns have been 11% p.a.)
Sensex: In the period FY18-30, we expect the market-cap share of Consumer Discretionary + Financial Services + Industrials + Materials + Energy to increase even as we move to per capita income of US$5000 by CY30. On the other hand, Consumer Staples + IT + Telecom are likely to lose market-cap share. Healthcare and Utilities are likely to remain stable. Owing to the structural changes that will materialise on the policy front, we expect the Sensex’s churn to rise to 50% in the next decade (vs 33% in the preceding decade). Using a combination of macroeconomic and financial filters, we expect Reliance Industries, Yes Bank, Infosys, M & M, Bharti Airtel, NTPC, Hero Motor, Tata Steel, Power Grid, Wipro, Coal India, Adani Ports, Tata Motors and Tata Motors DVR, and Dr Reddy’s to be potential exit candidates. IOCL, HCL, UltraTech, BPCL, Eicher Motors, Ambuja Cements, Pidilite, HDFC Standard Life, SBI Life, Titan, Torrent Pharma, and Page Industries are potential entrants from the listed space and Paytm, LIC and Flipkart are potential entrants from the unlisted space.

Strategy & Economy
January 09, 2018 Ambit Capital Pvt. Ltd. Page 7
An illustrated executive summary We have divided India’s past into three distinct phases and have also attempted to project what will happen over the next decade (see exhibit below).
Indicators through various phases Exhibit 1:
Indicator Policy phase 1 (FY65-80)
Policy phase 2 (FY80-95)
Policy phase 3 (FY95-18) FY18-30 E
GDP growth 3.2% 4.7% 6.6% 8.1%
Sensex returns CAGR NA 35% 11% NA
Sensex EPS growth NA NA 14% 9%
Congress seat share in Lok Sabha 58% 51% 22% NA
Gini coefficient (period end)* 0.32 0.34 0.37 NA
Source: CEIC, Bloomberg, Election Commission of India, World Bank, Ambit Capital research. *The Gini coefficient measures the inequality among values of a frequency distribution. A Gini coefficient of zero expresses perfect equality, whereas Gini coefficient of 1 expresses maximal inequality among value
Section 1 of PAGES: Why India made the POLICY choices it did and what happens next?
India’s history over the last five decades can in fact be divided into three distinct and thematic policy phases (see exhibit below).
The three policy phases of India Exhibit 2:
Source: CEIC, Election Commission of India, World Bank, Ambit Capital research. *Note: (1) The Gini coefficient measures the inequality among values of a frequency distribution. A Gini coefficient of zero expresses perfect equality, whereas Gini coefficient of 1 expresses maximal inequality among value, (2) Seat share of Congress refers to seat share in Lok Sabha (lower house of the Parliament).
To be more specific, the three policy phases can be demarcated as follows: Policy phase 1 (FY65-80): India accords top priority to agriculture
“What kind of pride and prejudice this country [India] was up against is best illustrated by an interview Vijayalakshmi Pandit, [Nehru's sister, then ambassador to the US] had with Sam Rayburn, Speaker of the House and a legendary figure on the Hill at that time, from which she returned in a towering rage. It had gone something like this:
Rayburn: "Why don't you buy wheat from Pakistan which has wheat in surplus? The only reason you don't is because Hindu India wants to do down Muslim Pakistan,"
She tried to control her temper as best she could and said testily, “India was not Hindu India, and that it had more Muslims than Muslim Pakistan."
Rayburn: "Oh, you have Muslims in India! Honey, why didn't you say so earlier?"
Ambassador: "Sam, I have been saying this for two years, ever since I came here, but you don't hear and you don't understand."
58%51%
22%
0.32 0.33 0.36
0%
1%
2%
3%
4%
5%
6%
7%
8%
0%
20%
40%
60%
80%
Policy Phase 1 (FY65-80) Policy Phase 2 (FY80-95) Policy phase 3 (FY95-18)
GD
P g
row
th
Sea
t sh
are
/Gin
i co
eff
.*/S
ense
x re
turn
s
Seat share of Congress (Left scale) Gini coeff. (Left scale)
Sensex returns (left scale) GDP growth (Right scale)

Strategy & Economy
January 09, 2018 Ambit Capital Pvt. Ltd. Page 8
Whereupon Rayburn's tone suddenly changed, and he said: "No, no, now that I know, now you will have no trouble. If they give you any more trouble, honey, you just tell me."
-‘Swallowing the humiliation’ by Inder Malhotra for the Indian Express on July 12, 2010
Policy phase#1 was hence characterised by low GDP growth, the political dominance of the Congress and the persistence of a high degree of income inequality (see exhibit below). During most of this era, India was a desperately poor country which was mocked by the world and constantly warring with its neighbours.
Policy phase#1 was characterised by low GDP growth, political dominance of the Congress and the persistence of Exhibit 3:a high degree of inequality
Source: CEIC, Election Commission of India, World Bank, Ambit Capital research. *Note: (1) The Gini coefficient measures the inequality among values of a frequency distribution. A Gini coefficient of zero expresses perfect equality, whereas Gini coefficient of 1 expresses maximal inequality among value, (2) Seat share of Congress refers to seat share in Lok Sabha (lower house of the Parliament).
*Note: Average GDP growth during this period was recorded at 3.2% YoY in real terms as compared to the FY65-18 average of 5.2% YoY, the average Gini coefficient during this period was recorded at 0.32 as compared to the FY65-18 average of 0.34 and the average seat share of the Congress during this period was recorded at 58% as compared to the FY65-18 average of 44%.
During this phase India’s policymakers were forced to focus on enhancing the productivity of the agricultural sector and did so by embracing the ‘Green Revolution’ which was transforming crop yields in the developing world. This policy choice was a critical one as the focus on agriculture allowed India to begin breaking away from the previous policy thrust that was centered on: (a) Soviet-style planning; and (b) growing state-owned enterprises (SOEs) that were thus far revered as the temples of modern India.
Policy phase 2 (FY80-95): From socialism to liberalisation
“No power on earth can stop an idea whose time has come”
- Dr. Manmohan Singh quoting Victor Hugo in his landmark budget speech (July 1991)
Policy phase#2 was characterised by a major improvement in GDP growth, superior stock market returns (35% CAGR), a rise in political competition and a rise in income inequality (see exhibit below).
73%
54%
68%
28%
67%
4%
3%
5%
3%2%
2%
3%
4%
5%
0%
20%
40%
60%
80%
FY62 FY67 FY71 FY77 FY80
GD
P g
row
th
Sea
t sh
are
/Gin
i*
Seat share of Congress (Left scale) Gini coeff. (Left scale) Avg. GDP growth (Right scale)
Strategy & Economy
January 09, 2018 Ambit Capital Pvt. Ltd. Page 9
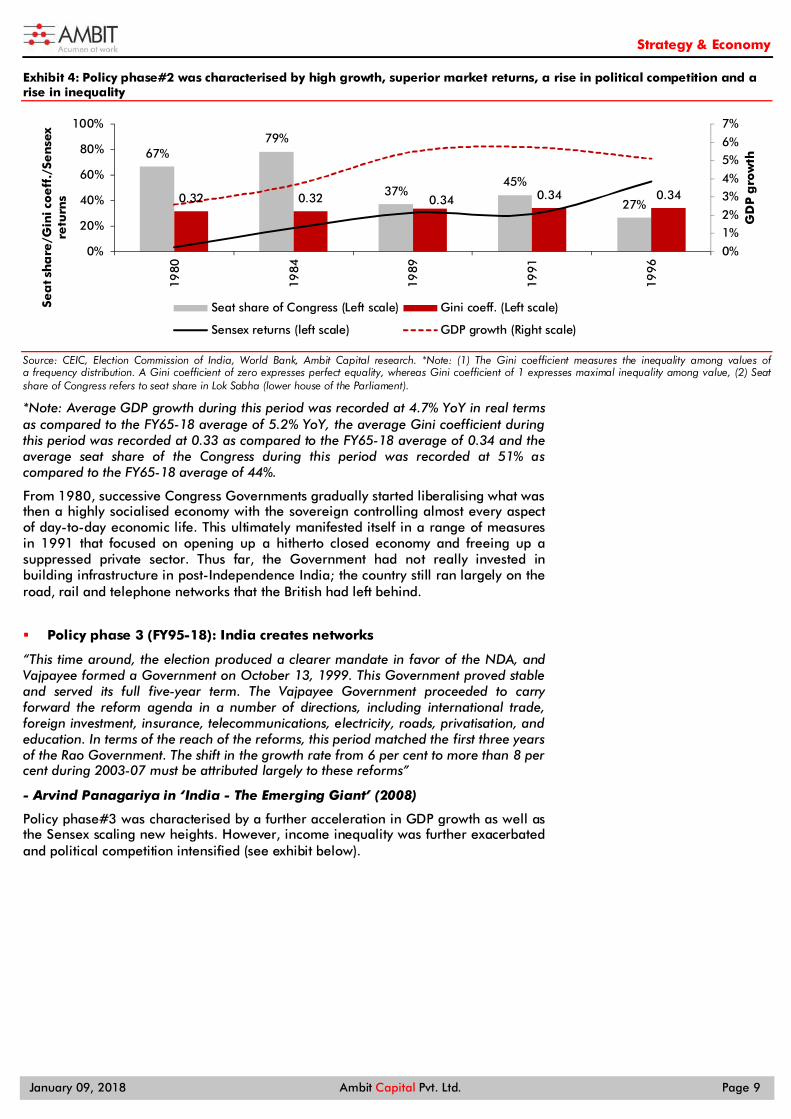
Policy phase#2 was characterised by high growth, superior market returns, a rise in political competition and a Exhibit 4:rise in inequality
Source: CEIC, Election Commission of India, World Bank, Ambit Capital research. *Note: (1) The Gini coefficient measures the inequality among values of a frequency distribution. A Gini coefficient of zero expresses perfect equality, whereas Gini coefficient of 1 expresses maximal inequality among value, (2) Seat share of Congress refers to seat share in Lok Sabha (lower house of the Parliament).
*Note: Average GDP growth during this period was recorded at 4.7% YoY in real terms as compared to the FY65-18 average of 5.2% YoY, the average Gini coefficient during this period was recorded at 0.33 as compared to the FY65-18 average of 0.34 and the average seat share of the Congress during this period was recorded at 51% as compared to the FY65-18 average of 44%.
From 1980, successive Congress Governments gradually started liberalising what was then a highly socialised economy with the sovereign controlling almost every aspect of day-to-day economic life. This ultimately manifested itself in a range of measures in 1991 that focused on opening up a hitherto closed economy and freeing up a suppressed private sector. Thus far, the Government had not really invested in building infrastructure in post-Independence India; the country still ran largely on the road, rail and telephone networks that the British had left behind.
Policy phase 3 (FY95-18): India creates networks
“This time around, the election produced a clearer mandate in favor of the NDA, and Vajpayee formed a Government on October 13, 1999. This Government proved stable and served its full five-year term. The Vajpayee Government proceeded to carry forward the reform agenda in a number of directions, including international trade, foreign investment, insurance, telecommunications, electricity, roads, privatisation, and education. In terms of the reach of the reforms, this period matched the first three years of the Rao Government. The shift in the growth rate from 6 per cent to more than 8 per cent during 2003-07 must be attributed largely to these reforms”
- Arvind Panagariya in ‘India - The Emerging Giant’ (2008)
Policy phase#3 was characterised by a further acceleration in GDP growth as well as the Sensex scaling new heights. However, income inequality was further exacerbated and political competition intensified (see exhibit below).
67%79%
37%45%
27%0.32 0.32 0.34 0.34 0.34
0%
1%2%
3%4%
5%6%
7%
0%
20%
40%
60%
80%
100%
1980
1984
1989
1991
1996
GD
P g
row
th
Sea
t sh
are
/Gin
i co
eff
./Se
nse
x re
turn
s
Seat share of Congress (Left scale) Gini coeff. (Left scale)
Sensex returns (left scale) GDP growth (Right scale)

Strategy & Economy
January 09, 2018 Ambit Capital Pvt. Ltd. Page 10
The third policy phase was characterised by GDP growth as well as the Sensex scaling new heights, inequality Exhibit 5:worsening and political competition remaining high
Source: CEIC, Election Commission of India, World Bank, Ambit Capital research. *Note: (1) The Gini coefficient measures the inequality among values of a frequency distribution. A Gini coefficient of zero expresses perfect equality, whereas Gini coefficient of 1 expresses maximal inequality among value, (2) Seat share of Congress refers to seat share in Lok Sabha (lower house of the Parliament).
*Note: Average GDP growth during this period was recorded at 6.7% YoY in real terms as compared to the FY65-18 average of 5.2% YoY, the average Gini coefficient during this period was recorded at 0.33 as compared to the FY65-18 average of 0.36 and the average seat share of the Congress during this period was recorded at 22% as compared to the FY65-18 average of 44%.
If the FY80-95 era was about liberalising the economy and letting animal spirits loose, the next 20 years were about India building infrastructure – physical, financial and virtual. The creation of these infrastructure networks allowed Indians – workers and entrepreneurs - to travel: (a) across the country and (b) across the wider global economy in search of economic opportunities. That in turn created for the first time since 1947 a recognisably self-confident nation.
What to expect from policy making?
From a forward-looking perspective, much in line with the international experience, we expect four trends should emerge.
Trend#1: We expect subsequent Indian Governments to continue focusing on the pursuance of black money crackdown. This can be a key tool that political parties deploy to weaken the opposition’s access to finance and to boost acceptability amongst the economically backward classes.
Trend#2: Creation of networks will be a fundamental trend where the Government will focus on quality infrastructure creation to boost growth.
Trend#3: Politically, the rise of the right wing is likely to continue following a 70-year period that saw the Congress and Congress-like parties dominate Indian politics.
For instance, it is worth noting that the BJP and its allies control 18 Indian States which account for 60% of India’s GDP. This kind of entrenched dominance in Indian politics was last seen in 1967 when the Congress controlled a similar number of states (see exhibit below).
Trend#4: “Strongman economics”, i.e. ad-hoc policy-making, is likely to remain the flavour of the coming decade at the national as well as state level as compared to capitalism or socialism being the dominant economic philosophies in the previous few decades.
67%79%
37%45%
27%0.32 0.32 0.34 0.34 0.34
0%
1%
2%
3%
4%
5%
6%
7%
-20%
0%
20%
40%
60%
80%
100%
1998
1999
2004
2009
2014
GD
P g
row
th
Sea
t sh
are
/Gin
i co
eff
icie
nt/
Sen
sex
retu
rns
Seat share of Congress (Left scale) Gini coeff. (Left scale)
Sensex returns (left scale) GDP growth (Right scale)
Strategy & Economy
January 09, 2018 Ambit Capital Pvt. Ltd. Page 11
Section 2 of PAGES: The ASPIRATIONS that defined India over FY60-18
As the Indian economy changed so did the aspirations of its youth. We see three broad phases of aspirations: from the trials and tribulations of a volatile post-Independence era (FY65-80) to the early stages of an open-market economy (FY80-95). As the open economy grew and evolved, a more vibrant, more self-confident was born and that generation is at war today with the previous generation that still rules it (FY95-18) Aspiration phase #1: Discontent and frustration (1965-80)
"To the historian, the late 1960s are reminiscent of the late 1940s, likewise a time of crisis and conflict, of resentment along lines of class, religion, ethnicity and region, of a Centre that seemed barely to hold."
"Indian democracy, circa 1975, could reconcile the Valley of Kashmir to the Union of India, but not Indira Gandhi with Jayaprakash Narayan."
- Ramachandra Guha in ‘India After Gandhi’ (2007)
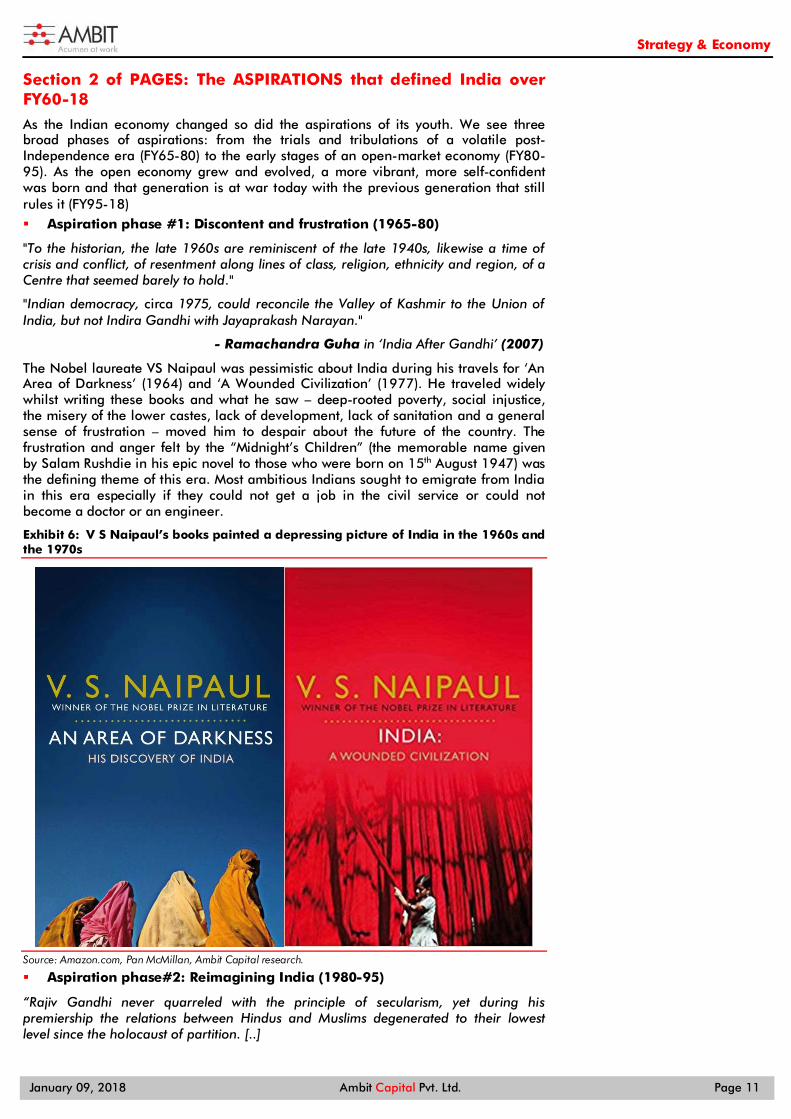
The Nobel laureate VS Naipaul was pessimistic about India during his travels for ‘An Area of Darkness’ (1964) and ‘A Wounded Civilization’ (1977). He traveled widely whilst writing these books and what he saw – deep-rooted poverty, social injustice, the misery of the lower castes, lack of development, lack of sanitation and a general sense of frustration – moved him to despair about the future of the country. The frustration and anger felt by the “Midnight’s Children” (the memorable name given by Salam Rushdie in his epic novel to those who were born on 15th August 1947) was the defining theme of this era. Most ambitious Indians sought to emigrate from India in this era especially if they could not get a job in the civil service or could not become a doctor or an engineer.
V S Naipaul’s books painted a depressing picture of India in the 1960s and Exhibit 6:the 1970s
Source: Amazon.com, Pan McMillan, Ambit Capital research.
Aspiration phase#2: Reimagining India (1980-95)
“Rajiv Gandhi never quarreled with the principle of secularism, yet during his premiership the relations between Hindus and Muslims degenerated to their lowest level since the holocaust of partition. [..]

Strategy & Economy
January 09, 2018 Ambit Capital Pvt. Ltd. Page 12
Democracy was not faring too well either when Rajiv Gandhi was assassinated. [..] Even in opposition Rajiv remained an isolated figure, dependent for information and advice on a small coterie who had no political clout of their own."
- Mark Tully in ‘No full stops for India’, (1991)
The 1980s saw the dawn of colour television in India and the arrival of religious soap operas like the ‘Ramayana’, a TV series aired in 1987-88. Streets and cities emptied on Sunday mornings when the Ramayana and subsequently the Mahabharata were broadcast. Whilst emigrating from India remained popular, for the first time since Independence, Indian youth found that even if they could not get a job in the civil services, there were a few remunerative jobs to be found in the private sector.
The other defining theme of this era was the rise of big ticket corruption scandals which, for the first time, involved politicians and civil servants working in cahoots with corporate houses. The template for these scams was memorably captured in hit art house movies of this era like Ardh Satya and Jaane Bhi Do Yaaron.
Parallel cinema rose in the 1980s and captured the growing nexus between Exhibit 7:politicians and business houses
Source: IMDB.com, Neo Films, Shemaroo, NFDC, Ambit Capital research
Aspiration phase#3: A billion mutinies now! (1995-2017)
“…India was, in the simplest way, on the move, that all over the vast country men and women had moved out of the cramped ways and expectations of their parents and grandparents and were expecting more.”
– V S Naipaul in ‘India: A million mutinies now’ (1989)
Economic liberalisation transformed India. A new class of executives and business owners arose on the back of the opportunities unleashed by the opening up of the economy and by strong GDP growth during FY2003-FY2008. The proliferation of mobile telephony and internet coupled with a huge ramp-up in road infrastructure (the Golden Quadrilateral linking metro cities of Delhi, Mumbai, Chennai and Kolkata) brought small-town India closer to cities, opening up career and business opportunities like never before. This upbeat narrative was punctuated by corruption scams which had a common template – crony capitalists allying with politicians and civil servants to game either regulations and/or the Government spending engine.

Strategy & Economy
January 09, 2018 Ambit Capital Pvt. Ltd. Page 13
Modi’s victory resounded across the world Exhibit 8:
Source: Time.com, Economist.com, Ambit Capital research
What is the future of aspirations in India?
We see three big areas of aspirations for the Indian youth. These are:
(1) Muscular assertion of identity: With the rise of the BJP, there is a clear move to disassociate India from the liberal-secular ideals of the Nehruvian era and shift the narrative of a new generation to a broader, more muscular assertion of India’s greatness. This is already evident in Government initiatives such as suggesting an International Yoga Day to the United Nations, dedicating a Ministry and Minister for the erstwhile Department of Ayurveda, Yoga and Naturopathy, Unani Siddha and Homeopathy (AYUSH), etc. We expect these trends to continue and fuel aspirations for today’s youth to be patriotic, proud of India’s past, and self-confident in the assertion of their own identity.
(2) The rise of the lower middle class and the aspirations of the poor: As the Golden Quadrilateral and the launch of mobile telephony in Phase 3 (1995- 2017) drove the aspirations of the middle class, we believe that the Government’s initiatives such as the Bharatmala Road Project (34,800km of roads to be constructed at an investment of Rs5.350tn) and the increasing penetration of the ‘Jan Dhan-Aadhaar-Mobile’ Yojana will, over the next decade, fuel aspirations of the lower middle class and the poor. The poor will aspire to services and products such as aviation, housing, and mobile data services on low-cost feature-phones.
(3) Asset ownership aspirations – from physical to financial: With demonetisation, there has been a shift from physical savings towards financial savings, which is gradually picking up pace and should continue in the next decade. This shift is being fueled by the unaffordability of real estate in metro cities (bloated prices), the freezing of cash transactions in real estate (due to demonetisation), and the booming stock markets. Thus, over the longer term, we expect affordable housing to fulfill the aspirations of the lower middle class even as the urban youth question the need for owning an expensive house and shift, instead, toward building a portfolio of stocks and mutual funds for securing their financial future.

Strategy & Economy
January 09, 2018 Ambit Capital Pvt. Ltd. Page 14
Section 3 of PAGES: What is likely to be the impact of these changes in POLICY and ASPIRATIONS on GDP growth?
Cross-country experience suggests that as capita incomes rise, (1) the share of ‘Consumption’ falls but at a diminishing pace; and (2) the share of ‘Services’ rises but also at a diminishing pace (see exhibit below).
We expect the share of ‘Services’ in GDP to continue rising but at a Exhibit 9:diminished pace
Period Average
Agriculture (as a % of GDP)
Average Industry (as a % of GDP)
Average Services (as a % of GDP)
Average real GDP growth
FY65-80 40% 21% 38% 3.2%
FY80-95 31% 26% 43% 4.7%
Delta for Phase 2 -9% +5% +5% +1.5%
FY95-18 21% 28% 51% 6.6%
Delta for Phase 3 -10% +2% +8% +1.9%
FY18-30 (E) 14% 30% 56% 8.1%
Level in FY17 17% 29% 54% 5.8%
Delta for Phase 4 (E) -7% +2% +5% +1.5%
Source: CEIC, Ambit Capital research
We expect GDP growth to accelerate by 150bps during FY18-30. In other words, we expect GDP growth to average at 8.1% during FY18-30 as compared to an average of 6.6% during FY95-118 (see exhibit below).
We expect GDP growth to accelerate by 150bps during FY18-30 Exhibit 10:
Source: CEIC, Ambit Capital research
Section 4 of PAGES: The future of India’s earnings
As regards earnings, history points to a surprisingly strong correlation between nominal GDP growth and Sensex earnings growth (see exhibit below).
Sensex earnings and nominal GDP growth broadly move in sync Exhibit 11:
Source: CEIC, Bloomberg, Ambit Capital research
3.2%
4.7%
6.6%
8.1%
0%
2%
4%
6%
8%
10%
FY65-80 FY80-95 FY95-18 FY18-39 (E)
Re
al G
DP
gro
wth
(Ave
rag
e o
ver
spe
cifi
ed
p
eri
od
)
(60)
(40)
(20)
0
20
40
60
Mar
-01
Nov
-01
Jul-
02
Mar
-03
Nov
-03
Jul-
04
Mar
-05
Nov
-05
Jul-
06
Mar
-07
Nov
-07
Jul-
08
Mar
-09
Nov
-09
Jul-
10
Mar
-11
Nov
-11
Jul-
12
Mar
-13
Nov
-13
Jul-
14
Mar
-15
Nov
-15
Jul-
16
Mar
-17
Nominal GDP growth (%) Sensex EPS growth (%)
(%Yo

Strategy & Economy
January 09, 2018 Ambit Capital Pvt. Ltd. Page 15
A linear regression does not fully capture the relationship between GDP growth and EPS growth. In order to model this relationship more accurately, we run a polynomial regression analysis of India’s nominal GDP growth (x variable) versus Sensex earnings growth (y variable) and present the results in the exhibit below, including the polynomial trend line.
Strong correlation between Sensex earnings and the nominal GDP growth Exhibit 12:rate
Source: Bloomberg, Ambit Capital research. The data pertains from 1QFY06-2QFY18 (50 quarters)
Using this relationship and assuming nominal GDP growth of 12% (i.e. 8% real GDP growth + 4% inflation), we expect earnings growth to be recorded at 9% p.a. in nominal terms over FY18-30. Since long-term stock market returns are defined by long-term EPS growth, this suggests that the Sensex will give returns of around 9% p.a. over the next 10 years. [Note: the Sensex has compounded at 15% since its inception in 1979.]
Section 5 of PAGES: The Sensex’s constitution
In the period FY18-30, we expect the market-cap share of consumer discretionary + financials and industrials + materials + energy to increase even as we move to per capita income of US$5000 by CY30. On the other hand, consumer staples and IT + telecom are likely to lose market-cap share. Healthcare and utilities are likely to remain stable. Owing to the structural changes that will materialise on the policy front, we expect Sensex’s churn to rise to 50% in the next decade. Using a combination of macroeconomic and financial filters, we expect Reliance Industries, Yes Bank, Infosys, M&M, Bharti Airtel, NTPC, Hero Motor, Tata Steel, Power Grid, Wipro, Coal India, Adani Ports, Tata Motors and Tata Motors DVR, and Dr Reddy’s to be potential exit candidates. IOCL, HCL, UltraTech, BPCL, Eicher, Ambuja Cements, Pidilite, HDFC Standard Life, SBI Life, Titan, Torrent Pharma, and Page Industries are potential entrants from the listed space and Paytm, LIC and Flipkart are potential entrants from the unlisted space.
Sector weights evolution Exhibit 13:
Sector FY95 FY05 FY15 Dec ‘17 FY30E Change
(FY30-Dec17)
Consumer Discretionary and Financial Services 15% 25% 41% 49% 57% +8%
Industrials, Materials, and Energy 58% 35% 20% 21% 26% +5%
Information Technology and Telecom 0% 21% 17% 13% 5% -8%
Consumer Staples 23% 12% 13% 12% 7% -5%
Healthcare 2% 5% 6% 3% 3% 0%
Utilities 2% 2% 3% 3% 3% 0%
Total 100% 100% 100% 100% 100% 100%
Source: Bloomberg, Ambit Capital research
y = -23.386x2 + 9.53x - 0.7218R² = 0.5288
-40%
-30%
-20%
-10%
0%
10%
20%
30%
40%
50%
0% 5% 10% 15% 20% 25% 30%
Y
X Variable 1
Y
Poly. (Y)

Strategy & Economy
January 09, 2018 Ambit Capital Pvt. Ltd. Page 16
The probable exits from Sensex Exhibit 14:Exits Ticker Mcap ($bn) GICS Sector
Reliance RIL IN 94 Energy
Infosys INFO IN 37 IT
Airtel BHARTI IN 33 Telecom
Coal India COAL IN 27 Energy
Wipro WPRO IN 24 IT
NTPC NTPC IN 23 Utilities
Tata Motors TTMT IN 22 Cons. Discr
Tata Motors - DVR TTMT/A IN 22 Cons. Discr
Power Grid PWGR IN 17 Utilities
M&M MM IN 15 Cons. Discr
Adani Ports ADSEZ IN 14 Utilities
Hero Motors HMCL IN 12 Cons. Discr
Tata Steel TATA IN 11 Materials
Yes Bank YES IN 11 Financials
Dr Reddy's DRRD IN 6 Health Care
Source: Bloomberg, Ambit Capital research
The possible entrants into the Sensex Exhibit 15:
Entrants Ticker Mcap ($bn) GICS Sector
IOCL IOCL IN 30 Energy
HCL HCLT IN 20 Information Technology
Ultratech UTCEM IN 19 Materials
BPCL BPCL IN 17 Energy
Eicher EIM IN 12 Industrials
Ambuja Cements ACEM IN 9 Materials
Pidilite PIDI IN 7 Materials
HDFC Standard Life HDFCLIFE IN 12 Financials
SBI Life SBILIFE IN 11 Financials
Titan TTAN IN 12 Consumer Discretionary
Torrent Pharma TRP IN 4 Health Care
Page PAG IN 4 Consumer Discretionary
Paytm - - Financials
Flipkart - - Consumer Discretionary
LIC - - Financials
Source: Bloomberg, Ambit Capital research

Strategy & Economy
January 09, 2018 Ambit Capital Pvt. Ltd. Page 17
Section 1 of PAGES: Why India made the policy choices it did? “There comes a time in the life of every nation when it stands at the crossroads of history and must choose which way to go. But for us there need to be no difficulty or hesitation, no looking to right or left.”
- Lal Bahadur Shastri in his first address as PM of India (June 11, 1964)
Whilst Indian policymakers’ choices can seem ad-hoc, lacking any pattern in the way they behave, India’s history over the last five decades can be divided into three distinct and thematic policy phases, namely: Policy phase#1 (FY1965-80): When Independent India pursued reforms to
boost agricultural productivity (refer to pg 18 to 27 for details), Policy phase#2 (FY1980-95): When India transitioned from socialism to a
mixed economy (refer to pg 27 to 36 for details); and Policy phase#3 (FY1995-2018): When India created internal networks and
infrastructure (refer to pg 37 to 52 for details).
This segmentation of India’s policy choices into these three policy phases yields several key insights that the subsequent section spanning will elaborate upon. The chief finding that stands out is that Indian policymakers opted for pro-market reforms and pro-business policy changes only to ensure the longevity of political power. Contrary to popular belief, liberalisation was not necessitated by India’s twin deficits in the 1990s but by a range of financial compulsions that gradually crept up on the Indian Government through the 1980s.
The private sector in India was ignored until 1980, i.e. the point in time until political competition in India was low and the Congress had near monopoly control over India. As political competition grew, political parties that held power ensured that they undertook greater opening-up of the Indian economy and also facilitated infrastructure development so as to fulfill two goals, namely:
Raise the monies required for funding General Elections (which were becoming exorbitant affairs owing to rising political competition); and
Foster GDP growth rate so as to grow tax collections at a healthy clip which could then be used to provide sops to the masses.
In fact, this phenomenon probably explains why the rise in political competition in India has been accompanied by higher GDP growth in India (see exhibit below).
The increase in political competition in India has been accompanied by Exhibit 16:higher GDP growth
Source: Election Commission of India, CEIC, Ambit Capital research. Note: The effective number of parties is a concept which provides for an adjusted number of political parties in a country's party system. The idea behind this measure is to count parties and, at the same time, to weight the count by their relative strength. The relative strength refers to their vote share ("effective number of electoral parties") or seat share in the parliament ("effective number of parliamentary parties")
0%
2%
4%
6%
8%
10%
0
1
2
3
4
5
6
7
1952
1957
1962
1967
1971
1977
1980
1984
1989
1991
1996
1998
1999
2004
2009
GD
P g
row
th
(Yo
Y ch
an
ge
, in
%)
Effe
ctiv
e n
o. o
f p
oli
tica
l p
art
ies
(se
ats
)*
India opted for pro-market reforms and pro-business policy changes only to ensure longevity of political power

Strategy & Economy
January 09, 2018 Ambit Capital Pvt. Ltd. Page 18
The other key finding that stands out is that Indian policymakers’ decisions are heavily influenced by the international policy narrative prevalent at a particular point in time. This could because Indian politicians have seldom possessed intellectual conviction when it comes to making policy decisions; more often than not, their policy decisions are driven by the need to hurt rival politicians and consolidate their political power. This helps explain why India swung from pursuing left of centre economic policies from FY1947-64 to right of centre economic policies from FY1980.
The Soviet Union’s economic model of Central Exhibit 17:command-and-control heavily influenced Indian policies from FY1947-64
Source: Ambit Capital research
The apparent success of classical liberalism Exhibit 18:
and free markets created an imprint on Indian policy from the 1980s
Source: Ambit Capital research
The subsequent part of this section elaborates on each of the three policy phases that India has traversed since FY1960 to date.
Each of the three policy phase related sections in turn is divided into three convenient parts, namely: (1) the political backdrop; (2) the policy choices made; and finally (3) the macroeconomic ramifications of the policy choices made on GDP growth, inflation and extent of inequality.
Policy phase#1: India accords top priority to agriculture (FY1965-80) “A nation’s strength ultimately consists in what it can do on its own, and not in what it can borrow from others.”
- Indira Gandhi (1970)
When India became independent in 1947, it had been administered and controlled by the British for two centuries. By the sixties, i.e. two decades after being an independent sovereign, and after the initial exhilaration around India’s independence abated, Indian politicians were overwhelmed by the demands of managing a country of this size and complexity.
Hence, it is no surprise that India’s adolescence spanning FY1965-80 was marked by extensive trouble and strife. The adversities that India faced over this period (both internally and externally) thus played a critical role in shaping the policy choices India made during this period.
First, India ran into trouble with its neighbours and ended up fighting two full-scale wars with Pakistan (in 1965 and then in 1971) and also fought against and lost to China (1962). Then, just when policymakers were grappling with the fact that a war was a luxury that a fledgling and poor country like India could ill afford, it ran into another primitive problem, i.e. the shortage of food. India’s rapid population growth and inadequate food production capabilities meant that India had to rely on developed countries for food aid which was given with humiliating riders.
Indian policymakers’ policy decisions are heavily influenced by the international policy narrative prevalent at a particular point in time
Indian politicians were overwhelmed by the demands of managing a country of this size and complexity

Strategy & Economy
January 09, 2018 Ambit Capital Pvt. Ltd. Page 19
Against this backdrop of a weakened global positioning and a domestic food shortage, India’s policymakers were forced to focus on enhancing the productivity of the agricultural sector and did so by embracing the ‘Green Revolution’ which was transforming agriculture in the developing world. This policy choice was a critical one as the focus on agriculture allowed India to unknowingly begin breaking away from the previous policy thrust that was centered on Soviet-style planning and growing state-owned enterprises (SOEs) that were thus far revered as the temples of modern India.
The remaining part of this policy phase section spanning FY1965-80 is divided into three sections:
The first sub-section (spanning pg 19 to pg 22) sets up the political backdrop under which the specific policy decisions were taken. It answers questions, such as what prompted India to focus on self-sufficiency in food grain production.
The second sub-section (spanning pg 22 to pg 25) details the policy changes that were affected and what specific steps were taken to enhance agricultural productivity.
The third and final sub-section (spanning pg 25 to pg 27) quantifies the macroeconomic impact of these policy changes. Our findings suggest that agricultural productivity increased substantially although there were regional disparities. This era also saw inequality decreasing.
The chart below graphically shows how this phase was characterised by:
Low GDP growth whereby the average GDP growth over FY1965-80 was recorded at 3.1% YoY as compared to the average growth rate of 6% recorded over FY1980-18.
The Congress dominating national politics, accounting for a median of 70% of seats during the General Elections held over this phase.
Inequality in India was the lowest over FY1965-80 especially so when compared to the deterioration this metric would undergo in the subsequent policy phases.
Policy phase#1 was characterised by low GDP growth, political dominance of the Congress and the persistence Exhibit 19:of a high degree of inequality
Source: CEIC, Election Commission of India, World Bank, Ambit Capital research. *Note: (1) The Gini coefficient measures the inequality among values of a frequency distribution. A Gini coefficient of zero expresses perfect equality, whereas Gini coefficient of 1 expresses maximal inequality among value. (2) Average GDP growth during this period: 3.2%, Average Gini coefficient: 0.32 and Average seat share of Congress: 58%.
Section A: The political backdrop – a country mocked by the world
“What kind of pride and prejudice this country [India] was up against is best illustrated by an interview Vijayalakshmi Pandit, [Nehru's sister, then ambassador to the US] had with Sam Rayburn, Speaker of the House and a legendary figure on the Hill at that time, from which she returned in a towering rage. It had gone something like this:
Rayburn: "Why don't you buy wheat from Pakistan which has wheat in surplus? The only reason you don't is because Hindu India wants to do down Muslim Pakistan,"
73%
54%
68%
28%
67%
0.33 0.31 0.31 0.32 0.324%
3%
5%
3%
2%
2%
3%
3%
4%
4%
5%
5%
0%
20%
40%
60%
80%
FY62 FY67 FY71 FY77 FY80
GD
P g
row
th
Sea
t sh
are
/Gin
i*
Seat share of Congress (Left scale) Gini coeff. (Left scale) Avg. GDP growth (Right scale)
India’s rapid population growth and inadequate food production capabilities meant that India had to rely on developed countries for food aid

Strategy & Economy
January 09, 2018 Ambit Capital Pvt. Ltd. Page 20
She tried to control her temper as best she could and said testily, “India was not Hindu India, and that it had more Muslims than Muslim Pakistan." Rayburn: "Oh, you have Muslims in India! Honey, why didn't you say so earlier?"
Ambassador: "Sam, I have been saying this for two years, ever since I came here, but you don't hear and you don't understand." Whereupon Rayburn's tone suddenly changed, and he said: "No, no, now that I know, now you will have no trouble. If they give you any more trouble, honey, you just tell me."
-‘Swallowing the humiliation’ by Inder Malhotra for the Indian Express on July 12, 2010
The two decades leading to 1965 were marked by a range of socio-economic as well as foreign policy related developments which in more ways than one necessitated a shift away from Nehru’s thrust on ‘temples of modern India’ to a never-before-seen thrust on agriculture. First and foremost, India’s population growth rate was undergoing a period of rapid acceleration as birth rates expanded (see exhibit below). As compared to the current population growth rate of 1.2% YoY in FY17, India’s population growth rate had accelerated to an average of 2.1% over FY1960-65 as compared from an already high level of 1.9% YoY recorded immediately post-independence over FY1952-59.
India’s population growth rate accelerated Exhibit 20:post-independence…
Source: CEIC, Ambit Capital research
…even as foodgrain production was undergoing Exhibit 21:a deceleration!
Source: CEIC, Ambit Capital research
To compound matters, this period also saw the pace of foodgrain production slow down drastically from an average of 5.8% YoY over FY1952-59 to an average of 2.6% YoY over FY1960-65 (see exhibit above). This deceleration in foodgrain production growth rates could be mainly attributed to: (1) India’s excessive dependence on monsoons with only 10% of land having irrigation cover in FY60 (as compared to 60% now); (2) India experiencing three droughts in the 1960s (in 1965, 1966 and 1968); and (3) the exhaustion of the land’s productive capacity.
The combination of rising demand for food and slowing pace of food grain production meant that India had to deal with a crippling food scarcity problem. To meet the food shortage and to stabilise the prices, India was forced to import increasing amounts of food. The Government of India signed the controversial Trade Development and Assistance Act of 1954, commonly known as PL–480 scheme with the USA in 1956 to facilitate these imports. However, rather than being a standardised agreement, India was subjected to a great deal of humiliation in the run up to this scheme being approved by the US Congress.
The US openly looked down upon India with an air of condescension. And yet, India’s need for wheat was so pressing that it had no choice but continue negotiating with
1.9%
2.1%
2.3%
1.6%
1.8%
2.0%
2.2%
2.4%
FY52-59 FY60-65 FY65-80
Avg
. po
pu
lati
on
gro
wth
(Yo
Y ch
an
ge
, in
%)
FY52-59 FY60-65 FY65-80
5.8%
2.6%
0.0%
2.0%
4.0%
6.0%
8.0%
FY52-59 FY60-65
Avg
. fo
od
gra
in p
rod
uct
ion
g
row
th (
YoY
cha
ng
e, i
n %
)
FY52-59 FY60-65
The two decades leading to 1965 were marked by a range of socio-economic as well as foreign policy related developments
This period also saw the pace of foodgrain production slow down drastically
The combination of rising demand for food and slowing pace of foodgrain production meant that India had to deal with a crippling food scarcity problem
Strategy & Economy
January 09, 2018 Ambit Capital Pvt. Ltd. Page 21
the US to ensure that the wheat supplies reached hungry Indian mouths. More importantly, the US took the liberty to be blatantly critical of India's foreign policy of non-alignment, i.e. neither aligning with the US nor with the USSR in the Cold War. Given the towering standing that the US enjoyed on the global stage and given that India was an inconsequential country on the global stage at this point in time, America’s treatment of India affected India’s ability to operate as a sovereign.
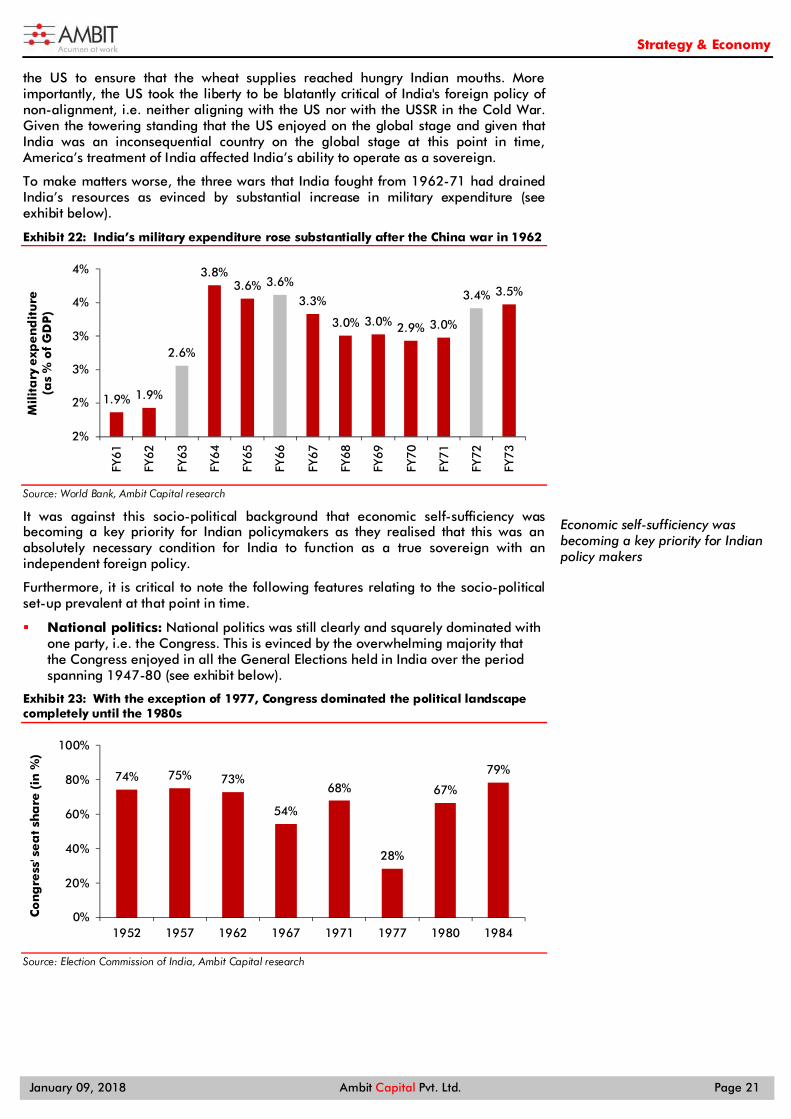
To make matters worse, the three wars that India fought from 1962-71 had drained India’s resources as evinced by substantial increase in military expenditure (see exhibit below).
India’s military expenditure rose substantially after the China war in 1962 Exhibit 22:
Source: World Bank, Ambit Capital research
It was against this socio-political background that economic self-sufficiency was becoming a key priority for Indian policymakers as they realised that this was an absolutely necessary condition for India to function as a true sovereign with an independent foreign policy.
Furthermore, it is critical to note the following features relating to the socio-political set-up prevalent at that point in time.
National politics: National politics was still clearly and squarely dominated with one party, i.e. the Congress. This is evinced by the overwhelming majority that the Congress enjoyed in all the General Elections held in India over the period spanning 1947-80 (see exhibit below).
With the exception of 1977, Congress dominated the political landscape Exhibit 23:completely until the 1980s
Source: Election Commission of India, Ambit Capital research
1.9% 1.9%
2.6%
3.8%3.6% 3.6%
3.3%
3.0% 3.0% 2.9% 3.0%
3.4% 3.5%
2%
2%
3%
3%
4%
4%
FY61
FY62
FY63
FY64
FY65
FY66
FY67
FY68
FY69
FY70
FY71
FY72
FY73
Mil
ita
ry e
xpe
nd
itu
re(a
s %
of
GD
P)
74% 75% 73%
54%
68%
28%
67%
79%
0%
20%
40%
60%
80%
100%
1952 1957 1962 1967 1971 1977 1980 1984
Co
ng
ress
' se
at
sha
re (
in %
)
Economic self-sufficiency was becoming a key priority for Indian policy makers

Strategy & Economy
January 09, 2018 Ambit Capital Pvt. Ltd. Page 22
The fact that Indian politics was a single-player game mattered, because this was one of the main reasons why the Congress was only focused on solving immediate economic problems (like that of food scarcity) rather than pursuing goals, such as economic liberalisation or infrastructure creation.
The party’s grip on power over FY1965-80 was such that it did not feel the need to boost the prospects of India’s private sector as there was no other political party with which it was competing for access to political funding.
Indian politics would become a multi-player game from the 1980s and this would coincide with policymakers according a high priority to boosting GDP growth, to economic liberalisation and to growing infrastructure networks (see pg 27 of this note for the section titled “Policy phase#2: From Socialism to Liberalisation FY1980-1995” and see pg 37 of this note for the section titled “Policy phase#3: India creates networks FY1995-2018”).
The international context: The world economy had been split into two camps with political affiliations as well as economic philosophy determined by Cold War alliances. Those aligned with the US were opting for the Western model of capitalism and whilst those aligned with the USSR were leaning towards Communism. India’s fierce desire to be non-aligned also meant it did not want to explicitly embrace capitalism at this point in time and hence opted to be a ‘mixed economy’.
Hence, it was only after the intensity of the Cold War softened in the 1980s that Indian policymakers became ready to embrace an economic system where the Government did not play a central role.
State of infrastructure & networks: It is critical to note that in this era the roads and railway networks created by the British were still sufficient to service the Indian populace.
Thus, building ‘networks’ was not a pressing demand made by the electorate, and consequently this was not a priority for Indian policymakers at this stage.
The need for creating networks would rise as a top priority from 1995 as India’s gaping infrastructure deficit would threaten to stall India’s GDP growth rate (see pg 27 of this note for the section titled Policy phase#3: India creates networks FY1995-2018).
Section B: Detailing the policy changes
The phenomenon of Green Revolution is defined as a series of research, development, innovation and technology transfer initiatives that were launched in the developing world from the 1960s and that resulted in increasing India’s agriculture production.
Norman Borlaug, an American agronomist, is credited as being the father of Green Revolution was awarded the Padma Vibhushan - India’s second highest civilian honour - in 2006 for his role in boosting agricultural productivity in India. The other thinkers and leaders who played a critical role in precipitating India’s Green Revolution were C. Subramaniam (India’s Agriculture minister over 1964-66), Indira Gandhi (the then Prime Minister) and MS Swaminathan (agricultural scientist).
Eminent people associated with Green Revolution Exhibit 24:Person Designation
Norman Borlaug American Agronomist and Father of Green Revolution
C. Subramaniam India’s Agriculture minister over 1964-66
MS Swaminathan Agricultural Scientist (Indian Agricultural Research Institute [IARI]).
Indira Gandhi India’s Prime Minister over 1966-77
Source: Ambit Capital research
The process for increasing foodgrain productivity started in 1962 when Borlaug’s hybrid seeds were tested in Punjab and Haryana. Thereafter, severe food shortage forced India to adopt high yielding variety (HYV) seeds (which Norman Borlaug has developed) and the use of fertilisers to boost agricultural productivity thereby leading other regions, such as Eastern and Southern India to adopt the same (see exhibit below).
The world economy had been split into two camps with political affiliations as well as economic philosophy determined by Cold War alliances
The process for increasing foodgrain productivity started in 1962

Strategy & Economy
January 09, 2018 Ambit Capital Pvt. Ltd. Page 23
How the Green Revolution spread in India over the 1960s Exhibit 25:
Time period Description
March 1962 Borlaug’s dwarf spring wheat strains were grown in the fields of the Indian Agricultural Research Institute (IARI) in Pusa, New Delhi.
March 1963 Rockefeller Foundation and the Mexican Government sent Borlaug and Dr. Robert Glenn Anderson to India to continue his work.
October 1965 New policy was put into practice when 114 districts (out of 325) were selected by the Ministry of Agriculture for an Intensive Agricultural Areas Programme (I.A.A.P.).
November 1965 Food Ministry was ready for the implementation of a High Yielding Varieties Programme in districts that had already been selected for intensive development under the I.A.D.P. and I.A.A.P. schemes
September 1966 India spent USD2.5 million for 18,000 tons of Mexican wheat seed, the largest purchase and import of any seed in the world at that time.
Source: Ministry of Agriculture, Ambit Capital research
Following the rapid introduction of high yielding wheat varieties, the production of wheat in India consistently started exceeding the 20-million tonne mark which was significantly more than the previous peak output of 12.3-million tonne achieved in the last good weather year of FY65 (see exhibit below).
Wheat production increased substantially after the Green Revolution Exhibit 26:
Source: Ministry of Agriculture, Ambit Capital research
Even as India’s wheat production grew rapidly over this period, it is worth noting that the Green Revolution in India did not have the far reaching impact it ought to have had owing to a range of political and socio-economic reasons.
Firstly, regionally, in India, the greatest impact of the Green Revolution was in the wheat-growing areas of Punjab, Haryana and Western Uttar Pradesh. Unfortunately, the rest of India experienced only a marginal improvement in productivity (see exhibit below).
The Green Revolution’s effect was not evenly distributed across India Exhibit 27:
Source: CEIC, Ambit Capital research
Secondly, the Green Revolution resulted in a meaningful boost for India’s wheat productivity even as rice productivity rose by a lesser degree (see exhibit below).
1012
10 11
1719
20
2426
25
0
5
10
15
20
25
30
FY64 FY65 FY66 FY67 FY68 FY69 FY70 FY71 FY72 FY73
Wh
ea
t p
rod
uct
ion
(in
mil
lio
n t
on
ne
s)
-4%
0%
4%
8%
Mah
aras
htra
Punj
ab
Har
yana
Goa
Guj
arat
Wes
t Ben
gal
Kar
nata
ka
And
hra
Prad
esh
Indi
a
Tam
il N
adu
Him
acha
l…
Utta
r Pr
ades
h
Raja
stha
n
Biha
r
Ori
ssa
Ker
ala
Mad
hya
Prad
esh
Exp
on
en
tia
l gro
wth
of
Ag
ri(F
Y71
-80
)
Following the rapid introduction of high yielding wheat varieties, the production of wheat in India consistently started exceeding the 20-million tonne
Green Revolution in India did not have the far reaching impact it ought to have had owing to a range of political and socio-economic reasons

Strategy & Economy
January 09, 2018 Ambit Capital Pvt. Ltd. Page 24
The Green Revolution only boosted productivity of wheat Exhibit 28:
Source: Ministry of Agriculture, Ambit Capital research
Thirdly, it is worth noting that the adoption and success of the Green Revolution related technology was affected to a great extent by the historical property relations (i.e. tenancy laws for agricultural lands) prevalent in India at that point in time. These systems held back agricultural sector growth mainly because there was no incentive for the cultivator/tenant to boost agricultural productivity leading to the rise of a classic agency-principal problem.
The table below details the extent of economic inefficiencies created by each of these land relations’ systems (see exhibit below).
The land tenure system set up by the British especially the zamindari system were unproductive Exhibit 29:Land tenure system Details
Zamindari or landlordism
-Under this system, most of the land was owned by a handful of people called the landlords. This landlord was entrusted by the British to collect taxes. This person, the Zamindar, thus had free reign and was able to set the terms of engagement for all of his peasants which were often unfair. - Not only could the landlord expel peasants who did not pay their taxes, but if a peasant did not pay taxes then his land was confiscated. This set the stage for social disparity as those who could not afford land were stripped of their ownership rights. Why was this system problematic from the perspective of adopting high yielding varieties? The zamindari system was inherently opposed to the capitalistic way of farming where the tenant had no incentive to increase productivity as it was appropriated by the landlord.
Raiyatwari
- Under the Raiyatwari system, taxes were collected directly from the cultivator, or raiyat. This meant that the cultivator actually owned the rights to their land. The taxes were not fixed as they were with the Zamindari system and instead they were calculated based on average annual output. - Furthermore, taxes then varied from place to place depending on soil types and were adjusted in response to changes in the productivity of the land. Why was this system less problematic from the perspective of adopting high yielding varieties? As the cultivator owned the rights of the land, it was in his incentive to adopt practises which could yield high growth.
Mahalwari
- This was a system prevalent in the Northwest states of India as well as Punjab. - As per this system the village was jointly owned by a group of cultivators who as a group were responsible for the collection of taxes. This system was very flexible and inconsistent; in some cases the groups in charge consisted of many people and in others there was only one or a few in charge, making it similar to Zamindari tenure. Why was this system also less problematic from the perspective of adopting high yielding varieties? Peasants or tenants have direct incentive to increase productivity unlike the zamindari system
Source: Ambit Capital research
0
1,000
2,000
3,000FY
61
FY63
FY65
FY67
FY69
FY71
FY73
FY75
FY77
FY79
FY81
FY83
FY85
FY87
FY89
Yie
ld(K
g/h
ect
are
)
Rice Wheat
Adoption and success of the Green Revolution related technology was affected to a great extent by the historical property relations

Strategy & Economy
January 09, 2018 Ambit Capital Pvt. Ltd. Page 25
The acceptance of Green Revolution technology was low in areas Exhibit 30:dominated by the Zamindari system (refer to areas highlighted in pink below)
Source: Indmaps, Ambit Capital research, Note: The region highlighted in pink was characterised by the Zamindari system.
Consequently, the new technology made available under the Indian Green Revolution was more readily accepted in areas (such as Punjab and Haryana) where pre-existing property relations were conducive to capitalist farming. Areas such as Bengal, Bihar, Orissa, modern-day Madhya Pradesh, Tamil Nadu and Andhra Pradesh that were historically under Zamindari system were able to imbibe very little of the Green Revolution technology.
Section C: The economic impact - India became self-sufficient on food, inequality reduced but headline GDP growth remained weak
The Central policymakers’ thrust on agriculture boosted the farm sector’s share of GDP from 38% in FY60 to 43% by FY80. This yielded two sets of benefits, namely: (1) India became self-sufficient on the food front, and (2) inequality in India abated as 75% of India’s population was employed in the farm sector.
However, just when India was able to manage a degree of order domestically, a whole host of Asian countries successfully overtook India on headline GDP growth rates as they successfully re-invented their economies. Moreover, average GDP growth in India came down during FY1965-80 at 3.2% as compared to 4.4% during FY1952-65. Likewise, the coefficient of variation (CV) of real GDP growth (a measure of the volatility of the GDP growth) remained high during FY1965-80 at 1.2 as compared to 0.5 during FY1952-65.
Impact on GDP growth - Whilst farm sector growth picked up, non-farm sector growth decelerated!
Whilst farm sector growth received an instant shot in the arm as a result of Green Revolution, the impact of these reforms on overall GDP growth was insignificant (see exhibit below).
A whole host of Asian countries successfully overtook India on headline GDP growth rates as they successfully re-invented their economies

Strategy & Economy
January 09, 2018 Ambit Capital Pvt. Ltd. Page 26
The period spanning FY1965-80 saw farm sector growth pick-up Exhibit 31:but headline growth remained lackluster
Period Growth rate (in %)
GDP Non-farm Farm
Pre-Green Revolution (FY51-65) 3.9% 5.6% 2.7% Green Revolution period (FY66-80) 3.6% 4.4% 2.8%
Delta +30bps -120bps +10bps
Source: CEIC, Ambit Capital research
Whilst the rest of Asia at this point in time was undergoing rapid industrialisation, such was the absence of all-round economic reforms in India that India’s GDP growth started lagging that of Asian peers (see exhibit below).
India’s GDP growth started lagging behind that Exhibit 32:of the Asian countries in the 1970s
Source: CEIC, Ambit Capital research
India’s per capita income started lagging Exhibit 33:behind that of China in the seventies
Source: CEIC, Ambit Capital research
Unsurprisingly, by the 1970s India’s GDP per capita fell behind that of China’s (see exhibit above).
Impact on inflation - Low oil prices and improvement in food supply lowered inflation
Consumer price inflation in India went into double digits over FY1964-67 due to a fall in agricultural production triggered by the frequent drought of the sixties. Then, the combination of contained oil prices and the Green Revolution driven increase in agricultural production resulted in the lowering of inflation by the late 1960s. However, the oil price shock of the early 1970s again pushed inflation back into double digits (see exhibit below).
Inflation levels in India were volatile over FY1965-80 Exhibit 34:
Source: CEIC, Ambit Capital research
-10%
0%
10%
20%
30%
197
0
197
2
197
4
197
6
197
8
198
0Re
al G
DP
gro
wth
(in
%)
India
China
Indonesia
Japan
Korea
6
7
8
9
10
1950
1957
1964
1971
1978
1985
1992
1999
2006
GD
P p
er
cap
ita
, 19
90
US$
(in
lo
g) India
China
South-EastAsia
2% 4% 3%
13%9%11%
13%
3%1%
5% 3%6%
17%
29%
6%
-8%
8%
3%6%
11%
-10%
0%
10%
20%
30%
40%
FY61
FY62
FY63
FY64
FY65
FY66
FY67
FY68
FY69
FY70
FY71
FY72
FY73
FY74
FY75
FY76
FY77
FY78
FY79
FY80
CP
I (Y
oY
cha
ng
e, i
n %
)
India’s GDP growth started lagging that of Asian peers
Consumer price inflation in India went into double digits over FY1964-67 due to a fall in agricultural production triggered by the frequent drought of the sixties

Strategy & Economy
January 09, 2018 Ambit Capital Pvt. Ltd. Page 27
After the first oil shock of early 1970s, consumer inflation remained under control in the late 1970s before it started rising again starting 1980.
Impact on equality - The reforms of FY1965-80 lowered inequality
The most progressive development over this policy phase was the fact that inequality not only remained low in India compared to the other South East Asian nations, but it actually reduced over this period. This dynamic of a reduction in income inequality would elude India over the two subsequent policy phases (see exhibit below).
Inequality in India remained low during FY1965-80 Exhibit 35:
Source: World Bank, Ambit Capital research. * Gini coefficient is a measure of statistical dispersion intended to represent the income or wealth distribution of a nation's residents, and is the most commonly used measure of inequality. Higher the Gini coefficient higher the inequality
Policy phase#2: From socialism to liberalisation (FY1980-95) “No power on earth can stop an idea whose time has come”
- Dr. Manmohan Singh quoting Victor Hugo in his landmark budget speech (July 1991)
Contrary to popular belief, India began the process of transitioning away from socialism in the 1980s and not in 1991. Even as the dream team comprising of PV Narsimha Rao (India’s PM from 1991- 96), Manmohan Singh (FM from 1991-96) and S.P. Shukla (Finance Secretary in 1991) are credited with initiating this transition, in more ways than one, this change was initiated a decade ago by the Gandhi family and some unsung heroes (see exhibit below for details).
The unsung heroes of India’s liberalisation process Exhibit 36:
Prime Ministers Finance Ministers Key civil servants
Indira Gandhi (1980-84)
R Venkataraman, Pranab Mukherjee P. C. Alexander (Principal Secretary to the PM) and I.G. Patel (Governor, RBI)
Rajiv Gandhi (1985-89) V.P Singh Sam Pitroda (Technological Advisor to Rajiv Gandhi)
PV Narsimha Rao (1991-96) Manmohan Singh
A.N Verma (Principal Secretary to the Prime Minister), Suresh Mathur (Industry Secretary), Naresh Chandra (Cabinet secretary), S.P. Shukla (Finance Secretary), Montek Singh Ahluwalia (Finance secretary)
Source: Ambit Capital research
The remaining part of this policy phase spanning FY1980-95 is divided into three sections.
The first sub-section (spanning pg 28 to pg 30) sets up the political backdrop that caused a relatively agrarian and poor country’s transition from socialism to a more pro-business and pro-market economy. We hypothesise that a combination of rising political competition and international pressure led the politicians of a poor country like India to embrace pro-market reforms.
0.24
0.28
0.32
0.36
1965
1966
1967
1968
1969
1970
1971
1972
1973
1974
1975
1976
1977
1978
1979
1980
Gin
i co
eff
icie
nt f
or
ine
qu
ali
ty*
India South-East Asia
The most progressive development over this policy phase was the fact that inequality not only remained low in India compared to the other South East Asian nations, but also reduced.
India began the process of transitioning away from socialism in the 1980s and not in 1991

Strategy & Economy
January 09, 2018 Ambit Capital Pvt. Ltd. Page 28
The second sub-section (spanning pg 30 to pg 33) details the policy changes that were affected. This section describes in detail what market-oriented and industry-friendly policies were pursued in order to unshackle India’s economy from the licence-permit-quota raj.
The third and final section (spanning 33 to pg 36) quantifies the macroeconomic impact of these policy changes. Our findings suggest that, whilst the change in economic philosophy clearly boosted India’s GDP growth and brought India’s inflation rates lower, the changes worsened indicators relating to income inequality.
Policy phase#2 was characterised by high growth, superior market returns, a rise in political competition and a Exhibit 37:rise in inequality
Source: Bloomberg, CEIC, World Bank, Election Commission of India, Ambit Capital research *Note: (1) The Gini coefficient measures the inequality among values of a frequency distribution. A Gini coefficient of zero expresses perfect equality, whereas Gini coefficient of 1 expresses maximal inequality among value. (2) Average GDP growth during this period: 4.7%, Average Gini coefficient: 0.33, Average seat share of Congress: 51% and Average Sensex returns: 27%
Section A: The political backdrop – Rising political competition and the rise of classical liberalism globally “The trigger for India’s economic growth was an attitudinal shift on the part of the national government in 1980 in favor of private business. The rhetoric of the reigning Congress Party until that time had been all about socialism and pro-poor policies. When Indira Gandhi returned to power in 1980, she re-aligned herself politically with the organized private sector and dropped her previous rhetoric. The national government’s attitude towards business went from being outright hostile to supportive. Indira’s switch was further reinforced, in a more explicit manner, by Rajiv Gandhi following his rise to power in 1984. This, in our view, was the key change that unleashed the animal spirits of the Indian private sector in the early 1980s.”
- Dani Rodrik in “From Hindu Growth to Productivity Surge: The Mystery of the Indian Growth Transition” (2004)
The first non-Congress Government at the Centre which was formed in 1977 failed to complete its full five-year term and fresh elections were called in 1980. Indira Gandhi returned to power but it is clear that she was a changed leader post the loss of 1977. Not only did she re-invent her political image but she was also forced to re-think her economic philosophy as well. So what drove this transition in Indira Gandhi’s economic philosophy away from socialism to a philosophy that was focused on embracing pro-market reforms?
67%
79%
37%45%
27%0.32 0.32 0.34 0.34 0.34
0%
1%
2%
3%
4%
5%
6%
7%
0%
20%
40%
60%
80%
100%
FY80
FY84
FY89
FY91
FY96
GD
P g
row
th/S
en
sex
Sea
t sh
are
/Gin
i co
eff
./Se
nse
x re
turn
s
Seat share of Congress (Left scale) Gini coeff. (Left scale)
Sensex returns (left scale) GDP growth (Right scale)
The first non-Congress Government at the Centre which was formed in 1977 failed to complete its full five-year term and fresh elections were called in 1980

Strategy & Economy
January 09, 2018 Ambit Capital Pvt. Ltd. Page 29
National politics: National politics in late 1970s was increasingly becoming a two-player game as opposed to being a single-player game with the degrees of political competition rising significantly from the early nineties (see exhibit below).
Political competition has increased in India Exhibit 38:
Source: Election commission of India, Ambit Capital research. Note: The effective number of parties is a concept which provides for an adjusted number of political parties in a country's party system. The idea behind this measure is to count parties and, at the same time, to weight the count by their relative strength. The relative strength refers to their vote share ("effective number of electoral parties") or seat share in the parliament ("effective number of parliamentary parties")
The Congress was realising that as compared to the situation thus far when the Congress had monopoly control over Indian politics, the rise of the BJP and certain regional parties was turning Indian politics into a system that can be characterised as a ‘monopolistic competition’. This mattered because the first non-Congress Government assuming power in 1977 prompted Indira Gandhi to realise that India was no longer a fiefdom that she could run based on her whims and fancies.
Also, it was clear that in her first long stint as PM (from 1966-77), the complex web of controlled prices that she had created had made the Indian economy vulnerable to exogenous price shocks such as the oil price spike of the 1970s. India desperately needed to grow at a faster rate and decontrolling prices as well as full-fledged liberalisation seemed like the easiest way to achieve this. During her second stint as PM beginning 1980 Utpadan badhao (i.e. increase production) replaced the earlier motto of Garibi hatao (i.e. eradicate poverty) which characterised Indira Gandhi’s Indian politics over 1967-77.
The international context: In the 1980s, it was clear that Soviet model of socialism that India had embraced had failed to deliver economic growth and also failed to deliver a sustainable rise in the standard of living for the masses. Globally too, developing countries which had adopted USSR’s model of development started abandoning this economic philosophy in favour of free-market capitalism. It is against this backdrop that India also started liberalising its economy.
State of infrastructure & networks: So far Indian policymakers had not focused on infrastructure development and India was running on the roads and railways that the British had created. Moreover, Indian policymakers could not have accorded a high priority to infrastructure creation because neither the Exchequer nor the private sector had the resources to focus on infrastructure creation.
The need for creating networks would become a primary priority from 1995 as India’s gaping infrastructure deficit would threaten to stall the country’s GDP growth rate.
1.7 1.7 1.8
3.1
2.12.6
2.21.6
4.33.7
5.85.2
5.86.5 6.6
0
1
2
3
4
5
6
7
1952
1957
1962
1967
1971
1977
1980
1984
1989
1991
1996
1998
1999
2004
2009
Effe
ctiv
e n
o. o
f p
oli
tica
l p
art
ies
(se
ats
)*
The rise of the BJP and certain regional parties was turning Indian politics into a system that can be characterised as a ‘monopolistic competition’
Soviet model of socialism that India had embraced had failed to deliver economic growth and also failed to deliver a sustainable rise in the standard of living
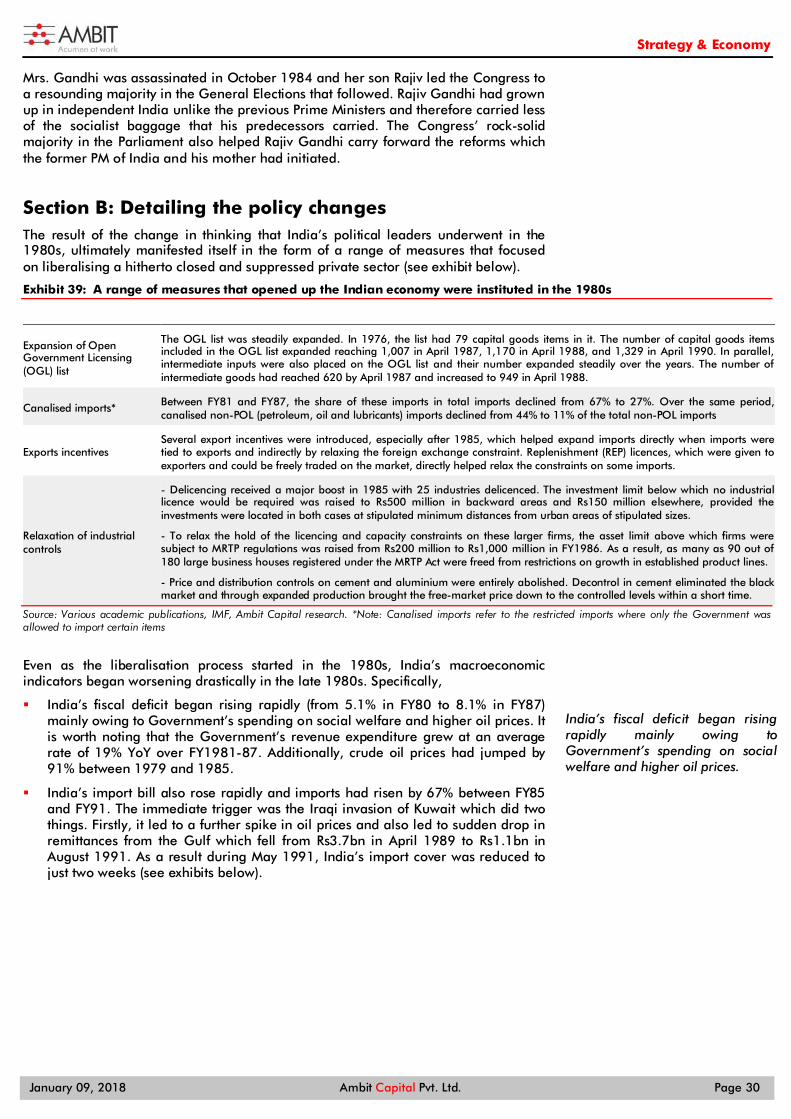
Strategy & Economy
January 09, 2018 Ambit Capital Pvt. Ltd. Page 30
Mrs. Gandhi was assassinated in October 1984 and her son Rajiv led the Congress to a resounding majority in the General Elections that followed. Rajiv Gandhi had grown up in independent India unlike the previous Prime Ministers and therefore carried less of the socialist baggage that his predecessors carried. The Congress’ rock-solid majority in the Parliament also helped Rajiv Gandhi carry forward the reforms which the former PM of India and his mother had initiated.
Section B: Detailing the policy changes The result of the change in thinking that India’s political leaders underwent in the 1980s, ultimately manifested itself in the form of a range of measures that focused on liberalising a hitherto closed and suppressed private sector (see exhibit below).
A range of measures that opened up the Indian economy were instituted in the 1980s Exhibit 39:
Expansion of Open Government Licensing (OGL) list
The OGL list was steadily expanded. In 1976, the list had 79 capital goods items in it. The number of capital goods items included in the OGL list expanded reaching 1,007 in April 1987, 1,170 in April 1988, and 1,329 in April 1990. In parallel, intermediate inputs were also placed on the OGL list and their number expanded steadily over the years. The number of intermediate goods had reached 620 by April 1987 and increased to 949 in April 1988.
Canalised imports* Between FY81 and FY87, the share of these imports in total imports declined from 67% to 27%. Over the same period, canalised non-POL (petroleum, oil and lubricants) imports declined from 44% to 11% of the total non-POL imports
Exports incentives Several export incentives were introduced, especially after 1985, which helped expand imports directly when imports were tied to exports and indirectly by relaxing the foreign exchange constraint. Replenishment (REP) licences, which were given to exporters and could be freely traded on the market, directly helped relax the constraints on some imports.
Relaxation of industrial controls
- Delicencing received a major boost in 1985 with 25 industries delicenced. The investment limit below which no industrial licence would be required was raised to Rs500 million in backward areas and Rs150 million elsewhere, provided the investments were located in both cases at stipulated minimum distances from urban areas of stipulated sizes.
- To relax the hold of the licencing and capacity constraints on these larger firms, the asset limit above which firms were subject to MRTP regulations was raised from Rs200 million to Rs1,000 million in FY1986. As a result, as many as 90 out of 180 large business houses registered under the MRTP Act were freed from restrictions on growth in established product lines.
- Price and distribution controls on cement and aluminium were entirely abolished. Decontrol in cement eliminated the black market and through expanded production brought the free-market price down to the controlled levels within a short time.
Source: Various academic publications, IMF, Ambit Capital research. *Note: Canalised imports refer to the restricted imports where only the Government was allowed to import certain items
Even as the liberalisation process started in the 1980s, India’s macroeconomic indicators began worsening drastically in the late 1980s. Specifically,
India’s fiscal deficit began rising rapidly (from 5.1% in FY80 to 8.1% in FY87) mainly owing to Government’s spending on social welfare and higher oil prices. It is worth noting that the Government’s revenue expenditure grew at an average rate of 19% YoY over FY1981-87. Additionally, crude oil prices had jumped by 91% between 1979 and 1985.
India’s import bill also rose rapidly and imports had risen by 67% between FY85 and FY91. The immediate trigger was the Iraqi invasion of Kuwait which did two things. Firstly, it led to a further spike in oil prices and also led to sudden drop in remittances from the Gulf which fell from Rs3.7bn in April 1989 to Rs1.1bn in August 1991. As a result during May 1991, India’s import cover was reduced to just two weeks (see exhibits below).
India’s fiscal deficit began rising rapidly mainly owing to Government’s spending on social welfare and higher oil prices.

Strategy & Economy
January 09, 2018 Ambit Capital Pvt. Ltd. Page 31
India’s fiscal deficit stayed in excess of 7% of Exhibit 40:GDP for 6 consecutive years (1986-91)
Source: CEIC, Ambit Capital research
India’s Current Account Deficit (CAD) expanded Exhibit 41:to 3% of GDP by FY91
Source: CEIC, Ambit Capital research
India’s fiscal deficit expanded mainly owing to Exhibit 42:a rise in revenue expenditure
Source: CEIC, Ambit Capital research
India’s Current Account Deficit (CAD) expanded Exhibit 43:mainly owing to a rise in oil prices and a collapse in exports
Source: CEIC, Ambit Capital research
India’s twin deficits (i.e. the fiscal deficit and current account deficit) led Indian policymakers to embrace another round of market reforms in 1991 and hence serendipitously India went on to complete the market reforms started in the 1980s (see exhibit below for details of the reforms implemented).
The Indian economy received a another dose of liberalisation in 1991 Exhibit 44:Head Details
New Industrial Policy
In a single stroke, the “Statement of Industrial Policy” dated July 24, 1991 and frequently called the New Industrial Policy did away with investment licencing and myriad entry restrictions on Monopoly and Restrictive Trade Practises (MRTP) firms. It also ended public sector monopoly in many sectors and initiated a policy of automatic approval for foreign direct investment up to 51%.
Licensing On licencing, the new policy explicitly stated, “industrial licencing will henceforth be abolished for all industries, except those specified, irrespective of levels of investment.” Exception to this rule was granted to 18 industries.
Public sector monopoly The 1991 policy statement also limited the public sector monopoly to eight sectors selected on security and strategic ground. All other sectors were opened to the private sector.
Foreign investments In the area of foreign investment, the policy statement abolished the threshold of 40% on foreign equity investment. The concept of automatic approval was introduced whereby the RBI was empowered to approve equity investment up to 51% in 34 industries.
External Trade The July 1991 package also made a break from the 1980s’ approach of selective liberalisation on the external trade front by replacing the positive list approach of listing licence-free items on the OGL list to a negative list approach.
Source: Various academic publications, IMF, Ambit Capital research
It is critical to note that two other meaningful reforms were administered during this period namely the deregulation of interest rates and relaxation of export-related restrictions.
5.1% 4.9%5.4%
6.8%
7.5%
8.1%
7.1%7.6%
4%
5%
6%
7%
8%
9% 1
980
198
1
198
2
198
3
198
4
198
5
198
6
198
7
198
8
198
9
199
0
199
1
Fisc
al d
efi
cit
(as
a %
of
GD
P) -0.4%
-1.5% -1.4%-1.1%
-2.1%-1.8%
-2.4%
-2.0%
-3.0%-3.5%
-3.0%
-2.5%
-2.0%
-1.5%
-1.0%
-0.5%
0.0%
198
0
198
1
198
2
198
3
198
4
198
5
198
6
198
7
198
8
198
9
199
0
199
1
CA
D(a
s a
% o
f G
DP
)
20%
11%
22%
15%
23%21%
19%
0%
5%
10%
15%
20%
25%
198
1
198
3
198
5
198
7
Re
ven
ue
exp
en
dit
ure
(Yo
Y ch
an
ge
, in
%)
- 1 2 3 4 5 6 7
-20%
-10%
0%
10%
20%
30%
40%
197
3
197
5
197
7
197
9
198
1
198
3
198
5
Oil
im
po
rts
(USD
bil
lio
n)
Exp
ort
s(Y
oY
cha
ng
e, i
n %
)
Exports (Left scale)
Oil imports (Right scale)
India went on to complete the market reforms started in the 1980s

Strategy & Economy
January 09, 2018 Ambit Capital Pvt. Ltd. Page 32
Decision#1: Deregulation of interest rates
Until 1991, a notable feature of the Indian monetary system had been the structure of administered rates of interest in which, both deposit and lending rates were regulated by the RBI. Since 1964, the RBI had been fixing all the deposit rates of commercial banks, and since 1960, their lending rates. The system of administered interest rates during the period 1960 to 1985 resulted in many distortions in the Indian economy such as:
The administered interest rate system had grown to be unduly complex and had reduced the ability of the banking system to promote the effective use of credit. High Statutory Liquidity Ratio (SLR) requirements along with priority sector lending left little room for the banks to do discretionary lending and this was creating inefficiencies in the forma that sectors which actually needed credit did not get it at the right price. SLR is the proportion of the net demand and time liabilities which banks have to park in Government designated securities.
The low yield on Treasury bills and Government securities had adversely affected bank profitability and the growth of capital markets. A high SLR requirement meant that banks parked large proportion of their funds into the Government securities. On the other hand, interest rates were regulated to keep borrowing costs low for the Government which meant banks earned little on their investments in SLR.
Hence, there was a strong case for doing away with the regulated interest rate regime which was not helping anyone other than the Exchequer.
The reforms of 1991 saw the: (1) dismantling the complex system of interest rate controls, (2) cutting down Cash Reserve Ratio (CRR is the proportion of the net demand and time liabilities which banks have to compulsorily park with the RBI; CRR was brought down from 15% in 1989 to 11% in 1998) and (3) reduction of the SLR (SLR was brought down from 38.8% in 1992 to 25% in 1997).
As a result, lending rates measured using the SBI advance rate fell from 18-19% during the late-1980s to about 12% by FY2000.
Interest rate decontrol was one of the most important reforms of 1991 Exhibit 45:
Source: CEIC, Ambit Capital research
Decision#2: Devaluation of the currency as well as trade liberalisation
The crisis of 1991 was essentially a Balance of Payments (BoP) crisis. Thus, it became necessary to devalue the INR and move towards a floating exchange rate regime rather than a pegged one. As a result, the INR was devalued by 30% in FY92 and by 18% again in FY93 (see exhibit below) to make the currency more competitive.
0%
4%
8%
12%
16%
20%
FY86
FY87
FY88
FY89
FY90
FY91
FY92
FY93
FY94
FY95
FY96
FY97
FY98
FY99
FY00
SBI
ad
van
ce r
ate
(in
%)
Pre crisis(1986-90)
Crisis and reform period
(1991-93)Post crisis(1994-00)
Until 1991, a notable feature of the Indian monetary system had been the structure of administered rates of interest
The crisis of 1991 was essentially a Balance of Payments (BoP) crisis
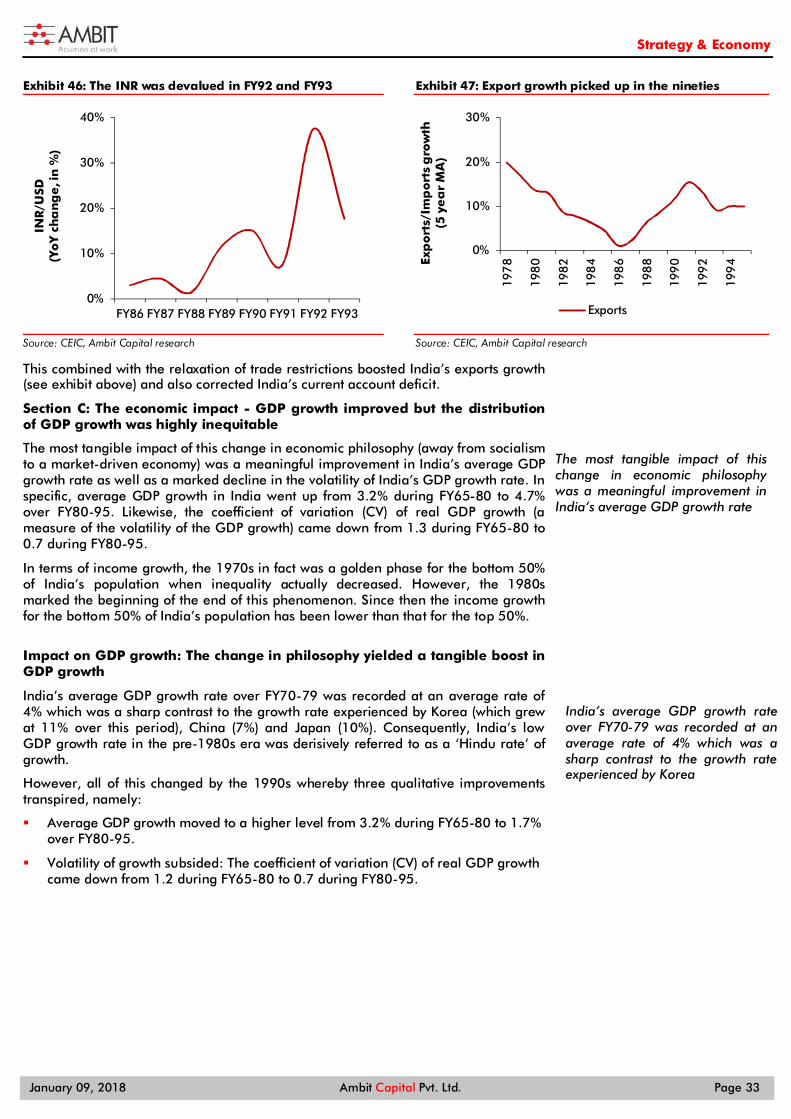
Strategy & Economy
January 09, 2018 Ambit Capital Pvt. Ltd. Page 33
The INR was devalued in FY92 and FY93 Exhibit 46:
Source: CEIC, Ambit Capital research
Export growth picked up in the nineties Exhibit 47:
Source: CEIC, Ambit Capital research
This combined with the relaxation of trade restrictions boosted India’s exports growth (see exhibit above) and also corrected India’s current account deficit.
Section C: The economic impact - GDP growth improved but the distribution of GDP growth was highly inequitable
The most tangible impact of this change in economic philosophy (away from socialism to a market-driven economy) was a meaningful improvement in India’s average GDP growth rate as well as a marked decline in the volatility of India’s GDP growth rate. In specific, average GDP growth in India went up from 3.2% during FY65-80 to 4.7% over FY80-95. Likewise, the coefficient of variation (CV) of real GDP growth (a measure of the volatility of the GDP growth) came down from 1.3 during FY65-80 to 0.7 during FY80-95.
In terms of income growth, the 1970s in fact was a golden phase for the bottom 50% of India’s population when inequality actually decreased. However, the 1980s marked the beginning of the end of this phenomenon. Since then the income growth for the bottom 50% of India’s population has been lower than that for the top 50%.
Impact on GDP growth: The change in philosophy yielded a tangible boost in GDP growth
India’s average GDP growth rate over FY70-79 was recorded at an average rate of 4% which was a sharp contrast to the growth rate experienced by Korea (which grew at 11% over this period), China (7%) and Japan (10%). Consequently, India’s low GDP growth rate in the pre-1980s era was derisively referred to as a ‘Hindu rate’ of growth.
However, all of this changed by the 1990s whereby three qualitative improvements transpired, namely:
Average GDP growth moved to a higher level from 3.2% during FY65-80 to 1.7% over FY80-95.
Volatility of growth subsided: The coefficient of variation (CV) of real GDP growth came down from 1.2 during FY65-80 to 0.7 during FY80-95.
0%
10%
20%
30%
40%
FY86 FY87 FY88 FY89 FY90 FY91 FY92 FY93
INR
/USD
(Yo
Y ch
an
ge
, in
%)
0%
10%
20%
30%
197
8
198
0
198
2
198
4
198
6
198
8
199
0
199
2
199
4Exp
ort
s/Im
po
rts
gro
wth
(5 y
ea
r M
A)
Exports
The most tangible impact of this change in economic philosophy was a meaningful improvement in India’s average GDP growth rate
India’s average GDP growth rate over FY70-79 was recorded at an average rate of 4% which was a sharp contrast to the growth rate experienced by Korea

Strategy & Economy
January 09, 2018 Ambit Capital Pvt. Ltd. Page 34
Until the 1970s, India was stuck in what is Exhibit 48:called the Hindu rate of growth
Source: CEIC, Ambit Capital research
GDP growth started accelerating in the 1980s Exhibit 49:
Source: CEIC, Ambit Capital research
The first dose of reforms administered in the 1980s and then the booster dose of 1991 created a solid ground for sustainable economic growth in the years to come (see exhibit below).
Economic growth in the 1990s was more sustainable than the growth seen Exhibit 50:in the 1980s
Source: CEIC, Ambit Capital research
In fact, such was the ideological power of these reforms that successive Governments have more or less taken these reforms forward and rather than tinkering with the basic ideology underlying these reforms.
From a demand side perspective, it is worth noting that this improvement in GDP growth was mainly driven by investments rising (see exhibit below).
2%
3%
4%
5%
6% 1
956
195
8
196
0
196
2
196
4
196
6
196
8
197
0
197
2
197
4
197
6
197
8
Re
al G
DP
gro
wth
(5 y
ea
r M
A)
0%
2%
4%
6%
8%
10%
198
0
198
3
198
6
198
9
199
2
199
5
199
8
200
1
200
4
200
7
201
0
201
3
Re
al G
DP
gro
wth
(5 y
ea
r M
A)
3%
4%
5%
6%
7%
FY80
FY81
FY82
FY83
FY84
FY85
FY86
FY87
FY88
FY89
FY90
FY91
FY92
FY93
FY94
FY95
FY96
FY97
FY98
FY99
FY00
Re
al G
DP
gro
wth
(5 y
r M
A, i
n %
)
Crisis and reform period
(1991-93)
Pre crisis Post crisis
Successive Governments have more or less taken these reforms forward

Strategy & Economy
January 09, 2018 Ambit Capital Pvt. Ltd. Page 35
Investment growth rose markedly in the 1990s Exhibit 51:
Source: CEIC, Ambit Capital research
Impact on inflation: Interest rate deregulation and reigning in the fiscal deficit helped control inflation
The rising fiscal deficit was one of the major drivers of higher consumer price inflation during the 1980s. To complicate matters (for the reasons mentioned three pages prior), the RBI could do little from a monetary policy perspective to rein in inflation.
With a conscious effort being made to control the fiscal deficit and reforms to deregulate interest rates, consumer prices started to come down during the latter part of the 1990s (see exhibit below).
India’s fiscal deficit and hence inflation came down in 1990s Exhibit 52:
Source: CEIC, Ambit Capital research
During the early 1990s, inflation also remained elevated owing to the existence of binding supply bottlenecks. However, as supply pressure eased and reforms started to show results, headline inflation as well as other constituents of inflation began to cool down.
Impact on inequality: The reforms of FY80-95 exacerbated inequality
French Economist, Thomas Piketty’s latest findings on India’s income distribution (https://goo.gl/TDcJxq) suggest that inequality has risen systematically since the 1980s. This is evident from the fact that: (1) the pace of income growth experienced by the bottom 50% of the population has been slower than the rest of India since the 1980s; and (2) the pace of income growth experienced by the top 10%, top 1% and top 0.1% of India’s population has been faster than the rest of India since the 1980s (see exhibits below). These findings – elaborated upon in the exhibits that follow - suggest that the fruits of reforms and the subsequent high growth have not been evenly distributed.
4%
5%
6%
7%
8%
9%
10%FY
80
FY81
FY82
FY83
FY84
FY85
FY86
FY87
FY88
FY89
FY90
FY91
FY92
FY93
FY94
FY95
FY96
FY97
FY98
FY99
FY00
Inve
stm
en
t gro
wth
(5 y
r. M
ovi
ng
Ave
rag
e, i
n %
) Pre crisis(1986-90)
Crisis and reform period
(1991-93)
Post crisis(1994-00)
3%
5%
7%
9%
11%
4%
5%
6%
7%
8%
198
0 1
981
198
2
198
3 1
984
198
5 1
986
198
7 1
988
198
9
199
0 1
991
199
2 1
993
199
4 1
995
199
6
199
7 1
998
CP
I i
nfl
ati
on
(5 y
r. M
A, i
n
%)
Fisc
al d
efi
cit
(5 y
r. M
ovi
ng
Avg
., a
s %
of
GD
P)
Fiscal deficit (Left scale) CPI (Tight scale)
The rising fiscal deficit was one of the major drivers of higher consumer price inflation during the 1980s.
During the early 1990s, inflation also remained elevated owing to the existence of binding supply bottlenecks

Strategy & Economy
January 09, 2018 Ambit Capital Pvt. Ltd. Page 36
Since the 1980s, the pace of income growth experienced by the bottom 50% of India’s Exhibit 53:population has been slower than the rest of India
Source: Piketty & Chancel (2017)
Since the 1980s, the pace of income growth Exhibit 54:experienced by the top 10% as well as the top 1% of India’s population has been faster than the rest of India
Source: Piketty & Chancel (2017)
The income share of the top 1% of India’s Exhibit 55:population has been rising since the 1980s
Source: Piketty & Chancel (2017)
The income share of the top 0.1% of India’s Exhibit 56:population has been rising since the 1980s
Source: Piketty & Chancel (2017)

Strategy & Economy
January 09, 2018 Ambit Capital Pvt. Ltd. Page 37
Policy phase#3: India creates networks (FY1995-2018)
“Networking inherently implies equality. Everyone, rich and poor, is plugged into the same electric, water, sewer, gas and telephone network. The poor may only be able to hook up years after the rich, but eventually they receive the same access.”
-Robert J. Gordon, “The Rise and Fall of American Growth” (2016)
If the FY80-95 era was about liberalising the economy and letting animal spirits lose, then the next 20 years were about India building infrastructure – physical, financial and virtual. The beginning of this period saw India build telecom connectivity and by the end of this period, India had made rapid strides on the financial inclusion and data access front. As regards roads, airways and electricity, whilst India made reasonable progress, it lagged behind peers, such as China and other East Asian Tigers with respect to railways and waterways. This focus on creating networks over FY95-18 combined with the tailwind of liberalisation-related reforms administered over FY80-95 meant that India’s GDP growth rose to an unprecedented level. However, inequality continued to widen – a trend that had begun in the 1980s.
The remaining part of this policy phase spanning 1995-2018 is divided into three sections.
The first sub-section (spanning pg 38 to pg 41) sets up the political backdrop explaining why it became necessary to create networks in an increasing connected world. Also, by this time, the infrastructure and networks were creating a drag on the economy and needed a shot in the arm to help boost growth.
The second sub-section (spanning pg 41 to pg 50) details the policy changes that were affected. The section explains in detail what legislation and rules were changed to create networks in India.
The third and final sub-section (spanning pg 50 to pg 52) quantifies the macroeconomic impact of these policy changes. Our findings suggest that, the average GDP growth increased as a result of creation of networks and volatility in GDP growth too came down. However, this phase also saw increase in inequality.
The third policy phase was characterised by GDP growth as well as the Sensex scaling new heights, inequality Exhibit 57:exacerbation and political competition remaining high
Source: Bloomberg, CEIC, World Bank, Election Commission of India, Ambit Capital research *Note: (1) The Gini coefficient measures the inequality among values of a frequency distribution. A Gini coefficient of zero expresses perfect equality, whereas Gini coefficient of 1 expresses maximal inequality among value. (2) Average GDP growth during this period: 6.6%, Average Gini coefficient: 0.36, Average seat share of Congress: 22% and Average Sensex returns: 11%.
67%
79%
37%45%
27%0.32 0.32 0.34 0.34 0.34
0%
1%
2%
3%
4%
5%
6%
7%
-20%
0%
20%
40%
60%
80%
100%
FY98
FY99
FY04
FY09
FY14
GD
P g
row
th/S
en
sex
Sea
t sh
are
/Gin
i co
eff
./Se
nse
x re
turn
s
Seat share of Congress (Left scale) Gini coeff. (Left scale)
Sensex returns (left scale) GDP growth (Right scale)
The beginning of this period saw India build telecom connectivity and by the end of this period, India had made rapid strides on the financial inclusion and data access front.

Strategy & Economy
January 09, 2018 Ambit Capital Pvt. Ltd. Page 38
Section A: The political backdrop – Two non-Congress Governments complete a full term and usher in a focus on networks “This time around, the election produced a clearer mandate in favor of the NDA, and Vajpayee formed a Government on October 13, 1999. This Government proved stable and served its full five-year term. The Vajpayee Government proceeded to carry forward the reform agenda in a number of directions, including international trade, foreign investment, insurance, telecommunications, electricity, roads, privatisation, and education. In terms of the reach of the reforms, this period matched the first three years of the Rao Government. The shift in the growth rate from 6 per cent to more than 8 per cent during 2003-07 must be attributed largely to these reforms”
- Arvind Panagariya in ‘India - The Emerging Giant’ (2008)
Three sets of reasons are likely to have triggered Indian policymakers’ focus on network creation over the period spanning FY1995-2018.
Firstly, with Indian policymakers having dedicated about 15 years to agricultural sector reforms (during policy phase#1 spanning FY65-80) and another 15 years on liberalising the non-farm sector (during policy phase#2 spanning FY80-95), it made sense to address India’s infrastructural deficits which could have acted as a binding constraint to GDP growth.
Secondly, General Elections in India were becoming an expensive affair given India’s democratic system which uniquely combines the first past the post (FPTP) system with a multi-party system. It is worth noting that this is a sharp contrast to the practice followed in Western democracies which either have FPTP (with a two-party system) or proportional representation (with a multi-party system).
Thus, Indian policymakers were now needed to raise the large sums of money required for winning elections by allowing the private sector the chance to profitably create infrastructure in return for sharing the spoils with the politicians. Not surprisingly therefore, some of the biggest corruption scams which transpired in India in the noughties related to the infrastructure sector (see exhibit below).
General Elections in India were becoming an expensive affair given India’s democratic system

Strategy & Economy
January 09, 2018 Ambit Capital Pvt. Ltd. Page 39
Some of the largest scams that materialised in India took place in the noughties and were in the infrastructure Exhibit 58:space
Head Description
Telecom contract scam (1996)
Sukh Ram who was the Telecom Minister in the P.V. Narsimha Rao’s cabinet was arrested by the CBI in September 1996 (after Rao’s term had ended) after cash worth Rs360mn was seized from his residence in connection with irregularities in awarding a telecom contract. Sukh Ram was subsequently sentenced to five years in jail.
2G spectrum scam (2010-11)*
The 2G spectrum scam involved politicians and government officials in India illegally undercharging mobile telephone companies for frequency allocation licences, which they would then use to create 2G subscriptions for cell phones. The minister and officials allegedly allocated spectrum on first come first serve basis bypassing the auction process. The shortfall between the money collected and the money which the law mandated to be collected is estimated to be Rs1.76tn, as valued by the Comptroller and Auditor General (CAG) of India in a landmark report published in November 2010.
PSU Banks’ NPAs (2012-Present)
The infrastructure sector accounts for an overwhelming 18% of the NPAs of the banking system today. Almost all of these loans were given between 2006 and 2012.
New Delhi Airport related scam (2012)
DIAL is a joint venture consortium of the GMR Group (54%), Airports Authority of India (26%), and Fraport AG & Eraman Malaysia (10% each). GMR is the lead member of the consortium. In January 2006, the consortium was awarded the concession to operate, manage and develop the IGI Airport following a competitive bidding process. DIAL entered into an Operations, Management and Development Agreement (OMDA) on 4 April 2006 with the Airports Authority of India (AAI). The initial term of the concession is for 30 years extendable for another 30 years. Besides upgrading the existing terminals, DIAL commissioned a new runway at IGI Airport on 25 September 2008. It also inaugurated the new domestic departure terminal 1D on 26 February 2009. According to the CAG report on DIAL (published in August 2012): “As per the Business Plan the original project cost approved by DIAL and communicated to AAI to 18 January 2008 was INR 8975 crore [US$1.5bn]. …The final project cost adopted by the Airports Economic Regulatory Authority (AERA) for arriving at the Regulatory Asset Base (RAB) was INR 12502.86 crore [US$2.1bn]…i.e. 43.25% higher than the original project cost… It was noted in the audit that at the time of financial closure in January 2008 levy of Development Fee [DF] was not contemplated. [However] Large part of the enhanced project cost was subsequently recovered by DIAL from the passengers using the airport through levy of DF….as per the original estimates the entire funding was to be through equity, debt, security deposits and internal accruals. However, this was reduced to 72.68 per cent of the total fund requirements of the actual project cost. This financial gap was mainly filled by levy of DF…OMDA did not envisage the funding of project cost through levy of DF from passengers….the inability of the shareholders of DIAL to bring in additional funds to the project through additional debt from financial institutions led to levy of DF on passengers.”
Coal block allocation scam (2012)
In 2012, CAG highlighted the fact that the UPA Government had inefficiently allocated coal blocks over CY04-09 resulting in loss to the exchequer to the tune of Rs1.86tn. In a landmark judgement in September 2014, the Supreme Court cancelled all coal blocks that had been allocated by the Centre and by state governments in the preceding 20 years.
Source: Media reports, Ambit Capital research. Note: All accused in the 2G spectrum scam were acquitted by the special CBI court on December 21
Furthermore, it is critical to note the following features relating to the socio-political set-up prevalent at that point in time which seem to have played a role in the policy-making apparatus focusing on infrastructure development.
National politics: National politics was now firmly a multi-player game in India at this point in time with the Congress and BJP having to deal with the rise of regional parties. This is evinced by the fact that regional parties accounted for close to 50% of seats in the Lok Sabha in the three General Elections that were held in the noughties (see exhibit below).
Parties other than Congress and BJP accounted for more than 40% of seats Exhibit 59:in the noughties
Source: Election Commission of India, Ambit Capital research
In fact, such was the competition on the national politics front that the number of political parties in India has actually grown at 23% p.a. over CY04-14 (CAGR; see exhibit below).
46% 48%
41%
0%
10%
20%
30%
40%
50%
60%
1999 2004 2009
Sha
re o
f se
ats
wo
n b
y p
art
ies
ex
Co
ng
ress
an
d B
JP
National politics was now firmly a multi-player game in India

Strategy & Economy
January 09, 2018 Ambit Capital Pvt. Ltd. Page 40
The number of political parties in India has Exhibit 60:grown exponentially over the last decade
Source: CEIC, Ambit Capital research
The total number of candidates contesting a Exhibit 61:
general election also rose rapidly
Source: CEIC, Ambit Capital research
This in turn has also meant that the number of candidates contesting in each election has also risen significantly (see exhibit above).
This rise in political competition was propelled no doubt by the fact that the spoils of rent seeking now available to Indian politicians were vast. The consolidated – i.e. Centre plus states – spend of the Indian Government is $615bn per annum. Even if one conservatively assumes that a meagre 10% of this ends up in the politicians’ pockets that translate into a $60bn per annum pie for the political class. To put this number into perspective, the largest company in the Nifty – TCS – reported post-tax earnings of $3.5bn in FY17.
The reason why the extent of political competition matters is simply because greater the political competition, the higher is the probability of the Government in power working to address the electorates’ need gaps (and thus getting the lion’s share of the pie mentioned above). For instance, the Congress failed to undertake market reforms or build networks over FY65-80 mainly because there were no other parties competing with the Congress for power. The Congress raised its game in the 1980s after political competition emerged in the 1970s.
State of infrastructure & networks: By the mid-1990s, the roads and railways created by the British were now grossly insufficient to service the Indian populace (see exhibit below).
In 1990 India ranked 52 out of 61 countries on Global Exhibit 62:Infrastructure Index
Source: Kiel Institute for the World Economy, Ambit Capital research
Hence, building ‘networks’ was a pressing demand made by the electorate and consequently became a policy priority for Indian policymakers.
53 27 34 36209
76 69215
363
1687
0
400
800
1200
1600
200019
52
1962
1977
1980
1996
1998
1999
2004
2009
2014
Nu
mb
er
of
pa
rtie
s co
nte
stin
g
the
ge
ne
ral e
lect
ion
4,750 4,648 5,435
7,514 8,251
-
2,000
4,000
6,000
8,000
10,000
1998 1999 2004 2009 2014
Tota
l no
. of
can
did
ate
s in
g
en
era
l ele
ctio
ns
123 56 89 12 15 17 20 24 26 28 32 3440
5261
010203040506070
Uni
ted
Stat
esJa
pan
Swed
enSw
itzer
land
Aus
tral
iaN
ethe
rland
sD
enm
ark
New
Zea
land
Luxe
mbo
urg
Isra
elK
orea
, Rep
.Ita
lySp
ain
Belg
ium
Kuw
ait
Bahr
ain
Slov
enia
Bulg
aria
Slov
ak R
ep.
Latv
iaM
alay
sia
Saud
i Ara
bia
Indi
aPa
nam
aO
man
Glo
ba
l in
fra
stru
ctu
re r
an
k
(19
90
)
This rise in political competition was propelled no doubt by the fact that the spoils of rent seeking now available to Indian politicians were vast

Strategy & Economy
January 09, 2018 Ambit Capital Pvt. Ltd. Page 41
The international context: The collapse in the 1980s of the ‘socialistic model’ championed by the erstwhile USSR had shaken the world’s belief in socialism. Then the spate of economic crises that unfolded (starting with the East Asian Crisis of 1997 and ending with the Lehman Crisis of 2008) dented the credentials of neo-liberal economics. It was against this backdrop that Emerging Markets (EMs) like South Korea, followed by Russia and then Brazil as well as Turkey saw the rise of ‘strongman economics’ whereby populist leaders began generating economic solutions that were seemingly customised for their country without subscribing to any single economic philosophy (click here for our note dated November 24, 2014 for details). The relative success of these tailor-made economic policies meant that more and more EMs began adopting this approach.
Given India’s gaping infrastructure deficit and given the rent-seeking potential that promoting infrastructure entailed, it made eminent sense for India’s strong-men (charismatic Chief Ministers as well as Prime Ministers) to facilitate the creation of networks in India. Not only does this address a need-gap for the populace, it facilitates the playing of the rent-seeking game which then facilitates big-ticket spending in election campaigns.
Evidence regarding the change in philosophy which was focused on explicit network-building can be seen through the lens of a range of legislative changes and policy changes that Governments in this era opted for which in turn paved the way for network building (see exhibit below).
Important policy changes between FY95 and 2018 Exhibit 63:Policy/Legislation Details
New Telecom policy, 1999 The New Telecom policy of 1999 aimed to provide a balance between the provision of universal service to all uncovered areas, including the rural areas, and the provision of high-level services capable of meeting the needs of the country's economy.
National Highways Development Project
The National Highways Development Project is a project to upgrade, rehabilitate and widen major highways in India to a higher standard. The project was implemented in 1998 under the leadership of Atal Bihari Vajpayee.
FRBM A Fiscal Responsibility and Budget Management (FRBM) Act was enacted by Parliament in 2003. The Rules accompanying the FRBM Act required the Centre to reduce the fiscal deficit to 3% of GDP and eliminate revenue deficit by March 31, 2008.
Unique Identity Authority of India
UIDAI was set up in 2009 as an attaché to the erstwhile Planning Commission to issue unique identification numbers to all its citizens.
PMJDY Prime Minister’s Jan Dhan Yojana (PMJDY) is the flagship programme of the National Democratic Alliance (NDA) II Government aiming to further financial inclusion by opening bank accounts for all Indian households. It was launched in August 2014.
Goods and Services Tax (GST)
The NDA Government has implemented the biggest tax reform since the independence making India one unified market for Goods and Services.
New Aviation policy, 2016 The Government has implemented the ‘New Aviation Policy’ which aims to make airline services accessible for the poor.
Waterways Act, 2015 The act seeks to add 106 inland waterways to the existing six National Waterways on the recommendations of the Parliamentary Standing Committee on Transport, Tourism and Culture and comments of several state governments
Digital India initiative Digital India is a campaign launched by the Government of India to ensure that Government services are made available to citizens electronically by improved online infrastructure and by increasing Internet connectivity or by making the country digitally empowered in the field of technology
Bharatmala Bharatmala is the new umbrella programme under which national highways will be constructed. Akin to the current National Highway Development Programme (NHDP), a large chunk of national highway projects will now be a part of this programme.
Source: Ambit Capital research
Section B: Detailing the policy changes
The result of the above change in economic philosophy of the policymakers was the relentless rise of networks over the short period spanning CY1995-2017 whereby India in a limited period of time became one of the emerging markets characterised by the highest ‘telecom’ penetration, reasonably elevated levels of ‘data’ consumption and the widest spread of ‘financial inclusion’. Whilst ‘roads’, ‘airways’ and ‘electricity’ were three other networks that India was able to make reasonable progress on, India lagged meaningfully on the ‘railways’ and ‘waterways’ front.
(A) The rise of the telecom sector in India
In 1999, the BJP framed the New Telecom Policy (NTP), which provided a critical boost to this sector. Under this policy, the Government changed the fixed licence fee regime to a revenue-sharing model for cellular and basic telecommunications services, which allowed more telecom service operators to enter the market. The new telecom policy for the first time allowed private players to operate in India with
The collapse in the 1980s of the ‘socialistic model’ championed by the erstwhile USSR had shaken the world’s belief in socialism
There was a relentless rise of networks over the short period spanning CY95-17
In 1999, the BJP framed the New Telecom Policy (NTP), which provided a critical boost to this sector

Strategy & Economy
January 09, 2018 Ambit Capital Pvt. Ltd. Page 42
decent profitability. Additionally, excise duties on important inputs, such as optical fibers and semiconductors were cut, providing easier access to telecom parts for equipment makers. Both these moves served to increase tele-density in India from 3 per 100 inhabitants in 2001 to 83 per 100 inhabitants in 2016 (see exhibit below).
Tele density rose rapidly during the noughties Exhibit 64:
Source: CEIC, Ambit Capital research
A cross-country comparison suggests that India has made rapid strides on this front and today, relative to other countries, tops the charts in terms of tele-density, i.e. the number of telephone connections for every hundred individuals (see exhibit below).
Tele-density in India is comparable to that of Exhibit 65:developed countries
Source: CEIC, Ambit Capital research, Note: The data pertains to CY16
India is one of the cheapest destinations for Exhibit 66:
telecom usage cost
Source: International Telecom Union, Ambit Capital research. Note: The list is for the bottom ten countries by telecom usage cost
Today not only is India leading rankings relating to tele-density, it is worth noting that the cost of incoming and outgoing calls in India are one of the lowest globally (see exhibit above).
6% 12%
75%88%
17% 25%
153% 154%
1% 7%
41%51%
0%
40%
80%
120%
160%
200%
NDA I (FY00-04) UPA I (FY05-09) UPA II (FY10-14) NDA II (FY15-17)
Tele
-de
nsi
ty(i
n %
)
Total Urban Rural
0%
40%
80%
120%
160%
200%
Russ
ia
Braz
il
Ger
man
y
Japa
n
USA
Indo
nesi
a
Chi
na
Indi
a
Mex
ico
Tele
-de
nsi
ty(i
n %
)
$1.0
$1.4
$2.0 $2.1 $2.5
$2.8 $3.0 $3.2 $3.3 $3.3
$0
$1
$2
$3
$4
Sri L
anka
Bang
lade
sh
Iran
Paki
stan
Nep
al
Indi
a
Bhut
an
Man
golia
Ethi
opia
Suda
n
Mo
nth
ly p
ho
ne
usa
ge
co
st(i
n U
S d
oll
ars
)
Cost of incoming and outgoing calls in India is one of the lowest globally

Strategy & Economy
January 09, 2018 Ambit Capital Pvt. Ltd. Page 43
(B) The rapid rise of financial inclusion
“If money stays in hand, there is a desire sometimes to overspend it. Today, there is an atmosphere of restraint. The poor man too feels that money saved will come for the use of his children or in some other good venture.”
- Narendra Modi, August 2017
The stage for the revolution in financial inclusion in India was set by the establishment of the Unique Identification Authority of India (UIDAI) - the brainchild of the Infosys chairman, Nandan Nilekani, and the then PM, Manmohan Singh - in December 2010. The agency was vested with the task of issuing a 12-digit unique identity number to each Indian resident based on biometric and demographic data.
After its victory in the May 2014 General Elections, the NDA Government took up this initiative with renewed vigour. Starting with the issuance of the first Unique Identification (UID) in September 2010, UIDAI has issued 1.17 billion unique identification numbers as of November 2017.
According to the Census data of 2011, only 59% of Indian had access to banking services. However, after coming to power in 2014, the Modi Government launched an ambitious financial inclusion programme called the Pradhan Mantri Jan Dhan Yojana (PMJDY). This was one of Narendra Modi’s pet schemes and was directly monitored by the PMO with execution conducted on a war footing. PMJDY was essentially done to create financial networks for the poor so that the Direct Benefits Transfer (DBT) could be implemented with ease (click here for our March 2015 “Modi’s resets” note for details).
PMJDY seems to have been personally supervised by the Prime Minister Narendra Modi himself. Launched in August 2014, the number of accounts opened under the scheme has crossed 300mn thereby making it one of the most ambitious financial inclusion drives in the world. As a result, more than 95% of total households in India now have at least one bank account (see exhibit below).
Until 2014 India fared poorly on financial Exhibit 67:inclusion
Source: Census of India, Ambit Capital research
The rapid rise of Jan Dhan (PMJDY) Exhibit 68:
Description Number Unit Source
Number of accounts opened under PMJDY to date
306 mn PMJDY
Number of Aadhaar cards issued 1,171 mn UIDAI
RuPay Cards issued 230 mn PMJDY
Total deposits in the PMJDY accounts
677 Rs billion PMJDY
Source: Source: pmjdy.gov.in, Ambit Capital research. Note: Status reflected refers to November 08, 2017. *Note: all PMJDY accounts are linked to Aadhaar.
In fact, the thrust on opening bank accounts, Aadhaar and an already robust mobile network helped boost the mobile payments considerably in the last two years (see exhibit below).
36%
59%
0%
10%
20%
30%
40%
50%
60%
70%
2001 2011
Acc
ess
to b
an
kin
g s
erv
ice
s(a
s %
of
tota
l po
pu
lati
on
)
The stage for the revolution in financial inclusion in India was set by the establishment of UIDAI
According to the Census data of 2011, only 59% of Indian had access to banking services

Strategy & Economy
January 09, 2018 Ambit Capital Pvt. Ltd. Page 44
Mobile banking has grown at a rapid pace in the recent past Exhibit 69:
Source: RBI, Ambit Capital research
(C) The Indian consumer shows appetite for data consumption
“The foundation of the fourth industrial revolution is connectivity and data. Data is the new natural resource. We are at the beginning of an era where data is the new oil."
- Mukesh Ambani, Chairman and MD, Reliance Industries, February 2017
It is worth noting that internet penetration levels in India are far lower than that of emerging markets with the same per capita income level (see exhibit below). Why did India perform well on telecom penetration but lagged behind in internet penetration? The answer lies in India’s poor literacy levels which are far worse than in comparable emerging economies.
India still lags peers on internet penetration Exhibit 70:
Source: World Bank, Ambit Capital research. Data pertains to CY16
This policy change in the form of digital India initiative then led to the launch of Reliance’s Jio initiative in July 2017, which offers 4G connectivity at extremely low rates (see exhibit below), has transformed the Indian connectivity landscape. Given Reliance Jio’s ambitious expansion plans and the cut-throat competition in the data provision space (between Reliance, Bharti, Vodafone and Idea), India’s progress on this parameter too is set to continue. India is now the second largest country in the world in terms of data consumption.
0 01
4
13
0
2
4
6
8
10
12
14
FY13 FY14 FY15 FY16 FY17
Mo
bil
e b
an
kin
g
(in
IN
R t
rill
ion
)
84
68
49 5158
3544
17 18
40
0
20
40
60
80
100
Sout
h Ko
rea
Mal
aysi
a
Chi
na
Turk
ey
Braz
il
Thai
land
Mex
ico
Indo
nesi
a
Indi
a
Phili
ppin
es
No
. of
inte
rne
t u
sers
(pe
r 1
00
pe
rso
ns)
Internet penetration levels in India are far lower than that of emerging markets

Strategy & Economy
January 09, 2018 Ambit Capital Pvt. Ltd. Page 45
Data consumption in India has been rising at a Exhibit 71:rapid pace
Source: Department of telecom, Ambit Capital research
Jio’s entry has initiated a price war in data Exhibit 72:
Source: Department of telecom, Ambit Capital research
(D) The road-building effort – India has come a long way but there’s a long way to go
The road building programme first received a boost during NDA-I’s tenure with the commissioning of the National Highways Development programme under which the National Highways Authority of India (NHAI) was established. The traditional contractor model for road building, which is almost as old as independent India, entails bidding for a public works or infra contract at a low rate which other bidders/contractors cannot match and then, once the contract is given, maximising the upside by either asking the Government for more funds or by imposing levies on the public.
Starting in the mid-1990s, as the Indian Government stepped up its programme of building roads between its major cities (and peaking with the NDA Government’s turn of the century ‘Golden Quadrilateral’ road building programme), a new generation of contractors became very large, very fast on the back of large road construction contracts. The road building programme received another shot in the arm when the current NDA-II Government announced the Bharatmala project (see exhibit below) in October, 2017.
Various Governments since 1998 have given thrust to road building Exhibit 73:
Project Description
National highways development project
This was a landmark project initiated in 1998 and helped create the National Highways Authority of India. Under the National Highways Development Project, the Golden Quadrilateral and widening up of the North-South-East-West Corridor was undertaken.
Rural Roads The Government launched the Pradhan Mantri Gram Sadak Yojana in 2000 with an aim to connect all the unconnected villages by all-weather roads.
Bharat Nirman Bharat Nirman was a four-year scheme spanning FY06-09 that aimed to connect 66,802 habitats with all-weather roads.
Bharatmala Bharatmala is the new umbrella programme under which national highways will be constructed. Akin to the current National Highway Development Programme (NHDP), a large chunk of national highway projects will now be a part of this programme.
Source: Ministry of Roads, Ambit Capital research
Consequently, India over the noughties has made rapid progress in expanding its roads network spanning national highways, state highways and rural roads (see exhibit below).
- 500
1,000 1,500 2,000 2,500 3,000 3,500 4,000 4,500
Mar
'12
Sep'
12
Mar
'13
Sep'
13
Mar
'14
Sep'
14
Mar
'15
Sep'
15
Mar
'16
Sep-
16
Mar
-17
Sep-
17
Da
ta c
on
sum
pti
on
/ u
ser/
mo
nth
(in
MB
)
-
0.050
0.100
0.150
0.200
0.250
0.300
Dec
-14
Mar
-15
Jun-
15
Sep-
15
Dec
-15
Mar
-16
Jun-
16
Sep-
16
Dec
-16
Mar
-17
Jun-
17
Sep-
17
Da
ta ta
riff
(Rs/
MB
)
Idea Airtel
Jio's entry
The road building program first received a boost during NDA-I’s tenure with the commissioning of the NHAI
India over the noughties has made rapid progress in expanding its roads network

Strategy & Economy
January 09, 2018 Ambit Capital Pvt. Ltd. Page 46
National and state highways received a boost Exhibit 74:in the noughties…
Source: MoRTH, Ambit Capital research
…so did rural roads Exhibit 75:
Source: MoRTH, Ambit Capital research
Furthermore, since the present NDA Government came to power, there has been a significant uptick in national highway project awards, construction progress and also resolution of multiple slow-moving projects (see exhibits below). This in turn has been achieved through more budgetary allocations, policy changes (such as empowering the MORTH (Ministry of Roads, Transport and Highways) & implementing single-window clearances and vendor support (changes to concession agreement; resolution of arbitrations).
Overall road awards (NHAI + MORTH)* have Exhibit 76:increased materially
Source: MORTH, Ambit Capital research. * NHAI stands for National Highways Authority of India and MORTH stands for Ministry of Road Transport and Highways
The pace of construction (NHAI+MORTH)* has Exhibit 77:also started recovering in the last 2 years
Source: MORTH, Ambit Capital research. * NHAI stands for National Highways Authority of India and MORTH stands for Ministry of Road Transport and Highways
However, it is worth noting that these achievements are below the targets set by the Roads Minister. Indeed, the target for road awards in FY17 was 25,000kms vs achievement of 15,000kms. Similarly, execution targets of 40kms a day at the beginning of FY17 ended at 23km a day. Major exercises, such as monetisation of national highways through the ToT (toll-operate-transfer) model have not yet fructified and banks continue to be hesitant to provide working capital to road projects.
Even on a cross-country basis, India lags on the population-adjusted road length front. Although India boasts of the second-highest road length after the USA, India’s road length on a ‘per square kilometer’ basis or ‘per capita basis’ is far lower than that of peers.
81
126
161190
235262 265
0
50
100
150
200
250
30019
71
1981
1991
2001
2011
2014
2015
Len
gth
of
sta
te h
igh
wa
ys
an
d n
ati
on
al h
igh
wa
ys(i
n '0
00
KM
s)
355 629
1,260
1,972
2,750
3,304 3,337
-
500
1,000
1,500
2,000
2,500
3,000
3,500
4,000
1971
1981
1991
2001
2011
2014
2015
Len
gth
of
rura
l ro
ad
s(i
n '0
00
KM
s)
9,794
1,961 3,625
7,980 10,098
16,271
25,000
-
5,000
10,000
15,000
20,000
25,000
30,000
FY12
FY13
FY14
FY15
FY16
FY17
FY18
e*
Roads awarded(in kms)
2,013
5,732 4,260 4,410
6,061
8,231
15,000
-
2,000
4,000
6,000
8,000
10,000
12,000
14,000
16,000
FY12
FY13
FY14
FY15
FY16
FY17
FY18
e*
Roads constructed(in kms)
Since the present NDA Government came to power, there has been a significant uptick in national highway project awards
On a cross-country basis, India lags on the population-adjusted road length front

Strategy & Economy
January 09, 2018 Ambit Capital Pvt. Ltd. Page 47
In absolute terms, India is second to USA in Exhibit 78:road length network but…
Source: World Bank, Ambit Capital research
…on a per capita basis it lags EMs like Russia Exhibit 79:and Brazil
Source: World Bank, Ambit Capital research
(E) Electricity - Glass half full
Electricity in India is a concurrent subject on which both Centre and the States can create laws. However, electricity distribution is solely a state subject. Therefore although the Central Government has undertaken several reforms in this sector (see exhibit below), the failure of state governments to take up reforms has stalled progress. In specific, most state governments have failed to curb power theft and failed to collect the tariffs associated with power consumption.
Between 1999 and 2003 landmark laws were passed to reform the electricity sector Exhibit 80:
Reform Description
The Electricity Regulatory Commissions Act, 1999
It aimed to provide for the establishment of a Central Electricity Regulatory Commission and State Electricity Regulatory Commissions, rationalisation of electricity tariff, transparent policies regarding subsidies, promotion of efficient and environmentally benign policies.
Accelerated Power Development Programme, 2001
This programme was meant to improve the power supply reliability at distribution level and to achieve commercial viability of the state electricity departments.
Electricity Act, 2003 The Government of India passed the landmark Electricity Act in 2003 which replaced the 1910, 1948 and 1999 electricity laws. The act covers major issues involving generation, distribution, transmission and trading in power.
Source: Ministry of Power, Ambit Capital research
In fact, the Electricity Act of 2003 was a landmark law in more ways than one. The Act altered the organisation and governance in the sector dramatically by consolidating laws related to generation, transmission, distribution, trading and use of electricity. However, the success in improving the service, attracting more private players and bringing down commercial losses has been limited, because: There is a lack of political will to get farmers pay for the electricity. Regulatory agencies in almost all states have failed to act independently and
have failed to move the price of electricity closer to the cost for the household consumers.
State Electricity Boards (SEBs) have failed to operate on a commercial basis resulting in very low collections.
Even as India has made some progress on providing electricity to its masses, the pace of growth has been very slow and India has one of the lowest per capita consumption of electricity amongst peers (see exhibit below).
0
1000
2000
3000
4000
5000
6000
7000U
SA
Indi
a
Chi
na
Braz
il
Russ
ia
Japa
n
Can
ada
Fran
ce
Len
gth
of
roa
ds
(in
'00
0 o
f K
Ms)
0.000
0.005
0.010
0.015
0.020
0.025
0.030
Can
ada
USA
Fran
ce
Japa
n
Russ
ia
Braz
il
Indi
a
Chi
naLen
gh
th o
f ro
ad
pe
r ca
pit
a(k
m p
er
cap
ita
)Electricity in India is a concurrent subject on which both Centre and the States can create laws
Electricity Act of 2003 was a landmark law in more ways than one

Strategy & Economy
January 09, 2018 Ambit Capital Pvt. Ltd. Page 48
Electricity generation picked up in noughties Exhibit 81:
Source: Ministry of Power, Ambit Capital research
India has one of the lowest per capita Exhibit 82:consumption of electricity amongst peers
Source: Ministry of Power, Ambit Capital research
(F) Railways - Too little, too late
India has hardly added any new route-kilometers to its railway network since independence (see exhibit below).
India has added only 6,000kms of railway track length since FY1971 (on a Exhibit 83:base of 60,000kms)
Source: Ministry of Railways, Ambit Capital research
In fact, since FY71, the total route kilometers have gone up by a meagre 6,000kms (see exhibit above). As a result of this slow progress, India lags behind peers with respect to the reach of the railway network (see exhibit below).
India lags its peers when it comes to rail networks Exhibit 84:
Source: World Bank, Ambit Capital research.
61 119
289
561
1,176 1,336
-
200
400
600
800
1,000
1,200
1,400
1,600
1971 1981 1991 2001 2014 2016
Ele
ctri
city
ge
ne
rati
on
(i
n '0
00
GW
)
-
2,000
4,000
6,000
8,000
10,000
12,000
Sout
h Ko
rea
Mal
aysi
a
Chi
na
Turk
ey
Braz
il
Thai
land
Mex
ico
Indo
nesi
a
Indi
a
Phili
ppin
es
Ele
ctri
c p
ow
er
con
sum
pti
on
(K
Wh
pe
r ca
pit
a)
50
54
58
62
66
70
FY71
FY73
FY75
FY77
FY79
FY81
FY83
FY85
FY87
FY89
FY91
FY93
FY95
FY97
FY99
FY01
FY03
FY05
FY07
FY09
FY11
FY13
Tra
in r
ou
te k
ilo
me
tra
ge
(in
'00
0 K
Ms)
-
500,000
1,000,000
1,500,000
2,000,000
2,500,000
3,000,000
2000
2001
2002
2003
2004
2005
2006
2007
2008
2009
2010
2011
2012
2013
2014
2015
Ra
ilw
ays
go
od
s tr
an
spo
rte
d(m
illi
on
-to
n-K
m)
ChinaIndiaRussia
Since FY71, the total route kilometers have gone up by a meagre 6,000kms

Strategy & Economy
January 09, 2018 Ambit Capital Pvt. Ltd. Page 49
A seminal report published by Dr. Rakesh Mohan in 2001 outlines why the Indian Railways had not been able to make progress even though India has one of the largest rail networks in the world (see exhibit below).
Indian Railways has not been able to operate commercially due to political pressures Exhibit 85:
Head Description
Lack of focus on customers
The lack of customer focus is characteristic of the “government department” attitude of Indian Railways. Competing modes of transport (primarily road transport) are far more responsive to market requirements. National Highway Development Project linking the four metro cities is likely to provide the biggest threat to the Indian Railways’ freight and passenger shares. Frequent air-conditioned bus services will increase tremendously with the availability of fast, quality four lane highways.
Lack of clarity regarding purpose
On the one hand, at least since the separation of accounts in 1924, Indian Railways is seen by the Government and by itself as a commercial organisation. It should therefore be financially self-sufficient. On the other hand, as a department of the government it is seen as a social organisation which must be subservient to fulfilling social needs as deemed fit by the government.
Outdated business structure
Indian Railways currently functions as a Government department. This has limited its flexibility to respond to changes in the market place. The inability to change prices in response to increase in costs or the market scenario highlights the various compulsions under which the Railway operates.
Lack of autonomy (from politicians)
Although the Railway Board is currently provided considerable autonomy within the existing framework, the organisation has historically been subject to significant political pressures. As a result, the Railways have often found it difficult to take decisions that may be beneficial from a commercial viewpoint but are perceived to be politically unpopular, particularly in the area of pricing of passenger services.
Source: The Indian Railways Report (2001) by Dr. Rakesh Mohan; Ambit Capital research
The current NDA Government has laid down an ambitious Rs8.5tn (US$127bn) capex plan for the next five years (FY15-20). Most of the said amount will be spent on network decongestion and network expansion (see exhibit below).
In 2015, the Railways announced an ambitious capex plan Exhibit 86:
Head Investment target (Rs bn)
Network Decongestion (including DFC + electrification, Doubling + electrification & traffic facilities) 1,993
Network Expansion (including electrification) 1,930
National Projects (North Eastern & Kashmir connectivity projects) 390
Safety (Track renewal, bridge works) 1,270
Information Technology/Research 50
Rolling Stock (Locomotives, coaches, wagons – production & maintenance) 1,020
Passenger Amenities 125
High Speed Rail & Elevated corridor 650
Station redevelopment + logistic parks 1,000
Others 132
Total 8,560
Timeline By end-FY20
Source: Ministry of Railways, Ambit Capital research
(G) Waterways – Much needs to be done
Waterways development never received attention until recently from the Government. The Inland Waterways Authority of India (IWAI) has never received sufficient regulatory powers as the NHAI or the Directorate General of Civil Aviation (DGCA). Consequently, India’s current network of waterways is fairly rudimentary. For instance, inland waterways in India make up a paltry 3% of the total volume of transport compared with China’s 47%, according to data from National Waterways Authority of India. The length of waterways in India is extremely short and this opens up a huge opportunity for India to develop its waterways.
The current NDA Government has laid down an ambitious Rs8.5tn (US$127bn) capex plan for the railways
Waterways development never received attention until recently from the Government.

Strategy & Economy
January 09, 2018 Ambit Capital Pvt. Ltd. Page 50
India lags peers when it comes to waterways network Exhibit 87:
Source: World Bank, Ambit Capital research. Data pertains to CY15.
The NDA Government passed the New National Waterways Act in February 2016 which proposes to build 106 new waterways on the existing six National Waterways (see exhibit below for details) throughout the country, thereby expanding the volume of goods and passengers moved via inland waterways (see exhibit below).
The New Waterways Act, 2016 aims to add 106 national waterways Exhibit 88:Head Description
What the National Waterways Act seeks?
The act seeks to add 106 inland waterways to the existing six National Waterways on the recommendations of the Parliamentary Standing Committee on Transport, Tourism and Culture and comments of several state governments.
Progress
The act will also look after the renovation and maintenance of the existing waterways. Out of the 106 new waterways, 18 have already been identified. These include five waterways each from Karnataka and Meghalaya, three each from Maharashtra and Kerala, one each from Tamil Nadu and Rajasthan.
Other provisions in the act
The act also aims to help the Inland Waterways Authority of India (IWAI) to develop the feasible stretches for Shipping and Navigation.
Timelines To be completed by CY20
Source: National Waterways Authority of India, Ambit Capital research
Section C: The economic impact - GDP growth scaled new highs but once again the distribution of the growth was highly inequitable
The most tangible impact of creation of networks was a meaningful improvement in India’s average GDP growth rate as well as a marked decline in the volatility of India’s GDP growth rate. In specific, average GDP growth in India rose from 5.2% over FY80-95 to 6.8% over FY95-present. Likewise, the coefficient of variation (CV) of real GDP growth (a measure of the volatility of the GDP growth) declined from 0.6 over FY80-95 to 0.3 over FY95-Present.
Impact on GDP growth: GDP growth scaled new highs
The coming together of agricultural reforms that were administered over FY65-80, the economic reforms of FY80-95 and then networks creation over FY1995-2018 meant that India’s GDP growth rate scaled levels that were even 20 years ago unimaginable – earning itself the tag of the fastest-growing major world economy in 2016 and again in 2017. In specific, three qualitative improvements transpired:
Average GDP growth moved to a higher level from an average of 4.7% YoY during FY80-95 to 7% during FY1995-2018.
The coefficient of variation (CV) of real GDP growth – a measure of volatility - came down drastically from 0.69 during FY80-95 to 0.28 during FY1995-2018
The five-year moving average real GDP growth accelerated from 4.7% during FY80-95 to 6.8% during FY1995-2018.
The exhibit below shows the improvement that materialised in each of the above three mentioned parameters (see exhibit below).
126
102
50
22 18 15
0
20
40
60
80
100
120
140
China Russia Brazil Indonesia Vietnam India
Len
gth
of
wa
terw
ays
(in
'oo
o K
Ms)
The NDA Government passed the New National Waterways Act in February 2016
The most tangible impact of creation of networks was a meaningful improvement in India’s average GDP growth
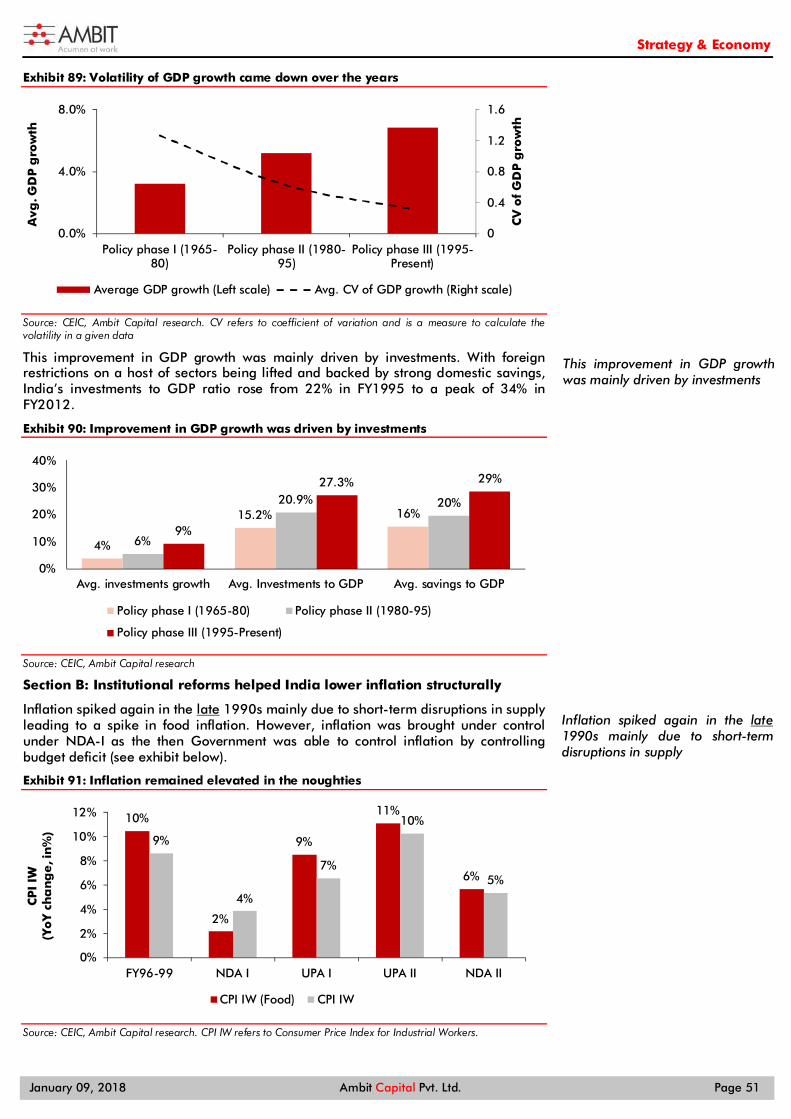
Strategy & Economy
January 09, 2018 Ambit Capital Pvt. Ltd. Page 51
Volatility of GDP growth came down over the years Exhibit 89:
Source: CEIC, Ambit Capital research. CV refers to coefficient of variation and is a measure to calculate the volatility in a given data
This improvement in GDP growth was mainly driven by investments. With foreign restrictions on a host of sectors being lifted and backed by strong domestic savings, India’s investments to GDP ratio rose from 22% in FY1995 to a peak of 34% in FY2012.
Improvement in GDP growth was driven by investments Exhibit 90:
Source: CEIC, Ambit Capital research
Section B: Institutional reforms helped India lower inflation structurally
Inflation spiked again in the late 1990s mainly due to short-term disruptions in supply leading to a spike in food inflation. However, inflation was brought under control under NDA-I as the then Government was able to control inflation by controlling budget deficit (see exhibit below).
Inflation remained elevated in the noughties Exhibit 91:
Source: CEIC, Ambit Capital research. CPI IW refers to Consumer Price Index for Industrial Workers.
0
0.4
0.8
1.2
1.6
0.0%
4.0%
8.0%
Policy phase I (1965-80)
Policy phase II (1980-95)
Policy phase III (1995-Present)
CV
of
GD
P g
row
th
Avg
. GD
P g
row
th
Average GDP growth (Left scale) Avg. CV of GDP growth (Right scale)
4%
15.2% 16%
6%
20.9% 20%
9%
27.3% 29%
0%
10%
20%
30%
40%
Avg. investments growth Avg. Investments to GDP Avg. savings to GDP
Policy phase I (1965-80) Policy phase II (1980-95)
Policy phase III (1995-Present)
10%
2%
9%
11%
6%
9%
4%
7%
10%
5%
0%
2%
4%
6%
8%
10%
12%
FY96-99 NDA I UPA I UPA II NDA II
CP
I IW
(Yo
Y ch
an
ge
, in
%)
CPI IW (Food) CPI IW
This improvement in GDP growth was mainly driven by investments
Inflation spiked again in the late1990s mainly due to short-term disruptions in supply

Strategy & Economy
January 09, 2018 Ambit Capital Pvt. Ltd. Page 52
Under the NDA-II (FY15-present) inflation fell from an average of 11% to an average of 6% mainly owing to a sharp fall in crude prices and better supply side management of food. A reduction in fiscal deficit over this period also helped to contain inflation.
Impact on inequality: Inequality remained elevated and in fact widened over this policy phase
The rapid growth witnessed during this policy phase was also accompanied by a sharp increase in income inequality suggesting the fruits of growth were not evenly distributed among the population (see exhibits below).
The income share of the top 1% of India’s Exhibit 92:population has been rising since the 1980s
Source: Piketty & Chancel (2017)
The income share of the top 0.1% of India’s Exhibit 93:population has been rising since the 1980s
Source: Piketty & Chancel (2017)
Where is policy-making headed hereon?
“Other countries, like China, are far more developed economically but India has a political advantage as a democracy and is beginning to get its economic house, if slowly, into better order. Immense problems remain, and new ones erupt. Previous failures in India give skeptics plenty of reason to doubt that it can really project itself successfully abroad. Yet even the most doubtful observers of India, those who worry that “neoliberal” policies are somehow the cause of more poverty, make no suggestion of taking India back to its most isolated and poverty-stricken days of earlier generations. India will improve in many ways in the coming decades…”
- Adam Roberts, former South Asia Bureau Chief of ‘The Economist’, in “Superfast Primetime Ultimate Nation” (2017)
History suggests that policy-making in India thus far has been influenced by two sets of powerful motivators namely the extent of competition on the national politics front, and the international context.
From a forward-looking perspectives, much in line with the international context, we expect: (1) subsequent Indian Governments to continue focusing on the pursuance of black money crackdown as rising inequality remain a key focus area, (2) politically, the rise of the right-wing parties to continue in India, and (3) “strongman economics” i.e. ad-hoc policy-making to remain the flavour of the coming decade (at the national as well as state level) as compared to capitalism or socialism being the dominant economic philosophies in the previous few decades. All of this is likely to be inset in a broadly pro-business policy environment as high degrees of political competition means that political parties have no choice but to ensure that corporate India is able to generate healthy profits (and thus gratify the rent seekers).
The section below highlights the specifics associated with the above mentioned dynamics.
Under the NDA-II (FY15-present) inflation fell from an average of 11% to an average of 6%
Indian Governments to continue focusing on the pursuance a black money crackdown as rising inequality remain a key focus area

Strategy & Economy
January 09, 2018 Ambit Capital Pvt. Ltd. Page 53
What has driven policy making in India so far?
History suggests that policy-making in India has been influenced by two sets of powerful motivators, namely: (1) the extent of competition on the national politics front; and (2) the international context.
The extent of political competition matters to the extent that history shows that the greater is the political competition, the more likely is the Central policy-making apparatus likely to focus on pro-market and pro-infrastructure development related reform. Likewise, the international context matters to the extent that the policy themes opted for by Indian policymakers are undoubtedly influenced and the result of the broader global narrative.
Factor#1: High political competition will ensure that subsequent Governments also maintain a pro-business outlook
As highlighted earlier (over pages 18 to 52), India’s history from the period spanning 1965 to 2017 illustrates that pro-market reforms and policy changes were ignored by the Central policy-making apparatus until 1980, i.e. the point in time until political competition in India was low and the Congress had near monopoly control over India. As political competition grew, political parties that held power ensured that they undertook greater opening-up of the Indian economy and also facilitated infrastructure development so as to fulfill two goals:
Raise the monies required for funding General Elections (which were becoming exorbitant affairs owing to the high and rising political competition); and
Raise India’s GDP growth rate so as to grow tax collections at a healthy clip which could be used to provide sops to the masses.
This relationship (between the degree of political competition and focus on industry & services related reforms) can be seen through the lens of Indian States’ experience too whereby Indian States with a history of single-party rule are been industrially backward (with the exception of Gujarat).
States that have been characterised by little or no political competition tend to be passive about pursuing reforms which helps the industrial or the services sector. In such states, the policy-making apparatus tends to focus on high revenue expenditure and short-term farm sector related reforms (as opposed to structural farm sector related reforms) as a large part of the electorate depends on this sector for its livelihood.
This is evident from the fact that states which remained under one-party rule for a sustained period of time saw their industrial or services sector grow at a rate which was below the national average (see exhibit below).
States characterised by single-party rule for a long spell have seen lower non-farm sector growth and higher Exhibit 94:revenue expenditure growth
Avg. non-farm sector growth in
the State (1)
Avg. non-farm sector growth in
India (2)
Spread (3 = 1 - 2)
Avg. social sector expenditure
growth (4)
Avg. All states social sector expenditure
growth (5)
Spread (6 = 4 - 5)
Bihar during RJD’s rule from CY90-04 (i.e. 15 years) 5% 9% 4% 7% 12% 5%
Odisha during BJD’s rule from CY00-Present (i.e. 17 years) 7% 9% 2% 9% 12% 3%
Source: CEIC, Ambit Capital research
Additionally, these states saw social sector expenditure growth being undertaken at a significantly higher clip as compared to the national average (see exhibit above).
The evidence regarding the converse phenomenon is also overwhelming whereby states like Tamil Nadu, Kerala and Rajasthan that have seen the party in power change for every alternate term for a sustained period of time saw their industrial or services sector grow at a pace that was higher than the national average (see exhibit below).
The extent of political competition matters to the extent that history shows that the greater is the political competition
As political competition grew, political parties that held power ensured that they undertook greater opening-up of the Indian economy
The experience of Indian states suggests that States that have been characterised by little or no political competition tend to be passive about pursuing reforms
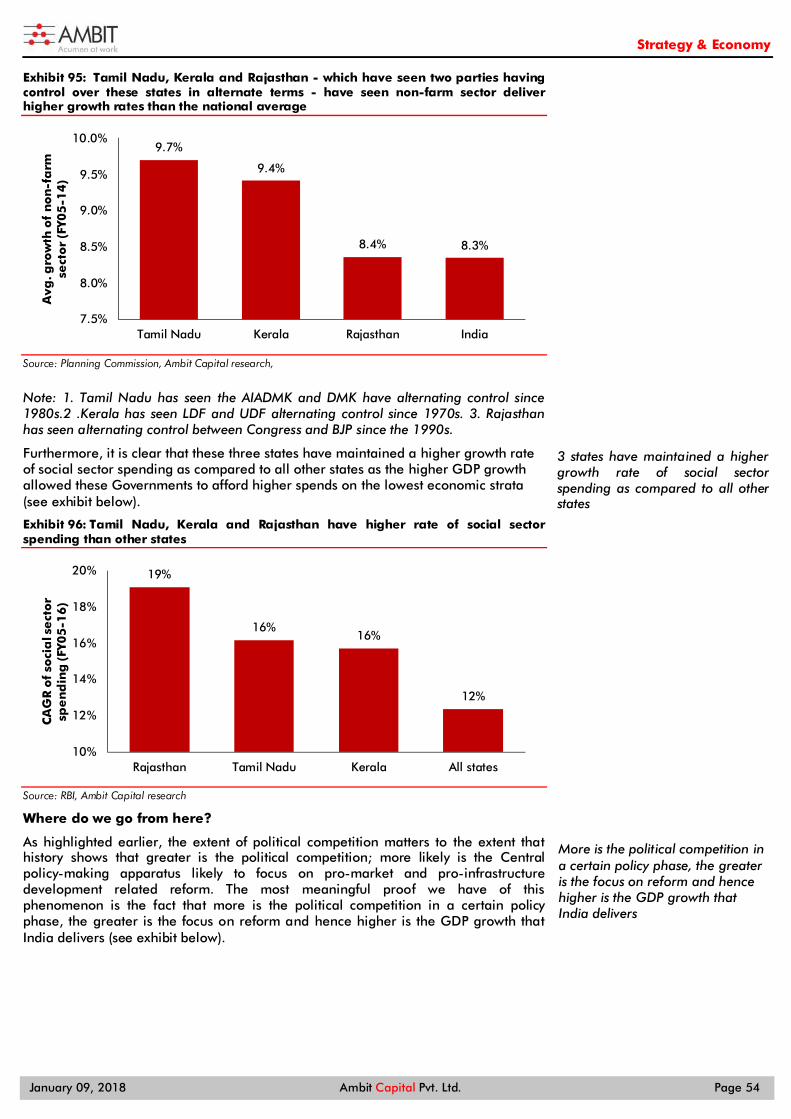
Strategy & Economy
January 09, 2018 Ambit Capital Pvt. Ltd. Page 54
Tamil Nadu, Kerala and Rajasthan - which have seen two parties having Exhibit 95:control over these states in alternate terms - have seen non-farm sector deliver higher growth rates than the national average
Source: Planning Commission, Ambit Capital research,
Note: 1. Tamil Nadu has seen the AIADMK and DMK have alternating control since 1980s.2 .Kerala has seen LDF and UDF alternating control since 1970s. 3. Rajasthan has seen alternating control between Congress and BJP since the 1990s.
Furthermore, it is clear that these three states have maintained a higher growth rate of social sector spending as compared to all other states as the higher GDP growth allowed these Governments to afford higher spends on the lowest economic strata (see exhibit below).
Tamil Nadu, Kerala and Rajasthan have higher rate of social sector Exhibit 96:spending than other states
Source: RBI, Ambit Capital research
Where do we go from here?
As highlighted earlier, the extent of political competition matters to the extent that history shows that greater is the political competition; more likely is the Central policy-making apparatus likely to focus on pro-market and pro-infrastructure development related reform. The most meaningful proof we have of this phenomenon is the fact that more is the political competition in a certain policy phase, the greater is the focus on reform and hence higher is the GDP growth that India delivers (see exhibit below).
9.7%
9.4%
8.4% 8.3%
7.5%
8.0%
8.5%
9.0%
9.5%
10.0%
Tamil Nadu Kerala Rajasthan India
Avg
. gro
wth
of
no
n-f
arm
se
cto
r (F
Y05
-14
)
19%
16%16%
12%
10%
12%
14%
16%
18%
20%
Rajasthan Tamil Nadu Kerala All states
CA
GR
of
soci
al s
ect
or
spe
nd
ing
(FY0
5-1
6)
3 states have maintained a higher growth rate of social sector spending as compared to all other states
More is the political competition in a certain policy phase, the greater is the focus on reform and hence higher is the GDP growth that India delivers

Strategy & Economy
January 09, 2018 Ambit Capital Pvt. Ltd. Page 55
The increase in political competition has been accompanied by the rise in Exhibit 97:GDP growth
Source: Election Commission of India, CEIC, Ambit Capital research. Note: The effective number of parties is a concept which provides for an adjusted number of political parties in a country's party system. The idea behind this measure is to count parties and, at the same time, to weight the count by their relative strength. The relative strength refers to their vote share ("effective number of electoral parties") or seat share in the parliament ("effective number of parliamentary parties")
Correspondingly, it is worth noting that more the political competition, lower is the share of the agricultural sector in total GDP (see exhibit below).
Share of agricultural sector declined as political competition increased Exhibit 98:
Source: Election Commission of India, CEIC, Ambit Capital research Note: The effective number of parties is a concept which provides for an adjusted number of political parties in a country's party system. The idea behind this measure is to count parties and, at the same time, to weight the count by their relative strength. The relative strength refers to their vote share ("effective number of electoral parties") or seat share in the parliament ("effective number of parliamentary parties")
Given that we expect political competition to remain high (as the space ceded by the Congress is captured by regional parties) and given that we expect the Indian General Elections to remain an expensive affair given the sheer size of the electorate, the policy-making apparatus of India should remain focused on aiding higher growth for the industrial and services sectors.
In fact, proof of the fact that the Government of the day has been focused on aiding industrial and services sectors’ growth is evident from its focus on implementing taxation-related reforms as well as facilitating easier clearances (see exhibit below).
1.7 1.7 1.8
3.1
2.12.6
2.21.6
4.33.7
5.85.2
5.86.5 6.6
0%
2%
4%
6%
8%
10%
0
1
2
3
4
5
6
7
1952
1957
1962
1967
1971
1977
1980
1984
1989
1991
1996
1998
1999
2004
2009
GD
P g
row
th
(Avg
. fo
r th
pe
rio
d)
Effe
ctiv
e n
o. o
f p
oli
tica
l p
art
ies
(se
ats
)
Effective parties (Left scale) GDP growth (Right scale)
1.7 1.7 1.8
3.1
2.12.6
2.21.6
4.33.7
5.85.2
5.86.5 6.6
10%
30%
50%
70%
0
1
2
3
4
5
6
7
1952
1957
1962
1967
1971
1977
1980
1984
1989
1991
1996
1998
1999
2004
2009
Ag
ri s
ha
re in
GD
P
Effe
ctiv
e n
o. o
f p
oli
tica
l p
art
ies
(se
ats
)
Effective parties (Left scale) Agri share in GDP (Right scale)
More the political competition, lower is the share of agricultural sector in total GDP
We expect political competition to remain high going forward

Strategy & Economy
January 09, 2018 Ambit Capital Pvt. Ltd. Page 56
The Modi-led BJP Government has shown gumption in trying to improve the health of India’s Exhibit 99:services and industrial sectors Reform/Policy decisions Description
GST Implementation The Government finally implemented India’s boldest tax reform since the independence which promises to truly unify the countrA thrust on infrastructure development
As highlighted in the note, this Government has focussed on infrastructure development with renewed vigour. The Government has increased capital spending in Railways, National Highways, Rural roads and Electricity.
Improving the bankruptcy ecosystem One of the first legislations passed by the Modi Government was the insolvency and bankruptcy code, which allows lenders to take over the assets of the defaulting borrowers and a resolution is reached in a time-bound manner.
Bank recapitalisation The Modi Government has announced a massive Rs2.11trillion bank recapitalisation plan for the public sector banks reeling under a huge pile of stressed assets. The Government has indicated that this will be used to increase credit flow to the micro, small and medium enterprises (MSME) sector.
Boosting India’s ease of doing business ranking
The entire Government machinery in the last three years have worked to improve India’s rank in the World Bank’s ease of doing business rankings and in the latest rankings released by the World Bank, India jumped 30 positions to 100.
Unique terms of reference for the 15th Finance Commission The commission will examine the new fiscal dynamics between the Centre and the states in the wake of GST.
Reducing the corporate tax rate Mr. Jaitley has promised that the corporate tax rate will be brought down from current 33% to 25% over the course of next few years.
Source: Ambit Capital research
Factor#2: The rise of the right wing, black money crackdown and the rise of strongman economics are likely to continue
The international environment over the last two decades has been characterised by three major themes, namely the rise of the right wing, a global focus on a black money crackdown and the rise of strongman economics. The section below highlights the details with respect to each of these three themes. The rise of right-wing political parties
“Over the past year, far right political parties have made major gains in divisive elections throughout the West. Although some of these movements enjoyed victories in previous elections in the 1990s and early 2000s, success of this magnitude across Europe has not occurred since before WWII. Grown from worldwide recessions and refugee crises, nationalism and populism are newly ascendant political forces to be reckoned with. While coverage of right-populist movements has mainly focused on Brexit and the rise of Donald Trump, the far right has been strengthening throughout the West.”
- The rise of the far right, Harvard Political Review, February 2017
All over the world, there has been a rightward turn in the politics. Be it Europe, USA or the Asian countries, we are witnessing a rise of far-east parties in the mainstream politics. This rightward turn in politics has focused on hyper nationalism and mobilising the majority against the minority by demonising the latter. One common feature of this rightward turn has been a conscious effort by these right-wing leaders to highlight the disadvantages of the globalisation.
A global focus on rising income inequality and black money crackdown
The 10 wealthiest people on the planet collectively hold US$500bn, more than most countries produce in a year, according to Forbes. Moreover, it is increasingly becoming clear that very rich buy political influence. This has prompted democratically elected Governments all over the world to focus on black money crackdown and inequality to remain relevant to large sections of the population in their respective countries.
The rise of strongman economics
Just as Communism lost relevance starting the late 1980s, neo-liberal economics started losing its relevance at the turn of the millennium. The series of crises starting from the East Asian crisis of 1997 damaged the credentials of liberal free market economics. This in turn gave rise to what we call ‘strongman economics’ (i.e. ad-hoc economic policies driven by an aggressive leader with a focus on nationalism) in a range of emerging markets (see exhibit below).
All over the world, there has been a rightward turn in the politics
Neo-liberal economics started losing its relevance at the turn of the millennium

Strategy & Economy
January 09, 2018 Ambit Capital Pvt. Ltd. Page 57
The rise of strongman economics Exhibit 100:
Source: Ambit Capital research
So what would likely be the key features of policy making in India over the next decade?
As highlighted earlier, the international context matters to the extent that the policy themes opted for by Indian policymakers are undoubtedly influenced and the result of the broader global narrative. Indian politicians’ fascination with socialism in the 1950s, 60s and 70s was in
part because this was the most fashionable economic policy of that era. The Western world’s disdain towards India’s food shortage in more ways than
one triggered Indian policy-makers’ decision to opt for measures to boost agricultural productivity over FY65-80.
Likewise the formulation of the Washington Consensus in the 1980s undoubtedly lent Indian policymakers the confidence they needed to transform India from being a command-and-control driven economy to a free market economy over the course of 1980-95.
From a forward-looking perspective, much in line with the international experience, we expect four trends should emerge.
Trend#1: Against the backdrop of income inequality in India rising consistently for more than three decades (see exhibits below), we expect subsequent Indian Governments to continue focusing on the pursuance of black money crackdown this can be a key tool that political parties deploy to weaken the opposition’s access to finance and to boost acceptability amongst the economically backward classes.
Formulation of the Washington Consensus in the 1980s undoubtedly lent Indian policymakers the confidence they needed to transform India

Strategy & Economy
January 09, 2018 Ambit Capital Pvt. Ltd. Page 58
The income share of the top 1% of India’s Exhibit 101:population has been rising since the 1980s
Source: Piketty & Chancel (2017)
The income share of the top 0.1% of India’s Exhibit 102:population has been rising since the 1980s
Source: Piketty & Chancel (2017)
Trend#2: Creation of networks will be a fundamental trend going forward where the Government will focus on quality infrastructure creation to boost growth.
Trend#3: Politically, the rise of the right wing is likely to continue following a 70-year period that saw the Congress and Congress-like parties dominate Indian politics.
For instance, it is worth noting that the BJP and its allies control 18 Indian States which account for 60% of India’s GDP. This kind of entrenched dominance in Indian politics was last seen in 1967 when the Congress controlled similar number of states (see exhibit below).
19 Indian states are now controlled by the BJP Exhibit 103:
Source: Ambit Capital research
Politically, the rise of the right wing is likely to continue
“Strongman economics” i.e. ad-hoc policy-making is likely to remain the flavour of the coming decade

Strategy & Economy
January 09, 2018 Ambit Capital Pvt. Ltd. Page 59
Trend#4: “Strongman economics” i.e. ad-hoc policy-making is likely to remain the flavour of the coming decade at the national as well as state level as compared to capitalism or socialism being the dominant economic philosophies in the previous few decades.
The table below lists the names of some of India’s strongmen (and women) and their eccentric economic policies (see exhibit below).
India’s strongmen/women are at work both at Central and state level Exhibit 104:
Indian strongmen and women Economic policies
PM Narendra Modi On November 8, 2016, the Indian PM in an unprecedented move decided to outlaw 86% of the currency in circulation. This along with other measures, such as GST will reduce the size of black economy and will help formalise economy faster
CM of W Bengal Mamata Banerjee After three decades of the left rule in West Bengal, Ms. Banerjee is trying to woo industrialists to invest in the state. She has made sweeping changes in the policies to make the state industrially developed like progressive and bold labour reforms.
CM of UP Yogi Adityanath
Uttar Pradesh Chief Minister Yogi Adityanath has said that his government will create jobs by building expressways and industrial corridors in the state including the Purvanchal (eastern UP) and Bundelkhand (central) regions. His Government for the first time has identified land banks to offer it to industrialists. Most notably, the Yogi Adityanath Government has cracked down heavily on the criminals to change the image of the state.
CM of Andhra Pradesh Chandrababu Naidu
Mr. Naidu’s image has been of a progressive leader who is inclined to use technology to transform the lives of the people. He is credited for transforming Hyderabad (then united Andhra Pradesh’s capital) into a technological hub.
Source: Ambit Capital research

Strategy & Economy
January 09, 2018 Ambit Capital Pvt. Ltd. Page 60
Section 2 of PAGES: The evolution of a billion Aspirations As the Indian economy changed so did the aspirations of its youth. We see three broad phases of aspirations: from the trials and tribulations of a volatile post-Independence era (FY65-80) to the early stages of an open-market economy (FY80-95). As the open economy grew and evolved, a more vibrant, more self-confident Indian was born (FY95-18).
The subsequent part of this section delves into these three phases with each phase divided into three parts namely (1) a brief history of the key events during that phase followed by, (2) how the notion of “aspiration” changed during this particular phase and (3) what the result of this change was.
Aspiration phase #1: Discontent and frustration (1965-80)
"To the historian, the late 1960s are reminiscent of the late 1940s, likewise a time of crisis and conflict, of resentment along lines of class, religion, ethnicity and region, of a Centre that seemed barely to hold."
"Indian democracy, circa 1975, could reconcile the Valley of Kashmir to the Union of India, but not Indira Gandhi with Jayaprakash Narayan."
- Ramachandra Guha in ‘India After Gandhi’ (2007)
A brief history: The triple whammy of war, insurgency, and Emergency
Between 1961 and 1971, India fought twice with China (1962 and 1967), twice with Pakistan (1965 and 1971), faced an insurgency in the Northeast (1964), and then even saw the rise of Naxalites (1967). The Nehruvian era came to an end with Jawaharlal Nehru’s death in 1964 and his daughter, Indira Gandhi, became Prime Minister in 1966.
As these events drew to a close in the mid-1970s, the then Prime Minister Indira Gandhi imposed an Emergency in 1975. Gandhi had dominated Indian politics since she became Prime Minister in 1966. Even though she lost in the post-Emergency elections in 1977, she returned to power in 1980 after winning that year’s General Elections.
Segment 1: How did aspirations change from seeking a government job to migrating overseas
"India is the poorest country in the world. Therefore, to see its poverty is to make an observation of no value; a thousand newcomers to the country before you have seen and said as you." wrote V. S. Naipaul in his 1964 book, 'An Area of Darkness'. The book, a bleak and pessimistic travelogue, painted a dire picture of India in only its third decade after Independence. Naipaul was pessimistic about India during his travels for ‘An Area of Darkness’ (1964) and ‘A Wounded Civilization’ (1977). He traveled widely whilst writing these books and what he saw – deep-rooted poverty, social injustice, the misery of the lower castes, lack of development, lack of sanitation and a general sense of frustration – moved him to despair about the future of India.
We see three broad phases of aspirations: 1965-1980, 1980-1995, and 1995-2017
The Nehruvian era came to an end in 1964…
… and Indira Gandhi dominated Indian politics since she became Prime Minister in 1966

Strategy & Economy
January 09, 2018 Ambit Capital Pvt. Ltd. Page 61
VS Naipaul’s books painted a depressing picture of India in the 1960s Exhibit 105:and the 1970s
Source: Amazon.com, Pan McMillan, Ambit Capital research.
During the 1960s, given the wars with China, the mood in India was somber. Journalist Mihir Bose reminisces about 1the 1960s saying, “The talk of the day was to get the country better prepared militarily and so students were told that they would not be allowed to sit for their graduation examinations unless they underwent three years' compulsory training in the National Cadet Corps. Eighteen months after the Chinese invasion, we found ourselves being given basic military training.”
If the 1960s saw conflict with neighbors, the 1970s was the decade of disillusionment (poignantly captured in the award winning movie, ‘Hazaaron Khwaishein Aisi’ (2005) which crudely translated means a thousand unfulfilled wishes). It was arguably India’s most volatile decade with the Emergency (1975-77) causing a huge rift in the nation. Poverty remained extremely high in the 1970s with 40% of India’s total population remaining below the poverty line. To compound matters, inflation rose to high levels, thereby adding to the strife of a poor country with low levels of purchasing power.
Trade Unionist George Fernandes called a nationwide railway strike in 1974 at a time when the Indian Railways employed 14m workers or 7% of the organised labor force in India. As journalist, Coomi Kapoor recalls in her 2015 book, ‘The Emergency’, “Mrs. Gandhi looked upon the railway strike as a manifestation of the growing climate of violence and indiscipline in the country. Indeed, she often mentioned the strike when justifying the imposition of the Emergency.”
1 http://indiatoday.intoday.in/story/indian-decade-of-dos-and-donts-1960s/1/155688.html
If the 1960s saw conflict with neighbors, the 1970s was the decade of disillusionment
7% of India’s organised labor force went on strike in 1974

Strategy & Economy
January 09, 2018 Ambit Capital Pvt. Ltd. Page 62
The Emergency of 1975-1977 was an important turning point for India in Exhibit 106:the 1970s
Source: Firstpost.com2, The Hindu, Ambit Capital research
The discontent within India found its expression through the medium of cinema with the 1970s seeing the rise of the ‘Angry Young Man’. Amitabh Bachchan became a superstar by capturing the face of how men and women ought to deal with this disillusionment with Zanjeer in 1973 and Deewar in 1975 being blockbusters. Bachchan’s rise in the 1970s spelt the end of the careers of other matinee idols such as Rajesh Khanna and Shammi Kapoor, whose careers were pivoted on being romantic heroes in Hindi cinema produced in the 1960s.
With major movie hits, Amitabh Bachchan became ‘the angry young Exhibit 107:man’ of the 1970s
Source: IMDB.com, Prakash Mehra Productions, Trimurti Films, Eros International, Ambit Capital research
With their future looking bleak, the aspirations of the youth changed from seeking the safety of a pensionable Government job to seeking greener pastures abroad. For the millions of youth who could not get a job in the Indian Administrative Services (IAS i.e. the Indian civil service), migrating from India to the West was seen as the ultimate achievement for an ambitious, young professional. This triggered a “brain drain” from India in full earnest.
2 http://www.firstpost.com/photos/emergency-declared-headlines-indians-saw-morning-25-june-1975-2311662-3.html
Amitabh Bachchan became a superstar by capturing the disillusionment as the Angry Young Man of the 1970s
India’s “brain drain” began in full earnest in Phase 1 (1965-1980)
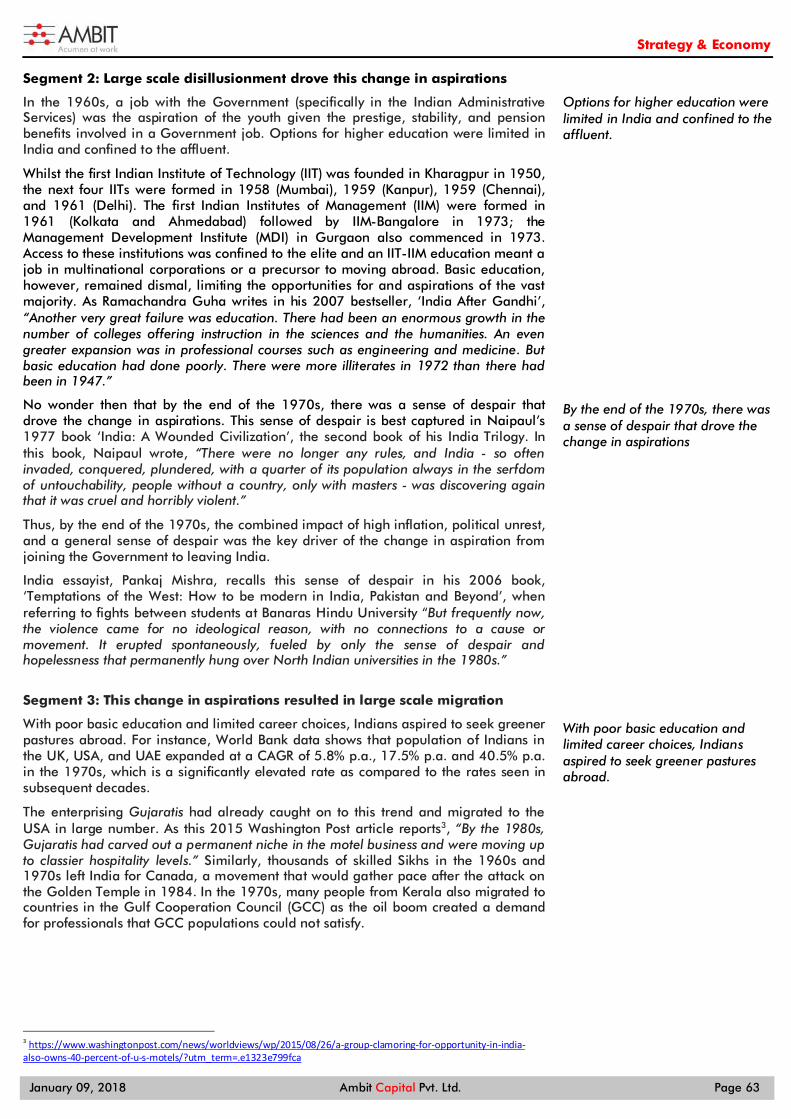
Strategy & Economy
January 09, 2018 Ambit Capital Pvt. Ltd. Page 63
Segment 2: Large scale disillusionment drove this change in aspirations
In the 1960s, a job with the Government (specifically in the Indian Administrative Services) was the aspiration of the youth given the prestige, stability, and pension benefits involved in a Government job. Options for higher education were limited in India and confined to the affluent.
Whilst the first Indian Institute of Technology (IIT) was founded in Kharagpur in 1950, the next four IITs were formed in 1958 (Mumbai), 1959 (Kanpur), 1959 (Chennai), and 1961 (Delhi). The first Indian Institutes of Management (IIM) were formed in 1961 (Kolkata and Ahmedabad) followed by IIM-Bangalore in 1973; the Management Development Institute (MDI) in Gurgaon also commenced in 1973. Access to these institutions was confined to the elite and an IIT-IIM education meant a job in multinational corporations or a precursor to moving abroad. Basic education, however, remained dismal, limiting the opportunities for and aspirations of the vast majority. As Ramachandra Guha writes in his 2007 bestseller, ‘India After Gandhi’, “Another very great failure was education. There had been an enormous growth in the number of colleges offering instruction in the sciences and the humanities. An even greater expansion was in professional courses such as engineering and medicine. But basic education had done poorly. There were more illiterates in 1972 than there had been in 1947.”
No wonder then that by the end of the 1970s, there was a sense of despair that drove the change in aspirations. This sense of despair is best captured in Naipaul’s 1977 book ‘India: A Wounded Civilization’, the second book of his India Trilogy. In this book, Naipaul wrote, “There were no longer any rules, and India - so often invaded, conquered, plundered, with a quarter of its population always in the serfdom of untouchability, people without a country, only with masters - was discovering again that it was cruel and horribly violent.”
Thus, by the end of the 1970s, the combined impact of high inflation, political unrest, and a general sense of despair was the key driver of the change in aspiration from joining the Government to leaving India.
India essayist, Pankaj Mishra, recalls this sense of despair in his 2006 book, ‘Temptations of the West: How to be modern in India, Pakistan and Beyond’, when referring to fights between students at Banaras Hindu University “But frequently now, the violence came for no ideological reason, with no connections to a cause or movement. It erupted spontaneously, fueled by only the sense of despair and hopelessness that permanently hung over North Indian universities in the 1980s.”
Segment 3: This change in aspirations resulted in large scale migration
With poor basic education and limited career choices, Indians aspired to seek greener pastures abroad. For instance, World Bank data shows that population of Indians in the UK, USA, and UAE expanded at a CAGR of 5.8% p.a., 17.5% p.a. and 40.5% p.a. in the 1970s, which is a significantly elevated rate as compared to the rates seen in subsequent decades.
The enterprising Gujaratis had already caught on to this trend and migrated to the USA in large number. As this 2015 Washington Post article reports3, “By the 1980s, Gujaratis had carved out a permanent niche in the motel business and were moving up to classier hospitality levels.” Similarly, thousands of skilled Sikhs in the 1960s and 1970s left India for Canada, a movement that would gather pace after the attack on the Golden Temple in 1984. In the 1970s, many people from Kerala also migrated to countries in the Gulf Cooperation Council (GCC) as the oil boom created a demand for professionals that GCC populations could not satisfy.
3 https://www.washingtonpost.com/news/worldviews/wp/2015/08/26/a-group-clamoring-for-opportunity-in-india-also-owns-40-percent-of-u-s-motels/?utm_term=.e1323e799fca
Options for higher education were limited in India and confined to the affluent.
By the end of the 1970s, there was a sense of despair that drove the change in aspirations
With poor basic education and limited career choices, Indians aspired to seek greener pastures abroad.

Strategy & Economy
January 09, 2018 Ambit Capital Pvt. Ltd. Page 64
Aspiration phase#2: Reimagining India (1980-95)
"Its constitution commits India to socialism, secularism and democracy. All three had come under unparalleled pressure by the time Rajiv Gandhi stepped down as prime minister. Socialism had become unfashionable in the West, so it was no surprise that Rajiv had attempted to wriggle out of its grip. [..]
Rajiv Gandhi never quarreled with the principle of secularism, yet during his premiership the relations between Hindus and Muslims degenerated to their lowest level since the holocaust of partition. [..]
Democracy was not faring too well either when Rajiv Gandhi was assassinated. [..] Even in opposition Rajiv remained an isolated figure, dependent for information and advice on a small coterie who had no political clout of their own."
- Mark Tully in ‘No full stops for India’, (1991)
A brief history of the era of reforms
The Congress returned to power in the 1980 elections following the demise of the short-lived tenure of the Janata Party (which was in reality an alliance of parties opposed to Indira Gandhi). Whilst Indira Gandhi returned with a thumping majority capturing 353 seats won of 542 seats in the January 1980 elections, she was assassinated in 1984 after ordering an attack on the Golden Temple in Amritsar, the holiest shrine of the Sikhs. Her son, Rajiv Gandhi won the 1984 elections with a huge sympathy wave but he too was assassinated in 1991 by a suicide bomber sponsored by the Sri Lankan Tamil Tigers. However, the financial crisis in the summer of 1991 and subsequent reforms proved to be the turning point in India’s economy and more importantly society. Whilst a first set of reforms were executed in the mid-1980s, the larger reforms of 1991 would decisively put an end to the chaos of the 1960s and 1970s and set India on course to the expansion of the noughties. For contemporary Indians, therefore, 1991 is as much of a watershed as 1947 was for the generation that grew in the 1950s and 1960s.
Segment 1: How did aspirations change from wanting to leave India to aspiring to be an engineer in India?
Whilst India didn’t fight as many wars with its neighbors in the 1980s, there were many riots in India including the riots between Hindus and Muslims in 1980 in Uttar Pradesh and 1985 in Gujarat, the Nellie massacre in 1983 in Assam, the Hindu-Sikh riots in 1984, and the Bhagalpur riots in 1989. This period was also marred by demands for new states, notably in Bihar, Madhya Pradesh, and Andhra Pradesh, as well as insurgency in Assam and Kashmir. The most serious of these agitations were in Punjab where communal violence and an attack by the Army on the Golden Temple would eventually lead to Indira Gandhi’s assassination in 1984, coincidentally the same year as the Bhopal Gas Tragedy which cost 3,787 people their lives. To this day, the Bhopal Gas Tragedy remains the largest industrial accident anywhere in the world.
The larger reforms of 1991 would decisively put an end to the chaos of the 1960s and 1970s
There were many riots and demands for new states in India in the 1980s
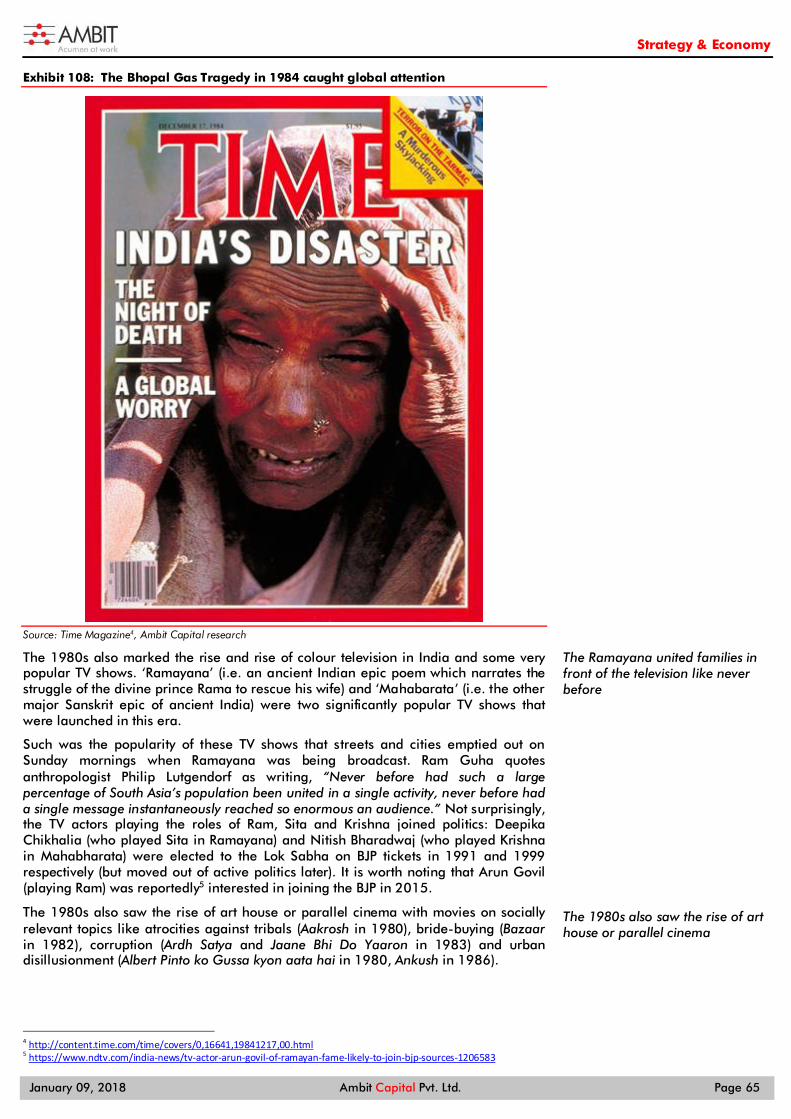
Strategy & Economy
January 09, 2018 Ambit Capital Pvt. Ltd. Page 65
The Bhopal Gas Tragedy in 1984 caught global attention Exhibit 108:
Source: Time Magazine4, Ambit Capital research
The 1980s also marked the rise and rise of colour television in India and some very popular TV shows. ‘Ramayana’ (i.e. an ancient Indian epic poem which narrates the struggle of the divine prince Rama to rescue his wife) and ‘Mahabarata’ (i.e. the other major Sanskrit epic of ancient India) were two significantly popular TV shows that were launched in this era.
Such was the popularity of these TV shows that streets and cities emptied out on Sunday mornings when Ramayana was being broadcast. Ram Guha quotes anthropologist Philip Lutgendorf as writing, “Never before had such a large percentage of South Asia’s population been united in a single activity, never before had a single message instantaneously reached so enormous an audience.” Not surprisingly, the TV actors playing the roles of Ram, Sita and Krishna joined politics: Deepika Chikhalia (who played Sita in Ramayana) and Nitish Bharadwaj (who played Krishna in Mahabharata) were elected to the Lok Sabha on BJP tickets in 1991 and 1999 respectively (but moved out of active politics later). It is worth noting that Arun Govil (playing Ram) was reportedly5 interested in joining the BJP in 2015.
The 1980s also saw the rise of art house or parallel cinema with movies on socially relevant topics like atrocities against tribals (Aakrosh in 1980), bride-buying (Bazaar in 1982), corruption (Ardh Satya and Jaane Bhi Do Yaaron in 1983) and urban disillusionment (Albert Pinto ko Gussa kyon aata hai in 1980, Ankush in 1986).
4 http://content.time.com/time/covers/0,16641,19841217,00.html 5 https://www.ndtv.com/india-news/tv-actor-arun-govil-of-ramayan-fame-likely-to-join-bjp-sources-1206583
The Ramayana united families in front of the television like never before
The 1980s also saw the rise of art house or parallel cinema

Strategy & Economy
January 09, 2018 Ambit Capital Pvt. Ltd. Page 66
Parallel cinema arose in the 1980s Exhibit 109:
Source: IMDB.com, Neo Films, Shemaroo, NFDC, Ambit Capital research
In mainstream cinema, Amitabh Bachchan completely dominated the 1980s with hits where he played a multitude of characters in movies such as Laawaris and Silsila (1981), Namak Halal (1982), Coolie (1983), Sharaabi (1984), etc. Unfortunately, for Indian cinema producers, the arrivals of the Video Cassette Recorder (VCR) from Japan meant that affluent Indians no longer had to go to the cinema hall to watch the latest movies. Pirated video tapes and cheap VCRs opened up new avenues in home entertainment for a repressed nation.
India also hosted the Asian Games in 1982 in Delhi when the number of participating countries (33) was the highest in the history of the games. This was followed by India’s victory in World Cup cricket in 1983 – a particularly special victory since India as underdogs defeated West Indies, then the world’s best cricket team. Both these events boosted India’s confidence of holding its own in the global sports arena. There was a sense of accomplishment in the air for a country that was populous and poor. Emboldened by these achievements, India, along with Pakistan, went on to host the Cricket World Cup in 1987. Called the ‘Reliance World Cup’ (another indication of Dhirubhai Ambani’s rising ambitions), this was the first time that the World Cup was held outside England much to the chagrin of English cricket administrators who still saw India through colonial lenses.
In 1983, Maruti launched the ‘Maruti 800’ car which went on change India’s automobile sector. Launched at a price of Rs48,000 with an initial payment of Rs10,000, the car was a super-hit. At a time when cars were seen as mainly for the rich, and when there was no competition or choice (the clunky, expensive, Ambassador and the Premier Padmini were the only cars available then), the Maruti 800 transformed the Indian middle class. Designed as a ‘people’s car’, the Maruti 800 became an object of envy and a status symbol for the middle class.
As this 2014 article6 in the Mint recounts, “Maruti 800’s success can be gauged from the fact that the size of Indian passenger vehicles grew from 40,000 units in 1983 to 150,000 in 1987. Critics who expected the company to sell fewer than 40,000 units a year were dumbfounded when Maruti announced it has received bookings of 125,000 units for the first year though it could only produce 100,000.” For those of us who lived in that era, we can remember our parents being offered a “premium” to sell their precious Marutis in the black market.
6 http://www.livemint.com/Companies/js6mNCIQXBVo5tnBnspzVI/How-Maruti-800-changed-the-dynamics-of-Indian-car-industry.html
Amitabh Bachchan completely dominated the 1980s with hits where he played a multitude of characters
There was a sense of accomplishment in the air for a country that was populous and poor

Strategy & Economy
January 09, 2018 Ambit Capital Pvt. Ltd. Page 67
By then, India’s economy was also performing well. Rajiv Gandhi, the then PM, V.P. Singh, then Finance Minister, ushered the first set of reforms in Budget of 1985 with the removal of licenses across industries such as textiles and computers. This ushered an era of prosperity and the rise of the middle class. As Ram Guha writes, “The latter half of the 1980s was a good time for Indian business. Industry grew at a healthy rate of 5.5% per year, with the manufacturing sector doing even better, growing at 8.9% per annum. Market capitalization rose from Rs68bn in 1980 to Rs550bn in 1989.”
However, these reforms were baby steps and opposed internally by the Congress Party where belief in socialism was still strong. As Vinay Sitapati writes in his 2016 book, ‘Half Lion: How P.V. Narasimha Rao transformed India’, “Rajiv’s incapacity to achieve economic reforms was made worse by his artlessness in everyday politics. Rajiv had come to power with the largest mandate in Indian history. But faced with the usual cycle of state elections, allegations of corruption, and dissidents within his party – in short, the routine turbulence that any prime minister faces - Rajiv lost his appetite for bold changes.”
Whilst the 1980s closed on a note of economic progress, the socio-political atmosphere was still rife with protests that carried over to the early 1990s – notably from the Shah Bano case7 (1985), the Babri Masjid demolition8 (1992) and the Mandal Commission protests9 (1990). The Congress was confronted with the infamous Bofors Scam10 (1987) following which then Finance Minister, VP Singh, left the Congress in 1988. He went on to implement the Mandal Commission recommendations as Prime Minister of the National Front Government in 1990, which led to huge anti-reservation protests by aggrieved upper caste students.
Whilst the anti-reservation protests rocked India in 1990, the reforms of the mid-to-late 1980s had also, alongside, begun to create a new middle class with rising incomes. Private sector entrepreneurship was in early days. Infosys was formed in 1981, went public in 1993 and picked up pace in the 1990s. Dhirubhai Ambani and Reliance Industries rose in prominence through the 1980s, sparking off the ‘equity cult’11. Thus, even though social protests continued, India’s youth began seeing a future for themselves and their aspirations in the country. From leaving the country, they began exploring options in the newly opened up sectors of the Indian economy. For this change in aspirations, credit must be given to the reforms of 1991.
Segment 2: What drove the change in aspirations? The 1991 reforms
Against this backdrop, the 1991 reforms changed India’s economic future forever. As Vinay Sitapati writes, “In a single day, Narasimha Rao and Manmohan Singh had done more than anyone to dismantle the three pillars of the license raj: “monopolies for the public sector, limits on private business, and isolation from the world markets.” The reforms would shape a big change in aspirations for every Indian company. Huge sectors – such as information technology, telecom, media, private banks, airlines – opened up, providing many career options and, therefore, aspirations for the youth.
By the 1980s and 1990s, as more IITs, IIMs, and business schools (such as SP Jain and Narsee Monjee Institute of Management Studies (NMIMS) which opened in 1981) gained prominence, an engineering degree coupled with an MBA had emerged as a viable alternative to becoming a Chartered Accountant, or a doctor or getting a Government job. Through the 1990s, as new IT companies were set up to capture the offshoring and Y2K opportunity, youths aspired to become software 7 A controversial lawsuit in 1985 where the Supreme Court granted alimony to a divorced Muslim woman from her husband. Following the verdict, the Rajiv Gandhi-led Congress Government enacted a law that effectively diluted the verdict by restricting the right of Muslim divorcees to alimony from their former husbands for only 90 days. 8 The Babri Masjid was demolished by a crowd of Hindu activists on 6th Dec 1992 after a political rally organized by the BJP and VHP turned violent. The event was seen as a culmination of a prolonged dispute of the site being the birthplace of Lord Ram that was later destroyed by the Mughals. 9 In 1990 then Prime Minister V.P. Singh tried to implement the recommendations of the Mandal Commission which called for reservations of 49.5% in government jobs, sparking protests against these reservations. Protestors closed roads, highways, schools, businesses and even attempted self-immolation. 10 The Bofors scandal in 1987 centered around allegations that Swedish arms company Bofors paid kickbacks to Indian politicians and defence officials to secure an arms contract with the Indian Government. Then Prime Minister Rajiv Gandhi was also implicated in the scandal. 11 Reliance Industries IPO of Rs28m in 1977 was large by standards existing then. By 1985, RIL's AGM was being held at football stadiums in Mumbai with attendance of many thousands of investors. Thus, by creating awareness of investment in equities when it was a new concept, Dhirubhai Ambani is credited in the popular media as introducing the 'equity cult' in India.
Rajiv Gandhi and V.P. Singh ushered the first set of reforms in Budget of 1985
The 1985 reforms were baby steps and opposed internally by the INC
Whilst the socio-political atmosphere was still rife with protests…
…India’s youth began seeing a future for themselves and their aspirations in the country
“Software companies came to symbolise a newer, younger India”

Strategy & Economy
January 09, 2018 Ambit Capital Pvt. Ltd. Page 68
engineers. As Sitapati writes, “Software companies employed only a fraction of Indians. But they came to symbolise a newer, younger India where honesty and hard work could make millionaires of the middle class.”
Civil and mechanical engineers also gained demand as the opening up of the Indian economy meant private sector companies began to plan expansion without the need for procuring licenses and permits. Thus, as the economy opened, jobs opened up across the board.
The imagination of the youth was also captured by India’s victory in global beauty contests in the same year: Sushmita Sen became Miss Universe and Aishwarya Rai became Miss World in 1994. Both victories were celebrated with fervour reminiscent of India’s victory in the 1983 Cricket World Cup. For a nation still seeking to find its feet in the world at large, even modest affirmations of its worth were enough to create a feel-good effect in the country at large.
Four million jobs were added in the public sector from FY81 to FY98, Exhibit 110:private sector jobs picked up in the 1990s
Source: RBI, Ambit Capital research
Segment 3: What was the result of this change? Positive course correction
The opening up of the Indian economy was a paradigm shift for a country mired in poverty and rooted in socialist beliefs. We believe this phase set the foundation for three profound shifts in India that would change aspirations for generations to follow:
a) From socialism to free markets: The reforms in the mid/late-1980s were half-hearted attempts to open up the economy to competition. However, the liberalisation reforms of 1991 resulted in an end of the license/permit raj era, itself a relic of the socialist age of controls. But whilst the license era was over, the cost around factors of production like land and labor were still in control of the Government. Given the haphazard and hurried way (in response to a crisis) in which these reforms were done, they would drive an institutionalisation of corruption and, in the process, deepen the politicians-businessmen nexus. For example, small road contractors would game public contracts to perfection using a mix of the following models: (1) the ‘traditional’ contractor model; (2) the ‘resource grab’ model; and (3) the ‘capital grab’ model. We have discussed these models in depth in our 2013 report, ‘The one report that changed India’. This nexus would eventually explode in the multiple scams (Commonwealth Games, telecom spectrum, and coal allocation) in 2010-12 as discussed in Phase 3.
b) From looking down on wealth to celebrating it: In a socialist era, the rich were seen as evil people who would oppress the poor to build their wealth. Movies of then would often feature moneylenders as blood-sucking capitalists and business owners as exploiters of labourers. Thus, the idea of equating wealth will evil was ingrained in the socialist era. However, as reforms stimulated economic growth, consumerism boomed, and career opportunities picked up, the idea of being rich went from being an evil to becoming an aspiration. Dhirubhai Ambani was the new poster boy of an outsider challenging the established rich families such as Tatas and Birlas. Tycoons like Vijay Mallya (associated with liquor, flashy airlines and a glitzy
5.0
7.0
9.0
11.0
13.0
15.0
17.0
19.0
1981 1986 1987 1991 1996 1998
Private Public
As the economy opened, jobs opened up across the board
The 1991 reforms resulted in an end of the license/permit raj era
The idea of being rich went from being an evil to becoming an aspiration

Strategy & Economy
January 09, 2018 Ambit Capital Pvt. Ltd. Page 69
lifestyle) were seen as role models of a successful businessman. Flaunting wealth was not criticised any longer; it was to be aspired for. Business magazines like ‘Business India’ and ‘Business Today’ started mushrooming in the 1980s which celebrated this new phenomenon in Indian society.
c) From a single-party to coalition politics: In 1984, the Rajiv Gandhi-led Congress was voted to power with an overwhelming majority, swept largely by a sympathy wave following the assassination of Indira Gandhi. However, Rajiv Gandhi was never able to capitalise on this majority; from the Shah Bano and Babri Masjid case to the Bofors scandal, the INC’s fortunes were on the decline. Guha described the churning caused by the turbulent socio-political atmosphere of the 1980s as the growing decentralisation of the Indian polity away from the hegemony of a single region (north), a single party (the Congress) and a single family (the Gandhis).
To put things in perspective, the Congress won only 140 seats in the 1996 elections compared with 404 in the 1984 under Rajiv Gandhi. By 1999, this would drop to 114. Eventually, Sonia Gandhi joined politics in 1997 to help revive the Congress’ fortunes. Thus, Phase 2 saw the end of a single-party rule and the start of coalition politics. As the Congress’ rule weakened over successive elections, regional parties asserted their power at the Centre and the BJP gained from the general disillusionment with regards to the Congress’ socialist-era politics.
Cinema reflected reality. Among the biggest blockbusters of the 1990s was ‘Dilwale Dulhania Le Jayenge’ (1995) – a movie shot extensively in Switzerland that laid down aspirations of exotic foreign travel for youth whilst also pulling them down to Indian values of the importance of parental approval for marriage. India had come a long way from the angry young man of the 1970s, and the art cinema of the 1980s. The age of consumerism (Pepsi was launched in 1989) had dawned in India.
Dilwale Dulhania Le Jayenge (DDLJ) reflected the aspirations of the Exhibit 111:youth in the 1990s
Source: IMDB.com, Yash Raj films.
Emblematic of this rise was Sachin Tendulkar, who rose from a middle-class family in Dadar in Mumbai to become what the greatest batsman of his era. Sachin dominated cricket and national imagination for nearly three decades (from the 1990s until his retirement in 2013) and his popularity during the 1990s reached manic proportions as he broke batting records. Sachin’s endorsement fees (estimated12 at Rs60-70m per endorsement in his playing days) also made the news as the youth were captivated by the sheer money power that Sachin attracted from brands such as Pepsi. Even as
12 http://www.livemint.com/Consumer/La7iUPMRvAQoxlCEvB93lK/Can-Brand-Sachin-bat-on.html
Rajiv Gandhi and the INC could never capitalise on their huge victory in 1984
The age of consumerism had dawned in India in Phase 2 (1980-1995)

Strategy & Economy
January 09, 2018 Ambit Capital Pvt. Ltd. Page 70
India was routinely pummeled in overseas cricket matches by fitter and physically stronger teams from Australia, South Africa and England, Sachin’s success convinced a generation of Indians that it was possible to compete in the global arena.
Rising from the middle class in Mumbai, Sachin Tendulkar rose to Exhibit 112:become an Indian icon
Source: Amazon, Hachette India, Jaico Publishing House, Ambit Capital research

Strategy & Economy
January 09, 2018 Ambit Capital Pvt. Ltd. Page 71
Aspiration phase#3: A billion mutinies now! (1995-2017) “…India was, in the simplest way, on the move, that all over the vast country men and women had moved out of the cramped ways and expectations of their parents and grandparents and were expecting more.”
– VS Naipaul, ‘India: A million mutinies now’ (1989)
Brief history: India comes of age
Liberalisation transformed India. On the development front, a new middle class arose from the opening up of the economy and strong GDP growth during FY2003 to FY2008. The proliferation of mobile telephony and internet coupled with a huge ramp-up in road infrastructure (the Golden Quadrilateral linking metro cities of Delhi, Mumbai, Chennai, and Kolkata) brought small-town India closer to cities, opening up career and business opportunities like never before.
Coalition politics and the Congress Party dominated Government until 2014, which is when the Narendra Modi-led BJP came to power with an overwhelming majority.
Modi’s victory resounded across the world Exhibit 113:
Source: Time.com, Economist.com, Ambit Capital research
The NDA’s victory came as a vote against the spate of corruption scandals against the Congress-led United Progressive Alliance (UPA). Given its battle against corruption and uprooting the old order of crony capitalism, the Modi Government abruptly demonetised 86% of India’s currency on 8th November 2016. This was followed by the long-awaited implementation of the Goods and Services Tax (GST) on 1st July 2017.
Both measures are still working their way into the economy. Alongside, a bold and often brash wave of nationalism and muscular Hindutva has broken out. The effects of all three factors (Demonetisation, GST and Hindutva) will shape the next General Elections due in 2019.
New careers, new aspirations
Modi’s victory was a vote against corruption
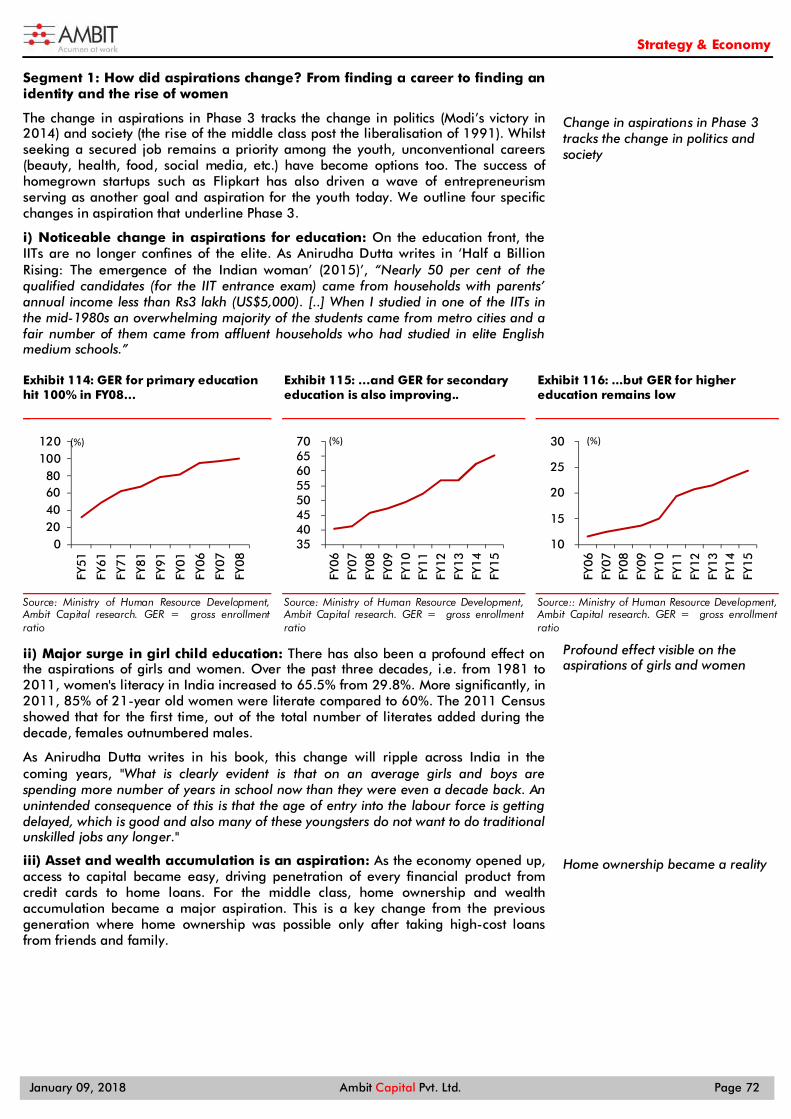
Strategy & Economy
January 09, 2018 Ambit Capital Pvt. Ltd. Page 72
Segment 1: How did aspirations change? From finding a career to finding an identity and the rise of women
The change in aspirations in Phase 3 tracks the change in politics (Modi’s victory in 2014) and society (the rise of the middle class post the liberalisation of 1991). Whilst seeking a secured job remains a priority among the youth, unconventional careers (beauty, health, food, social media, etc.) have become options too. The success of homegrown startups such as Flipkart has also driven a wave of entrepreneurism serving as another goal and aspiration for the youth today. We outline four specific changes in aspiration that underline Phase 3.
i) Noticeable change in aspirations for education: On the education front, the IITs are no longer confines of the elite. As Anirudha Dutta writes in ‘Half a Billion Rising: The emergence of the Indian woman’ (2015)’, “Nearly 50 per cent of the qualified candidates (for the IIT entrance exam) came from households with parents’ annual income less than Rs3 lakh (US$5,000). [..] When I studied in one of the IITs in the mid-1980s an overwhelming majority of the students came from metro cities and a fair number of them came from affluent households who had studied in elite English medium schools.”
GER for primary education Exhibit 114:hit 100% in FY08…
Source: Ministry of Human Resource Development, Ambit Capital research. GER = gross enrollment ratio
…and GER for secondary Exhibit 115:education is also improving..
Source: Ministry of Human Resource Development, Ambit Capital research. GER = gross enrollment ratio
...but GER for higher Exhibit 116:education remains low
Source:: Ministry of Human Resource Development, Ambit Capital research. GER = gross enrollment ratio
ii) Major surge in girl child education: There has also been a profound effect on the aspirations of girls and women. Over the past three decades, i.e. from 1981 to 2011, women's literacy in India increased to 65.5% from 29.8%. More significantly, in 2011, 85% of 21-year old women were literate compared to 60%. The 2011 Census showed that for the first time, out of the total number of literates added during the decade, females outnumbered males.
As Anirudha Dutta writes in his book, this change will ripple across India in the coming years, "What is clearly evident is that on an average girls and boys are spending more number of years in school now than they were even a decade back. An unintended consequence of this is that the age of entry into the labour force is getting delayed, which is good and also many of these youngsters do not want to do traditional unskilled jobs any longer."
iii) Asset and wealth accumulation is an aspiration: As the economy opened up, access to capital became easy, driving penetration of every financial product from credit cards to home loans. For the middle class, home ownership and wealth accumulation became a major aspiration. This is a key change from the previous generation where home ownership was possible only after taking high-cost loans from friends and family.
020406080
100120
FY51
FY61
FY71
FY81
FY91
FY01
FY06
FY07
FY08
(%)
35 40 45 50 55 60 65 70
FY06
FY07
FY08
FY09
FY10
FY11
FY12
FY13
FY14
FY15
(%)
10
15
20
25
30
FY06
FY07
FY08
FY09
FY10
FY11
FY12
FY13
FY14
FY15
(%)
Change in aspirations in Phase 3 tracks the change in politics and society
Profound effect visible on the aspirations of girls and women
Home ownership became a reality

Strategy & Economy
January 09, 2018 Ambit Capital Pvt. Ltd. Page 73
Fall in interest rates in the early noughties… Exhibit 117:
Source: RBI, Ambit Capital research. Note: Till FY03, bank rate is used and from FY04 onwards, repo rate is used for the chart above.
..was instrumental in making homes more Exhibit 118:affordable (chart shows property prices as a multiple of annual income)
Source: HDFC, Ambit Capital research. Note: HDFC defines affordability as property prices divided by annual incomes. Hence, in the chart above, 3.8 means property prices were 3.8x annual incomes in FY17, whilst in FY95, it was 22x annual income.
Finding an identity has become important too. As a BloombergQuint survey in April 2017 shows13, 61% of India's youth say they are somewhat or very fond of wearing stylish clothes. 59% were keen on acquiring the latest mobile phone. 39% said they liked applying fairness creams quite a lot and 36% reported a moderate or high degree of fondness for visiting beauty parlours and salons.
iv) The rise of sports as a career option: Even as elite education institutions such as the IITs became more accessible to the poor, even sports saw growing participation from cities beyond the metros. In cricket, the World Cup winning team of 1983 was drawn largely from the elite of the major Indian metros. Sunil Gavaskar and Ravi Shastri were from Mumbai, Mohinder Amarnath from Delhi, Roger Binny from Bangalore, and K Srikkanth from Chennai.
In contrast, the social origins of the current Indian cricket team are very different: Kuldeep Yadav from Kanpur is the son of a brick kiln owner, Bhuvneshwar Kumar is from Bulandshahr in UP, Yuzvendra Chahal is from Jind in Haryana, Hardik Pandya is from Choryasi in Gujarat and of course, MS Dhoni is famously a groundsman’s son from Ranchi. In fact, barring Virat Kohli, the boys from the big cities rarely get a regular place in the Indian team now and the shorter the format of the game, the greater the success of the small town boys. In effect, the big city boys are being replaced by hungrier and more naturally aggressive talent from small town India. This boom in talent has also driven India’s ‘Golden Run’ with success across all formats, T20 (#5 as per ICC), one-day internationals (#2 after South Africa), and test cricket (#1).
Beyond cricket, the victory of youth beyond the metros is visible in Olympic medals won, namely, Abhinav Bindra (from Uttarakhand), Vijender Singh and Sakshi Malik (Haryana), Vijay Singh (Himachal Pradesh), and Mary Kom (Manipur). Thus, the rise of India from smaller towns and villages (discussed in Phase 2 continues in Phase 3).
Segment 2: What drove the change in aspirations? The explosion of the middle-class and expectations of cleaner administration
i) The explosion of the middle class
The 1991 reforms worked their way in opening up the economy to foreign competition, giving birth to a new generation of middle-class population, especially in smaller towns. In his 1995 book, 'Butter chicken in Ludhiana: Travels in small town India', Pankaj Mishra, compared this post-liberalisation middle class to the middle class Naipaul had, twenty-fours ago, described as modest, "Twenty-four years later, this was only partly true. Modest wasn't a word once could use any longer in connection with the middle classes; neither in numbers nor in ambition nor in 13 https://www.thequint.com/news/india/csds-kas-youth-survey-report-attitudes-anxieties-aspirations-of-india-youth-changing-patterns
0
2
4
6
8
10
12
14
Jan-
91
Jan-
93
Jan-
95
Jan-
97
Jan-
99
Jan-
01
Jan-
03
Jan-
05
Jan-
07
Jan-
09
Jan-
11
Jan-
13
Jan-
15
Jan-
17
(%)
-
5
10
15
20
25
FY95
FY97
FY99
FY01
FY03
FY05
FY07
FY09
FY11
FY13
FY15
FY17
(x)
Finding an identity has become important for the youth

Strategy & Economy
January 09, 2018 Ambit Capital Pvt. Ltd. Page 74
expectations could they be called that. Indeed, as I saw later, the appropriation of brand-names alone could not satisfy them; they aimed at nothing less than the creation of a whole new pan-Indian culture."
Mobile telephony was launched in 1995 but became popular only in the early noughties. The completion of the Golden Quadrilateral road network in 2006 meant that small towns and villages were now better connected with the rest of India in an unprecedented manner - by road as well as mobile. This caused a profound change across services industry since it increased mobility and communications for the middle class, giving rise to demand for cars, two-wheelers, telecom services, etc. Improved road networks gave career options for people in villages to move to towns to seek better incomes and jobs. By the early noughties, the boom in employment-heavy service sectors such as private banks, IT/IT-enabled services, and telecommunication was clearly visible and driven by urban as well as semi-urban areas. "The employment of hundreds of thousands of young engineers, scientists, economics and English graduates on pay scales that often exceeded those of their parents nearing retirement age created a new generation of consumers with little time for India's traditional pace of life" wrote the Financial Times South Asia bureau chief, Edward Luce in his 2006 book, 'In Spite of the Gods: the Strange Rise of Modern India'. As economic growth boomed spectacularly from FY04-08 in the first term of the Congress-led United Progressive Alliance (UPA), this new middle class rose across India. As the middle class grew, the rich got richer and this was visible in metro cities as well as small towns. In Mumbai, Mukesh Ambani (who is now in the Top 20 of the World’s Richest people as per Forbes14), has built his house called ‘Antilla’ in South Mumbai at an estimated cost of US$1bn and as per media reports15 was the second-most expensive home in the world in 2014 after the Buckingham Palace. The show of wealth spreads out to smaller cities as well where the boom in luxury car sales has been evident since at least 2012. As this 2012 Knowledge@Wharton article16 titled ‘Luxury Cars Are Gaining Traction in India – and in Small Towns, Too’ notes,
“What has been unexpected is the market; new purchases are coming from smaller cities and towns. Audi has dealerships in Nagpur, Ludhiana and Surat with Lucknow and Coimbatore in the pipeline. BMW was the first to open a dealership in Raipur four years ago; it sold 30 cars the first year and manages to sell about a 100 cars a year today. It has also set up mobile showrooms to visit even smaller towns such as Agra and Nashik.
Mercedes Benz recently launched its dealerships in Karnal and Lucknow. At the launch of the Lucknow dealership, Mercedes Benz India director (sales and marketing) Debashis Mitra said: “Two to three years ago, Delhi and Mumbai accounted for nearly 70% of our sales. Today, this percentage has declined to 50%; the rest is accounted for by Tier-II towns. We are confident that Tier-II and Tier-III towns will account for future growth.”
ii) Expectations of a cleaner administration and the rise of Modi
Corruption in Indian politics isn’t a new phenomenon. Indeed, corruption scandals had hit both the Congress (Bofors, 1987) and the BJP (Jain Hawala scam, 1991) in the past. However, the 1991 reforms, being haphazard and reactive in nature, failed to address structural issues in the economy and landed up deepening corruption within India’s economic and political framework.
For example, they did not change India’s archaic labor laws that held back firms from adding employees – these conditions exist even today. As The Economist’s journalist and former South Asia Bureau Chief, Adam Roberts, writes in his 2017 book ‘Superfast Primetime Ultimate Nation’, “Formal jobs come with mind-numbing levels
14 https://www.forbes.com/sites/naazneenkarmali/2017/04/26/mukesh-ambani-rejoins-the-worlds-top-20-richest-on-rising-shares-of-reliance-industries/#3d88d1f72752 15 http://www.dailymail.co.uk/news/article-2824919/World-s-expensive-homes-revealed-Buckingham-Palace-property-ladder-1billion-three-ten-London.html 16 http://knowledge.wharton.upenn.edu/article/luxury-cars-are-gaining-traction-in-india-and-in-small-towns-too/
Boom in mobile telephony and completion of the Golden Quadrilateral increased communication and mobility for the middle class
By the early noughties, the boom in employment heavy service sectors was visible
The rich grew richer and show of wealth spread to small towns
The 1991 reforms failed to address structural issues in the economy…

Strategy & Economy
January 09, 2018 Ambit Capital Pvt. Ltd. Page 75
of bureaucracy, such as baffling definitions of what counts as wages or what category of workers an employee belongs to. All seemed designed to create lucrative chances for corrupt labor inspectors to extract bribes.”
This corruption that resulted from the haphazard implementation of the 1991 reforms would eventually become institutional (creating a network of middlemen in business) and political (embedding corrupt politicians in Parliament). As Milan Vaishnav writes in his 2016 book, ‘When crime pays: money and muscle in Indian politics’, “Individuals with criminal reputations have long been associated with politics in India, but amid a changing electoral environment in which uncertainty and competition have both intensified, over time they have moved from the periphery to the center stage.”
Even in the current Government, MPs with criminal cases remain high Exhibit 119:
Source: Milan Vaishnav, ‘When Crime Pays’ (2016), Ambit Capital research
This depth of corruption within our democracy can be gauged from this depressing extract from Josy Joseph’s ‘A Feast of Vultures’ (2016), “For the vast majority of Indians, their country is not much of a republic and even less of a democracy. How else could a generation of entrepreneurs blatantly abuse power and still thrive? How could so many buy their way into legislatures and parliament to manipulate public processes for their private gains?”
Those who thought that economic progress would usher in a cleaner India were brought to their senses in 2010-12 when the second term of the UPA Government (2009-14) was marred with a spate of corruption scandals from the Commonwealth Games (2010) to the allocation of telecom spectrum (2010) and coal mines (2012). These allegations coincided with the post-Global Financial Crisis (2009) led economic slowdown. By this time, India’s now large middle class across metros and Tier 1 and Tier 2 cities had had enough. It was time for change.
As Infosys co-founder and now Chairman, Nandan Nilekani wrote in his 2013 book, ‘Reimagining India’, “India is a country so young that 50 per cent of the population is still not eligible to vote, and this means that the voice of an entire, large generation is now ignored in India's policy making and public debates. These are the children of liberalisation who have an entirely different perspective on our traditions and policies compared to the majority of India's voters and policy makers today.”
In hindsight, Modi was able to capture both these trends – the rise of the middle-class across towns and villages and the anti-corruption wave fueled by the scams. For a young, aspirational middle-class youth seeking a new way of life, Modi literally promised ‘acche din’ (better days). Journalist Rajdeep Sardesai in his book, ‘2014: The election that changed India’ writes, “Modi’s other great success was in understanding the changing demographics of India – a younger, aspirational society that is easily the most upwardly mobile in the world. Modi likes to see the core of this new India as a ‘neo-middle class’ society which is tiring of state-sponsored welfarism and simply wants market-driven growth.”
24%
30%34%
12%15%
21%
0%
5%
10%
15%
20%
25%
30%
35%
40%
2004 2009 2014
MPs with criminal cases MPs with serious cases
… and the haphazard implementation of the 1991 reforms aided in creating institutional corruption
“For the vast majority of Indians, their country is not much of a republic and even less of a democracy.”
Corruption scandals marred the second term of the UPA

Strategy & Economy
January 09, 2018 Ambit Capital Pvt. Ltd. Page 76
Modi’s appeal cut across caste and class alike. Sardesai writes, “This ‘neo-middle class’ was, in a sense, Modi’s answer to the Congress’s aam aadmi, and captured the vaulting aspirations of a rapidly changing India, from a taxi driver to a call centre operator and from a pizza delivery boy to a hair stylist in a small town.”
Modi’s victory was comprehensive, nearly decimating the Congress in the 2014 elections. Modi’s victory is significant because it gives hope of a rank outsider – that too of humble beginnings and lower caste – rising to lead the country.
The BJP has nearly decimated the Congress in the past 30 years Exhibit 120:
Seats Vote Share (%)
2014 1984 2014 1984
BJP 282 2 31.0 7.7
Congress 44 404 19.3 49.1
Source: Election Commission of India, Ambit Capital Research
Segment 3: What was the result of this change? Tectonic shifts in the fabric of the nation We see three big changes that will play out in the future:
a) From secularism to nationalism: With the end of the UPA in 2014, there is a perceptible shift from the Nehruvian idea of secularism enshrined in our Constitution to a more muscular, proud sense of nationalism (often Hindu nationalism). There were already glimpses of this in the previous BJP regime during the Kargil war of 1999. But under Modi, this shift is more evident. After all, the BJP has risen to 282 seats in the Lok Sabha in 2014 from a mere two seats in 1984. This surge has underpinned the growth in Hindutva and a conscious effort to stamp out the Nehru-Gandhi family’s reign over India in the past. We provide two quotes to highlight this change:
Dhirendra Jha in his 2017 book, ‘Shadow Armies’, writes, “The triumph of Hindutva, following the BJP’s striking victory in the 2014 Lok Sabha Elections and in many of the state polls thereafter, has resulted in brahminism trying to recolonize the spaces it had been forced to vacate due to social reform movements and anti-brahminical ideological struggles.”
TN Ninan in a Business Standard editorial 17 on how the association between Nehru and Children’s Day is being erased as part of a broader effort, “This association between Nehru and young people may be difficult to dislodge from public consciousness, even though the Union Ministry of Youth Affairs is reportedly preparing a Cabinet note on deleting his name from the government’s network of Nehru Yuva Kendras. This is part of a broader, concerted effort to erase, or at least diminish, the memory of Nehru from India’s public life.”
b) The rise of socially aggressive lower castes: Modi’s positioning as an outsider crusading to end the old order of the elite has a massive appeal with the poor. With demonetisation he demonstrated his commitment to uproot the corrupt; the poor (in terms of caste and class) responded overwhelmingly: the BJP won a landslide victory in the Uttar Pradesh assembly elections in March 2017.
Modi’s popularity with the poor will shape his policies until the General Elections of 2019 and possibly later. The poor want to see their aspirations fulfilled. These men and women want their children to be well-educated and healthy. They want to live in pucca homes and purchase products which signal to the community around them that they are moving up in the world. Thus, going forward, we expect Modi to continue his anti-elite, pro-poor stance over the next 18 months.
17 http://www.business-standard.com/article/opinion/marginalising-nehru-117111301558_1.html
Modi’s victory nearly decimated the Congress in the 2014 elections
There is a perceptible shift from the Nehruvian era to a proud sense of nationalism
Modi has demonstrated his commitment to uproot the corrupt…
…and his popularity with the poor will shape his economic policies

Strategy & Economy
January 09, 2018 Ambit Capital Pvt. Ltd. Page 77
c) The assertion of girls and women: Three ongoing factors are raising the role of women from staying at home to being increasingly assertive: a) rising levels of literacy; b) high profile gender-sensitisation and awareness campaigns being run by the Government (Sukanya Samriddhi Yojana; Beti Bachao, Beti Padhao); and c) the breakdown of the joint family and the rise of nuclear families, which reduce the impact of decisions imposed on women by the larger joint family. As Anirudha Dutta writes in his book, “Whilst improved and increased literacy is immediately not driving significant increase in labour force participation, it will be a natural consequence with at best a few years’ time lag. I believe economic rationale, cost of living, aspirations for a better lifestyle and assertiveness of independence by girls and women will drive increase in labour force participation.”
We believe these three changes are still playing out and should in all likelihood strengthen in the next decade.

Strategy & Economy
January 09, 2018 Ambit Capital Pvt. Ltd. Page 78
How will aspirations evolve over the next decade? Seventy years after its Independence, India continues to evolve. As we showed in the previous section, India’s youth went from long phase of frustration (Phase 1: 1965-1980), to hope in a steadily liberalising economy (Phase 2: 1980-1995), to establishing an identity in a growing economy (Phase 3: 1995 to 2017). What does the next decade hold? We see four big areas of aspirations for the Indian youth:
1. Muscular assertion of identity: In his pre-election rallies in 2014, Mr. Modi often used the line “Congress got 60 years to rule India, give us 60 months” and promised a “Congress-mukt Bharat” (an India rid of the INC). The narrative played well with Modi positioning himself as an outsider underdog from a poor background pitted against the power of Delhi’s entrenched elite and ruling class. His promise of a corruption-free India headed for development found mass appeal in a country that had seen mega-scams in the UPA era.
The BJP’s overwhelming wins in the general elections in 2014 and in the Uttar Pradesh assembly elections in 2017 further cemented its mass popularity (across caste and class) and, in the process, closed the chapter on the old-style politics that the Congress had created.
As journalist and ex-editor of the Indian Express, Shekhar Gupta, wrote in this column18 (emphasis ours) in May 2017,
“For seven decades, the Congress, or Congress-like Left-Centre politics was the dominant pole of our politics. Now, the BJP has replaced it.
Just as in the past all challenge was built as a counterpoint to this pole, the roles have now decisively reversed in the manner they hadn't with Modi's win in 2014 and the Vajpayee-Advani reign earlier.
That is because all past contest was between 'secular' forces representing India's minorities and some caste vote banks and the BJP trying to rouse an insecure majority whilst claiming to be truly secular.
Today, it leads an unprecedented Hindu vote bank that is no longer driven by old insecurities, but a resurgent new confidence, even arrogance.”
With the rise of the BJP, there is a clear move to disassociate India from the liberal-secular ideals of the Nehruvian era and shift the narrative of a new generation to a broader, more muscular assertion of India’s greatness. This shift also plays to building Modi’s image with the poor versus the Congress/Nehru’s elitists past, mentioned above. As Pankaj Mishra wrote19 in the New York Times,
“Nehru and his followers had articulated an influential ideology of Indian exceptionalism, claiming moral prestige and geopolitical significance for India’s uniquely massive and diverse democracy. Only many of those righteous notions also reeked of upper-caste sanctimony and class privilege. Mr. Modi has effectively mobilized those Indians who have long felt marginalized and humiliated by India’s self-serving Nehruvian elite into a large vote bank of resentment.”
18 http://www.rediff.com/news/column/the-rise-of-hindutva-20/20170506.htm 19 https://www.nytimes.com/2017/08/11/opinion/india-70-partition-pankaj-mishra.html
“For seven decades, the Congress, or Congress-like Left-Centre politics was the dominant pole of our politics. Now, the BJP has replaced it.”

Strategy & Economy
January 09, 2018 Ambit Capital Pvt. Ltd. Page 79
We provide a few examples of the BJP Government’s efforts at invoking India’s glorious past:
In 2014, at the inauguration of a hospital in Mumbai, Modi alluded20 to plastic surgery and genetic science being present in ancient India.
In 2014, the Department of Ayurveda, Yoga and Naturopathy, Unani Siddha and Homeopathy (AYUSH) became a separate, dedicated Ministry of AYUSH with its own Minister of State (Independent Charge) – Mr. Shripad Yesso.
In 2015, addressing the United Nations, Modi suggested that 21st June be made International Yoga Day.
Alongside this, elite structures of the past are also slowly being dismantled: the Planning Commission, India’s apex policymaking body since Independence, gave way to the NITI Aayog in 2015 and in 2016, Race Course Road (which houses the Prime Minister’s residence) was renamed Lok Kalyan Marg (Lok Kalyan means “the good of the people”).
We expect these trends to continue and fuel aspirations for today’s youth to be patriotic, proud of India’s past, and self-confident in the assertion of their own identity. This change seems likely to become visible in the following ways:
New groups of people from the smaller towns and cities will pushing the entrenched elites of the big cities out of the way.
Even within the big cities, the erstwhile working class will snap at the heels of the established Anglicised elites.
No longer will people with crisp English, membership of the right clubs and degrees from prestigious universities walk into the top policy and political posts.
The new elite are those with a strong grip on Hindi, a practical understanding of how small town and rural India functions, an ability to identify with the country’s ancient traditions and, of course, the ability to win the trust of the PM.
The old elite were in a way the remnants of the Raj. The new elite are an altogether different – a more indigenous – proposition. That in itself implies that the country will see a huge churn in its economy and in its elite over the next decade.
2. The rise of lower middle class and the aspirations of the poor: Just as middle-class consumerism started booming in the 1980s, we expect the lower middle class to demand better services and aspire for a better life in the next decade. As the Golden Quadrilateral and the launch of mobile telephony in Phase 3 (1995- 2017) drove the aspirations of the middle class, we believe that the Government’s initiatives such as the Bharatmala Road Project (34,800km of roads to be constructed at an investment of Rs5.350tn) and the increasing penetration of the ‘Jan Dhan-Aadhaar-Mobile’ Yojana will, over the next decade, fuel aspirations of the lower middle class and the poor.
20 https://qz.com/288867/modi-was-half-right-worlds-first-plastic-surgeon-may-well-have-been-indian-but-he-wasnt-shiva/
Elite structures of the past are also slowly being dismantled
Today’s youth will aspire to strive to establish their own identity
The lower middle class will demand better services and aspire for a better life in the next decade

Strategy & Economy
January 09, 2018 Ambit Capital Pvt. Ltd. Page 80
Marked increase in road construction under Exhibit 121:Pradhan Mantri Gram Sadak Yojana (PMGSY)
Source: Press Information Bureau, Ambit Capital research
Investment in housing projects has been Exhibit 122:ramped up significantly
Source: Press Information Bureau, Ambit Capital research. JNNURM = Jawaharlal Nehru National Urban Renewal Mission, PMAY = Prime Minister Awas Yojana
We highlight three specific areas that the lower middle class will aspire to in the next decade:
Aviation: The opening up of the Aviation Sector after liberalisation reforms in 1991 opened up air travel for the middle class. Air travel was until then seen as a status symbol, a preserve of the rich, and a dream for the middle class (until then used to traveling long distances by train). Eventually, this aspiration for air travel graduated to foreign and leisure travel. However, air travel is still out of bounds for the lower middle class, something that Prime Minister Modi is aware of. To make this aspiration a reality, Modi launched the UDAN (Ude Desh ka Aam Nagrik, Hindi for let India’s common man fly) scheme in April 2017 from Shimla, tweeting21, “The lives of the middle class are being transformed and their aspirations are increasing. Given the right chance they can do wonders.” In October 2017, the Prime Minister also tweeted22, “Aviation cannot be about rich people. We have made aviation affordable and within reach of the lesser privileged”. The UDAN scheme entails low cost airfare of Rs2,500 for a 1-hour journey of approximately 500 kilometers on a fixed wing aircraft or a 30-minute journey on a helicopter.
21 https://twitter.com/PMOIndia/status/857468857161662465 22 https://twitter.com/PMOIndia/status/916596500339163136
10
15
20
25
30
35
40
45
50
FY12 FY13 FY14 FY15 FY16 FY17
('000 km road length completed)
152
1,535
0
200
400
600800
1,000
1,200
1,400
1,600
1,800
JNNURM PMAY (Urban)
(Rs bn)
Prime Minister Modi has said “Aviation cannot be about rich people”

Strategy & Economy
January 09, 2018 Ambit Capital Pvt. Ltd. Page 81
Prime Minister Modi launching UDAN from Shimla in April 2017 Exhibit 123:
Source: narendramodi.in, Ambit Capital research
Housing: Owning your own home remains an aspiration for many in India, especially the lower middle class. In June 2015, the Union Cabinet approved the ‘Housing for all by 2022’ campaign (2022 is when India celebrates 75 years of Independence). On the eve of New Year 2017, Prime Minister Modi announced23 a slew of measures including interest subvention of 4% for loans up to Rs0.9m and 3% for loans up to Rs1.2m taken in 2017. The number of houses being built for the poor, under the Pradhan Mantri Awaas Yojana in rural areas, was increased by 33% and interest rate subventions were announced for affordable rural housing as well. In April 2017, at a speech on the occasion of Ambedkar Jayanti, Modi said24, “We have a dream for 2022. The poorest of poor should have a house of his own. And that house must be equipped with electricity, water and other facilities. There should be hospitals and schools in the neighborhood”. Thus, we expect housing to remain a focus area for the Government and – depending on the success of the affordable housing schemes – fuel the aspirations of the lower middle class, much in the same manner as the first wave of housing finance companies (such as HDFC in the 1990s) fueled the middle class housing demand in Phase 2 (1980-1995) as well as Phase 3 (1995-2017).
Access to low-cost mobile data and voice: The entry of mass-market operator, Reliance Jio (public launch in September 2016), with the offer of all voice calls free and cheap rates for data was a huge success, garnering 16m subscribers in its first month and hitting 100m subscribers in less than six months (Sept 2016 to Feb 2017). Reliance Jio has also launched a feature-phone (Jio Phone) for Rs1,500 in an attempt to overcome the hurdle of expensive smartphones for accessing apps. Access to mobile data at cheap rates has the potential to open up apps and services (such as bank transfers, e-commerce, consuming video content, etc.) to a vast section of lower middle class that was held back due to expensive tariffs for data and the high cost of a smartphone.
23 http://pib.nic.in/newsite/PrintRelease.aspx?relid=156050 24 https://thewire.in/125113/housing-for-all-modi-mumbai/
Housing will remain a focus area for the Government
Reliance Jio hit 100m subscribers in less than six months of launch

Strategy & Economy
January 09, 2018 Ambit Capital Pvt. Ltd. Page 82
Reliance Jio’s feature-phone has received a positive response Exhibit 124:
Source: jio.com, Ambit Capital Research
Aviation, housing, and mobile telephony went from being luxuries to necessities for the middle class in India in Phase 3 (1995-2017). We expect a repeat across the lower middle class in the next decade. Popular Hindi cinema already reflects this change with many movies being set in smaller towns and cities, recognising the changing aspirations in these locations.
Movies shot in Exhibit 125:non-metro cities…
Source: IMDB.com, B.R. Studios, Junglee Pictures, Ambit Capital Research
..have been popular in Exhibit 126:2017…
Source: IMDB.com, Dharma Productions, Ambit Capital Research
..reflecting the aspirations Exhibit 127:of the youth
Source: IMDB.com, Color Yellow Productions, Eros International, Y Not Studios, Ambit Capital Research
3. Asset ownership aspirations – from physical to financial: Physical savings (i.e. real estate such as homes and land) have long dominated India’s savings, accounting for 57% of total household sector savings as recently as FY16. Within financial savings, bank deposits are seen as ‘safer’ and hence have traditionally accounted for the largest share. Thus, asset ownership within India remains grounded in traditional, low yielding assets such as real estate and bank deposits.
Asset ownership within India remains grounded in traditional, low yielding assets…

Strategy & Economy
January 09, 2018 Ambit Capital Pvt. Ltd. Page 83
Physical savings score over financial savings Exhibit 128:(as % of household savings)…
Source: RBI, Ambit Capital research
…whilst bank deposits are preferred over Exhibit 129:shares (as % of financial assets)
Source: RBI, Ambit Capital research
With demonetisation, there has been a shift from physical savings towards financial savings, which is gradually picking up pace and should continue in the next decade. This shift is being fueled by the unaffordability of real estate in metro cities (bloated prices), the freezing of cash transactions in real estate (due to demonetisation), and the booming stock markets.
Investor folios in mutual funds are hitting all-time highs Exhibit 130:
Source: AMFI, Ambit Capital research
We believe “owning your own home” will remain an aspiration for the masses. However, within metros, the youth are increasingly questioning the purpose of committing huge chunks of their future salaries for owning an expensive, illiquid, low-yielding asset. At the same time, the Association of Mutual Funds of India (AMFI) has been running a highly visible advertising campaign advocating the use of systematic investment plans (SIPs) as a low-ticket, long-term way of building wealth in an asset class that has also delivered stellar returns (Sensex rose 26% in CY2017).
0%
20%
40%
60%
80%
100%
FY13 FY14 FY15 FY16
Financial Physical Valuables
(10)
0
10
20
30
40
50
60
70
FY08
FY09
FY10
FY11
FY12
FY13
FY14
FY15
FY16
FY17
Deposits Shares & debentures
(% )
35
40
45
50
55
60
65
FY09 FY10 FY11 FY12 FY13 FY14 FY15 FY16 FY17 1HFY18
(m)
…which is gradually shifting towards financial assets
Owning your own home will remain an aspiration for the masses.

Strategy & Economy
January 09, 2018 Ambit Capital Pvt. Ltd. Page 84
Whilst home ownership is being questioned… Exhibit 131:
Source: Screen grab from Huffington Post website
…mutual funds advertisements are playing on Exhibit 132:prime time TV
Source: Screen grab from AMFI website
Thus, over the longer term, we see a scenario of the lower middle class aspirations being fulfilled by the affordable housing segment, even as in urban and metro areas the need for owning an expensive house gets questioned by the youth.
We see the urban youth building a portfolio of stocks and mutual funds as aspiring as their needs to secure their financial future. Thus, the acceptance of mutual funds in general and SIPs in particular as an aspirational way of building a secure future holds the potential of a sustained switch of inflows towards equity markets away from real estate.
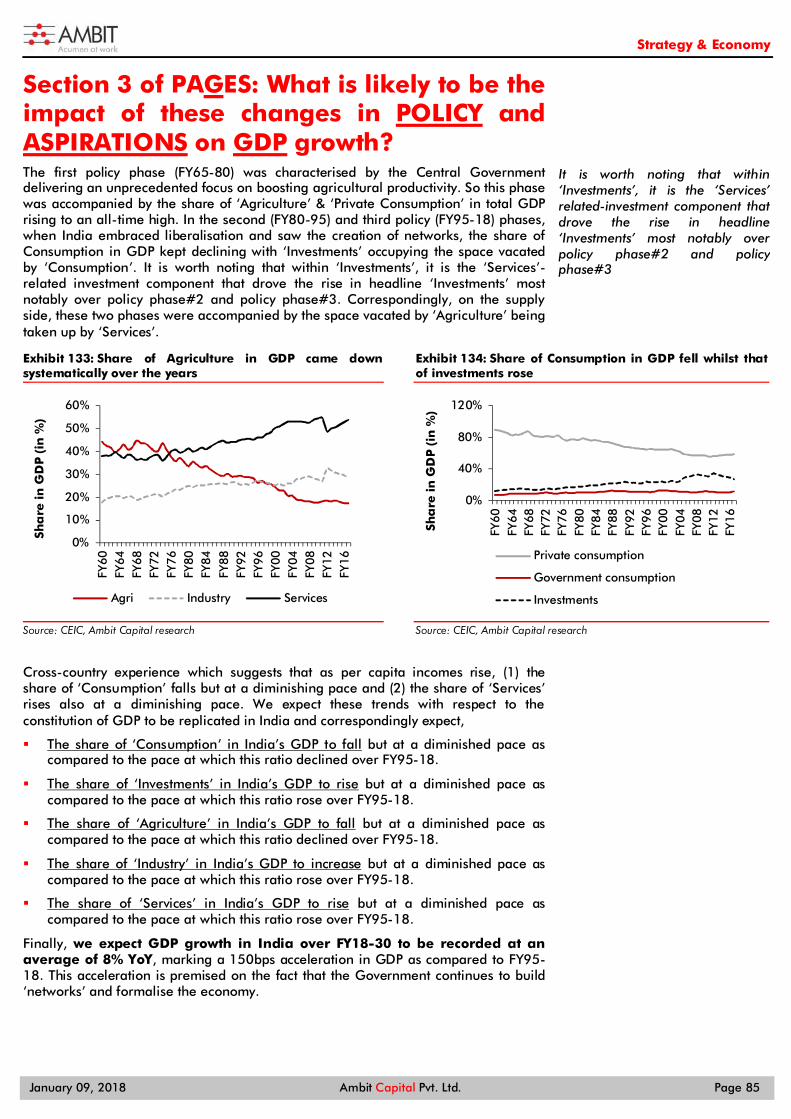
Strategy & Economy
January 09, 2018 Ambit Capital Pvt. Ltd. Page 85
Section 3 of PAGES: What is likely to be the impact of these changes in POLICY and ASPIRATIONS on GDP growth? The first policy phase (FY65-80) was characterised by the Central Government delivering an unprecedented focus on boosting agricultural productivity. So this phase was accompanied by the share of ‘Agriculture’ & ‘Private Consumption’ in total GDP rising to an all-time high. In the second (FY80-95) and third policy (FY95-18) phases, when India embraced liberalisation and saw the creation of networks, the share of Consumption in GDP kept declining with ‘Investments’ occupying the space vacated by ‘Consumption’. It is worth noting that within ‘Investments’, it is the ‘Services’-related investment component that drove the rise in headline ‘Investments’ most notably over policy phase#2 and policy phase#3. Correspondingly, on the supply side, these two phases were accompanied by the space vacated by ‘Agriculture’ being taken up by ‘Services’.
Share of Agriculture in GDP came down Exhibit 133:systematically over the years
Source: CEIC, Ambit Capital research
Share of Consumption in GDP fell whilst that Exhibit 134:of investments rose
Source: CEIC, Ambit Capital research
Cross-country experience which suggests that as per capita incomes rise, (1) the share of ‘Consumption’ falls but at a diminishing pace and (2) the share of ‘Services’ rises also at a diminishing pace. We expect these trends with respect to the constitution of GDP to be replicated in India and correspondingly expect,
The share of ‘Consumption’ in India’s GDP to fall but at a diminished pace as compared to the pace at which this ratio declined over FY95-18.
The share of ‘Investments’ in India’s GDP to rise but at a diminished pace as compared to the pace at which this ratio rose over FY95-18.
The share of ‘Agriculture’ in India’s GDP to fall but at a diminished pace as compared to the pace at which this ratio declined over FY95-18.
The share of ‘Industry’ in India’s GDP to increase but at a diminished pace as compared to the pace at which this ratio rose over FY95-18.
The share of ‘Services’ in India’s GDP to rise but at a diminished pace as compared to the pace at which this ratio rose over FY95-18.
Finally, we expect GDP growth in India over FY18-30 to be recorded at an average of 8% YoY, marking a 150bps acceleration in GDP as compared to FY95-18. This acceleration is premised on the fact that the Government continues to build ‘networks’ and formalise the economy.
0%
10%
20%
30%
40%
50%
60%
FY60
FY64
FY68
FY72
FY76
FY80
FY84
FY88
FY92
FY96
FY00
FY04
FY08
FY12
FY16
Sha
re in
GD
P (
in %
)
Agri Industry Services
0%
40%
80%
120%
FY60
FY64
FY68
FY72
FY76
FY80
FY84
FY88
FY92
FY96
FY00
FY04
FY08
FY12
FY16
Sha
re in
GD
P (
in %
)
Private consumption
Government consumption
Investments
It is worth noting that within ‘Investments’, it is the ‘Services’ related-investment component that drove the rise in headline ‘Investments’ most notably over policy phase#2 and policy phase#3

Strategy & Economy
January 09, 2018 Ambit Capital Pvt. Ltd. Page 86
We expect the share of ‘Services’ in GDP to continue rising but at a Exhibit 135:diminished pace
Period Average
Agriculture (as a % of GDP)
Average Industry (as a % of GDP)
Average Services (as a % of GDP)
Average real GDP growth
FY65-80 40% 21% 38% 3.2%
FY80-95 31% 26% 43% 4.7%
Delta for Phase 2 -9% +5% +5% +1.5%
FY95-18 21% 28% 51% 6.6%
Delta for Phase 3 -10% +2% +8% +1.9%
FY18-39 (E) 14% 30% 56% 8.1%
Level in FY17 17% 29% 54% 5.8%
Delta for Phase 4 (E) -7% +2% +5% +1.5%
Source: CEIC, Ambit Capital
These changes in GDP composition correlate strongly with how we see the Sensex evolving over the next decade (please see section 4 on page 91-92 for details).
The section below elaborates on the rationale behind these dynamics. Section A: Capturing the transition of India’s supply side GDP over the three policy phases The first policy phase spanning FY65-80 was characterised by the Central Government delivering an unprecedented focus on boosting agricultural productivity. Correspondingly, the first policy phase also saw the share of the Agricultural sector in GDP being recorded at an average of 40%; i.e. the highest level this metric would be recorded at across all three policy phases. In the second and third policy phases, when India embraced liberalisation and the creation of networks, the share of Agriculture in GDP kept declining with the Services sector and the Industrial Sector (to a significantly lesser extent) occupying the space vacated by the Farm sector. This change in constitution of India’s GDP away from the Farm sector and in favour of the non-farm sector was naturally accompanied by India’s average real GDP growth receiving a boost in each of the two phases with the booster amounting to 150bps and 190bps in the second and third phases respectively (see exhibit below).
Post 1980, the share of farm sector GDP kept declining with the Services Exhibit 136:sector taking up the majority of the vacated space
Period
Average Agricultural
sector GDP (as a % of GDP)
Industrial Sector GDP (as
a % of GDP)
Services sector GDP (as a % of
GDP)
Average real GDP growth
India’s average per
capita income (in US$)*
FY65-80 40% 21% 38% 3% 145
FY80-95 31% 26% 43% 5% 320
Change -9% +5% +5% +1.5% 175
FY95-18 21% 28% 51% 6.6% 914
Change -10% +2% +8% +1.9% 594
Source: CEIC, Ambit Capital research. * Please note that this is average GDP/capita across the entire phase (not at the end date).
In specific, an analysis of the supply side constitution of India’s GDP over each of the three policy phases yields the following takeaways:
Agriculture: The share of Agriculture in overall GDP has been declining systematically over each of the three policy phases. The average share of Agriculture in GDP decreased by 9 percentage points in the second policy phase as compared to the first. During the third policy phase this metric declined by a whopping10 percentage points of GDP.
Industry: The share of Industry in overall GDP has been rising over each of the policy phases but at a notably declining rate. The average share of Industry in GDP increased by 5 percentage points in the second policy phase as compared to the first. Then during the third policy phase this metric increased but only by 2 percentage points of GDP.
The first policy phase spanning FY65-80 was characterised by the Government delivering a boost to agricultural productivity.
In the second and third policy phase India embraced liberalisation and the creation of networks
The share of Agriculture in overall GDP has been declining systematically

Strategy & Economy
January 09, 2018 Ambit Capital Pvt. Ltd. Page 87
Services: The share of Services in overall GDP has been rising over each of the policy phases and that too at an increasing rate. The average share of Services in GDP increased by 5 percentage points in the second policy phase as compared to the first. Then during the third policy phase this metric increased by an impressive 8 percentage points of GDP.
Section B: Capturing the transition of the demand side over the three policy phases In line with cross-country experience, the first policy phase when India’s per capita income was unusually low was when the share of private Consumption in total GDP peaked at an average of 81%. In the second and third policy phases when India embraced liberalisation and the creation of networks and as India’s per capita income rose, the share of Consumption in GDP kept declining with ‘Investments’ and to a lesser extent ‘Government expenditure’ occupying the space vacated by ‘Consumption’. It is worth noting that ‘net exports’ as a sector too kept losing significance across the three policy phases as Indian exports growth remained slower than the pace of growth of India’s imports (see exhibit below).
After 1980 the share of ‘Consumption’ in total GDP declined with Exhibit 137:‘Investments’ taking up most of the space vacated
Period Average PFCE
(as a % of GDP)
Average GFCF (as a % of
GDP)
Average GFCE (as a % of
GDP)
Average NX (as a % of
GDP)
Average real GDP growth
FY65-80 81% 15% 9% -1% 3.2%
FY80-95 72% 21% 11% -1% 4.7%
Delta -9% +6% +2% +0% +1.5%
FY95-2017 61% 28% 11% -3% 6.6%
Delta -11% +7% +0% -2% +1.9%
Source: CEIC, Ambit Capital. Note: PFCE stands for Private Final Consumption Expenditure, GFCF stands for Gross Fixed Capital formation, GFCE stands for Government Final Consumption Expenditure, NX stands for Net Exports
An analysis of the demand side constitution of India’s GDP over each of the three policy phases yields the following takeaways:
Private final Consumption expenditure (PFCE) or Consumption: Much in line with global experience, as India’s per capita income increased, the share of Consumption in overall GDP declined systematically over each of the three policy phases. The average share of Consumption in GDP decreased by 9% in the second policy phase as compared to the first. During the third policy phase this metric declined by a notable 11% of GDP.
Gross fixed capital formation (GFCF) or Investments: The share of Investments in overall GDP has been rising over each of the policy phases and that too at an increasing rate. The average share of investment in GDP increased by 6 percentage points in the second policy phase (FY80-95) as compared to the first (FY65-80). During the third policy phase this metric increased by an impressive 7 percentage points of GDP.
As regards the constitution of investments, it is worth noting that the share of the Industrial sector’s investments in GDP rose substantially in the second policy phase. However, in the third policy phase, the Services sector’s investments rose substantially with Industrial sector GFCF rising by a lesser degree (see exhibit below).
The first policy phase when India’s per capita income was unusually low was when the share of private Consumption in total GDP peaked at an average of 81%
The average share of Consumption in GDP decreased by 9% in the second policy phase as compared to the first
The share of Investments in overall GDP has been rising over each of the policy phases

Strategy & Economy
January 09, 2018 Ambit Capital Pvt. Ltd. Page 88
Whilst policy phase#2 saw Industrial investments rising dramatically, Exhibit 138:policy phase#3 saw Services investments rising meaningfully
Period Average Agricultural GFCF (as a % of GDP)
Average Industrial GFCF (as a % of GDP)
Average Services GFCF (as a % of GDP)
FY65-80 2.7% 7.7% 6.6%
FY80-95 2.4% 11.1% 8.8%
Delta -30bps +340bps +220bps
FY95-2017 2.4% 13.5% 13.0%
Delta 0bps +240bps +420bps
Source: CEIC, Ambit Capital
Government Consumption expenditure: The share of GFCE in overall GDP has been rising over each of the policy phases but at a declining rate. The average share of GFCE in GDP increased by 2 percentage points in the second policy phase (FY80-95) as compared to the first (FY65-80). During the third policy phase this metric remained static. This trend is in line with the Government component of Gross Savings declining at an increasing rate as explained in the section below.
Saving: As the share of Consumption in India declined over each of the three policy phases, concomitantly the share of savings in India rose at an increasing pace. However, it is worth noting that this increase was driven by the household sector and to a lesser extent the private corporate sector. The Government sector on the other hand experienced a decline in its savings ratio as the Indian State opted for higher fiscal deficits to appease the masses that were increasingly left out of the development process (see exhibit below).
Households savings have gone up significantly over the phases Exhibit 139:
Period
Average Households
Savings (as a % of GDP)
Average Government
Savings (as a % of GDP)
Average Private
Corporate Savings (as a % of GDP)
Average Households
Financial Savings (as a % of GDP)
Average gross
savings (as a % of GDP)
FY65-80 10% 4% 1% 4% 16%
FY80-95 14% 3% 2% 7% 20%
Delta +4% -1% +1% +3% +4%
FY95-2017 21% 1% 7% 10% 29%
Delta +7% -2% +6% +3% +9%
Source: CEIC, Ambit Capital research
Section C: Forecasting GDP growth and its constitution in India over FY17-22 As highlighted over pages 85-88 from a forward looking perspective, we expect,
Policy makers in India to maintain a broadly pro-business policy environment (as high degrees of political competition mean that political parties have no choice but to ensure that corporate India is able to generate healthy profits).
Subsequent Indian Governments to continue focusing on the pursuance of black money crackdown (as rising inequalities remain a key focus).
Hence, we expect the following trends to characterise growth in India’s GDP growth rate and its constitution.
We expect the share of services in GDP to rise but a diminished pace as compared to the last 22 years. This could be in line with the cross-country experience which suggests the pace of growth of the share of Services sector in GDP diminishes at higher levels of per capita income (see exhibit below).
The share of GFCE in overall GDP has been rising over each of the policy phases
Policy makers in India to maintain a broadly pro-business policy environment

Strategy & Economy
January 09, 2018 Ambit Capital Pvt. Ltd. Page 89
We expect share of services to rise but at a diminished pace Exhibit 140:
Source: World Bank, Ambit Capital research. The data consist of all the countries with per capita income up to US$5,000. Data pertains to CY16.
Thus, even as the change in constitution of India’s GDP away from the Farm sector and in favour of the non-farm sector continues, the pace of expansion of the Services sector is likely to diminish. This is likely to mean that India’s average real GDP growth rate receives a boost over FY18-30 but the extent of the increase is lesser, at 150bps, as compared to the delta of 190bps in the third phase (FY95-18) (see exhibit above).
We expect the share of ‘Services’ to rise at a diminished pace, resulting in Exhibit 141:the share of ‘Agriculture’ declining at a diminished pace
Period Average
Agriculture (as a % of GDP)
Average Industry (as a % of GDP)
Average Services (as a % of GDP)
Average real GDP growth
FY65-80 40% 21% 38% 3.2%
FY80-95 31% 26% 43% 4.7%
Delta for Phase 2 -9% +5% +5% +1.5%
FY95-18 21% 28% 51% 6.6%
Delta for Phase 3 -10% +2% +8% +1.9%
FY18-39 (E) 14% 30% 56% 8.0%
Level in FY17 17% 29% 54% 5.8%
Delta for Phase 4 (E) -7% +2% +5% +1.5%
Source: CEIC, Ambit Capital
The pick-up in GDP growth over FY18-30 is likely to be driven by three sets of factors, namely: (1) the continued creation of physical, financial and virtual networks, which in turn is likely to drive productivity growth; (2) the continued focus of subsequent Governments on a black money crackdown is likely to formalise the economy; and (3) liberalisation continuing to be a policy theme, thereby resulting in the continued opening up of the broader economy.
We expect the share of Consumption in GDP to decline but at a diminishing pace as compared to that of the last 22 years. This is in line with cross-country experience (see exhibit below).
20%
40%
60%
80%
100%
-
2,000
4,000
6,000Bu
rund
i
Mad
agas
car
Gam
bia,
The
Togo
Burk
ina
Faso
Cha
d
Nep
al
Mal
i
Tanz
ania
IDA
onl
y
Kyr
gyz
Repu
blic
Zam
bia
Bang
lade
sh
Ken
ya
Sub-
Saha
ran
Afr
ica
Cot
e d'
Ivoi
re
Indi
a
Mol
dova
Nic
arag
ua
Vie
tnam
Suda
n
Mor
occo
Cab
o V
erde
Ang
ola
Arm
enia
Mon
golia
Geo
rgia
Alg
eria
Alb
ania
Low
& m
iddl
e in
com
e
Bosn
ia a
nd…
Iran
, Is
lam
ic R
ep.
Sha
re o
f se
rvic
es
in G
DP
Pe
r ca
pit
a in
com
e (U
S$)
PCI (Left scale) Share of services (Right scale)
The pace of expansion of the Services sector is likely to diminish

Strategy & Economy
January 09, 2018 Ambit Capital Pvt. Ltd. Page 90
Pace of decline of the share of Consumption in GDP diminishes at higher levels of per capita Exhibit 142:
Source: World Bank, Ambit Capital research. The data consist of all the countries with per capita income up to US$5,000. Data pertains to CY16.
Thus, even as the change in constitution of India’s GDP away from Consumption continues, the pace of the contraction is likely to diminish. This is likely to mean that the pace at which India’s savings ratio expands will diminish.
We expect the share of ‘Consumption’ to decline, resulting in ‘Savings’ as Exhibit 143:well as ‘Investments’ rising
Period Average PFCE
(as a % of GDP)
Average GFCF (as a % of GDP)
Average gross savings
(as a % of GDP)
Average real GDP growth
FY65-80 81% 15% 16% 3.2%
FY80-95 72% 21% 20% 4.7%
Delta for Phase 2 -9% +6% +4% +1.5%
FY95-18 61% 28% 29% 6.6%
Delta for Phase 3 -11% +7% +9% +1.9%
FY18-39 (E) 52% 32% 33% 8.0%
Level in FY17 59% 27% 32% 5.8%
Delta for Phase 4 (E) -9% +4% +4% +1.5%
Source: CEIC, Ambit Capital
20%
60%
100%
140%
180%
-
2,000
4,000
6,000
8,000Bu
rund
i
Moz
ambi
que
Con
go,
Dem
. Re
p.
Sier
ra L
eone
Uga
nda
Rwan
da
Hai
ti
Beni
n
Yem
en,
Rep.
Kyr
gyz
Repu
blic
Cam
bodi
a
Paki
stan
Con
go,
Rep.
Mol
dova
Ukr
aine
Hon
dura
s
Bhut
an
Phili
ppin
es
Egyp
t, A
rab
Rep.
Kos
ovo
Sri L
anka
Alg
eria
Gua
tem
ala
Guy
ana
Jam
aica Fiji
Serb
ia
Thai
land
Sha
re o
f co
nsu
mp
tio
n in
GD
P
Pe
r ca
pit
a in
com
e (c
urr
en
t US$
)
PCI (Left scale) Consumption share (Right scale)
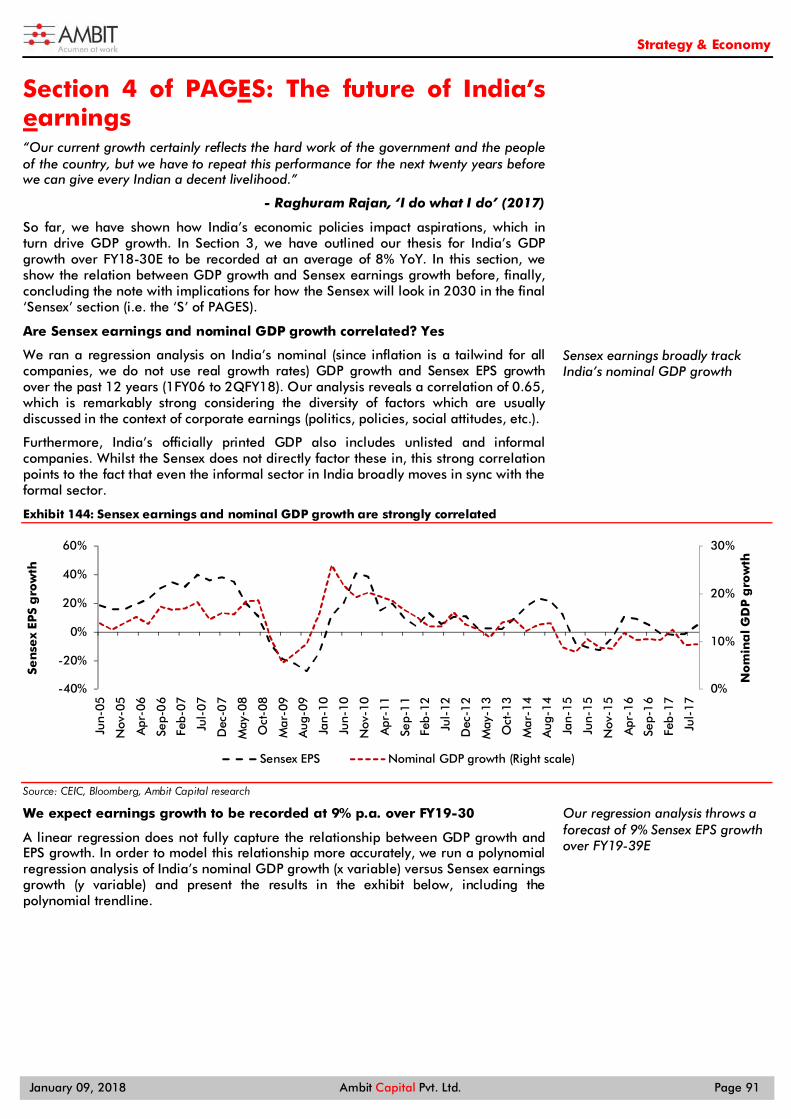
Strategy & Economy
January 09, 2018 Ambit Capital Pvt. Ltd. Page 91
Section 4 of PAGES: The future of India’s earnings “Our current growth certainly reflects the hard work of the government and the people of the country, but we have to repeat this performance for the next twenty years before we can give every Indian a decent livelihood.”
- Raghuram Rajan, ‘I do what I do’ (2017)
So far, we have shown how India’s economic policies impact aspirations, which in turn drive GDP growth. In Section 3, we have outlined our thesis for India’s GDP growth over FY18-30E to be recorded at an average of 8% YoY. In this section, we show the relation between GDP growth and Sensex earnings growth before, finally, concluding the note with implications for how the Sensex will look in 2030 in the final ‘Sensex’ section (i.e. the ‘S’ of PAGES).
Are Sensex earnings and nominal GDP growth correlated? Yes
We ran a regression analysis on India’s nominal (since inflation is a tailwind for all companies, we do not use real growth rates) GDP growth and Sensex EPS growth over the past 12 years (1FY06 to 2QFY18). Our analysis reveals a correlation of 0.65, which is remarkably strong considering the diversity of factors which are usually discussed in the context of corporate earnings (politics, policies, social attitudes, etc.).
Furthermore, India’s officially printed GDP also includes unlisted and informal companies. Whilst the Sensex does not directly factor these in, this strong correlation points to the fact that even the informal sector in India broadly moves in sync with the formal sector.
Sensex earnings and nominal GDP growth are strongly correlated Exhibit 144:
Source: CEIC, Bloomberg, Ambit Capital research
We expect earnings growth to be recorded at 9% p.a. over FY19-30
A linear regression does not fully capture the relationship between GDP growth and EPS growth. In order to model this relationship more accurately, we run a polynomial regression analysis of India’s nominal GDP growth (x variable) versus Sensex earnings growth (y variable) and present the results in the exhibit below, including the polynomial trendline.
0%
10%
20%
30%
-40%
-20%
0%
20%
40%
60%
Jun-
05
Nov
-05
Apr
-06
Sep-
06
Feb-
07
Jul-
07
Dec
-07
May
-08
Oct
-08
Mar
-09
Aug
-09
Jan-
10
Jun-
10
Nov
-10
Apr
-11
Sep-
11
Feb-
12
Jul-
12
Dec
-12
May
-13
Oct
-13
Mar
-14
Aug
-14
Jan-
15
Jun-
15
Nov
-15
Apr
-16
Sep-
16
Feb-
17
Jul-
17
No
min
al G
DP
gro
wth
Sen
sex
EPS
gro
wth
Sensex EPS Nominal GDP growth (Right scale)
Sensex earnings broadly track India’s nominal GDP growth
Our regression analysis throws a forecast of 9% Sensex EPS growth over FY19-39E
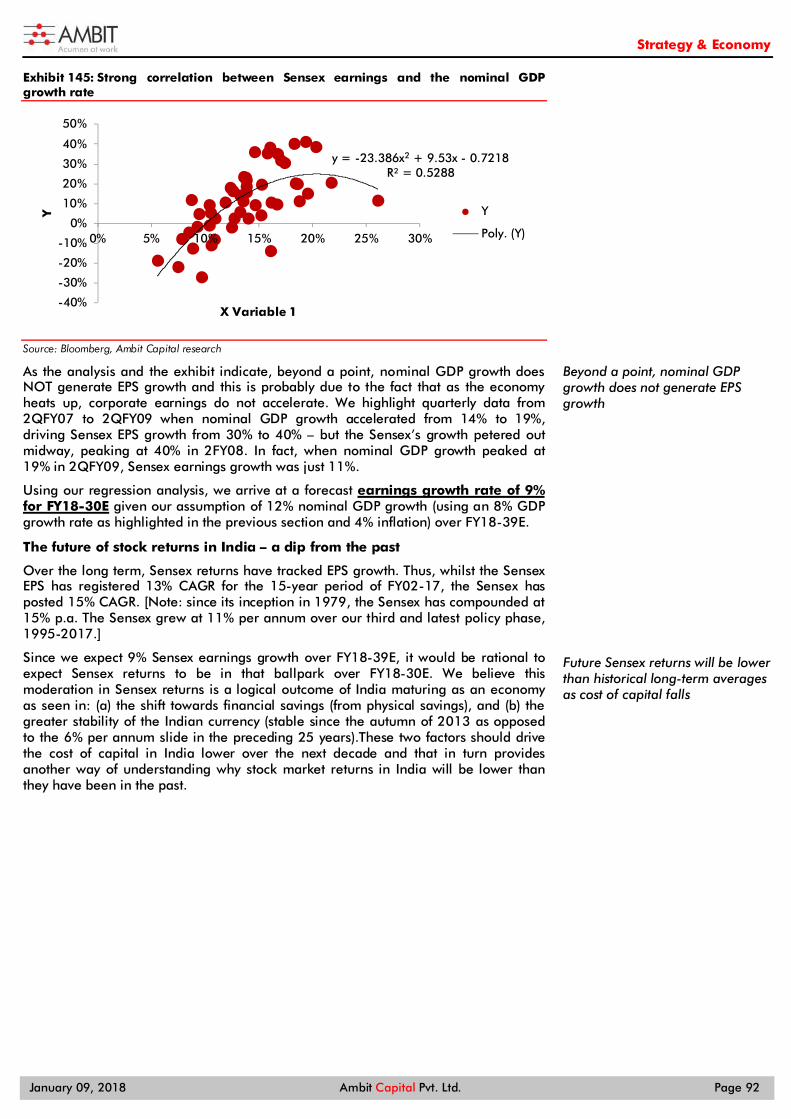
Strategy & Economy
January 09, 2018 Ambit Capital Pvt. Ltd. Page 92
Strong correlation between Sensex earnings and the nominal GDP Exhibit 145:growth rate
Source: Bloomberg, Ambit Capital research
As the analysis and the exhibit indicate, beyond a point, nominal GDP growth does NOT generate EPS growth and this is probably due to the fact that as the economy heats up, corporate earnings do not accelerate. We highlight quarterly data from 2QFY07 to 2QFY09 when nominal GDP growth accelerated from 14% to 19%, driving Sensex EPS growth from 30% to 40% – but the Sensex’s growth petered out midway, peaking at 40% in 2FY08. In fact, when nominal GDP growth peaked at 19% in 2QFY09, Sensex earnings growth was just 11%.
Using our regression analysis, we arrive at a forecast earnings growth rate of 9% for FY18-30E given our assumption of 12% nominal GDP growth (using an 8% GDP growth rate as highlighted in the previous section and 4% inflation) over FY18-39E.
The future of stock returns in India – a dip from the past
Over the long term, Sensex returns have tracked EPS growth. Thus, whilst the Sensex EPS has registered 13% CAGR for the 15-year period of FY02-17, the Sensex has posted 15% CAGR. [Note: since its inception in 1979, the Sensex has compounded at 15% p.a. The Sensex grew at 11% per annum over our third and latest policy phase, 1995-2017.]
Since we expect 9% Sensex earnings growth over FY18-39E, it would be rational to expect Sensex returns to be in that ballpark over FY18-30E. We believe this moderation in Sensex returns is a logical outcome of India maturing as an economy as seen in: (a) the shift towards financial savings (from physical savings), and (b) the greater stability of the Indian currency (stable since the autumn of 2013 as opposed to the 6% per annum slide in the preceding 25 years).These two factors should drive the cost of capital in India lower over the next decade and that in turn provides another way of understanding why stock market returns in India will be lower than they have been in the past.
y = -23.386x2 + 9.53x - 0.7218R² = 0.5288
-40%
-30%
-20%
-10%
0%
10%
20%
30%
40%
50%
0% 5% 10% 15% 20% 25% 30%
Y
X Variable 1
Y
Poly. (Y)
Beyond a point, nominal GDP growth does not generate EPS growth
Future Sensex returns will be lower than historical long-term averages as cost of capital falls

Strategy & Economy
January 09, 2018 Ambit Capital Pvt. Ltd. Page 93
Section 5 of PAGES: The Sensex in 2030 As we move towards FY30, the market-cap share of consumer discretionary + financials and industrials + materials + energy should increase even as we move to per capita income of US$5,000 by CY30. On the other hand, consumer staples and IT + telecom are likely to lose market-cap share. Healthcare and utilities are likely to remain stable. Owing to the structural changes that will materialize on the policy front, we expect Sensex’s churn to rise to 50% in the next decade. Using a combination of macroeconomic and financial filters, we expect Reliance Industries, Yes Bank, Infosys, M&M, Bharti Airtel, NTPC, Hero MotoCorp, Tata Steel, Power Grid, Wipro, Coal India, Adani Ports, Tata Motors and Tata Motors DVR, and Dr. Reddy’s to be potential exit candidates. IOCL, HCL, UltraTech, BPCL, Eicher, Ambuja Cements, Pidilite, HDFC Standard Life, SBI Life, Titan, Torrent Pharma and Page Industries are potential entrant candidates from the listed space, and Paytm, LIC and Flipkart are potential entrants from the unlisted space.
Section A: Tracing the evolution of the Sensex
In this section, we trace the evolution of Sensex from FY85 to date. Even as Sensex data is available from FY79, data regarding the constitution of the Sensex is available from FY85. Consequently, we undertook this analysis from FY85. This analysis in turn can be divided into two phases, namely: the period spanning FY85-95 and the subsequent period spanning FY95 to date.
Sensex through the years – a snapshot Exhibit 146:
CAGR p.a. -
Sensex (Rs)
CAGR p.a. - Sensex
($)
CAGR p.a.
- MSCI EM ($)
Churn ratio
Annual average capital account
surplus (% of GDP)
Average annual real GDP growth
Phase #1 FY85-95 25% 18%* 17%* 17% 1.80% 5%
Phase #2 FY95-Date 11% 7% 4% 77% 3.10% 7%
Source: Bloomberg, Capitaline, Ambit Capital research. Note: *Given the data availability of MSCI EM, we start the period from FY90.
The subsequent two sections elaborate on the details associated with these two phases associated with the stock market.
Phase#1: The first signs of life emerge in the Sensex (FY85-95)
Whilst the Sensex as an Index was launched on 1 January, 1986, the term Sensex was coined by Deepak Mohoni, a stock market analyst in 1989 while he was writing columns for Business World. The term was coined as a portmanteau of the words Sensitive and Index.
The four developments that defined the first phase of the existence of the Sensex spanning FY85 to FY95 were:
The Sensex’s maiden rally: The Sensex reacted positively to the Congress-led majority government of Rajiv Gandhi assuming power following the 1984 elections and the subsequent bout of economic reforms that were launched. The economic reforms which Indira Gandhi had already kicked-off prior to her assassination combined with incremental reforms under the new PM, i.e., Rajiv Gandhi, gave India its first growth boom and a strong stock market rally whereby the market rallied by 44% in FY85 (see exhibit below).
Sensex as an Index was launched on 1 Jan 1986, the term Sensex was coined by Deepak Mohoni, a stock market analyst in 1989
The Sensex reacted positively to the Congress-led majority government of Rajiv Gandhi assuming power following the 1984 elections
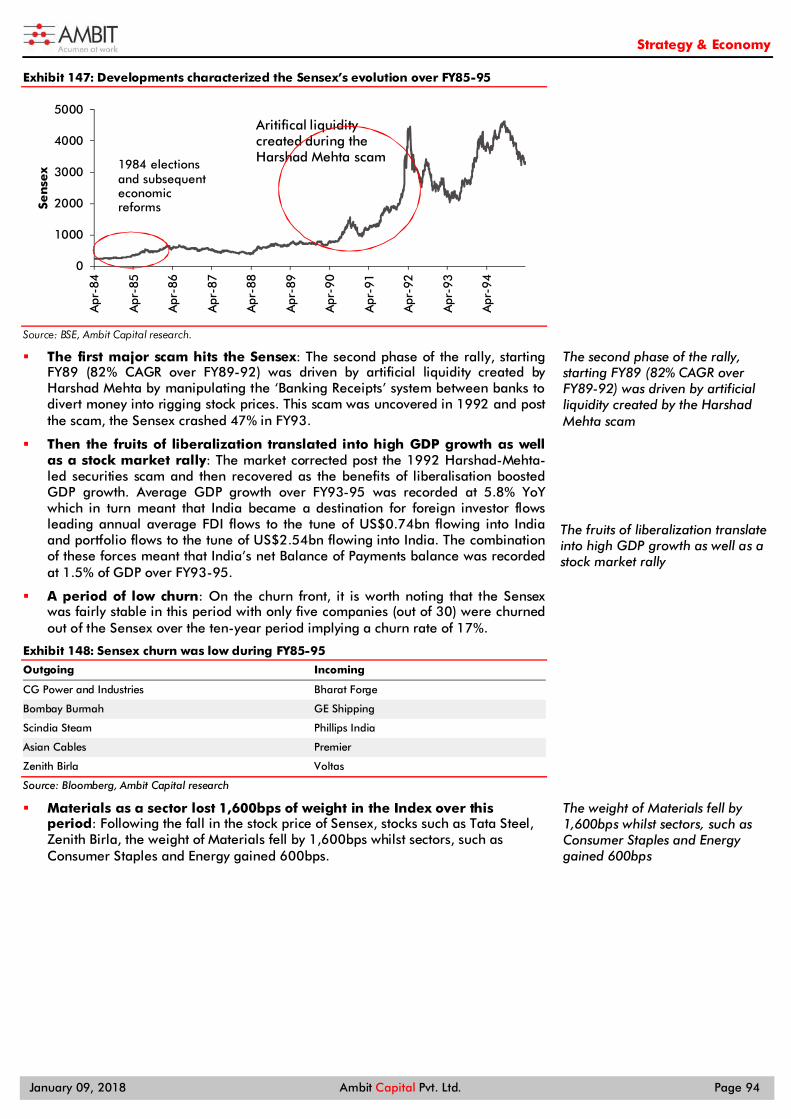
Strategy & Economy
January 09, 2018 Ambit Capital Pvt. Ltd. Page 94
Developments characterized the Sensex’s evolution over FY85-95 Exhibit 147:
Source: BSE, Ambit Capital research.
The first major scam hits the Sensex: The second phase of the rally, starting FY89 (82% CAGR over FY89-92) was driven by artificial liquidity created by Harshad Mehta by manipulating the ‘Banking Receipts’ system between banks to divert money into rigging stock prices. This scam was uncovered in 1992 and post the scam, the Sensex crashed 47% in FY93.
Then the fruits of liberalization translated into high GDP growth as well as a stock market rally: The market corrected post the 1992 Harshad-Mehta-led securities scam and then recovered as the benefits of liberalisation boosted GDP growth. Average GDP growth over FY93-95 was recorded at 5.8% YoY which in turn meant that India became a destination for foreign investor flows leading annual average FDI flows to the tune of US$0.74bn flowing into India and portfolio flows to the tune of US$2.54bn flowing into India. The combination of these forces meant that India’s net Balance of Payments balance was recorded at 1.5% of GDP over FY93-95.
A period of low churn: On the churn front, it is worth noting that the Sensex was fairly stable in this period with only five companies (out of 30) were churned out of the Sensex over the ten-year period implying a churn rate of 17%.
Sensex churn was low during FY85-95 Exhibit 148:
Outgoing Incoming
CG Power and Industries Bharat Forge
Bombay Burmah GE Shipping
Scindia Steam Phillips India
Asian Cables Premier
Zenith Birla Voltas
Source: Bloomberg, Ambit Capital research
Materials as a sector lost 1,600bps of weight in the Index over this period: Following the fall in the stock price of Sensex, stocks such as Tata Steel, Zenith Birla, the weight of Materials fell by 1,600bps whilst sectors, such as Consumer Staples and Energy gained 600bps.
0
1000
2000
3000
4000
5000A
pr-8
4
Apr
-85
Apr
-86
Apr
-87
Apr
-88
Apr
-89
Apr
-90
Apr
-91
Apr
-92
Apr
-93
Apr
-94
Sen
sex 1984 elections
and subsequent economic reforms
Aritifical liquidity created during the Harshad Mehta scam
The second phase of the rally, starting FY89 (82% CAGR over FY89-92) was driven by artificial liquidity created by the Harshad Mehta scam
The fruits of liberalization translate into high GDP growth as well as a stock market rally
The weight of Materials fell by 1,600bps whilst sectors, such as Consumer Staples and Energy gained 600bps

Strategy & Economy
January 09, 2018 Ambit Capital Pvt. Ltd. Page 95
Consumer Staples and Energy gained the Exhibit 149:most market-cap share while Materials lost the most market-cap share from FY90-95 Sector Mar'90 Mar'95 Change
Materials 46% 30% -16%
Consumer Staples 15% 21% 6%
Consumer Discretionary 16% 16% -
Energy 10% 16% 6%
Industrials 11% 13% 3%
Utilities 1% 2% 1%
Health Care 1% 2% 1%
Financials 0% 0% -
IT 0% 0% -
Telecom 0% 0% -
Source: Bloomberg, Ambit Capital research
Sensex outperformed MSCI World and MSCI EM Exhibit 150:during this period from FY90-95
Source: Bloomberg, Ambit Capital research. Note: Owing to the data availability of MSCI EM, we have taken the data from FY90-95.
Sensex outperforms global benchmarks: As India embraced liberalization and the world began taking note of India as a fruitful investment destination, the Sensex outperformed both MSCI EM and MSCI World over FY90-95 (exhibit above).
Policy phase#2: The Sensex’s profile rose manifold (FY1995-2018)
Following the nascent stage spanning FY85-95, the subsequent period from April 1995 to April 2017 was characterized by multiple boom-and-bust cycles even as the Sensex delivered 11% CAGR p.a. (in Rupee terms) during this time.
The four developments that defined the second phase of the existence of the Sensex spanning FY1995 to FY2018 were:
The Sensex remains flat for a prolonged period spanning FY95-03: This period was marred by political instability (i.e., two General Elections between CY96-98) as well as economic uncertainty which in turn manifested itself in the form of the Sensex delivering unattractive returns of -1% p.a. (Rupee terms) and -6% p.a. (Dollar terms) over FY95-03 (see exhibit below).
Sensex delivered 11% CAGR p.a. from 1995 to 2017 Exhibit 151:
Source: BSE, Ambit Capital research. Note: The Sensex has been published since 1 January 1986. The highlighted chunks show the up movements in the stock market.
The Asian Financial Crisis in 1998 also weighed on FII sentiment during this phase. A brief upswing was seen over FY99-00 which was led by the global dot-com bubble.
Liquidity during the dot-com bubble was fuelled yet again by another scam, this time by a stock broker/investor, Ketan Parekh, who was incidentally given a two-year prison sentence on 4 March, 2014 after a 12-year long trial.
18%17%
6%
0%
5%
10%
15%
20%
Sensex MSCI EM MSCI World
Pri
ce p
erf
orm
an
ce (C
AG
R
p.a
. in
%)
0
5000
10000
15000
20000
25000
30000
Apr
-95
Apr
-96
Apr
-97
Apr
-98
Apr
-99
Apr
-00
Apr
-01
Apr
-02
Apr
-03
Apr
-04
Apr
-05
Apr
-06
Apr
-07
Apr
-08
Apr
-09
Apr
-10
Apr
-11
Apr
-12
Apr
-13
Apr
-14
Apr
-15
Apr
-16
Apr
-17
Sen
sex
Ketan Parekhscam driven artificial liquidity
UPA coalition victory
UPA II
Modi named as Prime Ministerial candidate
The subsequent period from April 1995 to April 2017 was characterized by multiple boom-and-bust cycles
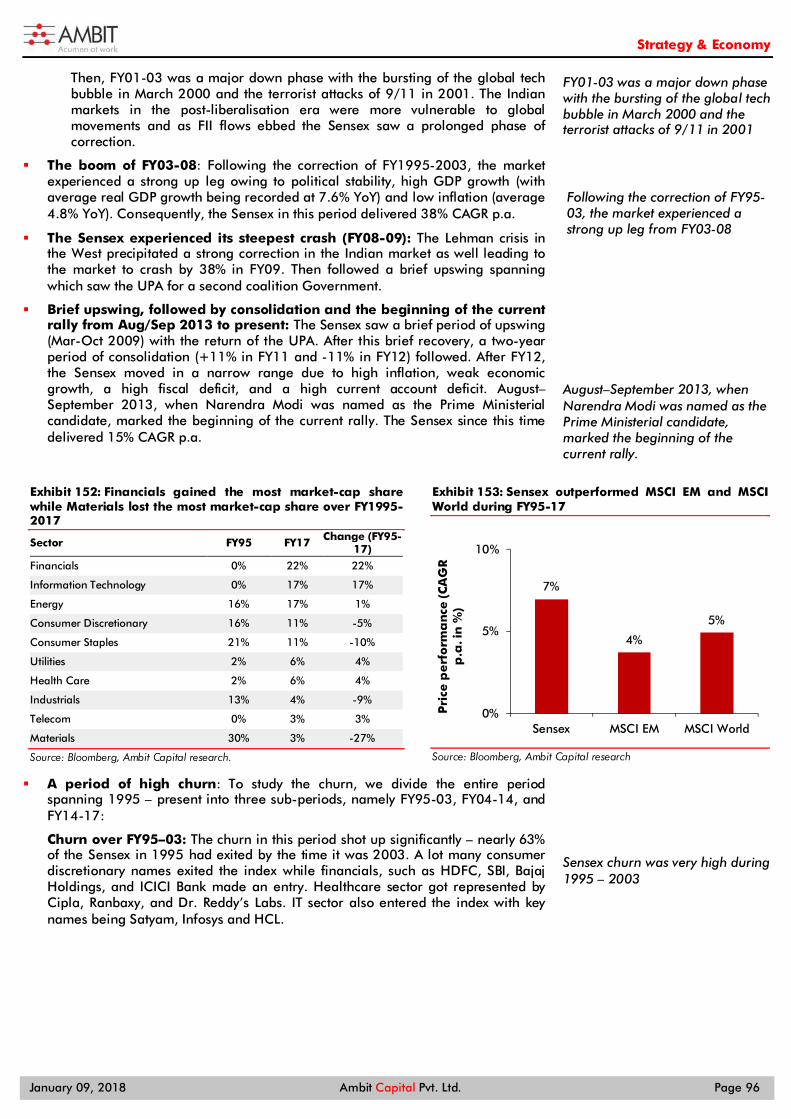
Strategy & Economy
January 09, 2018 Ambit Capital Pvt. Ltd. Page 96
Then, FY01-03 was a major down phase with the bursting of the global tech bubble in March 2000 and the terrorist attacks of 9/11 in 2001. The Indian markets in the post-liberalisation era were more vulnerable to global movements and as FII flows ebbed the Sensex saw a prolonged phase of correction.
The boom of FY03-08: Following the correction of FY1995-2003, the market experienced a strong up leg owing to political stability, high GDP growth (with average real GDP growth being recorded at 7.6% YoY) and low inflation (average 4.8% YoY). Consequently, the Sensex in this period delivered 38% CAGR p.a.
The Sensex experienced its steepest crash (FY08-09): The Lehman crisis in the West precipitated a strong correction in the Indian market as well leading to the market to crash by 38% in FY09. Then followed a brief upswing spanning which saw the UPA for a second coalition Government.
Brief upswing, followed by consolidation and the beginning of the current rally from Aug/Sep 2013 to present: The Sensex saw a brief period of upswing (Mar-Oct 2009) with the return of the UPA. After this brief recovery, a two-year period of consolidation (+11% in FY11 and -11% in FY12) followed. After FY12, the Sensex moved in a narrow range due to high inflation, weak economic growth, a high fiscal deficit, and a high current account deficit. August–September 2013, when Narendra Modi was named as the Prime Ministerial candidate, marked the beginning of the current rally. The Sensex since this time delivered 15% CAGR p.a.
Financials gained the most market-cap share Exhibit 152:while Materials lost the most market-cap share over FY1995-2017
Sector FY95 FY17 Change (FY95-17)
Financials 0% 22% 22%
Information Technology 0% 17% 17%
Energy 16% 17% 1%
Consumer Discretionary 16% 11% -5%
Consumer Staples 21% 11% -10%
Utilities 2% 6% 4%
Health Care 2% 6% 4%
Industrials 13% 4% -9%
Telecom 0% 3% 3%
Materials 30% 3% -27%
Source: Bloomberg, Ambit Capital research.
Sensex outperformed MSCI EM and MSCI Exhibit 153:World during FY95-17
Source: Bloomberg, Ambit Capital research
A period of high churn: To study the churn, we divide the entire period spanning 1995 – present into three sub-periods, namely FY95-03, FY04-14, and FY14-17:
Churn over FY95–03: The churn in this period shot up significantly – nearly 63% of the Sensex in 1995 had exited by the time it was 2003. A lot many consumer discretionary names exited the index while financials, such as HDFC, SBI, Bajaj Holdings, and ICICI Bank made an entry. Healthcare sector got represented by Cipla, Ranbaxy, and Dr. Reddy’s Labs. IT sector also entered the index with key names being Satyam, Infosys and HCL.
7%
4%
5%
0%
5%
10%
Sensex MSCI EM MSCI World
Pri
ce p
erf
orm
an
ce (C
AG
R
p.a
. in
%)
FY01-03 was a major down phase with the bursting of the global tech bubble in March 2000 and the terrorist attacks of 9/11 in 2001
Following the correction of FY95-03, the market experienced a strong up leg from FY03-08
August–September 2013, when Narendra Modi was named as the Prime Ministerial candidate, marked the beginning of the current rally.
Sensex churn was very high during 1995 – 2003

Strategy & Economy
January 09, 2018 Ambit Capital Pvt. Ltd. Page 97
Sensex churn was very high during 1995–2003 Exhibit 154:
Outgoing Sector Incoming Sector
CEAT Consumer Discretionary Zee Entertainment Consumer Discretionary
M & M Consumer Discretionary Hero MotoCorp Consumer Discretionary
Bombay Dyeing Consumer Discretionary Colgate-Palm. Consumer Staples
Futura Polyester Consumer Discretionary HPCL Energy
Indian Hotels Consumer Discretionary HDFC Financials
Philips India Consumer Discretionary St Bk of India Financials
Hind.Motors Consumer Discretionary Bajaj Holdings Financials
Bharat Forge Consumer Discretionary ICICI Bank Financials
GE Shipping Co Energy Cipla Health Care
Siemens Industrials Ranbaxy Labs. Health Care
Aditya Bir. Nuv. Industrials Dr Reddy's Labs Health Care
Premier Industrials BHEL Industrials
Voltas Industrials Satyam Computer Information Technology
Cummins India Industrials Infosys Information Technology
G S F C Materials HCL Technologies Information Technology
Ballarpur Inds. Materials Castrol India Materials
Mukand Materials Ambuja Cem. Materials
Century Textiles Materials MTNL Telecom
Tata Power Co. Utilities Reliance Infra. Utilities
Source: Bloomberg, Ambit Capital research
Churn over FY04-14: The churn in this period moderated to 33%. Auto companies, such as M&M, Maruti and Bajaj entered the index while cement companies, such as ACC and Ambuja ex ited. Public utilities, such as NTPC and GAIL also entered.
Sensex churn moderated over 2004-2014 Exhibit 155:Outgoing Sector Incoming Sector
Zee Entertainment Consumer Discretionary M & M Consumer Discretionary
H P C L Energy Maruti Suzuki Consumer Discretionary
Bajaj Holdings Financials Bajaj Auto Consumer Discretionary
Ranbaxy Labs. Health Care Coal India Energy
Satyam Computer Information Technology Axis Bank Financials
ACC Materials Sun Pharma Health Care
Ambuja Cement Materials TCS Information Technology
Grasim Inds Materials Vedanta Materials
M T N L Telecommunication Services NTPC Utilities
Reliance Infra. Utilities GAIL (India) Utilities
Source: Bloomberg, Ambit Capital research
Churn over FY14-17: The churn in this period dropped substantially to just 13% that is only 13% of the Sensex in 2014 exited the index by 2017. Materials, Industrials and Utilities names, such as Hindalco, Vedanta, BHEL, and Tata Power exited the index while Healthcare players like Lupin, Utilities players like Power Grid, Industrials players like Adani, and Materials players like Asian Paints entered.
Sensex churn dropped during 2014-2017 Exhibit 156:
Outgoing Sector Incoming Sector
Hindalco Inds. Materials Lupin Ltd Health Care
Vedanta Materials Power Grid Corp Of India Ltd Utilities
Tata Power Co. Utilities Adani Ports And Special Econ Industrials
B H E L Industrials Asian Paints Ltd Materials
Source: Bloomberg, Ambit Capital research
The churn in the period FY04-14 moderated to 33%
Sensex churn dropped substantially during 2014-2017

Strategy & Economy
January 09, 2018 Ambit Capital Pvt. Ltd. Page 98
Section B: What is the constitution of Sensex likely to look like in FY30?
Given peer Emerging Markets’ experience, it seems likely that the combined market-cap share of Consumer discretionary + Financials is set to rise as India’s per capita income moves to US$5,000 in FY30. The assumption that India’s per capita income hits this level is premised on: 1) the assumption that nominal GDP grows at 12% p.a., and 2) India’s population growth slows down to 1% p.a. Additionally, given that India is likely to increase infrastructure spending, the combined weight of Industrials + Materials + Energy is likely to rise as well. On the other hand, owing to our trajectory on high per capita income path, Consumer Staples and IT + Telecom are likely to lose market-cap share. Finally, Healthcare and Utilities are expected to stay stagnant.
The subsequent part of this sub-section is divided into the historical evolution of Sensex over FY1985-2018 and our expectation of where we go from here over FY18-30.
How did the constitution of the Sensex evolve over FY1985-2018?
After evaluating the period for which market data is available, we get three key takeaways, namely:
Financials as a sector has seen its weight rise most significantly over the period under consideration. From a 0% sector weight in FY90, this sector has risen in prominence and today accounts for 38% of the Sensex as at December 2017.
IT is another notable gainer whose weight has risen from 0% in FY90 to 17% in FY17. The other sectors that have gained market share over this period include Telecom (+3%), Utilities (+5%), Energy (+7%) and Healthcare (+5%).
On the other hand, the Materials sector is the biggest market-cap loser and has lost market-cap share from 46% in FY90 to 3% in FY17. The other sectors that have lost market share over this period include Consumer Discretionary (-5%), Consumer Staples (-4%) and Industrials (-7%). (See exhibit below).
Financials is the only sector which gained market-cap share consistently Exhibit 157:since March 1990 while the opposite holds true for Materials*
Sector FY90 FY95 FY00 FY05 FY10 FY17 Dec 2017*
Change (FY90-FY17)
Consumer Discretionary 16% 16% 3% 6% 6% 11% 11% -5%
Consumer Staples 15% 21% 27% 9% 6% 11% 12% -4%
Financials 0% 0% 10% 15% 15% 22% 38% +22%
Industrials 11% 13% 4% 4% 9% 4% 6% -7%
Information Technology 0% 0% 23% 17% 16% 17% 11% +17%
Telecommunication Services 0% 0% 5% 5% 6% 3% 2% +3%
Materials 46% 30% 8% 8% 8% 3% 3% -43%
Utilities 1% 2% 1% 2% 9% 6% 3% +5%
Energy 10% 16% 13% 29% 22% 17% 12% +7%
Healthcare 1% 2% 5% 4% 1% 6% 3% +5%
Source: Bloomberg, Ambit Capital research. Note: *We have used Global Industry Standard Classification (GICS). Based on total market cap weights.* Based on free float market cap weights.
Where do we go from here?
Cross-country experience suggests that as a country’s per capita income increases, the sector weighting of both Consumer Discretionary as well as Financial Services increases (see exhibits below and for more details please see our note dated 19 September 2016 titled Sensex entries and exits: the decadal story).
Given peer Emerging Markets’ experience, it seems likely that the combined market-cap share of Consumer discretionary + Financials is set to rise as India’s per capita income moves to US$5,000 in FY30
Financials as a sector has seen its weight rise most significantly. IT is another notable gainer. On the other hand, the Materials sector is the biggest market-cap loser
Cross-country experience suggests that as a country’s per capita income increases, the sector weighting of both Consumer Discretionary as well as Financial Services increases

Strategy & Economy
January 09, 2018 Ambit Capital Pvt. Ltd. Page 99
Cross-country evidence suggests that Financial Exhibit 158:Services’ market-cap share increases as per capita income rises…
Source: CEIC, Bloomberg, Ambit Capital research. Note: Countries under consideration are Thailand (CY94-15), Malaysia (CY94-15), India (CY94-15), Turkey (CY00-15).
Cross-country data suggests that the market-Exhibit 159:cap share of consumer discretionary as a sector rises as per capita income rises
Source: CEIC, Bloomberg, Ambit Capital research. Note: Countries under consideration are Mexico (CY00-15), India (CY94-15), Korea (CY94-15), and Thailand (CY94-15).
Cross-country experience also suggests that as a country’s per capita income increases, the sector weighting of Consumer Staples and Healthcare reduces (see exhibits below).
Cross-country evidence suggests consumer Exhibit 160:staples’ market-cap share dips as per capita income rises
Source: CEIC, Bloomberg, Ambit Capital research. Note: Countries under consideration include Turkey (CY00-15), Korea (CY94-15), Thailand (CY94-15), and Malaysia (CY94-15).
Spends on healthcare tend to marginally Exhibit 161:decline/stagnate till US$10k level
Source: CEIC, Bloomberg, Ambit Capital Research. Note: Countries under consideration are Korea (CY70-15), Malaysia (CY00-15), and India (CY70-14).
Given that the Indian experience thus far has been in line with the cross-country experience, from a forward-looking perspective we expect the following:
Financials and Consumer Discretionary: Assuming nominal GDP grows at 12% p.a. and India’s population growth slows down to 1% p.a., we expect India’s per capita income to rise to US$5,000 in FY30. At this per capita income level, we expect weight of the Financials and Consumer Discretionary sectors to be at 57% as compared to the current level of 49%.
Consumer Staples: Consumer Staples tend to lose market-cap share as per EM cross-country experience – India’s consumer staples weighting has indeed fallen (albeit marginally) from 15% in FY90 to 11% in FY17. Given that cross-country experience suggests that the market-cap share of consumer staples tends to decrease as per capita income rises, we assume that the market-cap share of consumer staples will fall by at least ~5% points by CY30.
Industrials + Materials + Energy: Even though the combined weight of Industrials, Materials and Energy has fallen from 67% in FY85 to 24% in FY17, given the rising share of investments and the Indian Government’s desire to
R² = 0.3297
0%
20%
40%
60%
0 1000 2000 3000 4000
Fin
an
cia
ls' m
ark
et-
cap
sh
are
(in
%)
Per capita income (US$)
R² = 0.2729
0%
4%
8%
12%
16%
0 10000 20000 30000Co
nsu
me
r d
iscr
eti
on
ary
's
ma
rke
t-ca
p s
ha
re (i
n %
)
Per capita income (US$)
R² = 0.292
0%
3%
6%
9%
12%
15%
0 10000 20000 30000
Co
nsu
me
r st
ap
les'
ma
rke
t ca
p s
ha
re (
in %
)
Per capita income (US$)
R² = 0.1304
0%
1%
2%
3%
4%
5%
6%
0 2000 4000 6000 8000 10000
Sha
re o
f h
ea
lth
care
in
ho
use
ho
ld c
on
sum
pti
on
(in
%
)
Per capita income (US$)
As a country’s per capita income increases, the sector weighting of Consumer Staples as well as Healthcare reduces
We expect weight of the Financials and Consumer Discretionary sectors to be at 55% as compared to the current level of 49%
We assume that the market-cap share of consumer staples will fall by at least ~6% points by CY30
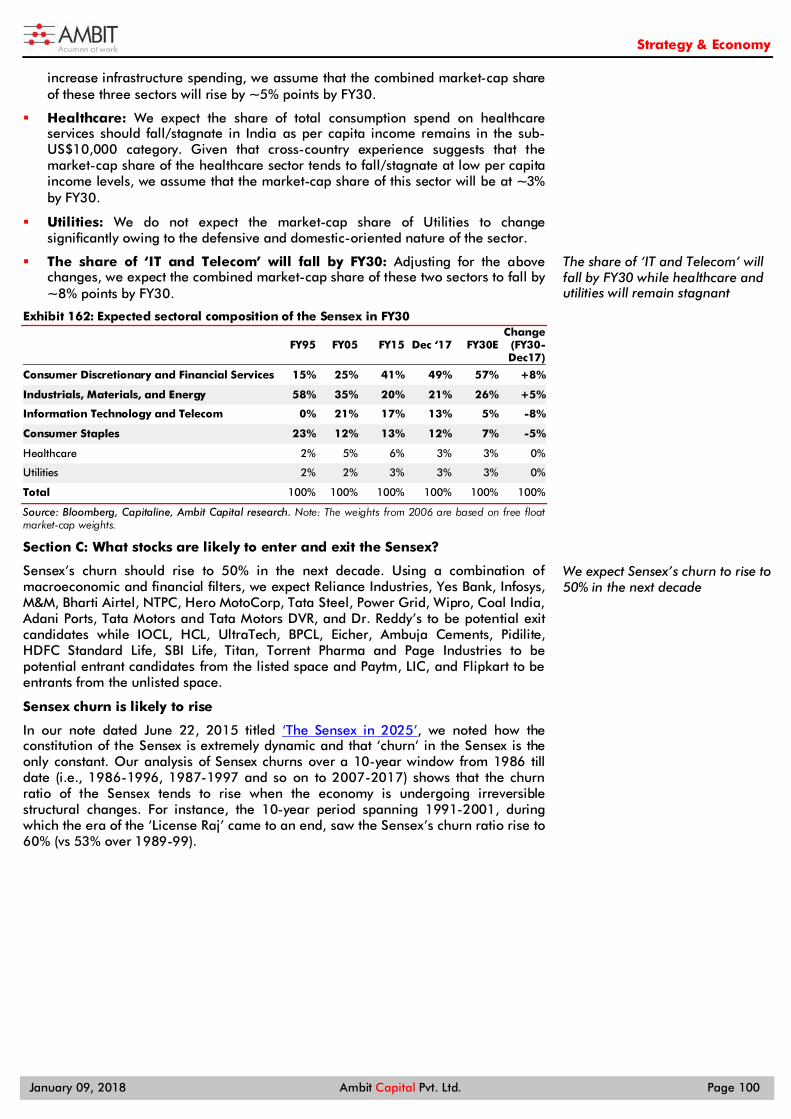
Strategy & Economy
January 09, 2018 Ambit Capital Pvt. Ltd. Page 100
increase infrastructure spending, we assume that the combined market-cap share of these three sectors will rise by ~5% points by FY30.
Healthcare: We expect the share of total consumption spend on healthcare services should fall/stagnate in India as per capita income remains in the sub-US$10,000 category. Given that cross-country experience suggests that the market-cap share of the healthcare sector tends to fall/stagnate at low per capita income levels, we assume that the market-cap share of this sector will be at ~3% by FY30.
Utilities: We do not expect the market-cap share of Utilities to change significantly owing to the defensive and domestic-oriented nature of the sector.
The share of ‘IT and Telecom’ will fall by FY30: Adjusting for the above changes, we expect the combined market-cap share of these two sectors to fall by ~8% points by FY30.
Expected sectoral composition of the Sensex in FY30 Exhibit 162:
FY95 FY05 FY15 Dec ‘17 FY30E Change
(FY30-Dec17)
Consumer Discretionary and Financial Services 15% 25% 41% 49% 57% +8%
Industrials, Materials, and Energy 58% 35% 20% 21% 26% +5%
Information Technology and Telecom 0% 21% 17% 13% 5% -8%
Consumer Staples 23% 12% 13% 12% 7% -5%
Healthcare 2% 5% 6% 3% 3% 0%
Utilities 2% 2% 3% 3% 3% 0%
Total 100% 100% 100% 100% 100% 100%
Source: Bloomberg, Capitaline, Ambit Capital research. Note: The weights from 2006 are based on free float market-cap weights.
Section C: What stocks are likely to enter and exit the Sensex?
Sensex’s churn should rise to 50% in the next decade. Using a combination of macroeconomic and financial filters, we expect Reliance Industries, Yes Bank, Infosys, M&M, Bharti Airtel, NTPC, Hero MotoCorp, Tata Steel, Power Grid, Wipro, Coal India, Adani Ports, Tata Motors and Tata Motors DVR, and Dr. Reddy’s to be potential exit candidates while IOCL, HCL, UltraTech, BPCL, Eicher, Ambuja Cements, Pidilite, HDFC Standard Life, SBI Life, Titan, Torrent Pharma and Page Industries to be potential entrant candidates from the listed space and Paytm, LIC, and Flipkart to be entrants from the unlisted space.
Sensex churn is likely to rise
In our note dated June 22, 2015 titled ‘The Sensex in 2025’, we noted how the constitution of the Sensex is extremely dynamic and that ‘churn’ in the Sensex is the only constant. Our analysis of Sensex churns over a 10-year window from 1986 till date (i.e., 1986-1996, 1987-1997 and so on to 2007-2017) shows that the churn ratio of the Sensex tends to rise when the economy is undergoing irreversible structural changes. For instance, the 10-year period spanning 1991-2001, during which the era of the ‘License Raj’ came to an end, saw the Sensex’s churn ratio rise to 60% (vs 53% over 1989-99).
The share of ‘IT and Telecom’ will fall by FY30 while healthcare and utilities will remain stagnant
We expect Sensex’s churn to rise to 50% in the next decade

Strategy & Economy
January 09, 2018 Ambit Capital Pvt. Ltd. Page 101
Sensex churn ratio shows a tendency to rise when the economy undergoes Exhibit 163:structural changes
Source: Ambit Capital research, Bloomberg. Note: Sensex churn has been calculated as the percentage number of companies forming a part of the Sensex in year ‘t’ that get exited from the index by year ‘t+10’. All years are calendar years.
Churn in the Sensex peaked in the four years following the momentous reforms launched by PV Narasimha Rao (as PM) and Manmohan Singh (as Finance Minister).
After 1995, Sensex churn fell remarkably relative to the volatile era of the early 1990s. Sensex incumbents grew rapidly in size, which we attribute to the following reasons:
Large business groups ramped up domestic capacities in a licence-free era and followed them up by large acquisitions in the noughties (Reliance, Tata Steel and Hindalco).
Export-led companies like software (Infosys and TCS) and pharmaceuticals expanded.
The noughties also saw the rise of infrastructure companies (L&T) and banks & financial institutions which funded their expansion (ICICI Bank) and also benefited (HDFC and HDFC Bank) due to the rise in overall GDP growth (from 3.9% in FY03 to 8% in FY04, 7.1% in FY05, 9.5% in FY05 and 9.6% in FY01).
Finally, towards the end of the noughties, the rise in rural-led consumption benefited auto (Hero MotoCorp, Bajaj Auto, M&M and Maruti) and FMCG (HUL and ITC) stocks.
After remaining flat for a decade (3% CAGR from FY93 to FY03), Sensex’s recovery began meaningfully only after FY03 (55% CAGR from FY03 to FY06). This recovery drove a slew of large IPOs, including Government disinvestment-driven ones (see exhibit below). These new IPOs resulted in new entrants into the Sensex, such as ONGC and NTPC from PSUs and TCS and Reliance Petroleum from the private sector. However, in terms of numbers, the impact of these changes on Sensex churn was much lower than those driven by the end of the License Raj regime. Only 8 replacements were made in the Sensex from 2005 to 2015 vs 20 from 1995 to 2005.
0%
15%
30%
45%
60%
75%
86-9
6
87-9
7
88-9
8
89-9
9
90-0
0
91-0
1
92-0
2
93-0
3
94-0
4
95-0
5
96-0
6
97-0
7
98-0
8
99-0
9
00-1
0
01-1
1
02-1
2
03-1
3
04-1
4
05-1
5
06-1
6
07-1
7
% o
f se
nse
x co
s. c
hu
rne
d o
ut
ove
r th
e n
ext
10
yrs
Churn in the Sensex peaked in the four years following the momentous reforms
Sensex’s recovery after FY03 drove a slew of large IPOs, including Government disinvestment-driven ones

Strategy & Economy
January 09, 2018 Ambit Capital Pvt. Ltd. Page 102
List of IPOs of more than US$1bn Exhibit 164:
Year Mkt cap at IPO (Rs bn)
1 Coal India Oct-10 150
2 Reliance Power Jan-08 117
3 General Insurance Oct-17 113
4 ONGC Mar-04 95
5 The New India Assurance Co Nov-17 96
6 DLF Jun-07 92
7 HDFC Life Nov-17 87
8 SBI Life Oct-17 84
9 ICICI Prudential Sep-16 61
10 Cairn India Dec-06 58
11 ICICI Lombard Sep-17 57
12 TCS Aug-04 54
13 NTPC Oct-04 54
Source: Media reports, Ambit Capital research
We believe the next 10 years in India will be akin to the 1990s rather than the noughties (see Policy section of this note for more details). This is because the period spanning FY92-02 was defined by irrevocable structural changes administered by the political leadership. In fact, as depicted in Exhibit 18, the churn has already began to rise – moving from 27% for the 2004-14 window to 33% for the 2007-17 window.
Which stocks are likely to exit the Sensex?
Given that we believe the next 13 years will be akin to the 1990s rather than the noughties, thus far, we expect the Sensex churn to increase from 33% in 2007-17 to 50% in the FY18-30 decade. This means that 15 stocks will be replaced in the Sensex in the upcoming decade.
Identifying exits early on is critical as history suggests that owning Sensex-exit candidates is a losing proposition. In the exhibit below, we show the share price performance of all the exits from the Sensex in two ways, i.e. over the next decade and until the time of exit from the Sensex. Whilst on an average these stocks underperformed the Sensex by ~6% on a CAGR basis over the next decade, what is more interesting is their performance and underperformance until the time of exit from the Sensex. On an average, these stocks delivered -10% CAGR until exit. Further, relative to the Sensex, the underperformance (until exit) is as high as -20% CAGR.
We believe the next 10 years in India will be akin to the 1990s rather than the noughties
Owning Sensex-exit candidates is a losing proposition

Strategy & Economy
January 09, 2018 Ambit Capital Pvt. Ltd. Page 103
Sensex-exit stocks - Massive underperformance until the time of exit from the Sensex Exhibit 165:
Period No. of exits from Sensex Median performance of exiting stocks over the
decade
Median underperformance rel. to Sensex of exiting stocks
over the decade
Median performance of exiting stocks till exit from
Sensex
Median underperformance rel. to Sensex of exiting stocks
till exit from Sensex
1991-01 18 -15% -20% -12% -23%
1992-02 19 -8% -11% -9% -17%
1993-03 20 -1% -6% -16% -14%
1994-04 20 -2% -7% -27% -18%
1995-05 20 5% -6% -24% -33%
1996-06 14 8% -7% -21% -25%
1997-07 13 10% -8% -22% -31%
1998-08 13 6% -6% -6% -18%
1999-09 14 9% -5% -9% -11%
2000-10 16 13% -5% -3% -16%
2001-11 16 13% -4% 7% -17%
2002-12 14 21% 2% 14% -19%
2003-13 9 6% -8% 0% -11%
2004-14 8 13% -2% -9% -25%
2005-15 8 9% -2% -4% -15%
2006-16 9 1% -6% -7% -14%
2007-17 11 3% -2% -28% -15%
Average 14 5% -6% -10% -19%
Source: Bloomberg, Ambit Capital research
Hence, given the stark underperformance of the exit stocks, it becomes critical for investors to identify potential exiting candidates in advance. We now provide a framework for identification.
A framework to identify the candidates that will exit Sensex
We provide a four-step filter for identifying stocks that are most likely to exit the Sensex in the coming decade. To maintain consistency for a 10-year window, we use financial data for the past 10 years (FY07 to FY16).
In the first two steps, we score companies using our Coffee Can Portfolio and Greatness frameworks. From these scores, we select the bottom 20 companies and shortlist them as the most likely Sensex-exit candidates.
In the third step, we check if the shortlisted companies feature on the Ambit ‘P-75’ list of politically-connected companies. In the final step, we check if the shortlisted companies are in a sector that is likely to lose market share (i.e. Consumer Staples, Healthcare [albeit marginally] and IT + Telco) given the economic insights that we have derived in the previous section.
Checklist for Sensex-exit candidates Exhibit 166:Step Criteria Parameters
1 Coffee Can filters in reverse
Non-BFSI: Highest number of years over FY07-16 where sales growth was <10% Non-BFSI: Highest number of years over FY07-16 where RoCE was <15% Banks and financial services: Highest number of years over FY07-16 where loan growth was <15% Banks: Highest number of years over FY07-16 where RoA was <1.2%
NBFCs: Highest number of years over FY07-16 where RoE was <15%
2 Greatness Framework* Featuring in the lowest decile
3 Politically Connected Part of Ambit's P-75 Index
4 Losing sector Belongs to a sector that is likely to lose market-cap share
Source: Ambit Capital research. *Note: As we do not have a greatness framework for NBFCs, we give an average score to HDFC (the only NBFC in the Sensex) on this parameter. Greatness scores for non-BFSI names are based on FY10-15 financials and for BFSI names FY09-14 financials. Accounting scores are based on FY11-17 financials. Our accounting framework does not apply to BFSI names.
Given the stark underperformance of the exit stocks, it becomes critical for investors to identify potential exiting candidates in advance
We provide a four-step filter for identifying stocks that are most likely to exit the Sensex in the coming decade

Strategy & Economy
January 09, 2018 Ambit Capital Pvt. Ltd. Page 104
Identifying the Sensex-exit candidates
We present the results of our four-step screening of potential Sensex-exit stocks over the next 10 years.
Exit candidates from Sensex over the next decade Exhibit 167:Name Ticker GICS Sector Hypothesis
Reliance Inds. RIL IN Industrials Non-core investments have consumed most operating cash flows and led to a significant ballooning of debt; both E&P and retail make minuscule profits despite US$17bn-18bn capital allocation over the past decade
Yes Bank YES IN Financials The bank’s reliance on wholesale banking remains unchanged (the segment accounts for 67% of loans, broadly unchanged in the last five years); the scalability of the bank’s size and valuation is thus questionable
Infosys INFO IN IT Lack of strong and stable leadership in the company; high proportion of cash and equivalents on the balance sheet resulting in depressed RoCE’s
M & M MM IN Cons. Discr UV business under threat from Maruti/Hyundai’s rising focus/distribution edge and MNCs’ superior offerings; other automotive segments (esp. 2W/trucks) have limited chances of long-term success
Bharti Airtel BHARTI IN Telecom Persistently high capex to support data growth; Reliance Jio’s entry; technology disruptions eroding competitive advantages as cash-rich media companies find alternate delivery modes
NTPC NTPC IN Utilities Limited growth opportunities in power generation; tariff regulation likely to hit 2019 RoE; weakening competitive positioning
Hero Motocorp HMCL IN Cons. Discr Over-dependence on legacy models, uncertain indigenous technology, shift towards scooters & premium motorcycles and rising competition from Honda
Tata Steel TATA IN Materials Shrinking raw material advantage as well as margins
Power Grid Corp PWGR IN Utilities Capex is unlikely to accelerate; profitability can be impacted by lower regulated RoEs and more competitive bid projects; additional risk that the company may venture into new segments to maintain its capex levels
Wipro WPRO IN IT Weak portfolio mix and culture; continued underperformance of earnings growth relative to peers combined with deceasing RoCE
Coal India COAL IN Energy Compromised pricing power and/or muted e-auction prices can pressurise margins; capital misallocation risks exist given CIL’s plans to invest in projects with limited visibility on expected RoI
Adani Ports ADSEZ IN Industrials High capital intensity and capital allocation issues within the company; delays in enabling infrastructure could affect volumes
Tata Motors TTMT/A IN Cons. Discr Growing challenges for JLR business surrounding technology (EVs), regulations (diesel, emissions) and shrinking product lifecycle
Tata Motors - DVR TTMT IN Cons. Discr Growing challenges for JLR business surrounding technology (EVs), regulations (diesel, emissions) and shrinking product lifecycle
Dr Reddy's Labs DRRD IN Health Care Sub-par business mix and weak competitive positioning
Source: Bloomberg, Ambit Capital research.
We have chosen 15 exit candidates from this list on the following basis:
The top seven companies with greatness scores of less than 45 qualify automatically for exiting the Sensex, based on our framework detailed above. These seven companies are Reliance, M&M, Bharti Airtel, NTPC, Hero Motocorp, Tata Steel, and Coal India. We do not include ONGC owing to government’s plans to create integrated public sector oil majors as announced in the budget which may pave way for a merger between GAIL and ONGC (source: https://goo.gl/BrypCW). We do not include Bajaj Auto despite low greatness scores due to long-term export potential.
The remaining eight candidates have been chosen from companies based on our sector leads’ views that these companies face an uncertain future. These seven companies are Infosys, Yes Bank, Wipro, Adani Ports, Power Grid, Tata Motors, Tata Motors – DVR and Dr. Reddy’s.
Which stocks are likely to enter the Sensex?
Before we identify the stocks from the currently listed universe, we examine where Sensex entrants historically came from.
~50% of the entrants historically have come from the top-100 stocks based on market cap as of the beginning of the decade. This suggests that nearly half the fresh entrants over a 10-year window belong to the top-100 stocks on beginning-period market cap;
~11% stocks come from the next-100 stocks (i.e. beginning-period market cap rank between 101-200);
~5% of the entrants come from the listed universe outside the top-200 stocks; and
The remaining 34% of the stocks entered the index on account of fresh listings.
Nearly half the entrants historically have come from the ‘top-100’ stocks as at the start of the decade

Strategy & Economy
January 09, 2018 Ambit Capital Pvt. Ltd. Page 105
Nearly half the entrants historically have come from the ‘top-100’ stocks Exhibit 168:as at the start of the decade
Period 'Top 100' bucket '101-200' bucket 'Beyond top 200' bucket
'Fresh issuances' bucket
1990-00 33% 11% 6% 50%
1991-01 33% 6% 11% 50%
1992-02 47% 16% 11% 26%
1993-03 45% 20% 15% 20%
1994-04 60% 10% 10% 20%
1995-05 50% 25% 5% 20%
1996-06 50% 7% 7% 36%
1997-07 46% 8% 0% 46%
1998-08 38% 8% 0% 54%
1999-00 43% 0% 7% 50%
2000-10 44% 0% 13% 44%
2001-11* 44% 6% 6% 44%
2002-12* 57% 7% 7% 29%
2003-13* 56% 11% 0% 33%
2004-14* 75% 13% 0% 13%
2005-15* 63% 13% 0% 25%
2006-16* 56% 11% 0% 33%
2007-17* 58% 25% 0% 17%
Average 50% 11% 5% 34%
Source: Bloomberg, Capitaline, Ambit Capital research. Note: * indicates this is on a free float market-cap basis
The reason why identifying an entrant matters is important is simply because owning a future Sensex entrant has been a winning proposition. Firms that entered the index from the top-100 bucket (based on beginning-period market cap) managed to deliver 21% CAGR returns historically. Firms that entered the index from the next 100 bucket managed to deliver an impressive 35% CAGR returns. Following this logic further, firms that entered the index from outside the top-200 stocks, however, have been blazing winners (having delivered 60% CAGR returns over the 10-year period after entering the index which is the average share price performance over the decade for firms entering by the end of decade).
The further an entrant is from the Sensex at the beginning of the decade, Exhibit 169:the higher its investment returns over the course of the decade
Period 'Top 100' bucket '101-200' bucket 'Beyond top 200' bucket
'Fresh issuances' bucket
1990-00 18% 25% 64% N/A
1991-01 13% 4% 50% N/A
1992-02 10% 34% 35% N/A
1993-03 12% 43% 57% N/A
1994-04 17% 28% 57% N/A
1995-05 24% 42% 67% N/A
1996-06 43% 35% 75% N/A
1997-07 35% 49% N/A N/A
1998-08 22% 39% N/A N/A
1999-00 23% N/A 65% N/A
2000-10 24% N/A 70% N/A
2001-11* 24% 68% 63% N/A
2002-12* 28% 54% 60% N/A
2003-13* 22% 30% N/A N/A
2004-14* 21% 24% N/A N/A
2005-15* 22% 37% N/A N/A
2006-16* 17% 28% N/A N/A
2007-17* 11% 25% N/A N/A
Average 21% 35% 60% N/A
Source: Bloomberg, Capitaline, Ambit Capital research. Note: This is the average share price performance over the decade for firms entering the Sensex by the end of the decade. * indicates this is share price performance for firms belonging to the respective buckets constructed on a free float market-cap basis.
Firms that entered the index from the top-100 bucket (based on beginning-period market cap) managed to deliver 21% CAGR returns historically.

Strategy & Economy
January 09, 2018 Ambit Capital Pvt. Ltd. Page 106
A framework to identify candidates that can enter Sensex
We identify three unlisted companies that can potentially enter the Sensex over the next decade. These companies are essentially placeholders for three themes that we foresee arising in the next decade:
Theme#1: Sectors with significant private equity funding
We expect the large e-commerce start-ups to list in the coming decade. Out of these, we choose Flipkart and Paytm for their leading positions (both in terms of scale and valuation) among competition. We have to admit that because these are unlisted firms, our judgments are based on what we read in the press, which might mean that we do not have a complete picture of the financial prospects of these firms.
Theme#2: Sectors that will come into play via disinvestment
We believe that the current NDA Government would opt for at least one large IPO in the next decade to convey its commitment to divestment. We believe LIC could top the list of profitable PSUs that will list over the next decade.
Step 1: Efficient capital allocation
Over the past four years, we have successfully used our greatness framework to measure the efficiency of a firm’s capital allocation. The framework looks for firms that judiciously invest capital and turn those investments into sales, profits, balance sheet strength, and most importantly, free cash flows which then feed back into the future growth needs of the firm.
The ’greatness‘ framework Exhibit 170:
Source: Ambit Capital research
This framework has been the basis of stock selection for both our tenbagger and Good & Clean portfolios. For more details on the framework please refer to our latest iteration from January 2017 (Tenbagger 6 note). For a firm to be considered for Sensex inclusion, the ‘greatness’ score should be 67% or higher. Thus, at the first step, we weed out all firms that fail to meet this metric.
However, we make exceptions for IOCL, Ambuja, UltraTech and Pidilite Industries:
Whilst IOCL and UltraTech do not score highly on the “greatness” model, they require the least amount of compounding to get into the index given their size. By total free float market-cap rank, they are currently ranked 15 and 30 respectively.
Ambuja will soon cease to exist in its current form as it will merge with ACC, thus creating the second-largest cement company in India with a combined market cap of ~$13.5bn and a highly likely Sensex entrant. (The smallest Sensex’s company’s market cap is $6bn).
Pidilite is included due to our analysts’ conviction on the long-term story for the stock. Pidilite's free-float market-cap rank in the Indian market is 89.
We expect the large e-commerce start-ups to list in the coming decade. Out of these, we choose Flipkart and Paytm for their leading positions
We believe LIC could top the list of profitable PSUs that will list over the next decade
For a firm to be considered for Sensex inclusion, the ‘greatness’ score should be 67% or higher
b. Conversion of investment to sales (asset turnover, sales)
c. Pricing discipline (PBIT margin)
d. Balance sheet discipline (D/E, cash ratio)
a. Investment (gross block)
e. Cash generation (CFO)

Strategy & Economy
January 09, 2018 Ambit Capital Pvt. Ltd. Page 107
Step 2: Consistent financial performance
Once filtered for ‘greatness’, we test the universe for consistency of financial performance using our twin filters of growth and profitability (we had used these same filters for creating our Coffee Can Portfolio in November last year).
Consistent sales growth of more than 10%: With India’s nominal GDP having grown at 15% per annum on average over the last 10 years (FY07-17), we measure the consistency of growth by using a more relaxed filter of 10% sales growth in at least seven of the past 10 years.
Consistent RoCE of over 15%: With 15% being the approximate cost of capital in the country, we use a profitability filter of 15% or more on pre-tax ROCE in at least seven of the past 10 years.
For Financial Services companies, we modify the filters on RoCE and sales growth as follows:
RoA of 1.1% for banks (and RoE of 15% for non-banking financial services): Whilst we have used RoE as the return measure for NBFCs, we have used RoA for banks. Whilst the underlying profitability of operations reflects in both RoA and RoE, RoE is also impacted by the leverage or capital position of the bank. Historically, many banks (especially PSU banks) have delivered high RoE due to high leverage despite weak underlying profitability. Therefore, RoA is a better metric to use for banks.
We identify banks that have delivered RoA in excess of 1.1% (and NBFCs that have delivered RoE in excess of 15%) in at least seven out of the last 10 years.
Loan growth of 15%: We believe consistency of loan growth is an indication of a lender’s ability to lend over business cycles. Strong lenders ride the downcycle better as their competitive advantages surrounding their origination, appraisal and collection process ensure that they continue their growth profitably either through market-share improvements or upping the ante in sectors which are resilient during a downturn. Therefore, we identify lenders that managed to deliver 15% loan growth in at least seven of the past 10 years.
Step 3: Ambit’s P-75 companies
We then screen the residual universe to eliminate stocks that are part of Ambit’s P-75 companies, i.e. companies whose core competitive advantage is political connectivity.
We believe such companies are on a weaker footing given the impact of Modi’s three resets, especially the one pertaining to disruption of crony capitalism. Thus, any company in our universe that is part of Ambit’s P-75 companies is automatically disqualified from becoming a probable Sensex entrant.
Step 4: Market-cap buckets
The fourth filter that we use pertains to the size of the company at the beginning of the period. From our previous discussions, we note that nearly half of the Sensex entrants historically have been firms from the top-100 stocks on free-float market cap as of today.
Further, the remaining 15% entrants come from the universe outside of the top-100 companies. This would mean that the remaining two companies should belong to the residual universe (outside of the top-100 companies).
Step 5: Pick and choose depending on sector
In the final step, from the stocks that clear all our filters, we give preference to stocks that belong to the sectors that are expected to gain market share - Consumer Discretionary, Industrials, Energy, Materials and Financial Services.
Once filtered for ‘greatness’, we test the universe for consistency of financial performance using our twin filters of growth and profitability
Any company in our universe that is part of Ambit’s P-75 companies is automatically disqualified from becoming a probable Sensex entrant
We give preference to stocks that belong to the sectors that are expected to gain market share - Consumer Discretionary, Industrials, Energy, Materials, and Financial Services

Strategy & Economy
January 09, 2018 Ambit Capital Pvt. Ltd. Page 108
Stocks from the top-100 universe that are likely to enter Sensex Exhibit 171:
Name Ticker GICS Sector Hypothesis
IOCL IOCL IN Energy Largest Indian fuel retailer and second-largest refiner; competitive advantage will be driven by scaling up of Paradip and increased autonomy in decision making by GoI
HCL Tech HCLT IN Technology Leader in Infra Management Services and Engineering Services; scores better than Wipro on our capital allocation, portfolio mix, operational excellence and management framework
UltraTech Cement UTCEM IN Materials Strong balance sheet, cash generative traits and access to large land parcels and limestone reserves will drive UtlraTech’s leadership position and make it a proxy play on India’s infra/housing pick-up
BPCL BPCL IN Energy Leading fuel retailer and refiner in India with superior capital allocation and project execution
Eicher Motors EIM IN Cons Discr Leader in niche motorcycle segment; well-placed to gain from rise in consumer discretionary spend
Ambuja Cements ACEM IN Materials ACC will merge with Ambuja to create the second-largest cement entity The combined entity will maximise plant efficiencies and enjoy synergistic savings
Pidilite Industries PIDI IN Materials Sustainable brand leadership and superior fundamentals make Pidilite a high-quality defensive play in the consumer sector
HDFC Standard Life HDFCLIFE IN Financials
HDFC Standard Life has grown faster than industry even while maintaining industry best new business margins. The company has highest settlement ratio in private sector. On the back of strong brand, execution capabilities and vast distribution network, the company should be able to maintain its premium position in the market.
SBI Life SBILIFE IN Financials
Over last three years, SBI Life increased its market share by ~1% to 5.8% based on the new business premium basis and currently is growing faster than its peers. SBI Life has cost leadership and large distribution advantage which should support the company to increase its market share.
Titan Company TTAN IN Cons Discr Inroads into wedding jewellery using its brand trust and reach elongate the growth runway thus supporting premium valuations
Source: Bloomberg, Capitaline, Ambit Capital research
Similarly, stocks from the next 100 universe on free float market-cap that clear all our filters and which we believe would likely enter the index over the next decade have been shown in the exhibit below.
Stocks from the 101-200 universe that are likely to enter Exhibit 172:Name Ticker GICS Sector Hypothesis
Torrent Pharma TRP IN Healthcare Increasing presence in generics (US, Europe) and branded markets (India and EMs); new management driving high RoCE
Page Industries PAG IN Cons. Disc Greater growth longevity than most consumer companies; sustained competitive advantages will support premium valuations
Source: Bloomberg, Capitaline, Ambit Capital research.

Strategy & Economy
January 09, 2018 Ambit Capital Pvt. Ltd. Page 109
Appendix 1: Comparison with our Sensex entry and exit predictions from last year We published the Sensex entries and exits thematic on 19 September 2016. We highlight that two of our exit predictions for the decade – Cipla and BHEL – have already materialised while two of our entrant predictions for the decade – Kotak Mahindra Bank and IndusInd Bank have already entered the index.
We look at the changes made in our predictions from 2016.
Predicted exit candidates (from the September 2016 note) Exhibit 173:
Name Ticker Part of current Sensex? Part of this year’s exit list Price performance
(last 1 year)
Reliance Industries RIL IN Yes Yes 68%
Coal India COAL IN Yes Yes -11%
O N G C ONGC IN Yes No – Possibility of merger with HPCL and then perhaps GAIL to create an integrated oil and gas company 1%
State Bank of India SBIN IN Yes No – The Government will merge weak PSU banks with SBI thereby keeping it big 26%
Larsen & Toubro LT IN Yes No – For large-scale construction projects, India has no real alternative to L&T. No other firm is remotely close to L&T’s size and skill set when it comes to large-scale construction projects
43%
Bharti Airtel BHARTI IN Yes Yes 70%
NTPC NTPC IN Yes Yes 7%
Wipro WPRO IN Yes Yes 33%
M & M MM IN Yes Yes 23%
Hero Motocorp HMCL IN Yes Yes 26%
Adani Ports ADSEZ IN Yes Yes 54%
Dr Reddy's Labs DRRD IN Yes Yes -24%
GAIL (India) GAIL IN No No – Already exited 50%
Cipla CIPLA IN No No – Already exited 8%
Tata Steel TATA IN Yes Yes 82%
Source: Ambit Capital research
The new exit candidates in comparison with the 2016 list are Infosys, Tata Motors and Tata Motors – DVR, Tata Steel and Power Grid.
SBI, L&T and ONGC are three candidates which no longer figure in our list while Gail and Cipla have already exited.
Two of our exit predictions from last year – Cipla and BHEL – have already materialised while two of our entrant predictions – Kotak Mahindra Bank and IndusInd Bank have already entered the index

Strategy & Economy
January 09, 2018 Ambit Capital Pvt. Ltd. Page 110
Predicted entry candidates (from the September 2016 note) Exhibit 174:
Name Ticker Part of current Sensex? Part of this year’s entry list Price performance (last 1 year)
Kotak Mahindra Bank KMB IN Yes No – Already entered Sensex 44%
IOCL IOCL IN No Yes 12%
HCL Tech HCLT IN No Yes 7%
UltraTech Cement UTCEM IN No Yes 29%
BPCL BPCL IN No Yes 14%
IndusInd Bank IIB IN Yes No – Already entered Sensex 53%
Eicher Motors EIM IN No Yes 28%
Ambuja Cement ACEM IN No Yes 27%
Pidilite Industries PIDI IN No Yes 51%
Torrent Pharma TRP IN No Yes 3%
Page Industries PAG IN No Yes 79%
Flipkart N/A No Yes -
HDFC Life N/A No Yes 18%
LIC N/A No Yes -
PayTm N/A No Yes -
Source: Ambit Capital research.
The new entry candidates compared with the ones in 2016 are SBI Life and Titan.
Kotak and IndusInd Banks no longer figure in the list as they have already entered Sensex.

Strategy & Economy
January 09, 2018 Ambit Capital Pvt. Ltd. Page 111
Institutional Equities Team Saurabh Mukherjea, CFA CEO, Ambit Capital Private Limited (022) 30433174 [email protected] Pramod Gubbi, CFA Head of Equities (022) 30433124 [email protected]
Research Analysts
Name Industry Sectors Desk-Phone E-mail
Nitin Bhasin - Head of Research E&C / Infra / Cement / Home Building (022) 30433241 [email protected]
Aadesh Mehta, CFA Banking / Financial Services (022) 30433239 [email protected]
Abhishek Ranganathan, CFA Retail / Consumer Discretionary (022) 30433085 [email protected]
Aditi Singh Economy / Strategy (022) 30433284 [email protected]
Anuj Bansal Consumer (022) 30433122 [email protected]
Archit Varshney Consumer (022) 30433275 [email protected]
Ariha Doshi Consumer (022) 30433228 [email protected]
Bhargav Buddhadev Power Utilities / Capital Goods / Small Caps (022) 30433252 [email protected]
Deep Shah Media / Telecom (022) 30433064 [email protected] Gaurav Khandelwal, CFA Oil & Gas (022) 30433132 [email protected]
Gaurav Kochar Banking / Financial Services (022) 30433246 [email protected]
Girisha Saraf Home Building (022) 30433211 [email protected]
Karan Khanna, CFA Strategy / Small Caps (022) 30433251 [email protected]
Kushagra Bhattar Agri Inputs / Chemicals (022) 30433062 [email protected]
Nikhil Mathur Small Caps (022) 30433220 [email protected]
Mayank Porwal Retail / Consumer Discretionary (022) 30433214 [email protected]
Pankaj Agarwal, CFA Banking / Financial Services (022) 30433206 [email protected]
Prateek Maheshwari Cement / E&C / Infrastructure (022) 30433234 [email protected]
Prashant Mittal, CFA Strategy / Derivatives (022) 30433218 [email protected]
Rahil Shah Banking / Financial Services (022) 30433217 [email protected]
Ravi Singh Banking / Financial Services (022) 30433181 [email protected]
Ritesh Gupta, CFA Oil & Gas / Agri Inputs / Chemicals (022) 30433242 [email protected]
Ritika Mankar Mukherjee, CFA Economy / Strategy (022) 30433175 [email protected]
Sudheer Guntupalli Technology / Staffing (022) 30433203 [email protected]
Sumit Shekhar Economy / Strategy (022) 30433229 [email protected]
Utsav Mehta, CFA E&C / Infrastructure (022) 30433209 [email protected]
Vivekanand Subbaraman, CFA Media / Telecom (022) 30433261 [email protected]
Sales
Name Regions Desk-Phone E-mail
Sarojini Ramachandran - Head of Sales UK +44 (0) 20 7886 2740 [email protected]
Anmol Arya India (022) 30433079 [email protected]
Dharmen Shah India / Asia (022) 30433289 [email protected]
Dipti Mehta India (022) 30433053 [email protected]
Krishnan V India / Asia (022) 30433295 [email protected]
Nityam Shah, CFA Europe (022) 30433259 [email protected]
Punitraj Mehra, CFA India / Asia (022) 30433198 [email protected] Shaleen Silori India (022) 30433256 [email protected]
Singapore
Praveena Pattabiraman Singapore +65 6536 0481 [email protected]
Shashank Abhisheik Singapore +65 6536 1935 [email protected]
USA / Canada
Hitakshi Mehra Americas +1(646) 793 6751 [email protected]
Achint Bhagat, CFA Americas +1(646) 793 6752 [email protected]
Production
Sajid Merchant Production (022) 30433247 [email protected]
Sharoz G Hussain Production (022) 30433183 [email protected]
Jestin George Editor (022) 30433272 [email protected]
Richard Mugutmal Editor (022) 30433273 [email protected]
Nikhil Pillai Database (022) 30433265 [email protected]

Strategy & Economy
January 09, 2018 Ambit Capital Pvt. Ltd. Page 112
Explanation of Investment Rating
Investment Rating Expected return (over 12-month)
BUY >10%
SELL <10%
NO STANCE We have forward looking estimates for the stock but we refrain from assigning valuation and recommendation
UNDER REVIEW We will revisit our recommendation, valuation and estimates on the stock following recent events
NOT RATED We do not have any forward looking estimates, valuation or recommendation for the stock POSITIVE We have a positive view on the sector and most of stocks under our coverage in the sector are BUYs
NEGATIVE We have a negative view on the sector and most of stocks under our coverage in the sector are SELLs
* In case the recommendation given by the Research Analyst becomes inconsistent with the rating legend, the Research Analyst shall within 28 days of the inconsistency, take appropriate measures (like change in stance/estimates) to make the recommendation consistent with the rating legend.
Disclaimer This report or any portion hereof may not be reprinted, sold or redistributed without the written consent of Ambit Capital. AMBIT Capital Research is disseminated and available primarily electronically, and, in some cases, in printed form.
Additional information on recommended securities is available on request.
Disclaimer 1. AMBIT Capital Private Limited (“AMBIT Capital”) and its affiliates are a full service, integrated investment banking, investment advisory and brokerage group. AMBIT Capital is a Stock Broker, Portfolio
Manager, Merchant Banker and Depository Participant registered with Securities and Exchange Board of India Limited (SEBI) and is regulated by SEBI. 2. AMBIT Capital makes best endeavours to ensure that the research analyst(s) use current, reliable, comprehensive information and obtain such information from sources which the analyst(s) believes
to be reliable. However, such information has not been independently verified by AMBIT Capital and/or the analyst(s) and no representation or warranty, express or implied, is made as to the accuracy or completeness of any information obtained from third parties. The information, opinions, views expressed in this Research Report are those of the research analyst as at the date of this Research Report which are subject to change and do not represent to be an authority on the subject. AMBIT Capital may or may not subscribe to any and/ or all the views expressed herein.
3. This Research Report should be read and relied upon at the sole discretion and risk of the recipient. If you are dissatisfied with the contents of this complimentary Research Report or with the terms of this Disclaimer, your sole and exclusive remedy is to stop using this Research Report and AMBIT Capital or its affiliates shall not be responsible and/ or liable for any direct/consequential loss howsoever directly or indirectly, from any use of this Research Report.
4. If this Research Report is received by any client of AMBIT Capital or its affiliate, the relationship of AMBIT Capital/its affiliate with such client will continue to be governed by the terms and conditions in place between AMBIT Capital/ such affiliate and the client.
5. This Research Report is issued for information only and the 'Buy', 'Sell', or ‘Other Recommendation’ made in this Research Report such should not be construed as an investment advice to any recipient to acquire, subscribe, purchase, sell, dispose of, retain any securities and should not be intended or treated as a substitute for necessary review or validation or any professional advice. Recipients should consider this Research Report as only a single factor in making any investment decisions. This Research Report is not an offer to sell or the solicitation of an offer to purchase or subscribe for any investment or as an official endorsement of any investment.
6. This Research Report is being supplied to you solely for your information and may not be reproduced, redistributed or passed on, directly or indirectly, to any other person or published, copied in whole or in part, for any purpose. Neither this Research Report nor any copy of it may be taken or transmitted or distributed, directly or indirectly within India or into any other country including United States (to US Persons), Canada or Japan or to any resident thereof. The distribution of this Research Report in other jurisdictions may be strictly restricted and/ or prohibited by law or contract, and persons into whose possession this Research Report comes should inform themselves about such restriction and/ or prohibition, and observe any such restrictions and/ or prohibition.
7. Ambit Capital Private Limited is registered as a Research Entity under the SEBI (Research Analysts) Regulations, 2014. SEBI Reg.No.- INH000000313.
Conflict of Interests 8. In the normal course of AMBIT Capital’s business circumstances may arise that could result in the interests of AMBIT Capital conflicting with the interests of clients or one client’s interests conflicting
with the interest of another client. AMBIT Capital makes best efforts to ensure that conflicts are identified and managed and that clients’ interests are protected. AMBIT Capital has policies and procedures in place to control the flow and use of non-public, price sensitive information and employees’ personal account trading. Where appropriate and reasonably achievable, AMBIT Capital segregates the activities of staff working in areas where conflicts of interest may arise. However, clients/potential clients of AMBIT Capital should be aware of these possible conflicts of interests and should make informed decisions in relation to AMBIT Capital’s services.
9. AMBIT Capital and/or its affiliates may from time to time have or solicit investment banking, investment advisory and other business relationships with companies covered in this Research Report and may receive compensation for the same.
Additional Disclaimer for Canadian Persons 10. AMBIT Capital is not registered in the Province of Ontario and /or Province of Québec to trade in securities and/or to provide advice with respect to securities. 11. AMBIT Capital's head office or principal place of business is located in India.
12. All or substantially all of AMBIT Capital's assets may be situated outside of Canada. 13. It may be difficult for enforcing legal rights against AMBIT Capital because of the above. 14. Name and address of AMBIT Capital's agent for service of process in the Province of Ontario is: Torys LLP, 79 Wellington St. W., 30th Floor, Box 270, TD South Tower, Toronto, Ontario M5K 1N2
Canada. 15. Name and address of AMBIT Capital's agent for service of process in the Province of Québec is Torys Law Firm LLP, 1 Place Ville Marie, Suite 1919 Montréal, Québec H3B 2C3 Canada.
Additional Disclaimer for Singapore Persons
16. This Report is prepared and distributed by Ambit Capital Private Limited and distributed as per the approved arrangement under Paragraph 9 of Third Schedule of Securities and Futures Act (CAP 289) and Paragraph 11 of the First Schedule to the Financial Advisors Act (CAP 110) provided to Ambit Singapore Pte. Limited by Monetary Authority of Singapore.
17. This Report is only available to persons in Singapore who are institutional investors (as defined in section 4A of the Securities and Futures Act (Cap. 289) of Singapore (the “SFA”).” Accordingly, if a Singapore Person is not or ceases to be such an institutional investor, such Singapore Person must immediately discontinue any use of this Report and inform Ambit Singapore Pte. Limited.
Additional Disclaimer for UK Persons 18. All of the recommendations and views about the securities and companies in this report accurately reflect the personal views of the research analyst named on the cover. No part of this research
analyst’s compensation was, is, or will be directly or indirectly related to the specific recommendations or views expressed by the research analyst in this research report. This report may not be reproduced, redistributed or copied in whole or in part for any purpose.
19. This report is a marketing communication and has been prepared by Ambit Capital Pvt Ltd of Mumbai, India (“Ambit”) and has been approved in the UK by Ambit Capital (UK) Limited (“ACUK”) solely for the purposes of section 21 of the Financial Services and Markets Act 2000. Ambit is regulated by the Securities and Exchange Board of India and is registered as a Research Entity under the SEBI (Research Analysts) Regulations, 2014. ACUK is regulated by the UK Financial Services Authority and has registered office at C/o Panmure Gordon & Co PL, One New Change, London, EC4M9AF.
20. In the UK, this report is directed at and is for distribution only to persons who (i) fall within Article 19(1) (persons who have professional experience in matters relating to investments) or Article 49(2)(a) to (d) (high net worth companies, unincorporated associations etc) of the Financial Services and Markets Act 2000 (Financial Promotions) Order 2005 (as amended) or (ii) are professional customers or eligible counterparties of ACUK (all such persons together being referred to as "relevant persons"). This report must not be acted on or relied upon by persons in the UK who are not relevant persons.
21. Neither Ambit nor ACUK is a US registered broker-dealer. Transactions undertaken in the US in any security mentioned herein must be effected through a US-registered broker-dealer, in conformity with SEC Rule 15a-6.
22. Neither this report nor any copy or part thereof may be distributed in any other jurisdictions where its distribution may be restricted by law and persons into whose possession this report comes should inform themselves about, and observe, any such restrictions. Distribution of this report in any such other jurisdictions may constitute a violation of UK or US securities laws, or the law of any such other jurisdictions.
23. This report does not constitute an offer or solicitation to buy or sell any securities referred to herein. It should not be so construed, nor should it or any part of it form the basis of, or be relied on in connection with, any contract or commitment whatsoever. The information in this report, or on which this report is based, has been obtained from publicly available sources that Ambit believes to be reliable and accurate. However, it has not been prepared in accordance with legal requirements designed to promote the independence of investment research. It has also not been independently verified and no representation or warranty, express or implied, is made as to the accuracy or completeness of any information obtained from third parties.
24. The information or opinions are provided as at the date of this report and are subject to change without notice. The information and opinions provided in this report take no account of the investors’ individual circumstances and should not be taken as specific advice on the merits of any investment decision. Investors should consider this report as only a single factor in making any investment decisions. Further information is available upon request. No member or employee of Ambit or ACUK accepts any liability whatsoever for any direct or consequential loss howsoever arising, directly or indirectly, from any use of this report or its contents.

Strategy & Economy
January 09, 2018 Ambit Capital Pvt. Ltd. Page 113
25. The value of any investment made at your discretion based on this Report, or income therefrom, maybe affected by changes in economic, financial and/or political factors and may go down as well as go up and you may not get back the original amount invested. Some securities and/or investments involve substantial risk and are not suitable for all investors.
26. Ambit and its affiliates and their respective officers directors and employees may hold positions in any securities mentioned in this Report (or in any related investment) and may from time to time add to or dispose of any such securities (or investment). Ambit and ACUK may from time to time render advisory and other services to companies referred to in this Report and may receive compensation for the same.
27. Ambit and its affiliates may act as a market maker or risk arbitrator or liquidity provider or may have assumed an underwriting commitment in the securities of companies discussed in this Report (or in related investments) or may sell them or buy them from clients on a principal to principal basis or may be involved in proprietary trading and may also perform or seek to perform investment banking or underwriting services for or relating to those companies.
28. Ambit and ACUK may sell or buy any securities or make any investment which may be contrary to or inconsistent with this Report and are not subject to any prohibition on dealing. By accepting this report you agree to be bound by the foregoing limitations. In the normal course of Ambit and its affiliates’ business, circumstances may arise that could result in the interests of Ambit conflicting with the interests of clients or one client’s interests conflicting with the interest of another client. Ambit makes best efforts to ensure that conflicts are identified, managed and clients’ interests are protected. However, clients/potential clients of Ambit should be aware of these possible conflicts of interests and should make informed decisions in relation to Ambit services.
Additional Disclaimer for U.S. Persons
29. The research report is solely a product of AMBIT Capital 30. AMBIT Capital is the employer of the research analyst(s) who has prepared the research report 31. Any subsequent transactions in securities discussed in the research reports should be effected through Enclave Capital LLC. (“Enclave”). 32. Enclave does not accept or receive any compensation of any kind for the dissemination of the AMBIT Capital research reports. 33. The research analyst(s) preparing the email / Research Report/ attachment is resident outside the United States and is/are not associated persons of any U.S. regulated broker-dealer and that
therefore the analyst(s) is/are not subject to supervision by a U.S. broker-dealer, and is/are not required to satisfy the regulatory licensing requirements of FINRA or required to otherwise comply with U.S. rules or regulations regarding, among other things, communications with a subject company, public appearances and trading securities held by a research analyst account.
34. This report is prepared, approved, published and distributed by the Ambit Capital located outside of the United States (a non-US Group Company”). This report is distributed in the U.S.by Enclave Capital LLC, a U.S. registered broker dealer, on behalf of Ambit Capital only to major U.S. institutional investors (as defined in Rule 15a-6 under the U.S. Securities Exchange Act of 1934 (the “Exchange Act”)) pursuant to the exemption in Rule 15a-6 and any transaction effected by a U.S. customer in the securities described in this report must be effected through Enclave Capital LLC (19 West 44th Street, suite 1700, New York, NY 10036). In order to receive any additional information about or to effect a transaction in any security or financial instrument mentioned herein, please contact a registered representative of Enclave Capital LLC.
35. As of the publication of this report Enclave Capital LLC, does not make a market in the subject securities. 36. This document does not constitute an offer of, or an invitation by or on behalf of Ambit Capital or its affiliates or any other company to any person, to buy or sell any security. The information
contained herein has been obtained from published information and other sources, which Ambit Capital or its Affiliates consider to be reliable. None of Ambit Capital accepts any liability or responsibility whatsoever for the accuracy or completeness of any such information. All estimates, expressions of opinion and other subjective judgments contained herein are made as of the date of this document. Emerging securities markets may be subject to risks significantly higher than more established markets. In particular, the political and economic environment, company practices and market prices and volumes may be subject to significant variations. The ability to assess such risks may also be limited due to significantly lower information quantity and quality. By accepting this document, you agree to be bound by all the foregoing provisions.
Disclosures 37. The analyst (s) has/have not served as an officer, director or employee of the subject company. 38. There is no material disciplinary action that has been taken by any regulatory authority impacting equity research analysis activities. 39. All market data included in this report are dated as at the previous stock market closing day from the date of this report. 40. Ambit and/or its associates have received compensation for investment banking/merchant banking/brokering services from HDFC Bank Ltd and Reliance Infra in the past 12 months. 41. Anupam Gupta and his wife (dependent) have an interest in the following stocks mentioned in the report: Bharat Forge, BPCL, Eicher Motors, Hero Motorcorp, HDFC Life, Kotak Mahindra Bank, and
Larsen & Toubro.
Analyst Certification
Each of the analysts identified in this report certifies, with respect to the companies or securities that the individual analyses, that (1) the views expressed in this report reflect his or her personal views about all of the subject companies and securities and (2) no part of his or her compensation was, is or will be directly or indirectly dependent on the specific recommendations or views expressed in this report. © Copyright 2017 AMBIT Capital Private Limited. All rights reserved.
Ambit Capital Pvt. Ltd. Ambit House, 3rd Floor. 449, Senapati Bapat Marg, Lower Parel, Mumbai 400 013, India. Phone: +91-22-3043 3000 | Fax: +91-22-3043 3100 CIN: U74140MH1997PTC107598 www.ambitcapital.com