strategy to execution: predictive analytics
TRANSCRIPT
7/25/2019 Strategy to Execution: Predictive Analytics
http://slidepdf.com/reader/full/strategy-to-execution-predictive-analytics 1/5
Organizational Strategy to ExecutionPredictive Analytics with SAS® Enterprise Miner
Garrett Stauber
The Citadel
Charleston, USA
The expansive amount of availabl e data presents organi zations
with a valuable resource. By harnessing and analyzing data
through predictive analytical processes valuable insights can be
gained about fu tur e events and behaviors. However, to r each it s ful l
potential , predictive analytical insights need to fin d their way to the
organizational decision makers. By making predictive analytics
accessible to those in strategic roles via well designed softwar e
tool s, data anal ysis can feed business strategies that are responsive
to the organizations in tri nsic and extri nsic environment.
I. I NTRODUCTION
Organizations are established with the intent of profitability[1]. To achieve and improve profitability, high level business
goals must be established to position the organization for futuresuccess. To disseminate these goals, an organization typically
pushes the goals downward through the business layers.Meaningful and achievable strategies must be extracted from
the goals at each business layer.
This process of setting goals and then translating them into
objectives for the various organizational layers is designed to provide top down control over the organization. The top layer
in this hierarchy of control is known as the strategic layer [1].
In this layer high-level business goals are established, and a business strategy is devised to achieve these goals. The business strategy will provide an overall direction for the
organization [1]. At the next layer of the organization, knownas the tactical layer, the business strategy must be translated
into tactics which various business units can employ to
contribute towards the strategy [1]. Finally, at the lowest level
of the organization control hierarchy, the operational layer, the business unit’s tactics are transformed into actions which can
be accomplished by business processes in their day-to-day
operations [1].
II. PREDICTIVE A NALYTICS & ORGANIZATIONAL LAYERS
The organizational control flow begins with goal setting.The process of establishing goals and the strategies to achievethem requires a tremendous amount of insight. Today’s
businesses have the benefit of massive amounts of dataavailable to them about the external environment, and theability to collect large amounts of data regarding their internaloperations of their business. With this data countless insightscan be drawn. The problem, however, is that this massiveamount of data is difficult to organize and analyze. Thus thespecialized fields have arisen to focus on organizing and
extracting meaningful relationships from big data. The fieldknown as predictive analytics is one of these big-data fields.Predictive analytics is aimed at drawing conclusions aboutfuture events and behaviors based upon historical trends foundin data [2].
A. Relationship to Strategy Execution
At the strategic control layer, predictive analytics providesthe insights to make informed decision regarding futurechanges to the business environment. At this layer, the external
environment is of primary concern. By providing insights intothe future customer and competitor behaviors, goals andstrategies can be formulated to beneficially position theorganization ahead of the competition.
B. Relationship to Tactical Execution
At the tactical control layer, predictive analytics can
provide business units insights into the intrinsic trends of theorganization. These trends can then be leveraged to shift
intrinsic factors such as cost, efficiency, or output.
C. Relationship to Organizational Execution
At the organizational control layer, business processesgenerate data that feeds predictive analytics. This data can
then be used to identify business processes in need ofimprovement at the tactical layer, or identify organization-
wide trends that can be addressed at the strategic level.
III. PREDICTIVE A NALYTICS TOOLS
Due to the complexity of big-data, many tools are requiredto manage and analyze it. Thus, predictive analytics tools areoften packaged in a suite with other big-data tools. There arenumerous software suites focusing on big-data that include
predictive analytics capabilities. These include large enterprisesoftware vendors SAP, SAS, Oracle and IBM, as well as, thesoftware from the open-source Apache community [3].
A. Analysis Techniques
A 4-step process for conducting predictive analytics on big-data is outline in Predictive Analytics: It’s everywhere byPopow [4]. The first step is to ensure the data is of high quality.Here the data is scanned for incomplete or erroneous data sets.This data must be corrected or removed to prevent statisticalerrors. Next, the data-mining process occurs. In this phasetrends, patterns, and other relationships in the data arediscovered. Using this information in the next step, we can

7/25/2019 Strategy to Execution: Predictive Analytics
http://slidepdf.com/reader/full/strategy-to-execution-predictive-analytics 2/5
build mathematical models to conduct predictive analysis onthe data. These models contain the logic for conductinganalysis on a known set of data. Finally, the models arevalidated by running them against older data and comparingthe output to the known results. The types of models used toconduct predictive analytics can broadly be grouped into twocategories: regression and machine learning models [3].
In regression modeling an equation is established, the
output of which will be the focus of our analysis [3]. Theanalyst will want to discover what factors lead tomaximization, or minimization of this equation. By looking athistorical data and with a knowledge of the problem at hand,new variables can be introduced to the equation and their effecton the output can be gauged.
Machine learning is different in that equation is notexplicitly stated and the machine has no way of interpretingwhich factors have known relevance to the problem at hand[5]. The machine is simply given access to the data, and it isable to remember the data in states in which a certain eventoccurred. The machine can then use its memory to recognizean occurrence of this state in the future. By feeding the
machine more known occurrences which it can learn from, itcan be trained to better determine when an event of interestwill occur.
B. PMML
Big-data tools are largely proprietary and practitioners are
often experts in a limited set of tools. As big-data analysis becomes more prominent in business strategy, standardization
is being introduced to the set of available tools. This allows businesses to transition between big-data suites without
extensive investments in re-training their professionals.One form of standardization in big-data, and specifically to
predictive analytics, is the creation of the predictive modelmarkup language [PMML]. PMML is an XML-based file
format developed by the Data Mining Group to provide a wayfor applications to describe and exchange models produced by
data mining and machine learning algorithms [6].The primary purpose of PMML is to provide a standardized
structure to represent the various data-mining models [6]. Thisallows the models to be imported and exported from various
statistical language packages [6]. Large enterprise suites likeSAS, which is explored in the next section, support both
importing and exporting PMML.
IV. SAS
SAS is a software suite originally developed at North
Carolina State University and released in 1972 [7]. Today it iscomprised of over 200 components [7]. It can mine, alter,
manage and retrieve data from a variety of sources and perform statistical analysis on it [7]. SAS provides a graphical
point-and-click user interface for non-technical users andmore advanced options through the SAS programming
language.
A. Enterprise Miner
The SAS module of importance, in reference to PredictiveAnalytics, is SAS Enterprise Miner. This module is focused
on the mining of data relationships and the creation ofaccurate descriptive and predictive data models [8].
B. Predictive Analysis in Enterprise Miner
The process of data mining and analysis in Enterprise
Miner is described in 5 steps (SEMMA) in the Getting Startedwith SAS Enterprise Miner 14.1 [8, page 1].
• Sample
the data by creating one or more data sets. Thesample should be large enough to contain significantinformation, yet small enough to process. This step includes
the use of data preparation tools for data import, merge,append, and filter, as well as statistical sampling techniques.
• Explore the data by searching for relationships, trends, and
anomalies in order to gain understanding and ideas. This stepincludes the use of tools for statistical reporting and graphical
exploration, variable selection methods, and variableclustering.
• Modify the data by creating, selecting, and transforming the
variables to focus the model selection process. This step
includes the use of tools for defining transformations, missingvalue handling, value recoding, and interactive binning.
• Model the data by using the analytical tools to train astatistical or machine learning model to reliably predict a
desired outcome. This step includes the use of techniques suchas linear and logistic regression, decision trees, neural
networks, partial least squares, LARS and LASSO, nearest
neighbor, and importing models defined by other users or even
outside SAS Enterprise Miner.
• Assess the data by evaluating the usefulness and reliabilityof the findings from the data mining process. This step
includes the use of tools for comparing models and computingnew fit statistics, cutoff analysis, decision support, report
generation, and score code management.
After the models have been created and assessed,Enterprise Miner will report your models which have the
highest degree of accuracy [8, page 2]. These models can then be applied to new data, to score the likelihood of the target
outcome [8, page 2].

7/25/2019 Strategy to Execution: Predictive Analytics
http://slidepdf.com/reader/full/strategy-to-execution-predictive-analytics 3/5
C. Enterprise Miner Nodes
The heart of Enterprise Miner’s purpose and functionality
lies what they call nodes. The nodes provide the user all of thefunctionality needed to import, mine, and analyze data. The
simple drag and drop user interface provided by EnterpriseMiner allows the user to create a process flow containing
various nodes that follow the SEMMA methodology [8, page
2]. Using this interface, it is possible to rapidly generate andanalyze many data models. The most commonly used nodesare organized below along with a brief description according
to their SEMMA phase as documented in the softwaredocumentation [8, page 47].
1) Sample
a) Append
The append node is used to combine data sets withinthe process flow diagram [8, page 47].
b) Data Partition
The Data Partition node is used to divide a data set
into a subset used for model fitting, and other data setaside for model validation and testing [8, page 47].
c) Filter
The Filter node can be used to exclude data based
upon variable values [8, page 48].
d) Input Data
The Input Data node is used to include SAS
recognized data sets in the process flow [8, page 48].
e) Sample
The sample node is used to extract a subset from alarger dataset [8, page 48].
2) Explore
a) Association
The Association node is used to identify relationships
of interest between variables in the dataset [8, page 48].
b) Graph Explore
The Graph Explore node provides data visualizations
along with interactive exploration to aid in pattern andtrend discovery [8, page 49].
c) MultiPlot
The MultiPlot node will automatically create chartsof the input and target variables [8, page 49].
d) Path Analysis
The Path Analysis node is used to explore web logsto determine the paths taken to navigate a website [8,
page 49].
e) StatExplore
The StatExplore node is used to examine thestatistical properties of an input data set [8, page 49].
f) Variable Clustering
The Variable Clustering node is used to replaceredundant and collinear variables in the data with a
single variable [8, page 49].
g) Variable Selection
The Variable Selection node is used to select which
variables are useful to the model for target prediction [8, page 49].
3) Modify
a) Drop
The Drop node is used to remove variables from the
dataset or to hide metadata [8, page 49].
b) Impute
The Impute node is used to compute and input
missing variable values into the dataset [8, page 50].
c) Transform Variables
The Transform Variable node is used to replace a
variable with a value that is a transformation of itsexisting value [8, page 50].

7/25/2019 Strategy to Execution: Predictive Analytics
http://slidepdf.com/reader/full/strategy-to-execution-predictive-analytics 4/5
4) Model
a) AutoNeural
The AutoNeural node is an automated tool that will
aid in discovering the optimal configuration for a neuralnetwork model [8, page 50].
b) Decision Tree
The Decision Tree node is used to fit decision trees tothe data and includes auto-ranking of the input variables
[8, page 51].
c) Model Import
The Model Import node is used to import a model not
created in Enterprise Miner [8, page 52].
d) Neural Network
The Neural Network node is used to construct, train,
and validate multilayer, feed-forward neural networks[8, page 52].
e)
Regression
The Regression node is used to fit linear and logisticregression models to the data [8, page 52].
5) Assess
a) Model Comparison
The Model Comparison node is used to comparemodel nodes and their predictions. The node will
generate visualizations showing the usefulness of thegiven models [8, page 53].
b) Score
The Score node is used to manage SAS scoring codethat is generated by the models. Scoring is the
generation of predicted values for a data set that mightnot contain a target variable [8, page 53].
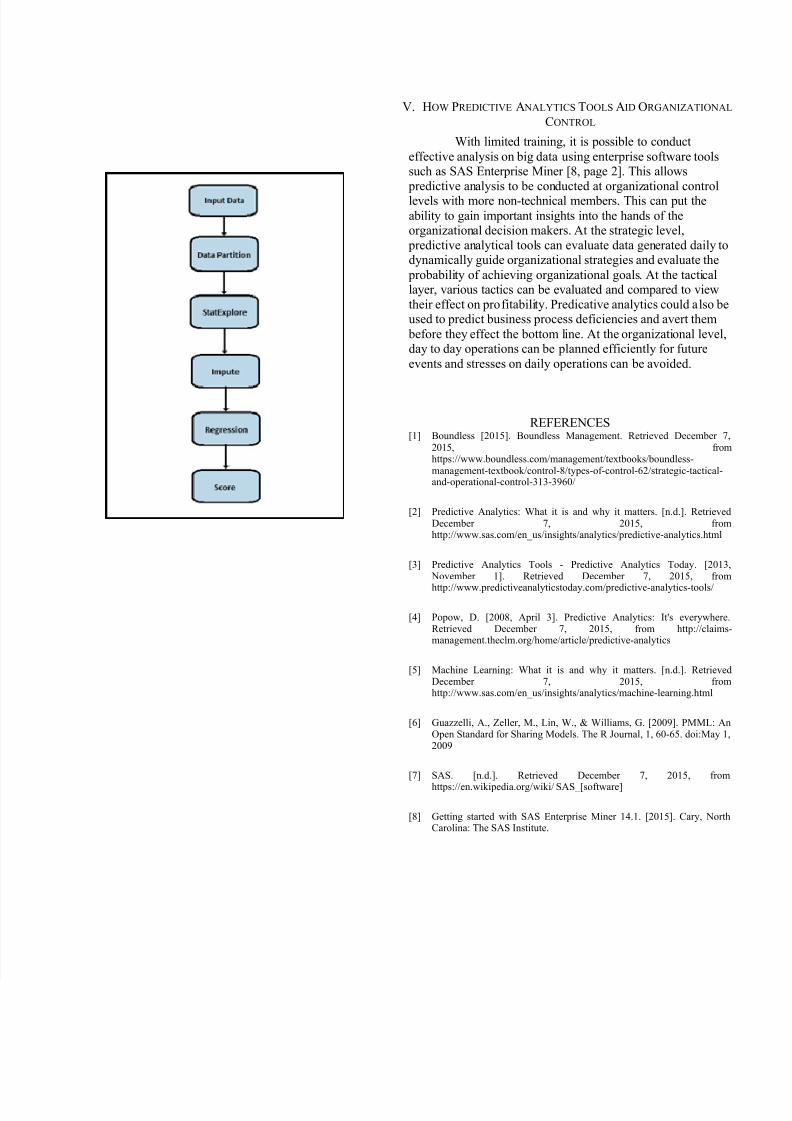
D. Sample Enterprise Miner Process Flow Diagram
In its simplest form an example usage of these nodes
following the SEMMA methodology would look somethinglike the following:
Our first node would be a Sample node. Using the
Input Data node, we would link to a SAS data sourceand define which fields we would like to exclude and
identify our target field [8, page 11].
In order to facilitate analysis we must next include aData Partition node. Using this node, we will definewhat percentage of our data source to divide into
subsets used for initial model fitting, analysis of themodel, and for test data [8, page 18].
Our next node will be used to explore the datasource. In this example will use the StatExplore node.
Once we link this node to our Data node, we can runthe StatExplore node and view the results [8, page
16]. The results will display a graph charting the
correlation between our various data source fieldsand our target field [8, page 16].
Next, before conducting analysis on our data, we willinclude an Impute node to fill in any missing datathat can be calculated or interpreted from other fields.
This step can improve the amount of data we have togenerate and validate our models since model nodes
will discard incomplete records [8, page 30].
Once we have defined the impute rules, we canchoose a Model node to fit to our data. In this casewe will use a Regression node, and select a linear
regression algorithm in the node’s properties.
Finally, we can complete our process work flow witha Score node. This Score node is used to predict thetarget variable on a data source outside of the data
used for model fitting and validation. When wechoose to run the scoring node, it will execute all
previous nodes and score the data set aside in theData Partition node for testing. The predicted result
for the target variable will be stored in the Scorenode’s results and our analysis is complete [8, page
44].
Graphic on following page
7/25/2019 Strategy to Execution: Predictive Analytics
http://slidepdf.com/reader/full/strategy-to-execution-predictive-analytics 5/5
V. HOW PREDICTIVE A NALYTICS TOOLS AID ORGANIZATIONAL
CONTROL
With limited training, it is possible to conduct
effective analysis on big data using enterprise software toolssuch as SAS Enterprise Miner [8, page 2]. This allows
predictive analysis to be conducted at organizational control
levels with more non-technical members. This can put theability to gain important insights into the hands of theorganizational decision makers. At the strategic level,
predictive analytical tools can evaluate data generated daily todynamically guide organizational strategies and evaluate the
probability of achieving organizational goals. At the tacticallayer, various tactics can be evaluated and compared to view
their effect on profitability. Predicative analytics could also beused to predict business process deficiencies and avert them
before they effect the bottom line. At the organizational level,day to day operations can be planned efficiently for future
events and stresses on daily operations can be avoided.
REFERENCES[1] Boundless [2015]. Boundless Management. Retrieved December 7,
2015, fromhttps://www.boundless.com/management/textbooks/boundless-management-textbook/control-8/types-of-control-62/strategic-tactical-and-operational-control-313-3960/
[2] Predictive Analytics: What it is and why it matters. [n.d.]. RetrievedDecember 7, 2015, fromhttp://www.sas.com/en_us/insights/analytics/predictive-analytics.html
[3] Predictive Analytics Tools - Predictive Analytics Today. [2013, November 1]. Retrieved December 7, 2015, from
http://www.predictiveanalyticstoday.com/predictive-analytics-tools/
[4] Popow, D. [2008, April 3]. Predictive Analytics: It's everywhere.Retrieved December 7, 2015, from http://claims-management.theclm.org/home/article/predictive-analytics
[5] Machine Learning: What it is and why it matters. [n.d.]. RetrievedDecember 7, 2015, fromhttp://www.sas.com/en_us/insights/analytics/machine-learning.html
[6] Guazzelli, A., Zeller, M., Lin, W., & Williams, G. [2009]. PMML: AnOpen Standard for Sharing Models. The R Journal, 1, 60-65. doi:May 1,2009
[7] SAS. [n.d.]. Retrieved December 7, 2015, from
https://en.wikipedia.org/wiki/ SAS_[software]
[8] Getting started with SAS Enterprise Miner 14.1. [2015]. Cary, NorthCarolina: The SAS Institute.