stream assessment and mitigation protocols · pdf filestream assessment and mitigation...
TRANSCRIPT

United States Environmental Protection Agency Office of Wetlands, Oceans, and Watersheds Washington, D.C. 20460
STREAM ASSESSMENT AND MITIGATION PROTOCOLS:
A REVIEW OF COMMONALITIES
AND DIFFERENCES
May 2010
STREAM ASSESSMENT AND MITIGATION PROTOCOLS:
A REVIEW OF COMMONALITIES
AND DIFFERENCES
May 4, 2010
Prepared for:
U.S. Environmental Protection Agency Office of Wetlands, Oceans, and Watersheds
Washington, D.C.
Prepared by:
Nutter & Associates, Inc. 360 Hawthorne Lane
Athens, Georgia 30606

I - ii
ACKNOWLEDGMENTS This report was funded wholly by the U.S. Environmental Protection Agency, Office of Wetlands, Oceans, and Watersheds under contract number GS-00F-0032M. Invaluable team oversight was provided by Brian Topping, USEPA Project Officer; Palmer Hough and Dr. Tracie Nadeau, USEPA; Will Harman, Michael C. Baker Corporation; and Richard Starr, U.S. Fish and Wildlife Service. Tony Greco, Nutter & Associates, assisted with research, and additional support was provided by Toney Ott, USEPA, Greg Melia, North Carolina Department of the Environment and Natural Resources, and George Athanasakes, Stantec, during compilation of nationwide regional curves. Despite the guidance and assistance from this group, any errors or omissions remain solely the responsibility of the author. Mention of trade names or commercial products does not constitute endorsement or recommendation for use. This document is not a regulation or rule and does not impose any binding requirements on USEPA, any other federal or state agency, or the public. Appropriate Citation: Somerville, D.E. 2010. Stream Assessment and Mitigation Protocols: A Review of Commonalities and Differences, May 4, 2010, Prepared for the U.S. Environmental Protection Agency, Office of Wetlands, Oceans, and Watersheds (Contract No. GS-00F-0032M). Washington, D.C.
I - iii
TABLE OF CONTENTS
PART I
LIST OF TABLES ............................................................................................................ I - iv
EXECUTIVE SUMMARY ................................................................................................. I - vi
1.0 INTRODUCTION ........................................................................................................ I - 1
2.0 HOW TO USE THIS REPORT ................................................................................... I - 3 2.1 Definitions of Terms ......................................................................................... I - 3
3.0 ORGANIZATION OF THIS REPORT ......................................................................... I - 5
4.0 BACKGROUND ........................................................................................................ I - 10 4.1 Objectives for Stream Assessment ................................................................ I - 10 4.2 Components of Stream Assessment.............................................................. I - 11 4.3 Reference Conditions. .................................................................................... I - 12 4.4 Considerations for an Effective Assessment Protocol .................................... I - 13 4.5 Stream Condition and Function ...................................................................... I - 14
5.0 METHODS................................................................................................................ I - 21
6.0 RESULTS ................................................................................................................. I - 22 6.1 Geographic Distribution of Reviewed Protocols. ............................................ I - 22 6.2 Non-Regulatory Stream Assessment Protocols. ............................................ I - 22 6.3 Regulatory Stream Mitigation Protocols ......................................................... I - 36
6.3.1 Federal Compensatory Stream Mitigation Information. I - 36
7.0 CONCLUSIONS & RECOMMENDATIONS ............................................................. I - 54
REFERENCES ............................................................................................................... I - 56 APPENDIX A. Hydraulic Regional Curves for Selected Areas of the United States PART II REVIEWS OF REPRESENTATIVE STREAM ASSESSMENT AND MITIGATION
PROTOCOLS

I - iv
LIST OF TABLES Table 1. Commonly recommended considerations for monitoring parameters and
protocols. .........................................................................................................I - 13 Table 2. Description of primary stream and riparian functions affecting system
dynamics. .........................................................................................................I - 15 Table 3. Description of primary stream and riparian functions affecting hydrologic
balance. ...........................................................................................................I - 16 Table 4. Description of primary stream and riparian functions affecting sediment
processes and character. ................................................................................I - 17 Table 5. Description of primary stream and riparian functions affecting biological
support. ............................................................................................................I - 18 Table 6. Description of primary stream and riparian functions affecting chemical
processes and pathways. ................................................................................I - 19 Table 7. Interrelationships of primary stream and riparian functions. ............................I - 20 Table 8. General applicability of representative non-regulatory stream assessment
protocols. .........................................................................................................I - 23 Table 9. Individual parameters included in stream assessment protocols. ...................I - 26 Table 10. Stream and riparian zone functions addressed by representative non-regulatory
stream assessment protocols. .........................................................................I - 31 Table 11. Summary of parameters included in representative non-regulatory stream
assessment protocols. .....................................................................................I - 33 Table 12. General applicability of representative regulatory stream mitigation
protocols. .........................................................................................................I - 37 Table 13. Stream and riparian zone functions addressed by representative regulatory
stream mitigation protocols. .............................................................................I - 38 Table 14. Summary of parameters included in representative regulatory stream mitigation
protocols. .........................................................................................................I - 39 Table 15. Summary of stream assessment, monitoring, and mitigation guidance available
from U.S. Army Corps of Engineers Districts nationwide. ...............................I - 41

I - v
Table 16. Comparison of adverse impact factors among U.S. Army Corps of Engineers, Standard Operating Procedures based on the Charleston District SOP for evaluating proposed impacts subject to Clean Water Act, Section 404 regulatory authorization. ...................................................................................................I - 45
Table 17. Comparison of compensatory mitigation factors among U.S. Army Corps of
Engineers, Standard Operating Procedures based on the Charleston District SOP for evaluating proposed mitigation actions to compensate for adverse impacts subject to Clean Water Act, Section 404 regulatory authorization. ....I - 48

I - vi
EXECUTIVE SUMMARY Various stream assessment and stream mitigation protocols in use by federal and state agencies nationwide were compiled and evaluated to determine the degree to which they presented unique, comprehensive procedures to assess primary stream and riparian functions. Thirty two of these protocols were selected for more detailed review in order to identify specific stream and riparian functions or conditions assessed, parameters measured, assessment results obtained, intensity of effort and training needed, use and source of reference condition information, and other factors potentially instructive to parties seeking to review, initiate, or modify stream assessment programs. Approximately 70 unique stream assessment parameters are included as components in one or more of the 32 protocols reviewed for this report. However, the compilation of individual parameters within each of the 32 protocols varies widely. Approximately one-quarter of the 70 parameters appear in fewer than 10% of protocols reviewed. Conversely, only 8 parameters appear in at least half of the protocols reviewed. The 8 common parameters include stream discharge, channel habitat units (bed forms), sinuosity, substrate particle size, bank stability / dominant bank substrate, riparian canopy cover, water temperature, and benthic macroinvertebrates. Only channel habitat units (bed forms) and substrate particle size appear as metrics in at least two-thirds of the protocols reviewed. Indicators of primary stream and riparian functions are not equally represented in most of the stream assessment and stream mitigation protocols reviewed. Three primary functions affecting the hydrologic balance of stream and riparian ecosystems are the least well represented by assessment variables, despite that these functions arguably exert the most influence on the overall functioning of lotic ecosystems. Future revisions to existing protocols or initiatives to develop new protocols may be best served by incorporating considerations of stream and riparian functions early in the process. By first framing the suite of functions desired to be represented, extraneous assessment parameters can be omitted or considered optional, and the allocation of resources necessary to perform the assessment and manage the resulting data will remain as efficient as possible. Bankfull regional curves and indicators of biotic integrity (fish and/or benthic macroinvertebrates) are becoming more and more common throughout the country. However, these tools are often under utilized because their existence is poorly advertised. Any stream restoration project, whether undertaken expressly for compensatory mitigation purposes or not, will likely require some level of regulatory agency authorization. Thus, it is incumbent on those agencies to collectively identify, incorporate, and advertise the existence and utility of stream assessment and restoration design tools compiled by other parties. The complete breadth of stream assessment and restoration research and practical field experience must be better shared in order to maximize the likelihood of implementing physically stable, biologically productive, and ecologically beneficial stream restoration and mitigation projects.

I - 1
1.0 INTRODUCTION Bernhardt et al. (2005) estimate that at least $1 billion has been spent annually on stream restoration projects in the continental United States since 1990. However, after compiling and analyzing the records of over 37,000 stream restoration projects conducted in the United States since 1990 for the National River Restoration Science Synthesis, Bernhardt et al. (2005) concluded that assessing the progress of these efforts either nationwide or regionally is not possible with the reporting information currently available. Only 10% of these project records contain any data documenting site assessment or monitoring (Bernhardt et al., 2005). Thus, despite thousands of projects on the ground, the vast majority of stream restoration projects appear to have been implemented with unclear objectives and insufficient monitoring. A suite of standardized methods and/or procedures to assess the condition of streams is necessary for regulatory authorities and management entities to ensure that stream restoration efforts are being conducted and monitored using the most resolute, unbiased, and comprehensive information possible. Objective, repeatable stream assessments are necessary in order to define contemporary reference stream conditions and performance standards, and to track the development of stream restoration projects towards clearly stated success criteria. Although stream restoration may be undertaken to satisfy a variety of regulatory or non-regulatory objectives, such projects initiated to satisfy the compensatory mitigation requirements of Section 404 of the Clean Water Act (CWA) must be aimed at replacing the aquatic resource functions lost as a result of the permitted activity (33 CFR 332.3(a); 40 CFR 230.93). Furthermore, performance standards based on objective and verifiable stream ecosystem attributes must be used to evaluate whether the project is providing the expected functions (33 CFR 332.5; 40 CFR230.95). This report provides a review of 32 stream assessment protocols and mitigation guidance documents in use by various federal and state government agencies nationwide. It identifies stream functions or conditions assessed, parameters or attributes measured, assessment results obtained, intensity of effort and training needed, use and source of reference condition information, and other factors potentially instructive to parties seeking to review, initiate, or modify stream assessment programs. A similar compendium of stream assessment methods was presented by Somerville and Pruitt (2004) in support of the National Wetlands Mitigation Action Plan released by the George W. Bush Administration on December 26, 2002. Whereas, Somerville and Pruitt (2004) focused exclusively on assessment methods for physical stream habitat and identified attributes that the authors felt were most applicable to the CWA, Section 404 regulatory program, the present compendium is neither limited to any single component of the stream ecosystem, nor does it overtly assign judgment to the protocols’ utility for any single regulatory or non-regulatory objective. This report is not a comprehensive review of every stream assessment tool, but rather a representative compilation that highlights the range of methods used across the country, their commonalities, and differences. Nor is it a compilation and review of biological assessment programs in use by states and tribes as part of water quality standards
I - 2
programs. Criteria for inclusion in this review included, but was not necessarily limited to, the following: • Verifiable contemporary use of the assessment or mitigation protocol by one or more
state or federal agencies, or procedures that have formed the basis for such protocols by March 2010;
• Inclusion of multiple assessment attributes as indicators of multiple stream functions; • Emphasis on objective stream attributes based on actual measurement or estimation in
the field; • Reliance upon, or inclusion of a hierarchical phase that requires, site specific
assessment undertaken at a stream-reach scale, because it is at this scale that most stream restoration projects are focused.
In general, stream mitigation protocols and guidance documents are both fewer in number and narrower in scope than stream assessment protocols. This is likely due at least in part to the fact that stream mitigation protocols are all aimed at addressing the same general set of objectives and standards (i.e. those required by the requirements and regulations of Section 404 of the Clean Water Act). In contrast, stream assessment protocols may be designed to target any number of regulatory or non-regulatory objectives, and the resulting variability in form, scope, and output of these protocols is greater. In many cases, a single stream assessment or mitigation protocol has been adopted or modified by numerous entities in multiple locations nationwide. In such instances, this report attempts to focus on the original procedure and simply references others that have adapted it to local conditions elsewhere. Specific inclusion or omission of any individual method, protocol, or guidance document was a choice solely attributable to the author and does not constitute blanket endorsement or disapproval of such procedures by the U.S. Environmental Protection Agency (USEPA).

I - 3
2.0 HOW TO USE THIS REPORT In lieu of reading this report from beginning to end, users may elect to proceed immediately to the summary tables that outline commonalities among the 32 stream assessment and mitigation protocols reviewed herein, especially tables 8-14. These tables summarize the more detailed reviews of the protocols themselves and also identify the respective stream assessment parameters that differentiate them. Collectively, the tables also permit the user to quickly identify representative assessment or mitigation protocols based either on regions of the country, specific parameters assessed or categories thereof, or primary stream and riparian functions for which those parameters are indicative. In any event, the reader is encouraged to first review Sections 2.0 and 3.0 to understand the terminology and organizational underpinnings of the individual protocol reviews that form the basis upon which the summary tables were developed. 2.1 Definitions of Terms. The following terms are used repeatedly in this report, and in this context refer to the concepts or meanings provided below. Condition: In this report, the definition of condition when used in the context of stream condition is borrowed from the implementing regulations for Section 404 of the Clean Water Act (CWA), which is itself based on an oft cited definition of biological integrity from Karr and Dudley (1981):
“The relative ability of an aquatic resource to support and maintain a community of organisms having a species composition, diversity, and functional organization comparable to reference aquatic resources in the region” (33 CFR 332.2; 40 CFR 230.92).
Function: Federal and state regulatory requirements provide the incentive for a significant proportion of the total number of stream restoration projects undertaken each year in the United States. The federal Endangered Species Act and CWA 404 program each has significant provisions requiring stream restoration and/or management, and numerous states, counties, and municipalities nationwide have statutory provisions encouraging or requiring stream and riparian zone restoration and management. For example, Sudduth et al. (2007) found that approximately one-half of all stream restoration projects in four southeastern states were implemented for compensatory mitigation of a CWA 404 permit. The implementing regulations for the CWA 404 program define functions as:
“the physical, chemical, and biological processes that occur in ecosystems,” (33 CFR 332.2; 40 CFR 230.92)
This definition is especially critical because the level of compensatory mitigation that is determined to be required during the CWA 404 permit review process is to be based on what is practicable and capable of compensating for the aquatic resource functions that will be lost as a result of the permitted activity (33 CFR 332.3; 40 CFR 230.93).

I - 4
Functional Capacity: The term functional capacity is defined in the USACE implementing regulations and the CWA 404(b)(1) Guidelines as the degree to which an area of aquatic resource performs a specific function. Index: An index is a numerical combination of parameters, variables, or attributes that are aggregated to represent either an indicator of function or stream condition. Indicator: An indicator is a characteristic or feature of a stream ecosystem that can be numerically represented based on actual measurements of field conditions, which then represents the relative degree to which that ecosystem may be performing a particular function. Method: In this report, a method is defined as a series of actions, typically presented in a recommended sequential order, for documenting a particular parameter or indicator. Parameter: A parameter (syn. attribute; element; metric; variable) is a specific stream, riparian, or watershed feature that is measured in the field or evaluated using remote sensing techniques, assessment of topographic maps, etc. and which can either individually or collectively be used to detect change in an indicator. Protocol: This report reserves the term protocol (syn. procedure) to represent a defined set of methods compiled to assess or document the condition of stream ecosystems or fundamental components thereof (e.g., fish community, macroinvertebrate community, morphological condition). Reference Conditions: Unless otherwise noted, the term reference conditions in this report represents the least-disturbed physical, chemical and biological conditions across a population of streams and includes an estimate of natural variability. Reference conditions are thereby best represented as a range of least-disturbed conditions exemplified by streams throughout a defined geographic area within which there is a minimal range of variability among the overriding macro-scale influences on stream structure and function (e.g. geology, soils, climate, gradient, elevation, etc.). However, some stream assessment and mitigation protocols define reference condition based on a single site-specific stream or stream reach, in which case reference conditions consist of a more limited number of measurements from that site-specific comparison, and the natural variability among similarly situated local or regional aquatic resources is not accounted for.

I - 5
3.0 ORGANIZATION OF THIS REPORT Part I of this report introduces terminology and the organization of the individual stream assessment and mitigation protocol reviews provided. It also provides a brief introduction to the assessment of stream conditions, identifies common objectives and components of assessment protocols, and explains especially relevant concepts embodied in this report (e.g. reference conditions). Part I concludes with a discussion of the commonalities and differences among the reviewed protocols and includes a number of tables that summarize many of their salient features. These tables are intended to facilitate the user’s search for existing stream assessment and mitigation protocols of interest based on desired target elements of stream ecosystems (e.g. regional location, stream geomorphology, physical stream habitat, biological communities, etc.). Part II of this report consists of individual summaries of 32 selected stream assessment and mitigation protocols in use by various federal, state, and local government agencies nationwide. The reviews are structured according to a standardized template developed for this project, as follows: Name (Catalog No.). This is the name of the protocol or procedure and a unique whole number assigned to it simply to aid in the organization of this report. The sequential ordering of the protocols begins with those designed to be applicable nationwide, and then proceeds in chronological order of the ten regions of USEPA. Primary Author/Agency. Self-explanatory. Electronic Resource. If the documentation for the protocol or procedure is available electronically on the internet, the URL link to the page where the document may be downloaded is provided. Intended Use/Purpose. This entry identifies the original intent for development of the protocol or procedure. In some cases, the original intent for designing the protocol may be its only practicable use, but others may be well suited for additional objectives. The review entry for Intended Use/Purpose generally includes one or more of the following:
Non-Regulatory Condition Assessment. For this report, regulatory protocols are considered only those developed or used to support regulatory decisions pursuant to Section 404 of the CWA or similar state or regional “dredge and fill” laws that regulate physical adverse impacts to jurisdictional lotic waters. Thus, protocols designed for ambient monitoring undertaken to support State 305(b) Reports or development of total maximum daily loads are considered non-regulatory condition assessments in this report, even though these efforts are in fact directly related to regulation. Another example of non-regulatory condition assessment protocols would be those aimed at documenting stream response to land or watershed management activities.

I - 6
Regulatory Assessment (<<law or regulation>>). This category of Intended Use/Purpose is restricted to protocols associated with either the CWA 404 or similar state laws regulating dredge and fill activities in streams and rivers. Assessment and monitoring protocols for dredge and fill regulatory programs must typically consider a suite of programmatic and/or administrative elements in addition to purely technical ones. In consideration of these differences, such protocols are identified independent of others assessment procedures and are in fact clustered as a separate group in Part II of this report (Catalog Nos. 26-32). Parenthetical entries identify the specific law or laws for which the protocol was originally compiled to support.
Compensatory Mitigation Protocol. Compensatory mitigation protocols are those that programmatically define the compensatory mitigation credits necessary to compensate for authorized impacts to similar resources elsewhere. They are also typically used to estimate the number of mitigation credits capable of being generated by proposed mitigative actions. A single regulatory protocol may include both an assessment of condition and mitigation credits, but not all of them do.
Inventory. Stream assessment protocols that are intended primarily as inventories do not necessarily require an evaluation or ranking of stream condition based on value judgments (i.e. this stream is in “better condition” than that one). Instead, inventories may simply document the stream’s state of being. Thus, there may be no need for comparison among regional resources, and consequently no imperative to document or consult reference conditions per se.
Ambient Monitoring. Unlike an inventory, which may not necessarily be repeated on a regular schedule or perhaps even not at all, ambient monitoring programs typically return to the same monitoring stations or watersheds on a regular cycle. Ambient monitoring programs also typically frame assessment of stream condition on regional reference conditions, and monitoring methods themselves may be more apt to consider objectives related to time-series statistical data analysis.
Target Resource Type. Target resource type identifies the type or classification of linear, aquatic feature for which the assessment protocol was ideally developed. Sampling protocols differ for wadeable streams versus non-wadeable streams. Similarly, some methods and sampling tools developed for larger wadeable streams may not be applicable for the smallest headwater streams in the drainage network. Scale/Unit of Assessment. Most of the stream assessment and mitigation protocols included here are based on field data collected from the stream-reach scale. A stream reach can theoretically be any length of one’s choosing. However, many stream assessment protocols base the minimum assessment reach length on a multiplier of either channel wetted width or channel bankfull-width. Others simply clarify that the targeted reach must be homogenous in character based on gradient, valley type, or other factors. Geographic Applicability. There is a wide variability among stream ecosystems nationwide due to variations in climate, geology, gradient, land use history, and numerous additional macro-scale influences on stream structure and ecology. Assessment protocols or components thereof developed in one region may or may not be applicable for use in

I - 7
another. This entry identifies the specific region in which the protocol was developed. This review makes no overt attempt to evaluate the potential utility of assessment or mitigation protocols outside of the geographic area for which the author or authors of the protocol based their work. General Level of Effort. This is a subjective evaluation of the relative ease with which a complete assessment can be executed using the target protocol. Factors considered to rate the general level of effort include the overall complexity of the protocol, the level of instructional detail provided, the likely expertise necessary to yield high quality results, and the time necessary to conduct the protocol. Some of these factors are noted by the authors of the protocols themselves, but others are left open to judgment. Ratings are limited to Easy, Moderate, or Intensive. An easy level of effort may require only semi-quantitative estimates or selections from checklists or categories provided, and may take only a couple hours or less to execute in the field. Intensive assessments may entail complete quantitative characterization of the stream’s morphology, physical habitat, and biota (e.g. fish, macroinvertebrates, etc.), and would likely take a team of two or more an entire day or more to complete in the field. A moderate level of effort is reserved for assessment protocols intermediate between these two extremes, and there are clearly ranges of effort embedded within any one of these categorical levels of effort. Assessment Parameters. This section lists the specific parameters included in the assessment protocol. If the assessment protocol includes a categorical characterization of some element of the stream or riparian corridor via a checklist or narrative description, this may not be reflected in these lists, and would instead be referenced in the protocol Description/ Summary. Likewise, if an index is required to be evaluated in the field (e.g. the physical habitat assessment component of the USEPA rapid bioassessment protocols (Barbour et al., 1999)), the index itself is referenced, but generally not each of the individual parameters used to tally the index. For ease of comparing one protocol to others, the assessment parameters are listed under the following categorical headings: Channel/Valley Morphology, Physical Habitat, Water Quality, Biology, and Other. Resolution. Resolution refers to the potential accuracy and precision of data produced as a result of the assessment protocol and can include any one or more of the following: Qualitative, Semi-Quantitative, and Quantitative. Qualitative assessment data includes narrative descriptions or categorical checklists where one category is not necessarily deemed any more or less beneficial or important than another (e.g. dominant vegetative species in the riparian zone). Semi-quantitative assessment data may be produced as a result of selections made from ordinal or ranked classes or scales, where for example one condition class is considered more beneficial than another class. Many rapid, visual-based habitat assessment indices are considered semi-quantitative in this review. Quantitative assessments ideally provide the most robust and accurate data, while also minimizing potential observer bias. For example, measures or estimates conducted at defined locations along a stream reach (i.e. transects) are considered quantitative measures.
I - 8
Output. This entry characterizes the type of information that results from use of the assessment protocol, which can generally include one or more of the following:
Condition Assessment. The assessment results in a numerical representation of the relative ability of a stream to support and maintain a community of organisms having a species composition, diversity, and functional organization comparable to reference aquatic resources in the region (33 CFR 332.2; 40 CFR 230.92). Generally, a Condition Assessment includes at least a fundamental evaluation of physio-chemical conditions in the stream, as well as aquatic biota, physical habitat, and geomorphic components of the stream and riparian zone.
Index (e.g. numeric score). An index is a numerical value based on one or more components of an ecosystem that represents the condition of that ecosystem. Thus, indices must incorporate some value judgments, either based on quantitative reference data or professional opinion, in order to provide context for the meaning of the index itself. Numerical indices are often correlated with a narrative description of these values. For example, a score in the range of 16 to 20 out of a maximum score of 20 may be considered representative of “optimal” conditions.
Qualitative Description. Assessment protocols that are based solely on qualitative descriptions have not been intentionally included in this review for previously cited concerns regarding subjectivity and precision. None the less, even assessment protocols based primarily on quantitative data often include narrative descriptions to provide further insight into the condition of the stream, its riparian zone, and/or its watershed, or to otherwise convey observations made in the field that data and/or data sheets fail to portray clearly.
Raw data. Many assessment protocols included in this review result in raw, quantitative data. However, some protocols also aggregate portions of this data into one or more indices.
Programmatic or Regulatory Support Information. Many protocols in use by dredge and fill regulatory programs utilize the results of assessment protocols to support regulatory decisions, such as mitigation requirements based on unit-length or area, compensatory mitigation ratios, or unitless mitigation credits.
Reference. This entry identifies the manner in which the target protocol designates reference conditions. In some cases, protocols do not specifically clarify the manner in which reference conditions should be defined, or they may not address reference conditions at all (e.g. protocols intended as tools for conducting inventories). In such cases, the Reference entry is noted as Not Applicable (N/A). Internal reference conditions are sometimes “built in” to a protocol when that protocol results in an index representing stream condition (i.e. an index that is already calibrated to existing local or regional reference data). In contrast, site specific or project specific reference conditions are identified as Measured External Reference. Finally, some protocols assume a reference condition based on the knowledge and experience of the practitioner using the protocol, and these are labeled as Best Professional Judgment.

I - 9
QA/QC. Specific recommended practices for quality assurance and quality control (QA/QC) may include training, auditing, repeat site visits, and cross-checking data entry. This review cites only explicit reference to QA/QC by the author(s) of the protocol. Other factors that may enhance QA/QC, including clearly detailed instructions for executing a protocol, sample field data sheets, and minimizing the use of subjective decision making. Description/Summary. A narrative description of the protocol is provided in the Description/Summary that includes objectives and/or limitations stated by the author(s), if applicable. The protocol summaries do not provide enough information to execute the protocol, but should aid the identification of specific protocols that the user wishes to investigate further. Expertise Required. Specific expertise required or recommended by the author(s) of the protocol. Time Necessary to Conduct Assessment. Approximate amount of time necessary to fully execute the protocol in the field, if so noted by the author(s). Seasonality. Time of year during which the protocol should be undertaken, if so noted by the author(s). Related Procedures/References. Most stream assessment protocols include bibliographies citing the original sources of specific methods that have been included or modified as part of the protocol. This section in each protocol review is not intended to replicate these bibliographies. Instead, it highlights the most pertinent related documents that enhance the clarity of the program for which the protocol was developed, provide critical supporting information or data upon which the protocol was based, or that share significant components of the protocol under review. Other/Notes. Any pertinent observations concerning the protocol that are not captured in the above sections of the review may be included here.
I - 10
4.0 BACKGROUND 4.1 Objectives for Stream Assessment. Stream assessments may be undertaken to satisfy any number of regulatory or non-regulatory objectives. Assessments may be inventories of stream condition or biological populations aimed at supporting management policies or practices. They may be implemented to classify different resources into groups for allocation of resources, policy, regulatory, or educational purposes. Stream assessments may also be used to document conditions pursuant to regulatory permitting programs, such as Section 404 of the CWA, or other statutory provisions (e.g. federal Endangered Species Act). Compensatory mitigation for authorized impacts to federally jurisdictional waters is a fundamental component of the CWA 404 regulatory program, which regulates the discharge of dredged or fill material into jurisdictional waters of the United States. Consistent with the mitigation policies outlined in the Council on Environmental Quality regulations (40 CFR 1508.20) and the CWA Section 404(b)(1) Guidelines (40 CFR 230), mitigation is defined as the establishment, restoration (re-establishment and rehabilitation), enhancement, or in exceptional circumstances, preservation, of aquatic resources undertaken expressly for the purpose of compensating for authorized impacts to similar resources elsewhere. A perceived lack of accountability for compensatory mitigation, as well as poor data collection and availability have been among the most consistent criticisms of the compensatory mitigation program (Zedler and Weller, 1990; NRC, 2001; ELI, 2004; Bernhardt et al., 2005). There has also been considerable debate regarding which specific features or processes of stream ecosystems should be monitored for restoration projects, how to actually measure them in the field, and how to assess the resulting data (Nagle, 2007). There are now hundreds of methods and procedures designed to assess or catalogue a variety of physical and biological attributes of stream ecosystems (see reviews in Bain et al., 1999; Johnson et al., 2001; NRCS, 2001, 2007; Somerville and Pruitt, 2004; Stolnack et al., 2005). Paulsen et al. (2008) observe that biological stream assessment field protocols and assessment tools have become so well developed and accessible that unique protocols and condition indices are now often developed by federal, state, and local government agencies and private organizations for each new study. This profusion of assessment methods and protocols may only exacerbate long-standing criticism citing the lack of consistent assessment standards which limits the transferability of data between parties or programs (Diamond et al; 1996; 1998). However, since the 2008 Final Mitigation Rule (73 FR 70:19594-19705), USACE regulations and the CWA 404(b)(1) Guidelines have required that applicants for CWA 404 permits provide a detailed mitigation plan. That plan must explain the mitigation site selection process, provide baseline ecological information for both the proposed mitigation site and the proposed impact site, describe the mitigation work plan, outline a long-term monitoring plan based on objective and verifiable performance standards, and identify a management plan that ensures long-term stewardship of the mitigation site. For proposed stream mitigation projects, the mitigation work plan must also include planform geometry and channel form (i.e. cross-sectional dimensions).

I - 11
4.2 Components of Stream Assessment. Objective, quantifiable, and reproducible assessments of stream condition are required in order to collect the long-term data necessary to measure the benefits of stream restoration projects, to allow society to assess the effectiveness of the CWA 404 program, to inform future policy and management decisions, and to ultimately improve on our efforts to intervene with targeted activities for the ecological benefit of stream ecosystems (NRC, 2001; Somerville and Pruitt, 2004; Paulsen et al., 2008). USACE regulations and the CWA 404(b)(1) Guidelines require objective and verifiable ecological performance standards for compensatory mitigation projects that are based on measures of functional capacity, hydrology, or other aquatic resource characteristics, and/or comparisons to reference resources of similar type and landscape setting (33 CFR 332.5; 40 CFR 230.95). The use of biological monitoring data to reflect ambient environmental conditions has gained widespread acceptance. In 1998, USEPA made it a national priority for state and tribal water quality standards programs to adopt biocriteria to better protect aquatic life in all waters where biological assessments methods were available (USEPA, 1998). The 2002 National Wetlands Mitigation Action Plan specifically requested that the signatory federal agencies evaluate the effectiveness of using biological indicators as tools for assessing mitigation efforts, and the 2008 Final Mitigation Rule cited the agencies’ collective ambitions to move towards using functional and condition assessments. Whereas biological variables tend to be seasonally variable, sometimes labor intensive, and often require specialized expertise to sample properly, physical stream features are relatively stable over short time frames in all but the most perturbed stream environments, are relatively easy to measure in the field, and provide a tangible resource for decision making, management, and restoration plans (Johnson et al., 2001; Roper et al., 2002). Habitat assessment indices are nearly ubiquitous in stream condition assessment procedures undertaken as part of ambient monitoring programs. However, these assessment indices are often only visual-based, subjective inventories of physical and/or stream habitat features. USEPA (2002) reports that 30 U.S. States fail to include any form of quantitative measurements in the habitat assessment component of their biological assessment programs, and Fritz et al. (2006) posit that there is not a universally accepted index or procedure to rate the condition of stream physical habitat. While the habitat assessment component of the USEPA Rapid Bioassessment Protocols (Barbour et al., 1999), or slight variants thereof, is arguably the most common rapid visual-based habitat assessment index used as part of bioassessment programs, Asmus et al. (2009) argue that measures of physical channel stability instead of stream habitat would better compliment biological stream assessments. Benefits for measures of channel stability cited by the authors include an enhanced capacity to select reference conditions and better documentation of baseline conditions from which changes over time may be monitored (Asmus et al., 2009).
I - 12
Water quality parameters commonly incorporated into stream assessment and mitigation protocols include in-situ physiochemical parameters, such as temperature, dissolved oxygen, pH, turbidity, and conductivity, as well as analytical parameters. The specific analytes targeted may include common nutrients (e.g. nitrogen and phosphorus), total suspended solids, and any number of additional analytes of local or regional importance. However, like geomorphology, the inclusion of water chemistry components in stream assessment protocols varies considerably. 4.3 Reference Conditions. Reference conditions provide the context with which the condition or outcome of any observation or measurement can be compared to other similar observations. Consequently, the proper documentation of reference conditions is vital to any program seeking to assess changes to natural resources over time. Most ambient stream monitoring programs utilize the concept of least disturbed conditions. Such an approach accepts the fact that all (or most) aquatic resources have been adversely impacted to some degree over time, even by influences beyond watershed borders (e.g. as a result of acid rain), making so-called pristine conditions impractical. Even streams that appear superficially intact (e.g., well developed riparian zone; no obvious physical channel instability) can remain in a state of biological recovery for many decades following anthropogenic activities in the watershed (Harding et al., 1998). Thus, a multi-faceted evaluation of reference conditions, based on biological, chemical, and physical / geomorphological characteristics measured in similarly situated streams throughout a defined region or watershed, is desired in lieu of relying on any single characteristic of stream ecosystems. While physical stream restoration designs have often been based on channel characteristics measured at a single reference site, the use of reference reach databases and composite data sets are becoming more popular. In addition, regional hydraulic geometry relationships (regional curves) are becoming more commonly available tools to aid stream channel restoration design and planning. Regional curves are statistical relationships of the bankfull channel discharge and dimensions (area, width, and mean depth) as a function of the stream’s drainage area. When such relationships are determined for multiple streams with varying watershed sizes within a defined geographic area, empirically derived regression equations can be developed and used to assist the design of stream restoration projects in the region for which the regional curves are valid. Similarly, ambient stream monitoring programs are more commonly adopting the principal of reference conditions based on multiple sites within a watershed or ecoregion in lieu of a single site-specific reference. Restricting the geographic range of these multiple sites to a single ecoregion, watershed, or other defined geographic area within which there is a minimal range of variability of overriding influences on stream structure and function minimizes the natural variability captured by the reference sites. Within even a single ecoregion, additional stratification of reference sites based on such factors as watershed size or channel gradient may further refine and narrow the range of variation among reference streams, and thereby strengthen the utility of the reference data as a basis for restoration design and/or performance standards. In any event, the use of multiple reference sites defines a range of reference conditions in lieu of reliance upon data from a single reference site that may or may not reflect conditions near the median of the natural variability expressed throughout an ecoregion.
I - 13
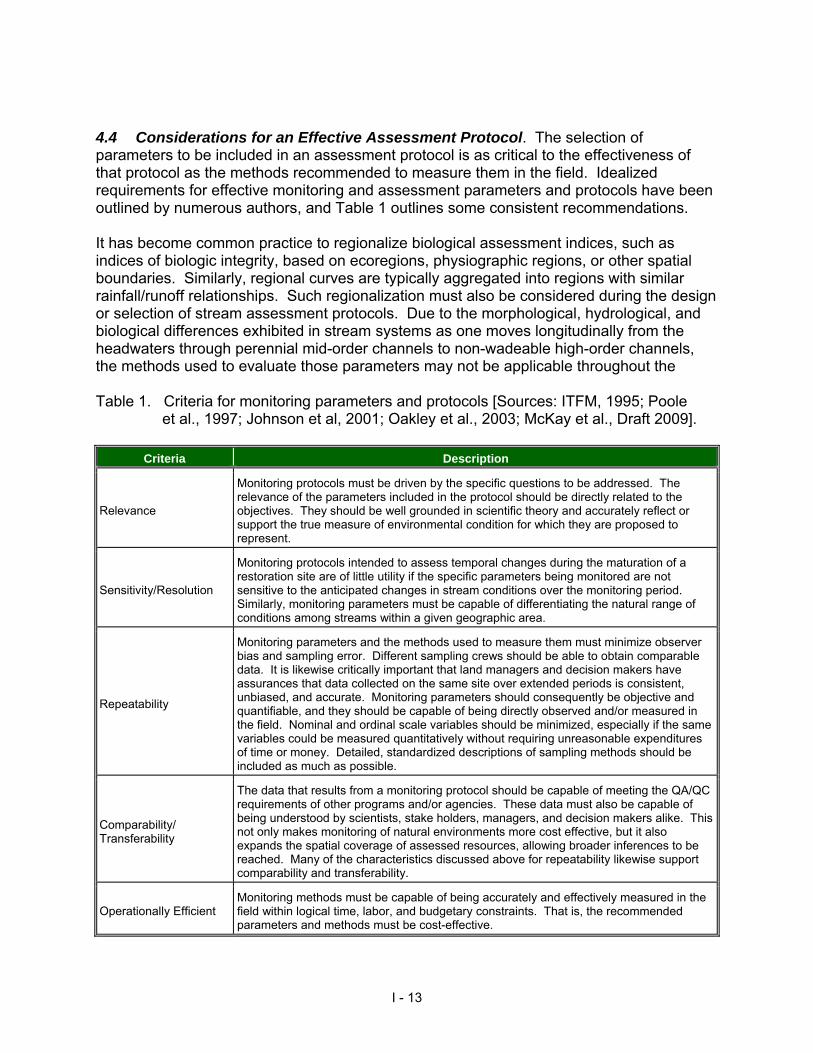
4.4 Considerations for an Effective Assessment Protocol. The selection of parameters to be included in an assessment protocol is as critical to the effectiveness of that protocol as the methods recommended to measure them in the field. Idealized requirements for effective monitoring and assessment parameters and protocols have been outlined by numerous authors, and Table 1 outlines some consistent recommendations. It has become common practice to regionalize biological assessment indices, such as indices of biologic integrity, based on ecoregions, physiographic regions, or other spatial boundaries. Similarly, regional curves are typically aggregated into regions with similar rainfall/runoff relationships. Such regionalization must also be considered during the design or selection of stream assessment protocols. Due to the morphological, hydrological, and biological differences exhibited in stream systems as one moves longitudinally from the headwaters through perennial mid-order channels to non-wadeable high-order channels, the methods used to evaluate those parameters may not be applicable throughout the Table 1. Criteria for monitoring parameters and protocols [Sources: ITFM, 1995; Poole
et al., 1997; Johnson et al, 2001; Oakley et al., 2003; McKay et al., Draft 2009].
Criteria Description
Relevance
Monitoring protocols must be driven by the specific questions to be addressed. The relevance of the parameters included in the protocol should be directly related to the objectives. They should be well grounded in scientific theory and accurately reflect or support the true measure of environmental condition for which they are proposed to represent.
Sensitivity/Resolution
Monitoring protocols intended to assess temporal changes during the maturation of a restoration site are of little utility if the specific parameters being monitored are not sensitive to the anticipated changes in stream conditions over the monitoring period. Similarly, monitoring parameters must be capable of differentiating the natural range of conditions among streams within a given geographic area.
Repeatability
Monitoring parameters and the methods used to measure them must minimize observer bias and sampling error. Different sampling crews should be able to obtain comparable data. It is likewise critically important that land managers and decision makers have assurances that data collected on the same site over extended periods is consistent, unbiased, and accurate. Monitoring parameters should consequently be objective and quantifiable, and they should be capable of being directly observed and/or measured in the field. Nominal and ordinal scale variables should be minimized, especially if the same variables could be measured quantitatively without requiring unreasonable expenditures of time or money. Detailed, standardized descriptions of sampling methods should be included as much as possible.
Comparability/ Transferability
The data that results from a monitoring protocol should be capable of meeting the QA/QC requirements of other programs and/or agencies. These data must also be capable of being understood by scientists, stake holders, managers, and decision makers alike. This not only makes monitoring of natural environments more cost effective, but it also expands the spatial coverage of assessed resources, allowing broader inferences to be reached. Many of the characteristics discussed above for repeatability likewise support comparability and transferability.
Operationally Efficient Monitoring methods must be capable of being accurately and effectively measured in the field within logical time, labor, and budgetary constraints. That is, the recommended parameters and methods must be cost-effective.

I - 14
drainage network. Further, a stream assessment protocol developed in more temperate regions of the country may not be directly applicable to more arid regions without regionalization of assessment parameters and/or methods. Focusing attention on a defined set of primary stream functions may be the most logical way to approach the development of standardized assessment protocols. In recognition of the differing physical, chemical, and biological conditions to be expected throughout a drainage network, as well as climatic and geologic variability across the country, focusing on indicators of functions rather than parameters or methods per se may yield the highest possible level of consistency and transferability of stream assessment data between regions. 4.5 Stream Condition and Function. USEPA’s Science Advisory Board defines condition assessment as a characterization of the health or condition of an entire population or ecosystem based on a suite of measures evaluated and reported in combination (USEPA SAB, 2000). However, function connotes a process integrating time, whereas condition might more traditionally refer to a manner or state of being reflected at a “snapshot” in time. The term functional assessment may be defined as the measurement of one or more individual ecosystem processes (e.g. primary production) that would suggest the need to account for temporal change and would not necessarily be synonymous with SAB’s definition of condition assessment. Measuring multiple ecosystem functions (vis a vis processes) over time may demand a considerable expenditure of resources that is likely beyond the scope of many stream assessment programs. This is in large part why the identification and use of appropriate indicators, from which function is inferred, is such a fundamental first step in the development of “functional assessment” procedures (Smith et al., 1995; Fischenich, 2006). In this way, assessing function essentially becomes an assessment of condition with a built in inference of processes occurring over time to produce that observed result. Fischenich (2006) notes that specific functions for stream and riparian corridors have yet to be defined in a manner generally agreed upon and suitable as a basis for which management and policy decisions can be made. In an effort to fill this need for the U.S. Army Corps of Engineers (USACE) Ecosystem Restoration and Urban Flood Damage Reduction programs, an international committee of scientists, engineers, and practitioners defined 15 key stream and riparian zone functions aggregated into five categories (Fischenich, 2006) and included indicators and field measurements useful to document each function (Tables 2-6). Fischenich (2006) further outlines the interrelationships of each function to one another by defining which functions would be affected either directly or indirectly as a result of perturbations to any single other function (Table 7). For example, an alteration to the hydrodynamic character of a stream (function #6) either directly or indirectly affects all other functions, whereas changes to stream habitat (function #11) affects only three other functions. In this way, Fischenich (2006) not only provides a relative hierarchy defining the influence of each function on other stream processes, but he also presents a means to evaluate the capacity of existing stream assessment and mitigation protocols to provide effective inference into the complete suite of functions for stream ecosystems.

I - 15
Table 2. Description of primary stream and riparian functions affecting system dynamics (Fischenich, 2006).
Functions Description Indicators Measurements
1 Maintain stream evolution processes
• Necessary process to maintain appropriate energy levels in the system.
• Promotes normally occurring change necessary to maintain diversity and succession.
• Provides for genetic variability and species diversity of biotic communities.
Systemic changes to channel cross-section, planform, or grade.
Magnitude, frequency, and duration of flow changes.
Bed armoring or sorting. Evidence of bed erosion or deposition.
Bank erosion. Diverse riparian vegetation and
aquatic biota. Presence of pioneer vegetation
species. Stream stability. Changes in the composition of
the aquatic community.
Stability assessment techniques that quantify bed and bank stability.
Channel evolution model stage and change.
Rates of change of channel geometry parameters.
Time-series aerial photo analysis of stream pattern.
Quantity, densities, ages, types, % cover of different vegetation.
Abundance and distribution of pioneer species, as well as rate of succession.
Flood history polygons (exceedance intervals).
Other disturbance process measures (e.g., fire).
2 Energy management processes
• Spatial and temporal variability in cross section, grade, and resistance allows for conversion between potential energy and kinetic energy through changes in physical features, hydraulic characteristics, and sediment transport processes.
• Provides habitat, generates heat, oxygenates flows.
Changes in physical stream features, such as width, depth, slope, and bed and/or bank roughness.
Changes in flow state or condition.
Erosion/deposition pattern change.
Alternate and diverse reach classifications (riffle, pool, run).
Watershed disturbance patterns.
Changes in terrestrial and aquatic biota
Determine energy grade line and hydraulic grade line and compare with bed slope at different flows.
Quantify variability in physical stream features or hydraulic features along the channel and compare to reference channels.
Measure channel/floodplain constrictions.
3 Provide for riparian succession
• Changes in vegetation structure and age promote diversity and ecological vigor by initiating change, which is important to long-term adaptation of ecosystems
• Zones of mature riparian vegetation are necessary for system stability, LWD recruitment, and nutrient cycling.
Presence of pioneer species. Diversity of vegetation. Varied age classes. New sediment deposition and
active erosion.
Measures of species diversity, composition, age, and structure.
Riparian zone width. Seedling distribution. LWD recruitment rate.
(Reproduced with permission of the author)

I - 16
Table 3. Description of primary stream and riparian functions affecting hydrologic balance (Fischenich, 2006).
Functions Description Indicators Measurements
4 Surface Water storage processes
• Provides temporary water storage during high flows.
• Regulates discharge and replenishes soil moisture.
• Provides pathways for fish and macroinvertebrate movement.
• Provides low-velocity habitats.
• Maintains base flow and soil moisture.
• Provides contact time for biogeochemical processes.
Presence of perennial floodplain topographic features, such as floodplain lakes, ponds, oxbows, wetlands, and sloughs.
Riparian wetlands, depressions, and microtopographic changes in active floodplain.
Presence of floodplain spawning fishes. Presence of macroinvertebrate and amphibian indicator species. Watershed % impervious surface.
Riparian debris patterns. Detrital accumulations.
Backwater computations. Hydrologic routing models. Stream entrenchment surveys. Rating curves. Floodplain species spawning
success. Topographic surveys.
Infiltration rates, compaction surveys.
Gage and well records.
5 Maintain surface / subsurface water connections and processes
• Provides bi-directional flow pathways from open channel to subsurface soils.
• Allows exchange of chemicals, nutrients, and water.
• Moderates low and high in-channel flows. .. Provides habitat and pathways for organisms.
• Maintains subsurface capacity to store water for long durations.
• Maintains base flow, seasonal flow, and soil moisture.
Invertebrates found in the hyporheic zone under floodplains.
Presence of floodplain topographic features that connect the channel to groundwater recharge areas by free-draining soils.
Occurrence of flows sufficient to allow connection.
Presence of layers of silt or organics in soil profile.
Moist soil conditions, hydrophytic vegetation.
Adjacent wetlands, hydric soil indicators.
Groundwater elevation fluctuations.
Watershed % impervious surface.
Flux in groundwater levels. Stream baseflow. Hyporheic macroinvertebrate
distribution, density, and diversity.
Complexity of microtopography.Isotope dating. Soil porosity. Water chemistry profiles. Temperature recording. Texture, structure, moisture,
redox, and porosity of adjacent soils.
6 General hydrodynamic balance
• ·Rivers have a unique hydrologic signature important in ensuring proper flow conditions at the appropriate seasons for support of the biotic environment.
Presence of an active floodplain.
Associated wetlands. Redoximorphic features and
other indicators of hydric soils.
Hydrophytic vegetation, drift line, and sediment deposits at appropriate elevations.
Flow duration analyses. Rating curves. Spawning success.
(Reproduced with permission of the author)

I - 17
Table 4. Description of primary stream and riparian functions affecting sediment processes and character (Fischenich, 2006).
Functions Description Indicators Measurements
7 Sediment continuity
• Provides for appropriate erosion, transport, and deposition processes.
• Maintains substrate sorting and armoring capabilities.
• Provides for the establishment and succession of aquatic and riparian habitats
• Important part of nutrient cycling and water quality maintenance
Bed sediment character. Evidence of recent channel or
floodplain sediment and detrital deposits.
Recent bed or bank erosion. Channel planform, section, or
grade changes. Active bars. Changes in supply, erosion and
deposition patterns. Diversity in aquatic and riparian
biota. Watershed disturbance patterns. Composition and diversity of
macroinvertebrates. Changes in magnitude, duration,
or frequency of flow.
Bed material sediment loads and gradations.
Suspended sediment load assessments.
Stability assessment techniques.
Temporal changes in channel geometry.
Sediment yield measures. Sediment transport modeling
and/or incipient motion analysis.
Lower bank angle surveys. Stream bed core sampling.
8 Maintain substrates and structural processes
• Stream channels and riparian zones provide substrates and structural architecture to support diverse habitats and biotic communities
• Complex habitats naturally attenuate the effects of irregular disturbance processes such as fire and floods.
Presence and health of indigenous biota.
Distribution, abundance, health and diversity of biota.
Relative complexity of substrates. Structural complexity and
distribution. Abundance and distribution of
large woody debris. Habitat diversity and complexity. Population trends of indicator
species. Disturbance history.
Presence, composition, frequency, and distribution of physical characteristics such as pools, riffles, bedforms, specific depths and velocities, cover and substrate features, riparian corridor widths, etc.
Aquatic and riparian habitat assessment methods such as PHABSIM, RCHARC, RBPS, HEP, IBIs.
Distribution and frequency of key physical parameters.
Riparian and in-channel woody debris surveys.
Aquatic macrophyte surveys. Periphyton samples. Stream substrate composition. Soil compaction, displacement,
or erosion. Detrital mass surveys. Bacterial counts. Fungal surveys. Fire and flood history mapping.
9 Quality and quantity of sediments
• Organisms often evolve under specific sediment regimes and these must be preserved for the ecological health of the system.
• Sediment yield and character are primary variables in determining the physical character of the system
Change in banks, pools, and bars acceptable relative to other similar streams.
Distribution, abundance, health, and diversity of biota. Presence of indicator species.
Sediment grain size distribution.
Embeddedness. Sediment yield. Bedload. Suspended sediment load. Sediment concentration. Secchi depth. Armor layer size and
thickness. Depth to bedrock. Sediment mineralogy. Macroinvertebrate surveys. Redd counts.
(Reproduced with permission of the author)

I - 18
Table 5. Description of primary stream and riparian functions affecting biological support (Fischenich, 2006).
Functions Description Indicators Measurements
10 Support biological communities and processes
• Provides for diverse assemblages of native species.
• Maintains natural predator/prey relationships.
• Maintains healthy physiological conditions of biotic communities.
• Maintains genetic diversity.• Maintains age class and
life form structures. • Provides for natural
reproduction and long-term biotic persistence.
Changes in population trends. Changes in health or condition of
individuals or populations. Abnormal behaviors. Unbalanced predator/prey
communities. Changes in growth or reproduction.Unbalanced age class or life form
structures. Unusual species occurrence
outside of normal ranges or preferred habitats.
Presence of non-native species. Hybridization.
Population and individual growth rates and condition factors.
Disease histories, bacterial and viral profiles.
Species diversity and other IBIs. Species assemblages relative to
reference conditions. Viability analyses. Population surveys, including
density, age-class structure, life-form composition, etc.
Bioassays. Stomach content analyses. Genetic testing and mapping. Species distribution relative to
Reference. 11 Provide
necessary aquatic and riparian habitats
• Produces and sustains habitats to support vigorous aquatic and riparian biotic communities.
• Provides for basic food, air, light, water and shelter needs of dependant species.
• Provides habitats suitable for reproduction.
• Supports migration and staging areas.
• Provides key temporal habitats during periods of population stress.
Presence/absence/complexity of habitat features.
Presence/absence/health of key indicator species, and native, non-native, surrogate, or invasive species.
Observations of surrogate signs: remains, nests, dens, trails, feces, fur, prints, etc.
Evidence of predator/ prey or reproductive, cooperative, or social behaviors.
Presence of critical microhabitat features.
Distribution, diversity, and quality of habitats throughout species ranges and over time.
Secure recruitment pathways. Disease, extreme population
fluctuations.
Measures from Rapid Stream Assessment Procedure, or other habitat modeling such as RCHARC, PHABSIM, HEP.
Comparison of biotic counts to reference Indices of Biotic Integrity (IBI).
Composition, structure, extent, variability, diversity, abundance of habitat features, key indicator species, native, non-native, surrogate, or invasive species relative to reference conditions.
Habitat suitability, complexity, and diversity measures/models. Limiting habitat factor surveys.
Refugia network mapping. Terrestrial and aquatic temperature
studies. Corridor connectivity assessment. Habitat fragmentation surveys.
12 Maintain trophic structure and processes
• Promotes growth and reproduction of biotic communities across trophic scales.
• Maintains contact time for biotic and abiotic energy processes.
• Maintains equilibrium between primary autotrophs and primary microbial heterotrophs.
• Supports food chain dynamics to convert energy to biomass.
• Supports characteristic patterns of energy cascade and pooling.
• Provides nutrient levels capable of sustaining indigenous biologic communities.
Presence/ absence of producers and consumers.
Evidence of periphyton growth on substrate.
Evidence of detrital shredding and decomposition.
Presence/absence of a balance and variety of nutrients and organisms to convert carbon, nitrogen, and/or phosphorus between forms.
Presence/absence/abundance of snags, previous season’s plants, leaf litter, detritus.
Evidence of detrital shredding and decomposition.
Organic horizon and organic layers in soil.
Presence/absence/abundance of native, non-native, and invasive indicator species.
Aquatic and riparian vegetation density.
Periphyton biovolume. Density, composition, and biomass
of invertebrate consumers, diversity indices, and other IBIs.
Measure of N:P ratios in water. Diversity and composition of
stream biota. Measure of primary productivity. Measure of detritus production,
CPOM, FPOM, DOM. Measure of large woody debris
frequency and density. Comparison of above- and
belowground biomass R/S ratio.Biomass production of stream
dependant species. Biomass profile.
(Reproduced with permission of the author)

I - 19
Table 6. Description of primary stream and riparian functions affecting chemical processes and pathways (Fischenich, 2006).
Functions Description Indicators Measurements
13 Maintain water and soil quality
• Water quality parameters are directly tied to support of biologic community.
• Riparian communities trap, retain, and remove particulate and dissolved constituents of surface and overland flow, improving water quality.
• Regulates chemical and nutrient cycles.
• Controls pathogens and viruses.
• Maintains chemistry and equilibrium conducive to reproduction, behavior, development and sustainability of a diverse aquatic ecosystem.
• Supports important chemical processes and nutrient cycles.
Watershed conditions and disturbance features.
Stream order. Presence/absence/ abundance
of key indicator biota. Presence/absence of trophic
indicators. Abnormal forms or behaviors;
unusual mortalities of indicator species.
Plant, fish, and invertebrate density, diversity, distribution, and health.
Wetland and riparian aerial and positional changes.
Geology and soils - availability of a range of surface textures and areas for reactions.
Presence/ absence of riparian sediment deposits.
Density, diversity, and distribution of microbial, fungal, and invertebrate communities.
Conventional water quality measures (e.g., D.O., pH, conductivity, turbidity, TDS, salinity, temperature, suspended sediment).
Bacterial counts. Metals and trace element
sampling. Nutrient (N, P) tests. Examination of soil profiles. Soil profile elemental
composition surveys. Rates of sediment deposition in
channel and riparian corridor.
Detrital mass surveys. Large woody debris counts. Infiltration rates. Compaction, displacement, and
erosion surveys. Bacterial counts. Trace element sampling. Nutrient (N, P) tests. COM levels.
14 Maintain chemical processes and nutrient cycles
• Provides for complex chemical reactions to maintain equilibrium and supply required elements to biota.
• Provides for acquisition, breakdown, storage, conversion, and transformation of nutrients within recurrent patterns.
Presence of seasonal debris in riparian area.
Presence/ absence of indicator species and their health.
Presence/absence of photosynthesis, fecal matter, biofilms, and decomposition products.
Presence/absence of particulates on vegetation.
Riparian vegetation composition and vigor.
Changes in algae, periphyton, or macrophyte communities.
Changes in trophic indicators.
BOD (CBOD & NBOD) and DOC.
Stable carbon isotope analyses – identify energy pathways.
Cell counts, ATP concentration, respiration rates, uptake of labeled substances.
Water and soil buffer capacity. Complexation. Redox potential. Ion exchange capacity. Adsorption capacity. Dissolution/precipitation rates. Decomposition rates. Plant growth rates, biomass
production.
15 Maintain landscape pathways
• Maintains longitudinal and latitudinal connectivity to allow for biotic and abiotic energy process pathways.
• Serves as barriers, corridors, or buffers to plant and animal migration.
• Provides source and sink areas for maintaining population equilibrium of plant and animal species.
Presence of animal trails along corridor.
Observations of migratory species use.
Flood tolerance of vegetation species on floodplains.
Presence/absence of key indicator species in portions of the adjacent landscape.
Recent deposits of sediments and detrital matter in the riparian corridor.
Distribution, density, diversity, and age class composition of riparian vegetation.
Accumulation of species during high stress periods.
Relative scale of stream to riparian corridor as a function of stream order or slope.
Width, density, and composition of riparian vegetation community.
Frequency and duration of floodplain inundation.
Migratory bird surveys. Measures of sediment
deposition and detrital flux in the riparian corridor.
Migration barrier surveys. Genetic analyses. Canopy cover measurements of
various life forms. Temperature.
(Reproduced with permission of the author)

I - 20
Table 7. Interrelationships of primary stream and riparian functions (Fischenich, 2006).
Stream Function Grouped by Category Functions Directly Affected
Functions Indirectly Affected
System Dynamics
1. Stream Evolution Processes 2, 3, 4, 5, 6, 7, 8, 9, 11, 13, 14, 15 10, 12
2. Energy Management 1, 3, 4, 6, 7, 8, 9, 11 - -
3. Riparian Succession 1, 2, 4, 6, 7, 11, 14, 15 10, 12
Hydrologic Balance
4. Surface Water Storage Processes 2, 5, 6, 7, 11, 13, 14, 15 1, 3, 8, 9, 10, 12
5. Surface/Subsurface Water Exchange 3, 6, 11, 13 4, 10, 12, 15
6. Hydrodynamic Character 1, 2, 3, 4, 5, 7, 8, 9, 10, 11, 13, 14, 15 12
Sediment Processes and Character
7. Sediment Continuity 2, 3, 4, 8, 9, 10, 11, 13 6, 12, 14
8. Substrate and Structural Processes 1, 2, 5, 6, 7, 8, 11 3, 10, 12, 13
9. Quality and Quantity of Sediments 1, 2, 3, 5, 7, 8, 11 6, 10, 12, 15
Biological Support
10. Biological Communities and Processes 3, 11, 12, 13, 14 5, 6, 8, 9, 14, 15
11. Necessary Habitats for all Life Cycles 10, 12, 15 - -
12. Trophic Structures and Processes 10, 13, 14 9
Chemical Processes and Pathways
13. Water and Soil Quality 9, 10, 12, 14 3
14. Chemical Processes and Nutrient Cycles 9, 10, 12 2
15. Landscape Pathways 10, 11, 12, 14 2 (Reproduced with permission of the author.)

I - 21
5.0 METHODS Selection criteria for the 32 stream assessment and mitigation protocols reviewed in Part II of this report limited candidate protocols to those designed for trained professionals having at least a fundamental understanding of the structure and function of lotic waters. This was not intended to diminish the utility of monitoring tools designed for volunteer groups, nor was it meant to discredit or trivialize the dedication of such groups, the diligence with which they undertake their efforts, or the utility of their results. Instead, focus was placed on assessment methods aimed at professional users in recognition that such methods are potentially less subjective, often have a greater reliance on quantitative data, and target more technical components of these ecosystems that should be prerequisite to design and implementation of stream restoration projects. Internet-based searches for information concerning stream monitoring, assessment, restoration, and mitigation form the basis of information presented herein. These searches concentrated on respective state water programs devoted to biological assessment, watershed planning, and water quality certification (CWA Section 401). Similar searches were conducted at numerous federal agency web sites, including, but not limited to each of the 38 USACE District offices nationwide, U.S. Department of Agriculture (e.g. U.S. Forest Service, Natural Resources Conservation Service), and U.S. Department of Interior (e.g. U.S. Fish and Wildlife Service, Bureau of Land Management). There was no overt effort during compilation of this report to directly contact all monitoring or assessment program representatives at any state or federal agency. Previously cited reviews of stream monitoring and assessment procedures provided a baseline literature review from which additional methods were also screened (e.g. Bain et al., 1999; Johnson et al., 2001; NRCS, 2001, 2007; Somerville and Pruitt, 2004; Stolnack et al., 2005).

I - 22
6.0 RESULTS 6.1 Geographic Distribution of Reviewed Protocols. Stream assessment, monitoring, and mitigation approaches have developed at different rates in various regions of the country, which has in turn contributed to an inconsistent distribution of unique assessment and mitigation protocols in use nationwide. This may be attributable to a number of regional differences, including but not necessarily limited to climatic variability, population density, cultural traditions, the presence of marquee aquatic organisms (e.g. salmon in the Pacific Northwest), and other factors influencing public and private sector priorities and resources historically allocated to stream and riparian ecosystems research and regulation. Furthermore, in many instances a single stream assessment or mitigation protocol has been either modified or even adopted without revision for use outside of the geographic area in which it was originally designed and/or tested. In such instances, this report attempts to focus on the original procedure and simply references others that have adopted or modified it for local conditions elsewhere. For protocols designed with national applicability in mind (e.g. USEPA Rapid Bioassessment Protocols), all or portions of the protocol are typically intended by the authors to be regionally calibrated to local conditions. However, in some cases it is not apparent that this has been done. In other instances, a protocol framework is adopted, and it is only the scoring of various indices within that framework that is modified. The USACE Charleston District Standard Operating Procedure for Compensatory Mitigation (USACE Charleston District, 2002) is an example of a stream mitigation protocol that has been adopted and modified by numerous other regulatory entities. Every effort was made to include unique, representative protocols from each region of the country. However, the protocols ultimately selected for review in this report are not spatially distributed evenly. Seven of the 25 non-regulatory protocols have nationwide applicability and were originally designed, published, and/or supported by USEPA, the U.S. Geologic Survey (USGS), or the U.S. Forest Service (USFS). Almost one-half of the remaining non-regulatory protocols reviewed in this report were designed with a focus on stream conditions in the northwestern United States (USEPA Region 10 and parts of Regions 8 and 9). A secondary concentration of protocols reviewed herein comes from states adjacent to the Great Lakes (USEPA Region 5), and the remainder are widely scattered from throughout the rest of country. Interestingly, while the Southeastern United States (USEPA Region 4) is generally under represented among the non-regulatory assessment protocols reviewed in this report, over half of the regulatory mitigation protocols come from this region. 6.2 Non-Regulatory Stream Assessment Protocols. Non-regulatory stream assessment protocols reviewed in this report include five protocols compiled or supported by the USEPA, five by USFS, one by USGS, and 14 additional protocols compiled by various agencies in 11 states (Table 8). The overwhelming majority of these protocols were developed for use in wadeable streams, although at least five of them may be used in intermittent and/or ephemeral streams. In half of the cases (12 of the 25 non-regulatory protocols reviewed), the potential utility of the assessment protocol in non-perennial streams is not specifically addressed by the author(s) (Table 8). Approximately 70 unique stream assessment parameters are included as components in one or more of the 32 protocols reviewed for this report (Table 9). However, the compilation

I - 23
Table 8. General applicability of representative non-regulatory stream assessment protocols.
Cat
alog
N
umbe
r
Title/ Author
Geographic Applicability Target Resource Type
State / Territory
USEPA Region(s)
(E)phemeral, (I)ntermittent, or (P)erennial Description
Programmatic Intended Use / Purpose 1
Overall Level of Effort2
1 Rapid Bioassessment Protocols for Use in Streams and Wadeable Rivers - USEPA (Barbour et al., 1999)
Nationwide All - - Wadeable streams Non-Regulatory Condition
Assessment; Inventory; Ambient Monitoring
Easy to Intensive
2
Revised Methods for Characterizing Stream Habitat in the National Water Quality Assessment Program - USGS (Fitzpatrick et al., 1998)
Nationwide All - - Wadeable and Non-Wadeable streams
Inventory; Ambient Monitoring Moderate to Intensive
3
Field Operations Manual for Assessing the Hydrologic Permanence and Ecological Condition of Headwater Streams - USEPA (Fritz et al., 2006)
Forested temperate
regions All E, I, P Headwater streams (≤ 1
mile2 drainage area) Inventory; Ambient
Monitoring Moderate to Intensive
4
Environmental Monitoring and Assessment Program (EMAP), Physical Habitat Characterization - USEPA (Kaufmann and Robison, 1998)
Nationwide All - - Wadeable streams Non-Regulatory Condition
Assessment; Ambient Monitoring
Moderate
5 Methods for Evaluating Stream, Riparian, and Biotic Conditions - USFS (Platts et al., 1983)
Nationwide All - - Wadeable streams Inventory; Ambient Monitoring Intensive
6 Wadeable Stream Assessment: Field Operations Manual - USEPA (USEPA, 2004; 2006)
Nationwide All P Wadeable perennial streams, generally
1st -3rd order Ambient Monitoring Intensive
7 Watershed Assessment of River Stability and Sediment Supply – Rosgen (2007) / USEPA
Nationwide All - - All streams Non-Regulatory Condition
Assessment; Inventory; Ambient Monitoring
Intensive
8 Stream Geomorphic Assessment Protocol Handbooks - Vermont Agency of Natural Resources (Kline et al., 2003; rev. 2004)
VT 1 - - Wadeable streams Non-Regulatory Condition
Assessment; Inventory; Ambient Monitoring
Moderate to Intensive
9
A Physical Habitat Index for Freshwater Wadeable Streams in Maryland - Maryland Department of Natural Resources (Paul et al., 2002)
MD 3 - - Wadeable streams Non-Regulatory Condition Assessment Easy

Table 8. General applicability of representative non-regulatory stream assessment protocols (continued).
I - 24
Cat
alog
N
umbe
r
Title/ Author
Geographic Applicability Target Resource Type
State / Territory
USEPA Region(s)
(E)phemeral, (I)ntermittent, or (P)erennial Description
Programmatic Intended Use / Purpose 1
Overall Level of Effort2
10
Physical Habitat and Water Chemistry Assessment Protocol for Wadeable Streams Monitoring Sites - Minnesota Pollution Control Agency (2002)
MN 5 - - Wadeable streams
Non-Regulatory Condition Assessment (WQ
Standards); Ambient Monitoring
Moderate
11 Field evaluation manual for Ohio’s primary headwater habitat streams - Ohio Environmental Protection Agency (2002)
OH 5 E, I, P Headwater streams (≤ 1 mile2 drainage area)
Non-Regulatory Condition Assessment (WQ
Standards); Inventory Easy to Moderate
12
The Qualitative Habitat Evaluation Index (QHEI): Rationale, Methods, and Application - Ohio Environmental Protection Agency (Rankin, 1989; OEPA, 2006)
OH 5 P
All streams, but strength of correlation with fish IBI is weaker in headwaters and low-order perennial
streams.
Non-Regulatory Condition Assessment (WQ
Standards); Ambient Monitoring
Easy
13 Guidelines for Evaluating Fish Habitat in Wisconsin Streams - USFS (Simonson et al. (1993)
WI 5 P Wadeable streams Non-Regulatory Condition
Assessment; Ambient Monitoring
Moderate
14 Physical Habitat of Aquatic Ecosystems - Texas Commission on Environmental Quality (2007)
TX 6 I, P
Wadeable and non-wadeable streams,
including intermittent streams with pools
Non-Regulatory Condition Assessment (WQ
Standards); Inventory; Ambient Monitoring
Easy to Moderate
15 Subjective Evaluation of Aquatic Habitats -Kansas Department of Wildlife & Parks (2004)
KS 7 E, I, P All streams Non-Regulatory Condition
Assessment; Inventory; Ambient Monitoring
Easy
16
Effectiveness monitoring for streams and riparian areas: sampling protocol for stream channel attributes - USFS (Heitke et al., 2008)
WA, OR, ID, wMT, neNV,
nwWY 8, 9, 10 - - Wadeable streams Inventory; Ambient
Monitoring Moderate to Intensive
17
R1/R4 (Northern /Intermountain Regions) Fish and Fish Habitat Standard Inventory Procedures Handbook - USFS (Overton et al., 1997)
All or parts of ID, MT,
ND, NV, OR, SD, UT, WA,
WY, eCA
8, 9, 10 P Blue-line streams on
USGS 1:24,000 topographic maps
Inventory Moderate to Intensive
18
Effectiveness monitoring for streams and riparian areas within the Pacific Northwest: stream channel methods for core attributes - USFS (2004)
WA, OR, ID, wMT, neNV, nwWY, nCA
8, 9, 10 - - Wadeable streams Inventory; Ambient Monitoring Moderate

Table 8. General applicability of representative non-regulatory stream assessment protocols (continued).
I - 25
Cat
alog
N
umbe
r
Title/ Author
Geographic Applicability Target Resource Type
State / Territory
USEPA Region(s)
(E)phemeral, (I)ntermittent, or (P)erennial Description
Programmatic Intended Use / Purpose 1
Overall Level of Effort2
19 A Manual of Procedures for Sampling Surface Waters - Arizona Department for Environmental Quality (2005)
AZ 9 - - Wadeable streams Non-Regulatory Condition
Assessment; Inventory; Ambient Monitoring
Intensive
20 Stream Condition Inventory (SCI) Technical Guide - USFS Region 5 (Frazier et al., 2005)
CA 9 P Wadeable perennial streams
Inventory; Ambient Monitoring Intensive
21
Idaho Small Stream Ecological Assessment Framework - Idaho Department of Environmental Quality (Grafe et al. (2002a)
ID 10 - -
Wadeable streams (generally <5th order;
wetted width <15 feet at baseflow)
Non-Regulatory Condition Assessment; Inventory;
Ambient Monitoring Moderate
22
Idaho River Ecological Assessment Framework - Idaho Department of Environmental Quality (Grafe et al. (2002b)
ID 10 P
Non-wadeable streams (generally ≥5th order;
wetted width ≥15 feet at baseflow)
Non-Regulatory Condition Assessment; Inventory;
Ambient Monitoring Moderate
23
Beneficial Use Reconnaissance Program Field Manual for Streams - Idaho Department of Environmental Quality (2007)
ID 10 - - Wadeable streams Non-Regulatory Condition
Assessment; Inventory; Ambient Monitoring
Moderate to Intensive
24 Methods for Stream Habitat Surveys - Oregon Department of Fish and Wildlife (Moore et al., 2008)
OR 10 (I), P Streams Inventory; Ambient Monitoring Moderate to Intensive
25 Stream Inventory Handbook: Level I & II - USFS Region 6 (2009) OR, WA 10 E, I, P Wadeable streams Inventory; Ambient
Monitoring Intensive
1 See Programmatic Intended Use / Purpose category definitions in Section 3.0. 2 Overall Level of Effort. This entry considers only the amount of time reported by the author(s) necessary to complete an assessment. Thus, if even a single parameter is
measured in the field using very detailed procedures, an otherwise rapid protocol may take a great deal of time to complete.

I - 26
Table 9. Individual parameters included in stream assessment and mitigation protocols. ♦
.Assessment Parameter / Metric
Cum
ulat
ive
% Non-Regulatory Stream Assessment Protocols
Regulatory Stream Mitigation Protocols
Catalog Number
% o
f Inc
lusi
on
Catalog Number
% o
f Inc
lusi
on
1 2 3 4 5 6 7 8 9 10 11 12 13 14 15 16 17 18 19 20 21 22 23 24 25 26 27 28 29 30 31 32
Macro-Scale Morphology & Watershed Parameters Stream type classification 22 ♦ ♦ ♦ ♦ ♦ ♦ 24 ♦ 14 Stream evolutionary stage 9 ♦ ♦ 8 ♦ 14 Valley type / confinement 9 ♦ ♦ ♦ 12 0 Stream order 25 ♦ ♦ ♦ ♦ ♦ ♦ ♦ ♦ 32 0 Watershed area 28 ♦ ♦ ♦ ♦ ♦ ♦ ♦ ♦ 32 ♦ 14 Watershed drainage density 6 ♦ ♦ 8 0 Elevation 13 ♦ ♦ ♦ ♦ 16 0 Evidence of channel alteration 25 ♦ ♦ ♦ ♦ 16 ♦ ♦ ♦ ♦ 57 Riparian disturbance / land use 38 ♦ ♦ ♦ ♦ ♦ ♦ ♦ ♦ ♦ ♦ ♦ 44 ♦ 14 Watershed disturbance (e.g. percent impervious surfaces, dominant surrounding land use)
25 ♦ ♦ ♦ ♦ ♦ ♦ 24 ♦ ♦ 29
Stream Reach-Scale Morphology Parameters Stream discharge 50 ♦ ♦ ♦ ♦ ♦ ♦ ♦ ♦ ♦ ♦ ♦ ♦ ♦ ♦ 56 ♦ ♦ 29 Flow velocity 16 ♦ ♦ ♦ ♦ 16 ♦ 14 Water surface gradient 16 ♦ ♦ ♦ ♦ ♦ 20 0 Channel cross-sectional dimensions 31 ♦ ♦ ♦ ♦ ♦ ♦ ♦ 28 ♦ ♦ ♦ 43 Wetted channel width 44 ♦ ♦ ♦ ♦ ♦ ♦ ♦ ♦ ♦ ♦ ♦ ♦ 48 ♦ ♦ 29 Depth 31 ♦ ♦ ♦ ♦ ♦ ♦ ♦ ♦ ♦ ♦ 40 0 Bankfull width 44 ♦ ♦ ♦ ♦ ♦ ♦ ♦ ♦ ♦ ♦ ♦ ♦ ♦ 52 ♦ 14 Bankfull depth 34 ♦ ♦ ♦ ♦ ♦ ♦ ♦ ♦ ♦ ♦ 40 ♦ 14 Floodprone area width 22 ♦ ♦ ♦ ♦ ♦ ♦ 24 ♦ 14

Table 9. Individual parameters included in stream assessment and mitigation protocols (continued).
I - 27
Assessment Parameter / Metric Cum
ulat
ive
%
Non-Regulatory Stream Assessment Protocols Regulatory Stream
Mitigation Protocols
Catalog Number
% o
f Inc
lusi
on Catalog Number
% o
f Inc
lusi
on
1 2 3 4 5 6 7 8 9 10 11 12 13 14 15 16 17 18 19 20 21 22 23 24 25 26 27 28 29 30 31 32
Longitudinal profile (geomorphology survey) 19 ♦ ♦ ♦ ♦ 16 ♦ ♦ 29 Channel gradient 47 ♦ ♦ ♦ ♦ ♦ ♦ ♦ ♦ ♦ ♦ ♦ ♦ ♦ 52 ♦ ♦ 29 Channel habitat units / bed forms: 75 ♦ ♦ ♦ ♦ ♦ ♦ ♦ ♦ ♦ ♦ ♦ ♦ ♦ ♦ ♦ ♦ ♦ ♦ ♦ ♦ 80 ♦ ♦ ♦ ♦ 57 Measured / quantified 44 ♦ ♦ ♦ ♦ ♦ ♦ ♦ ♦ ♦ ♦ ♦ ♦ ♦ 52 ♦ 14 Estimated, inventoried, or tallied 31 ♦ ♦ ♦ ♦ ♦ ♦ ♦ 28 ♦ ♦ ♦ 43 Maximum pool depth 16 ♦ ♦ ♦ ♦ ♦ 20 0 Quantified pool description (e.g. percent pool, residual pool depth, maximum pool depth, pool substrate, etc.)
31 ♦ ♦ ♦ ♦ ♦ ♦ ♦ ♦ ♦ ♦ 40 0
Pool formative features 9 ♦ ♦ ♦ 12 0 Sinuosity 53 ♦ ♦ ♦ ♦ ♦ ♦ ♦ ♦ ♦ ♦ ♦ ♦ ♦ ♦ 56 ♦ ♦ ♦ 43 Meander wavelength 16 ♦ ♦ ♦ ♦ 16 ♦ 14 Full planform survey (radius of curvature, meander belt width, etc.) 16 ♦ ♦ ♦ 12 ♦ ♦ 29
Substrate particle size: 88 ♦ ♦ ♦ ♦ ♦ ♦ ♦ ♦ ♦ ♦ ♦ ♦ ♦ ♦ ♦ ♦ ♦ ♦ ♦ ♦ ♦ ♦ ♦ ♦ 96 ♦ ♦ ♦ ♦ 57 Distribution (measured) 47 ♦ ♦ ♦ ♦ ♦ ♦ ♦ ♦ ♦ ♦ ♦ ♦ ♦ 52 ♦ ♦ 29 Dominance (estimated) 59 ♦ ♦ ♦ ♦ ♦ ♦ ♦ ♦ ♦ ♦ ♦ ♦ ♦ ♦ ♦ ♦ 64 ♦ ♦ ♦ 43 Depth to bedrock 3 ♦ 4 0 Depth to groundwater 3 ♦ 4 0 Rapid Geomorphic Assessment Index 3 ♦ 4 0 Pfankuch 6 ♦ ♦ 8 0 Bank stability / dominant bank substrate 56 ♦ ♦ ♦ ♦ ♦ ♦ ♦ ♦ ♦ ♦ ♦ ♦ ♦ ♦ 56 ♦ ♦ ♦ ♦ 57 Bank height 13 ♦ ♦ ♦ ♦ 16 0
Bank height ratio (BHR) 6 ♦ ♦ 8 0

Table 9. Individual parameters included in stream assessment and mitigation protocols (continued).
I - 28
Assessment Parameter / Metric Cum
ulat
ive
%
Non-Regulatory Stream Assessment Protocols Regulatory Stream
Mitigation Protocols
Catalog Number
% o
f Inc
lusi
on Catalog Number
% o
f Inc
lusi
on
1 2 3 4 5 6 7 8 9 10 11 12 13 14 15 16 17 18 19 20 21 22 23 24 25 26 27 28 29 30 31 32
Bank erodability index 6 ♦ ♦ 8 0 Bank angle 28 ♦ ♦ ♦ ♦ ♦ ♦ ♦ ♦ ♦ 36 0 Bank undercut distance / percentage 25 ♦ ♦ ♦ ♦ ♦ ♦ ♦ ♦ 32 0 In-Stream Physical Habitat Parameters In-stream cover/habitat 47 ♦ ♦ ♦ ♦ ♦ ♦ ♦ ♦ ♦ ♦ ♦ ♦ 48 ♦ ♦ ♦ 43 Bank vegetative cover/protection 41 ♦ ♦ ♦ ♦ ♦ ♦ ♦ ♦ ♦ ♦ 40 ♦ ♦ ♦ 43 Streambed sediment moisture content 3 ♦ 4 0 Embeddedness 38 ♦ ♦ ♦ ♦ ♦ ♦ ♦ ♦ ♦ 36 ♦ ♦ ♦ 43 Sediment deposition (visually estimated) 13 ♦ 4 ♦ ♦ ♦ 43 Coarse / large woody debris 47 ♦ ♦ ♦ ♦ ♦ ♦ ♦ ♦ ♦ ♦ ♦ ♦ ♦ ♦ 56 ♦ 14 Aquatic macrophytic vegetation: 16 ♦ ♦ ♦ ♦ ♦ 20 0 Percent cover 16 ♦ ♦ ♦ ♦ ♦ 20 0 Speciation 3 ♦ 4 0 Habitat Assessment Index: 28 ♦ ♦ ♦ ♦ ♦ ♦ ♦ ♦ 32 ♦ 14 Measured 6 ♦ ♦ 8 0 Estimated (rapid, visual-based) 22 ♦ ♦ ♦ ♦ ♦ ♦ 24 ♦ 14 Riparian Zone Parameters Riparian cover 59 ♦ ♦ ♦ ♦ ♦ ♦ ♦ ♦ ♦ ♦ ♦ ♦ ♦ ♦ ♦ ♦ 64 ♦ ♦ ♦ 43 Measured (e.g. densiometer) 34 ♦ ♦ ♦ ♦ ♦ ♦ ♦ ♦ ♦ ♦ ♦ 44 0 Estimated 25 ♦ ♦ ♦ ♦ ♦ 20 ♦ ♦ ♦ 43 Solar radiation on water surface 6 ♦ ♦ 8 0 Riparian community type 38 ♦ ♦ ♦ ♦ ♦ ♦ ♦ ♦ ♦ ♦ 40 ♦ ♦ 29 Riparian zone width 41 ♦ ♦ ♦ ♦ ♦ ♦ ♦ ♦ ♦ ♦ 40 ♦ ♦ ♦ 43

Table 9. Individual parameters included in stream assessment and mitigation protocols (continued).
I - 29
Assessment Parameter / Metric Cum
ulat
ive
%
Non-Regulatory Stream Assessment Protocols Regulatory Stream
Mitigation Protocols
Catalog Number
% o
f Inc
lusi
on Catalog Number
% o
f Inc
lusi
on
1 2 3 4 5 6 7 8 9 10 11 12 13 14 15 16 17 18 19 20 21 22 23 24 25 26 27 28 29 30 31 32
Riparian species dominance 28 ♦ ♦ ♦ ♦ ♦ ♦ ♦ 28 ♦ ♦ 29 Measured (e.g. basal area, stem density, etc.) 9 ♦ ♦ 8 ♦ 14 Estimated 19 ♦ ♦ ♦ ♦ ♦ 20 ♦ 14 Water Quality Parameters Dissolved oxygen 34 ♦ ♦ ♦ ♦ ♦ ♦ ♦ ♦ ♦ 36 ♦ ♦ 29 Temperature 53 ♦ ♦ ♦ ♦ ♦ ♦ ♦ ♦ ♦ ♦ ♦ ♦ ♦ ♦ ♦ ♦ 64 ♦ 14 Conductivity 47 ♦ ♦ ♦ ♦ ♦ ♦ ♦ ♦ ♦ ♦ ♦ ♦ ♦ 52 ♦ ♦ 29 pH 25 ♦ ♦ ♦ ♦ ♦ ♦ ♦ 28 ♦ 14 Turbidity 25 ♦ ♦ ♦ ♦ ♦ ♦ ♦ 28 ♦ 14 Redox 3 ♦ 4 0 Alkalinity / Acid neutralizing capacity 13 ♦ ♦ ♦ ♦ 16 0 Analytical 16 ♦ ♦ ♦ ♦ ♦ 20 0 Suspended sediment load 3 ♦ 4 0 Bedload 3 ♦ 4 0 Aquatic Biota Parameters Benthic macroinvertebrates 53 ♦ ♦ ♦ ♦ ♦ ♦ ♦ ♦ ♦ ♦ ♦ ♦ ♦ 52 ♦ ♦ ♦ ♦ 57 Fish 41 ♦ ♦ ♦ ♦ ♦ ♦ ♦ ♦ ♦ ♦ ♦ 44 ♦ ♦ 29 Periphyton / Algae 9 ♦ ♦ ♦ 12 0 Bryophytes 3 ♦ 4 0 Amphibians / salamanders 25 ♦ ♦ ♦ ♦ ♦ ♦ ♦ 28 ♦ 14 Mussels 3 ♦ 4 0 Diatoms 6 ♦ ♦ 8 0

I - 30
of individual parameters within each of the 32 protocols varies widely. Approximately one-quarter of the 70 parameters listed in Table 9 appear in fewer than 10% of the protocols reviewed. Conversely, only 8 parameters appear in at least half of the protocols reviewed, including stream discharge, channel habitat units (bed forms), sinuosity, substrate particle size, bank stability / dominant bank substrate , riparian canopy cover, water temperature, and benthic macroinvertebrates (Table 9). Only channel habitat units (bed forms) and substrate particle size appear as metrics in at least two-thirds of all protocols reviewed. Repeating this analysis among only the 25 non-regulatory stream assessment protocols adds four additional parameters (12 total) that are components in at least half of the protocols, including bankfull width, channel gradient, large woody debris, and conductivity (Table 9). Existing stream assessment protocols also differ in their incorporation of applicable indicators and measures for the 15 primary stream and riparian functions outlined by Fischenich (2006). Stream functions related to sediment processes and character are the most well represented functions among the non-regulatory stream assessment protocols reviewed in this report (Table 10). Primary stream and riparian functions related to system dynamics, biological support, and chemical processes and pathways are represented approximately equally, while functions related to the hydrologic balance are the least well represented (Table 10). The latter observation is especially noteworthy considering that two of the three functions that exert the most influence on the overall functioning of lotic ecosystems are hydrologic balance functions: surface water storage processes and hydrodynamic character (Fischenich, 2006) (Table 7). Only one of the 25 non-regulatory stream assessment protocols includes assessment parameters that Fischenich (2006) considered either indicators or measures indicative of all 15 primary stream functions (Table 10). That protocol, “A Manual of Procedures for Sampling Surface Waters” from the Arizona Department of Environmental Quality (ADEQ) was designed by the ADEQ Hydrologic Support and Assessment Section for the collection and management of surface water data and related environmental information for all surface water sample collections performed by ADEQ personnel, ADEQ contractors, environmental organizations, private companies and corporations, and educators (ADEQ, 2005). It is reviewed in this report as Catalog No. 19. The above referenced protocol from ADEQ is also one of the two non-regulatory protocols containing metrics with the greatest “Degree of Coverage” among all of the four main assessment parameter categorical headings used in this report (i.e. Channel/Valley Morphology, Physical Habitat, Water Quality, and Biology) (Table 11). The other protocol is the Beneficial Use Reconnaissance Program Field Manual for Streams, compiled by the Idaho Department of Environmental Quality (IDEQ, 2007), which is reviewed herein as Catalog No. 23. The “Degree of Coverage” rankings in Table 11, which range from 0 to 5, consider both the absolute number of assessment parameters per category (Table 9), as well as the degree to which those parameters are based on objective versus subjective estimates or measures in the protocol. Quantitative, objective measures are given more weight and score higher. Thus, a particular protocol may include many metrics covering a given category, but can still score low in that category if those metrics are all simply visual estimates.

I - 31
Table 10. Primary stream and riparian zone functions addressed by representative non-regulatory stream assessment protocols.
Cat
alog
N
umbe
r
Title / Author
Primary Stream and Riparian Zone Functions 1
System Dynamics
Hydrologic Balance
Sediment Processes
& Character
Biological Support
Chemical Processes
& Pathways
1 2 3 4 5 6 7 8 9 10 11 12 13 14 15
1 Rapid Bioassessment Protocols for Use in Streams and Wadeable Rivers - USEPA (Barbour et al., 1999)
♦ ♦ ♦ ♦ ♦ ♦ ♦ ♦ ♦ ♦ ♦
2
Revised Methods for Characterizing Stream Habitat in the National Water Quality Assessment Program - USGS (Fitzpatrick et al., 1998)
♦ ♦ ♦ ♦ ♦ ♦ ♦ ♦ ♦
3
Field Operations Manual for Assessing the Hydrologic Permanence and Ecological Condition of Headwater Streams - USEPA (Fritz et al., 2006)
♦ ♦ ♦ ♦ ♦ ♦ ♦ ♦ ♦
4
Environmental Monitoring and Assessment Program (EMAP), Physical Habitat Characterization - USEPA (Kaufmann and Robison, 1998)
♦ ♦ ♦ ♦ ♦ ♦ ♦ ♦ ♦ ♦ ♦
5 Methods for Evaluating Stream, Riparian, and Biotic Conditions - USFS (Platts et al., 1983) ♦ ♦ ♦ ♦ ♦ ♦ ♦ ♦ ♦ ♦
6 Wadeable Stream Assessment: Field Operations Manual - USEPA (USEPA, 2004; 2006)
♦ ♦ ♦ ♦ ♦ ♦ ♦ ♦ ♦
7 Watershed Assessment of River Stability and Sediment Supply (WARSSS) - Rosgen (2007)/USEPA
♦ ♦ ♦ ♦ ♦ ♦ ♦ ♦ ♦
8 Stream Geomorphic Assessment Protocol Handbooks - Vermont Agency of Natural Resources (Kline et al., 2003; rev. 2004)
♦ ♦ ♦ ♦ ♦ ♦ ♦ ♦ ♦
9
A Physical Habitat Index for Freshwater Wadeable Streams in Maryland - Maryland Department of Natural Resources (Paul et al., 2002)
♦ ♦ ♦ ♦ ♦
10
Physical Habitat and Water Chemistry Assessment Protocol for Wadeable Streams Monitoring Sites - Minnesota Pollution Control Agency (2002)
♦ ♦ ♦ ♦ ♦ ♦ ♦
11 Field Evaluation Manual for Ohio’s Primary Headwater Habitat Streams - Ohio Environmental Protection Agency (2002)
♦ ♦ ♦ ♦ ♦ ♦ ♦ ♦
12
The Qualitative Habitat Evaluation Index (QHEI): Rationale, Methods, and Application - Ohio Environmental Protection Agency (Rankin, 1989; OEPA, 2006)
♦ ♦ ♦ ♦ ♦ ♦

Table 10. Primary stream and riparian zone functions addressed by representative non-regulatory stream assessment protocols (continued).
I - 32
Cat
alog
N
umbe
r
Title / Author
Primary Stream and Riparian Zone Functions 1
System Dynamics
Hydrologic Balance
Sediment Processes
& Character
Biological Support
Chemical Processes
& Pathways
1 2 3 4 5 6 7 8 9 10 11 12 13 14 15
13 Guidelines for Evaluating Fish Habitat in Wisconsin Streams - USFS (Simonson et al. (1993)
♦ ♦ ♦ ♦ ♦ ♦
14 Physical Habitat of Aquatic Ecosystems - Texas Commission on Environmental Quality (2007)
♦ ♦ ♦ ♦ ♦ ♦ ♦ ♦ ♦ ♦
15 Subjective Evaluation of Aquatic Habitats - Kansas Department of Wildlife & Parks (2004) ♦ ♦ ♦ ♦
16 Effectiveness monitoring for streams and riparian areas: sampling protocol for stream channel attributes - USFS (Heitke et al., 2008)
♦ ♦ ♦ ♦ ♦ ♦ ♦ ♦ ♦ ♦ ♦
17
R1/R4 (Northern /Intermountain Regions) Fish and Fish Habitat Standard Inventory Procedures Handbook - USFS (Overton et al., 1997)
♦ ♦ ♦ ♦ ♦
18
Effectiveness monitoring for streams and riparian areas within the Pacific Northwest: stream channel methods for core attributes - USFS (2004)
♦ ♦ ♦ ♦ ♦ ♦ ♦ ♦ ♦ ♦
19 A Manual of Procedures for Sampling Surface Waters - Arizona Department for Environmental Quality (2005)
♦ ♦ ♦ ♦ ♦ ♦ ♦ ♦ ♦ ♦ ♦ ♦ ♦ ♦ ♦
20 Stream Condition Inventory (SCI) Technical Guide - USFS Region 5 (Frazier et al., 2005) ♦ ♦ ♦ ♦ ♦ ♦ ♦ ♦ ♦ ♦
21 Idaho Small Stream Ecological Assessment Framework - Idaho Department of Environmental Quality (Grafe et al. (2002a)
♦ ♦ ♦ ♦ ♦ ♦ ♦ ♦ ♦
22 Idaho River Ecological Assessment Framework - Idaho Department of Environmental Quality (Grafe et al. (2002b)
♦ ♦ ♦ ♦ ♦ ♦ ♦ ♦
23 Beneficial Use Reconnaissance Program Field Manual for Streams - Idaho Department of Environmental Quality (2007)
♦ ♦ ♦ ♦ ♦ ♦ ♦ ♦
24 Methods for Stream Habitat Surveys - Oregon Department of Fish and Wildlife (Moore et al., 2008)
♦ ♦ ♦ ♦ ♦ ♦ ♦ ♦ ♦ ♦ ♦ ♦
25 Stream Inventory Handbook: Level I & II - USFS Region 6 (2009) ♦ ♦ ♦ ♦ ♦ ♦ ♦ ♦ ♦ ♦ ♦ ♦ ♦ ♦
1 Stream functions are based on Fischenich (2006) which is summarized in Tables 2 thru 6. Inclusion of any given function in this table may be the result of either qualitative or quantitative consideration of applicable indicators.

I - 33
Table 11. Summary of parameters included in representative non-regulatory stream assessment protocols.
Cat
alog
Num
ber
Title / Author
Morphological Habitat Water Quality / Physiochemical Biological
Deg
ree
of
Cov
erag
e1
Res
olut
ion
Out
put
Deg
ree
of
Cov
erag
e1
Res
olut
ion
Out
put
Deg
ree
of
Cov
erag
e1
Res
olut
ion
Out
put
Deg
ree
of
Cov
erag
e1
Res
olut
ion
Out
put
1 Rapid Bioassessment Protocols for Use in Streams and Wadeable Rivers - USEPA (Barbour et al., 1999)
1 Semi-Quantitative
Visual based index
2 Semi-Quantitative
Visual based index
3 Quantitative Data 5 Quantitative Data
2
Revised Methods for Characterizing Stream Habitat in the National Water Quality Assessment Program - USGS (Fitzpatrick et al., 1998)
5 Quantitative Data; Index 5 Quantitative Data 0 N/A N/A 3 Quantitative Data
3
Field Operations Manual for Assessing the Hydrologic Permanence and Ecological Condition of Headwater Streams - USEPA (Fritz et al., 2006)
3
Semi-Quantitative
to Quantitative
Data 3
Semi-Quantitative
to Quantitative
Data 2 Quantitative Data 2 - 4
Semi-Quantitative
to Quantitative
Data
4
Environmental Monitoring and Assessment Program (EMAP), Physical Habitat Characterization - USEPA (Kaufmann and Robison, 1998)
3 Quantitative Data 5 Quantitative Data 5 Quantitative Data 1 Semi-Quantitative Data
5 Methods for Evaluating Stream, Riparian, and Biotic Conditions - USFS (Platts et al., 1983) 5 Quantitative Data 5 Quantitative Data 0 Quantitative Data 5 Quantitative Data
6 Wadeable Stream Assessment: Field Operations Manual - USEPA (USEPA, 2004; 2006)
3 Quantitative Data 4
Semi-Quantitative
to Quantitative
Data; Visual based index
5 Quantitative Data 3
Semi-Quantitative
to Quantitative
Data
7 Watershed Assessment of River Stability and Sediment Supply – Rosgen (2007) / USEPA 5 Quantitative Data;
Index 1 Qualitative to Semi-
Quantitative Data 1 Quantitative Data 0 N/A N/A
8 Stream Geomorphic Assessment Protocol Handbooks - Vermont Agency of Natural Resources (Kline et al., 2003; rev. 2004)
3-5
Semi-Quantitative
to Quantitative
Data; Visual based index
3
Semi-Quantitative
to Quantitative
Data; Visual based index
0 N/A N/A 0 N/A N/A
9
A Physical Habitat Index for Freshwater Wadeable Streams in Maryland - Maryland Department of Natural Resources (Paul et al., 2002)
1 Qualitative to Semi-
Quantitative
Check lists;
Visual based index
2 Qualitative to Semi-
Quantitative
Check lists;
Visual based index
0 N/A N/A 0 N/A N/A

Table 11. Summary of parameters included in representative non-regulatory stream assessment protocols (continued).
I - 34
Cat
alog
Num
ber
Title / Author
Morphological Habitat Water Quality / Physiochemical Biological
Deg
ree
of
Cov
erag
e1
Res
olut
ion
Out
put
Deg
ree
of
Cov
erag
e1
Res
olut
ion
Out
put
Deg
ree
of
Cov
erag
e1
Res
olut
ion
Out
put
Deg
ree
of
Cov
erag
e1
Res
olut
ion
Out
put
10
Physical Habitat and Water Chemistry Assessment Protocol for Wadeable Streams Monitoring Sites - Minnesota Pollution Control Agency (2002)
3
Semi-Quantitative
to Quantitative
Data; Index 4
Semi-Quantitative
to Quantitative
Data; Index 4 Quantitative Data 0 N/A N/A
11 Field Evaluation Manual for Ohio’s Primary Headwater Habitat Streams - Ohio Environmental Protection Agency (2002)
1 Qualitative to Semi-
Quantitative
Visual based index
1 Qualitative to Semi-
Quantitative
Visual based index
0-3 N/A to Quantitative Data 0-4
N/A to Semi-
Quantitative or
Quantitative
Data; Index
12
The Qualitative Habitat Evaluation Index (QHEI): Rationale, Methods, and Application - Ohio Environmental Protection Agency (Rankin, 1989; OEPA, 2006)
1 Qualitative to Semi-
Quantitative
Visual based index
2 Qualitative to Semi-
Quantitative
Visual based index
0 N/A N/A 0 N/A N/A
13 Guidelines for Evaluating Fish Habitat in Wisconsin Streams - USFS (Simonson et al. (1993)
2 Quantitative Data; Index 4
Semi-Quantitative
or Quantitative
Data; Index 3 Quantitative Data 0 N/A N/A
14 Physical Habitat of Aquatic Ecosystems - Texas Commission on Environmental Quality (2007)
2 Quantitative Data; Index 3
Semi-Quantitative
or Quantitative
Data; Index 3 Quantitative Data 1 Semi-
Quantitative Data
15 Subjective Evaluation of Aquatic Habitats - Kansas Department of Wildlife & Parks (2004) 1
Qualitative to Semi-
Quantitative
Visual based index
1 Qualitative to Semi-
Quantitative
Visual based index
1 Qualitative to Semi-
Quantitative
Visual based index
1 Qualitative to Semi-
Quantitative
Visual based index
16 Effectiveness monitoring for streams and riparian areas: sampling protocol for stream channel attributes - USFS (Heitke et al., 2008)
4 Quantitative Data 3 Quantitative Data 1 Quantitative Data 3 Quantitative Data
17
R1/R4 (Northern /Intermountain Regions) Fish and Fish Habitat Standard Inventory Procedures Handbook - USFS (Overton et al., 1997)
1 Qualitative to Semi-
Quantitative
Check lists 3
Qualitative to Semi-
Quantitative
Check lists with
limited data
1 Quantitative Data 3 Quantitative Data (fish)

Table 11. Summary of parameters included in representative non-regulatory stream assessment protocols (continued).
I - 35
Cat
alog
Num
ber
Title / Author
Morphological Habitat Water Quality / Physiochemical Biological
Deg
ree
of
Cov
erag
e1
Res
olut
ion
Out
put
Deg
ree
of
Cov
erag
e1
Res
olut
ion
Out
put
Deg
ree
of
Cov
erag
e1
Res
olut
ion
Out
put
Deg
ree
of
Cov
erag
e1
Res
olut
ion
Out
put
18
Effectiveness monitoring for streams and riparian areas within the Pacific Northwest: stream channel methods for core attributes - USFS (2004)
3 Quantitative Data 3 Quantitative Data 1 Quantitative Data 3 Quantitative Data
19 A Manual of Procedures for Sampling Surface Waters - Arizona Department for Environmental Quality (2005)
5
Semi-Quantitative
to Quantitative
Data; Index 5
Semi-Quantitative
to Quantitative
Data; Index 3 Quantitative Data 4 Quantitative Data;
Index
20 Stream Condition Inventory (SCI) Technical Guide - USFS Region 5 (Frazier et al., 2005) 4 Quantitative Data 4 Quantitative Data 1 Quantitative Data 5 Quantitative Data
21 Idaho Small Stream Ecological Assessment Framework - Idaho Department of Environmental Quality (Grafe et al. (2002a)
0 N/A N/A 1 Semi-Quantitative
Visual based index
0 N/A N/A 5 Quantitative Data; Index
22 Idaho River Ecological Assessment Framework - Idaho Department of Environmental Quality (Grafe et al. (2002b)
0 N/A N/A 0 N/A N/A 5 Quantitative Data; Index 5 Quantitative Data;
Index
23 Beneficial Use Reconnaissance Program Field Manual for Streams - Idaho Department of Environmental Quality (2007)
3 Quantitative Data 5
Semi-Quantitative
to Quantitative
Data; Visual based index
3 Quantitative Data 5 Quantitative Data; Index
24 Methods for Stream Habitat Surveys - Oregon Department of Fish and Wildlife (Moore et al., 2008)
4
Semi-Quantitative
to Quantitative
Data; 5 Quantitative Data 1 Quantitative Data 5 Quantitative Data
25 Stream Inventory Handbook: Level I & II - USFS Region 6 (2009) 5 Quantitative Data 5 Quantitative Data 1 Quantitative Data 5 Quantitative Data
1 The relative degree to which the procedure includes parameters addressing a given category of stream and riparian ecosystem assessment components: 0 = No parameters are included in the protocol. 1 = The number of parameters is very limited and/or they are only subjectively estimated. 3 = A modest number of parameters are included, and/or their documentation may include subjective (qualitative) or quantitative (objective) measures or estimates. 5 = There are multiple parameters included, and they are documented using mostly direct, objective (quantitative) measures.
I - 36
A number of additional non-regulatory protocols scored very high in three of the four categories, but failed to score even modestly in the remaining category (Table 11). Examples include Methods of Evaluating Stream, Riparian, and Biotic Conditions (Platts et al., 1983) (Catalog No. 5), the Stream Condition Inventory Technical Guide for USFS Region 5 (Frazier et al., 2005) (Catalog No. 20), the Oregon Department of Fish and Wildlife’s Methods for Stream Habitat Surveys (Moore et al., 2008) (Catalog No. 24), and the USFS Region 6 Stream Inventory Handbook: Level I & II (USFS Region 6, 2009) (Catalog No. 25). Each of these four protocols includes very few assessment parameters intended to document water quality, and they all consequently scored very low in the Water Quality parameter category. 6.3 Regulatory Stream Mitigation Protocols. Seven regulatory stream mitigation protocols were included for review in this report, including six unique protocols compiled by the USACE, often in cooperation with other state and federal agencies, and one by the State of Kentucky (Table 12). Additional USACE stream mitigation protocols, effectively similar in structure and content as those actually reviewed, will be addressed in a subsequent section of this report. Six of the seven regulatory stream mitigation protocols reviewed herein specifically note that they are suitable for use in ephemeral and/or intermittent streams. The remaining protocol neither explicitly includes nor excludes such channels (Table 12). The average number of individual assessment parameters required by the regulatory stream mitigation protocols is approximately 40% fewer than the corresponding average among the non-regulatory stream assessment protocols (Table 9). Whereas 12 individual assessment parameters are common to at least 50% of non-regulatory assessment protocols, only 5 parameters are similarly common among regulatory mitigation protocols: evidence of channel alteration, channel habitat units / bed forms, substrate particle size, bank stability / dominant bank substrate, and benthic macroinvertebrates (Table 9). In contrast to the non-regulatory stream assessment protocols reviewed, stream functions related to system dynamics and sediment processes and character are the most well represented functions among the regulatory stream mitigation protocols (Table 13). Biological support functions and chemical processes and pathways functions were also relatively well represented. However, like the non-regulatory protocols, functions related to the hydrologic balance are the least well represented (Table 13). In comparison to non-regulatory stream assessment protocols, each of the regulatory stream mitigation protocols under represents at least one, and often more than one, of the four assessment parameter categories summarized in Table 14. 6.3.1 Federal Compensatory Stream Mitigation Information. The USACE and the USEPA co-administer the CWA Section 404 regulatory program. In this capacity, the USACE issues permits, consistent with the Section 404(b)(1) Guidelines, to applicants seeking to discharge dredged or fill material into waters of the U.S. and determines appropriate compensatory mitigation for proposed impacts, consistent with the 2008 Final Compensatory Mitigation Rule and all applicable national guidance. Although all 38 USACE Districts nationwide abide by these nationwide guidance documents and procedures, some
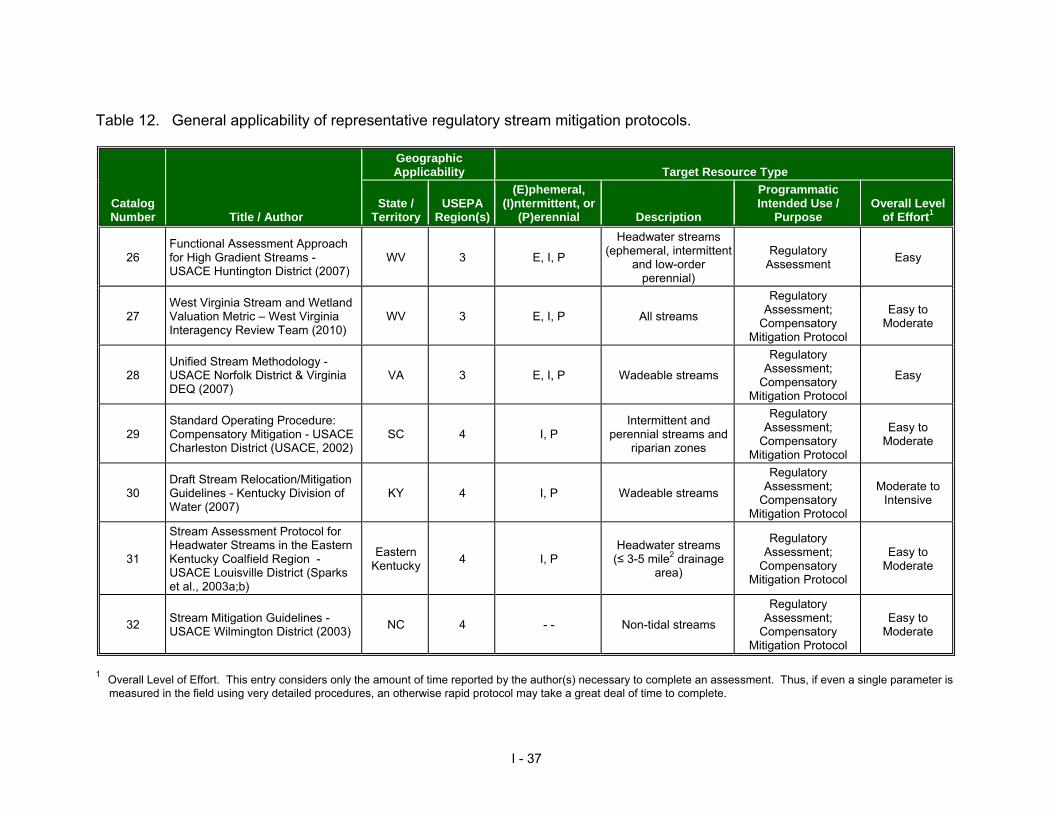
I - 37
Table 12. General applicability of representative regulatory stream mitigation protocols.
Catalog Number Title / Author
Geographic Applicability Target Resource Type
State / Territory
USEPA Region(s)
(E)phemeral, (I)ntermittent, or
(P)erennial Description
Programmatic Intended Use /
Purpose Overall Level
of Effort1
26 Functional Assessment Approach for High Gradient Streams - USACE Huntington District (2007)
WV 3 E, I, P
Headwater streams (ephemeral, intermittent
and low-order perennial)
Regulatory Assessment Easy
27 West Virginia Stream and Wetland Valuation Metric – West Virginia Interagency Review Team (2010)
WV 3 E, I, P All streams
Regulatory Assessment;
Compensatory Mitigation Protocol
Easy to Moderate
28 Unified Stream Methodology - USACE Norfolk District & Virginia DEQ (2007)
VA 3 E, I, P Wadeable streams
Regulatory Assessment;
Compensatory Mitigation Protocol
Easy
29 Standard Operating Procedure: Compensatory Mitigation - USACE Charleston District (USACE, 2002)
SC 4 I, P Intermittent and
perennial streams and riparian zones
Regulatory Assessment;
Compensatory Mitigation Protocol
Easy to Moderate
30 Draft Stream Relocation/Mitigation Guidelines - Kentucky Division of Water (2007)
KY 4 I, P Wadeable streams
Regulatory Assessment;
Compensatory Mitigation Protocol
Moderate to Intensive
31
Stream Assessment Protocol for Headwater Streams in the Eastern Kentucky Coalfield Region - USACE Louisville District (Sparks et al., 2003a;b)
Eastern Kentucky 4 I, P
Headwater streams (≤ 3-5 mile2 drainage
area)
Regulatory Assessment;
Compensatory Mitigation Protocol
Easy to Moderate
32 Stream Mitigation Guidelines - USACE Wilmington District (2003) NC 4 - - Non-tidal streams
Regulatory Assessment;
Compensatory Mitigation Protocol
Easy to Moderate
1 Overall Level of Effort. This entry considers only the amount of time reported by the author(s) necessary to complete an assessment. Thus, if even a single parameter is measured in the field using very detailed procedures, an otherwise rapid protocol may take a great deal of time to complete.

I - 38
Table 13. Primary stream and riparian zone functions addressed by representative regulatory stream mitigation protocols.
Cat
alog
N
umbe
r
Title / Author
Primary Stream and Riparian Zone Functions 1
System Dynamics
Hydrologic Balance
Sediment Processes
& Character
Biological Support
Chemical Processes
& Pathways
1 2 3 4 5 6 7 8 9 10 11 12 13 14 15
26 Functional Assessment Approach for High Gradient Streams - USACE Huntington District (2007)
♦ ♦ ♦ ♦ ♦ ♦ ♦ ♦ ♦
27 West Virginia Stream and Wetland Valuation Metric - West Virginia Interagency Review Team (2010)
♦ ♦ ♦ ♦ ♦ ♦ ♦ ♦ ♦
28 Unified Stream Methodology - USACE Norfolk District & Virginia DEQ (2007) ♦ ♦ ♦ ♦ ♦ ♦ ♦ ♦ ♦
29 Standard Operating Procedure: Compensatory Mitigation - USACE Charleston District (USACE, 2002)
♦ ♦ ♦ ♦ ♦ ♦ ♦ ♦ ♦
30 Draft Stream Relocation/Mitigation Guidelines - Kentucky Division of Water (2007) ♦ ♦ ♦ ♦ ♦ ♦ ♦
31
Stream Assessment Protocol for Headwater Streams in the Eastern Kentucky Coalfield Region - USACE Louisville District (Sparks et al., 2003a;b)
♦ ♦ ♦ ♦ ♦ ♦ ♦ ♦
32 Stream Mitigation Guidelines - USACE Wilmington District (2003) ♦ ♦ ♦ ♦ ♦ ♦ ♦ ♦ ♦ ♦ ♦

I - 39
Table 14. Summary of parameters included in representative regulatory stream mitigation protocols.
Cat
alog
Num
ber
Title / Author
Morphological Habitat Water Quality / Physiochemical Biological
Deg
ree
of
Cov
erag
e1
Res
olut
ion
Out
put
Deg
ree
of
Cov
erag
e1
Res
olut
ion
Out
put
Deg
ree
of
Cov
erag
e1
Res
olut
ion
Out
put
Deg
ree
of
Cov
erag
e1
Res
olut
ion
Out
put
26 Functional Assessment Approach for High Gradient Streams - USACE Huntington District (2007)
1 Qualitative to
Semi-Quantitative
Visual based index
1 Qualitative to Semi-
Quantitative
Visual based index
0 N/A N/A 1 Qualitative to Semi-
Quantitative
Visual based index
27 West Virginia Stream and Wetland Valuation Metric – West Virginia Interagency Review Team (2010)
1 Semi-Quantitative
Visual based index
2 Semi-Quantitative
Visual based index
3 Quantitative Data; Index 0-3 Varies Data; Index
28 Unified Stream Methodology - USACE Norfolk District & Virginia DEQ (2007)
1 Qualitative to
Semi-Quantitative
Visual based index
1 Qualitative to Semi-
Quantitative
Visual based index
0 N/A N/A 0 N/A N/A
29
Standard Operating Procedure: Compensatory Mitigation - USACE Charleston District (USACE, 2002)
1-3 Varies Data 1-2 Varies Data 0-3 Varies Data 0-5 Varies Data
30 Draft Stream Relocation/Mitigation Guidelines - Kentucky Division of Water (2007)
5 Quantitative Data 2 Quantitative Data 0 N/A N/A 0-5 Varies Data; Index
31
Stream Assessment Protocol for Headwater Streams in the Eastern Kentucky Coalfield Region - USACE Louisville District (Sparks et al., 2003a;b)
0 N/A N/A 2 Semi-Quantitative
Visual based index
1 Quantitative Data 0-3 Varies Data; Index
32 Stream Mitigation Guidelines - USACE Wilmington District (2003) 2
Qualitative to Semi-
Quantitative
Visual based index
2 Qualitative to Semi-
Quantitative
Visual based index
1 QualitativeVisual based index
3 Qualitative to Semi-
Quantitative
Data; Visual based index; Index
1 The relative degree to which the procedure includes parameters addressing a given category of stream and riparian ecosystem assessment components: 0 = No parameters are included in the protocol. 1 = The number of parameters is very limited and/or they are only subjectively estimated. 3 = A modest number of parameters are included, and/or their documentation may include subjective (qualitative) or quantitative (objective) measures or estimates. 5 = There are multiple parameters included, and they are documented using mostly direct, objective (quantitative) measures.

I - 40
Districts working either alone or in concert with state agencies and/or local or regional offices of federal agency partners, have compiled procedures and guidance documents specific to local conditions and priorities. Despite that both the USACE and USEPA are arguably the two federal agencies most closely aligned with stream mitigation and restoration in the U.S. due to their fundamental roles in the CWA 404 regulatory process, neither agency has made it a priority to make locally applicable stream restoration or mitigation information widely available to stream restoration practitioners. It is not uncommon for internet sites maintained by both USACE Districts and USEPA Regional offices to under represent locally or regionally applicable guidance, data, and/or tools and procedures that would benefit the quality and sustainability of stream restoration and mitigation projects within a given region. In some cases, such information may include physical or biological regional reference data that could be used to evaluate baseline conditions, establish success criteria or performance standards, or lend inference into desirable monitoring parameters. Local or regional hydraulic curves are often lacking from these agencies’ web sites despite the utility of these data during the design and even the regulatory review of stream restoration projects. In some instances these tools are compiled by universities, State agencies, and even other federal agencies, such as the U.S. Fish and Wildlife Service, the U.S. Forest Service, or the U.S.D.A. Natural Resources Conservation Service. By failing to compile important local resources and making them widely available to stream restoration practitioners, the federal agencies may be unwittingly fostering the compilation and presentation of stream restoration and mitigation projects that fail to utilize the best science presently available to design and implement ecologically successful, self sustaining projects. Table 15 presents the stream mitigation and/or restoration information available on each USACE District’s web site in March 2010. Almost two-thirds of the USACE Districts nationwide have no locally specific stream assessment, restoration, mitigation, or monitoring information on their internet sites (Table 15). However, where more than one District shares jurisdiction in a given State, the same local information may be found on more than one District’s web site. For example, the “Missouri Stream Mitigation Method” is used by three different USACE Districts who share jurisdiction in the State of Missouri. There are a total of 12 individual stream mitigation protocol guidance documents represented on ten of the 38 USACE District web sites. Eight of these 12 stream mitigation protocol guidance documents are based on a standard operating procedure (SOP) for mitigation developed by the USACE Charleston District (reviewed herein as Catalog No. 29).

I - 41
Table 15. Summary of stream assessment, monitoring, and mitigation guidance available from U.S. Army Corps of Engineers District websites nationwide.
USACE District Lo
cal
Info
rmat
ion
Che
cklis
ts/
Out
lines
Nat
iona
l G
uida
nce
No
Stre
am
Miti
gatio
n In
form
atio
n
Notes
Alaska ✓
Albuquerque ✓ See table footnote 1.
Baltimore ✓ ✓ See table footnote 1 & 2. “Maryland Compensatory Mitigation Guidance (1994)” is wetland centric.
Buffalo ✓ See table footnote 1.
Charleston ✓ Standard Operating Procedure (SOP): Compensatory Mitigation - reviewed in this report
Chicago ✓
Detroit ✓
Checklist / Outline recommends Michigan DNR “Qualitative Biological and Habitat Survey Protocols for Wadeable Streams and Rivers,” NAWQA Habitat Assessment procedures, and QHEI. State of Michigan has Wetland Mitigation Guidelines, but no reference to stream mitigation.
Fort Worth ✓ See table footnote 2.
Galveston ✓ See table footnote 2.
Honolulu ✓ See table footnote 1.
Huntington ✓ Functional Assessment Approach for High Gradient Streams: West Virginia - reviewed in this report
Jacksonville ✓ Wetland Rapid Assessment Procedure (WRAP); Uniform Mitigation Assessment Method (UMAM); the applicability of either method to streams is largely unclear.
Kansas City ✓ Missouri Stream Mitigation Method (SOP) and Kansas Stream Mitigation Guidance (SOP) - both based on USACE Charleston SOP.
Little Rock ✓ Charleston SOP for wetlands; Little Rock District Stream Method (based on USACE Charleston SOP) for streams
Los Angeles ✓ ✓ See table footnote 1 & 2.

Table 15. Summary of stream assessment, monitoring, and mitigation guidance available from U.S. Army Corps of Engineers District websites nationwide (continued).
I - 42
USACE District Lo
cal
Info
rmat
ion
Che
cklis
ts/
Out
lines
Nat
iona
l G
uida
nce
No
Stre
am
Miti
gatio
n In
form
atio
n
Notes
Louisville ✓ ✓
Stream Assessment Protocol for Headwater Streams in the Eastern Kentucky Coalfield Region; State of Kentucky has “Draft Stream Relocation/Mitigation Guidelines,” (October 2007), and “Illinois Stream Mitigation Guidelines” are available in draft form since May 2009, but neither are referenced on the USACE Louisville District web site. See table footnote 2.
Memphis ✓ ✓
Missouri Stream Mitigation Method (SOP) - based on USACE Charleston SOP
April 9, 2010 Public Notice: Illinois Stream Mitigation Method (SOP) – based on USACE Charleston SOP State of Tennessee has “Stream Mitigation Guidelines,” (July 2004), but these are not referenced on the USACE Memphis District web site despite that the USACE is listed as a cooperating party.
Mobile ✓ Compensatory Stream Mitigation Standard Operating Procedures and Guidelines (SOP) - based on USACE Charleston SOP
Nashville ✓
State of Tennessee has “Stream Mitigation Guidelines,” (July 2004), but these are not referenced on the USACE Nashville District web site despite that the USACE is listed as a cooperating party.
New England ✓ The “Vermont Stream Geomorphic Assessment Handbooks” are not referenced on the USACE New England District web site.
New Orleans ✓ See table footnote 1.
New York ✓ See table footnote 1.
Norfolk ✓ Unified Stream Methodology - reviewed in this report.
Omaha ✓ ✓ ✓
Montana Stream Mitigation Process (SOP) - based on USACE Charleston SOP. Compensatory Mitigation Guidelines for Wyoming - (Checklist / Outline)
Philadelphia ✓ See table footnote 1.
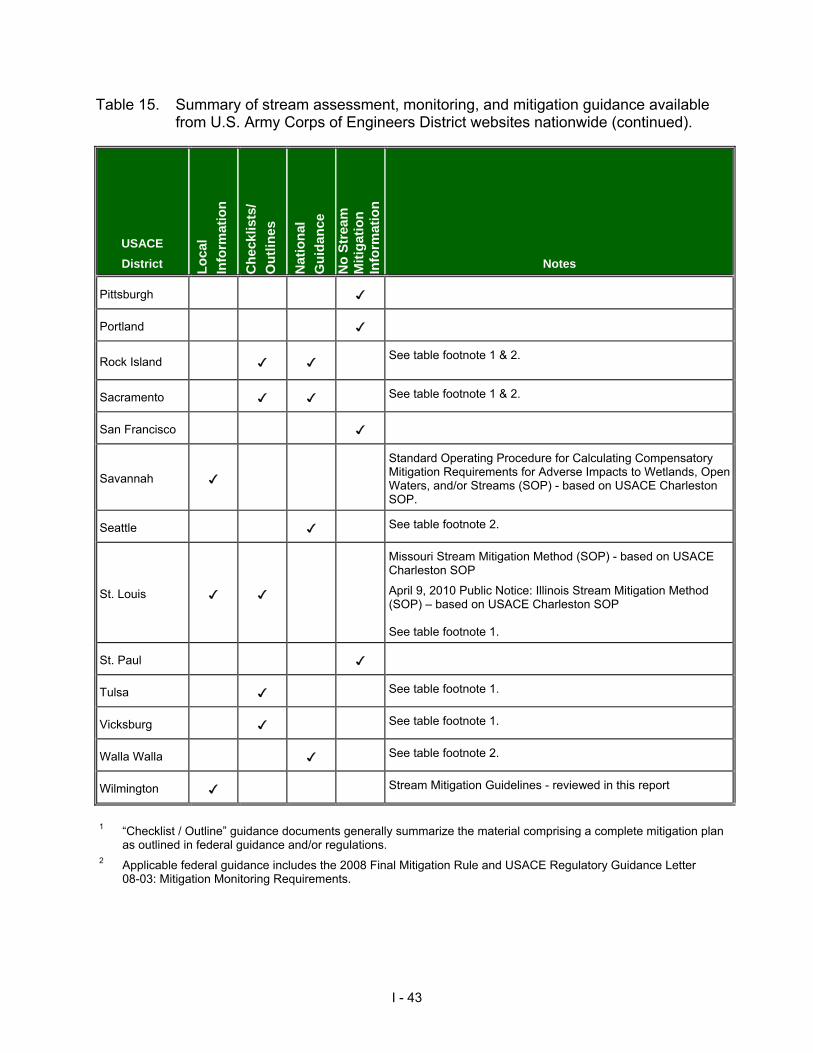
Table 15. Summary of stream assessment, monitoring, and mitigation guidance available from U.S. Army Corps of Engineers District websites nationwide (continued).
I - 43
USACE District Lo
cal
Info
rmat
ion
Che
cklis
ts/
Out
lines
Nat
iona
l G
uida
nce
No
Stre
am
Miti
gatio
n In
form
atio
n
Notes
Pittsburgh ✓
Portland ✓
Rock Island ✓ ✓ See table footnote 1 & 2.
Sacramento ✓ ✓ See table footnote 1 & 2.
San Francisco ✓
Savannah ✓
Standard Operating Procedure for Calculating Compensatory Mitigation Requirements for Adverse Impacts to Wetlands, Open Waters, and/or Streams (SOP) - based on USACE Charleston SOP.
Seattle ✓ See table footnote 2.
St. Louis ✓ ✓
Missouri Stream Mitigation Method (SOP) - based on USACE Charleston SOP
April 9, 2010 Public Notice: Illinois Stream Mitigation Method (SOP) – based on USACE Charleston SOP See table footnote 1.
St. Paul ✓
Tulsa ✓ See table footnote 1.
Vicksburg ✓ See table footnote 1.
Walla Walla ✓ See table footnote 2.
Wilmington ✓ Stream Mitigation Guidelines - reviewed in this report
1 “Checklist / Outline” guidance documents generally summarize the material comprising a complete mitigation plan
as outlined in federal guidance and/or regulations. 2 Applicable federal guidance includes the 2008 Final Mitigation Rule and USACE Regulatory Guidance Letter
08-03: Mitigation Monitoring Requirements.

I - 44
The above referenced eight SOP’s share many common technical elements, as well as programmatic elements specific to the CWA 404 regulatory program. Each of these mitigation guidance documents utilizes a set of matrices from which ordinal numeric values are selected based on specific conditions of the proposed impact or mitigation site and the correspondence of those conditions with descriptions provided in the SOP. Each matrix typically includes a suite of parameters, some of which may be rooted in technical considerations related to or inferring stream condition, while others are strictly programmatic. The sum of values from each parameter is then multiplied by a unit of measure (typically linear feet) to obtain mitigation requirements for stream impacts or mitigation credits for proposed stream mitigation activities. Despite the similarities among these mitigation SOP’s, the values assignable per parameter and the resulting summation of all respective parameters is considerably variable. The potential minimum mitigation requirements obtainable using the adverse impact matrices of these mitigation SOP’s ranges from 0.4 to 0.95 credits per linear-foot of impact, while the maximum mitigation requirements range upwards of 5.6 to 9.4 credits per linear-foot of impact (Table 16). The disparity among SOP values is even greater for matrices evaluating proposed mitigation actions. The potential minimum number of mitigation credits allotted by using the mitigation SOP’s ranges from 0.45 to 1.83 per linear-foot of stream, while the maximum number of mitigation credits ranges from 6.88 to 19.2 credits per linear-foot of stream (Table 17). However, given the regional variability in stream resources, impact stressors, and compensation practices across the country, some variability among conceptually similar mitigation SOP’s is not unwarranted.

I - 45
Table 16. Comparison of adverse impact factors among U.S. Army Corps of Engineers, Standard Operating Procedures based on the Charleston District SOP for evaluating proposed impacts subject to Clean Water Act, Section 404 regulatory authorization.
USACE District Guidance
Document(s)
Charleston Kansas City1 Little Rock Standard Operating Procedures: Compensatory Mitigation (SOP)
Kansas Stream Mitigation Guidance (SOP)
Little Rock District Stream Method (SOP)
Dates(s) Sept 2002 Dec 2009 March 2008 Adverse Impact
Factors Description Min, Max Credits Description
Min, Max Credits Description
Min, Max Credits
Lost Stream Type
Two categories: (1) Intermittent, 1st order, & 2nd order streams; (2) All other
streams.
0.3 0.8
Three categories: (1) Ephemeral/intermittent without
permanent pools; (2) Intermittent with permanent
pools; (3) Perennial.
0.4 0.8 Three categories: (1)
Ephemeral; (2) Intermittent; (3) Perennial.
0.1 0.8
Priority Area/Category
Three categories based on ecological, social, cultural or
economic value. 0.1 0.5
Three categories based on ecological, social, cultural or
economic value. 0.1 0.8
Three categories based on ecological, social, cultural or
economic value. 0.1 0.8
Existing Condition
Ordinal scale based on categorical descriptions of channel stability, biological
communities, and anthropogenic disturbance.
0.1 1.5
Three categories based on entrenchment ratio, width:depth ratio, width of the riparian area, and/or the score of the Stream Habitat Evaluation index from Kansas Department of Wildlife
and Parks.
0.1 5.0
Three categories based on categorical descriptions of channel stability, biological
communities, buffer width, and anthropogenic disturbance.
0.1 1.6
Duration of Impact Three categories: (1)
Seasonal,; (2) 0-1 year; (3) Greater than 1 year.
0.05 0.3
Three categories: (1) Temporary (<12 months); (2)
Short-term (evident >1 year, but <2 years); (3) Permanent.
0.05 0.3 Three categories: (1)
Temporary (<6 months); (2) Recurrent; (3) Permanent.
0.05 0.3
Dominant Impact Nine impact types with
successively greater adverse impact on stream systems.
0.05 2.5 Ten impact types with
successively greater adverse impact on stream systems.
0.05 2.5 Nine impact types with
successively greater adverse impact on stream systems.
0.05 2.5
Cumulative Impact / Scaling Factor
Cumulative impact factor = 0.005 x total linear feet of
stream impact. 0.01 ?
Prorated scaling factor based on linear length of stream
impact = 0.4 per 1,000 liner feet of stream impact.
0 ?
Prorated scaling factor based on linear length of stream
impact = 0.1 per 500 liner feet of stream impact.
0 ?
Total Adverse Impact Credits per Linear Foot 0.61 5.6 0.7 9.4 0.4 6.0
1 Also utilizes the Missouri Stream Mitigation Method
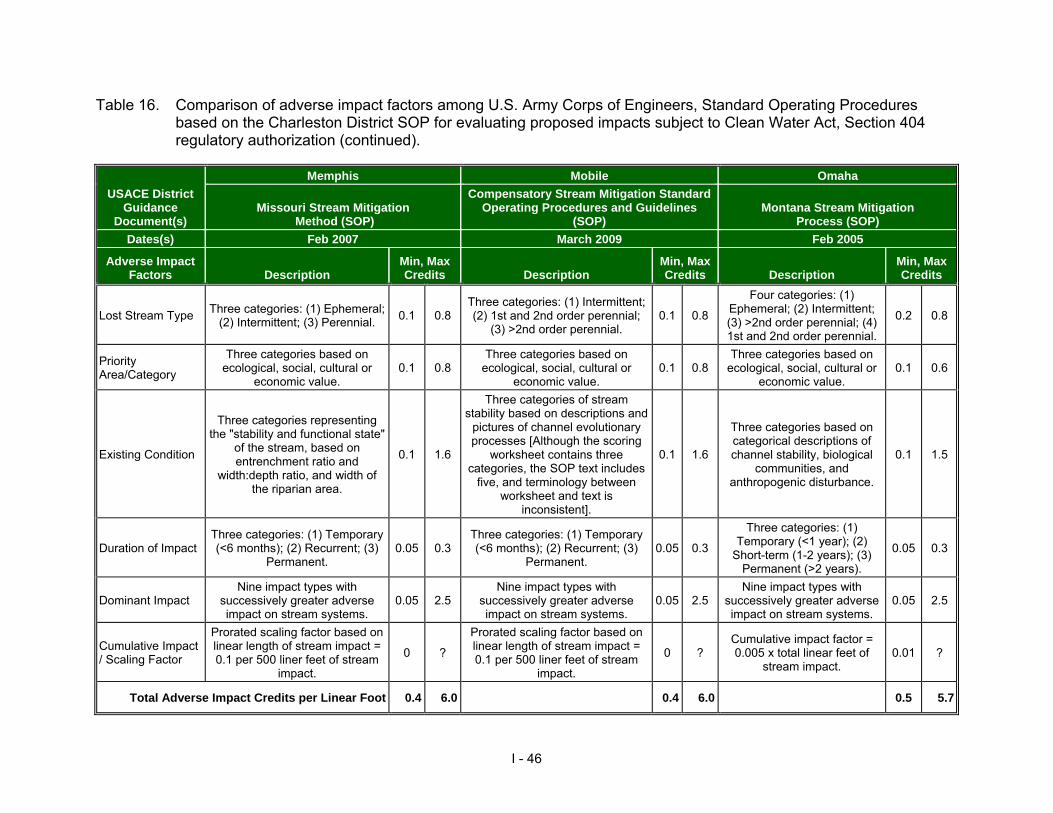
Table 16. Comparison of adverse impact factors among U.S. Army Corps of Engineers, Standard Operating Procedures based on the Charleston District SOP for evaluating proposed impacts subject to Clean Water Act, Section 404 regulatory authorization (continued).
I - 46
USACE District Guidance
Document(s)
Memphis Mobile Omaha
Missouri Stream Mitigation Method (SOP)
Compensatory Stream Mitigation Standard Operating Procedures and Guidelines
(SOP) Montana Stream Mitigation
Process (SOP) Dates(s) Feb 2007 March 2009 Feb 2005
Adverse Impact Factors Description
Min, Max Credits Description
Min, Max Credits Description
Min, Max Credits
Lost Stream Type Three categories: (1) Ephemeral; (2) Intermittent; (3) Perennial. 0.1 0.8
Three categories: (1) Intermittent; (2) 1st and 2nd order perennial;
(3) >2nd order perennial. 0.1 0.8
Four categories: (1) Ephemeral; (2) Intermittent; (3) >2nd order perennial; (4) 1st and 2nd order perennial.
0.2 0.8
Priority Area/Category
Three categories based on ecological, social, cultural or
economic value. 0.1 0.8
Three categories based on ecological, social, cultural or
economic value. 0.1 0.8
Three categories based on ecological, social, cultural or
economic value. 0.1 0.6
Existing Condition
Three categories representing the "stability and functional state"
of the stream, based on entrenchment ratio and
width:depth ratio, and width of the riparian area.
0.1 1.6
Three categories of stream stability based on descriptions and
pictures of channel evolutionary processes [Although the scoring
worksheet contains three categories, the SOP text includes
five, and terminology between worksheet and text is
inconsistent].
0.1 1.6
Three categories based on categorical descriptions of channel stability, biological
communities, and anthropogenic disturbance.
0.1 1.5
Duration of Impact Three categories: (1) Temporary (<6 months); (2) Recurrent; (3)
Permanent. 0.05 0.3
Three categories: (1) Temporary (<6 months); (2) Recurrent; (3)
Permanent. 0.05 0.3
Three categories: (1) Temporary (<1 year); (2)
Short-term (1-2 years); (3) Permanent (>2 years).
0.05 0.3
Dominant Impact Nine impact types with
successively greater adverse impact on stream systems.
0.05 2.5 Nine impact types with
successively greater adverse impact on stream systems.
0.05 2.5 Nine impact types with
successively greater adverse impact on stream systems.
0.05 2.5
Cumulative Impact / Scaling Factor
Prorated scaling factor based on linear length of stream impact = 0.1 per 500 liner feet of stream
impact.
0 ?
Prorated scaling factor based on linear length of stream impact = 0.1 per 500 liner feet of stream
impact.
0 ? Cumulative impact factor = 0.005 x total linear feet of
stream impact. 0.01 ?
Total Adverse Impact Credits per Linear Foot 0.4 6.0 0.4 6.0 0.5 5.7

Table 16. Comparison of adverse impact factors among U.S. Army Corps of Engineers, Standard Operating Procedures based on the Charleston District SOP for evaluating proposed impacts subject to Clean Water Act, Section 404 regulatory authorization (continued).
I - 47
USACE District Guidance
Document(s)
Savannah St. Louis St. Louis & Memphis1
SOP Missouri Stream Mitigation Method (SOP)Illinois Stream Mitigation Guidance
(SOP) Dates(s) March 2004 Feb 2007 March 2010
Adverse Impact Factors Description
Min, Max Credits Description
Min, Max Credits Description
Min, Max Credits
Lost Stream Type Three categories: (1) Intermittent;
(2) perennial >15 feet wide; (3) perennial ≤15 feet wide.
0.1 0.8 See summary under the Memphis District.
Three categories: (1) Ephemeral/intermittent; (2) Intermittent with seasonal
pools; (3) Perennial.
0.1 0.8
Priority Area/Category
Three categories based on ecological, social, cultural or
economic value. 0.5 1.5
Three categories based on ecological, social, cultural or
economic value. 0.1 0.8
Existing Condition
Three categories based on entrenchment ratio, biological
communities, channel substrate, and/or bank erosion.
0.25 1.0
Three categories based on categorical descriptions of channel stability, biological communities, water quality,
and anthropogenic disturbance. Also includes a
Biological Stream Rating criteria from the Illinois Department of Natural
Resources.
0.2 1.2
Duration of Impact Three categories: (1) Temporary
(<1 year); (2) Recurrent; (3) Permanent (>1 year).
0.05 0.2
Three categories: (1) Temporary (<3 months); (2) Short term (<2 years); (3) Permanent (> 2 years).
0.05 0.3
Dominant Impact Nine impact types with
successively greater adverse impact on stream systems.
0.05 3.0 Nine impact types with
successively greater adverse impact on stream systems.
0.05 2.5
Cumulative Impact / Scaling Factor
Prorated scaling factor based on linear length of stream impact = 0.4 per 1,000 liner feet of stream
impact.
0 ? Cumulative impact factor = 0.003 x total linear feet of
stream impact. 0 ?
Total Mitigation Credits per Linear Foot 0.95 6.5 0.5 5.6
1 Six-month testing period beginning April 9, 2010.
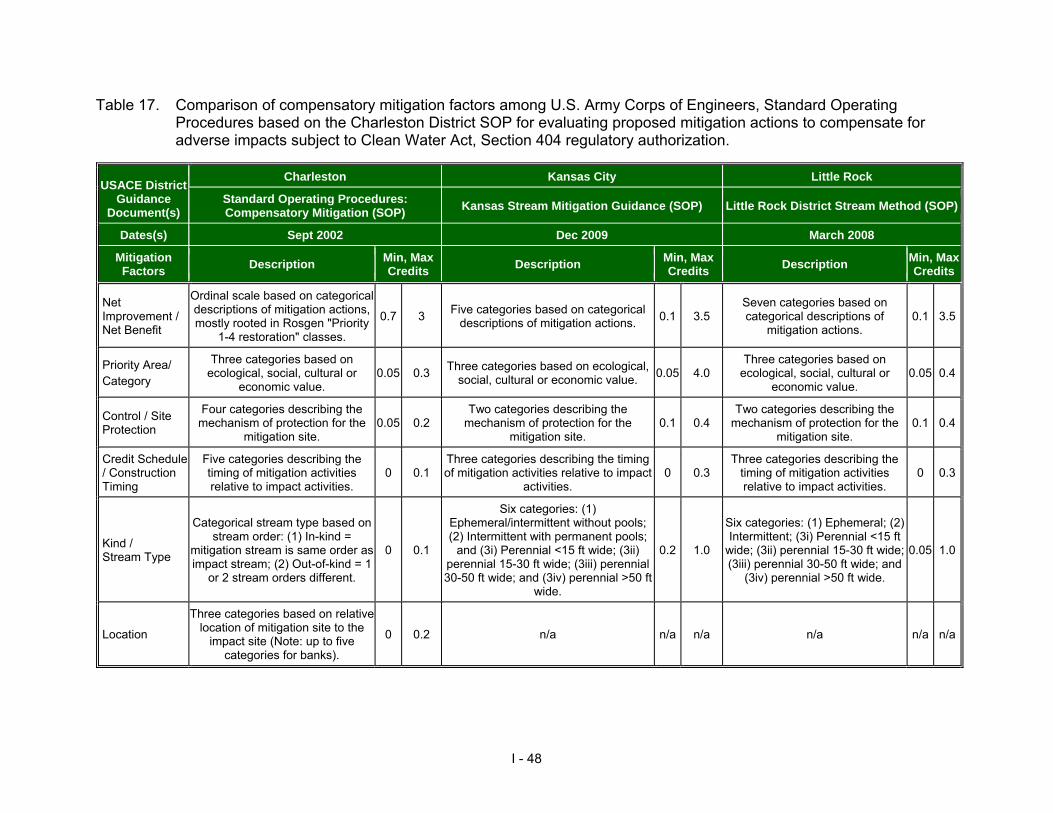
I - 48
Table 17. Comparison of compensatory mitigation factors among U.S. Army Corps of Engineers, Standard Operating Procedures based on the Charleston District SOP for evaluating proposed mitigation actions to compensate for adverse impacts subject to Clean Water Act, Section 404 regulatory authorization.
USACE District Guidance
Document(s)
Charleston Kansas City Little Rock
Standard Operating Procedures: Compensatory Mitigation (SOP) Kansas Stream Mitigation Guidance (SOP) Little Rock District Stream Method (SOP)
Dates(s) Sept 2002 Dec 2009 March 2008
Mitigation Factors Description Min, Max
Credits Description Min, Max Credits Description Min, Max
Credits
Net Improvement / Net Benefit
Ordinal scale based on categorical descriptions of mitigation actions, mostly rooted in Rosgen "Priority
1-4 restoration" classes.
0.7 3 Five categories based on categorical descriptions of mitigation actions. 0.1 3.5
Seven categories based on categorical descriptions of
mitigation actions. 0.1 3.5
Priority Area/ Category
Three categories based on ecological, social, cultural or
economic value. 0.05 0.3 Three categories based on ecological,
social, cultural or economic value. 0.05 4.0 Three categories based on
ecological, social, cultural or economic value.
0.05 0.4
Control / Site Protection
Four categories describing the mechanism of protection for the
mitigation site. 0.05 0.2
Two categories describing the mechanism of protection for the
mitigation site. 0.1 0.4
Two categories describing the mechanism of protection for the
mitigation site. 0.1 0.4
Credit Schedule / Construction Timing
Five categories describing the timing of mitigation activities relative to impact activities.
0 0.1 Three categories describing the timing of mitigation activities relative to impact
activities. 0 0.3
Three categories describing the timing of mitigation activities relative to impact activities.
0 0.3
Kind / Stream Type
Categorical stream type based on stream order: (1) In-kind =
mitigation stream is same order as impact stream; (2) Out-of-kind = 1
or 2 stream orders different.
0 0.1
Six categories: (1) Ephemeral/intermittent without pools; (2) Intermittent with permanent pools;
and (3i) Perennial <15 ft wide; (3ii) perennial 15-30 ft wide; (3iii) perennial 30-50 ft wide; and (3iv) perennial >50 ft
wide.
0.2 1.0
Six categories: (1) Ephemeral; (2) Intermittent; (3i) Perennial <15 ft
wide; (3ii) perennial 15-30 ft wide; (3iii) perennial 30-50 ft wide; and
(3iv) perennial >50 ft wide.
0.05 1.0
Location
Three categories based on relative location of mitigation site to the
impact site (Note: up to five categories for banks).
0 0.2 n/a n/a n/a n/a n/a n/a

Table 17. Comparison of compensatory mitigation factors among U.S. Army Corps of Engineers, Standard Operating Procedures based on the Charleston District SOP for evaluating proposed mitigation actions to compensate for adverse impacts subject to Clean Water Act, Section 404 regulatory authorization (continued).
I - 49
USACE District Guidance
Document(s)
Charleston Kansas City Little Rock
Standard Operating Procedures: Compensatory Mitigation (SOP) Kansas Stream Mitigation Guidance (SOP) Little Rock District Stream Method (SOP)
Dates(s) Sept 2002 Dec 2009 March 2008
Mitigation Factors Description Min, Max
Credits Description Min, Max Credits Description Min, Max
Credits
Riparian Buffer1 (preservation, enhancement, or restoration)
Separate matrix that considers proposed buffer width, proportion of buffer planted, additional credit
for buffers on both sides of the stream, stream type, control, timing, and proximity to the
impacted site.
0.15 3.375
Separate matrix that considers proposed buffer width, proportion of buffer planted, additional credit for
buffers on both sides of the stream or additional improvements, temporal lag, stream type, control, priority area, and
degree of monitoring.
0 3.05
Separate matrix that considers proposed buffer width, proportion of buffer planted, additional credit
for buffers on both sides of the stream or livestock fencing,
temporal lag, stream type, priority area, degree of monitoring, and
timing.
0.25 7.24
Existing Condition n/a n/a n/a
Three categories based on entrenchment ratio, width:depth ratio, width of the riparian area, and/or the
score of the Stream Habitat Evaluation index from Kansas Department of
Wildlife and Parks.
0 0.4
Three categories representing the "stability and functional state" of
the stream, based on entrenchment ratio and
width:depth ratio, and width of the riparian area.
0 0.4
Monitoring & Contingency n/a n/a n/a n/a n/a n/a
Three levels of monitoring rigor, including triggers for remedial or
corrective actions. 0.05 0.5
Streambank Stability n/a n/a n/a n/a n/a n/a n/a n/a n/a
Instream Habitat n/a n/a n/a n/a n/a n/a n/a n/a n/a
Mitigation Factor n/a n/a n/a n/a n/a n/a n/a n/a n/a
Total Mitigation Credits per Linear Foot 0.95 7.28 0.45 12.7 0.6 13.7
1 Riparian buffer credit min, max values assume buffers on both sides of the mitigated stream reach.

Table 17. Comparison of compensatory mitigation factors among U.S. Army Corps of Engineers, Standard Operating Procedures based on the Charleston District SOP for evaluating proposed mitigation actions to compensate for adverse impacts subject to Clean Water Act, Section 404 regulatory authorization (continued).
I - 50
USACE District
Guidance Document(s)
Memphis Mobile Omaha
Missouri Stream Mitigation Method (SOP) Compensatory Stream Mitigation Standard operating Procedures and Guidelines (SOP) Montana Stream Mitigation Process (SOP)
Dates(s) Feb 2007 March 2009 Feb 2005
Mitigation Factors Description Max, Min
Credits Description Max, Min Credits Description Max, Min
Credits
Net Improvement / Net Benefit
Four categories based on categorical descriptions of
mitigation actions. 0.1 3.5
Four categories based on categorical descriptions of mitigation
actions, mostly rooted in Rosgen "Priority 1-4 restoration" classes.
0.1 3.5 Three categories based on categorical descriptions of
mitigation actions. 1.2 2.5
Priority Area/Category
Three categories based on ecological, social, cultural or
economic value. 0.05 0.4
Three categories based on ecological, social, cultural or
economic value. 0.05 0.4
Three categories based on ecological, social, cultural or
economic value. 0.05 0.3
Control / Site Protection
Two categories describing the mechanism of protection for the
mitigation site. 0.1 0.4 n/a n/a n/a
Five categories describing the mechanism of protection for the
mitigation site. 0.03 0.2
Credit Schedule / Construction Timing
Three categories describing the timing of mitigation activities relative to impact activities.
0 0.3 n/a n/a n/a Five categories describing the timing of mitigation activities relative to impact activities.
0 0.1
Kind / Stream Type
Six categories: (1) Ephemeral; (2) Intermittent; (3i) Perennial <15 ft wide; (3ii) perennial 15-
30 ft wide; (3iii) perennial 30-50 ft wide; and (3iv) perennial >50
ft wide.
0.05 1.0
Six categories: (1) Intermittent; (2) 1st or 2nd order perennial; (3i) >2nd
order perennial <15 ft wide; (3ii) perennial 15-30 ft wide; (3iii)
perennial 30-50 ft wide; and (3iv) perennial >50 ft wide.
0.05 1.0
Categorical stream type based on stream order: (1) Same order as impact stream; (2) Within 1 order of impact stream; (3) 2 orders of
impact stream.
0 0.2
Location n/a n/a n/a n/a n/a n/a
Three categories based on relative location of mitigation site to the impact site: (1) On-site; (2) Off-site; (3) Outside of watershed.
0 0.2
Riparian Buffer1 (preservation, enhancement, or restoration)
Separate matrix that considers proposed buffer width,
proportion of buffer planted, additional buffer improvements,
temporal lag, stream type, priority area, degree of monitoring, and timing.
0.1 11.3
Separate matrix that considers proposed buffer width, proportion of buffer planted, additional credit for buffers on both sides of the stream,
stream type, priority area, and timing.
0.4 5.9
Separate matrix that considers proposed buffer width, proportion of buffer planted, control, timing,
stream type, location, and adjustments based on whether one or both sides of the stream
are buffered.
0.1 3.38

Table 17. Comparison of compensatory mitigation factors among U.S. Army Corps of Engineers, Standard Operating Procedures based on the Charleston District SOP for evaluating proposed mitigation actions to compensate for adverse impacts subject to Clean Water Act, Section 404 regulatory authorization (continued).
I - 51
USACE District
Guidance Document(s)
Memphis Mobile Omaha
Missouri Stream Mitigation Method (SOP) Compensatory Stream Mitigation Standard operating Procedures and Guidelines (SOP) Montana Stream Mitigation Process (SOP)
Dates(s) Feb 2007 March 2009 Feb 2005
Mitigation Factors Description Max, Min
Credits Description Max, Min Credits Description Max, Min
Credits
Existing Condition
Three categories representing the "stability and functional
state" of the stream, based on entrenchment ratio and
width:depth ratio, and width of the riparian area.
0 0.4
Two categories of stream stability based on descriptions and pictures of channel evolutionary processes
[The SOP text terminology is inconsistent with the scoring
worksheet].
0.05 0.4 n/a n/a n/a
Monitoring & Contingency
Three levels of monitoring rigor, including triggers for remedial
or corrective actions. 0.05 0.5 n/a n/a n/a n/a n/a n/a
Streambank Stability n/a n/a n/a
Two categories of bank stability based on descriptive summaries of streambank features [Bank Erosion Hazard Index is referenced as an
option].
0.2 0.4 n/a n/a n/a
Instream Habitat n/a n/a n/a
Four classes of instream habitat / concealment structures based on the number of cover types present
[differentiated between high gradient and low gradient streams].
0.1 0.35 n/a n/a n/a
Mitigation Factor n/a n/a n/a n/a n/a n/a n/a n/a n/a
Total Mitigation Credits per Linear Foot 0.45 17.8 0.65 11.2 1.38 6.88
1 Riparian buffer credit min, max values assume buffers on both sides of the mitigated stream reach.
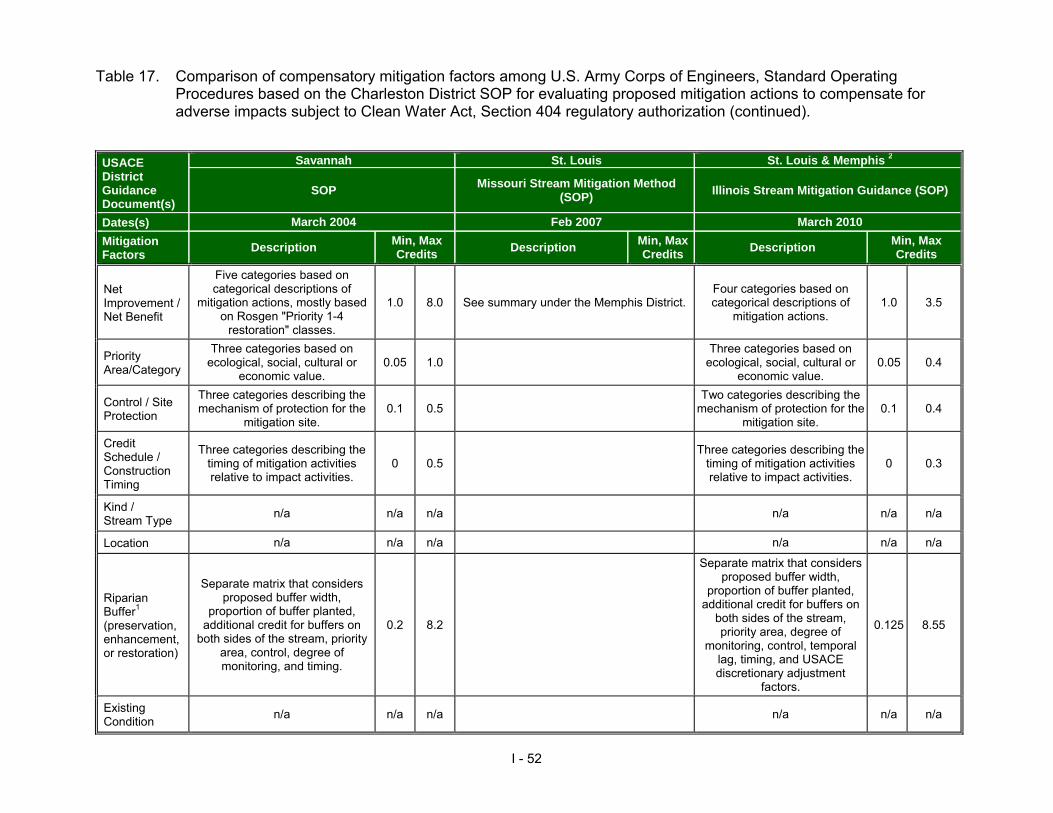
Table 17. Comparison of compensatory mitigation factors among U.S. Army Corps of Engineers, Standard Operating Procedures based on the Charleston District SOP for evaluating proposed mitigation actions to compensate for adverse impacts subject to Clean Water Act, Section 404 regulatory authorization (continued).
I - 52
USACE District Guidance Document(s)
Savannah St. Louis St. Louis & Memphis 2
SOP Missouri Stream Mitigation Method (SOP) Illinois Stream Mitigation Guidance (SOP)
Dates(s) March 2004 Feb 2007 March 2010 Mitigation Factors Description Min, Max
Credits Description Min, Max Credits Description Min, Max
Credits
Net Improvement / Net Benefit
Five categories based on categorical descriptions of
mitigation actions, mostly based on Rosgen "Priority 1-4
restoration" classes.
1.0 8.0 See summary under the Memphis District. Four categories based on categorical descriptions of
mitigation actions. 1.0 3.5
Priority Area/Category
Three categories based on ecological, social, cultural or
economic value. 0.05 1.0
Three categories based on ecological, social, cultural or
economic value. 0.05 0.4
Control / Site Protection
Three categories describing the mechanism of protection for the
mitigation site. 0.1 0.5
Two categories describing the mechanism of protection for the
mitigation site. 0.1 0.4
Credit Schedule / Construction Timing
Three categories describing the timing of mitigation activities relative to impact activities.
0 0.5 Three categories describing the
timing of mitigation activities relative to impact activities.
0 0.3
Kind / Stream Type n/a n/a n/a n/a n/a n/a
Location n/a n/a n/a n/a n/a n/a
Riparian Buffer1 (preservation, enhancement, or restoration)
Separate matrix that considers proposed buffer width,
proportion of buffer planted, additional credit for buffers on
both sides of the stream, priority area, control, degree of monitoring, and timing.
0.2 8.2
Separate matrix that considers proposed buffer width,
proportion of buffer planted, additional credit for buffers on
both sides of the stream, priority area, degree of
monitoring, control, temporal lag, timing, and USACE discretionary adjustment
factors.
0.125 8.55
Existing Condition n/a n/a n/a n/a n/a n/a

Table 17. Comparison of compensatory mitigation factors among U.S. Army Corps of Engineers, Standard Operating Procedures based on the Charleston District SOP for evaluating proposed mitigation actions to compensate for adverse impacts subject to Clean Water Act, Section 404 regulatory authorization (continued).
I - 53
USACE District Guidance Document(s)
Savannah St. Louis St. Louis & Memphis 2
SOP Missouri Stream Mitigation Method (SOP) Illinois Stream Mitigation Guidance (SOP)
Dates(s) March 2004 Feb 2007 March 2010 Mitigation Factors Description Min, Max
Credits Description Min, Max Credits Description Min, Max
Credits
Monitoring & Contingency
Four levels of monitoring rigor, including triggers for remedial or
corrective actions. 0 1.0
Three levels of monitoring to be determined by the reviewing
USACE District. 0.05 0.5
Streambank Stability n/a n/a n/a n/a n/a n/a
Instream Habitat n/a n/a n/a n/a n/a n/a
Mitigation Factor n/a n/a n/a
Discretionary adjustment factors utilized by the reviewing
USACE District based on watershed needs, best
available science, public interest comments, and resource agency input.
0.5 1.0
Total Mitigation Credits per Linear Foot 1.35 19.2 1.83 14.65 1 Riparian buffer credit min, max values assume buffers on both sides of the mitigated stream reach. 2 Six-month testing period beginning April 9, 2010.

I - 54
7.0 CONCLUSIONS & RECOMMENDATIONS There remains a significant lack of standardization of assessment parameters or metrics included in stream assessment and mitigation protocols. The specific compilation of individual parameters within each of the 32 protocols reviewed in this report varies widely, and only eight out of the 70 cumulative assessment parameters are common to even half of the protocols. In addition, approximately one-quarter of the cumulative assessment parameters are uncommon to even 10% of the protocols reviewed. The degree to which stream assessment and mitigation protocols incorporate assessment parameters aimed at fully documenting channel morphology, physical habitat, water quality, and biological communities is as varied as the specific parameters themselves. Approximately 40% of the non-regulatory assessment protocols reviewed herein fail to include any assessment parameters or metrics addressing at least one of the above referenced assessment parameter categories. In these situations, it is most often water quality or biological parameters that are not included. Stream mitigation protocols developed for regulatory purposes also tend to most often omit water quality and biological parameters, but these protocols also regularly under represent channel morphology and physical habitat in so far as even these categories of parameters tend to rely more on subjective estimates. Ambient stream monitoring protocols generally include more quantitative measures of addressing all assessment parameter categories, especially physical habitat. In addition, many of the data intensive assessment methods aimed at assessing physical habitat, especially fish habitat, have significant cross-over implications for geomorphological channel design (e.g., channel habitat units (bed forms), pool formative elements, quantitative pool features, etc.). Representatives from state and federal monitoring programs not typically associated with the CWA 404 regulatory program should be encouraged to participate in compilation or revision of mitigation protocols and guidance documents. For example, both the USGS and USFS possess a great deal of practical stream assessment and monitoring experience and their input could prove especially useful. However, even where a multitude of assessment parameters is included as part of a stream assessment protocol, there is no guarantee that all or most of the primary stream and riparian functions will be represented. Future revisions to existing protocols or initiatives to develop new protocols may be best served by incorporating considerations of stream and riparian functions early in the process. By first framing the suite of functions desired to be represented, extraneous assessment parameters can be omitted or considered optional, and the allocation of resources necessary to perform the assessment and manage the resulting data will remain as efficient as possible. Recommendations: 1. Assemble interagency teams incorporating multiple disciplines and backgrounds
when devising or revising stream assessment and mitigation protocols. Include representatives of agencies that have extensive experience in monitoring and assessment, but not typically engaged in CWA 404 regulatory activities.

I - 55
2. Incorporate considerations of stream and riparian zone functions early in the process in order to focus on those assessment parameters representing primary stream and riparian zone functions that can be evaluated objectively and repeatedly by disparate parties. Such focus may also minimize the addition of non-essential monitoring or assessment metrics, or otherwise make them optional.
Even when critically valuable stream assessment or restoration design tools exist within a given region, they are often overlooked by practitioners because their existence is not widely known. As previously noted, the 2002 National Wetlands Mitigation Action Plan specifically called for the signatory federal agencies to evaluate the effectiveness of using biological indicators as tools for assessing compensatory mitigation efforts. Most states have in fact developed regionally specific indicators of stream biological integrity based on one or more biological guilds (e.g. fish, benthic macroinvertebrates, periphyton, etc.). While the incorporation of such tools into the federal CWA 404 compensatory mitigation program is not yet widespread, it is encouraging to note that recent and on-going updates and revisions of some federal regulatory mitigation guidelines are including or even building upon such resources (e.g. 2009 USACE Savannah District mitigation banking guidelines; 2009 Draft Illinois Stream Mitigation Guidance; 2003 USACE Louisville District Stream Assessment Protocol for Headwater Streams in the Eastern Kentucky Coalfield Region). Similarly, more and more state and federal agencies, academic institutions, and private practitioners are compiling and publishing bankfull (a.k.a. hydraulic) regional curves. However, despite that these resources exist in many parts of the country (Appendix A), in most cases they are not incorporated or even referenced in stream restoration or mitigation guidance documents, rules, regulations, or web sites widely available to practitioners and natural resources managers. Because any stream restoration project, whether undertaken expressly for compensatory mitigation purposes or not, will likely require some level of regulatory agency authorization, it is incumbent on those agencies to collectively identify, incorporate, and advertise the existence and utility of stream assessment and restoration design tools compiled by other parties. Such tools may include, but are not necessarily limited to, biological condition indices and bankfull regional curves. The complete breadth of stream assessment and restoration research and practical field experience must be better shared among all parties in order to maximize the likelihood of implementing physically stable, biologically productive, and ecologically beneficial stream restoration and mitigation projects. Recommendations: 3. Establish one or more central internet repositories for stream assessment,
mitigation, and monitoring information to be made available to regulators, practitioners, and the other interested parties. This internet portal could be a regional university, a USACE District, a USEPA Region, or any other entity. The web master should be clearly noted in order to allow other state and federal agencies, universities, or practitioners to submit new or revised tools or guidance documents for listing. Such information may include regional IBI’s, benthic IBI’s, regional curves, etc.
I - 56
REFERENCES ADEQ. 2005. A Manual of Procedures for Sampling Surface Waters, L. Lawson (ed.),
Arizona Department for Environmental Quality, Hydrologic Support and Assessment Section. Phoenix, AZ.
Asmus, B., J.A. Magner, B. Vondracek, and J. Perry. 2009. Physical integrity: the missing
link in biological monitoring and TMDLs. Environmental Monitoring and Assessment 159: 443-463.
Bain, M.B., T.C. Hughes, and K.K. Arend. 1999. Trends in methods for assessing
freshwater habitats. Fisheries 24(4): 16-21. Barbour, MT. J. Gerritsen, B.D. Snyder, and J.B. Stribling. 1999. Rapid Bioassessment
Protocols for Use in Streams and Wadeable Rivers: Periphyton, Benthic Macroinvertebrates, and Fish, Second Edition. EPA 841-B-99-002. U.S. Environmental Protection Agency, Office of Water, Washington, D.C.
Bernhardt, E.S. M.A. Palmer, J.D. Allan, G. Alexander, K. Baranas, S. Brooks, J. Carr, S.
Clayton, C. Dahm, J. Follstad-Shah, D. Galat, S.G. Loss, P. Goodwin, D. Hart, B. Hassett, R. Jenkinson, S. Katz, G.M. Kondolf, P.S. Lake, R. Lave, J.L. Meyer, T.K. O’Donnell, L. Pagano, B. Powell, and E. Sudduth. 2005. Synthesizing U.S. river restoration efforts. Science 308: 636-637.
Diamond, J.M, M.T. Barbour, and J.B. Stribling. 1996. Characterizing and comparing
bioassessment methods and their results: a perspective. Journal of the North American Benthological Society 15(4): 713-727.
Diamond, J.M, J.B. Stribling, and C. Yoder. 1998. Determining comparability of
bioassessment methods and their results. Proc. of the 1998 National Monitoring Conference, National Water Quality Monitoring Council, Reno, NV.
ELI. 2004. Measuring mitigation: A review of the science for compensatory mitigation
performance standards. Environmental Law Institute. Washington, D.C. Fischenich, J.C. 2006. Functional objectives for stream restoration. ERDC TN-EMRRP SR-
52. U.S. Army Corps of Engineers Research and Development Center, Vicksburg, MS.
Fritz, K.M., B.R. Johnson, and D.M. Walters. 2006. Field operations manual for assessing
the hydrologic permanence and ecological condition of headwater streams. EPA 600/R-06/126. USEPA Office of Research and Development, Washington, D.C.
Frazier, J.W., K.B. Roby, J.A. Boberg, K. Kenfield, J.B. Reiner, D.L. Azuma, J.L. Furnish,
B.P. Staab. 2005. Stream Condition Inventory (SCI) Technical Guide. USDA Forest Service, Pacific Southwest Region - Ecosystem Conservation Staff. Vallejo, CA.
I - 57
Harding, J.S., E.F. Benfield, P.V. Bolstad, G.S. Helfman, and E.B.D. Jones, III. 1998. Stream biodiversity: the ghost of land use past. Proc. of the National Academy of Sciences 95: 14,843-14,847.
ITFM. 1995. “The Nationwide Strategy for Improving Water-Quality Monitoring in the United
States.” Intergovernmental Task Force on Monitoring Water Quality, Water Information Coordination Program. Washington, D.C.
Johnson, D.H., N. Pimman, E. Wilder, J.A. SIlver, R.W. Plotnikoff, B.C. Mason, K.K. Jones,
P. Roger, T.A. O’Neil, and C. Barrett. 2001. Inventory and Monitoring of Salmon Habitat in the Pacific Northwest: Directory and Synthesis of Protocols for Management/Research and Volunteers in Washington, Oregon, Idaho, Montana, and British Columbia. Washington Department of Fish and Wildlife, Olympia, WA.
Karr, J.R. and D.R. Dudley. 1981. Ecological perspectives on water quality goals.
Environmental Management 5:55-68. McKay, S.K., B.A. Pruitt, M. Harberg, A.P. Covich, M.A. Kenney, and J.C. Fischenich. Draft
2009. “Metric development for environmental benefits analysis.” EBA Technical Notes Collection. ERDC TN-EMRRP-EBA-xx-x, U.S. Army Engineer Research and Development Center, Vicksburg, MS.
Moore, K., K. Jones, J. Dambacher, C. Stein, et al. 2008. Aquatic Inventories Project:
Methods for Stream Habitat Surveys, Version 17.1, May 2008. Oregon Department of Fish and Wildlife, Aquatic Inventories Project, Conservation and Recovery Program, Corvallis, OR.
Nagle, G. 2007. Evaluating ‘natural channel design’ stream projects. Hydrological
Processes 21: 2539-2545. NRC. 2001. Compensating for Wetland Losses Under the Clean Water Act. National
Research Council, National Academy Press. Washington, D.C. NRCS. 2001. Stream Corridor Inventory and Assessment Techniques: A guide to site,
project, and landscape approaches suitable for local conservation programs. Watershed Science Institute Technical Report, USDA Natural Resources Conservation Service, Washington, D.C.
NRCS. 2007. Stream Corridor Inventory and Assessment Techniques. Tech. Suppl. 3A,
National Eng Handbook, Part 654, Stream Restoration Design. Oakley, K.L., L.P. Thomas, and S.G. Fancy. Guidelines for long-term monitoring protocols.
2003. Wildlife Society Bulletin 31(4): 1000-1003.

I - 58
Paulsen, S.G., A. Mayio, D.V. Peck, J.L. Stoddard, E. Tarquinio, S.M. Holdsworth, J. Van Sickle, L.L. Yuan, C.P. Hawkins, A.T. Herlihy, P.R. Kaufmann, M.T. Barbour, D.P. Larsen, and A.R. Olsen. 2008. Condition of stream ecosystems in the U.S.: an overview of the first national assessment. Journal of the North American Benthological Society 27(4): 812-821.
Platts, W.S., W.F. Megahan, and G.W. Minshall. 1983. Methods for Evaluating Stream,
Riparian, and Biotic Conditions. USDA Forest Service Intermountain Forest and Range Experiment Station, General Technical Report INT-138, Ogden, UT. 70 pp.
Poole, G.C., C.A. Frissell, and S.C. Ralph. 1997. In-stream habitat unit classification:
Inadequacies for monitoring and some consequences for management. Journal of the American Water Resources Association 33(4): 879-896.
Roper, B.B., J.L. Kershner, E. Archer, R.Henderson, and N. Bouwes. 2002. An evaluation of
physical stream habitat attributes used to monitor streams. Journal of the American Water Resources Association 38(6):1637-1646.
Smith, R.D., A. Ammann, C. Bartoldus, and M.M. Brinson. 1995. An approach for assessing
wetland functions using hydrogeomorphic classification, reference wetlands, and functional indices, Tech. Rpt. WRP-DE-9, USACE Waterways Experiment Station, Vicksburg, MS.,
Somerville, D.E. and B.A. Pruitt. 2004. Physical Stream Assessment: A Review of Selected
Protocols for Use in the Clean Water Act Section 404 Program. September 2004, Prepared for the U.S. Environmental Protection Agency, Office of Wetlands, Oceans, and Watersheds, Wetlands Division (Order No. 3W-0503-NATX). Washington, D.C.
Stolnack, S.A., M.D. Bryant, and R.C. Wissmar. 2005. A Review of Protocols for Monitoring
Streams and Juvenile Fish in Forested Regions of the PNW. USFS Pacific Northwest Research Station, PNW-GTR-625.
Sudduth, E.B., J.L. Meyer, and E.S. Bernhardt. 2007. Stream restoration practices in the
Southeastern United States. Restoration Ecology 15(3): 572-583. USACE, Charleston District. 2002. Standard Operating Procedure: Compensatory
Mitigation. RD-SOP-02-01, September 19, 2002. U.S. Army Corps of Engineers, Charleston District, Charleston, SC.
USEPA. 1998. Water quality criteria and standards plan – Priorities for the future. U.S.
Environmental Protection Agency Office of Water, EPA-822-R-98-003, Washington, D.C.
USEPA SAB. 2002. “A Framework for Assessing and Reporting on Ecological Condition: An
SAB Report,” T.F. Young and S. Sanzone (eds), EPA-SAB-EPEC-02-009, U.S. Environmental Protection Agency Science Advisory Board, Washington, D.C.

I - 59
USFS Region 6. 2009. Stream Inventory Handbook: Level I & II, Version 2.9. U.S. Forest Service, Pacific Northwest Region, Region 6.
Zedler, J.B. and M.W. Weller. 1990. Overview and future research, pgs. 405-413. In J.A.
Kusler and M.E. Kentula (eds), Wetland Creation and Restoration: The Status of the Science. Island Press, Washington, D.C.

A - 1
APPENDIX A
Hydraulic Regional Curves for Selected Areas of the United States
NOTE: Not all of the following references have been subject to the same level of independent review. In addition to investigations published in peer reviewed literature, this list also includes works undertaken pursuant to university degree programs and specific restoration projects undertaken by both the private and public sector. Moreover, some references are the result of symposia, workshops, etc., and information contained therein may have had little review outside of the individual document’s collaborators. ALABAMA Metcalf, C. 2005. Alabama riparian reference reach and regional curve study. U.S. Fish
and Wildlife Service, Panama City Fisheries Resource Office. Panama City, FL. http://www.fws.gov/panamacity/programs/pfw-projects/ FWS%20Final%20Alabama%20Regional%20Curve%20Report.pdf
ARIZONA Moody, T. and W. Odem. 1999. Regional relationships of bankfull stage in central and
southern Arizona, in D.S. Olsen and J.P. Potyondy (eds), Wildland Hydrology, American Water Resources Association Specialty Conference Proceedings, June 20-July 2, 1999: Bozeman, Mont., TPS-99-3, 536 p.
Moody, T., M. Wirtanen, and S.N. Yard. 2003. Regional Relationships for Bankfull Stage in
Natural Channels of the Arid Southwest, Natural Channel Design, Inc. Flagstaff, AZ. 38 p. http://www.naturalchanneldesign.com/NCD%20Reports.htm
CALIFORNIA Dunne, T.D. and L.B. Leopold. 1978. Water in Environmental Planning. W.H. Freeman and
Company, NY.818 p. COLORADO Elliot, J.G. and K.D. Cartier. 1986. Hydraulic geometry and streamflow of channels in the
Piceance Basin, Rio Blanco and Garfield Counties, Colorado. U.S. Geological Survey Water Resources Investigations Report 85-4118. http://pubs.er.usgs.gov/usgspubs/wri/wri854118
Yochum, S. 2003. Regional Bankfull Characteristics for the Lower Willow Creek Stream
Restoration, USDA NRCS Northern Plains Engineering Team, Lakewood, CO. 22 p. http://www.willowcreede.org/floodcontrol/WillowCreekRegionalBankfullCharacteristics.pdf

A - 2
FLORIDA Metcalf, C. 2004. Regional Channel Characteristics for Maintaining Natural Fluvial
Geomorphology in Florida Streams. U.S. Fish and Wildlife Service, Panama City Fisheries Resource Office. Panama City, FL. http://www.dot.state.fl.us/research-center/Completed_Proj/Summary_EMO/FDOT_BD470_final.pdf
Metcalf, C.K., S.D. Wilkerson, and W.A. Harman. 2009. Bankfull regional curves for north
and northwest Florida streams. Journal of the American Water Resources Association 45(5): 1260-1272.
GEORGIA Pruitt, B.A. 2001. Hydrologic and soil conditions across hydrogeomorphic settings. PhD
dissertation, University of Georgia, Athens, GA. 223.p. http://www.libs.uga.edu/science/
IDAHO Emmet, W.W. 1975. The channels and waters of the Upper Salmon River area, Idaho. U.S.
Geologic Survey, Professional Paper 870-A. U.S. Government Printing Office, Washington, D.C. 116 p.
KANSAS Emmert, B.A. 2004. Regional curve development for Kansas. In J.L. D’Ambrosio (ed).
Proceedings Self-Sustaining Solutions for Streams, Wetlands, and Watersheds, 12-15, September 2004. St. Paul, Minnesota. American Society of Agricultural Engineers, St. Joseph, MI. http://asae.frymulti.com/conference.asp?confid=sww2004
KENTUCKY Mater, B.D., A.C. Parola, Jr., C. Hansen, and M.S. Jones. 2009. Geomorphic
Characteristics of Streams in the Western Kentucky Coal Field Physiographic Region of Kentucky. Final Report prepared by University of Louisville, Stream Institute for the Kentucky Division of Water, Frankfort, KY. http://www.water.ky.gov/permitting/wqcert/
Parola, A.C., Jr., K. Skinner, A.L. Wood-Curini, W.S. Vesely, C, Hansen, and M.S. Jones.
2005. Bankfull Characteristics of Select Streams in the Four Rivers and Upper Cumberland River Basin Management Units. Final Report prepared by University of Louisville, Stream Institute for the Kentucky Division of Water, Frankfort, KY. http://www.water.ky.gov/permitting/wqcert/
Parola, A.C., Jr., W.S. Vesely, A.L. Wood-Curini, D.J. Hagerty, M.N. French, D.K.
Thaemert, and M.S. Jones. 2005. Geomorphic Characteristics of Streams in the Mississippi Embayment Physiographic Region of Kentucky. Final Report prepared by University of Louisville, Stream Institute for the Kentucky Division of Water, Frankfort, KY. http://www.water.ky.gov/permitting/wqcert/

A - 3
Parola, A.C., Jr., W.S. Vesely, M.A. Croasdaile, C. Hansen, and M.S. Jones. 2007. Geomorphic Characteristics of Streams in the Bluegrass Physiographic Region of Kentucky. Final Report prepared by University of Louisville, Stream Institute for the Kentucky Division of Water, Frankfort, KY. http://www.water.ky.gov/permitting/wqcert/
Pruitt, B.A., W.L. Nutter, and W.B. Ainslie. 1999. Estimating flood frequency in gaged and
ungaged watersheds, In K.J. Hatcher (ed.) Proceedings of the 1999 Georgia Water Resources Conference, March 30-31, 1999, University of Georgia, Athens, GA. http://www.gwri.gatech.edu/uploads/proceedings/1999/PruittB-99.pdf
Vesely, W.S., A.C. Parola, Jr., C. Hansen, and M.S. Jones. 2008. Geomorphic
Characteristics of Streams in the Eastern Kentucky Coal Field Physiographic Region of Kentucky. Final Report prepared by University of Louisville, Stream Institute for the Kentucky Division of Water, Frankfort, KY. http://www.water.ky.gov/permitting/wqcert/
MAINE Dudley, R.W. 2004. Hydraulic geometry relations for rivers in coastal and central Maine:
U.S. Geological Survey Scientific Investigations Report: 2004-5042, 30 p. http://water.usgs.gov/pubs/sir/2004/5042/
MARYLAND Chaplin, J.J. 2005. Development of regional curves relating bankfull-channel geometry and
discharge to drainage area for streams in Pennsylvania and selected areas of Maryland, U.S. Geologic Survey, Scientific Investigations Report 2005-5147.
Cinotto, P.J. 2003. Development of regional curves of bankfull-channel geometry and
discharge for streams in non-urban Piedmont Physiographic Province, Pennsylvania and Maryland: U.S. Geological Survey Water-Resources Investigations Report 03-4014, 27 p. http://pa.water.usgs.gov/reports/wrir03-4014.pdf
Doheny, E.J., and G.T. Fisher. 2007. Hydraulic geometry characteristics of continuous-
record streamflow-gaging stations on four urban watersheds along the main stem of Gwynns Falls, Baltimore County and Baltimore City, Maryland: U.S. Geological Survey Scientific Investigations Report 2006–5190, 24 p. http://pubs.usgs.gov/sir/2006/5190/
Keaton, J.N., T. Messinger, and E.J. Doheny. 2005. Development and analysis of regional
curves for streams in the non-urban valley and Ridge physiographic provinces, Maryland, Virginia, and West Virginia: U.S. Geological Survey Scientific Report 2005-5076, 116 p. http://pubs.usgs.gov/sir/2005/5076/sir05_5076.pdf
Krstolic, J.L., and J.J. Chaplin. 2007. Bankfull regional curves for streams in the non-urban,
non-tidal Coastal Plain Physiographic Province, Virginia and Maryland: U.S.

A - 4
Geological Survey Scientific Investigations Report 2007–5162, 48 p. http://pubs.usgs.gov/sir/2007/5162/pdf/SIR2007-5162.pdf
McCandless, T.L., and R.A. Everett. 2002. Maryland stream survey: bankfull discharge and
channel characteristics of streams in the Piedmont hydrologic region: U.S. Fish and Wildlife Service, Annapolis, Maryland, CBFO-S02-01, 163 p. http://www.fws.gov/chesapeakebay/pdf/Piedmont.pdf
McCandless, T.L. and R.A. Everett. 2003. Maryland stream survey: bankfull discharge and
channel characteristics of streams in the Allegheny Plateau and the Valley and Ridge hydrologic region: U.S. Fish and Wildlife Service, Annapolis, Maryland, CBFO-S03-01, 92 p. http://www.fws.gov/chesapeakebay/pdf/plateauweb.pdf
McCandless, T.L. 2003. Maryland stream survey: bankfull discharge and channel
characteristics of streams in the Coastal Plain hydrologic region: U.S. Fish and Wildlife Service, Annapolis, Maryland, CBFO-S03-02, 89 p. http://www.fws.gov/chesapeakebay/pdf/plain.pdf
Miller, K.F. 2003. Assessment of channel geometry data through May 2003 in the mid-
Atlantic highlands of Maryland, Pennsylvania, Virginia, and West Virginia: U.S. Geological Survey Open-File Report 03-388, 22 p.
White, K.E. 2001. Regional curve development and selection of a references reach in the
non-urban lowland sections of the piedmont physiographic province, Pennsylvania and Maryland: U.S. Geological Survey Water-Resources Investigations Report 01-4146, 20 p. http://pa.water.usgs.gov/reports/wrir01-4146.pdf
MASSACHUSETTES Bent, G.C., and A.M. Waite. (In review). Methods for estimating bankfull channel geometry
and discharge for streams in Massachusetts: U.S. Geological Survey Scientific Investigations Report 2008–XXXX, XX p.
MICHIGAN Mistak, J.L. and D.A. Stille. 2008. Regional hydraulic geometry curve for the Upper
Menominee River, Fisheries Technical Report 2008-1, Michigan Department of Natural Resources, Lansing, MI. http://www.michigan.gov/deq/0,1607,7-135-3313_3684_41228-141575--,00.html
Rachol, C.M. and K. Boley-Morse. 2009. Estimated Bankfull Discharge for Selected
Michigan Rivers and Regional Hydraulic Geometry Curves for Estimating Bankfull Characteristics in Southern Michigan Rivers. U.S. Geologic Survey, Scientific Investigations Report 2009-5133, 300 pp. http://pubs.er.usgs.gov/usgspubs/sir/sir20095133

A - 5
MINNESOTA Padmanabhan, G. and B.H. Johnson. 2010. Regional Dimensionless Rating Curves to
Estimate Design Flows and Stages. Journal of Spatial Hydrology 10(1):41-75. http://www.spatialhydrology.com/journal/papersping2010/Regional%20Dimensionless%20Rating%20Curves.pdf
MONTANA Lawlor, S.M. 2004. Determination of Channel-Morphology Characteristics, Bankfull
Discharge, and Various Design-Peak Discharges in Western Montana. U.S. Geologic Survey, Scientific Investigations Report 2004-5263, Reston, VA. http://pubs.usgs.gov/sir/2004/5263/
NEW ENGLAND Bent, G.C., 2006, Equations for estimating bankfull-channel geometry and discharge for
streams in the northeastern United States, In Proceedings of the Joint Federal Interagency Conference, 3rd Federal Interagency Hydrologic Modeling Conference and 8th Federal Interagency Sedimentation Conference, Reno, Nevada, April 2-6, 2006. http://pubs.usgs.gov/misc/FISC_1947-2006/pdf/1st-7thFISCs-CD/8thFISC/8thFISC.pdf
NEW MEXICO Jackson, F. 1994. Documenting channel condition in New Mexico. Stream Notes Special
Summer Issue 1994, Stream Systems Technology Center, U.S. Forest Service, Fort Collins, CO. pg 3-5.
Moody, T., M. Wirtanen, and S.N. Yard. 2003. Regional Relationships for Bankfull Stage in
Natural Channels of the Arid Southwest, Natural Channel Design, Inc. Flagstaff, AZ. 38 p. http://www.naturalchanneldesign.com/NCD%20Reports.htm
NEW YORK Baldigo, B. 2004. Regionalization of channel geomorphology characteristics for streams of
New York State, excluding Long Island: U.S. Geological Survey, New York Water Science Center. http://ny.water.usgs.gov/projects/summaries/2457-A29-1.html
Bent, G.C. 2006. Equations for estimating bankfull-channel geometry and discharge for
streams in the northeastern United States: Proceedings of the Joint Federal Interagency Conference, Book of Abstracts, 3rd Federal Interagency Hydrologic Modeling Conference and 8th Federal Interagency Sedimentation Conference, Reno, Nevada, April 2-6, 2006, 314 p.
Miller, S.J., and D. Davis. 2003. Optimizing Catskill Mountain regional bankfull discharge
and hydraulic geometry relationships: Proceedings of the American Water Resources Association, 2003 International Congress, Watershed management for water supply systems, New York City, N.Y., June 29-July 2, 2003, 10 p. http://www.nyc.gov/html/dep/watershed/pdf/smp.pdf
A - 6
Mulvihill, C.I., A.G. Ernst, and B.P. Baldigo. 2005. Regionalized equations for bankfull
discharge and channel characteristics of streams in New York state: hydrologic region 6 in the southern tier of New York: U.S. Geological Survey Scientific Investigations Report 2005-5100, 21 p. http://ny.water.usgs.gov/pubs/wri/sir055100/sir2005-5100.pdf
Mulvihill, C.I., A.G. Ernst, and B.P. Baldigo. 2006. Regionalized equations for bankfull-
discharge and channel characteristics of streams in New York State: hydrologic region 7 in western New York: U.S. Geological Survey Scientific Investigations Report 2006-5075, 14 p. http://ny.water.usgs.gov/pubs/wri/sir065075/sir2006-5075.pdf
Mulvihill, C.I., A. Filopowicz, A. Coleman, and B.P. Baldigo. 2007. Regionalized equations
for bankfull discharge and channel characteristics of streams in New York State—hydrologic regions 1 and 2 in the Adirondack region of northern New York: U.S. Geological Survey Scientific Investigations Report 2007-5189, 18 p. http://pubs.usgs.gov/sir/2007/5189/
Mulvihill, C.I. and B.P. Baldigo. 2007. Regionalized equations for bankfull-discharge and
channel characteristics of streams in New York State—hydrologic region 3 east of the Hudson River: U.S. Geological Survey Scientific Investigations Report 2007–5227, 15 p. http://pubs.usgs.gov/sir/2007/5227/pdf/SIR2007-5227.pdf
Powell, R.O., S.J. Miller, B.E. Westergard, C.I. Mulvihill, B.P. Baldigo, A.S. Gallagher, and
R.R. Starr. 2004. Guidelines for surveying bankfull channel geometry and developing regional hydraulic-geometry relations for streams of New York State: U.S. Geological Survey Open-File Report 03-092, 20 p. http://ny.water.usgs.gov/pubs/of/of03092/of03-092.pdf
Westergard, B.E., C.I. Mulvihill, A.G. Ernst, and B.P. Baldigo. 2005. Regional equations for
bankfull discharge and channel characteristics of stream in New York State - hydrologic region 5 in central New York: U.S. Geological Survey Scientific Investigations Report 2004-5247, 16p. http://ny.water.usgs.gov/pubs/wri/sir045247/
NORTH CAROLINA Doll, B.A., A.D. Dobbins, J. Spooner, D.R. Clinton, and D.A. Bidelspach. 2003. Hydraulic
geometry relationships for rural North Carolina Coastal Plain streams, NC Stream Restoration Institute, Report to NC Division of Water Quality for 319 Grant Project No. EW20011, 11 pp. http://www.bae.ncsu.edu/programs/extension/wqg/srp/techresources.html
Doll, B.A., D.E. Wise-Frederick, C.M. Buckner, S.D. Wilkerson, W.A. Harman, R.E. Smith,
and J. Spooner. 2002. Hydraulic geometry relationships for urban streams throughout the Piedmont of North Carolina. Journal of the American Water Resources Association 38(3): 641-651.

A - 7
Harman, W.H., G.D. Jennings, J.M. Patterson, D.R. Clinton, L.O. Slate, A.G. Jessup, J.R. Everhart, and R.E. Smith. 1999. Bankfull hydraulic geometry relationships for North Carolina streams, in D.S. Olsen and J.P. Potyondy (eds) Proc. Wildland Hydrology Symposium, June 30-July 2, 1999, Bozeman, MT. American Water Resources Association. http://www.bae.ncsu.edu/programs/extension/wqg/srp/techresources.html
Harman, W.H., D.E. Wise, M.A. Walker, R. Morris, M.A. Cantrell, M. Clemmons, G.D.
Jennings, D. Clinton, and J. Patterson. 2000. Bankkfull regional curves for North Carolina mountain streams, Pgs 185-190 in D.L. Kane (ed) Proc. AWRA Conference on Water Resources in Extreme Environments, Anchorage, AK. http://www.bae.ncsu.edu/programs/extension/wqg/srp/techresources.html
Sweet, W.V., and J.W. Geratz. 2003. Bankfull hydraulic geometry relationships and
recurrence for North Carolina’s Coastal Plain. Journal of the American Water Resources Association 39(4): 861-871.
NORTH DAKOTA Padmanabhan, G. and B.H. Johnson. 2010. Regional Dimensionless Rating Curves to
Estimate Design Flows and Stages. Journal of Spatial Hydrology 10(1):41-75. http://www.spatialhydrology.com/journal/papersping2010/Regional%20Dimensionless%20Rating%20Curves.pdf
OHIO Chang, T.J., Y.Y. Fang, H. Wu, and D.E. Mecklenburg. 2004. Bankfull channel dimensions
in southeast Ohio, in Proceedings of the Self-Sustaining Solutions for Streams, Wetlands, and Watersheds Conference, American Society of Agricultural Engineers, September 2004: 9 p.
Sherwood, J.M., and C.A. Huitger. 2005. Bankfull characteristics of Ohio streams and their
relation to peak streamflows: U.S. Geological Survey Scientific Investigations Report 2005-5153, 38 p. http://pubs.usgs.gov/sir/2005/5153/pdf/Bankfull_book.pdf
OKLAHOMA Dutnell, R.C. 2010. Development of Bankfull Discharge and Channel Geometry
Relationships for Natural Channel Design in Oklahoma Using a Fluvial Geomorphic Approach, Masters Thesis, University of Oklahoma, Norman, OK. 95 p. http://www.riverman-engineering.com/index_files/Page473.htm
OREGON Kuck, T.D. 2000. Regional Hydraulic Geometry Curves of the South Umpqua Area in
Southwestern Oregon. Stream Notes, January 2000, Stream Systems Technology Center, USDA Forest Service, Rocky Mountain Research Station, Ft. Collins, CO. http://stream.fs.fed.us/news/streamnt/pdf/SN_1_00.pdf
A - 8
PENNSYLVANIA Chaplin, J.J. 2005. Development of regional curves relating bankfull-channel geometry and
discharge to drainage area for streams in Pennsylvania and selected areas of Maryland, U.S. Geologic Survey, Scientific Investigations Report 2005-5147.
Cinotto, P.J. 2003. Development of regional curves of bankfull-channel geometry and
discharge for streams in non-urban Piedmont Physiographic Province, Pennsylvania and Maryland: U.S. Geological Survey Water-Resources Investigations Report 03-4014, 27 p. http://pa.water.usgs.gov/reports/wrir03-4014.pdf
Miller, K.F. 2003. Assessment of channel geometry data through May 2003 in the mid-
Atlantic highlands of Maryland, Pennsylvania, Virginia, and West Virginia: U.S. Geological Survey Open-File Report 03-388, 22 p.
White, K.E. 2001. Regional curve development and selection of a references reach in the
non-urban lowland sections of the piedmont physiographic province, Pennsylvania and Maryland: U.S. Geological Survey Water-Resources Investigations Report 01-4146, 20 p. http://pa.water.usgs.gov/reports/wrir01-4146.pdf
SOUTH CAROLINA Arcadis. 2004. "Development of South Carolina Rural Piedmont Regional Curves."
Presented at the 2004 NC SRI Southeastern Regional Conference on Stream Restoration. June 21-24, 2004, Winston-Salem, North Carolina. http://www.bae.ncsu.edu/programs/extension/wqg/sri/2004_conference/pdf_files/mcintyre.pdf
TENNESSEE Babbit, G.S. 2005. "Bankfull Hydraulic Geometry of Streams Draining the Southwestern
Appalachians of Tennessee." Master’sThesis, University of Tennessee. Knoxville, TN. http://www.researchgate.net/publication/36180144_Bankfull_hydraulic_geometry_of_streams_draining_the_Southwestern_Appalachians_of_Tennessee_electronic_resource_
Smith, D. and L. Turrini-Smith. 1999. Western Tennessee fluvial geomorphic regional curves: Report to U. S. Environmental Protection Agency, Region IV, Water Management Division, August 31, 1999. Atlanta, GA.
VERMONT VDEC. 2006. Vermont regional hydraulic geometry curves. Vermont Department of
Environmental Conservation, River Management Program, January 2006, 4 p. http://www.anr.state.vt.us/dec/waterq/rivers/htm/rv_geoassess.htm
VIRGINIA Austin, S.H. 2006. Hydraulic geometry equations and coefficients, Virginia Department of
Forestry web site, http://www.dof.virginia.gov/wq/ref-streams-hyd-geo-coeff.shtml

A - 9
Keaton, J.N., T. Messinger, and E.J. Doheny.2005. Development and analysis of regional curves for streams in the non-urban valley and Ridge physiographic provinces, Maryland, Virginia, and West Virginia: U.S. Geological Survey Scientific Report 2005-5076, 116 p. http://pubs.usgs.gov/sir/2005/5076/sir05_5076.pdf
Krstolic, J.L. and J.J. Chaplin. 2007. Bankfull regional curves for streams in the non-urban,
non-tidal Coastal Plain Physiographic Province, Virginia and Maryland: U.S. Geological Survey Scientific Investigations Report 2007–5162, 48 p. http://pubs.usgs.gov/sir/2007/5162/pdf/SIR2007-5162.pdf
Lotspeich, R.R. 2009. Regional Curves of Bankfull Channel Geometry for Non-Urban
Streams in the Piedmont Physiographic Province, Virginia. U.S. Geological Survey Scientific Investigations Report 2009-5206, 51 p. pubs.usgs.gov/sir/2009/5206/pdf/sir2009-5206.pdf
Miller, K.F. 2003. Assessment of channel geometry data through May 2003 in the mid-
Atlantic highlands of Maryland, Pennsylvania, Virginia, and West Virginia: U.S. Geological Survey Open-File Report 03-388, 22 p.
WEST VIRGINIA Keaton, J.N., T. Messinger, and E.J. Doheny. 2005. Development and analysis of regional
curves for streams in the non-urban valley and ridge physiographic provinces, Maryland, Virginia, and West Virginia: U.S. Geological Survey Scientific Report 2005-5076, 116 p. http://pubs.usgs.gov/sir/2005/5076/sir05_5076.pdf
Messinger, T. and J.B. Wiley. 2004. Regional relations in bankfull channel characteristics
determined from flow measurements at selected stream-gaging stations in West Virginia, 1911-2002: U.S. Geological Survey Water-Resources Investigations Report 03-4276, 43 p. http://pubs.usgs.gov/wri/wri034276/
Messinger, T. 2009. Regional curves for bankfull channel characteristics in the Appalachian
Plateaus, West Virginia: U.S. Geological Survey Scientific Investigations Report 2009-5242, 43 p. http://pubs.usgs.gov/sir/2009/5242/
Miller, K.F. 2003. Assessment of channel geometry data through May 2003 in the mid-
Atlantic highlands of Maryland, Pennsylvania, Virginia, and West Virginia: U.S. Geological Survey Open-File Report 03-388, 22 p.
WYOMING Dunne, T.D. and L.B. Leopold. 1978. Water in Environmental Planning. W.H. Freeman and
Company, NY.818 p.
A - 10
NATIONWIDE RESOURCES U.S. Department of Agriculture, Natural Resources Conservation Service, National Water
Management Center. 2004. Regional hydraulic geometry curves database: http://wmc.ar.nrcs.usda.gov/technical/HHSWR/Geomorphic/index.html

Part II
Reviews of Representative Stream Assessment
and Mitigation Protocols

II - ii
ABBREVIATIONS
Dbkf Bankfull depth DO Dissolved oxygen DOC Dissolved organic carbon EMAP Environmental Monitoring and Assessment Program est Estimate GIS Geographic Information System IBI Index of Biotic Integrity max Maximum min Minimum QA/QC Quality Assurance / Quality Control O/E Observed:Expected ratio opt Optional RBP Rapid Bioassessment Protocols (Barbour et al., 1999) REMAP Regional Environmental Monitoring and Assessment Program TSS Total dissolved solids USACE U.S. Army Corps of Engineers USDA U.S. Department of Agriculture USEPA U.S. Environmental Protection Agency USFS U.S. Forest Service USGS U.S. Geologic Survey Wbkf Bankfull width Wfpa Flood prone width

II - iii
LIST OF PROTOCOL REVIEWS
1. Rapid Bioassessment Protocols for Use in Streams and Wadeable Rivers,
U.S. Environmental Protection Agency ...................................................................II - 1
2. Revised Methods for Characterizing Stream Habitat in the National Water Quality Assessment Program, U.S. Geologic Survey .............................................II - 3
3. Field Operations Manual for Assessing the Hydrologic Permanence and Ecological Condition of Headwater Streams, U.S. Environmental Protection Agency ....................................................................................................................II - 5
4. Environmental Monitoring and Assessment Program (EMAP), Physical Habitat Characterization, U.S. Environmental Protection Agency ..........................II - 7
5. Methods for Evaluating Stream, Riparian, and Biotic Conditions, U.S. Forest Service ....................................................................................................................II -10
6. Wadeable Streams Assessment: Field Operations Manual, U.S. Environmental Protection Agency ...........................................................................II -12
7. Watershed Assessment of River Stability & Sediment Supply (WARSSS), Rosgen/U.S. Environmental Protection Agency .....................................................II -16
8. Stream Geomorphic Assessment Protocol Handbooks, Vermont Agency of Natural Resources ..................................................................................................II -18
9. A Physical Habitat Index for Freshwater Wadeable Streams in Maryland, Maryland Department of Natural Resources ...........................................................II -21
10. Physical Habitat and Water Chemistry Assessment Protocol for Wadeable Streams Monitoring, Minnesota Pollution Control Agency ......................................II -24
11. Field evaluation manual for Ohio’s primary headwater habitat streams, Ohio Environmental Protection Agency ...........................................................................II -26
12. The Qualitative Habitat Evaluation Index (QHEI), Ohio Environmental Protection Agency ...................................................................................................II -29
13. Guidelines for Evaluating Fish Habitat in Wisconsin Streams, U.S. Forest Service ....................................................................................................................II -31
14. Physical Habitat of Aquatic Ecosystems, Texas Commission on Environmental Quality .............................................................................................II -33
15. Subjective Evaluation of Aquatic Habitats, Kansas Department of Wildlife & Parks .......................................................................................................................II -35

II - iv
16. Effectiveness monitoring for streams and riparian areas: sampling protocol for stream channel attributes, AREMP & PACFISH/INFISH (PIBO) .......................II -37
17. R1/R4 (Northern and Intermountain Regions) Fish and Fish Habitat Standard Inventory Procedures Handbook, U.S. Forest Service ............................II -39
18. Effectiveness monitoring for streams and riparian areas within the Pacific Northwest: stream channel methods for core attributes, AREMP & PACFISH/INFISH (PIBO) .......................................................................................II - 41
19. A Manual of Procedures for Sampling Surface Waters, Arizona Department of Environmental Quality .........................................................................................II - 43
20. Stream Condition Inventory (SCI) Technical Guide, U.S. Forest Service ...............II - 46
21. Idaho Small Stream Ecological Assessment Framework, Idaho Department of Environmental Quality .........................................................................................II - 48
22. Idaho River Ecological Assessment Framework, Idaho Department of Environmental Quality .............................................................................................II - 51
23. Beneficial Use Reconnaissance Program Field Manual for Streams, Idaho Department of Environmental Quality .....................................................................II - 54
24. Methods for Stream Habitat Surveys, Oregon Department of Fish and Wildlife .....................................................................................................................II - 56
25. Stream Inventory Handbook: Levels I & II, U.S. Forest Service .............................II - 58
26. Functional Assessment Approach for High Gradient Streams: West Virginia, U.S. Army Corps of Engineers, Huntington District ................................................II - 60
27. West Virginia Stream and Wetland Valuation Metric, West Virginia Interagency Review Team ......................................................................................II - 62
28. [Virginia] Unified Stream Methodology, U.S. Army Corps of Engineers, Norfolk District and Virginia Department of Environmental Quality.........................II - 65
29. Standard Operating Procedure: Compensatory Mitigation, U.S. Army Corps of Engineers, Charleston District .............................................................................II - 67
30. [Kentucky] Draft Stream Relocation/Mitigation Guidelines, Kentucky Division of Water ...................................................................................................................II - 69
31. Stream Assessment Protocol for Headwater Streams in the Eastern Kentucky Coalfield Region, U.S. Army Corps of Engineers, Louisville District .......II - 71
32. Stream Mitigation Guidelines [NC], U.S. Army Corps of Engineers, Wilmington District ..................................................................................................II - 73

II - 1
Name Rapid Bioassessment Protocols for Use in Streams and Wadeable Rivers
Catalog No. 1
Primary Author/ Agency
USEPA Barbour, M.T., J. Gerritsen, B.D. Snyder, and J.B. Stribling. 1999. Rapid Bioassessment Protocols for
Use in Streams and Wadeable Rivers: Periphyton, Benthic Macroinvertebrates, and Fish, Second Edition. EPA 841-B-99–002. USEPA Office of Water, Washington, D.C.
Electronic Resource http://:www.epa.gov/owow/monitoring/rbp/
Intended Use/Purpose
Non-Regulatory Condition Assessment; Inventory; Ambient Monitoring.
Target Resource Type
Wadeable Streams
Scale/Unit of Assessment Stream reach, 100 meters
Geographic Applicability Nationwide
General Level of Effort
Varies based on the specific components of the protocol that are employed: Easy (rapid), Moderate, or Intensive (1 day± in the field by a trained or experienced crew of 2 or more persons).
Assessment Parameters
Habitat Assessment Index (based on visual observation)
Channel/Valley Morphology:
Channel alteration (H, L)1; frequency of riffles or bends (H); sinuosity (L); pool substrate characterization (L); Velocity/depth combinations (H); pool variability (L); bank stability (H, L).
Physical Habitat: Epifaunal substrate/available cover (H, L); embeddedness (H); sediment deposition (H, L); channel flow status (H, L); bank vegetative protection (H, L); riparian zone width (H, L).
Water Quality: - -
Biology: - -
Other: - - 1 H = applicable in high gradient streams; L = applicable in low gradient streams.
Additional Assessment Parameters
Channel/Valley Morphology:
- -
Physical Habitat: Stream velocity; stream depth; canopy cover class; woody debris tally; substrate particle size classes (est.);predominant riparian vegetation type; dominant aquatic vegetation type and species.
Water Quality: Temperature, specific conductivity; dissolved oxygen; pH; turbidity; water odors (classes); surface oils (classes); sediment odors (classes).
Biology: Periphyton (quantitative protocols for single habitat and multi-habitat provided and field-based rapid periphyton survey protocol described); benthic macroinvertebrates (single habitat and multi-habitat protocols provided); fish.
Other: Predominant surrounding land use.
Resolution Qualitative (descriptive); Semi-Quantitative (ordinal scale, rank, etc.) ~ mostly applicable to physical habitat assessment; Quantitative (actual measurement or estimate) ~ mostly applicable to biological assessment(s).

II - 2
Name Rapid Bioassessment Protocols for Use in Streams and Wadeable Rivers
Catalog No. 1
Output Condition Assessment ~ once data analyses and regional relationships have been developed. Index (e.g. numeric score) ~ physical habitat; Raw data ~ biological data.
Reference
Barbour et al. (1999) stress that regional reference conditions should be used to scale the assessment to the ‘best attainable conditions’ for synoptic surveys or those for monitoring trends over time. However, the authors also state that site-specific reference conditions may be better suited to assess specific sources of stream impact.
QA/QC
The RBP stresses that practitioners should be trained in the assessment procedure and work in teams in order to minimize observer bias. Specific QA/QC measures for both field sampling and laboratory analysis (if applicable) are provided for each main chapter in the RBP manual (e.g. benthic macroinvertebrates, fish, etc).
Description/ Summary
The primary purpose of the Rapid Bioassessment Protocols for Use in Wadeable Streams and Rivers (RBP) is "to describe a practical technical reference for conducting cost-effective biological assessments of lotic ecosystems," (Barbour et al., 1999). The author advocate integrated assessments of stream condition that incorporate physical habitat, water quality, and biological measures, such as periphyton, benthic macroinvertebrates, and fish. The RBP stream habitat assessment is a visual-based rapid assessment that relies upon visual characterizations of ten stream features in order to categorize the quality of those features as either poor, marginal, suboptimal, or optimal. The range of quality from poor to optimal is further defined on a point scale from 0 to 20 for each stream habitat parameter assessed. Thus, the maximum point score for the RBP habitat assessment is 200. Quality descriptions are outlined on the field data sheets and further described and illustrated in the text of the RBP manual itself. There are a few different or modified stream habitat parameters used in the assessment based on whether the stream has a high gradient and therefore dominated by riffle/run habitat types and coarse substrate, or a low gradient dominated by glide/pool habitats and typically finer substrates. Barbour et al. (1999) also outline biological data analysis techniques, discuss the integration of physical habitat data and biological data, and suggest methods of reporting and graphically summarizing RBP data. Numerous data forms are provided, and examples of concepts and ideas are illustrated with real data from around the country. Step by step field procedures are suggested and equipment lists provided.
Expertise Required
Not stated.
Time Necessary to Conduct Assessment
Barbour et al. (1999) describe the general RBP habitat assessment, as reviewed herein, as a Level I approach that takes approximately 15-20 minutes in the field. However, the authors also suggest that more quantitative and less ambiguous measures of stream habitat parameters, such as USEPA EMAP methods (Kaufmann and Robison, 1997), result in considerably greater precision.
Seasonality
Periphyton: Late summer or early fall; Benthic Macroinvertebrates: Depends on program objectives. Fish: Mid to late summer. Physical Habitat: Not stated.
Related Procedures/ References
Kaufmann, P.R., and E.G. Robison. 1998. Physical Habitat Characterization, Section 7 in J.M. Lazorchak et al. (eds). EMAP- Surface Waters: Field Operations and Methods for Measuring the Ecological Condition of Wadeable Streams. EPA/620/R-94/004F, USEPA, Washington, D.C.
Other/Notes
The RBP has become a defining framework for biological assessment programs in many U.S. States. The RBP Habitat Assessment Index in particular is an especially common component of other local or regional stream assessment protocols. Barbour et al (1999) stress that implementation of the RBP is enhanced by developing empirical relationships between habitat quality and biological conditions within specific geographic regions.

II - 3
Name Revised Methods for Characterizing Stream Habitat in the National Water Quality Assessment Program
Catalog No. 2
Primary Author/ Agency
U.S. Geologic Survey Fitzpatrick, F.A., I.R. Waite, P.J. D'Arconte, M.R. Meador, M.A. Maupin, and M.E. Gurtz. 1998. Revised
Methods for Characterizing Stream Habitat in the National Water Quality Assessment Program. U.S. Geologic Survey, WRI Report 98-4052, Raleigh, NC. 67 pp.
Electronic Resource http://pubs.usgs.gov/wri/wri984052/
Intended Use/Purpose
Inventory; Ambient Monitoring.
Target Resource Type
Wadeable and non-wadeable streams.
Scale/Unit of Assessment
Stream reach, 20X the mean wetted channel width (Wadeable streams: minimum 150 meters, maximum 300 meters; Non-wadeable streams: minimum 500 meters, maximum 1,000 meters). Fitzpatrick et al. (1998) also present procedures for collecting and analyzing data at basin and channel segment scales via GIS, topographic mapping, and aerial photography.
Geographic Applicability Nationwide.
General Level of Effort
Moderate to Intensive.
Assessment Parameters
Channel/Valley Morphology:
(optional)
Stream discharge; water surface gradient; water depth; flow velocity; wetted channel width; channel habitat units [bed forms]; sinuosity; channel gradient; bankfull stage; bank angle; bank height; bank stability index (based on bank angle, bank vegetative cover, bank height, & dominant bank substrate); cross-sectional channel dimensions; substrate particle size analysis (est. required; pebble counts, optional).
Physical Habitat: In-stream cover (type and percent-cover); bank vegetative cover; embeddedness; riparian vegetative cover (densiometer).
Water Quality: - -
Biology: Riparian vegetation stem density, basal area, & speciation (via point-centered quarter method, optional).
Other: Stream order; watershed area; cumulative perennial stream length; drainage density; basin length; drainage shape (ratio of drainage area and the square of the basin length); basin relief; basin relief ratio (ratio of basin relief and basin length); entire stream gradient (ratio of difference between elevation at 85% and 10% of stream length and the stream length between these two points); dominant riparian land use.
Resolution Qualitative (descriptive); Semi-Quantitative (ordinal scale, rank, etc.); and Quantitative (actual measurement or estimate).
Output Raw data
Reference N/A (The objective of the method or procedure is not presented in the context of defining the condition of a resource. However, it may be used to identify or establish reference conditions.)

II - 4
Name Revised Methods for Characterizing Stream Habitat in the National Water Quality Assessment Program
Catalog No. 2
QA/QC Not stated.
Description/ Summary
The goal of the National Water Quality Assessment (NAWQA) Program is to assess status and trends in water quality nationwide and to develop an understanding of the major factors influencing observed conditions and trends. Stream habitat assessments are conducted as part of the NAWQA Program in order measure habitat characteristics essential in describing and interpreting water chemistry and biological conditions (Fitzpatrick et al., 1998). These procedures allow for appropriate habitat descriptions and standardization of measurement techniques to facilitate unbiased evaluations of habitat influences on stream conditions at local, regional, and national scales (Fitzpatrick et al., 1998). The Revised Methods for NAWQA stream habitat characterizations integrate data at four spatial scales: 1) basin (watershed); 2) segment; 3) reach; and 4) microhabitat. Basin and segment-scale assessments are undertaken using GIS, topographic maps, aerial photographs, etc. A stream segment is defined in the NAWQA program as "a length of stream that is relatively homogeneous with respect to physical, chemical, and biological properties," and may be over several kilometers long (Fitzpatrick et al., 1998). Watershed size, climate and potential runoff characteristics, and land use are determined at the basin-scale, while stream gradient, sinuosity, and water management features are measured at the segment-scale. A computer program called “Basinsoft” has been developed by USGS to quantify a number of basin characteristics using GIS (Harvey and Eash, 1996). The stream reach scale is most commonly at issue for restoration and mitigation projects, and the remainder of this summary will focus primarily on stream reach scale aspects of the NAWQA Revised Methods. Reach-scale data is collected in the field from 11 systematically placed, equally-spaced transects (channel cross-sections); the spacing of which is based on stream width. The Revised Methods includes quantitative, semi-quantitative, and qualitative metrics. Specific methods for measuring or estimating reach-scale data are provided, and numerous illustrative graphs and figures are used to clarify concepts and instructions. There are additional sampling procedures for optional parameters, as noted in the Assessment Parameters section above. Data forms are provided for recording basin, segment, and reach scale data, although it is acknowledged that some may need revision to meet local needs. The Revised Methods manual also includes a suggested data management hierarchy that is available on the internet, which can be imported into a variety of commercial spreadsheet and database software applications. Data analysis is described, and specific statistical procedures that can be utilized to identify relationships among habitat variables and/or relationships among habitat variables and biological components of the stream system are recommended.
Expertise Required Not stated.
Time Necessary to Conduct Assessment
Not stated.
Seasonality Not stated.
Related Procedures/ References
Harvey, C.A. and D.A. Eash. 1996. Description, instructions, and verification for Basinsoft, a computer program to quantify drainage-basin characteristics, U.S. Geologic Survey Water Resources Investigations Report 95-4287. 25 pp.
Other/Notes

II - 5
Name Field Operations Manual for Assessing the Hydrologic Permanence and Ecological Condition of Headwater Streams Catalog No. 3
Primary Author/ Agency
U.S. EPA Fritz, K.M., B.R. Johnson, and D.M. Walters. 2006. Field Operations Manual for Assessing the Hydrologic
Permanence and Ecological Condition of Headwater Streams. EPA/600/R-06/126. U.S. Environmental Protection Agency, office of Research and Development, Washington, D.C.
Electronic Resource http://www.epa.gov/eerd/manual/headwater.htm
Intended Use/Purpose Inventory; Ambient Monitoring.
Target Resource Type
Headwater streams (ephemeral, intermittent, and perennial) with a drainage area less than 1 square mile.
Scale/Unit of Assessment Stream reach, 40x the channel width (~30 meters), absent of any tributary confluence
Geographic Applicability
Forested, temperate regions (study sites were located in Indiana, Illinois, Kentucky, Ohio, New Hampshire, New York, Vermont, Washington, and West Virginia).
General Level of Effort
Intensive
Assessment Parameters
Channel/Valley Morphology:
Stream discharge; water depth; flow velocity; wetted channel width; channel gradient; categorical channel habitat units (erosional habitats vs. depositional habitats); sinuosity (no. of complete meanders in sample reach); bankfull width; bankfull depth; floodprone area width; depth to bedrock; depth to groundwater; streambed sediment moisture content; substrate particle size classes.
Physical Habitat: Riparian vegetative cover (densiometer).
Water Quality: Temperature; conductivity; pH; dissolved oxygen.
Biology: Bryophytes (qualitative or quantitative); algae (qualitative or quantitative); benthic invertebrates (quantitative); amphibians (semi-quantitative).
Other: - -
Resolution Qualitative (descriptive; categorical), Semi-Quantitative (ordinal scale, rank, etc.), and Quantitative (actual measurement or estimates).
Output Raw data
Reference N/A (The objective of the method or procedure is not presented in the context of defining the condition of a resource. However, it may be used to identify or establish reference conditions.)
QA/QC Not stated.
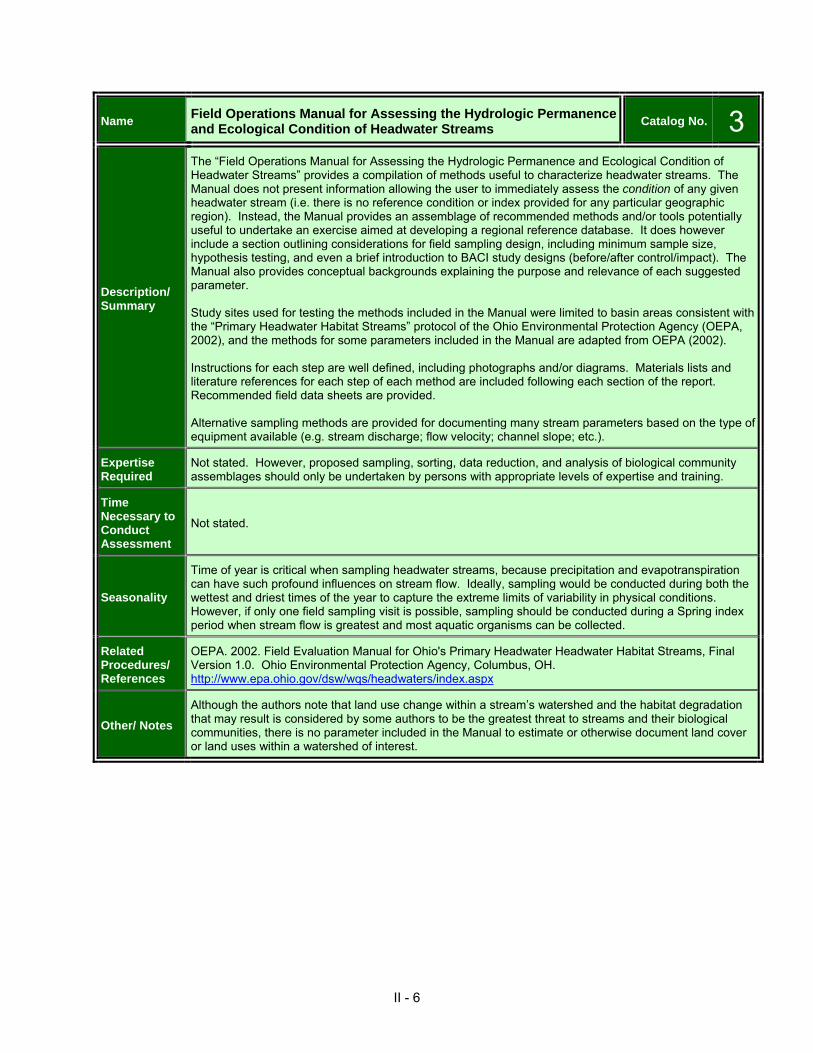
II - 6
Name Field Operations Manual for Assessing the Hydrologic Permanence and Ecological Condition of Headwater Streams Catalog No. 3
Description/ Summary
The “Field Operations Manual for Assessing the Hydrologic Permanence and Ecological Condition of Headwater Streams” provides a compilation of methods useful to characterize headwater streams. The Manual does not present information allowing the user to immediately assess the condition of any given headwater stream (i.e. there is no reference condition or index provided for any particular geographic region). Instead, the Manual provides an assemblage of recommended methods and/or tools potentially useful to undertake an exercise aimed at developing a regional reference database. It does however include a section outlining considerations for field sampling design, including minimum sample size, hypothesis testing, and even a brief introduction to BACI study designs (before/after control/impact). The Manual also provides conceptual backgrounds explaining the purpose and relevance of each suggested parameter. Study sites used for testing the methods included in the Manual were limited to basin areas consistent with the “Primary Headwater Habitat Streams” protocol of the Ohio Environmental Protection Agency (OEPA, 2002), and the methods for some parameters included in the Manual are adapted from OEPA (2002). Instructions for each step are well defined, including photographs and/or diagrams. Materials lists and literature references for each step of each method are included following each section of the report. Recommended field data sheets are provided. Alternative sampling methods are provided for documenting many stream parameters based on the type of equipment available (e.g. stream discharge; flow velocity; channel slope; etc.).
Expertise Required
Not stated. However, proposed sampling, sorting, data reduction, and analysis of biological community assemblages should only be undertaken by persons with appropriate levels of expertise and training.
Time Necessary to Conduct Assessment
Not stated.
Seasonality
Time of year is critical when sampling headwater streams, because precipitation and evapotranspiration can have such profound influences on stream flow. Ideally, sampling would be conducted during both the wettest and driest times of the year to capture the extreme limits of variability in physical conditions. However, if only one field sampling visit is possible, sampling should be conducted during a Spring index period when stream flow is greatest and most aquatic organisms can be collected.
Related Procedures/ References
OEPA. 2002. Field Evaluation Manual for Ohio's Primary Headwater Headwater Habitat Streams, Final Version 1.0. Ohio Environmental Protection Agency, Columbus, OH. http://www.epa.ohio.gov/dsw/wqs/headwaters/index.aspx
Other/ Notes
Although the authors note that land use change within a stream’s watershed and the habitat degradation that may result is considered by some authors to be the greatest threat to streams and their biological communities, there is no parameter included in the Manual to estimate or otherwise document land cover or land uses within a watershed of interest.

II - 7
Name Environmental Monitoring and Assessment Program (EMAP), Physical Habitat Characterization
Catalog No 4
Primary Author/ Agency
Kaufmann, P.R. and E.G. Robison. 1998. Physical Habitat Characterization, Section 7 in J.M. Lazorchak, D.J. Klemm, and D.V. Peck (eds), Environmental Monitoring and Assessment Program- Surface Waters: Field Operations and Methods for Measuring the Ecological Condition of Wadeable Streams. U.S. Environmental Protection Agency, EPA/620/R-94/004F, Washington, D.C.
Electronic Resource http://www.epa.gov/emap/html/pubs/docs/groupdocs/surfwatr/field/ws_abs.html
Intended Use/Purpose
Non-Regulatory Condition Assessment; Ambient Monitoring
Target Resource Type
Wadeable Streams
Scale/Unit of Assessment Stream reach, 40X low flow wetted width (minimum 150 meters)
Geographic Applicability Nationwide
General Level of Effort Moderate
Assessment Parameters
Channel / Valley Morphology
Stream discharge; water depth; channel habitat units [bed forms]; pool formative features; wetted channel width; channel gradient; bankfull width; bankfull height; bank height; bank angle; substrate particle size classes (est.); embeddedness (est.); bank undercut distance.
Physical Habitat Woody debris tally; areal cover class of fish concealment structures (est.); aerial cover class (est.) of aquatic macrophytes and filamentous algae; riparian vegetative cover (densiometer); relative aerial cover class (est.) and type (e.g. woody trees) of riparian vegetation in canopy, mid-layer, and ground cover.
Water Quality Temperature; conductivity; acid neutralizing capacity; dissolved organic carbon; nutrients; turbidity; total suspended solids; color; major cations and anions.
Biology - -
Other Observation of human disturbance and proximity to stream channel.
Resolution Qualitative (descriptive); Semi-Quantitative (ordinal scale, rank, etc.); Quantitative (actual measurement or estimate).
Output Raw data. However, Kaufmann et al. (1999) provide detailed procedures that can be used to calculate metrics related to stream reach and riparian habitat quality using EMAP PHC field data.
Reference N/A (The objective of the method or procedure is not presented in the context of defining the condition of a resource. However, it may be used to identify or establish reference conditions.)
QA/QC Kaufmann et al. (1999) discuss the precision associated with EMAP Physical Habitat Characterization measurements and metrics based on extensive field trials in Oregon and the Mid-Atlantic region.

II - 8
Name Environmental Monitoring and Assessment Program (EMAP), Physical Habitat Characterization
Catalog No 4
Description/ Summary
The USEPA Environmental Monitoring and Assessment Program (EMAP) is a research program aimed at developing the tools necessary to monitor and assess the status and trends of national ecological resources. EMAP protocols have been used to assess the regional condition of wadeable streams in the Pacific Northwest, the Mid-Atlantic, the greater 12-State western U.S., and the central U.S. They also served as the basis for the Wadeable Streams Assessment (USEPA, 2006), which was a nationwide State and Federal agency collaborative effort to statistically summarize the condition of the Nation’s streams. The EMAP Physical Habitat Characterization (PHC) is one component of the broader EMAP protocols, which also include: water chemistry, stream discharge, periphyton, sediment community metabolism, sediment toxicity, benthic macroinvertebrates, aquatic vertebrates, fish tissue contaminants, and rapid habitat and visual stream assessments (Lazorchak et al. 1998). There are four broad components of EMAP PHC: 1) stream discharge; 2) thalweg profile; 3) large woody debris tally; and 4) channel and riparian characterization. The target stream reach is divided into 10 equally spaced segments with cross-sections established at each union for a total of 11 cross-sections; the first being established at the downstream end of the reach. Stream discharge is measured at a single carefully selected cross-section following methods in Kaufmann (1998). The thalweg profile is a longitudinal survey of depth, channel habitat units, and presence of soft/small sediment at predetermined intervals based on channel width. The woody debris tally is recorded in each of the 10 reach segments between the cross-sections. Channel and riparian characterization includes measures and/or visual estimation of channel dimensions, substrate, fish cover, bank characteristics, riparian vegetation structure, and evidence of human disturbance. These measures are obtained at each of the 11 cross-sections. The EMAP PHC provides very detailed step-by-step instructions for laying out the sample reach and describes what to measure, how to measure, and in what sequence to measure all of the EMAP PHC components. Channel habitat unit classes are defined for the thalweg profile, large woody debris is defined and various "influence zones" are illustrated for the debris tally, and precise descriptions are provided for the whole suite of channel and riparian characterization variables. Comprehensive data forms are provided, and the EMAP PHC provides a list of equipment and supplies necessary to execute the characterization. Finally, the EMAP PHC recommends notation and data entry features and styles to facilitate quantitative statistical assessment and series analysis of the data following methods in Kaufmann et al. (1999). Kaufmann (draft 2001) revised the EMAP PHC as part of a Western Pilot Study Field Operations Manual for Wadeable Streams (Peck et al., Unpublished 2001 Draft). The Western Pilot PHC includes a number of procedural modifications for collecting data on substrate particle size, in-stream fish cover, human influence, and thalweg channel habitat classification. There are also three new PHC metrics in the Western Pilot: 1) size and proximity of large, old riparian trees and occurrence of invasive plant species in the riparian area; 2) degree of geomorphic channel constraint; and 3) evidence of major floods or debris torrents.
Expertise Required None specified, but the authors stress that the EMAP PHC field methods are easily learned.
Time Necessary to Conduct Assessment
1.5 to 3.5 hours in the field for a two-person crew
Seasonality The EMAP PHC field procedures are most efficiently applied during low flow conditions during the vegetative growing season, but they may be applied during other seasons and higher stream flows.

II - 9
Name Environmental Monitoring and Assessment Program (EMAP), Physical Habitat Characterization
Catalog No 4
Related Procedures/ References
Cuffney, T.F, M.E. Gurtz, and M.R. Meador. 1993. Methods for Collecting Benthic Invertebrate Samples as Part of the National Water-Quality Assessment Program. U.S. Geological Survey Open-File Report 93-406, Raleigh, North Carolina.
Kaufmann, P.R. Unpublished 2001 Draft. Physical Habitat Characterization, Section 7 In D.V. Peck, J.M.
Lazorchak, and D.J. Klemm (eds). Environmental Monitoring and Assessment Program-Surface Waters: Western Pilot Study Field Operations for Wadeable Streams. U.S. Environmental Protection Agency, EPA/xxx/x-xx/xxx, April 2001. Washington, D.C.
Kaufmann, P.R., P. Levine, E.G. Robison, C. Seeliger, and D.V. Peck. 1999. Quantifying Physical Habitat
in Streams. U.S. Environmental Protection Agency, EPA/620/R-99/003, Washington, D.C. Lazorchak, J.M., D.J. Klemm, and D.V. Peck (eds). 1998., Environmental Monitoring and Assessment
Program- Surface Waters: Field Operations and Methods for Measuring the Ecological Condition of Wadeable Streams. U.S. Environmental Protection Agency, EPA/620/R-94/004F, Washington, D.C.
USEPA. 2006. Draft Wadeable Stream Assessment: A Collaborative Survey of the Nation’s Streams. U.S.
Environmental Protection Agency, Office of Water, EPA-841-B-06-002, Washington, D.C.
Other/Notes
EMAP procedures for sampling benthic maroinvertebrates are based on the USEPA Rapid Bioassessment Protocols, but sampling equipment has been modified to allow a single field investigator to conduct the sampling, as recommended by the U.S. Geological Survey National Water Quality Assessment Program (Cuffney et al., 1993). EMAP Aquatic Vertebrate sampling procedures for fish and amphibians utilize the same stream cross-sectional transects as other EMAP procedures. Aquatic vertebrate sampling in wadeable streams utilizes a backpack electro-shocker and block nets or seines. Collection time is based on transect width and should take place for not less than 45 minutes, but no longer than 3 hours.

II - 10
Name Methods for Evaluating Stream, Riparian, and Biotic Conditions Catalog No. 5
Primary Author/ Agency
Platts, W.S., W.F. Megahan, and G.W. Minshall. 1983. Methods for Evaluating Stream, Riparian, and Biotic Conditions. USDA Forest Service Intermountain Forest and Range Experiment Station, General Technical Report INT-138, Ogden, UT. 70 pp.
Electronic Resource http://www.treesearch.fs.fed.us/pubs/29138
Intended Use/Purpose
Inventory; Ambient Monitoring
Target Resource Type
Wadeable Streams
Scale/Unit of Assessment Stream reach of unspecified length.
Geographic Applicability Nationwide
General Level of Effort Moderate to Intensive.
Assessment Parameters
Channel / Valley Morphology:
Stream discharge; water depth; channel habitat units [bed forms]; percent pool; percent riffle; pool formative features; channel gradient; channel elevation; sinuosity; bank angle; physical bank stability; channel cross-sectional dimensions; stream width; substrate particle size classes (est.); embeddedness (est.); bank undercut distance; vegetative bank stability.
Physical Habitat: Woody debris tally; pool quality; in-stream vegetative cover; solar radiation on water surface; riparian vegetative cover type; vegetation overhanging water surface.
Water Quality: - -
Biology: Vegetation use by animals (est.); herbage production and utilization; fish (numerous sampling methods described); benthic macroinvertebrates (numerous sampling methods described).
Other: Stream order.
Resolution Primarily quantitative (actual measurement or estimate) with some semi-quantitative components.
Output Raw data
Reference N/A (The objective of the method or procedure is not presented in the context of defining the condition of a resource. However, it may be used to identify or establish reference conditions.)
QA/QC
An analysis of the accuracy and precision of most of the assessment variables is provided based on time series graphical interpretation of habitat estimates over a 2 to 15 year period in Idaho, Utah, and Nevada relative to the true value of the respective variable. Precision was similarly rated based on confidence intervals obtained for each habitat measurement.

II - 11
Name Methods for Evaluating Stream, Riparian, and Biotic Conditions Catalog No. 5
Description/ Summary
Platts et al. (1983) set out to propose a "valid, objective, quantitative, repeatable procedure that will provide accurate evaluation of the stream and its biotic communities under any set of conditions." Methods for Evaluating Stream, Riparian, and Biotic Conditions presents standardized techniques for measuring aquatic, riparian, and biotic attributes of stream systems, including fish populations and macroinvertebrate assemblages. Platts et al. (1983) stress transect-based methods for physical stream characterization, whereby channel and riparian zone cross-sections (transects) are established from which one or more physical stream and riparian zone attributes are inventoried as they intersect each transect. The authors do not suggest any means of aggregating data collected using these methods into any specific evaluation of stream condition.
Expertise Required Not stated.
Time Necessary to Conduct Assessment
Not stated.
Seasonality Not stated.
Related Procedures/ References
Many of the recommended methods in Platts et al. (1983) have been modified and/or incorporated for use in other stream monitoring and assessment protocols in the two decades since the this manual was published.
Other/Notes

II - 12
Name Wadeable Stream Assessment: Field Operations Manual Catalog No. 6
Primary Author/ Agency
U.S. EPA USEPA. 2004a. Wadeable Streams Assessment: Field Operations Manual. EPA-841-B-04-004. U.S.
Environmental Protection Agency, Office of Water and Office of Research and Development, Washington, D.C.
USEPA. 2006. Wadeable Stream Assessment: A Collaborative Survey of the Nation’s Streams. EPA-841-
B-06-002. U.S. Environmental Protection Agency, Office of Water, Washington, D.C.
Electronic Resource http://www.epa.gov/owow/monitoring/wsa/wsa_fulldocument.pdf
Intended Use/Purpose Ambient Monitoring
Target Resource Type
Wadeable streams; generally 1st thru 3rd order streams (excluding intermittent and ephemeral streams)
Scale/Unit of Assessment Stream reach, 40X the channel width, absent of any tributary confluence or impoundment.
Geographic Applicability Nationwide
General Level of Effort
Intense (1 day± in the field by a trained or experienced crew of 2 or more persons)
Assessment Parameters
Channel / Valley Morphology:
Stream discharge; channel gradient; channel sinuosity; channel cross-sectional dimensions; bank height; bank angle; channel habitat units [aka bed forms]; wetted channel width; substrate particle size classes (est.); bank undercut distance;.
Physical Habitat: Woody debris tally; areal cover class of fish concealment structures (est.); embeddedness (est.); riparian vegetative cover (densiometer) and type in canopy, mid-layer, and ground cover; rapid visual-based habitat assessment (RBP).
Water Quality: - -
Biology: Benthic macroinvertebrates.
Other: Presence of anthropogenic disturbance within 10 meters of streambanks.
Resolution
Semi-Quantitative (ordinal scale, rank, etc.): Most of methods included are quantitative, except for the rapid habitat assessment and some other estimates of metrics in lieu of actual measurements. Quantitative (actual measurement or estimate): According to the authors, systematic spatial sampling design for physical habitat measurements collected from channel cross sections scales the sample reach and resolution in proportion to stream size and allows for statistical and series analyses of the data.
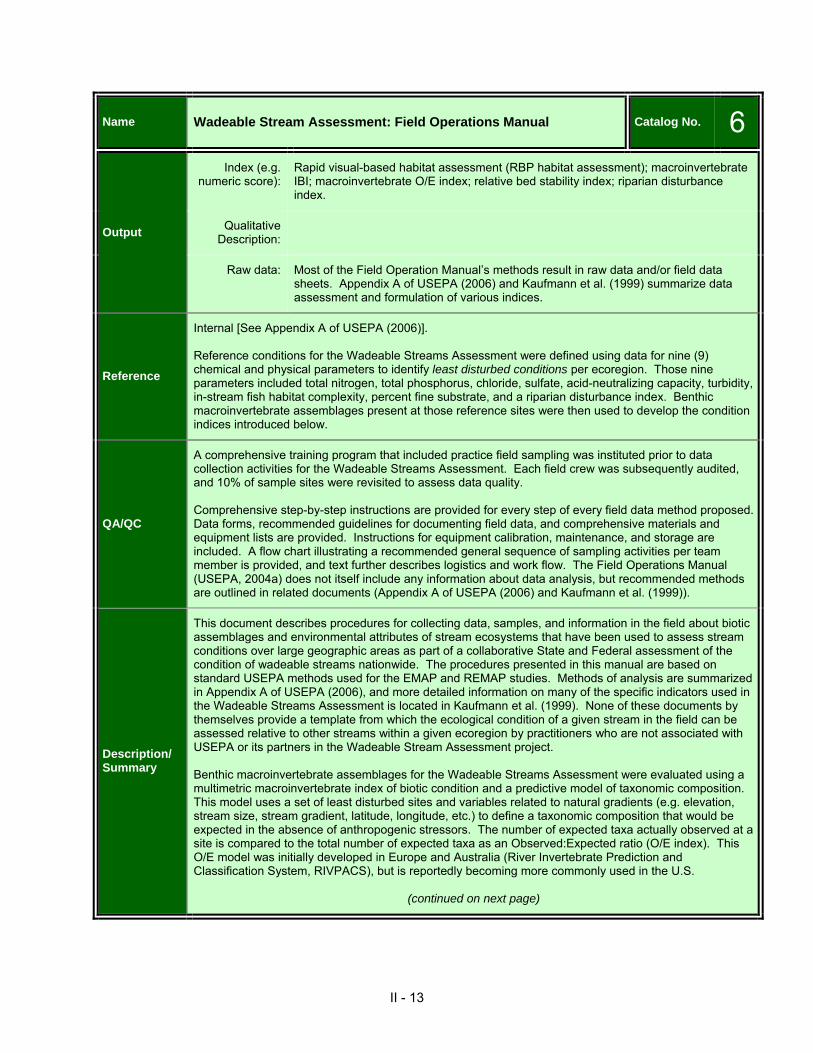
II - 13
Name Wadeable Stream Assessment: Field Operations Manual Catalog No. 6
Output
Index (e.g. numeric score):
Rapid visual-based habitat assessment (RBP habitat assessment); macroinvertebrate IBI; macroinvertebrate O/E index; relative bed stability index; riparian disturbance index.
Qualitative Description:
Raw data: Most of the Field Operation Manual’s methods result in raw data and/or field data sheets. Appendix A of USEPA (2006) and Kaufmann et al. (1999) summarize data assessment and formulation of various indices.
Reference
Internal [See Appendix A of USEPA (2006)]. Reference conditions for the Wadeable Streams Assessment were defined using data for nine (9) chemical and physical parameters to identify least disturbed conditions per ecoregion. Those nine parameters included total nitrogen, total phosphorus, chloride, sulfate, acid-neutralizing capacity, turbidity, in-stream fish habitat complexity, percent fine substrate, and a riparian disturbance index. Benthic macroinvertebrate assemblages present at those reference sites were then used to develop the condition indices introduced below.
QA/QC
A comprehensive training program that included practice field sampling was instituted prior to data collection activities for the Wadeable Streams Assessment. Each field crew was subsequently audited, and 10% of sample sites were revisited to assess data quality. Comprehensive step-by-step instructions are provided for every step of every field data method proposed. Data forms, recommended guidelines for documenting field data, and comprehensive materials and equipment lists are provided. Instructions for equipment calibration, maintenance, and storage are included. A flow chart illustrating a recommended general sequence of sampling activities per team member is provided, and text further describes logistics and work flow. The Field Operations Manual (USEPA, 2004a) does not itself include any information about data analysis, but recommended methods are outlined in related documents (Appendix A of USEPA (2006) and Kaufmann et al. (1999)).
Description/ Summary
This document describes procedures for collecting data, samples, and information in the field about biotic assemblages and environmental attributes of stream ecosystems that have been used to assess stream conditions over large geographic areas as part of a collaborative State and Federal assessment of the condition of wadeable streams nationwide. The procedures presented in this manual are based on standard USEPA methods used for the EMAP and REMAP studies. Methods of analysis are summarized in Appendix A of USEPA (2006), and more detailed information on many of the specific indicators used in the Wadeable Streams Assessment is located in Kaufmann et al. (1999). None of these documents by themselves provide a template from which the ecological condition of a given stream in the field can be assessed relative to other streams within a given ecoregion by practitioners who are not associated with USEPA or its partners in the Wadeable Stream Assessment project. Benthic macroinvertebrate assemblages for the Wadeable Streams Assessment were evaluated using a multimetric macroinvertebrate index of biotic condition and a predictive model of taxonomic composition. This model uses a set of least disturbed sites and variables related to natural gradients (e.g. elevation, stream size, stream gradient, latitude, longitude, etc.) to define a taxonomic composition that would be expected in the absence of anthropogenic stressors. The number of expected taxa actually observed at a site is compared to the total number of expected taxa as an Observed:Expected ratio (O/E index). This O/E model was initially developed in Europe and Australia (River Invertebrate Prediction and Classification System, RIVPACS), but is reportedly becoming more commonly used in the U.S.
(continued on next page)
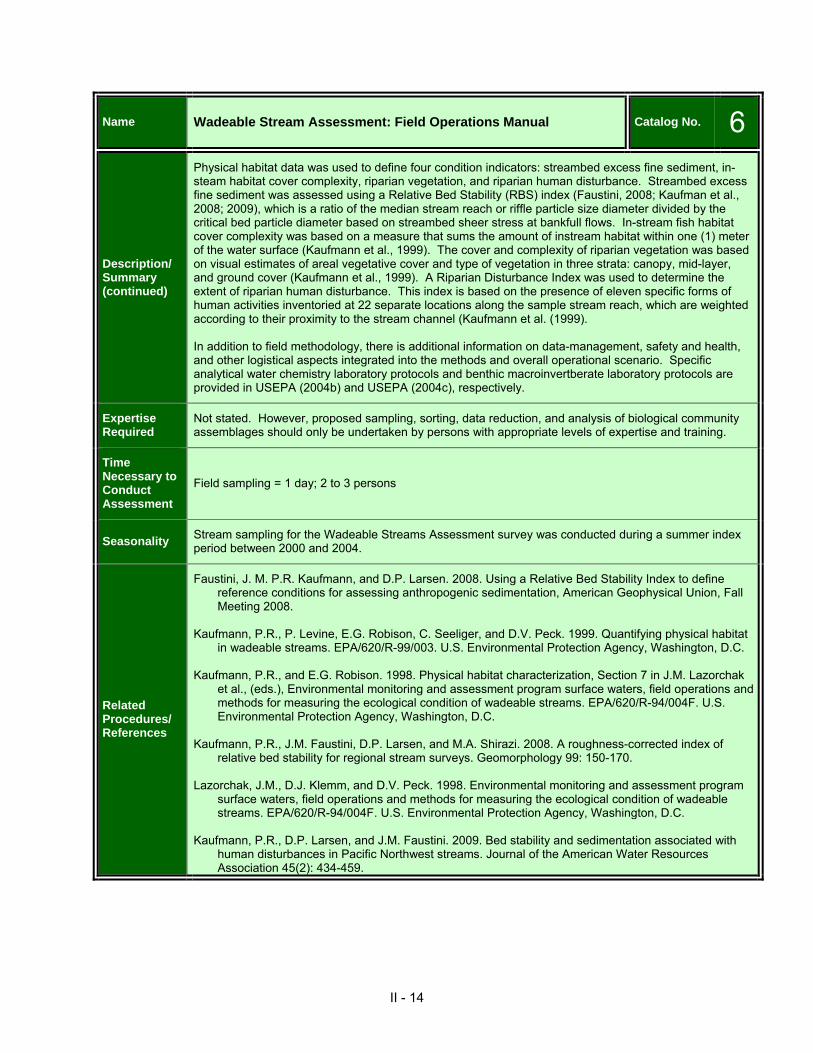
II - 14
Name Wadeable Stream Assessment: Field Operations Manual Catalog No. 6
Description/ Summary (continued)
Physical habitat data was used to define four condition indicators: streambed excess fine sediment, in-steam habitat cover complexity, riparian vegetation, and riparian human disturbance. Streambed excess fine sediment was assessed using a Relative Bed Stability (RBS) index (Faustini, 2008; Kaufman et al., 2008; 2009), which is a ratio of the median stream reach or riffle particle size diameter divided by the critical bed particle diameter based on streambed sheer stress at bankfull flows. In-stream fish habitat cover complexity was based on a measure that sums the amount of instream habitat within one (1) meter of the water surface (Kaufmann et al., 1999). The cover and complexity of riparian vegetation was based on visual estimates of areal vegetative cover and type of vegetation in three strata: canopy, mid-layer, and ground cover (Kaufmann et al., 1999). A Riparian Disturbance Index was used to determine the extent of riparian human disturbance. This index is based on the presence of eleven specific forms of human activities inventoried at 22 separate locations along the sample stream reach, which are weighted according to their proximity to the stream channel (Kaufmann et al. (1999). In addition to field methodology, there is additional information on data-management, safety and health, and other logistical aspects integrated into the methods and overall operational scenario. Specific analytical water chemistry laboratory protocols and benthic macroinvertberate laboratory protocols are provided in USEPA (2004b) and USEPA (2004c), respectively.
Expertise Required
Not stated. However, proposed sampling, sorting, data reduction, and analysis of biological community assemblages should only be undertaken by persons with appropriate levels of expertise and training.
Time Necessary to Conduct Assessment
Field sampling = 1 day; 2 to 3 persons
Seasonality Stream sampling for the Wadeable Streams Assessment survey was conducted during a summer index period between 2000 and 2004.
Related Procedures/ References
Faustini, J. M. P.R. Kaufmann, and D.P. Larsen. 2008. Using a Relative Bed Stability Index to define reference conditions for assessing anthropogenic sedimentation, American Geophysical Union, Fall Meeting 2008.
Kaufmann, P.R., P. Levine, E.G. Robison, C. Seeliger, and D.V. Peck. 1999. Quantifying physical habitat
in wadeable streams. EPA/620/R-99/003. U.S. Environmental Protection Agency, Washington, D.C. Kaufmann, P.R., and E.G. Robison. 1998. Physical habitat characterization, Section 7 in J.M. Lazorchak
et al., (eds.), Environmental monitoring and assessment program surface waters, field operations and methods for measuring the ecological condition of wadeable streams. EPA/620/R-94/004F. U.S. Environmental Protection Agency, Washington, D.C.
Kaufmann, P.R., J.M. Faustini, D.P. Larsen, and M.A. Shirazi. 2008. A roughness-corrected index of
relative bed stability for regional stream surveys. Geomorphology 99: 150-170. Lazorchak, J.M., D.J. Klemm, and D.V. Peck. 1998. Environmental monitoring and assessment program
surface waters, field operations and methods for measuring the ecological condition of wadeable streams. EPA/620/R-94/004F. U.S. Environmental Protection Agency, Washington, D.C.
Kaufmann, P.R., D.P. Larsen, and J.M. Faustini. 2009. Bed stability and sedimentation associated with
human disturbances in Pacific Northwest streams. Journal of the American Water Resources Association 45(2): 434-459.

II - 15
Name Wadeable Stream Assessment: Field Operations Manual Catalog No. 6
Related Procedures/ References (continued)
Peck, D.V., J.M. Lazorchak, and D.J. Klemm (editors). Unpublished 2001 draft. Environmental Monitoring and Assessment Program -Surface Waters: Western Pilot Study Field Operations Manual for Wadeable Streams. EPA/XXX/X-XX/XXXX. U.S. Environmental Protection Agency, Washington, D.C.
USEPA. 2004b. Wadeable Stream Assessment: Benthic Laboratory Methods. EPA841- B-04-007. U.S.
Environmental Protection Agency, Office of Water and Office of Research and Development, Washington, DC.
USEPA. 2004c. National Wadeable Stream Assessment: Water Chemistry Laboratory Manual. EPA841-
B-04-008. U.S. Environmental Protection Agency, Office of Water and Office of Research and Development, Washington, DC.
Other/Notes

II - 16
Name Watershed Assessment of River Stability and Sediment Supply (WARSSS) Catalog No. 7
Primary Author/ Agency
Rosgen, D. 2007. Watershed Assessment of River Stability and Sediment Supply (WARSSS). Wildland Hydrology. Fort Collins, CO. 193 pp.
Electronic Resource http://www.epa.gov/warsss/
Intended Use/Purpose
Non-Regulatory Condition Assessment (of sediment supply and channel stability); Inventory; Ambient Monitoring.
Target Resource Type
Not stated.
Scale/Unit of Assessment
Three-phases: I) Watershed-level reconnaissance; II) Watershed-level inventory; III) Stream reaches, specific hillslopes, etc.
Geographic Applicability Nationwide.
General Level of Effort Intensive (1 day± in the field by a trained or experienced crew of 2 or more persons)
Assessment Parameters
Channel/Valley Morphology:
Bankfull stream discharge; Rosgen stream classification; regional curves (bankfull dimensions vs drainage area); bankfull width & depth; radius of curvature; bank height; bank height ratio; cross-sectional channel dimensions; entrenchment ratio; floodprone area width; maximum depth; sinuosity; longitudinal profile; meander length; meander belt width; valley slope; modified Pfankuch channel stability index; bank erosion hazard index (BEHI); near-bank stress (NBS); percent & type of channel alteration; percent of channel blockage (including woody debris, structures, etc.); substrate particle size (pebble count); water surface slope; channel habitat units [bed forms]; pool length & spacing; pool length:riffle width ratio; channel evolutionary stage.
Physical Habitat: Percent altered riparian vegetation; length of channel with altered riparian vegetation.
Water Quality: Suspended sediment load & bedload [measured using methods in Edwards and Glysson (1999)].
Biology: Riparian species composition and percent coverage per strata.
Other: Stream order; watershed area; watershed land use.
Resolution Qualitative (descriptive); Semi-Quantitative (ordinal scale, rank, etc.); Quantitative (actual measurement or estimate).
Output Condition Assessment (of sediment supply and channel stability); Index (e.g. numeric score); Raw data.
Reference Regional reference conditions required, but not built-in to the assessment.
QA/QC Not stated.

II - 17
Name Watershed Assessment of River Stability and Sediment Supply (WARSSS) Catalog No. 7
Description/ Summary
The Watershed Assessment of River Stability and Sediment Supply (WARSSS) was developed by Dave Rosgen with the support of the U.S. Environmental Protection Agency (USEPA). USEPA has developed an internet-based assessment tool using WARSS, which is the principle source of this review. WARSSS utilizes a three-phase approach to assess both suspended and bedload sediment in rivers and streams. Collectively, execution of all three phases of WARSSS may take numerous months and include a multitude of data intensive field investigations and analyses. Results of the assessment can be used to evaluate known or suspected sediment problems, develop sediment remediation and management components of watershed plans, develop sediment TMDLs (Total Maximum Daily Loads), and other uses. Phase I is a Reconnaissance Level Assessment (RLA) that utilizes remote sensing data, published maps, and existing watershed data (e.g. topographic maps, recent and historical aerial photographs, land use/cover and soils maps) to provide a rapid, qualitative assessment of potential sediment sources throughout a watershed. Phase II of the WARSSS is a Rapid Resource Inventory for Sediment & Stability Consequence (RRISSC). The RRISSC phase requires analysis of the type and extent of land uses, the erosion potential of the landscape and channel, and the relationship of potential sediment sources to hillslope, hydrologic and channel processes beginning with target areas identified during the Phase I RLA. A step-by-step risk rating system using a series of worksheets, tables, and relationships of key erosional/depositional process variables is utilized to identify low, moderate, and high risk conditions. The final summary of potential sediment and stream channel stability risk identifies specific areas and stream reaches that may need either mitigation and/or more detailed assessment. The Phase III Prediction Level Assessment (PLA) relies largely on field measurements and is the most detailed level of assessment intended for areas identified as high-risk in the RRISSC. During the PLA, reference conditions are used to determine departure from natural rates of sediment and/or natural channel stability. The PLA analysis ultimately provides data to facilitate the design of well-targeted, site-specific and process-specific management prescriptions. Effectiveness monitoring is critical to compare predicted and observed values and can also be used to determine the effectiveness of the mitigation. The USEPA internet site for WARSSS includes step-by-step instructions for each element of each phase of the assessment, including worksheets, tables, figures, graphs, etc. Background information is provided to familiarize the reader with water quality and biological effects of excessive sediment in rivers and streams. Three case studies are also provided, along with numerous links to additional resources, a glossary, and a considerable bibliography.
Expertise Required
WARSSS is described as requiring expert judgment that is best undertaken by technical personnel very familiar with sediment sources, processes, and effects.
Time Necessary to Conduct Assessment
Three-phases: I) >1 day, depending on the size of the watershed being evaluated; II) >1 week, depending on the size of the watershed being evaluated; III) >1 month, depending on the size of the watershed being evaluated.
Seasonality Not stated.
Related Procedures/ References
Edwards, T.K. and G.D. Glysson. 1999. Field Methods for Measurement of Fluvial Sediment, Techniques of Water-Resources Investigations, Book 3, Chapter 2, U.S. Geological Survey. Reston, VA.
Other/Notes

II - 18
Name [Vermont] Stream Geomorphic Assessment Protocol Handbooks Catalog No. 8
Primary Author/ Agency
Vermont Agency of Natural Resources Kline, M., C. Alexander, S. Pomeroy, S. Jaquith, G. Springston, B. Cahoon, and L. Becker. Various Dates
(2003, rev. 2004). Stream Geomorphic Assessment Protocol Handbooks. Vermont Agency of Natural Resources, Waterbury, VT. www.vtwaterquality.org/rivers.htm
Electronic Resource http://www.anr.state.vt.us/dec/waterq/rivers/htm/rv_geoassesspro.htm
Intended Use/Purpose
Non-Regulatory Condition Assessment; Inventory; Ambient Monitoring.
Target Resource Type
Wadeable Streams
Scale/Unit of Assessment Varies: stream reach to watershed scales
Geographic Applicability Vermont
General Level of Effort
Easy (rapid); Moderate; Intensive (1 day± in the field by a trained or experienced crew of 2 or more persons).
Assessment Parameters
Channel/Valley Morphology:
Channel hydraulic geometry (plan, pattern, and profile); stream classification; bank slope & bank materials; substrate particle size; rapid geomorphic assessment.
Physical Habitat: Woody debris tally; rapid visual-based habitat assessment (RBP); riparian buffer width.
Water Quality: - -
Biology: - -
Other: Watershed land use/land cover; river corridor land use).
Resolution Qualitative (descriptive); Semi-Quantitative (ordinal scale, rank, etc.); and Quantitative (actual measurement or estimate).
Output Semi-quantitative indices representing various geomorphic or physical habitat components; Qualitative Descriptions; and Raw, quantitative data.

II - 19
Name [Vermont] Stream Geomorphic Assessment Protocol Handbooks Catalog No. 8
Reference
Internal: Hydraulic geometry relationships (i.e. regional curves) have been developed and continue to be refined, based on data submitted by users of the Protocols. The Vermont Department of Environmental Conservation has a reference reach program that collects data on geomorphic reference streams statewide, and reports containing reference data from Vermont and other regions by stream type have been drafted. External: Reference stream type must be identified in Phase 1. The reference stream type is defined as the natural stream type that would exist in the absence of anthropogenic changes to the channel, floodplain, and/or watershed. Reference stream type is often based primarily on characteristics of the valley, geology, and climate. Verification and refinement of the reference stream type is made by observing sediment and hydrologic characteristics, as well as channel, floodplain, and terrace land forms during Phases 2 and 3.
QA/QC The Protocols stress that users should establish a quality assurance (QA) program for each phase of assessment. It further outlines three key components of a good QA program and provides detailed descriptions and recommendations for each: training, data review, and use of a data management system.
Description/ Summary
The purpose of the Stream Geomorphic Assessment Protocols is to provide a method for gathering scientifically sound information that can be used for watershed planning and detailed characterization of riparian and in-stream habitat, stream-related erosion, and flood hazards. The Vermont Agency of Natural Resources (VANR) designed the series of three protocol handbooks to consolidate what had traditionally been distinct river and watershed assessment and resource management programs. Collectively, execution of all phases of the Protocols result in an exhaustive, comprehensive documentation of physical and geomorphic attributes of a stream and its watershed. The Protocols are predicated on a geomorphic stream classification system that VANR developed based on Schumm (1977), Rosgen (1994; 1996), and Montgomery and Buffington (1997) that can be used to generally characterize: 1) the relationship of the stream with its floodplain; 2) the respective roles of bed form, relative channel depth, and stream gradient in sediment transport processes; 3) the size and quantity of sediment in transport; 4) the boundary resistance of the stream bed and banks; and 5) hydrologic runoff characteristics. VANR also developed a channel evolution model adapted from Schumm et al. (1984), Rosgen (1996), and Thorne et al. (1997). Both the classification and the channel evolution model help to frame a "sensitivity rating" that represents a stream's potential rate of change in response to either watershed or local disturbance. Parameters used to rate sensitivity include: 1) erodibility of channel boundary materials; 2) sediment and flow regimes (volume and runoff characteristics); 3) confinement (valley width/channel width); and 4) stage of channel evolution (degree of departure from reference stream type conditions). After first introducing fluvial geomorphic processes, including sediment transport, channel evolution, etc., the Protocols provide three separate, but interrelated approaches for assessing geomorphic and physical habitat conditions of stream reaches and watersheds. Phase 1 is based on remote sensing and very limited, reconnaissance-level, field visits where valley types are identified and geologic conditions investigated to identify provisional stream types. Departure from reference conditions can be postulated based on watershed and stream corridor land use and channel or floodplain modifications. Phase 1 assessments are useful to help prioritize stream reaches for potential Phase 2 assessment, and they also serve as cataloguing databases where the results of Phase 2 and 3 assessments can be entered and tracked on a watershed scale over time.
Phase 2 assessments include channel and floodplain cross-sections and stream substrate characterization, all of which is used to identify existing stream type and on-going channel adjustment processes. Qualitative field evaluations of erosion and depositional processes, changes in channel and floodplain geometry, and riparian land use/land cover are used to assess stream geomorphic condition, physical habitat, adjustment processes, reach sensitivity (described previously), and stage of channel evolution. Rapid Habitat Assessment (RHA) and Rapid Geomorphic Assessment (RGA) index values are
Continued on next page
Description/

II - 20
Name [Vermont] Stream Geomorphic Assessment Protocol Handbooks Catalog No. 8
Summary
(continued)
also calculated in Phase 2. The RHA is the 10-metric habitat assessment index included as part of the U.S. EPA rapid bioassessment protocols (Barbour et al., 1999). The RGA is based on assessment of 4 to 6 categorical or ordinal metrics that are summed to result in a single index score. Field data sheets and computer database tools have been developed to facilitate Phase 2 data reduction and reporting. The Phase 2 assessment is ideal for identifying stream reaches for protection and restoration projects and the completion of more intensive Phase 3 surveys. Like Phase 2 assessments, Phase 3 assessments are also completed on a stream reach or sub-reach scale. Phase 3 assessments include the use of field survey equipment and other accurate measuring devices and methods to quantify measurements of channel dimension, pattern, profile, and sediments. These are typically undertaken to support requirements for design and implementation of restoration projects. The VANR also uses Phase 3 assessment protocols to develop reference tools (such as regional hydraulic geometry curves). Spreadsheet and database tools have been developed to facilitate Phase 3 data reduction and reporting. Appendices in the Handbooks provide field data forms, database recommendations and instructions, technical information, and detailed techniques and methods for various components of stream geomorphic assessment.
Expertise Required Technical training is required; Field assistance from VANR specialists is offered on an as available basis.
Time Necessary to Conduct Assessment
Varies Phase 1: based on size of watershed and level of detail; Phase 2: 1 to 2 days per mile of stream length; Phase 3: 3 to 4 days.
Seasonality Not stated.
Related Procedures/ References
Barbour, MT. J. Gerritsen, B.D. Snyder, and J.B. Stribling. 1999. Rapid Bioassessment Protocls for Use in Streams and Wadeable Rivers: Periphyton, Benthic Macroinvertebrates, and Fish, Second Edition. EPA 841-B-99-002. U.S. Environmental Protection Agency, Office of Water, Washington, D.C.
Montgomery, D., and J. Buffington. 1997. Channel-reach Morphology in Mountain Drainage Basins.
Geological Society of America Bulletin; v. 109; no. 5; pp 596-611. Rosgen, D.L. 1994. A classification of natural rivers. Catena: 22 169-199. Rosgen D.L. 1996. Applied Fluvial Morphology. Wildland Hydrology. Pagosa Springs, CO. Schumm, S.A. 1969. River Metamorphosis. Proceedings of the American Society of Civil Engineers,
Journal of the Hydraulics Division, vol. 95, 255-273. Schumm, S.A. 1977. The Fluvial System. John Wiley and Sons, New York. Schumm, S.A., M.D. Harvey, and C.C. Watson. 1984. Incised Channels Morphology, Dynamics, and
Control. Water Resources Publications, Littleton, CO. Thorne, C.R., R.D. Hey, and M.D. Newson. 1997. Applied Fluvial Geomorphology for River Engineering
and Management. John Wiley and Sons, Chichester, UK.
Other/Notes

II - 21
Name A Physical Habitat Index for Freshwater Wadeable Streams in Maryland
Catalog No. 9
Primary Author/ Agency:
Maryland Department of Natural Resources (MDNR) Paul, M.J, J.B. Stribling, R.J. Klauda, P.F. Kazyak, M.T. Southerland, and N.E. Roth. 2002. A Physical
Habitat Index for Freshwater Wadeable Streams in Maryland. CBWP-MANTA-EA-03-4, Maryland Department of Natural Resources, Monitoring and Non-Tidal Assessment Division, Annapolis, MD. 150 pp.
Electronic Resource: http://www.dnr.state.md.us/streams/mbss/mbss_pubs.html#technical
Intended Use/Purpose:
Non-Regulatory Condition Assessment; Inventory; Ambient Monitoring.
Target Resource Type:
Wadeable Streams
Scale/Unit of Assessment: Stream reach of unspecified length.
Geographic Applicability: Maryland
General Level of Effort: Easy
Assessment Parameters:
Coastal Plain:
Channel/Valley Morphology:
Bank stability.
Physical Habitat: In-stream wood; in-stream habitat quality (percent of habitat types present: riffle, run/glide, deep pools, shallow pools, undercut banks, and overhanging cover); epibenthic substrate; shading.
Water Quality: - -
Biology: - -
Other: Remoteness (distance to a road).
Piedmont:
Channel/Valley Morphology:
Bank stability.
Physical Habitat: In-stream wood; in-stream habitat quality; epibenthic substrate; shading; embeddedness; riffle quality.
Water Quality: - -
Biology: - -
Other: Remoteness (distance to a road). continued on next page

II - 22
Name A Physical Habitat Index for Freshwater Wadeable Streams in Maryland
Catalog No. 9
Assessment Parameters: (continued)
Blue Ridge, Ridge and Valley, and Appalachian Plateau:
Channel/Valley Morphology: Bank stability
Physical Habitat: Epibenthic substrate; shading; riparian width.
Water Quality: - -
Biology: - -
Other: Remoteness (distance to a road).
Resolution: Semi-Quantitative (ordinal scale, rank, etc.); Quantitative (actual measurement or estimate)
Output: Index (e.g. numeric score) ~ Physical Habitat Index
Reference: Internal (e.g. Index calibrated to existing local or regional reference data)
QA/QC: Not stated.
Description/ Summary:
The MDNR Physical Habitat Index (PHI) is not itself a procedure for collecting data. Instead, it is a procedure for analyzing physical habitat data into an index capable of predicting biological stream conditions in Maryland. It is specifically reviewed in this report to illustrate a method of calibrating physical stream assessment data with regional biological stream conditions to develop a physical stream assessment protocol with significant independent utility as a tool to predict biological conditions. The PHI has been subsequently modified by MDNR as a physical habitat assessment component for the Maryland Biological Stream Survey (MBSS) sampling protocols (MDNR, 2007). MDNR developed PHI as a multi-metric physical habitat index capable of discriminating reference stream conditions from degraded stream conditions in Maryland. This work updates and revises a provisional PHI developed by MDNR in 1999 (Hall et al., 1999). The PHI was developed by using biological, chemical, land use, and physical stream habitat data that had been collected throughout the State of Maryland from 1994-2000 using methods described in Roth et al. (1999). Streams were classified based on physiographic setting, and selected criteria were used to represent reference and degraded stream conditions (principally land use). Biological data was specifically avoided during selection of reference sites in order to independently assess the discriminatory efficiency of the PHI and avoid the circularity caused by including biological data in a tool to predict biological conditions. Candidate stream habitat metrics were then identified and tested for their ability to discriminate between reference and degraded conditions. The most discriminating and least redundant metrics were then assembled into a final revised PHI (Paul et al., 2002). Different PHI metrics are used for each of three stream classes based on physiography (see Assessment Parameters above). Some PHI metrics are recorded as counts, measurements, or estimates made in the field, while others are rated using standardized MBSS rating methods. Still others are simple presence/absence observations. The method used for collecting data in the field for each metric differs based according to guidance provided in MDNR (2007). Paul et al. (2002) tested sediment texture and relative bed stability (ratio of the median sediment particle diameter to that diameter moved during channel forming flows (Kaufmann et al., 1999)) in 30 streams (15 Piedmont and 15 Coastal Plain) as potential additional metrics that could predict biological integrity for the PHI. While both of these metrics had significant correlations with a benthic IBI, the sample streams lacked the data necessary to compute the PHI and evaluate, whether they could improve discriminatory or predictive value of the PHI.
Expertise Required:
MDNR (2007) states that only persons who have received MBSS training and have demonstrated proficiency performing MBSS physical habitat assessments should conduct MBSS physical habitat assessments.
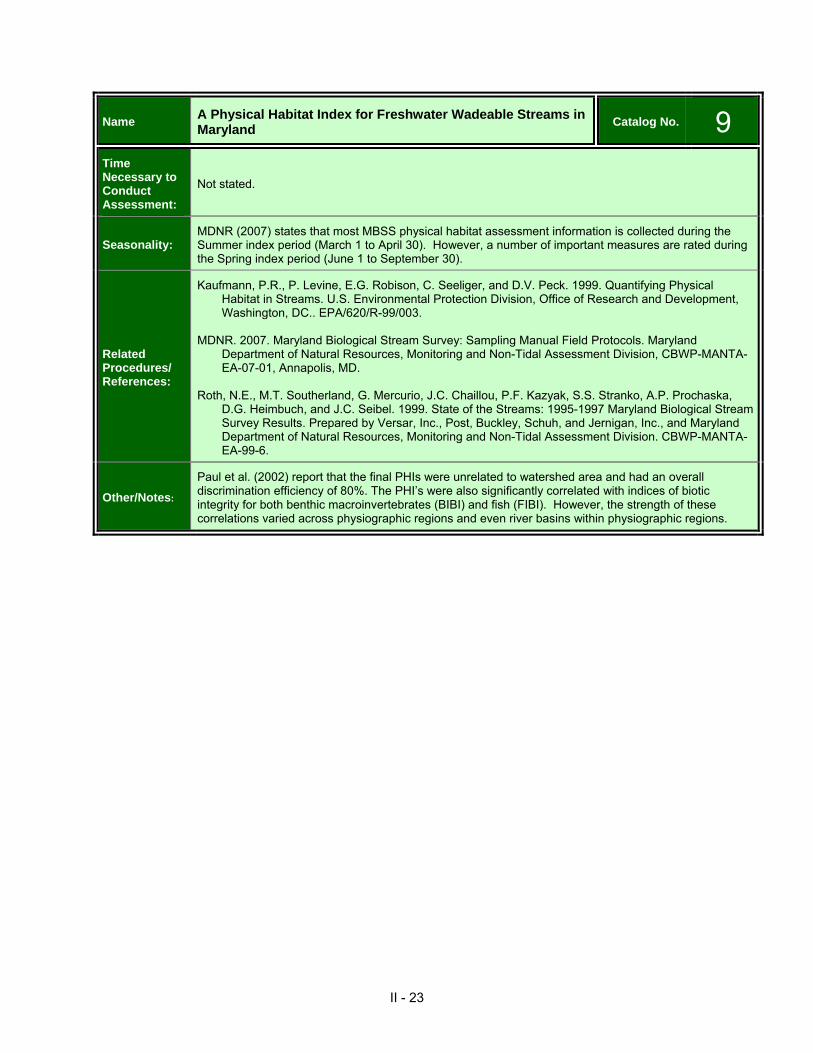
II - 23
Name A Physical Habitat Index for Freshwater Wadeable Streams in Maryland
Catalog No. 9
Time Necessary to Conduct Assessment:
Not stated.
Seasonality: MDNR (2007) states that most MBSS physical habitat assessment information is collected during the Summer index period (March 1 to April 30). However, a number of important measures are rated during the Spring index period (June 1 to September 30).
Related Procedures/ References:
Kaufmann, P.R., P. Levine, E.G. Robison, C. Seeliger, and D.V. Peck. 1999. Quantifying Physical Habitat in Streams. U.S. Environmental Protection Division, Office of Research and Development, Washington, DC.. EPA/620/R-99/003.
MDNR. 2007. Maryland Biological Stream Survey: Sampling Manual Field Protocols. Maryland
Department of Natural Resources, Monitoring and Non-Tidal Assessment Division, CBWP-MANTA-EA-07-01, Annapolis, MD.
Roth, N.E., M.T. Southerland, G. Mercurio, J.C. Chaillou, P.F. Kazyak, S.S. Stranko, A.P. Prochaska,
D.G. Heimbuch, and J.C. Seibel. 1999. State of the Streams: 1995-1997 Maryland Biological Stream Survey Results. Prepared by Versar, Inc., Post, Buckley, Schuh, and Jernigan, Inc., and Maryland Department of Natural Resources, Monitoring and Non-Tidal Assessment Division. CBWP-MANTA-EA-99-6.
Other/Notes:
Paul et al. (2002) report that the final PHIs were unrelated to watershed area and had an overall discrimination efficiency of 80%. The PHI’s were also significantly correlated with indices of biotic integrity for both benthic macroinvertebrates (BIBI) and fish (FIBI). However, the strength of these correlations varied across physiographic regions and even river basins within physiographic regions.

II - 24
Name Physical Habitat and Water Chemistry Assessment Protocol for Wadeable Streams Monitoring Sites Catalog No. 10
Primary Author/ Agency
Minnesota Pollution Control Agency MPCA. 2002. Physical Habitat and Water Chemistry Assessment Protocol for Wadeable Streams
Monitoring Sites. Minnesota Pollution Control Agency, Biological Monitoring Program, December 2002, St. Paul, MN.
Electronic Resource http://www.pca.state.mn.us/water/biomonitoring/bio-streams-fish.html#sops
Intended Use/Purpose
Ambient Monitoring; WQ Standards.
Target Resource Type
Wadeable streams
Scale/Unit of Assessment Stream reach, 35X mean stream width (minimum 150 meters, maximum 500 meters)
Geographic Applicability Minnesota
General Level of Effort Moderate.
Assessment Parameters
Channel/Valley Morphology:
Stream discharge; water depth; mean distance between stream meanders (aka meander wavelength); mean distance between riffles;
Physical Habitat: Depth of fines + water (fines >2 mm diameter); embeddedness (to nearest 25%); dominant substrate class (est.); percent algae (est.); percent-cover of fish concealment structures; percent-cover of streambank with exposed soil; total number of channel habitat units (riffles, pools, runs, bends, and log jams); riparian vegetative cover (densiometer); riparian buffer width.
Water Quality: Air temperature; water temperature; conductivity; dissolved oxygen; turbidity; pH; transparency; total phosphorus; total suspended solids; ammonia; nitrite-nitrate.
Biology: - -
Other: Dominant riparian land use
Resolution Semi-Quantitative (ordinal scale, rank, etc.); Quantitative (actual measurement or estimate).
Output Index (e.g. numeric score) ~ Stream Habitat Assessment (MPCA, 2007). Raw data.
Reference N/A (The objective of the method or procedure is not presented in the context of defining the condition of a resource. However, it may be used to identify or establish reference conditions.)
QA/QC Inexperienced field crew members must receive training. Requisite self-checks whereby field crew personnel cross-reference data collected by other crew members; crew leaders must periodically verify that crew members are adhering to protocol.

II - 25
Name Physical Habitat and Water Chemistry Assessment Protocol for Wadeable Streams Monitoring Sites
Catalog No. 10
Description/ Summary
The Minnesota Pollution Control Agency (MPCA), Biological Monitoring Program developed the Physical Habitat and Water Chemistry Assessment Protocol for Wadeable Stream Monitoring Sites to support assessment of water quality and development of biological criteria for Minnesota streams. These procedures are also applicable for EMAP stations and sites suspected of being impacted by a source of pollution. Quantitative stream habitat data is collected using a transect-point method modified from “Guidelines for evaluating fish habitat in Wisconsin streams” (Simonson et al., 1993). Thirteen equally spaced transects are established perpendicular to stream flow in the sample reach, and measurements or observations of habitat features are recorded from 0.3 m x 0.3 m quadrats set at four equally spaced points (1/5, 2/5, 3/5, and 4/5 of wetted stream width) and the channel thalweg along each transect. Key habitat features include variables describing channel morphology, substrate, cover, and riparian condition (see Assessment Parameters above). Data forms are provided and must be filled out individually for each transect. A single Station Features data sheet records the length and location (spacing) of major morphological and habitat features within the sample reach, including riffles, runs, pools, meander bends, islands, log jams, beaver dams, and other such features that may affect channel morphology, such as bridges, culverts, dams, and tributaries. MPCA also has a Stream Habitat Assessment (SHA) protocol (MPCA, 2007) based on the Ohio Environmental Protection Agency’s Qualitative Habitat Evaluation Index (QHEI) (Rankin, 1989). The SHA assigns scores for many of the stream metrics assessed during the Physical Habitat and Water Chemistry Assessment Protocol (MPCA, 2002) based on aggregate classes of potential results for each metric. The SHA adds a few additional metrics (e.g. surrounding land use within 2-3 square miles of assessment reach) and uses ratios of some existing metrics in order to assign scores (e.g. maximum thalweg depth: shallowest thalweg depth, pool width: riffle width). The maximum SHA score is 100.
Expertise Required
Field technicians must have at least one year of college education and coursework in environmental and/or biological science. Field crew leaders must be a professional aquatic biologist with a minimum of a Bachelor of Science degree in aquatic biology or closely related specialization, and six months field experience sampling physical stream habitat.
Time Necessary to Conduct Assessment
Not stated.
Seasonality Summer index period: mid-June thru mid-September
Related Procedures/ References
MPCA. 2007. Stream Habitat Assessment Protocol for Stream Monitoring Sites. Minnesota Pollution Control Agency, Biological Monitoring Program, March 2007, St. Paul, MN.
MPCA. 2009. Reconnaissance Procedures for Initial Visit to Stream Monitoring Sites. Minnesota
Pollution Control Agency, Biological Monitoring Program, February 2009, St. Paul, MN. Rankin, E.T. 1989. The Qualitative Habitat Evaluation Index (QHEI): Rationale, Methods, and
Application. Ohio Environmental Protection Agency, Division of Water Quality Planning & Assessment, Ecological Assessment Section. Columbus, OH. 73 pp.
Simonson, T.D., J. Lyons, and P.D. Kanehl. 1993. Guidelines for Evaluating Fish Habitat in Wisconsin
Streams. Gen. Tech. Rpt NC-164, USFS North Central Experiment Station, St. Paul, MN. 36 pp.
Other/Notes The MPCA Protocol provides a good example of a semi-quantitative physical stream assessment protocol used in a biological monitoring program.

II - 26
Name Field evaluation manual for Ohio’s primary headwater habitat streams Catalog No. 11
Primary Author/ Agency
Ohio Environmental Protection Agency OEPA. 2002a. Field evaluation manual for Ohio’s primary headwater habitat streams, Version 1.0, July
2002. Ohio Environmental Protection Agency, Division of Surface Water, Columbus, Ohio
Electronic Resource http://www.epa.ohio.gov/dsw/wqs/headwaters/index.aspx
Intended Use/Purpose
Non-Regulatory Condition Assessment; Ambient Monitoring
Target Resource Type
Headwater streams with a drainage area less than 1 square mile (ephemeral, intermittent, or perennial)
Scale/Unit of Assessment Stream reach, 200 feet, or shorter if necessary to avoid channel confluences
Geographic Applicability Ohio
General Level of Effort
Easy to Moderate A three-tiered protocol is presented with corresponding levels of effort 1) Rapid habitat evaluation referred to as the Headwater Habitat Evaluation Index (HHEI); and two levels of biological assessment, 2) Family-level taxonomic identification; and 3) Genus-species level taxonomic identification.
Assessment Parameters
Channel/Valley Morphology:
Bankfull width; channel substrate composition (selected from nine possible categories); maximum pool depth.
Physical Habitat: Riparian buffer width; percent open canopy.
Water Quality: Temperature; pH; conductivity; dissolved oxygen.
Biology: Fish; salamanders; benthic macroinvertebrates (as necessary).
Other: Floodplain land use; development pressure.
Resolution
Dependent on which of three-tier level of assessment is undertaken: Qualitative (descriptive) Semi-Quantitative (ordinal scale, rank, etc.) Quantitative (actual measurement or estimate)
Output Index (e.g. numeric score); Qualitative Description; Raw data; and Programmatic or Regulatory Support Information (WQ standards)
Reference Internal (e.g. Index calibrated to existing local or regional reference data)
QA/QC Not stated.

II - 27
Name Field evaluation manual for Ohio’s primary headwater habitat streams
Catalog No. 11
Description/ Summary
The Field Evaluation Manual for Ohio's Primary Headwater Habitat Streams is intended to promote standardized assessment of actual and expected biological conditions in primary headwater habitat (PHWH) streams in Ohio. The methods outlined in the Manual are designed solely to statistically differentiate among three designated uses of PHWH streams in Ohio, as defined in State water quality standards: Class III PHWH Stream (cool-cold water adapted native fauna); Class II PHWH Stream (warm water adapted native fauna); Class I PHWH Stream (ephemeral stream, normally dry channel). Chemical, biological, and physical habitat evaluations were conducted in PHWH streams throughout Ohio to assess seasonal trends in benthic macroinvertebrate assemblage. Statistical analysis is provided in OEPA (2002b; 2002c; 2002d). The Headwater Habitat Evaluation Index (HHEI) is a rapid habitat evaluation tool based on three physical measurements found to be highly correlated with biological measures of PHWH stream quality in Ohio: i) channel substrate composition; ii) maximum pool depth; and iii) average bankfull width (OEPA, 2002d). The HHEI rapid assessment tool is most predictive when "modified" channels are separated from natural channels having little or no evidence of channel modification. Specific methods are presented for each of the above referenced parameters. Index scores are compared to categories defining each of the above referenced classes of PHWH Streams. All PHWH evaluations also include assessment of riparian zone and floodplain quality (i.e. width and land use), flow regime, sinuosity, and gradient, although none of these factors are included in the calculation of the HHEI score. All of these parameters are simply categorical check-boxes. If the HHEI assessment is questionable, or additional support for the designated use category determined using the HHEI is desired, one can conduct a Headwater Macroinvertebrate Field Evaluation Index (HMFEI) and a rapid bioassessment of vertebrates (salamanders) using one of two tiers of effort presented in the Manual. Specific sampling protocols for each are dutifully referenced. If watershed size is greater than 1.0 square mile or natural deep pools are greater than 40 cm regardless of watershed size, a Qualitative Habitat Evaluation Index (QHEI) evaluation should be completed (Rankin, 1989). Data forms and detailed instructions are provided. There is also a suggested step-by-step procedure for executing an entire assessment, and there is a decision making flowchart to determine appropriate PHWH stream class using the HHEI.
Expertise Required Not stated.
Time Necessary to Conduct Assessment
Varies; dependent on which of three-tier level of assessment is undertaken.
Seasonality June to September is optimal for biological component(s) of the assessment

II - 28
Name Field evaluation manual for Ohio’s primary headwater habitat streams
Catalog No. 11
Related Procedures/ References
OEPA. 2002b. Technical support document for Ohio’s primary headwater streams: fish and amphibian assemblages. Ohio Environmental Protection Agency, Division of Surface Water, Columbus, Ohio.
OEPA. 2002c. Technical support document of Ohio’s primary headwater streams benthic:
macroinvertebrate assemblage. Ohio Environmental Protection Agency, Division of Surface Water, Columbus, Ohio.
OEPA. 2002d. Ohio EPA Primary Headwater Habitat Initiative Data Compendium, 1999-2000 Habitat,
Chemistry, and Stream Morphology Data. Ohio Environmental Protection Agency, Division of Surface Water, Columbus, Ohio.
Rankin, E. 1989. The qualitative habitat evaluation index (QHEI): Rational, methods, and applications.
Ohio Environmental Protection Agency, Division of Surface Water, Columbus, Ohio.
Other/Notes An attempt to relate Rosgen stream class with PHWH stream class was inconclusive; attributed by the authors to most likely be because the Rosgen system was not calibrated to the small watershed size (<1.0 square mile) of PHWH streams (OEPAc, 2002).

II - 29
Name The Qualitative Habitat Evaluation Index (QHEI): Rationale, Methods, and Application
Catalog No. 12
Primary Author/ Agency
Ohio Environmental Protection Agency OEPA. 2006. Methods for Assessing Habitat in Flowing Waters: Using the Qualitative Habitat Evaluation
Index (QHEI). OEPA Technical Bulletin EAS/2006-06-1, Ohio Environmental Protection Agency, Division of Surface Water, Ecological Assessment Section. Columbus, OH. 26 pp.
Rankin, E.T. 1989. The Qualitative Habitat Evaluation Index (QHEI): Rationale, Methods, and
Application. Ohio Environmental Protection Agency, Division of Water Quality Planning & Assessment, Ecological Assessment Section. Columbus, OH. 73 pp.
Electronic Resource http://www.epa.ohio.gov/dsw/bioassess/BioCriteriaProtAqLife.aspx
Intended Use/Purpose
Ambient Monitoring; WQ Standards.
Target Resource Type
Wadeable and non-wadeable streams, although correlations with a fish IBI in Ohio has been found to be weaker in small streams.
Scale/Unit of Assessment Stream reach of unspecified length.
Geographic Applicability
Ohio. However, its use is reported to now include some adjacent states.
General Level of Effort Easy (rapid)
Assessment Parameters
Channel/Valley Morphology:
Sinuosity (categorical classes); presence/absence or recovery state following channelization; channel stability; bank stability; channel gradient; substrate (type/size class, origin, & quality); predominance and development of riffle/pool complexes; pool/glide and riffle/run quality (max pool or glide depth, riffle width & depth, run depth, riffle/run substrate size class, riffle/run embeddedness, flow velocity class).
Physical Habitat: In-stream cover (type and percent-cover class); riparian buffer width; floodplain cover type.
Water Quality: - -
Biology: - -
Other: Watershed area.
Resolution Qualitative (descriptive); Semi-Quantitative (ordinal scale, rank, etc.).
Output Index (e.g. numeric score); Qualitative Description.

II - 30
Name The Qualitative Habitat Evaluation Index (QHEI): Rationale, Methods, and Application
Catalog No. 12
Reference N/A (The objective of the method or procedure is not presented in the context of defining the condition of a resource. However, it may be used to identify or establish reference conditions.)
QA/QC
Rankin (1989) stresses that regular training is a necessity to minimize bias and ensure comparability of assessments among field biologists. Field data sheet headers require that survey crew members indicate their level of QHEI training. At least one crew member must have completed OEPA QHEI training (OEPA, 2006).
Description/ Summary
The Qualitative Habitat Evaluation Index (QHEI) is an index of macro-habitat quality intended to assess stream habitat that is generally accepted to influence fish communities and which is also important to other aquatic life (Rankin, 1989). It was designed as a measure that would require a minimal amount of time and with a minimum of field measurements, but also relies upon experienced field biologists to execute the evaluation within acceptable ranges of accuracy and precision. The QHEI is based on emergent properties of habitat (e.g. sinuosity, pool/riffle development) rather than the individual metrics that shape these properties (e.g. current velocity, depth, substrate size, etc.). A field data sheet, modified in OEPA (2006), provides qualitative condition descriptors for 1 to 7 variables under each of six stream properties. The field surveyor matches the condition description for each variable with observed conditions in the field and checks the appropriate box. Each box includes an affiliated point score. Point scores are totaled for each metric to provide subtotals related to the above six stream properties. The sum of all metric subtotals provides the total QHEI score, which has a maximum of 100. More detailed definitions of terms used on the field data sheet, including broader descriptions and illustrations or drawings of each variable, are provided by OEPA (2006). The QHEI was found to be significantly different among Ohio ecoregions and significantly correlated with fish IBI (Rankin, 1989). However, the correlation with the fish IBI was weaker in wadeable and headwater streams relative to larger channels requiring boat access. Rankin (1989) suggests that due to the inherent interconnectedness of smaller channels with their watersheds and riparian zones, disturbances outside of the stream channel itself may exert a more prominent impact on the biological community, thus affecting IBI more than QHEI and thereby adversely affecting the correlation of the two. Rankin (1989) also notes that general basin characteristics and overall habitat quality exert a greater influence on fish communities than does site specific habitat, such as that assessed using the QHEI. Thus, he concludes, the QHEI (or any other site specific habitat measure) is not inclusive enough to be an absolute site specific predictor of fish communities without further consideration of basin-wide or reach-wide influences on stream biota (Rankin, 1989).
Expertise Required Not stated.
Time Necessary to Conduct Assessment
Not stated.
Seasonality Not stated.
Related Procedures/ References
Ohio EPA. 1989. Biological criteria for the protection of aquatic life: Volume III. Standardized biological field sampling and laboratory methods for assessing fish and macroinvertebrate communities. Ohio Environmental Protection Agency, Columbus, OH.
Other/Notes

II - 31
Name Guidelines for Evaluating Fish Habitat in Wisconsin Streams Catalog No. 13
Primary Author/ Agency
USFS Simonson, T.D., J. Lyons, and P.D. Kanehl. 1993. Guidelines for Evaluating Fish Habitat in Wisconsin
Streams. Gen. Tech. Rpt NC-164, USFS North Central Experiment Station, St. Paul, MN. 36 pp.
Electronic Resource http://www.treesearch.fs.fed.us/pubs/10228
Intended Use/Purpose
Inventory; Ambient Monitoring.
Target Resource Type
Perennial wadeable streams (ideally >1.5m wide with watersheds >13km2)
Scale/Unit of Assessment Stream reach, 35X low flow wetted width (minimum 100 meters)
Geographic Applicability Wisconsin
General Level of Effort Moderate.
Assessment Parameters
Channel / Valley Morphology:
Stream discharge; stage; velocity; wetted width; water depth; channel gradient; mean distance between bends (aka meander wave length); length and spacing of channel habitat units (aka bed forms); percent substrate particle size classes (est.).
Physical Habitat: Bank vegetative protection; embeddedness (est.); fine sediment depth; percent cover and types of fish concealment structures; riparian buffer width; canopy cover (densiometer).
Water Quality: Dissolved oxygen; temperature; conductivity, turbidity.
Biology: - -
Other: Stream order; riparian land use; watershed area.
Resolution Semi-Quantitative (ordinal scale, rank, etc.); Quantitative (actual measurement or estimate).
Output Subjective Index (e.g. numeric score); Qualitative Description; Programmatic or Regulatory Support Information
Reference Not stated. However, the River Fish Habitat Rating (FHR) index was internally calibrated to the Wisconsin fish IBI.
QA/QC Not stated.

II - 32
Name Guidelines for Evaluating Fish Habitat in Wisconsin Streams Catalog No. 13
Description/ Summary
Simonson et al. (1993) recommend that habitat data be collected using the basic framework of the transect method suggested by Platts et al. (1983), where sampling is based on transects spaced two times the mean wetted stream width throughout the sample reach, for a total of at least 18 sample transects per reach. Accuracy of sampling small streams (<10m wide) is not compromised by sampling transects spaced every three times the mean wetted width, but the authors do not recommend any fewer than 18 transects on larger channels (Simonson et al., 1993). Stream habitat characteristics are measured or estimated from one or more locations relative to each transect: 1) within a specified distance above and below the transect, 2) along the transect (e.g., 5m total belt width), or 3) at positions along the transect line, typically four equally spaced positions across the channel, plus the thalweg. Methods to measure or estimate each habitat characteristic are suggested, and the authors also report the accuracy and precision of each method based on their own analysis of survey results. Simonson et al. (1993) provide field data sheets and also discuss data management and analysis. The authors also present Fish Habitat Rating (FHR) indices based on actual field measurements as a means to compare habitat surveys by rating the physical habitat of streams and rivers to support diverse, healthy fish communities. Two different FHR indices are presented one for streams less than 10 meters wide, and a second for rivers 10 to 50 meters wide. The Stream FHR is based on seven selected variables or ratios that are rated poor, fair, good, or excellent based on reference conditions provided in the Guidelines: 1) riparian buffer width, 2) bank erosion, 3) pool area, 4) width/depth ratio, 5) riffle-to-riffle ratio or bend-to-bend ratio (average distance between riffles or bends divided by average stream width), 6) percent fine sediment, and 7) cover for fish. Points are allocated to each quality category and then summed to obtain a total Stream FHR index. The River FHR is based on five selected variables or ratios, including bank stability, maximum thalweg depth, riffle-to-riffle ratio or bend-to-bend ratio, percent rocky substrate, and cover for fish.
Expertise Required: Not stated.
Time Necessary to Conduct Assessment
2 to 4 hours.
Seasonality Baseflow conditions, ideally during Summer.
Related Procedures/ References
Platts, W.S., W.F. Megahan, and G.W. Minshall. 1983. Methods for Evaluating Stream, Riparian, and Biotic Conditions. USDA Forest Service Intermountain Forest and Range Experiment Station, General Technical Report INT-138, Ogden, UT. 70 pp.
Other/Notes The Wisconsin Department of Natural Resources “Guidelines for Evaluating Habitat of Wadeable Streams” closely mirrors Simonson et al. (1993).

II - 33
Name Physical Habitat of Aquatic Ecosystems (Texas) Catalog No. 14
Primary Author/ Agency
Texas Commission on Environmental Quality (TCEQ) TCEQ. 2007. Physical Habitat of Aquatic Ecosystems, Chapter 9 in Surface Water Quality Monitoring
Procedures, Vol. 2: Methods for Collecting and Analyzing Biological Assemblage and Habitat Data. RG-416, Texas Commission on Environmental Quality, Monitoring Operations Division, June 2007.
Electronic Resource http://www.tceq.state.tx.us/comm_exec/forms_pubs/pubs/rg/rg-416/index.html
Intended Use/Purpose
Non-Regulatory Condition Assessment; Inventory; Ambient Monitoring; WQ Standards.
Target Resource Type
Wadeable and Non-wadeable streams. This habitat assessment procedure may be used unmodified in non-flowing streams if water is present in pools covering >50 percent of the sample reach (~intermittent with pools).
Scale/Unit of Assessment:
Wadeable Streams: Stream reach, 40x average stream width; not less than 150m and not more 500m (avoiding significant tributary confluences, bridge crossings, etc.)
Non-wadeable Streams: Stream reach encompassing one full meander; not less than 500m and not more than 1km (avoiding significant tributary confluences, bridge crossings, etc.)
Geographic Applicability Texas
General Level of Effort Easy to Moderate
Assessment Parameters
Channel / Valley Morphology:
Stream discharge; wetted channel width; water depth; channel flow status; channel habitat units [aka bed forms]; maximum pool width; maximum pool depth; maximum pool length; number of riffles; number of flow obstructions; percent bank erosion (est.); dominant substrate particle size class (est.); percent of substrate that is gravel or larger (> 2mm) (est.); channel gradient; bank angle; number and definition of stream bends.
Physical Habitat: Percent-cover and type of vegetation on stream banks and in riparian zone; percent canopy cover (densiometer); riparian buffer width; percent and type of in-stream cover; ordinal est. of algae and macrophyte percent-cover.
Water Quality: Temperature, pH; dissolved oxygen; specific conductance; salinity.
Biology: - -
Other: Stream order; watershed area; categorical riparian zone aesthetics.
Resolution Semi-quantitative
Output Index (e.g. numeric score)~ Habitat Quality Index
Reference Internal to the Habitat Quality Index.
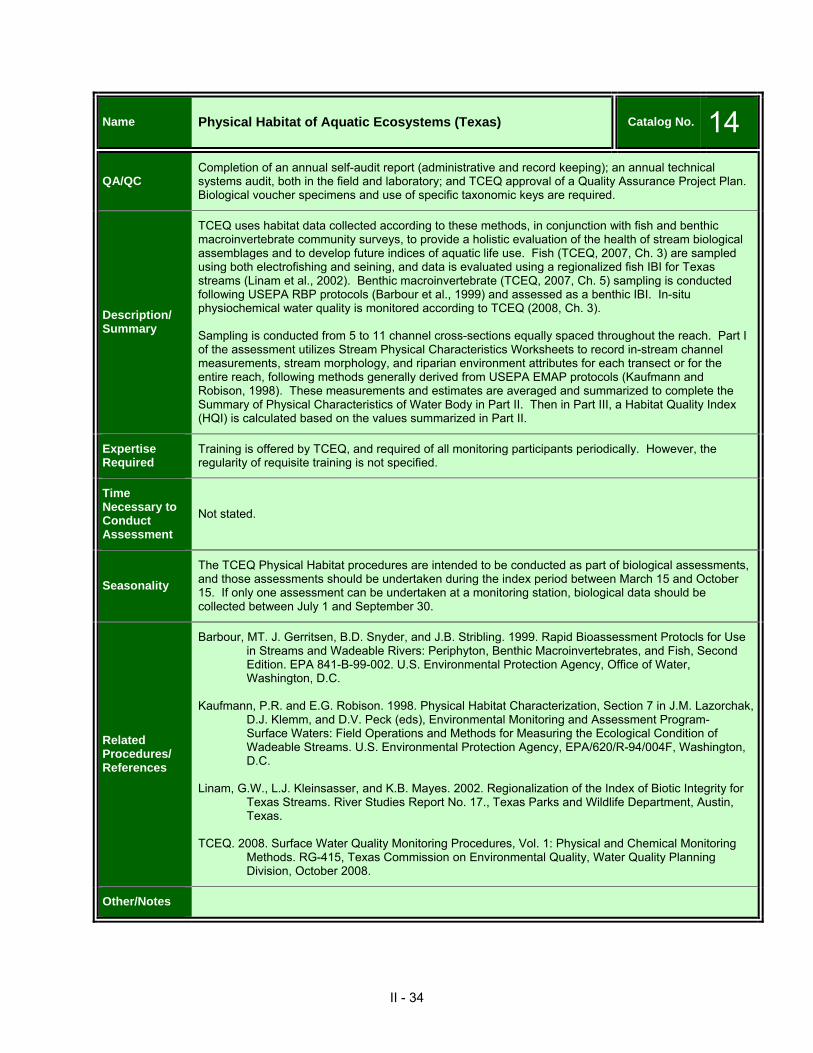
II - 34
Name Physical Habitat of Aquatic Ecosystems (Texas) Catalog No. 14
QA/QC Completion of an annual self-audit report (administrative and record keeping); an annual technical systems audit, both in the field and laboratory; and TCEQ approval of a Quality Assurance Project Plan. Biological voucher specimens and use of specific taxonomic keys are required.
Description/ Summary
TCEQ uses habitat data collected according to these methods, in conjunction with fish and benthic macroinvertebrate community surveys, to provide a holistic evaluation of the health of stream biological assemblages and to develop future indices of aquatic life use. Fish (TCEQ, 2007, Ch. 3) are sampled using both electrofishing and seining, and data is evaluated using a regionalized fish IBI for Texas streams (Linam et al., 2002). Benthic macroinvertebrate (TCEQ, 2007, Ch. 5) sampling is conducted following USEPA RBP protocols (Barbour et al., 1999) and assessed as a benthic IBI. In-situ physiochemical water quality is monitored according to TCEQ (2008, Ch. 3). Sampling is conducted from 5 to 11 channel cross-sections equally spaced throughout the reach. Part I of the assessment utilizes Stream Physical Characteristics Worksheets to record in-stream channel measurements, stream morphology, and riparian environment attributes for each transect or for the entire reach, following methods generally derived from USEPA EMAP protocols (Kaufmann and Robison, 1998). These measurements and estimates are averaged and summarized to complete the Summary of Physical Characteristics of Water Body in Part II. Then in Part III, a Habitat Quality Index (HQI) is calculated based on the values summarized in Part II.
Expertise Required
Training is offered by TCEQ, and required of all monitoring participants periodically. However, the regularity of requisite training is not specified.
Time Necessary to Conduct Assessment
Not stated.
Seasonality
The TCEQ Physical Habitat procedures are intended to be conducted as part of biological assessments, and those assessments should be undertaken during the index period between March 15 and October 15. If only one assessment can be undertaken at a monitoring station, biological data should be collected between July 1 and September 30.
Related Procedures/ References
Barbour, MT. J. Gerritsen, B.D. Snyder, and J.B. Stribling. 1999. Rapid Bioassessment Protocls for Use in Streams and Wadeable Rivers: Periphyton, Benthic Macroinvertebrates, and Fish, Second Edition. EPA 841-B-99-002. U.S. Environmental Protection Agency, Office of Water, Washington, D.C.
Kaufmann, P.R. and E.G. Robison. 1998. Physical Habitat Characterization, Section 7 in J.M. Lazorchak,
D.J. Klemm, and D.V. Peck (eds), Environmental Monitoring and Assessment Program- Surface Waters: Field Operations and Methods for Measuring the Ecological Condition of Wadeable Streams. U.S. Environmental Protection Agency, EPA/620/R-94/004F, Washington, D.C.
Linam, G.W., L.J. Kleinsasser, and K.B. Mayes. 2002. Regionalization of the Index of Biotic Integrity for
Texas Streams. River Studies Report No. 17., Texas Parks and Wildlife Department, Austin, Texas.
TCEQ. 2008. Surface Water Quality Monitoring Procedures, Vol. 1: Physical and Chemical Monitoring
Methods. RG-415, Texas Commission on Environmental Quality, Water Quality Planning Division, October 2008.
Other/Notes

II - 35
Name [Kansas] Subjective Evaluation of Aquatic Habitats Catalog No. 15Primary Author/ Agency
Kansas Department of Wildlife & Parks KDWP. 2004. Subjective Evaluation of Aquatic Habitats. Kansas Department of Wildlife & Parks,
Environmental Services Section, revised 2004. Topeka, KS.
Electronic Resource
http://www.kdwp.state.ks.us/news/Other-Services/Environmental-Reviews/Aquatic-Field-Habitat-Evaluations
Intended Use/Purpose
Non-Regulatory Condition Assessment; Inventory; Ambient Monitoring.
Target Resource Type
Streams: Ephemeral, Intermittent, or Perennial
Scale/Unit of Assessment Not stated.
Geographic Applicability Kansas
General Level of Effort Easy (rapid)
Assessment Parameters
Channel/Valley Morphology:
Channel modification; sinuosity (via map); percent of historical floodplain available of inundation; dominant substrate class; number of substrate types; pool:riffle sequencing; bank erosion.
Physical Habitat: embeddedness (class est.); in-stream cover types and percent cover (aka fish concealment structures); canopy cover (est.); percent of historical floodplain covered by native vegetation.
Water Quality: Condition classes based on professional judgment: dissolved oxygen / biochemical oxygen demand; nutrient enrichment; pesticides; turbidity; temperature; other.
Biology: Fish community characteristics (professional judgment); benthic invertebrates (dominant taxa); freshwater mussels (presence/absence); amphibians (presence/absence); other aquatic vertebrates (presence/absence).
Other: Stream type (ephemeral, intermittent, or perennial); floodplain land use classes; watershed land use classes.
Resolution Qualitative (descriptive); Semi-Quantitative (ordinal scale, rank, etc.).
Output: Index (e.g. numeric score)
Reference Best Professional Judgment
QA/QC Not stated.

II - 36
Name [Kansas] Subjective Evaluation of Aquatic Habitats Catalog No. 15
Description/ Summary
The Kansas Department of Wildlife & Parks (KDWP), Subjective Evaluation of Aquatic Habitats utilizes a four groups of individual parameters that are scored and then summed to provide a total stream habitat index (R-value). The R-value index is in turn associated with four overall stream habitat condition classes: excellent, good, fair, and poor. The number of points possible varies among the groups, from 50 points for the Physical Habitat Key to 15 points each for both the Biological Component Key and the Water Quality Component key. Each parameter within each group is scored based on qualitative, categorical, ranked conditions or classes as described in the document and outlined on the field data sheet. The Water Quality Component Key and the Biological Component Key, which includes a fish community parameter and a benthic invertebrate parameter, as well as a presence/absence of freshwater mussels, amphibians and other aquatic vertebrates, are not to be included in the final R-value rating if the stream is dry or inadequate water is present.
Expertise Required Not stated.
Time Necessary to Conduct Assessment
Not stated.
Seasonality Not stated.
Related Procedures/ References
Other/Notes
The U.S. Army Corps of Engineers, Kansas City District “Draft Kansas Stream Mitigation Guidance,” (rev. December 31, 2009) utilizes the KDWP R-value stream habitat index as one factor for determining the “Existing Condition” of streams either proposed to be impacted or to be used for compensatory mitigation as part of Clean Water Act, Section 404 permit applications. The “Draft Kansas Stream Mitigation Guidance” is a standard operating procedure modeled after the USACE Charleston District SOP reviewed herein.
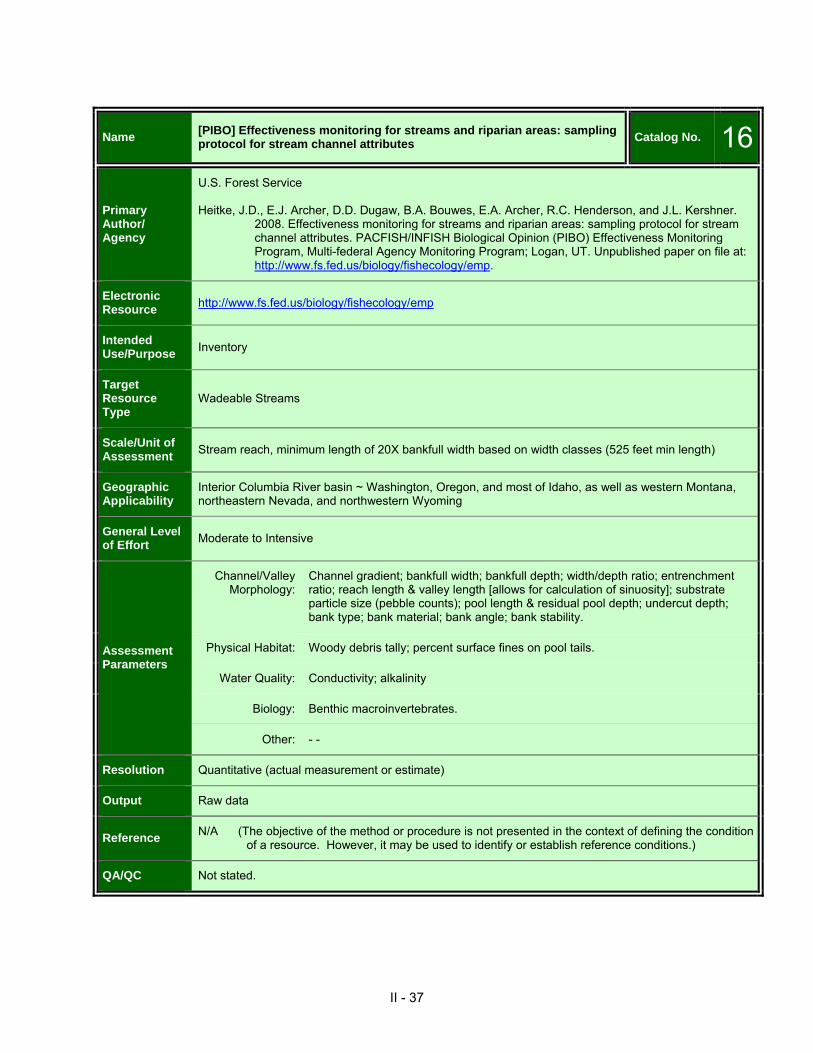
II - 37
Name [PIBO] Effectiveness monitoring for streams and riparian areas: sampling protocol for stream channel attributes Catalog No. 16
Primary Author/ Agency
U.S. Forest Service Heitke, J.D., E.J. Archer, D.D. Dugaw, B.A. Bouwes, E.A. Archer, R.C. Henderson, and J.L. Kershner.
2008. Effectiveness monitoring for streams and riparian areas: sampling protocol for stream channel attributes. PACFISH/INFISH Biological Opinion (PIBO) Effectiveness Monitoring Program, Multi-federal Agency Monitoring Program; Logan, UT. Unpublished paper on file at: http://www.fs.fed.us/biology/fishecology/emp.
Electronic Resource http://www.fs.fed.us/biology/fishecology/emp
Intended Use/Purpose Inventory
Target Resource Type
Wadeable Streams
Scale/Unit of Assessment Stream reach, minimum length of 20X bankfull width based on width classes (525 feet min length)
Geographic Applicability
Interior Columbia River basin ~ Washington, Oregon, and most of Idaho, as well as western Montana, northeastern Nevada, and northwestern Wyoming
General Level of Effort Moderate to Intensive
Assessment Parameters
Channel/Valley Morphology:
Channel gradient; bankfull width; bankfull depth; width/depth ratio; entrenchment ratio; reach length & valley length [allows for calculation of sinuosity]; substrate particle size (pebble counts); pool length & residual pool depth; undercut depth; bank type; bank material; bank angle; bank stability.
Physical Habitat: Woody debris tally; percent surface fines on pool tails.
Water Quality: Conductivity; alkalinity
Biology: Benthic macroinvertebrates.
Other: - -
Resolution Quantitative (actual measurement or estimate)
Output Raw data
Reference N/A (The objective of the method or procedure is not presented in the context of defining the condition of a resource. However, it may be used to identify or establish reference conditions.)
QA/QC Not stated.

II - 38
Name [PIBO] Effectiveness monitoring for streams and riparian areas: sampling protocol for stream channel attributes Catalog No. 16
Description/ Summary
The primary objective of the PACFISH/INFISH (PIBO) Effectiveness Monitoring Program is to determine whether priority biological and physical attributes, processes, and functions of riparian and aquatic systems are being degraded, maintained, or restored on federally managed lands within the interior Columbia River basin. This document describes the standardized methods that PIBO compiled following ten years of use, evaluation, and peer review, as well as a set of summary statistics for each attribute. The PIBO Effectiveness Monitoring protocols utilize transect-based methods for measuring physical habitat and geomorphic metrics. Stepwise instructions are thorough and include illustrative figures for clarification. Although many of the methods reported for specific metrics are modifications of methods proposed by others (e.g. Platts et al, 1987), the PIBO Effectiveness Monitoring protocols have typically further refined such methods to reduce bias and increase measurement precision. There is also a section devoted to explaining a proper method to photo-document the sample reach. Equipment lists, field data forms, decontamination procedures, and data management is discussed. There are also alternative sampling methods provided for sampling stream reaches affected by beaver.
Expertise Required Not stated.
Time Necessary to Conduct Assessment
Not stated.
Seasonality Not stated.
Related Procedures/ References
Henderson, R.C.; E.K. Archer, B.A. Bouwes, M.S. Coles-Ritchie, and J.L. Kershner. 2005. PACFISH/INFISH Biological Opinion (PIBO): Effectiveness Monitoring Program seven-year status report 1998 through 2004. Gen. Tech. Rep. RMRS-GTR-162. Fort Collins, CO: U.S. Department of Agriculture, Forest Service, Rocky Mountain Research Station. 16 pp.
Kershner, J.L., E.K. Archer, M. Coles-Ritchie, E.R. Cowley, R.C. Henderson, K. Kratz, C.M. Quimby,
D.L. Turner, L.C. Ulmer, M.R. Vision. 2004. Guide to effective monitoring of aquatic and riparian resources. General Technical Report RMRS-GTR-121. U.S. Department of Agriculture Forest Service, Fort Collins, CO.
Platts, W.S., C. Armour, G.D. Booth, M. Bryant, J.L. Bufford, P. Cuplin, S. Jensen, G. W. Lienkaemper,
G.W. Minshall, S.P. Monsen, R.L. Nelson, J.R. Sedell, and J.S. Tuhy. 1987. Methods for Evaluating Riparian Habitats with Applications to Management. U.S. Forest Service, Intermountain Research Station General Technical Report INT-221. 177 pp.
USFS. 2004. Effectiveness monitoring for streams and riparian areas within the Pacific Northwest:
stream channel methods for core attributes. Aquatic and Riparian Effectiveness Monitoring Program (AREMP) & PACFISH/INFISH (PIBO) Effectiveness Monitoring Program, Multi-Federal Agency Monitoring Programs. U.S. Department of Agriculture, Forest Service. Unpublished paper available at: http://www.reo.gov/monitoring/reports/watershed-reports-publications.shtml
Other/Notes

II - 39
Name R1/R4 (Northern /Intermountain Regions) Fish and Fish Habitat Standard Inventory Procedures Handbook
Catalog No. 17
Primary Author/ Agency
U.S. Forest Service Overton, C.K., S.P. Wollrab, B.C. Roberts, and M.A. Radko. 1997. R1/R4 (Northern and Intermountain
Regions) fish and fish habitat standard inventory procedures handbook. Gen. Tech. Rep. INT-GTR-346. U.S.D.A. Forest Service, Intermountain Research Station, Odgen, UT. 80pp.
Electronic Resource http://www.fs.fed.us/rm/pubs_int/int_gtr346.pdf
Intended Use/Purpose Inventory
Target Resource Type
Perennial streams identifiable on U.S. Geologic Survey 1:24,000 topographic quad maps
Scale/Unit of Assessment
Stream reach of unspecified length that is defined by confluences or changes in classified reach type (i.e. Montgomery and Buffington (1993) valley segments).
Geographic Applicability
Northern Region (R1) and Intermountain Region (R4) of the USFS, which includes all or parts of WA, OR, ID, MT, ND, SD, WY, UT, NV, east-central CA]
General Level of Effort
Three sampling schemes are presented with corresponding levels of effort ranging from Level I (least intensive) to Level III (most intensive).
Assessment Parameters
Channel/Valley Morphology:
Stream discharge; classification of stream reach type as A, B, or C (synonymous with Montgomery and Buffington’s (1993) valley segments); Rosgen stream classification; channel gradient; valley confinement; bankfull width and depth (optional); percent undercut banks; channel habitat units [aka bed forms] and lengths; wetted channel width, average water depth; average maximum depth of pocket pools; maximum pool depth; pool crest depth; substrate particle size class (est. or pebble count); percent surface fine sediment (<6mm); bank stability (classes); woody debris tally; riparian community type classification.
Physical Habitat: Woody debris tally; riparian community type classification.
Water Quality: Temperature.
Biology: Fish abundance.
Other: - -
Resolution Qualitative (descriptive; categorical), Semi-Quantitative (ordinal scale, rank, etc.), and Quantitative (actual measurement or estimates).
Output Raw data / data sheets
Reference N/A (The objective of the method or procedure is not presented in the context of defining the condition of a resource. However, it may be used to identify or establish reference conditions.)

II - 40
Name R1/R4 (Northern /Intermountain Regions) Fish and Fish Habitat Standard Inventory Procedures Handbook
Catalog No. 17
QA/QC
The Standard Inventory Procedures outlines recommended training procedures for field crews that includes exercises both in the field and in the office entering data. It is also recommended that field crews break every 2 to 3 hours and review field data sheets for missing data, illegible entries, misplaced decimal points, etc. Data forms and equipment lists are provided.
Description/ Summary
Most morphological and physical habitat metrics required in the Standard Inventory Procedures are undertaken using visual estimation methods or selected from standardized lists of types or classes. These metrics are therefore primarily qualitative or semi-quantitative. For example, a detailed, hierarchical channel habitat type classification (aka bed forms) is provided in tabular form, explained in the text, and illustrated with photographs and diagrams. This classification and attendant metrics to further characterize habitat types (e.g. pool depth, pool crest depth, step pool total, etc.) provide the primary focus of the physical and morphological component of the Standard Inventory Procedures. Relative fish abundance by species and size/age class is determined using the direct enumeration snorkeling technique of Thurow (1994), and is the primary quantitative component of the Standard Inventory Procedures. The final 15 to 30 minutes of the field survey should be spent writing a narrative description of the site, including observed land management activities, natural limitations to fish migration, sediment sources and other site observations that might not be captured by field sampling.
Expertise Required
Sample metrics were specifically selected, in part, for the ease with which inexperienced field technicians could be taught the sampling methods, resulting in reasonable expectations for accurate, consistent data.
Time Necessary to Conduct Assessment
Field sampling = 1 day, 2 to 3 persons
Seasonality
Methods are designed for sampling fish and fish habitat at stream baseflow, thus after peak snowmelt. However, caution needs to be taken to avoid sampling streams during spring and summer runs of spawning chinook salmon- a listed endangered species. Where fish surveys will be conducted, sampling should occur in July and August.
Related Procedures/ References
Montgomery, D.R., and J.M. Buffington. 1993. Channel classification, prediction of channel response and assessment of channel condition. Report TFW-SI-110-93-002, Timber/Fish/Wildlife Agreement, Washington, 96 pp.
Thurow, R.F. 1994. Underwater methods for study of salmonids in the Intermountain West. Gen. Tech.
Rpt. INT-GTR-307, U.S.D.A. Forest Service, Intermountain Research Station, 30 pp.
Other/ Notes

II - 41
Name Effectiveness monitoring for streams and riparian areas within the Pacific Northwest: stream channel methods for core attributes
Catalog No. 18
Primary Author/ Agency
U.S. Forest Service USFS. 2004. Effectiveness monitoring for streams and riparian areas within the Pacific Northwest:
stream channel methods for core attributes. Aquatic and Riparian Effectiveness Monitoring Program (AREMP) & PACFISH/INFISH (PIBO) Effectiveness Monitoring Program, Multi-Federal Agency Monitoring Programs. U.S. Department of Agriculture, Forest Service. Unpublished paper available at: http://www.reo.gov/monitoring/reports/watershed-reports-publications.shtml
Electronic Resource http://www.reo.gov/monitoring/reports/watershed-reports-publications.shtml
Intended Use/Purpose
Inventory; Ambient Monitoring.
Target Resource Type
Wadeable Streams
Scale/Unit of Assessment Stream reach, 20X bankfull width based on width classes (minimum 525 feet)
Geographic Applicability
Washington, Oregon, and most of Idaho, as well as western Montana, northeastern Nevada, northwestern Wyoming, and northern California (~interior Columbia River watershed, plus areas west of the Cascade Mountains).
General Level of Effort Moderate
Assessment Parameters:
Channel/Valley Morphology:
Bankfull width; water surface slope; substrate particle size; pool length & residual pool depth.
Physical Habitat: Woody debris tally; percent surface fines on pool tails.
Water Quality: Conductivity.
Biology: Benthic macroinvertebrates.
Other: - -
Resolution Quantitative (actual measurement or estimate)
Output Raw data
Reference N/A (The objective of the method or procedure is not presented in the context of defining the condition of a resource. However, it may be used to identify or establish reference conditions.)
QA/QC Not stated.

II - 42
Name Effectiveness monitoring for streams and riparian areas within the Pacific Northwest: stream channel methods for core attributes
Catalog No. 18
Description/ Summary
The Aquatic and Riparian Effectiveness Monitoring Program (AREMP) is a multi-federal agency monitoring program to assess the condition of watersheds within the Northwest Forest Plan area (federally managed lands “west of the Cascades”). The primary objective of the PACFISH/INFISH (PIBO) Effectiveness Monitoring Program is to determine whether priority biological and physical attributes, processes, and functions of riparian and aquatic systems are being degraded, maintained, or restored on federally managed lands within the interior Columbia River basin. This document describes the standardized methods that AREMP and PIBO compiled following ten years of use, evaluation, and peer review for a set of core stream channel attributes. The Core Attributes methods utilize transect-based methods for measuring physical habitat and geomorphic metrics. Stepwise instructions are thorough and include illustrative figures for clarification. This is, however, simply a collection of recommended metrics. There is no discussion of data management, QA/QC, data analysis, or any other component typical of a condition assessment procedure. The intent of this document is to simply identify the core metrics shared by the AREMP and PIBO long-term monitoring programs.
Expertise Required Not stated.
Time Necessary to Conduct Assessment
Not stated.
Seasonality Not stated.
Related Procedures/ References
Heitke, J.D., E.J. Archer, D.D. Dugaw, B.A. Bouwes, E.A. Archer, R.C. Henderson, and J.L. Kershner. 2008. Effectiveness monitoring for streams and riparian areas: sampling protocol for stream channel attributes. PACFISH/INFISH Biological Opinion (PIBO) Effectiveness Monitoring Program, Multi-federal Agency Monitoring Program; Logan, UT. Unpublished paper on file at: http://www.fs.fed.us/biology/fishecology/emp.
Henderson, R.C.; E.K. Archer, B.A. Bouwes, M.S. Coles-Ritchie, and J.L. Kershner. 2005.
PACFISH/INFISH Biological Opinion (PIBO): Effectiveness Monitoring Program seven-year status report 1998 through 2004. Gen. Tech. Rep. RMRS-GTR-162. Fort Collins, CO: U.S. Department of Agriculture, Forest Service, Rocky Mountain Research Station. 16 p.
Kershner, J.L., E.K. Archer, M. Coles-Ritchie, E.R. Cowley, R.C. Henderson, K. Kratz, C.M. Quimby,
D.L. Turner, L.C. Ulmer, M.R. Vision. 2004. Guide to effective monitoring of aquatic and riparian resources. General Technical Report RMRS-GTR-121. U.S. Department of Agriculture Forest Service, Fort Collins, CO.
Other/Notes

II - 43
Name A Manual of Procedures for Sampling Surface Waters [Arizona] Catalog No. 19Primary Author/ Agency
Arizona Department for Environmental Quality ADEQ. 2005. A Manual of Procedures for Sampling Surface Waters, L. Lawson (ed.), Arizona Department for Environmental Quality, Hydrologic Support and Assessment Section. Phoenix, AZ.
Electronic Resource http://www.azdeq.gov/environ/water/assessment/download/sampling.pdf
Intended Use/Purpose
Non-Regulatory Condition Assessment; Inventory; Ambient Monitoring.
Target Resource Type
Wadeable Streams
Scale/Unit of Assessment
Stream reach, 20-30X bankfull width or two complete meander lengths (minimum 100 meters “for large streams”)
Geographic Applicability Arizona
General Level of Effort Intensive (1 day± in the field by a trained or experienced crew of 2 or more persons)
Assessment Parameters:
Channel/Valley Morphology:
Stream discharge; stream type classification (Rosgen, 1996); stream type evolutionary stage; longitudinal channel profile; channel cross-section (bankfull cross-sectional area, bankfull width, bankfull depth; floodprone width); bank height ratio (Rosgen, 2001a); bank erodibility hazard index (Rosgen, 1996; 2001b); substrate particle size (pebble count in riffles, pools, and zig-zag & sieve sample); channel habitat units (aka bed forms); near bank stress; channel pattern / planform (sinuosity, belt width, radius of curvature, meander wave length); entrenchment ratio; sediment competence; pool facet slope analysis; Pfankuch channel stability (modified from Pfankuch (1975).
Physical Habitat: Linear habitat complexity index (based on run+glide, riffle, and pool lengths); Habitat Assessment Index; Proper Functioning Condition for riparian wetlands (Prichard et al., 1998); riparian percent canopy gaps (densiometer); riparian vegetative community type.
Water Quality: Dissolved oxygen; specific conductivity; pH; temperature; turbidity; redox; bacteria.
Biology: Benthic macroinvertebrates; diatoms; percent cover of algae & aquatic macrophytes; riparian vegetation percent cover per strata (trees, shrubs, ground cover) (est.); dominant trees per size class.
Other: Potential sources of non-point source pollution.
Resolution Semi-Quantitative (ordinal scale, rank, etc.); Quantitative (actual measurement or estimate).
Output Condition Assessment; Index (e.g. numeric score); Raw data.

II - 44
Name A Manual of Procedures for Sampling Surface Waters [Arizona] Catalog No. 19
Reference N/A (The objective of the method or procedure is not presented in the context of defining the condition of a resource. However, it may be used to identify or establish reference conditions.)
QA/QC Not stated.
Description/ Summary
The Arizona Department of Environmental Quality (ADEQ), Manual of Procedures for the Sampling of Surface Waters is an exhaustive collection of very specific methods, protocols, administrative policies, and QA/QC considerations that covers all facets Arizona’s surface water sampling program. Section 1 outlines Pre-Trip Administrative Activities, including safety procedures and data forms, while Section 2 describes Equipment Calibration and Cleaning Procedures. Section 3 addresses Field Procedures and is divided into three parts. Part A covers Basic Field Procedures and details activities directly involved in collecting field data for water quality, bacteria, macroinvertebrates and algae. Part B, Geomorphology Procedures, describes activities that assess the physical properties of stream channels. Part C, Habitat Assessments Procedures, describes the methods used to collect and assess habitat and the biological condition of wadeable streams. Section 4 of the Manual addresses Post-Trip Procedures, and Section 5 discusses Data Management. Finally, Section 6 provides Supporting Material as an appendix to the Manual. Biological components of the ADEQ Manual include bacteria, macroinvertebrates, and diatoms. ADEQ has developed benthic IBI’s for cold-water streams (above 5,000 feet elevation) and warm-water streams (below 5,000 feet elevation). Macroinvertebrate sampling is to be conducted in perennial streams only. Formulas to calculate IBI’s are provided. The Geomorphology Procedures in Part B of Section 3 are based on or derived from Rosgen (1996) and many measures and interpretive ratios are taken directly from various Rosgen publications. Numerous charts, tables, graphs, and illustrations taken from Rosgen training course materials are also provided in the manual, and surveying methods from Harrelson et al. (1994) are referenced and summarized. Most of the geomorphology parameters specified in the ADEQ Manual result in raw quantitative data, although there are numerous commonly used interpretive ratios and indices based on these data. The Habitat Assessment procedures provided in Part C of Section 3 are intended to aid the interpretation of benthic macroinvertebrate bioassessments. There are field data sheets provided in Part C for water chemistry, discharge, field observations about hydrology, biology, and general condition of the stream reach, as well as non-point source observations, the ADEQ Habitat Assessment Index, and riparian community assessment. The Habitat Assessment Index is based on USEPA RBP (Barbour et al., 1999) and USEPA EMAP protocols for rapid habitat assessment (Lazorchak et al., 1998).
Expertise Required Not stated.
Time Necessary to Conduct Assessment
Not stated.
Seasonality Macroinvertebrate sampling should occur in baseflow conditions following winter runoff; generally April-May for desert streams and May-June for mountain streams.
II - 45
Name A Manual of Procedures for Sampling Surface Waters [Arizona] Catalog No. 19
Related Procedures/ References
Barbour, M.T., J. Gerritsen, B.D. Snyder, and J.B. Stribling. 1999. Rapid Bioassessment Protocols for Use in Streams and Wadeable Rivers: Periphyton, Benthic Macroinvertebrates, and Fish, Second Edition. EPA 841-B-99–002. USEPA Office of Water, Washington, D.C.
Harrelson, CC., C.L. Rawlins, and J.P. Potyondy. 1994. Stream Channel Reference Sites: An Illustrated
Guide to Field Technique. General Technical Report RM-245, U.S. Forest Service Rocky Mountain Forest and Range Experiment Station, Fort Collins, CO.
Lazorchak, J.M., A.T Herlihy, and J. Green. 1998. Raid habitat and Visual Stream Assessments,
Section 14 in J.M. Lazorchak et al. (Eds) EMAP- Surface Waters: Field Operations and Methods for Measuring the Ecological Condition of Wadeable Streams. EPA/620/R-94/004F, U.S. Environmental protection Agency, Washington, D.C.
Moody, T.O. and W. Odem. 1999. Regional relationships for bankfull stage in natural channels of
Central and Southern Arizona. Prepared for the U.S. Forest Service, Albuquerque, NM by Northern Arizona University, Flagstaff, AZ.
Pfankuch, D.J. 1975. Stream reach invenotry and channel stability evaluation: A watershed
management procedure. U.S. Forest Service Northern Region, R1-75-002. Prichard, D., J. Anderson, C. Correll, J. Fogg, K. Gebhardt, R. Krapf, S. Leonard, B. Mitchell, and J.
Staats. 1998. Riparian area management: A user guide to assessing Proper Functioning Condition and the supporting science fo lotic areas. Technical Reference 1737-15, BLM/RS/ST-98/001+1737, U.S. Bureau of Land Management, Denver, CO.
Rosgen, D.L. 1996. Applied River Morphology. Wildland Hydrology. Pagosa Springs, CO. Rosgen, D.L. 2001a. A stream channel stability assessment methodology, pgs II-18 to II-26 in
Proceedings of the Seventh Federal Interagency Sedimentation Conference, March 25-29, 2001, Reno, NV.
Rosgen, D.L. 2001b. A practical method of computing streambank erosion rate, pgs II-9 to II-17 in
Proceedings of the Seventh Federal Interagency Sedimentation Conference, March 25-29, 2001, Reno, NV.
Other/Notes Moody and Odem (1999) compiled regional hydraulic curves for Arizona and New Mexico.

II - 46
Name Stream Condition Inventory (SCI) Technical Guide Catalog No. 20
Primary Author/ Agency
U.S. Forest Service Frazier, J.W., K.B. Roby, J.A. Boberg, K. Kenfield, J.B. Reiner, D.L. Azuma, J.L. Furnish, B.P. Staab.
2005. Stream Condition Inventory (SCI) Technical Guide. USDA Forest Service, Pacific Southwest Region - Ecosystem Conservation Staff. Vallejo, CA.
Electronic Resource http://www.fs.fed.us/r5/publications/water_resources/sci/techguide-v5-08-2005-a.pdf
Intended Use/Purpose
Inventory; Ambient Monitoring.
Target Resource Type
Wadeable perennial streams with channel gradients ≤10%. The SCI Technical Guide adds that some SCI methods are applicable to intermittent streams, but others are not.
Scale/Unit of Assessment
Stream reach (recommended minimum length is 500 meters; 100 meter reach is acceptable if neither large woody debris nor pools are key attributes)
Geographic Applicability California
General Level of Effort Intensive (1 day± in the field by a trained or experienced crew of 2 or more persons)
Assessment Parameters
Channel/Valley Morphology:
Channel cross-sectional dimensions; width:depth ratio; entrenchment; water surface gradient; bank stability (percent cover of vegetation, rock, downed wood, or other erosion resistant material); bank angle; substrate particle size distribution; bankfull stage; number and length of channel habitat units [aka bed forms]; residual pool depth; streamshore water depth; pool sediment ~ V*w (optional).
Physical Habitat: Woody debris tally; pool tail surface fine sediment; stream shading (solar insolation);.
Water Quality: Temperature; conductivity; total alkalinity.
Biology: Macroinvertebrates; aquatic fauna (herptofauna and fish).
Other: - -
Resolution Quantitative (actual measurement or estimate).
Output Raw data
Reference
The Technical Guide refers to regional reference streams for which inventories using SCI can provide useful comparison to non-reference conditions. However, the protocol itself does not result in a “condition index” that is based on an internal calibration to these reference streams. However, Appendix A of the Technical Guide presents a brief analysis of SCI data comparing conditions between a priori classification of reference and non-reference streams throughout USFS Region 5.

II - 47
Name Stream Condition Inventory (SCI) Technical Guide Catalog No. 20
QA/QC
All crew members must complete both introductory and refresher training sessions that include a combination of classroom and field exercises. All field data is to be checked by the crew leader while still in the field to ensure that all data sheets are legible and complete. Specific QA/QC documentation forms are provided to track QA/QC measures, including training documentation, field survey checklists, field oversight, and data entry.
Description/ Summary
The purpose of the USFS Pacific Southwest Region Stream Condition Inventory (SCI) is to collect intensive and repeatable data from stream reaches to document existing conditions and make reliable comparisons over time within or between stream reaches. It is designed to assess effectiveness of management actions on streams and to document temporal changes in stream conditions of unmanaged watersheds. The protocol stresses quantifiable, objective measurements of 17 core attributes and one optional attribute, but also adds that still additional optional attributes related to specific biota or stream characteristics may be needed to meet local inventory and monitoring objectives. Collecting SCI data in the field is accomplished using a multiple-pass sequence throughout the sample stream reach. The sample protocol provided in the Technical Guide is based on a four-pass sequence, where some of the above referenced attributes are measured and documented during each successive pass. Sample procedures for some specific attributes that could require potentially heavy or cumbersome equipment are described using more simplistic methods to ease transport into remote sample locations. One example includes the use of line levels and stadia rods in lieu of heavy tripods and a total station or automated level for channel surveying. Recommended sequential sample methods are described, including specific task instructions, necessary equipment, and data forms for each pass.
Expertise Required Not stated, but refer to training requirements in QA/QC above.
Time Necessary to Conduct Assessment
The Technical Guide suggests that up to 2-3 days could be required to initially establish and survey a sample reach, depending on travel time and crew experience. An undefined, but shorter amount of time is necessary to re-sample the same reach. The optional V*w pool sediment attribute is acknowledged to be a very intensive inventory, and is in fact cited as requiring 1-3 days to sample only this attribute, depending on reach length.
Seasonality Not stated.
Related Procedures/ References
Applicable references are provided for each of the 18 stream inventory attributes described in the Technical Guide.
Other/Notes

II - 48
Name Idaho Small Stream Ecological Assessment Framework Catalog No. 21Primary Author/ Agency
Idaho Department of Environmental Quality Grafe, C.S. (ed.). 2002a. Idaho Small Stream Ecological Assessment Framework: An Integrated
Approach. Idaho Department of Environmental Quality; Boise, Idaho.
Electronic Resource http://www.deq.idaho.gov/water/data_reports/surface_water/monitoring/publications.cfm
Intended Use/Purpose
Non-Regulatory Condition Assessment; Inventory; Ambient Monitoring.
Target Resource Type
Wadeable streams (generally <5th order; wetted width <15 feet at baseflow)
Scale/Unit of Assessment Not stated (see IDEQ, 2007).
Geographic Applicability Idaho
General Level of Effort Moderate
Assessment Parameters:
Channel/Valley Morphology:
Substrate particle size analysis (i.e. number of Wolman size classes); channel shape (undercut).
Physical Habitat: In-stream cover; woody debris tally; percent fines less than 2mm in wetted stream width; embeddedness; percent bank cover; percent canopy cover; disruptive pressures (qualitative variable used to determine seasonal human impacts on riparian zones); zone of influence (riparian zone width).
Water Quality: - -
Biology: Macroinvertebrates; fish.
Other: - -
Resolution Semi-Quantitative (ordinal scale, rank, etc.); Quantitative (actual measurement or estimate).
Output Condition Assessment; Index (e.g. numeric score); Raw data.
Reference Internal.
QA/QC Not stated (see IDEQ, 2007).

II - 49
Name Idaho Small Stream Ecological Assessment Framework Catalog No. 21
Description/ Summary
The Idaho Small Stream Ecological Assessment Framework describes the development and integration of three multimetric indexes that the Idaho Department of Environmental Quality (IDEQ) uses to assess aquatic life use support for small Idaho streams. The indexes were developed based on rapid bioassessment concepts developed by USEPA (Barbour et al. 1999). Specific field sampling protocols are described in IDEQ (2007). IDEQ uses different monitoring and assessment protocols depending on water body size, and has developed a three-parameter index to distinguish “small streams” from “rivers.” These parameters include stream order, average width at base flow, and average depth at base flow. Generally, streams that are less than fifth order, less than 15 feet in average base flow wetted width, and less than an average of 0.4 meters deep at base flow are considered small streams by IDEQ. Grafe (2002b) discusses aquatic life use support protocols for use on Idaho rivers. The Stream Macroinvertebrate Index (SMI) uses nine benthic macroinvertebrate metrics to calculate uniquely referenced index values for each of three different Idaho bioregions (Northern Mountains, Central and Southern Mountains, and Basins). These individual metrics include: total taxa, Ephemeroptera taxa, Plecoptera taxa, Trichoptera taxa, percent Plecoptera, Hilsenhoff Biotic Index, percent five dominant taxa, scraper taxa, and clinger taxa. Jessup and Gerritsen (2002) describe the development of the SMI in detail. The Stream Fish Index (SFI) utilizes two different sets of metrics to characterize water quality condition for montane-forested and desert basin-rangeland classifications. The rangeland metrics include: percent cold water individuals, Jaccard’s community similarity coefficient, percent omnivores and herbivores, percent cyprinids as longnose dace, percent of fish with certain abnormalities (deformities, eroded fins, lesions, and tumors), and catch per unit effort. The metrics in the forested classification are comprised of: number of cold water native species, percent cold water individuals, percent sensitive native individuals, number of sculpin age classes (unless sample is comprised solely of salmonids), number of salmonid age classes, and catch per unit effort. Mebane (2002) describes the development of the SFI in detail. The Stream Habitat Index (SHI) is calibrated to Idaho ecoregions and utilizes ten habitat measures that statistically had the highest correlation with either human disturbance or biological condition. Fore and Bollman (2002) describe the development of the SHI in detail. Each of the above referenced three index scores are adjusted to a common scale using a 1, 2, 3 scoring system, and then averaged to provide a single score representing stream ecological condition.
Expertise Required Not stated (see IDEQ, 2007).
Time Necessary to Conduct Assessment
Not stated (see IDEQ, 2007).
Seasonality Not stated (see IDEQ, 2007).

II - 50
Name Idaho Small Stream Ecological Assessment Framework Catalog No. 21
Related Procedures/ References
Barbour, M.T., J. Gerritsen, B.D. Snyder, and J.B. Stribling. 1999. Rapid Bioassessment Protocols for Use in Streams and Wadeable Rivers: Periphyton, Benthic Macroinvertebrates, and Fish, Second Edition. EPA 841-B-99–002. USEPA Office of Water, Washington, D.C.
Fore, L. and W. Bollman. 2002. Stream habitat index. Chapter 5, In C.S. Grafe (ed). Idaho Small
Stream Ecological Assessment Framework: An Integrated Approach. Idaho Department of Environmental Quality. Boise, Idaho.
Grafe, C.S. (ed). 2002b. Idaho River Ecological Assessment Framework: An Integrated Approach.
Idaho Department of Environmental Quality. Boise, Idaho. IDEQ. 2007. Beneficial Use Reconnaissance Program Field Manual for Streams. Idaho Department of
Environmental Quality, Beneficial Use Reconnaissance Program Technical Advisory Committee. Boise, Idaho.
Jessup, B. and J. Gerritsen. 2002. Stream macroinvertebrate index. Chapter 3, In C.S. Grafe (ed).
Idaho Small Stream Ecological Assessment Framework: An Integrated Approach. Idaho Department of Environmental Quality. Boise, Idaho.
Mebane, C.A. 2002. Stream fish index. Chapter 4, In C.S. Grafe (ed). Idaho Small Stream Ecological
Assessment Framework: An Integrated Approach. Idaho Department of Environmental Quality. Boise, Idaho.
Other/Notes
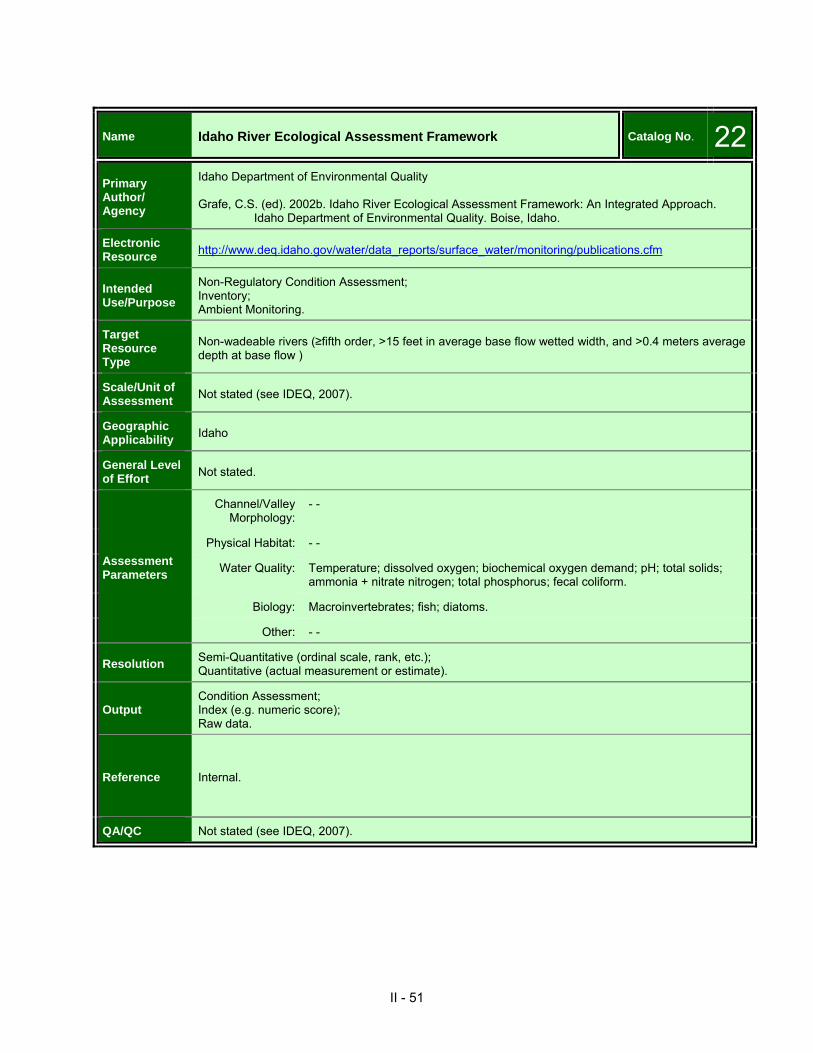
II - 51
Name Idaho River Ecological Assessment Framework Catalog No. 22Primary Author/ Agency
Idaho Department of Environmental Quality Grafe, C.S. (ed). 2002b. Idaho River Ecological Assessment Framework: An Integrated Approach.
Idaho Department of Environmental Quality. Boise, Idaho.
Electronic Resource http://www.deq.idaho.gov/water/data_reports/surface_water/monitoring/publications.cfm
Intended Use/Purpose
Non-Regulatory Condition Assessment; Inventory; Ambient Monitoring.
Target Resource Type
Non-wadeable rivers (≥fifth order, >15 feet in average base flow wetted width, and >0.4 meters average depth at base flow )
Scale/Unit of Assessment Not stated (see IDEQ, 2007).
Geographic Applicability Idaho
General Level of Effort Not stated.
Assessment Parameters
Channel/Valley Morphology:
- -
Physical Habitat: - -
Water Quality: Temperature; dissolved oxygen; biochemical oxygen demand; pH; total solids; ammonia + nitrate nitrogen; total phosphorus; fecal coliform.
Biology: Macroinvertebrates; fish; diatoms.
Other: - -
Resolution Semi-Quantitative (ordinal scale, rank, etc.); Quantitative (actual measurement or estimate).
Output Condition Assessment; Index (e.g. numeric score); Raw data.
Reference Internal.
QA/QC Not stated (see IDEQ, 2007).
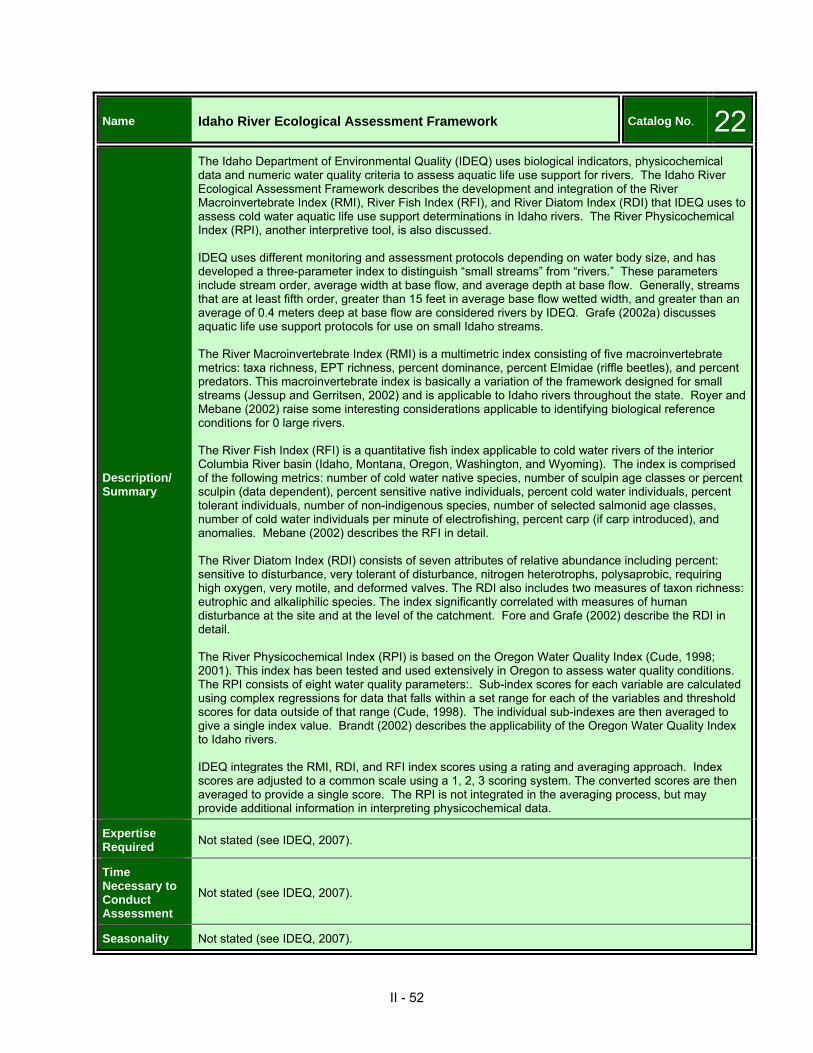
II - 52
Name Idaho River Ecological Assessment Framework Catalog No. 22
Description/ Summary
The Idaho Department of Environmental Quality (IDEQ) uses biological indicators, physicochemical data and numeric water quality criteria to assess aquatic life use support for rivers. The Idaho River Ecological Assessment Framework describes the development and integration of the River Macroinvertebrate Index (RMI), River Fish Index (RFI), and River Diatom Index (RDI) that IDEQ uses to assess cold water aquatic life use support determinations in Idaho rivers. The River Physicochemical Index (RPI), another interpretive tool, is also discussed. IDEQ uses different monitoring and assessment protocols depending on water body size, and has developed a three-parameter index to distinguish “small streams” from “rivers.” These parameters include stream order, average width at base flow, and average depth at base flow. Generally, streams that are at least fifth order, greater than 15 feet in average base flow wetted width, and greater than an average of 0.4 meters deep at base flow are considered rivers by IDEQ. Grafe (2002a) discusses aquatic life use support protocols for use on small Idaho streams. The River Macroinvertebrate Index (RMI) is a multimetric index consisting of five macroinvertebrate metrics: taxa richness, EPT richness, percent dominance, percent Elmidae (riffle beetles), and percent predators. This macroinvertebrate index is basically a variation of the framework designed for small streams (Jessup and Gerritsen, 2002) and is applicable to Idaho rivers throughout the state. Royer and Mebane (2002) raise some interesting considerations applicable to identifying biological reference conditions for 0 large rivers. The River Fish Index (RFI) is a quantitative fish index applicable to cold water rivers of the interior Columbia River basin (Idaho, Montana, Oregon, Washington, and Wyoming). The index is comprised of the following metrics: number of cold water native species, number of sculpin age classes or percent sculpin (data dependent), percent sensitive native individuals, percent cold water individuals, percent tolerant individuals, number of non-indigenous species, number of selected salmonid age classes, number of cold water individuals per minute of electrofishing, percent carp (if carp introduced), and anomalies. Mebane (2002) describes the RFI in detail. The River Diatom Index (RDI) consists of seven attributes of relative abundance including percent: sensitive to disturbance, very tolerant of disturbance, nitrogen heterotrophs, polysaprobic, requiring high oxygen, very motile, and deformed valves. The RDI also includes two measures of taxon richness: eutrophic and alkaliphilic species. The index significantly correlated with measures of human disturbance at the site and at the level of the catchment. Fore and Grafe (2002) describe the RDI in detail. The River Physicochemical Index (RPI) is based on the Oregon Water Quality Index (Cude, 1998; 2001). This index has been tested and used extensively in Oregon to assess water quality conditions. The RPI consists of eight water quality parameters:. Sub-index scores for each variable are calculated using complex regressions for data that falls within a set range for each of the variables and threshold scores for data outside of that range (Cude, 1998). The individual sub-indexes are then averaged to give a single index value. Brandt (2002) describes the applicability of the Oregon Water Quality Index to Idaho rivers. IDEQ integrates the RMI, RDI, and RFI index scores using a rating and averaging approach. Index scores are adjusted to a common scale using a 1, 2, 3 scoring system. The converted scores are then averaged to provide a single score. The RPI is not integrated in the averaging process, but may provide additional information in interpreting physicochemical data.
Expertise Required Not stated (see IDEQ, 2007).
Time Necessary to Conduct Assessment
Not stated (see IDEQ, 2007).
Seasonality Not stated (see IDEQ, 2007).

II - 53
Name Idaho River Ecological Assessment Framework Catalog No. 22Related Procedures/ References
Brandt, D. 2002. River physiochemcial index. Chapter 6, In C.S. Grafe (ed.) Idaho River Ecological Assessment Framework: An Integrated Approach. Idaho Department of Environmental Quality; Boise, Idaho.
Cude, C.G. 1998. Oregon water quality index: a tool for evaluating water quality management
effectiveness. Oregon Department of Environmental Quality, Laboratory Division, Water Quality Monitoring Section. Portland, OR. 20 pp.
Cude, C.G. 2001. Oregon water quality index: a tool for evaluating water quality management
effectiveness. Journal of the American Water Resources Association 37(1):125-137. Fore, L.S. and C.S. Grafe. 2002. River diatom index. Chapter 5, In C.S. Grafe (ed.) Idaho River
Ecological Assessment Framework: An Integrated Approach. Idaho Department of Environmental Quality; Boise, Idaho.
Grafe, C.S. (ed.). 2002a. Idaho Small Stream Ecological Assessment Framework: An Integrated
Approach. Idaho Department of Environmental Quality; Boise, Idaho. Jessup, B. and J. Gerritsen. 2002. Stream macroinvertebrate index. Chapter 3, In C.S. Grafe (ed).
Idaho Small Stream Ecological Assessment Framework: An Integrated Approach. Idaho Department of Environmental Quality. Boise, Idaho.
Mebane, C.A. 2002. River fish index. Chapter 4, In C.S. Grafe (ed.) Idaho River Ecological Assessment
Framework: An Integrated Approach. Idaho Department of Environmental Quality; Boise, Idaho.
Royer, T.V. and C.A. Mebane. 2002. River macroinvertebrtae index. Chapter 3, In C.S. Grafe (ed.)
Idaho River Ecological Assessment Framework: An Integrated Approach. Idaho Department of Environmental Quality; Boise, Idaho.
Other/Notes
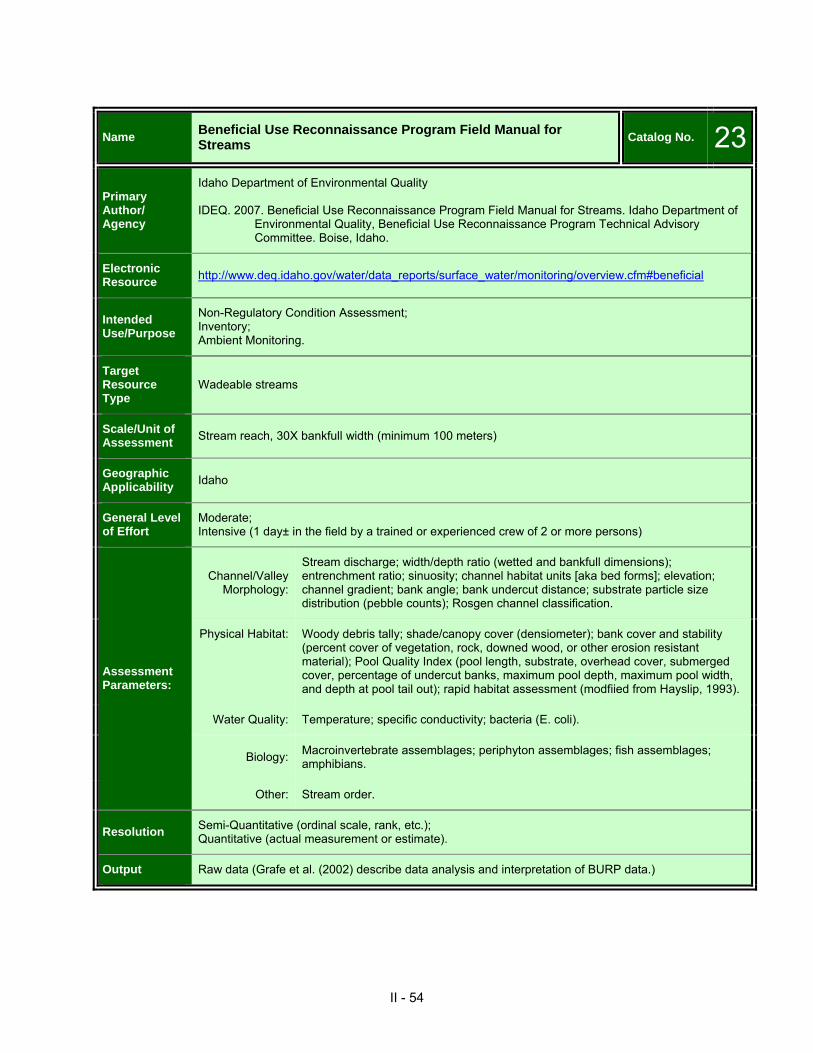
II - 54
Name Beneficial Use Reconnaissance Program Field Manual for Streams Catalog No. 23
Primary Author/ Agency
Idaho Department of Environmental Quality IDEQ. 2007. Beneficial Use Reconnaissance Program Field Manual for Streams. Idaho Department of
Environmental Quality, Beneficial Use Reconnaissance Program Technical Advisory Committee. Boise, Idaho.
Electronic Resource http://www.deq.idaho.gov/water/data_reports/surface_water/monitoring/overview.cfm#beneficial
Intended Use/Purpose
Non-Regulatory Condition Assessment; Inventory; Ambient Monitoring.
Target Resource Type
Wadeable streams
Scale/Unit of Assessment Stream reach, 30X bankfull width (minimum 100 meters)
Geographic Applicability Idaho
General Level of Effort
Moderate; Intensive (1 day± in the field by a trained or experienced crew of 2 or more persons)
Assessment Parameters:
Channel/Valley Morphology:
Stream discharge; width/depth ratio (wetted and bankfull dimensions); entrenchment ratio; sinuosity; channel habitat units [aka bed forms]; elevation; channel gradient; bank angle; bank undercut distance; substrate particle size distribution (pebble counts); Rosgen channel classification.
Physical Habitat: Woody debris tally; shade/canopy cover (densiometer); bank cover and stability (percent cover of vegetation, rock, downed wood, or other erosion resistant material); Pool Quality Index (pool length, substrate, overhead cover, submerged cover, percentage of undercut banks, maximum pool depth, maximum pool width, and depth at pool tail out); rapid habitat assessment (modfiied from Hayslip, 1993).
Water Quality: Temperature; specific conductivity; bacteria (E. coli).
Biology: Macroinvertebrate assemblages; periphyton assemblages; fish assemblages; amphibians.
Other: Stream order.
Resolution Semi-Quantitative (ordinal scale, rank, etc.); Quantitative (actual measurement or estimate).
Output Raw data (Grafe et al. (2002) describe data analysis and interpretation of BURP data.)

II - 55
Name Beneficial Use Reconnaissance Program Field Manual for Streams Catalog No. 23
Reference
N/A (The objective of the BURP Field Manual itself does not address reference conditions per se.) Grafe (2002a; 2002b) describes the development and integration of various condition indexes that IDEQ uses to assess aquatic life use support for Idaho streams and rivers, and these indexes have been developed and calibrated based on internal reference data from either Idaho ecoregions or bioregions, as applicable.
QA/QC
IDEQ ensures quality BURP data by providing centralized training for BURP crews, annual BURP Coordinator workshops, strict adherence to the Field Manual, consistent crew supervision, compilation and adherence to annual work plans, conducting comprehensive annual field audits, and following a quality assurance plan that addresses such issues as data handling, voucher specimens, and equipment calibration.
Description/ Summary
The Idaho Beneficial Use Reconnaissance Program (BURP) conducts stream monitoring activities to support assessments of biological assemblages and physical habitat structure, which in turn supports characterization of individual stream integrity and the total quality of Idaho’s waters. The BURP Field Manual is presented consistent with the four phases of BURP field activities: (1) Planning; (2) Preparing for field activities; (3) Field sampling, including detailed protocol descriptions; and (4) Follow-up and reporting. The field sampling protocols, which are generally transect based, are presented in a recommended sequence for performing monitoring activities.
Expertise Required Not stated.
Time Necessary to Conduct Assessment
Not stated.
Seasonality June to September
Related Procedures/ References
Grafe, C.S. (ed.). 2002a. Idaho Small Stream Ecological Assessment Framework: An Integrated Approach. Idaho Department of Environmental Quality; Boise, Idaho.
Grafe, C.S. (ed.). 2002b. Idaho River Ecological Assessment Framework: An Integrated Approach.
Idaho Department of Environmental Quality; Boise, Idaho. Grafe, C. S., M. McIntyre, C. Mebane and D. Mosier. 2002. Water Body Assessment Guidance (Second
Edition). Idaho Department of Environmental Quality. Boise, ID. Hayslip, G.A. (ed.). 1993. Region 10 in-stream biological monitoring handbook for wadeable streams in
the Pacific Northwest. EPA 910/9-92-013, U.S. Environmental Protection Agency, Region 10. Seattle, WA.
Other/Notes

II - 56
Name Aquatic Inventories Project Methods for Stream Habitat Surveys Catalog No. 24Primary Author/ Agency
Oregon Department of Fish and Wildlife Moore, K., K. Jones, J. Dambacher, C. Stein, et al. 2008. Aquatic Inventories Project: Methods for
Stream Habitat Surveys, Version 17.1, May 2008. Oregon Department of Fish and Wildlife, Aquatic Inventories Project, Conservation and Recovery Program, Corvallis, OR.
Electronic Resource
http://www.science.oregonstate.edu/~madsenl/TIESNA2009/Habitat_protocol.pdf
Intended Use/Purpose
Inventory; Ambient Monitoring.
Target Resource Type
Streams (No further clarification provided. However, there are procedural references specific to dry channels, suggesting that intermittent streams may also be inventoried using these methods).
Scale/Unit of Assessment
Stream reach of unspecified length that is defined based on confluences with named tributaries, changes in valley and channel form, major changes in vegetation type, or changes in land use or ownership. Appendices suggest that the sample stream reach should be 1000 meters.
Geographic Applicability Oregon
General Level of Effort
Moderate;
Intensive (1 day± in the field by a trained or experienced crew of 2 or more persons)
Assessment Parameters
Channel/Valley Morphology:
Stream discharge; water surface gradient; length, wetted width, and sub-type of each channel habitat unit [aka bed forms]; maximum pool depth; pool crest depth; substrate particle size classes (est.); boulder count (greater than 0.5 m average diameter located within or at margins of bankfull channel); percent active eroding banks (est.); percent undercut banks (est.); elevation; categorical valley type based on valley width index (ratio of the active channel width to the valley width); bankfull width; channel height above bankfull depth; floodprone width; terrace height (height from the streambed to the top of the first terrace above the floodprone height); terrace width; riparian zone gradient.
Physical Habitat: Woody debris tally; channel shade (via clinometer); general riparian community structure (size class and type).
Water Quality: Temperature.
Biology: Fish; amphibians; riparian vegetation (belt transect 5m x 30m perpendicular to each side of the stream): percent-cover trees (est.), percent-cover shrubs (est.), percent cover herbaceous layer (est.); tree count (stem density) per size class.
Other: Stream order; drainage density; watershed area; watershed land use.
Resolution Semi-Quantitative (ordinal scale, rank, etc.); Quantitative (actual measurement or estimate).
Output Raw data.
Reference N/A (The objective of the method or procedure is not presented in the context of defining the condition of a resource. However, it may be used to identify or establish reference conditions.)
QA/QC Not stated.

II - 57
Name Aquatic Inventories Project Methods for Stream Habitat Surveys Catalog No. 24
Description/ Summary
The Aquatic Inventories Project is designed to provide quantitative information on habitat condition for streams throughout Oregon. The Methods for Stream Habitat Surveys systematically identifies and quantifies valley and stream geomorphic features, resulting in a matrix of measurements and spatial relationships that can be generalized into frequently occurring valley and channel types. The Methods procedure requires completion of five (5) data sheets: 1) Stream Reach, 2) Unit-1, 3) Unit-2, 4) Wood, and 5) Riparian. Most channel morphology and physical habitat parameters are measured or estimated at either every channel habitat unit or every nth channel habitat unit, where n≤10. Channel habitat units (aka bed forms) are themselves classified in the field according to defined sub-types that share relatively homogeneous bed form, flow characteristics, and water surface slope. For example, six sub-types of pools are defined in the Methods. Data forms and instructions/guidelines for estimating or measuring each parameter are provided.
Expertise Required
Field work consistent with the Methods for Stream Habitat Surveys is intended to be carried out by a crew of two persons.
Time Necessary to Conduct Assessment
Not stated.
Seasonality Not stated.
Related Procedures/ References
Other/Notes

II - 58
Name Stream Inventory Handbook: Level I & II Catalog No. 25Primary Author/ Agency
U.S. Forest Service USFS. 2009. Stream Inventory Handbook: Level I & II, Version 2.9. U.S. Forest Service, Pacific
Northwest Region, Region 6.
Electronic Resource http://www.fs.fed.us/r6/water/fhr/sida/handbook/Stream-Inv-2009.pdf
Intended Use/Purpose
Inventory; Ambient Monitoring
Target Resource Type
Wadeable streams (ephemeral, intermittent, or perennial)
Scale/Unit of Assessment
Watershed; and/or Stream reach: A reach is a relatively homogeneous section of stream containing attributes of common character. The recommended minimum length for all reaches is 0.5 miles. All riffles (fast water) must be treated as “measured riffles” in any reach less than 0.5-mile long.
Geographic Applicability Oregon and Washington
General Level of Effort Intensive (1 day± in the field by a trained or experienced crew of 2 or more persons)
Assessment Parameters
Channel/Valley Morphology:
Stream discharge; length, wetted width, maximum depth, and average depth of each channel habitat unit [aka bed forms]; pool crest depth; pool forming feature (opt.); Rosgen stream type; valley form (opt.); thalweg length (longitudinal profile); bankfull width; average and maximum bankfull depth; floodprone area width; bank stability; substrate particle size classes (est.); particle size distribution (pebble count); mapped valley width; mapped channel length; mapped valley length; mapped channel gradient; measured channel gradient (opt.); mapped sinuosity; elevation (min/max).
Physical Habitat: Woody debris tally; inner riparian zone width (average width along both banks from bankfull to a distinct change in vegetation); successional class of riparian vegetation (based on vegetative type and size class); dominant overstory & understory riparian species.
Water Quality: Long-term thermograph (mid-June to late September).
Biology: Fish; amphibians.
Other: Stream order (opt.); watershed area.
Resolution Quantitative (actual measurement or estimate)
Output Raw data
Reference N/A (The objective of the method or procedure is not presented in the context of defining the condition of a resource. However, it may be used to identify or establish reference conditions.)
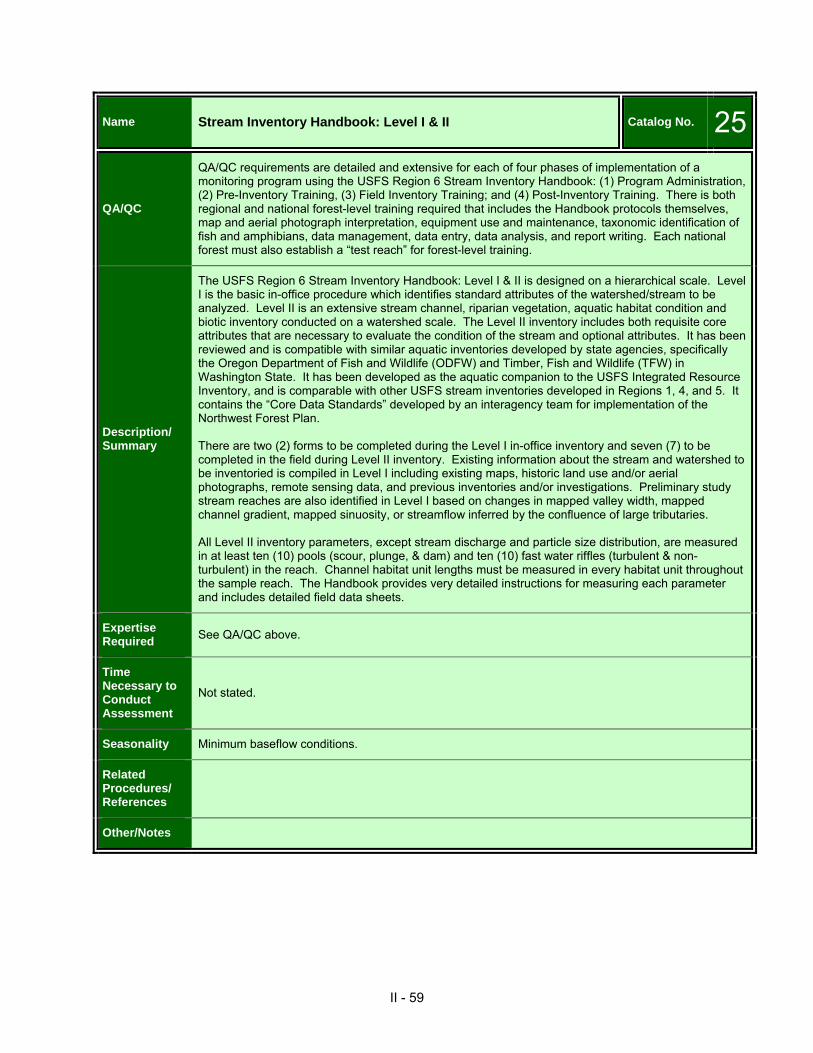
II - 59
Name Stream Inventory Handbook: Level I & II Catalog No. 25
QA/QC
QA/QC requirements are detailed and extensive for each of four phases of implementation of a monitoring program using the USFS Region 6 Stream Inventory Handbook: (1) Program Administration, (2) Pre-Inventory Training, (3) Field Inventory Training; and (4) Post-Inventory Training. There is both regional and national forest-level training required that includes the Handbook protocols themselves, map and aerial photograph interpretation, equipment use and maintenance, taxonomic identification of fish and amphibians, data management, data entry, data analysis, and report writing. Each national forest must also establish a “test reach” for forest-level training.
Description/ Summary
The USFS Region 6 Stream Inventory Handbook: Level I & II is designed on a hierarchical scale. Level I is the basic in-office procedure which identifies standard attributes of the watershed/stream to be analyzed. Level II is an extensive stream channel, riparian vegetation, aquatic habitat condition and biotic inventory conducted on a watershed scale. The Level II inventory includes both requisite core attributes that are necessary to evaluate the condition of the stream and optional attributes. It has been reviewed and is compatible with similar aquatic inventories developed by state agencies, specifically the Oregon Department of Fish and Wildlife (ODFW) and Timber, Fish and Wildlife (TFW) in Washington State. It has been developed as the aquatic companion to the USFS Integrated Resource Inventory, and is comparable with other USFS stream inventories developed in Regions 1, 4, and 5. It contains the “Core Data Standards” developed by an interagency team for implementation of the Northwest Forest Plan. There are two (2) forms to be completed during the Level I in-office inventory and seven (7) to be completed in the field during Level II inventory. Existing information about the stream and watershed to be inventoried is compiled in Level I including existing maps, historic land use and/or aerial photographs, remote sensing data, and previous inventories and/or investigations. Preliminary study stream reaches are also identified in Level I based on changes in mapped valley width, mapped channel gradient, mapped sinuosity, or streamflow inferred by the confluence of large tributaries. All Level II inventory parameters, except stream discharge and particle size distribution, are measured in at least ten (10) pools (scour, plunge, & dam) and ten (10) fast water riffles (turbulent & non-turbulent) in the reach. Channel habitat unit lengths must be measured in every habitat unit throughout the sample reach. The Handbook provides very detailed instructions for measuring each parameter and includes detailed field data sheets.
Expertise Required See QA/QC above.
Time Necessary to Conduct Assessment
Not stated.
Seasonality Minimum baseflow conditions.
Related Procedures/ References
Other/Notes

II - 60
Name Functional Assessment Approach for High Gradient Streams: West Virginia
Catalog No. 26
Primary Author/ Agency
U.S. Army Corps of Engineers, Huntington District USACE Huntington District. 2007. Functional Assessment Approach for High Gradient Streams: West
Virginia. June 2007, U.S. Army Corps of Engineers, Huntington District, Huntington, WV.
Electronic Resource http://www.lrh.usace.army.mil/permits/
Intended Use/Purpose
Regulatory Assessment (Clean Water Act, Section 404); Compensatory Mitigation Protocol
Target Resource Type
Headwater Streams: Ephemeral, Intermittent, & Low-order Perennial Characterized by high gradient (channel slope ranges from 4% to 10%), low sinuosity, with common to many step pools (Rosgen type A, Aa, or Aa+ streams)
Scale/Unit of Assessment Stream reach of unspecified length.
Geographic Applicability West Virginia
General Level of Effort Easy (rapid)
Assessment Parameters
Channel/Valley Morphology:
Watershed gradient; categorical channel alteration; channel gradient & number of step pools; substrate particle size (est.).
Physical Habitat: Woody debris tally.
Water Quality: - -
Biology: Percent-cover trees; percent-cover shrubs; percent-cover herbaceous layer; Number of native species in upper-most vegetative strata.
Other: Watershed land use/ land cover (est.); percent-cover soil detritus.
Resolution Qualitative (descriptive; categorical); Semi-Quantitative (ordinal scale, rank, etc.).
Output Condition Assessment; Index (e.g. numeric score); Programmatic or Regulatory Support Information.
Reference Internal, but based on “field observations, professional judgment, published literature,” and similar assessment indicators from other regions and ecosystems
QA/QC Not stated. However, the documentation indicates that no field studies have been conducted specifically to calibrate the metrics or indicators used in the Approach.

II - 61
Name Functional Assessment Approach for High Gradient Streams: West Virginia
Catalog No. 26
Description/ Summary
The “Functional Assessment Approach for High Gradient Streams: West Virginia” is considered by the USACE, Huntington District to be an interim approach that involves a visual evaluation of the physical and biological structure of the assessment site. The assessment itself uses a set of eleven (11) metrics that are scored based on ordinal or categorical descriptions and then aggregated in model equations to represent indicators of four (4) defined functions: hydrology, biogeochemical cycling, plant community functions, and wildlife habitat. Each function is described in the documentation, and rationale for including the subset of metrics used to generate an indicator score for each function, scaled from zero to 1.0, is also provided. The Approach documentation specifies that “decisions about how to use the numbers [output] are a matter of policy,” and are not specified in the document.
Expertise Required Not stated.
Time Necessary to Conduct Assessment
Not stated.
Seasonality Not stated.
Related Procedures/ References
None.
Other/Notes
The organizational presentation of the Approach document and the structure of the specific model equations that represent each function are very similar to those commonly used in regional guidebooks for hydrogeomorphic (HGM) functional assessment of wetlands. In early 2010, the IFAA was reportedly in the process of being significantly revised by the USACE Engineer Research and Development Center in Vicksburg, Mississippi.

II - 62
Name West Virginia Stream and Wetland Valuation Metric Catalog No. 27
Primary Author/ Agency
West Virginia Interagency Review Team West Virginia Interagency Review Team. 2010. West Virginia Stream and Wetland Valuation Metric, Version 1.1. March 2010. USACE Huntington District, USACE Pittsburgh District, USEPA, USFWS, USDA NRCS, West Virginia Department of Environmental Protection, and West Virginia Division of Natural Resources.
Electronic Resource http://www.lrh.usace.army.mil/permits/
Intended Use/Purpose
Regulatory Assessment (Clean Water Act, Section 404); Compensatory Mitigation Protocol.
Target Resource Type
Wadeable Streams: Ephemeral, Intermittent, or Perennial
Scale/Unit of Assessment
Not stated. However, the benthic macroinvertebrate sampling protocol upon which the West Virginia Stream Condition Index is based utilizes a sample stream reach of 100 meters.
Geographic Applicability West Virginia
General Level of Effort Moderate
Assessment Parameters
Channel/Valley Morphology:
Channel alteration (H, L)1; frequency of riffles or bends (H); sinuosity (L); bank stability (H, L); pool substrate characterization (L); Velocity/depth combinations (H); pool variability (L).
Physical Habitat: Epifaunal substrate/available cover (H, L); embeddedness (H); sediment deposition (H, L); channel flow status (H, L); bank vegetative protection (H, L); riparian zone width (H, L).
Water Quality: Specific conductivity; pH; dissolved oxygen.
Biology Benthic macroinvertebrates.
Other: - -
1 All Channel/Valley Morphology and Physical Habitat parameters listed above are included as part of the USEPA RBP stream habitat assessment index. H = applicable in high gradient streams; L = applicable in low gradient streams.
Resolution Semi-Quantitative (ordinal scale, rank, etc.); Quantitative (actual measurement or estimate).
Output Condition Assessment; Index (e.g. numeric score); Programmatic or Regulatory Support Information.
Reference Internal (e.g. Index calibrated to existing local or regional reference data).
QA/QC Not stated.
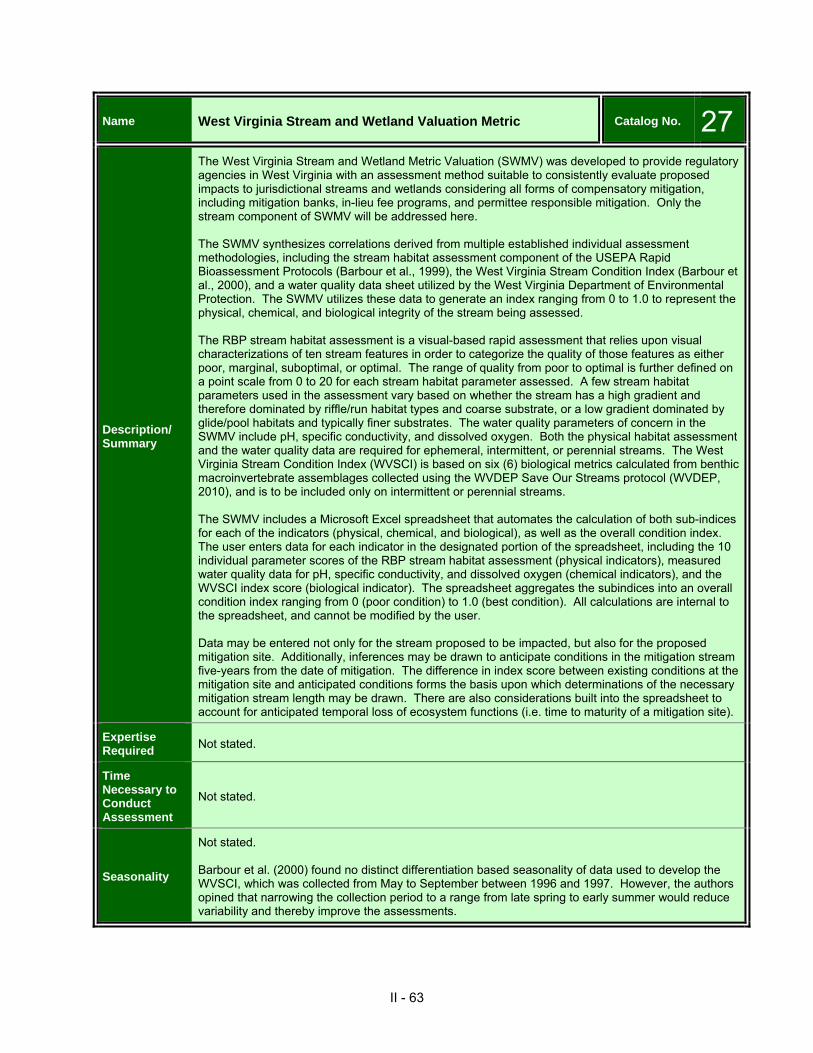
II - 63
Name West Virginia Stream and Wetland Valuation Metric Catalog No. 27
Description/ Summary
The West Virginia Stream and Wetland Metric Valuation (SWMV) was developed to provide regulatory agencies in West Virginia with an assessment method suitable to consistently evaluate proposed impacts to jurisdictional streams and wetlands considering all forms of compensatory mitigation, including mitigation banks, in-lieu fee programs, and permittee responsible mitigation. Only the stream component of SWMV will be addressed here. The SWMV synthesizes correlations derived from multiple established individual assessment methodologies, including the stream habitat assessment component of the USEPA Rapid Bioassessment Protocols (Barbour et al., 1999), the West Virginia Stream Condition Index (Barbour et al., 2000), and a water quality data sheet utilized by the West Virginia Department of Environmental Protection. The SWMV utilizes these data to generate an index ranging from 0 to 1.0 to represent the physical, chemical, and biological integrity of the stream being assessed. The RBP stream habitat assessment is a visual-based rapid assessment that relies upon visual characterizations of ten stream features in order to categorize the quality of those features as either poor, marginal, suboptimal, or optimal. The range of quality from poor to optimal is further defined on a point scale from 0 to 20 for each stream habitat parameter assessed. A few stream habitat parameters used in the assessment vary based on whether the stream has a high gradient and therefore dominated by riffle/run habitat types and coarse substrate, or a low gradient dominated by glide/pool habitats and typically finer substrates. The water quality parameters of concern in the SWMV include pH, specific conductivity, and dissolved oxygen. Both the physical habitat assessment and the water quality data are required for ephemeral, intermittent, or perennial streams. The West Virginia Stream Condition Index (WVSCI) is based on six (6) biological metrics calculated from benthic macroinvertebrate assemblages collected using the WVDEP Save Our Streams protocol (WVDEP, 2010), and is to be included only on intermittent or perennial streams. The SWMV includes a Microsoft Excel spreadsheet that automates the calculation of both sub-indices for each of the indicators (physical, chemical, and biological), as well as the overall condition index. The user enters data for each indicator in the designated portion of the spreadsheet, including the 10 individual parameter scores of the RBP stream habitat assessment (physical indicators), measured water quality data for pH, specific conductivity, and dissolved oxygen (chemical indicators), and the WVSCI index score (biological indicator). The spreadsheet aggregates the subindices into an overall condition index ranging from 0 (poor condition) to 1.0 (best condition). All calculations are internal to the spreadsheet, and cannot be modified by the user. Data may be entered not only for the stream proposed to be impacted, but also for the proposed mitigation site. Additionally, inferences may be drawn to anticipate conditions in the mitigation stream five-years from the date of mitigation. The difference in index score between existing conditions at the mitigation site and anticipated conditions forms the basis upon which determinations of the necessary mitigation stream length may be drawn. There are also considerations built into the spreadsheet to account for anticipated temporal loss of ecosystem functions (i.e. time to maturity of a mitigation site).
Expertise Required Not stated.
Time Necessary to Conduct Assessment
Not stated.
Seasonality
Not stated. Barbour et al. (2000) found no distinct differentiation based seasonality of data used to develop the WVSCI, which was collected from May to September between 1996 and 1997. However, the authors opined that narrowing the collection period to a range from late spring to early summer would reduce variability and thereby improve the assessments.

II - 64
Name West Virginia Stream and Wetland Valuation Metric Catalog No. 27
Related Procedures/ References
Barbour, M.T., J. Gerritsen, B.D. Snyder, and J.B. Stribling. 1999. Rapid Bioassessment Protocols for Use in Streams and Wadeable Rivers Periphyton, Benthic Macroinvertebrates, and Fish, Second Edition. EPA 841-B-99–002. USEPA Office of Water, Washington, D.C.
Barbour, M.T., J. Burton, and J. Gerritsen. 2000. A Stream Condition Index for West Virginia
Wadeable Streams. March 28, 2000 (revised July 21, 2000). EPA 68-C7-0014. U.S. Environmental Protection Agency, Region 3 Environmental Services Division and U.S. Environmental Protection Agency, Office of Science and Technology, Office of Water.
WVDEP. 2010. West Virginia Save Our Streams. West Virginia Department of Environmental
Protection, Division of Water and Waste Management, http://www.wvdep.org/item.cfm?ssid=11&ss1id=202.
Other/Notes The stream portion of the Stream and Wetland Valuation Metric is anticipated to be superceded by completion of a Comprehensive Stream Assessment Methodology being developed by the USACE Engineer Research and Development Center.

II - 65
Name Unified Stream Methodology Catalog No. 28Primary Author/ Agency
U.S. Army Corps of Engineers, Norfolk District and Virginia Department of Environmental Quality, January 2007
Electronic Resource http://www.nao.usace.army.mil/technical%20services/Regulatory%20branch/USM.asp
Intended Use/Purpose
Regulatory Assessment (Clean Water Act, Section 404; Virginia Water Protection Permit Program); Compensatory Mitigation Protocol.
Target Resource Type
Wadeable streams: Ephemeral, Intermittent, or Perennial.
Scale/Unit of Assessment
Stream reach defined by changes in channel condition, riparian buffer, in-stream habitat, or channel alteration.
Geographic Applicability Virginia
General Level of Effort Easy
Assessment Parameters
Wadeable perennial or intermittent streams - Reach Condition Index (based on visual observation):
Channel / Valley Morphology:
Channel condition (cross-sectional channel stability; preponderance of sediment deposition; vegetative bank coverage; bank erosion); Channel alteration (preponderance of anthropogenic channel disturbance, such as channelization, rip-rap, road crossings, etc.).
Physical Habitat: Riparian buffers (canopy coverage; number of well represented vegetative strata); in-stream habitat (percent coverage of in-stream habitat, including substrate size variation, flow velocity and depth, woody and leafy debris, undercut banks, etc.).
Water Quality: - -
Biology: - -
Other: - -
Resolution Qualitative (descriptive); Semi-Quantitative (ordinal scale, rank, etc.)
Output Subjective Index (e.g. numeric score); Qualitative Description; Programmatic or Regulatory Support Information
Reference Measured External Reference Required (e.g. site specific / project specific reference).
QA/QC Not stated.
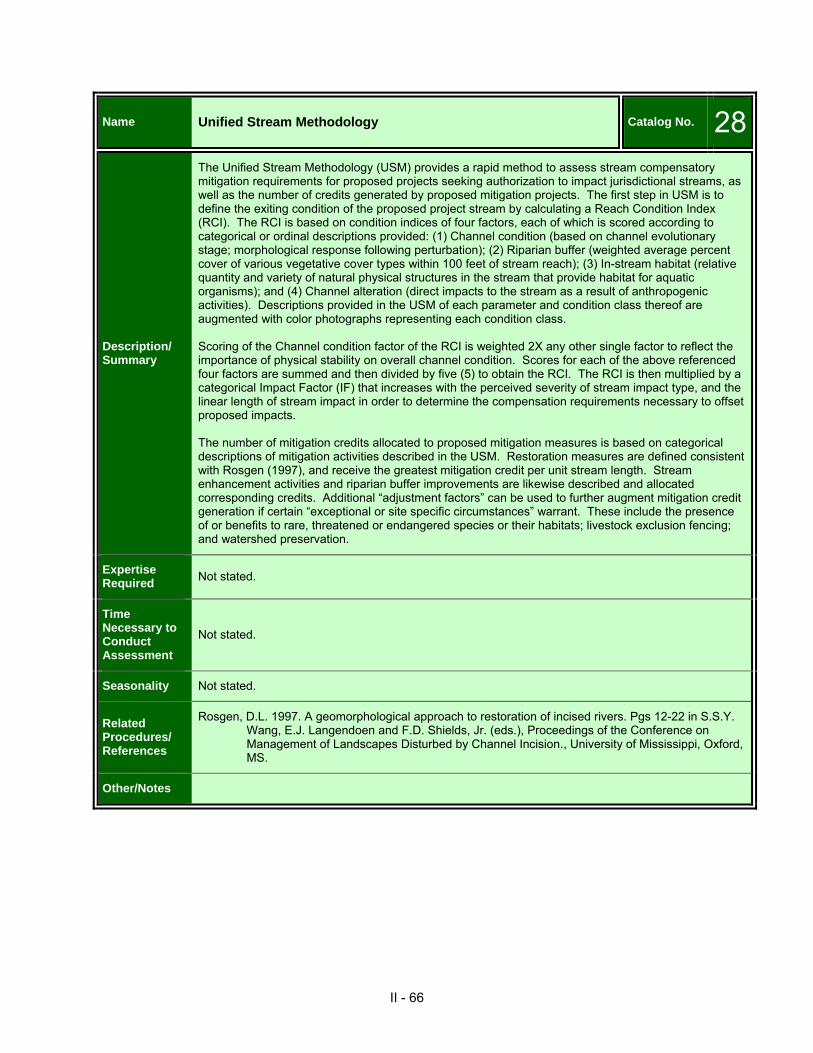
II - 66
Name Unified Stream Methodology Catalog No. 28
Description/ Summary
The Unified Stream Methodology (USM) provides a rapid method to assess stream compensatory mitigation requirements for proposed projects seeking authorization to impact jurisdictional streams, as well as the number of credits generated by proposed mitigation projects. The first step in USM is to define the exiting condition of the proposed project stream by calculating a Reach Condition Index (RCI). The RCI is based on condition indices of four factors, each of which is scored according to categorical or ordinal descriptions provided: (1) Channel condition (based on channel evolutionary stage; morphological response following perturbation); (2) Riparian buffer (weighted average percent cover of various vegetative cover types within 100 feet of stream reach); (3) In-stream habitat (relative quantity and variety of natural physical structures in the stream that provide habitat for aquatic organisms); and (4) Channel alteration (direct impacts to the stream as a result of anthropogenic activities). Descriptions provided in the USM of each parameter and condition class thereof are augmented with color photographs representing each condition class. Scoring of the Channel condition factor of the RCI is weighted 2X any other single factor to reflect the importance of physical stability on overall channel condition. Scores for each of the above referenced four factors are summed and then divided by five (5) to obtain the RCI. The RCI is then multiplied by a categorical Impact Factor (IF) that increases with the perceived severity of stream impact type, and the linear length of stream impact in order to determine the compensation requirements necessary to offset proposed impacts. The number of mitigation credits allocated to proposed mitigation measures is based on categorical descriptions of mitigation activities described in the USM. Restoration measures are defined consistent with Rosgen (1997), and receive the greatest mitigation credit per unit stream length. Stream enhancement activities and riparian buffer improvements are likewise described and allocated corresponding credits. Additional “adjustment factors” can be used to further augment mitigation credit generation if certain “exceptional or site specific circumstances” warrant. These include the presence of or benefits to rare, threatened or endangered species or their habitats; livestock exclusion fencing; and watershed preservation.
Expertise Required Not stated.
Time Necessary to Conduct Assessment
Not stated.
Seasonality Not stated.
Related Procedures/ References
Rosgen, D.L. 1997. A geomorphological approach to restoration of incised rivers. Pgs 12-22 in S.S.Y. Wang, E.J. Langendoen and F.D. Shields, Jr. (eds.), Proceedings of the Conference on Management of Landscapes Disturbed by Channel Incision., University of Mississippi, Oxford, MS.
Other/Notes

II - 67
Name USACE Charleston District, Standard Operating Procedure: Compensatory Mitigation Catalog No. 29
Primary Author/ Agency
U.S. Army Corps of Engineers, Charleston District USACE, Charleston District. 2002. Standard Operating Procedure: Compensatory Mitigation. RD-SOP-
02-01, September 19, 2002. U.S. Army Corps of Engineers, Charleston District, Charleston, SC. [NOTE: the Charleston SOP is currently being updated, as of February 2010].
Electronic Resource
http://www.sac.usace.army.mil/?action=mitigation.home
Intended Use/Purpose
Regulatory Assessment (Clean Water Act, Section 404); Compensatory Mitigation Protocol
Target Resource Type
Intermittent Streams; Perennial Streams; and Riparian Zones
Scale/Unit of Assessment Stream reach of unspecified length
Geographic Applicability South Carolina
General Level of Effort Varies; The SOP refers to other guidance for assessment and monitoring methods.
Assessment Parameters
Varies, but may include:
Channel/Valley Morphology:
Stream discharge; channel cross-sections & longitudinal profiles [dimension, pattern and profile]; measures of channel and streambank stability (methods undefined); substrate and sediment characteristics (undefined).
Physical Habitat: - -
Water Quality: Temperature; dissolved oxygen; turbidity.
Biology: As applicable: Fish; benthic macroinvertebrates; riparian vegetation.
Other: - -
Resolution Qualitative (descriptive; categorical); Semi-Quantitative (ordinal scale, rank, etc.); and/or Quantitative (actual measurement or estimate).
Output Programmatic or Regulatory Support Information
Reference
Measured External Reference Required (e.g. site specific / project specific reference)
Reference is not necessarily required to place the project stream into regional context based on physical or biological condition, but rather to suggest specific design and/or success criteria for proposed mitigation projects.
QA/QC Not stated.
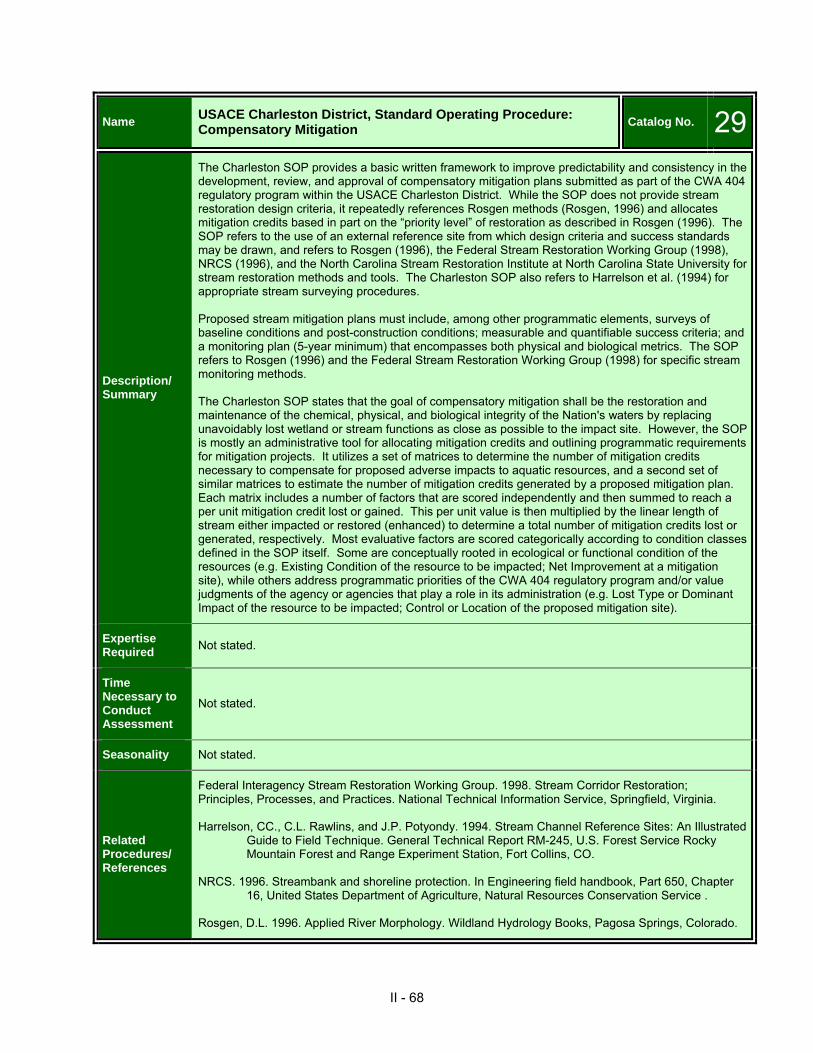
II - 68
Name USACE Charleston District, Standard Operating Procedure: Compensatory Mitigation Catalog No. 29
Description/ Summary
The Charleston SOP provides a basic written framework to improve predictability and consistency in the development, review, and approval of compensatory mitigation plans submitted as part of the CWA 404 regulatory program within the USACE Charleston District. While the SOP does not provide stream restoration design criteria, it repeatedly references Rosgen methods (Rosgen, 1996) and allocates mitigation credits based in part on the “priority level” of restoration as described in Rosgen (1996). The SOP refers to the use of an external reference site from which design criteria and success standards may be drawn, and refers to Rosgen (1996), the Federal Stream Restoration Working Group (1998), NRCS (1996), and the North Carolina Stream Restoration Institute at North Carolina State University for stream restoration methods and tools. The Charleston SOP also refers to Harrelson et al. (1994) for appropriate stream surveying procedures. Proposed stream mitigation plans must include, among other programmatic elements, surveys of baseline conditions and post-construction conditions; measurable and quantifiable success criteria; and a monitoring plan (5-year minimum) that encompasses both physical and biological metrics. The SOP refers to Rosgen (1996) and the Federal Stream Restoration Working Group (1998) for specific stream monitoring methods. The Charleston SOP states that the goal of compensatory mitigation shall be the restoration and maintenance of the chemical, physical, and biological integrity of the Nation's waters by replacing unavoidably lost wetland or stream functions as close as possible to the impact site. However, the SOP is mostly an administrative tool for allocating mitigation credits and outlining programmatic requirements for mitigation projects. It utilizes a set of matrices to determine the number of mitigation credits necessary to compensate for proposed adverse impacts to aquatic resources, and a second set of similar matrices to estimate the number of mitigation credits generated by a proposed mitigation plan. Each matrix includes a number of factors that are scored independently and then summed to reach a per unit mitigation credit lost or gained. This per unit value is then multiplied by the linear length of stream either impacted or restored (enhanced) to determine a total number of mitigation credits lost or generated, respectively. Most evaluative factors are scored categorically according to condition classes defined in the SOP itself. Some are conceptually rooted in ecological or functional condition of the resources (e.g. Existing Condition of the resource to be impacted; Net Improvement at a mitigation site), while others address programmatic priorities of the CWA 404 regulatory program and/or value judgments of the agency or agencies that play a role in its administration (e.g. Lost Type or Dominant Impact of the resource to be impacted; Control or Location of the proposed mitigation site).
Expertise Required Not stated.
Time Necessary to Conduct Assessment
Not stated.
Seasonality Not stated.
Related Procedures/ References
Federal Interagency Stream Restoration Working Group. 1998. Stream Corridor Restoration; Principles, Processes, and Practices. National Technical Information Service, Springfield, Virginia. Harrelson, CC., C.L. Rawlins, and J.P. Potyondy. 1994. Stream Channel Reference Sites: An Illustrated
Guide to Field Technique. General Technical Report RM-245, U.S. Forest Service Rocky Mountain Forest and Range Experiment Station, Fort Collins, CO.
NRCS. 1996. Streambank and shoreline protection. In Engineering field handbook, Part 650, Chapter
16, United States Department of Agriculture, Natural Resources Conservation Service . Rosgen, D.L. 1996. Applied River Morphology. Wildland Hydrology Books, Pagosa Springs, Colorado.
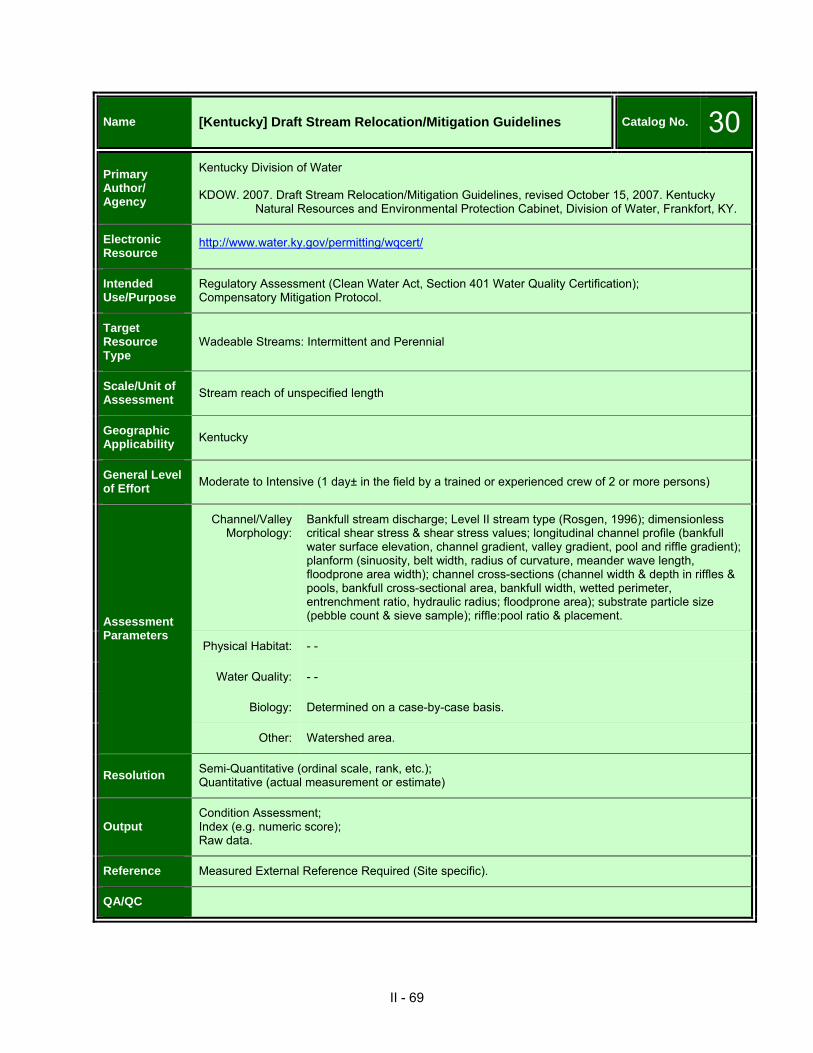
II - 69
Name [Kentucky] Draft Stream Relocation/Mitigation Guidelines Catalog No. 30
Primary Author/ Agency
Kentucky Division of Water KDOW. 2007. Draft Stream Relocation/Mitigation Guidelines, revised October 15, 2007. Kentucky
Natural Resources and Environmental Protection Cabinet, Division of Water, Frankfort, KY.
Electronic Resource
http://www.water.ky.gov/permitting/wqcert/
Intended Use/Purpose
Regulatory Assessment (Clean Water Act, Section 401 Water Quality Certification); Compensatory Mitigation Protocol.
Target Resource Type
Wadeable Streams: Intermittent and Perennial
Scale/Unit of Assessment Stream reach of unspecified length
Geographic Applicability Kentucky
General Level of Effort Moderate to Intensive (1 day± in the field by a trained or experienced crew of 2 or more persons)
Assessment Parameters
Channel/Valley Morphology:
Bankfull stream discharge; Level II stream type (Rosgen, 1996); dimensionless critical shear stress & shear stress values; longitudinal channel profile (bankfull water surface elevation, channel gradient, valley gradient, pool and riffle gradient); planform (sinuosity, belt width, radius of curvature, meander wave length, floodprone area width); channel cross-sections (channel width & depth in riffles & pools, bankfull cross-sectional area, bankfull width, wetted perimeter, entrenchment ratio, hydraulic radius; floodprone area); substrate particle size (pebble count & sieve sample); riffle:pool ratio & placement.
Physical Habitat: - -
Water Quality: - -
Biology: Determined on a case-by-case basis.
Other: Watershed area.
Resolution Semi-Quantitative (ordinal scale, rank, etc.); Quantitative (actual measurement or estimate)
Output Condition Assessment; Index (e.g. numeric score); Raw data.
Reference Measured External Reference Required (Site specific).
QA/QC

II - 70
Name [Kentucky] Draft Stream Relocation/Mitigation Guidelines Catalog No. 30
Description/ Summary
The Draft Stream Relocation/Mitigation Guidelines from the Kentucky Division of Water (KDOW) provides detailed guidance on mitigation requirements and monitoring and assessment requirements for stream relocations and mitigation projects in the Commonwealth of Kentucky. Mitigation requirements themselves are based on ratios, dependent on the type of mitigation actions proposed. For example, stream enhancement measures will require a greater linear stream length of mitigation relative to stream restoration activities used to mitigate equivalent impacts. Although monitoring and assessment requirements are generally provided in outline form, the requirements themselves are discussed in detail, and suitable methods are referenced. Requisite data to support stream relocation or mitigation projects include longitudinal channel profiles for the impact reach, reference stream segment, and post-construction channel. Planform information must also be presented for both the reference stream segment and post-construction channel. Channel cross-sections must be collected from meander bends and straight reaches of the channel in both the reference stream segment and post-construction channel. The Guidelines refer to Harrelson et al. (1994) for appropriate stream surveying procedures. Requisite monitoring parameters are clearly indicated in the Guidelines and include most of the above referenced parameters, in addition to riparian vegetation (density, percent cover, and dominance) and the rapid stream Habitat Assessment Index from the USEPA RBP (Barbour et al., 1999). Tentative habitat criteria relating the RBP Habitat Assessment Index to biological conditions for each of Kentucky’s ecoregions has been compiled, and is presented in Chapter 6 of KDOW (2002). When biological monitoring is required for stream relocation or mitigation projects, standard methods in KDOW (2002) must be followed.
Expertise Required Not stated.
Time Necessary to Conduct Assessment
Not stated.
Seasonality Not stated.
Related Procedures/ References
Barbour, M.T., J. Gerritsen, B.D. Snyder, and J.B. Stribling. 1999. Rapid Bioassessment Protocols for Use in Streams and Wadeable Rivers: Periphyton, Benthic Macroinvertebrates, and Fish, Second Edition. EPA 841-B-99–002. USEPA Office of Water, Washington, D.C.
Harrelson, CC., C.L. Rawlins, and J.P. Potyondy. 1994. Stream Channel Reference Sites: An
Illustrated Guide to Field Technique. General Technical Report RM-245, U.S. Forest Service Rocky Mountain Forest and Range Experiment Station, Fort Collins, CO.
KDOW. 2002. Methods for Assessing Biological Integrity of Surface Waters. July 2002. Kentucky
Natural Resources and Environmental Protection Cabinet, Division of Water, Frankfort, KY.
Other/Notes
The above KDOW referenced web site also includes links to documents reporting regional bankfull channel characteristics (aka hydraulic regional curves) for each ecoregion in Kentucky. Some of these documents also include stream channel morphological data collected from select designated KDOW biological reference streams and conclude with a discussion on how the regional relationships may be used during stream assessment and restoration design.

II - 71
Name Stream Assessment Protocol for Headwater Streams in the Eastern Kentucky Coalfield Region (eKY Protocol) Catalog No. 31
Primary Author/ Agency
U.S. Army Corps of Engineers, Louisville District [based in large part on work by Kentucky Division of Water] Sparks, E.J., J. Townsend, T. Hagman, and D. Messer. 2003a. Stream Assessment Protocol for
Headwater Streams in the Eastern Kentucky Coalfield Region. Aquatic Resource News: A Regulatory Newsletter 2(1), U.S. Army Corps of Engineers, Institute for Water Resources, Alexandria, VA.
Sparks, E.J., T.E. Hagman, D. Messer, and J.M. Townsend. 2003b. Eastern Kentucky Stream
Assessment Protocol: Utility in Making Mitigation Decisions. Aquatic Resource News: A Regulatory Newsletter 2(2), U.S. Army Corps of Engineers, Institute for Water Resources, Alexandria, VA.
Electronic Resource
http://www.usace.army.mil/CECW/Pages/aqua_news.aspx See also Pond and McMurray (2002), http://www.water.ky.gov/sw/swmonitor/sop/
Intended Use/Purpose
Regulatory Assessment (Clean Water Act, Section 404); Compensatory Mitigation Protocol.
Target Resource Type
Headwater Streams, either intermittent or perennial ~ 1st and 2nd order streams with a drainage area of generally <3 to 5 square miles [actual reference and test sites used to develop the Macroinvertebrate Bioassessment Index (MBI) ranged from 0.25 to 3.5 square miles]
Scale/Unit of Assessment Stream reach, 100-meters
Geographic Applicability
Eastern Kentucky Coalfield Region, including portions of three Level III ecoregions: Southwestern Appalachians, 68; Central Appalachians, 69; and Western Allegheny Plateau, 70.
General Level of Effort
Easy to Moderate - The eKY Protocol utilizes both biotic and abiotic indices to reach an “Ecological Integrity Index,” but allows for only the abiotic factors to be evaluated in the absence of comparable biotic data or when there is less time available for assessment (e.g. preliminary site visit).
Assessment Parameters
Channel/Valley Morphology:
- -
Physical Habitat: Riparian zone width; embeddedness; rapid visual-based habitat assessment (RBP).
Water Quality: Conductivity.
Biology: Benthic macroinvertebrates (optional).
Other: - -
Resolution Sparks et al. (2003a) Semi-Quantitative (ordinal scale, rank, etc.) Quantitative (actual measurement or estimate)
Pond and McMurray (2002) Semi-Quantitative (ordinal scale, rank, etc.) Quantitative (actual measurement or estimate)
Output Condition Assessment; Index (e.g. numeric score); Programmatic or Regulatory Support Information.

II - 72
Name Stream Assessment Protocol for Headwater Streams in the Eastern Kentucky Coalfield Region (eKY Protocol) Catalog No. 31
Reference Internal (e.g. Index calibrated to existing local or regional reference data); based on Pond and McMurray (2002) a priori classification of sites as representative of least disturbed conditions in the region during compilation of the MBI.
QA/QC Not stated.
Description/ Summary
Sparks et al. (2003a) utilized the Eastern Kentucky macroinvertebrate biological index (MBI) compiled by the Kentucky Division of Water (Pond and McMurray, 2002) to develop the eKY Protocol specifically for the U.S. Army Corps of Engineers, Louisville District in its administration of Section 404 of the Clean Water Act (CWA). Physical habitat metrics collected by Pond and McMurray (2002) during the development of the bioassessment index were mostly transect-based estimates, but not completely quantitative measurements. Three of these metrics, plus one water quality metric, collectively differentiated a prior reference and test sites with 98% accuracy: percent embeddedness, canopy cover, conductivity, and rapid habitat assessment score (Pond and McMurray, 2002). Pond and McMurray (2002) also evaluated a family-level MBI (F-MBI) and found a strong relationship between the F-MBI and the original genus level MBI. Recommendations for using the eKY Protocol include three components: characterization, assessment, and analysis (Sparks et al., 2003a). Characterization includes a checklist specific to the CWA 404 program for documenting potential consequences of a proposed dredge and fill project on the aquatic environment and describes the physical characteristics of the headwater stream ecosystem and surrounding landscape. Assessment involves calculation of the Ecological Integrity Index (EII) for both exiting conditions and anticipated post-project conditions. Analysis includes utilization of the assessment results to evaluate the proposed project under the CWA 404(b)(1) Guidelines and to help define potential compensatory mitigation needs, if applicable. Sparks et al. (2003b) provide examples of how the eKY Protocol is used to evaluate projects in the CWA 404 regulatory program, including how assessment results are used to determine mitigation ratios. EII spreadsheet calculators and mitigation ratio calculators are available on the USACE, Louisville District web site, including spreadsheets developed to account for the temporal loss of ecosystem functions between project site impact and implementation of mitigation. Although these examples do not specifically illustrate the protocol’s application in designing mitigation projects, Sparks et al. (2003b) stress that such projects should be designed using “sound principles of fluvial geomorphology...based on [project specific] reference reaches.”
Expertise Required Not stated.
Time Necessary to Conduct Assessment
Not stated.
Seasonality Most robust level of assessment is ideally based on macroinvertebrates sampled during the spring index period (mid-February to late-May).
Related Procedures/ References
Barbour, M.T., J. Gerritsen, B.D. Snyder, and J.B. Stribling. 1999. Rapid bioassessment protocols for use in streams and wadeable rivers: periphyton, benthic macroinvertebrates, and fish, second edition. EPA 841-B-99-002. Office of Water, U.S. Environmental Protection Agency, Washington, D.C.
Pond, G.J. and S.E. McMurray. 2002. A Macroinvertebrate Bioassessment Index for Headwater
Streams of the Eastern Coalfield Region, Kentucky. Kentucky Division of Water, Water Quality Branch, Frankfort, KY. 56 pp.
Other/Notes

II - 73
Name Stream Mitigation Guidelines [NC] Catalog No. 32Primary Author/ Agency
U.S. Army Corps of Engineers, Wilmington District USACE. 2003. Stream Mitigation Guidelines. U.S. Army Corps of Engineers, Wilmington District,
Wilmington, NC.
Electronic Resource http://www.saw.usace.army.mil/wetlands/Mitigation/stream_mitigation.html
Intended Use/Purpose
Regulatory Assessment (USACE CWA Section 404; NCDWQ CWA Section 401); Compensatory Mitigation Protocol
Target Resource Type
Non-tidal Streams
Scale/Unit of Assessment Stream reach of unspecified length
Geographic Applicability North Carolina
General Level of Effort
Easy (rapid); Moderate.
Assessment Parameters
Stream Quality Assessment index (based on visual observation):
Channel/Valley Morphology:
Entrenchment; presence of adjacent floodplain; sinuosity; evidence of channel incision or widening; presence of major bank failures; presence of flow / persistence of pools; evidence of human alteration; rooting depth and density on banks; dominant substrate size class and diversity of size classes; riffle and pool abundance, depth and frequency.
Physical Habitat: Riparian buffer width; presence of groundwater discharge; presence of adjacent wetlands; sediment input; in-stream habitat complexity; canopy coverage; embeddedness.
Water Quality: Evidence of nutrient or chemical discharges.
Biology: Invertebrates’ abundance, taxa richness, and sensitivity; types of amphibians present; fish abundance and taxa diversity; wildlife use of stream and riparian zone.
Other: Impact by agriculture, livestock, or timber production.
Resolution Qualitative (descriptive) Semi-Quantitative (ordinal scale, rank, etc.) Quantitative (actual measurement or estimate)
Output
Condition Assessment; Index (e.g. numeric score); Qualitative Description; Raw data Programmatic or Regulatory Support Information

II - 74
Name Stream Mitigation Guidelines [NC] Catalog No. 32
Reference
Condition assessment for large streams is based on ecoregional data collected by the NCDWQ bioassessment program. Site specific physical and morphological data is required from an external site specific reference stream reach. Post-construction benthic macroinvertebrate sampling must also include a sample station upstream of the mitigation stream section (NCDWQ, 2001). In some cases, one of NCDWQ’s regional biological reference stations will also be required for monitoring.
QA/QC
NCDWQ has specific requirements for the development of a quality assurance plan for benthic macroinvertebrate sampling that must be first coordinated with NCDWQ. The QA plan must include standard operating procedures that clearly demonstrate the ability of those involved with collection, taxonomic analyses, and reporting of results (NCDWQ, 2001).
Description/ Summary
Although the USACE Wilmington District bases stream mitigation requirements for CWA 404 permits on ratios, the integration of stream assessment information, tools, and guidance from various State and Federal sources that are included in the Stream Mitigation Guidelines (and directly referenced on the USACE Wilmington District’s web site) warrants its inclusion in this review. Final compensatory mitigation requirements for streams in the USACE Wilmington District consist of mitigation ratios that are generally based on the existing stream channel conditions and four levels or types of mitigation activities described in the Guidance. These categorical levels vary by the proposed mitigation actions’ degree of complexity and include geomorphic stream channel considerations, biological considerations, and water quality (chemical) considerations. Existing stream conditions for large streams and rivers (wetted width ≥4 meters) are assessed based on bioclassification criteria and rating protocols developed for some of the major ecoregions in North Carolina by the North Carolina Division of Water Quality (NCDWQ). These criteria themselves are based primarily on benthic macroinvertebrates community composition, but habitat quality and fish community conditions are also used to assess quality conditions for large streams and rivers. There are five (5) stream quality condition classes based on these criteria. The condition of small perennial streams (wetted width <3 meters) is assessed using a Stream Quality Assessment Worksheet that provides an index based on scores from observations of 23 metrics apportioned into four categories: (1) physical conditions, (2) channel stability, (3) habitat, and (4) biology. Monitoring requirements in the USACE Wilmington District recommend stream dimension, pattern, and profile surveying using methods from Harrelson et al. (1994). Additional requisite monitoring elements are based on the type and spatial extent of mitigation activities conducted, but may include biological sampling (NCDWQ, 2001), channel stability analysis, and/or riparian vegetation survival and growth. Specific evaluation criteria for mitigation sites are provided.
Expertise Required Not stated.
Time Necessary to Conduct Assessment
Not stated.
Seasonality
NCDWQ (2001) recommends that benthic macroinvertebrate samples be collected during the summer (June – September) for mitigation projects in the mountain and piedmont ecoregions (including the Sand Hills), but during the winter (January - March) for mitigation projects in coastal plain swamp streams.

II - 75
Name Stream Mitigation Guidelines [NC] Catalog No. 32
Related Procedures/ References
Doll, B.A., G.L. Grabow, K.R. Hall, J. Halley, W.A. Harman, G.D. Jennings, and D.E. Wise. 2003. Stream Restoration: A Natural Channel Design Handbook. NC Stream Restoration Institute, NC State University. http://www.bae.ncsu.edu/programs/extension/wqg/srp/guidebook.html
Harrelson, CC., C.L. Rawlins, and J.P. Potyondy. 1994. Stream Channel Reference Sites: An Illustrated
Guide to Field Technique. General Technical Report RM-245, U.S. Forest Service Rocky Mountain Forest and Range Experiment Station, Fort Collins, CO.
NCDWQ. 2001. Interim, Internal Technical Guide: Benthic Macroinvertebrate Monitoring Protocols for
Compensatory Stream Restoration Projects, North Carolina Division of Water Quality, 401/Wetlands Unit. December, 2001, Raleigh, NC.
Other/Notes
Appendices to the Stream Mitigation Guidelines include hydraulic regional curves for North Carolina, as well as a fact sheet describing “Application of the Rosgen Stream Classification System to North Carolina.” Links to the internet sites of North Carolina state agencies involved in stream assessment, monitoring, and mitigation are provided. North Carolina State University maintains a Stream Restoration Program (NCSRP) consisting largely of faculty of the Department of Biological and Agricultural Engineering, as well as North Carolina Sea Grant and off-campus Extension faculty. The goal of NCSRP is to improve water quality and aquatic ecology through research, demonstration projects, and education/training. Among the many technical resources compiled by NCSRP, Doll et al. (2003) compiled a handbook on natural channel design for stream restoration that is available on the NCSRP web site.