_stream outputs_session 2b-3b learning from experience_klaus schmitt
TRANSCRIPT

8/8/2019 _stream Outputs_session 2b-3b Learning From Experience_Klaus Schmitt
http://slidepdf.com/reader/full/stream-outputssession-2b-3b-learning-from-experienceklaus-schmitt 1/16
Experiences in quantitativemanagement effectiveness assessment using the
Management Information System MISTin Bwindi Impenetrable National Park, Uganda
John Makombo and Klaus Schmitt
November 2003
Report presented during the 5 th World Parks Congress, Durban, South Africa, September 2003

8/8/2019 _stream Outputs_session 2b-3b Learning From Experience_Klaus Schmitt
http://slidepdf.com/reader/full/stream-outputssession-2b-3b-learning-from-experienceklaus-schmitt 2/16
1
Table of contents
1. SUMMARY........................................................................................................................... 2
2. INTRODUCTION.................................................................................................................. 3
3.
A BRIEF OVERVIEW OF MIST............................................................................................ 4
3.1. The MIST programme and database ........................................................................ 4
3.2. Design of data collection........................................................................................... 5
3.3. Monitoring................................................................................................................. 5
3.4. MIST programme design and sustainability .............................................................. 6
3.5. Institutional set-up and knowledge management ........... ............ ............ ............ ....... 6
4. THE BWINDI EXPERIENCE WITH MANAGEMENT EFFECTIVENESS ASSESSMENT ..... 7
4.1. Planning ................................................................................................................... 7
4.2. Assessments of management effectiveness in BINP using the activity 'carry outlaw-enforcement patrols' as an example........... ......... ......... ......... ......... ......... ......... .. 8
4.3. Information provided by MIST not covered in the above example.............. .............. . 9
4.4. Problems with the effective use of MIST in Bwindi Impenetrable National Park ...... 10
5. CONCLUSION ................................................................................................................... 11
6. LITERATURE.....................................................................................................................13
Annex ........................................................................................................................................ 14
List of figures
Fig. 1: The management cycle..................................................................................................... 4Fig. 2: Location of Bwindi Impenetrable National Park .......... ........... ........... ........... ........... .......... . 7
Fig. 3: Hierarchy of planning in Uganda Wildlife Authority ........... ............ ........... ............ ........... ... 7Fig. 4: Screen shot from the MIST Annual Operations Planning module ............ ............. ............. 8Fig. 5: Report generator for mammal reports and maps........... ........... ............ ........... ........... ....... 8
Fig. 6: Data and information flow and database replication at protected area and national/regional level................................................................................................................... 12

8/8/2019 _stream Outputs_session 2b-3b Learning From Experience_Klaus Schmitt
http://slidepdf.com/reader/full/stream-outputssession-2b-3b-learning-from-experienceklaus-schmitt 3/16
2
1. SUMMARY
This report presents an example of how quantitative assessment of management effectiveness isperformed in Uganda using a spatial Management Information S ys tem (MIST).
MIST was developed as part of the GTZ project ‘Advisory Services to Uganda Wildlife Authority’
(1997-2002) and is currently used in Uganda and Cambodia. It is a tool which converts data frominternal and external sources into information and communicates this information, in anappropriate form, to managers at all levels to enable them to make timely and effective decisionsfor planning, directing/implementing and evaluating the activities for which they are responsible.The information enables managers to assess the effectiveness of their management.
MIST comprises a user-friendly computer programme and associated data collection procedures.It consists of a Structured Query Language (SQL) database (InterBase), application processinglibraries, a graphical user-interface programmed in Delphi and spatial display (ArcObjects).
Important aspects taken into consideration during the development of MIST were technicalfactors (data collection procedures, programming, database design, easy use and easymaintenance and customisability of MIST), the organisational set-up of Uganda Wildlife Authority(UWA) and behavioural principles (the human dimension of information management). Thetechnical aspects have been addressed successfully and MIST has been used in BwindiImpenetrable National Park since November 1999.
The data collection component of MIST, which has been designed to be simple and fast, and toprovide data which can be processed into information which is relevant and useful for managers,focuses on protected areas. MIST can be tailor-made to reflect differences in issues, objectives,and threats at local level and different protected area categories due to the easy customisabilityof the programme. Because of the design of the database and the database replication moduleMIST becomes a tool for use at national or regional (trans boundary) level once data from theprotected areas are replicated to a central MIST database.
The key issue for the successful and sustainable introduction of efficient quantitative informationmanagement is the human dimension. Opposition to new developments such as the use of MISTand quantitative information to plan, make decisions and to evaluate is inevitable, but will beovercome once managers realise that by using MIST they can do their work more efficiently andeffectively. A quantitative system can only succeed if all users, particularly senior management,accept such a system and want the transparency that comes with it.

8/8/2019 _stream Outputs_session 2b-3b Learning From Experience_Klaus Schmitt
http://slidepdf.com/reader/full/stream-outputssession-2b-3b-learning-from-experienceklaus-schmitt 4/16
3
2. INTRODUCTION
Effective management means producing planned results. Assessment of managementeffectiveness is about evaluating how well Protected Area Management carries out actionsnecessary to fulfil the protected area's objectives.
Hockings (2000) gives a comprehensive review of 31 methodologies for the assessment of management effectiveness. Most of them use subjective scoring by individuals and are thusqualitative in nature, depending on the knowledge base and integrity of the people who carry outthe assessment.
This report presents an example of how quantitative assessment of management effectiveness isperformed in Uganda.
Requirements for a quantitative assessment of management effectiveness are:
• data 1 which can be processed into information which is relevant and useful for managers• information which can be used to plan, make informed decisions and to evaluate to what
extent the planned results have been achieved• plans which set quantitative targets and define indicators• a tool to provide information for planning, decision-making (implementation) and evaluation
A tool which can do this is an information system which converts data from internal and externalsources into information and communicates this information, in an appropriate form, to managersat all levels to enable them to make timely and effective decisions for planning, directing/implementing and evaluating the activities for which they are responsible.
A spatial Management Information S ys tem (MIST) was developed as part of the GTZ 2 project‘Advisory Services to Uganda Wildlife Authority’ (1997-2002). MIST is currently used in nineprotected areas in Uganda, in Uganda Wildlife Authority Headquarters and also in one protectedarea in Cambodia.
The following text gives an introduction to MIST and describes experiences with the use of MISTand the assessment of management effectiveness in Bwindi Impenetrable National Park inUganda.
1 The terms data and information are often used interchangeably. However, in the context of information
management they have clearly distinct meanings: data are facts which have been recorded andinformation is processed data.
2 German Technical Cooperation (Deutsche Gesellschaft für Technische Zusammenarbeit).
8/8/2019 _stream Outputs_session 2b-3b Learning From Experience_Klaus Schmitt
http://slidepdf.com/reader/full/stream-outputssession-2b-3b-learning-from-experienceklaus-schmitt 5/16
4
3. A BRIEF OVERVIEW OF MIST
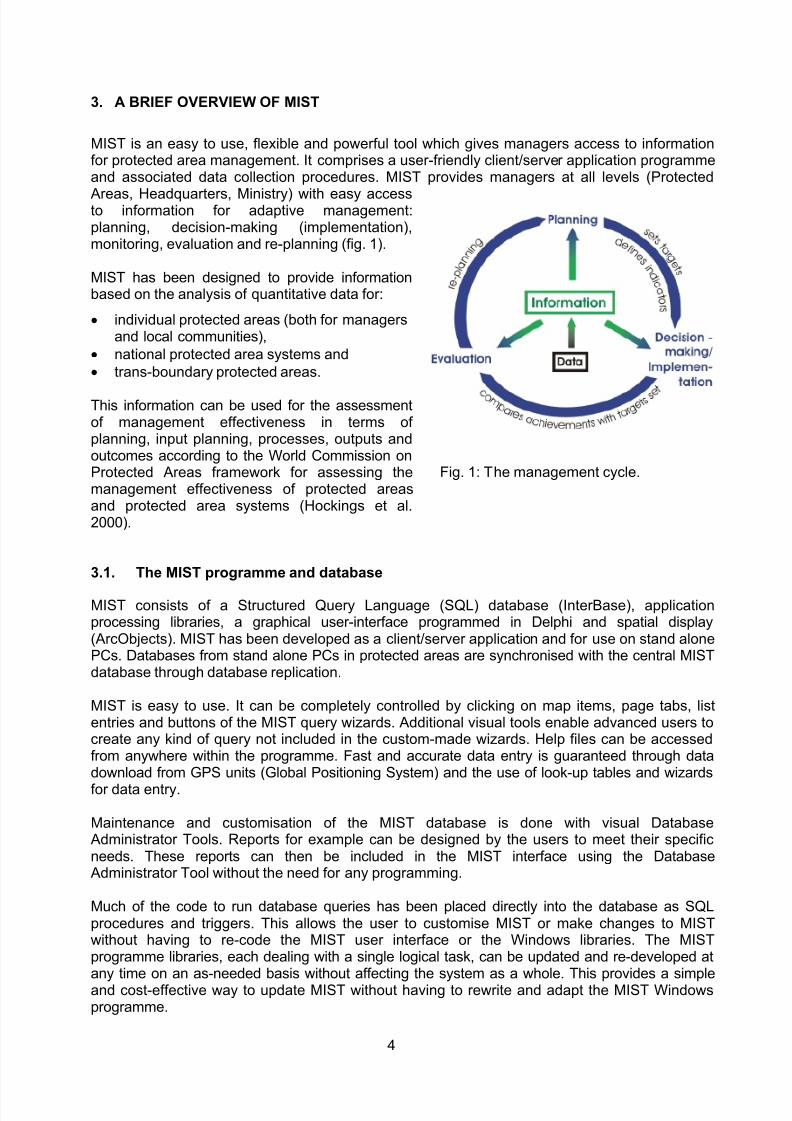
MIST is an easy to use, flexible and powerful tool which gives managers access to informationfor protected area management. It comprises a user-friendly client/server application programmeand associated data collection procedures. MIST provides managers at all levels (Protected
Areas, Headquarters, Ministry) with easy accessto information for adaptive management:planning, decision-making (implementation),monitoring, evaluation and re-planning (fig. 1).
MIST has been designed to provide informationbased on the analysis of quantitative data for:
• individual protected areas (both for managersand local communities),
• national protected area systems and• trans-boundary protected areas.
This information can be used for the assessmentof management effectiveness in terms of planning, input planning, processes, outputs andoutcomes according to the World Commission onProtected Areas framework for assessing themanagement effectiveness of protected areasand protected area systems (Hockings et al.2000).
3.1. The MIST programme and database
MIST consists of a Structured Query Language (SQL) database (InterBase), applicationprocessing libraries, a graphical user-interface programmed in Delphi and spatial display(ArcObjects). MIST has been developed as a client/server application and for use on stand alonePCs. Databases from stand alone PCs in protected areas are synchronised with the central MISTdatabase through database replication.
MIST is easy to use. It can be completely controlled by clicking on map items, page tabs, listentries and buttons of the MIST query wizards. Additional visual tools enable advanced users tocreate any kind of query not included in the custom-made wizards. Help files can be accessedfrom anywhere within the programme. Fast and accurate data entry is guaranteed through datadownload from GPS units (Global Positioning System) and the use of look-up tables and wizardsfor data entry.
Maintenance and customisation of the MIST database is done with visual DatabaseAdministrator Tools. Reports for example can be designed by the users to meet their specificneeds. These reports can then be included in the MIST interface using the DatabaseAdministrator Tool without the need for any programming.
Much of the code to run database queries has been placed directly into the database as SQLprocedures and triggers. This allows the user to customise MIST or make changes to MISTwithout having to re-code the MIST user interface or the Windows libraries. The MISTprogramme libraries, each dealing with a single logical task, can be updated and re-developed atany time on an as-needed basis without affecting the system as a whole. This provides a simpleand cost-effective way to update MIST without having to rewrite and adapt the MIST Windowsprogramme.
Fig. 1: The management cycle.

8/8/2019 _stream Outputs_session 2b-3b Learning From Experience_Klaus Schmitt
http://slidepdf.com/reader/full/stream-outputssession-2b-3b-learning-from-experienceklaus-schmitt 6/16
5
3.2. Design of data collection
The information needs of protected area managers determine what data are collected, themethods of analysis and the types of outputs. Only data which can be processed into informationwhich is relevant and useful for managers are collected, stored and processed in MIST. Datacollection has been designed to be simple and fast, to minimise data collection mistakes and toprovide raw data for a wide range of outputs. All spatial data collected are geo-referenced usingGPS units.
Data processed in MIST include:• spatial data on patrols, ecology and illegal activities• resource use and visitor data• staff and salary data• data from annual operations planning (activities, budget, expenses and the evaluation of the
implementation status of activities)
3.3. Monitoring
MIST processes systematically and opportunistically collected data for monitoring. An example of a systematic monitoring programme are wildlife counts from the air using systematicreconnaissance flights (Norton-Griffiths 1978). Opportunistically collected data by rangers andlocal communities are also analysed in MIST.
Indices are used for monitoring based on the analysis of opportunistically collected data. Indicesprovide measures of relative density and are calculated in MIST for monitoring of wildlifepopulations, illegal activities and resource harvest by local communities without the need for expensive baseline data (Caughley and Sinclair 1994).
Ranger patrols record opportunistic observations on key wildlife species and on illegal activities.All data collected is geo-referenced using GPS units and recordings are taken at least every 30minutes. This enables calculation of the distance covered by each patrol with reasonableaccuracy 3. In time, the opportunistic nature of ranger-based data collection will resemble randomsampling, and thus can be used for monitoring, if the bias in spatial distribution is low and thenumber of kilometres patrolled high. To achieve this each protected area needs to be stratifiedinto management sectors which are similar in terms of patrol intensity. Indices such as elephantsseen per kilometre patrolled and snares collected per kilometre patrolled are then calculated for these management sectors and can be used to monitor trends.
Non-geo-referenced data collected by local communities are used to monitor resource use. Twoindices are required to monitor the impact of the harvest on the resource base. (1) the amount of resources harvested (e.g. headloads/month, handful/week) and (2) the effort required for theharvest of a defined quantity (e.g. hours/headload). If the amount harvested per month remainsmore or less constant over time one might conclude that the harvest has no negative impact onthe resource and that there is enough regeneration to sustainably support the current harvestvolume. This is only the case if the effort required for the harvest of a defined quantity remainsthe same.
3 Under dense canopy patrols may not get a GPS waypoint reading for each observation. In such a case
patrols need to record the time at the observation and take a waypoint afterwards as soon as theopenness of canopy allows it. After downloading the waypoints, MIST will calculate the position for observations without GPS readings based on the time elapsed between two waypoints.

8/8/2019 _stream Outputs_session 2b-3b Learning From Experience_Klaus Schmitt
http://slidepdf.com/reader/full/stream-outputssession-2b-3b-learning-from-experienceklaus-schmitt 7/16
6
3.4. MIST programme design and sustainability
Important issues for the design of the MIST database were:• data integrity (which refers to maintaining the correctness and consistency of the data),• data independence (the data stored in a database are independent of the programme which
uses them) and• flexibility (it must be possible to access data in many different ways and for many different
purposes).
Flexibility and sustainability were also key issues for the design of the MIST programme. Thedevelopment of MIST as a programme which is not dependent on a highly trained GIS expert,which is easy to use, maintain and customise, and which provides different levels of access for users, contributes to the sustainability of MIST.
3.5. Institutional set-up and knowledge management
In Uganda Wildlife Authority, MIST has been placed in an Information Management Unit (IMU)which reports directly to the Executive Director. This guarantees access for all users, horizontalinformation flow, and data integrity.
The IMU’s function is to create an information network linking the departments of UWAHeadquarters and the protected areas. The role of MIST is: (1) to serve as an UWA in-housedecision-support tool, (2) to provide information for planning and evaluation, (3) to act as acentral data depository for incoming multi-sectoral data, and (4) to provide data and informationto other institutions.
Knowledge management is the broad process of locating, organising, transferring and using theinformation and expertise within an organisation. It is about (1) capturing and storing knowledgein an accessible way and about (2) joining up people to enable knowledge flow/exchange acrossthe organisation. The latter can only be achieved if a culture of knowledge exchange isestablished as a core value of the organisation; only then can personal knowledge becommunicated.
MIST contributes to institutionalising information and knowledge management in Uganda WildlifeAuthority through capturing and storing information and knowledge in an accessible way (MISTdatabase, meta-database, and documents and manuals kept in the digital archives), and by
joining up people to enable knowledge to exchange across the organisation.
Summary• The information needs of protected area managers determine what data are collected, the
methods of analysis and the types of outputs;• Data collection must be simple, fast and provide data which can be processed into
information which is relevant and useful for managers;• Indices are used for monitoring when analysing opportunistically collected data;• Easy use, maintenance and customisability contribute to the sustainability of MIST;• MIST contributes to institutionalising information and knowledge management;• MIST has been designed for use in protected areas, at national and trans-boundary levels.

8/8/2019 _stream Outputs_session 2b-3b Learning From Experience_Klaus Schmitt
http://slidepdf.com/reader/full/stream-outputssession-2b-3b-learning-from-experienceklaus-schmitt 8/16
7
4. THE BWINDI EXPERIENCE WITH MANAGEMENT EFFECTIVENESS ASSESSMENT
Bwindi Impenetrable National Park(BINP) is located in south west Uganda,(fig. 2) covering an area of 327 km² of
tropical rain forest with an altitudinalrange of 1,160 - 2,600 m. Bwindi hashigh floral and faunal biodiversity. Morethan half of the world's total populationof about 670 mountain gorillas is foundin BINP. Bwindi Impenetrable NationalPark was declared a World Heritage Sitein 1994.
Fig. 2: Location of Bwindi ImpenetrableNational Park.
4.1. Planning
Protected Area Management Plans andAnnual Operations Plans (AOPs) arewritten within the framework set by theUganda Wildlife Authority Strategic Plan.The relationship between the differentlevels of planning is shown in figure 3.
Based on the Protected Area GeneralManagement Plan, detailed AnnualOperations Plans are developed. Theseplans describe activities and who isresponsible for their implementation, settargets, define indicators, and elaboratethe budget.
An Annual Operations Planning modulefor MIST has been developed to assistPA managers with their annual planningand evaluation 4. The MIST AOP moduleprovides data entry fields and wizards for detailed descriptions of activities,budgets, milestones and indicators andfor evaluation.
4 There is little point in planning if progress after implementation is not monitored and evaluated.
Evaluation examines implementation of the plan. Evaluation must be based on clearly definedperformance measures (indicators) which describe quality, quantity, place and time, and not just onintuition, impressions or casual observations.
Fig. 3: Hierarchy of planning in Uganda WildlifeAuthority.
-0 100 km

8/8/2019 _stream Outputs_session 2b-3b Learning From Experience_Klaus Schmitt
http://slidepdf.com/reader/full/stream-outputssession-2b-3b-learning-from-experienceklaus-schmitt 9/16
8
Figure 4 shows a screen shot fromthe MIST AOP module which showsdetails of the activity 'carry out law-enforcement patrols', the indicatorsand means of verification. Differentwindows are used to enter thebudget and the evaluation codes.For more details see Schmitt andSallee (2002).
Fig. 4: Screen shot from the MISTAnnual Operations Planningmodule.
4.2. Assessments of management effectiveness in BINP using the activity 'carry outlaw-enforcement patrols' as an example
Data on ecology and illegal activities collected by ranger patrols are downloaded from the GPSunits and entered regularly into the MIST database at Bwindi Impenetrable National Parkheadquarters. Cost for food rations and fuel used for patrol deployment are also entered atBwindi. Salary data are part of the staff database in MIST which is synchronised throughdatabase replication with the payroll database in UWA Headquarters.
At the beginning of every month the warden responsible for MIST can then produce reports andmaps on mouse click. An example of a report wizard for mammal reports where the user onlyneeds to select the time period 5, whether or not a map should be included in the report and clickon the Report button, is shown in figure 5.
Standard reports and maps produced monthly from datacollected by ranger patrols:
• Patrol and ranger performance report : This reportwas designed to provide the information necessary toassess two of the indicators shown in figure 4:number of patrol days and costs/km patrolled. Other
information contained in this report can be used for staff performance assessments, planning etc. Anexample of a patrol and ranger performance report isshown in the annex.
• Patrol coverage map : This map shows areaspatrolled in grid cells and percentage park areapatrolled. The grid cell size can be defined by theuser. The standard size used in UWA is 1 km². Anexample of a patrol coverage map is shown in theannex.
5 Other sources of data for reports which can be selected from the report generator are: air patrols,research data and occasional observations.
Fig. 5: Report generator for mam-mal reports and maps

8/8/2019 _stream Outputs_session 2b-3b Learning From Experience_Klaus Schmitt
http://slidepdf.com/reader/full/stream-outputssession-2b-3b-learning-from-experienceklaus-schmitt 10/16
9
• Illegal activities report and distribution map : The report provides indices and numbersand the map shows the spatial distribution of illegal activities. The example shown in theannex provides the information necessary to assess the indicator shown in figure 4(decrease in pitsaws/km).
• Key wildlife species report and distribution map : The report provides indices and
numbers6
and the map shows the spatial distribution of key wildlife species.
The regular (monthly) dissemination of quantitative information and indices shows managers theeffects of their decision-making and enables them to carry out adaptive management. Theinformation enables managers to show whether the inputs provided in terms of man-power,equipment and finances are adequate to achieve the targets set. Managers can then adapt thetargets set for, or inputs to, specific activities. Reports, charts and maps produced with MIST helpmanagers to meet their reporting requirements. They show what has been done, and documentachievements and outcomes.
Information provided by MIST can be used for short-term planning. An example is the patroldeployment planning 7 based on areas patrolled, information about spatial and temporal patternsin the distribution of illegal activities and key wildlife species and on intelligence information.
4.3. Information provided by MIST not covered in the above example
Monitoring of behaviour and health of habituated gorilla groups is carried out in BwindiImpenetrable National Park in a programme developed by the International Gorilla ConservationProgramme. A gorilla database with data about individual gorillas has been added to MIST inBINP and the behaviour and health monitoring data are entered as part of the patrol datadownload/entry.
MIST has the option to enter data collected as part of the MIKE 8 programme and produce thereporting required by MIKE on button click.
MIST provides a module to monitor the sustainability of resource use by local communities atparish level and for the entire protected area. The data collected by local communities can alsobe used to assess whether harvesting is being done according to harvest quota set in theMemorandum of Understanding between the communities and the park, and to calculate themonetary value of the resources harvested by local communities.
The visitor statistics module in MIST stores data for a wide range of analyses. The data includenumbers, nationality and resident status of visitors, length and type of visit, and entrance feescollected.
The AOP module is used for planning as described in section 4.1 above and also for budgetcontrol (comparison of expenses with budget planned per budget line) on mouse click. Thismodule also provides managers with a comprehensive report which shows for each activity theimplementation status and budget and expenses (activity based costing) for each quarter of thefinancial year. An example is given in the annex.
6 In protected areas with open vegetation, whenever possible, patrols also record the number of young andadult male and female. These data are used to get information about population status – sex ratio,percentage of young and group size.7
In Murchison Falls Conservation Area (Uganda) MIST is used to develop 2-weekly patrol operation plans.8 MIKE (Monitoring Illegal Killing of Elephants) is a programme under CITES, the Convention onInternational Trade in Endangered Species of Wild Fauna and Flora.

8/8/2019 _stream Outputs_session 2b-3b Learning From Experience_Klaus Schmitt
http://slidepdf.com/reader/full/stream-outputssession-2b-3b-learning-from-experienceklaus-schmitt 11/16
10
Spatial data from external sources which are stored in MIST as shape files and their attributedata (socio-economy, vegetation, elevation etc.) together with the above listed data stored in theMIST database provide base-line data for future park management planning.
4.4. Problems with the effective use of MIST in Bwindi Impenetrable National Park
Important aspects taken into consideration during the development of MIST were technicalfactors, the organisational set-up of UWA and behavioural principles (the human dimension of information management). The technical aspects (data collection procedures, programming,easy use and easy maintenance and customisability of MIST) have been addressed successfullyand MIST has been used for planning and decision-making in Bwindi Impenetrable National Parksince November 1999. Procedures for data collection, entry and analysis and training manualsare in place and staff in BINP have been trained in data collection and the use and maintenanceof MIST.
Despite this there are still problems which need to be addressed to ensure the effective use of the information system. Unreliable power supply at BINP Park Headquarters severely impacts on
the effective use of the computers. BINP will address this problem through the installation of solar panels and sufficient backup power capacity. Furthermore UWA will install a back-upgenerator for its headquarters in Kampala to avoid future computer problems caused byfluctuations in power supply.
MIST has been set up in an Information Management Unit (IMU) to enable efficient and effectiveinformation and knowledge management and to enable knowledge exchange across theorganisation. IMU staff has been trained to maintain the central database and to providetechnical support to protected areas. However, technical support to MIST users in BINP is stillinsufficient. UWA senior management must ensure that the Information Management Unitprovides timely and appropriate technical support to field staff and that IMU carries out regular maintenance of all databases.
Summary
• The MIST AOP module is used to plan annual activities, indicators and budgets and toevaluate implementation of activities, for budget control and activity based costing.
• Regular data download and data entry into the various modules of MIST providesmanagers with a wide range of quantitative information (1) to assess whether the targetsset have been achieved, (2) for adaptive management, (3) for reporting on achievementsand outcomes, (4) for input planning and (5) for the development of management plans.
• The information provided by MIST on mouse click includes:− patrol and ranger performance indicators and patrol coverage maps,− wildlife distribution maps, indices on species abundance, information on population
structure, information about systematic monitoring programmes such as gorillabehaviour and health,
− distribution maps of illegal activities and indices to monitor trends in illegal activities,− indices on resource use by local communities and monetary value of resources
harvested,− visitor statistics,− activities planned and their implementation status,− budget control, and activity based costing.

8/8/2019 _stream Outputs_session 2b-3b Learning From Experience_Klaus Schmitt
http://slidepdf.com/reader/full/stream-outputssession-2b-3b-learning-from-experienceklaus-schmitt 12/16
11
The efficient use of MIST in BINP is further hampered by gaps in data collection and entry. This,and the insufficient technical support, are related to the human dimension of informationmanagement. To address the problems with data collection and entry, management of BINP willput in place incentives to ensure consistent data collection, and timely data entry and processing.Refresher training in data collection and the use and maintenance of MIST will be provided byUWA Headquarters. Regular feed-back to rangers on how the data they collect are being usedfor park management will contribute to improving staff motivation.
Opposition to new developments and institutional changes are inevitable. An example of this isthe introduction of GPS units for use by ranger patrols in UWA in 1997. The initial opposition wasovercome once staff realised that the GPS was not just there to control them, but to get usefulinformation for protected area management, and once the usefulness of spatial data becameobvious to managers. Nowadays GPS units are standard patrol equipment. The same willhappen to initial opposition to the efficient use of MIST in BINP.
5. CONCLUSION
The technical aspects and organisational set-up for information management have beenaddressed successfully during the development of MIST. The key issue for the successful andsustainable introduction of efficient information management is the human dimension. MIST usesquantitative information for planning, decision-making, monitoring, evaluation and theassessment of management effectiveness and can only succeed if all users, particularly senior management, accept such a system and want the transparency that comes with it.
Activity-based evaluation based on quantitative information, rather than qualitative perception by
individuals, using an Information System such as MIST, should be used whenever possible.However, establishment of an Information System and the collection of data requires time andresources. It is therefore important to choose the appropriate assessment tool/methodologydepending on objectives, the time frame and the situation on the ground in terms of availability of data, finances etc.
MIST is a tool for managers for planning, decision-making, monitoring and evaluation at local,national and regional levels. The data collection component of MIST focuses on protected areas.MIST can be tailor-made to reflect differences in issues, objectives, and threats at local level anddifferent protected area categories due to the easy customisability of the programme 9. Becauseof the design of the database and the database replication module MIST becomes a tool for use
9 MIST has been modified according to the needs of the management of Virachey National Park inCambodia and successfully introduced in the park.
Summary• Technical issues concerning the development and sustainable use of MIST have been
addressed successfully.• The role of UWA's Information Management Unit is to provide timely, appropriate and
consistent support to all MIST users.• Field staff need to be motivated and incentives put in place to ensure consistent data
collection, timely data entry and processing.• Opposition to new developments such as the use of MIST and quantitative information to
plan, make decisions and to evaluate is inevitable, but will be overcome once managersrealise that by using MIST they can do their work more efficiently and effectively.

8/8/2019 _stream Outputs_session 2b-3b Learning From Experience_Klaus Schmitt
http://slidepdf.com/reader/full/stream-outputssession-2b-3b-learning-from-experienceklaus-schmitt 13/16
12
at national/regional (trans boundary) level once data from the protected areas are replicated tothe central MIST database. The data and information flow at protected area level, the link to thenational/regional level through database replication and the information flow at national/regionallevel is shown in figure 6.
Fig. 6: Data and information flow and database replication at protected area and national/regional level.
effects of actions on real world
database replication
e f f e c
t s o
f a c
t i o n s
o n r e a
l w o r l d
Datacapture
Data entry,data
downloadMIST PAdatabase
Information User
Decisions,actions
MIST Centraldatabase
Information
User
User process,understanding
Decisions,actions
Meta database
User's memory,knowledge base
Other inputs:informalinformation system,training, etc.
Other inputs:external data,documents,manuals, etc.
Knowledgeexchange
P A l e v e
l
N a
t i o n a
l a n
d r e g
i o n a
l l e v e
laccess dissemination

8/8/2019 _stream Outputs_session 2b-3b Learning From Experience_Klaus Schmitt
http://slidepdf.com/reader/full/stream-outputssession-2b-3b-learning-from-experienceklaus-schmitt 14/16
13
6. LITERATURE
Caughley, G. and Sinclair, A.R.E. 1994: Wildlife ecology and management. - Blackwell ScientificPublications.
Hockings, M. 2000: Evaluating protected area management: a review of systems for assessingmanagement effectiveness of protected areas. – The University of Queensland. School of Natural an Rural Systems Management. Occasional Paper 7(3).
Hockings, M., Stolton, S. and Dudley, N. 2000: Evaluating effectiveness: a framework for assessing the management of protected areas. IUCN, Gland, Switzerland and Cambridge,UK. 121 pp.
Norton-Griffiths, M. 1978: Counting animals. - 2 nd revised edition. African Wildlife Foundation,Nairobi, Kenya.
Schmitt, K and Sallee, K. 2002: Information and Knowledge Management in Nature Conservation- Supporting Planning, Decision-making, Monitoring and Evaluation in WildlifeManagement in Uganda with a Spatial Management Information System (MIST). – GTZ,UWA. 33 pp.
Information
MIST is an open source programme, distributed free of charge for non-commercial use.
Further information can be obtained from:
GTZ, Karin von Loebenstein, Postfach 5180, 65726 Eschborn, GermanyE-mail: [email protected]
A demo version of the MIST programme and an interactive demo about the use of MIST canbe ordered, and a report about MIST in pdf format and MIST files can be downloaded from:http://www.ecostats.com/software/mist/mist.htm
Programme development: Ecological Software Solutions ([email protected]) andKlaus Schmitt ([email protected]).

8/8/2019 _stream Outputs_session 2b-3b Learning From Experience_Klaus Schmitt
http://slidepdf.com/reader/full/stream-outputssession-2b-3b-learning-from-experienceklaus-schmitt 15/16
14
Annex – Examples of print outs produced with the MIST modules GIS and AOP
Patrol and ranger performance report BINP, May 2001.
Map showing patrol paths and patrolled Map showing all gorilla sightings betweenareas in 1km² grid cells, BINP, May 2001. November 1999 and June 2001, BINP.

8/8/2019 _stream Outputs_session 2b-3b Learning From Experience_Klaus Schmitt
http://slidepdf.com/reader/full/stream-outputssession-2b-3b-learning-from-experienceklaus-schmitt 16/16
15
Report about number and indices of illegal activities and distribution map, BINP, May 2001.
Quarterly report showing for each activity: the budget, expense (current quarter and cumulative),percentage of budget spent, implementation status for each quarter and explanatory remarks.
The codes used for the implementation status are: A - no deviation from the plan, B - deviationfrom plan but no need for corrective action, and C - deviation from plan and need for correctiveaction.