stream sediment survey of an area around madagali ... · stream sediment survey of an area around...
TRANSCRIPT

Researcher 2015;7(10) http://www.sciencepub.net/researcher
56
Stream Sediment Survey of an Area around Madagali, Northeastern Nigeria
H.A. Ahmed1, 2, Kabir Shola Ahmed1 and Mohammed Jamilu2
1China University of Geosciences, Wuhan 430074, China
2MAUTECH, Yola, Nigeria
* Corresponding Author: [email protected]
Abstract: Geochemical (Stream Sediment) survey around Madagali was carried out in order to delineate areas of
potential mineralization. The geology of the study area is predominantly Pan-African granites (750Ma-450Ma). 13
stream sediments samples were collected and analyzed for 19 elements using x-ray fluorescence (XRF). Results of 9
trace elements namely Ba, Zr, Co, Ag , Hg, Cd, Pb, Mo and Ni have concentrations well above the average
Universal Crustal Abundance (AUCA), and were subjected to statistical treatment. Pearson correlation coefficients
show that significant correlation exists among Cu, Cr, Zn, Co and between Rb, Ni and Mn. Geochemical maps of
these elements are plotted. The dispersion train indicates anomalous concentration of Ba, Co, Ag ,Hg, Cd, Pb, Mo
and Ni suggesting that the area is favourable for mineralization.
[H.A. Ahmed, Kabir Shola Ahmed and Mohammed Jamilu. Stream Sediment Survey Of An Area Around
Madagali, Northeastern Nigeria. Researcher 2015;7(10):56-69]. (ISSN: 1553-9865).
http://www.sciencepub.net/researcher. 8
Keywords: Stream sediment survey, Geochemical map, Madagali and Mineralization
1.0 Introduction
The use of stream sediment geochemistry in
prospecting for ore deposits has been successfully
employed in many parts of the world. However, with
many significant metallogenic belts in Nigeria, the pace
for their exploration and exploitation is negligible.
Stream sediment geochemical methods for prospecting
of ore deposits are not being properly applied in Nigeria.
The Basement Complex in the NW, SW and SE has
been fairly studied by many workers such as
Garba, 1987. Adepoju and Adekoya, 2008, Haruna et al,
2008, Roger et al, 2012 among others. The northeast
(including this study area) Nigeria is the least studied
and has only received the attention of few workers such
as Haruna et al (2008) and Ahmed, (2012).
This paper describes a reconnaissance stream
sediment geochemical survey around Madagali. The
aim of this investigation is to establish the importance
of stream sediment geochemistry as an important tool in
delineating areas of potential mineralization in
northeastern Nigeria.
1.1 Location and Accessibility
The study area is situated in the northeastern part
of Nigeria between laitude 100511N and 100581N and
longitude 130361E and 130421E. The area is fairly
accessible especially in dry season. A federal road from
Maiduguri to Yola passes through the western side of
the main mountain range. Few secondary roads cross
the hills into the Cameroon (Fig 1). Other parts of the
hill are mainly accessible through footpaths.
1.2 Climate and Vegetation
Two main seasons (rain and dry) characterize the
climate of the area. The rainy season covers from May
to September with peak in August. Maximum
precipitation is about 700mm annually. The rain fall
mainly as short shower in the form of thunder storm,
which hardly last for more than three hours. The
effective precipitation is appreciably reduced by high
rate of evaporation. The dry season is longer, usually
lasting seven months (October to April). The
temperature variations are extreme (both annual and
diurnal). Coolest nights are experienced in December
and January when temperature less than 100c are
sometimes recorded.
1.3 Relief and Drainage
The Madagali hills form prominent parallel and
elongated topographic highs in the study area. The hills
stand about 180m above the general surroundings
which in turn about 420 meters above sea level. The
hills are dominant of granitic rocks while the flood
plains are underlain dominantly by metamorphic rocks.
The topography is generally undulating and dominated
by rugged Mandara hills which extend to Pulka in the
north to Gulak in the south and further down to Hong.
Drainage is poorly developed in the area and is
characterized by few seasonal streams with dendtritic
pattern which generally flows northward into Lake
Chad.

Researcher 2015;7(10) http://www.sciencepub.net/researcher
57
Fig. 1. Location Map of the Study Area
Fig. 2. Geologic Map of the Study Area
Researcher 2015;7(10) http://www.sciencepub.net/researcher
58
2.0 Geological setting
The area is part of Mandara Mountains which
together with the adjacent Hawal and Adamawa
Massifs form the northeastern basement complex of
Nigeria. The Nigerian basement Complex is broadly
divided into two provinces, the western province which
is characterized by Well-developed N-S trending
largely low-grade schist and the eastern province which
is made up mainly of migmatite-gneisses complex
(MGC) intruded by large volumes Pan-African
granitoids.
The study area is underlain mainly by granite and
pegmatite with minor quartzite. Outcrops are restricted
to the eastern part of the study area, as the western side
is characterized by pond and flood plains. Granites are
most dominant rock in the study area. They grade from
fine to medium to coarse and even porphyritic grains.
All the granites are similar in mineralogical
composition but vary in texture under visual
observation. The rocks of the study area are grouped
into granite, pegmatite and migmatite and they are
described in that order.
Under the microscope, the granite is characterized
by large grain quartz which shows pleochroism under
plain polarized light during the stage rotation.
Plagioclase was also identified which shows multiple
twinning and zoning under cross polarized due to
alteration. Quartz, feldspar and biotite constitute the
dominant minerals in hand specimen. Under
microscope, the feldspar is made up of microcline.
Quartz is the most abundant mineral as observed under
microscope. Microcline grains are characterized by
twinning while the biotite grain show interference
colour and extinction under cross polarized light.
Quartz shows an irregular, subhedral body which
occupies the space of plagioclase. Microcline and
plagioclase possesses randomly oriented euhedral
crystals. Muscovite interpenetrates the quartz and
feldspars, the cleavage is perfect and it maintains a
brownish to pinkish blue coloration.
The granite of the study area is characterized by
numerous faultzones which generally strike
approximately NE and jointing is more pronounced in
granite than any other rock type in the study area. In
most cases they are vertical to slightly dipping and
strike roughly NE-SW and NW-SE.
Bassey (2006) deduced the dominant N-S,
NNESSW and NW-SE structural trend in the NE
Nigeria and the northern Cameroon from field studies.
Generally, the basement complex rocks of the
northeastern Nigeria are the least studied and as
consequence very little discoveries of economic mineral
deposit are made. Most of the mineral exploited are
industrial which include feldspars, quartz, clays and
some gem minerals. Islam and Baba (1990) reported the
occurrence of manganese ore hosted by pegmatite in
Gwoza area, some few kilometers away from the study
area. Baba et al (1991) also reported the occurrence of
sulphide as dissemination within the older granite of
Mandara Mountains.
The element concentration within the area will
vary upon the geologic processes, tectonic events and
original composition of weathered, eroded and
deposited materials. Therefore it is not unusual to find
certain portion in the study area with high concentration
of element of economic importance.
One of the most important applications of such
database would be in indicating areas where there are
potentials of trace element enrichment and distribution
and hence detailed exploration for mineral deposits
exploration to be targeted, through the stream sediments,
rock types, structures and field relation.
Through stream geochemical survey of the study
area, it is expected that the mineral resources potential
will be delineated. Result will also be useful in
environmental studies, especially the adverse effect of
toxic element on the environment and human health.
3.0 Sampling and Analytical Methods
During the survey, samples collected were mainly
stream sediments along confluence points of tributaries
and at intervals along the stream; this is to give a better
representation of the sediments. At least 1Kg of stream
sediments were collected at thirteen (13) different
locations of the tributaries and the main stream
channels, along the entire network of the study area.
Most samples collected, were wet samples and
few dried once. The wet samples were sun dried for
about 24 hours. Large grains (pebbles) were handpicked
from the samples. Samples were sieved to obtain finer
grain sizes for laboratory analysis.
The sieves were regularly cleaned and dried after
sieving sample. This is to avoid the contamination of
each sample, with the other. Each sieved sample was
well packaged in a polythene bag and properly labeled,
weighted and sent to the department of Geology, Kano
University for Science and Technology, Wudil for
geochemical analysis.
The technique employed in determination of
element in samples was by x-ray fluorescence
spectrometry (XRF).
Thirteen (13) stream sediments samples were
analyzed, for the following elements; K, Ca, Ti, Cr, Mn,
Fe, Co, Ni, Zn, Rb, Cu, Sr, Zr, Ag, Cd, Ba, Hg, Pb, Mo.
The analysis was done at Kano State University, Wudil.
Samples were prepared by milling to less than 40µm,
and then 500mg per sample. The samples were mixed

Researcher 2015;7(10) http://www.sciencepub.net/researcher
59
with 2.5g lithium metaborate and 12.5mg lithium
bromide and fused at 12000c for 10 minutes. For
samples with loss on ignition (LOL), they were
determined by heating to 10300 c for 10 minutes. For
samples with a LOL greater than 20%, 1.25g lithium
metaborate and 1.2g lithium tetraborate were used. The
samples were mixed well and transferred to 25 ml
calibration flask, then diluted to 25 ml with 4% boric
acid to dissolve CaF2 precipitate and remove HF acid.
Pipet an aliquot of 5µl quartz carrier and dry it under
infrared lamp or vacuum.
3.1 Exploration History
There has been limited published work in Nigeria
on exploration geochemistry, especially in Northeastern
part of the country. No stream sediments study in this
area has been published so far to the best of our
knowledge.
4.0 Results
The result obtained from geochemical analysis is
shown in table 1 and was subjected to statistical
analysis. SPSS was used for the statistical analysis and
excel was used for designation of geochemical map.
Table 2 shows the statistical data of trace elements
within the study area indicating their mean, standard
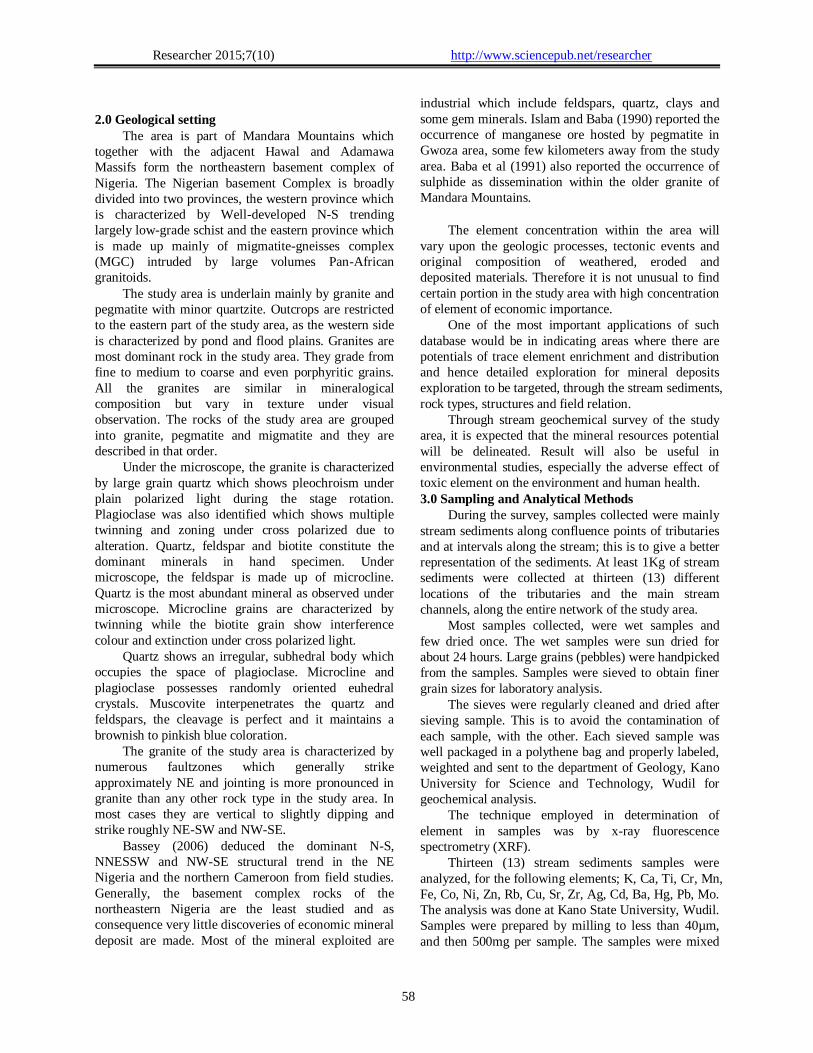
deviation and threshold values. Pearson correlation
analysis was also done on the set of data to study inter
element relationships. The results are expressed for
each pair of elements as Pearson correlation coefficient
and level of significance of 0.05. According to Adams
et al (2001), samples showing R˃0.7 are considered to
be strongly correlated, whereas R˃0.5-0.7 shows
moderate correlation at significant level of 0.05. The
mean, standard deviation coefficient of variation and
threshold values were computed, using appropriate
formulas. Concentrations of trace elements in the study
area were compared to Average Crustal Abundance
(Table 3) to be able to pinpoint areas of potential
mineralization.
Table 1. Geochemical result of samples from the study area. Analyze
symbol K Ca Ti Cr Mn Fe Co Ni Cu Zn Rb Sr Zr Ag Cd Ba Hg Pb Mo
Unit Symbol % ppm ppm ppm ppm Ppm ppm ppm ppm ppm ppm ppm ppm ppm ppm ppm ppm ppm ppm Station
SSG1 2.77 6426 1165 23 95 5330 81 64 - 21 98 508 106 28 27 583 10 26 - SSG2 3.51 5823 1338 - 114 6304 - 97 - 23 117 492 586 40 28 601 15 81 - SSG3 2.73 5579 2808 27 133 5884 138 - - 25 101 473 335 21 - 587 - 28 9 SSG4 3.42 9712 1705 45 229 220.5 527 60 82 39 110 539 725 48 33 696 14 34 - SSG5 365 5870 1090 29 114 8194 188 90 46 34 107 488 540 36 34 704 - 31 - SSG6 3.46 6169 1307 33 104 9892 227 105 42 52 114 440 283 38 35 578 10 31 - SSG7 3.05 7332 2007 32 163 259.3 268 67 31 41 105 490 485 32 36 599 - 29 - SSG8 3.68 2292 1189 28 618 6022 92 95 32 36 123 195 269 40 32 561 - 27 - SSG9 3.24 6629 2100 32 205 136.9 199 97 61 34 119 398 275 28 35 548 - 28 - SSG10 3.61 5447 1615 37 195 9135 124 71 39 30 118 343 429 46 46 570 - 30 - SSG11 1.76 6137 1641 56 117 112.3 240 - 61 56 82 474 806 31 39 549 - 26 16 SSG12 3.60 3334 1566 56 371 78 171 90 - 37 143 320 392 32 - 584 - 33 - SSG13 2.93 6730 2527 36 222 202.7 321 55 106 60 113 364 3221 45 23 616 14 32 -
Table 2. Statistical data of trace element within the study area
95% Confidence Interval of the Difference
N Mean (BACKGROUND)
Std. Deviation
Covariance THRESHOLD Lower Upper
K 13 3.1854 .54365 0.296 4.230037 2.8569 3.5139
Ca 13 5967.69 1784.677 3185070 9397.0158 4889.22 7046.16
Ti 13 1696.77 532.238 283277.7 2719.4854 1375.14 2018.40
Cr 12 35.33 9.442 89.152 53.4134 29.33 41.33
Mn 13 210.92 142.922 20426.744 485.5534 124.56 297.29
Fe 13 3905.2785 3881.0115 24.007 11455.337 1644.7728 6335.3164
Co 12 210.50 123.962 15366.455 447.8682 131.74 289.26
Ni 11 81.00 17.743 314.80 91.2013 69.08 92.92
Zn 13 37.54 12.231 149.603 44.0569 30.15 44.93
Rb 13 111.54 14.403 207.436 119.2142 102.84 120.24
Sr 13 424.92 96.866 9383.077 476.5469 366.39 483.46
Zr 13 650.15 796.579 634538.6 1074.6818 168.79 1131.52
Ag 13 35.77 8.012 64.192 40.0391 30.93 40.61
Cd 11 33.45 6.186 38.273 37.0115 29.30 37.61

Researcher 2015;7(10) http://www.sciencepub.net/researcher
60
Ba 13 598.15 49.303 2430.808 624.4294 568.36 627.95
Hg 5 12.60 2.408 5.80 14.5267 9.61 15.59
Pb 13 29.69 2.594 6.731 31.0749 28.12 31.26
Mo 2 12.50 4.950 24.50 -31.97 56.97
Cu 9 55.56 25.026 626.278 71.2851 36.32 74.79
Table 3. Comparison of trace elements within the study area and Average Universal Crustal Abundance
Elements Average crustal abundance (ppm/%) Emsley, (2001) Mean Std. Deviation Threshold
K 2.6% 3.1854 .54365 4.230037
Ca 36,300ppm 5967.69 1784.677 9397.0158
Ti 5600ppm 1696.77 532.238 2719.4854
Cr 10ppm 35.33 9.442 53.4134
Mn 1000ppm 210.92 142.922 485.5534
Fe 50,000ppm 3905.2785 3881.0115 11455.337
Co 20ppm 210.50 123.962 447.8682
Ni 80ppm 81.00 17.743 91.2013
Zn 75ppm 37.54 12.231 44.0569
Rb 300ppm 111.54 14.403 119.2142
Sr 370ppm 424.92 96.866 476.5469
Zr 190ppm 650.15 796.579 1074.6818
Ag 0.070ppm 35.77 8.012 40.0391
Cd 0.11ppm 33.45 6.186 37.0115
Ba 500ppm 598.15 49.303 624.4294
Hg 0.05ppm 12.60 2.408 14.5267
Pb 14ppm 29.69 2.594 31.0749
Mo 1.5ppm 12.50 4.950
Cu 100ppm 55.56 25.026 71.2851
A B
Fig. 3. (A &B) Histograms of some Trace elemnts in the study Area (A=Nickel, B=Ba)

Researcher 2015;7(10) http://www.sciencepub.net/researcher
61
C D
E F
G H I
Fig. 3. Contd. (C-I) Histograms of some Trace elemnts in the study Area (C=Co, D=Pb, E=Ag, F=Hg, G=Mo,
H=Zr, I=Cd.
Researcher 2015;7(10) http://www.sciencepub.net/researcher
62
Table 4. Correlation of trace elements in the study area

Researcher 2015;7(10) http://www.sciencepub.net/researcher
63
Fig. 4. Nickel concentration of stream sediments samples in the study area
Fig. 5. Titanium concentration of stream sediments samples in the study
area

Researcher 2015;7(10) http://www.sciencepub.net/researcher
64
Fig. 6. Barium concentration of stream sediments samples in the study area
Fig. 7. Zircon concentration of stream sediments samples in the study area

Researcher 2015;7(10) http://www.sciencepub.net/researcher
65
Fig. 8. Manganese concentration of stream sediments samples in the study area
Fig. 9. Cobalt concentration of stream sediments samples in the study area

Researcher 2015;7(10) http://www.sciencepub.net/researcher
66
Fig. 10. Silver concentration of stream sediments samples in the study area
Fig. 11. Cadmium concentration of stream sediments samples in the study area

Researcher 2015;7(10) http://www.sciencepub.net/researcher
67
Fig. 12. Mercury concentration of stream sediments samples in the study area
Fig. 13. Lead concentration of stream sediments samples in the study area

Researcher 2015;7(10) http://www.sciencepub.net/researcher
68
Fig. 14. Molybdenum concentration of stream sediments samples in the study area
4.1 Discussion of Result
From the above geochemical data, elements could
said to be apparently anomalous with their values much
higher than the background values and average
universal crustal abundance as could be observed on
(Tables 2 and 3).
The element includes Titanium (Ti), Manganese
(Mn), Iron (Fe), Nickel (Ni), zinc (Zn), Zircon (Zr),
Silver (Ag), Cadmium (Cd), Barite (Ba), Lead (Pb),
Cobalt (Co) and Mercury (Hg). It could therefore be
stated that, these anomalous concentration are
significant and may be linked to mineralization. The
anomalous concentration of these elements also
suggests that they are indicator of their own
mineralization. No significant correlation is observed
amongst the trace elements to suggest similar source of
mineralization.
The concentration of Titanium (Ti) is also high at
this area compared to other anomalous values
elsewhere within the study area. The highest peak of
Titanium (Ti) where sample SSG 3, has 2808ppm while
SSG 13 is 2527ppm, SSG 9 is 2100ppm and 2007ppm
for (SSG7) but their concentration is less than the
average crustal abundance in the study area.
Zinc is anomalously concentrated in sample
(SSG13) where it occurs in association with significant
anomalous value of Pb. This may be termed as possible
Pb-Zn mineralization due to the disparity between the
background value of 12.4ppm (Emsley, 2001) and the
anomalous value of 34ppm of Pb in sample (SSG4).
The association of Ni, Zn and Mn might be an
indication of many oxide mineralizations.
Barium (Ba) is another most anomalous element
within the study area mostly concentrated around
Wagga Luggere (Fig. 6), Ba has a high anomaly in
sample SSG4 and SSG5 with value of 704ppm and
696ppm respectively (Table 1), which is much higher
than the average of crustal abundance. The enrichment
of Co might be associated with Ca in the area. Pearson
correlation indicates significant correlation of (0.801)
between the two elements indicating similar source of
mineralization.
Zircon has maximum value in (SSG11, Table 1),
and by observing the geochemical map (Fig. 7), it is
seen that Zr is highly concentrated at the northeastern
part of the study area.
The spatial distribution of most of the anomalous
elements such as Manganese, cobalt, nickel,
molybdenum and zinc in the study area (Figs. 4-14)
leads to the assumption that the behaviors of these
element is controlled by local drainage condition.
Hence, mineralization may be located upstream.
4.2 Implication for Mineral Exploration
The study area has no history of economic
minerals mining and studies so far have shown
appreciable mineralization potential. Calcium, Barium,
Cobalt, Cadmium, Molybdenum and Titanium being
the most anomalous elements in the study area could
form a particularly attractive target for mineral
exploration in the area.
Conclusion
The geology of the area is fairly studied consisting
of fine-medium-coarse to porphyritic granite, pegmatite

Researcher 2015;7(10) http://www.sciencepub.net/researcher
69
and migmatite gneisses. Presence of fault, fractures and
joints may serve as the structural control of the
anomalous concentration of trace elements in the study
area. The research has ended up in the delineation of
some prospective targets for mineral deposits. Target of
anomalous distribution of these trace elements include;
Mn, Ba, Zn, Cd, Ag, Zr, Co, Mo, and Ti which are
mostly found in the northeastern portion of the study
area. Therefore if these targets are further assessed, they
may meet the objectives of this work.
Recommendation
Based on the above analyses of result and
conclusion, it is observed that relevant and significant
mineralization of Mn, Ba, Zn, Cd, Ag, Zr, Co, Mo, and
Ti occurs within the study area.
It is in view of this, that we therefore recommend
that detailed exploration to be carried out, particularly
around the northeastern part of the study area. This is
with the view to pinpoint areas of mineralization across
the study area.
References
1. Adams, S. Titus, R., Pietersen, K., Terndox G.
and Harris G (2001). Hydrogeochemical
characteristics of aquifer near Sutherland in the
western Karoo, South Africa. Journal of
hydrogeology 241. Pp91-103.
2. Adepoju, M.O and Adekoya, J. A. 2008.
Statistical analysis of reconnaissance geochemical
Survey from Orle district, SW Nigeria. Global
Journal of Geological Sciences, Vol. 6(1) pp 63-
74.
3. Ahmed, H.A. 2012. Stream sediment survey of
Ngabahi Area, South of Mubi, Northeastern
Nigeria. Unpublished M. Sc Thesis, MAUTECH,
Yola. 108p.
4. Baba, S. Islam M.R. El-Neefaty J.M and Amate
M.K. 1991. Exploration and evaluation of
individual minerals and rocks in the Northern part
of Mandara hills N.E. Nigeria Journal of Mining
and Geological Science 27, 2 PP.
5. Bassey N.E. (2006) Structure of Mandara Hills
N.E Nigeria from Air borne Magnetic satellite
data. Global Journal of Geological Science 4.1pp.
6. Emsley, J. (2001) Natures Building Books: An A-
Z Guide to Elements. Oxford University Press.
240-242 ISBN 0-19-850341-5.
7. Garba I. (1987). Geochemical prospecting of
Gold in the area north of Isanlu, Nigeria. J. Afr.
Earth Sci., 6,281-286.
8. Haruna, I.V, Dada, S.S. and Mamman, Y.D.
Stram sediment geochemical survey of an area
around Dass, Northeastern Nigeria. Global
Journal of Geological Sciences, Volume 6, No.2
pp 105-112.
9. Islam, M.R. and Baba. S. (1990) The Mineral
Potential of the Northern part of Mandara hills,
Nigeria. Berg-Und. Hattenmannische montatshele
(BHM), 135,4, PP 95-96.
10. Roger M. Key, Christopher C. Johnson, Matthew
S.A. Horstwood, Dan J. Lapworth, Katherine V.
Knights, Simon J. Kemp, Michael Watts, Martin
Gillespie, Michael Adekanmi, Tunde Arisekola.
(2012) Investigating high zircon concentrations in
the fine fraction of stream sediments draining the
Pan-African Dahomeyan Terrane in Nigeria.
Applied Geochemistry 27(8) 1525-1539.
10/23/2015