street crossing behavior in younger and older pedestrians
TRANSCRIPT
RESEARCH ARTICLE Open Access
Street crossing behavior in youngerand older pedestrians: an eye- andhead-tracking studyG. A. Zito1, D. Cazzoli1,8, L. Scheffler1, M. Jäger1, R. M. Müri1,2,6, U. P. Mosimann1,3,7, T. Nyffeler1,2,4, F. W. Mast5,6
and T. Nef1,8*
Abstract
Background: Crossing a street can be a very difficult task for older pedestrians. With increased age and potentialcognitive decline, older people take the decision to cross a street primarily based on vehicles’ distance, and not ontheir speed. Furthermore, older pedestrians tend to overestimate their own walking speed, and could not adapt itaccording to the traffic conditions. Pedestrians’ behavior is often tested using virtual reality. Virtual reality presentsthe advantage of being safe, cost-effective, and allows using standardized test conditions.
Methods: This paper describes an observational study with older and younger adults. Street crossing behavior wasinvestigated in 18 healthy, younger and 18 older subjects by using a virtual reality setting. The aim of the study wasto measure behavioral data (such as eye and head movements) and to assess how the two age groups differ interms of number of safe street crossings, virtual crashes, and missed street crossing opportunities. Street crossingbehavior, eye and head movements, in older and younger subjects, were compared with non-parametric tests.
Results: The results showed that younger pedestrians behaved in a more secure manner while crossing a street, ascompared to older people. The eye and head movements analysis revealed that older people looked more at theground and less at the other side of the street to cross.
Conclusions: The less secure behavior in street crossing found in older pedestrians could be explained by theirreduced cognitive and visual abilities, which, in turn, resulted in difficulties in the decision-making process,especially under time pressure.Decisions to cross a street are based on the distance of the oncoming cars, rather than their speed, for bothgroups. Older pedestrians look more at their feet, probably because of their need of more time to plan precisestepping movement and, in turn, pay less attention to the traffic. This might help to set up guidelines forimproving senior pedestrians’ safety, in terms of speed limits, road design, and mixed physical-cognitive trainings.
Keywords: Eye- and head-tracking technology, Older pedestrians, Street crossing behavior, Virtual reality
BackgroundCrossing a street can be a very difficult task for older pe-destrians. In 2012, 17 % of all traffic fatalities in theUnited States involved 65 years old people and older [1].The challenge in deciding when to safely cross a streetconsists of acquiring and interpreting visual and acoustic
information within a limited amount of time. This poseshigh demands on perception (e.g., vision, hearing), andcognition (e.g., attention, processing speed) [2, 3]. Bothdirections of the roadway must be inspected, the vehiclesand their speed detected and processed, and the pedes-trians must estimate when the vehicles will arrive at thecrossing point. Additionally, pedestrians have to com-bine the estimated arrival times of the vehicles with theestimation of their own walking speed, and judgewhether the gap is long enough for a safe crossing.These visual and cognitive processes lead to the decision
* Correspondence: [email protected] and Rehabilitation Group, University of Bern, Bern,Switzerland8ARTORG Center for Biomedical Engineering Research, University of Bern,Bern, SwitzerlandFull list of author information is available at the end of the article
© 2015 Zito et al. Open Access This article is distributed under the terms of the Creative Commons Attribution 4.0International License (http://creativecommons.org/licenses/by/4.0/), which permits unrestricted use, distribution, andreproduction in any medium, provided you give appropriate credit to the original author(s) and the source, provide a link tothe Creative Commons license, and indicate if changes were made. The Creative Commons Public Domain Dedication waiver(http://creativecommons.org/publicdomain/zero/1.0/) applies to the data made available in this article, unless otherwise stated.
Zito et al. BMC Geriatrics (2015) 15:176 DOI 10.1186/s12877-015-0175-0
to either cross the road or let the vehicles pass and waitfor the next opportunity. Furthermore, while crossing,the representation of the scene must be updated and, incase of wrong judgment, the walking speed must berapidly adapted to the actual traffic situation [4].Normal aging can affect perception and cognition,
which in turn might have an impact on street crossingbehavior [5]. Several studies investigated differences be-tween the street crossing behavior of younger and olderpeople [6–10]. These studies found that decisions ofolder people in selecting safe gaps were often based onsimple heuristics, such as vehicle’s distance and not itsspeed [11, 12]. A consequence of this pattern was an im-precise time-to-arrival estimation [13]. In facts, olderpeople often report that they think to have more time tocross a street than they actually have.Not only visual and cognitive, but also motor abilities
were shown to play an important role in street crossing be-havior. In previous studies, Dommes et al. [2, 14] showedthat older pedestrians overestimated their own walkingspeed, and could not adapt it according to the actual trafficconditions. In agreement with these results, a study byOxley et al. [15] showed that slower walkers made moreunsafe crossings than faster walkers, suggesting that slowerwalkers had more difficulties in adjusting their behavior tocompensate for decreased motor abilities.Since studying street crossing behavior in a real life
environment may be dangerous, many studies focusedon virtual reality settings [2, 11, 16, 17]. Virtual realitypresents, on the one hand, the advantage of giving theparticipants the feeling of immersion in the virtual envir-onment and, therefore, a realistic experience [18]. Fur-thermore, it is safe, cost-effective, and allows to usestandardized test conditions, with a strong experimentalcontrol over the tasks [19]. On the other hand, virtualreality has certain disadvantages. The participants haveto immerse themselves in the virtual scene, and it is notsure whether distances and speeds of the vehicles areperceived in the same way as in the corresponding real-life environment. Another technology often used tomeasure cognitive and visual abilities is eye-tracking[20]. This technique is based on the detection of somecharacteristics of the eye, such as the pupil shape, thatvary with the eye movements and that can be detectedby a camera [21]. The gaze direction is extracted bymeans of algorithms of image analysis, and then mappedin order to return the points on the scene where the eyelooked at. Indeed, eye and head movements proved tobe a valid and reliable technique to assess visual explor-ation behavior [22], and provide insights into the streetcrossing decision processes. However, to the best of ourknowledge, there are no studies that explored visual ex-ploration behavior of younger and older pedestrians dur-ing a street crossing task.
In the present study, street crossing behavior was in-vestigated in healthy, younger and older subjects bymeans of a virtual reality setting. The aim of the studywas to measure behavioral data (such as eye and headmovements) and to assess how these two age groups dif-fer regarding the number of safe crossings, virtualcrashes, and missed crossing opportunities. The record-ing of eye and head movements represents the noveltyof this approach.The following hypotheses were tested: Older partici-
pants were expected to behave in a less secure mannercompared to younger ones, with more virtual crashes,fewer missed crossing opportunities, and more visualfixations on the floor. For both age groups, more missedopportunities were expected at a lower speed of ap-proaching cars, and more virtual crashes at a higherspeed, since crossing decisions are based on the vehicle’sdistance instead of speed [11, 12].
MethodsParticipants and ethical approval20 healthy, younger participants (8 men, aged between23 and 28 years old, M = 25.15, SD = 1.81) and 20healthy, older participants (12 men, aged between 65and 79 years old, M = 70.50, SD = 4.43 years old) wererecruited to participate in this study. Older participantswere recruited through the “Senior University of Bern”.Younger participants were recruited through advertise-ment at the University of Bern. Participation in the ex-periment was free. Inclusion criteria were: a MoCA [23]score > 26 for both age groups, age range between 20and 30 years old for the younger group, and age rangebetween 60 and 80 years old for the older group. Exclu-sion criteria were: severely impaired motor abilities (e.g.,resulting from chronic pain), inability to stand for about1 h, or restricted visual field (less than 140° on the hori-zontal dimension). All subjects had a post-secondaryeducation degree. Due to poor quality of eye and headmovements data, only 18 older and 18 younger subjectswere included in the analysis.The study was carried out in accordance with the
latest version of the Declaration of Helsinki, EthicalApproval was provided by the Ethics Committee of theCanton of Bern, Switzerland.
Experimental setupThe experiment was comprised of two blocks of about30 min each. In the first block, a general screening ofthe cognitive and visual abilities of the participants, aswell as the 10 m Gait Speed Test (GST), were con-ducted. In the second block, the street crossing simula-tion, preceded by a practice session, was carried out.All participants gave written informed consent prior to
the experiment. The participants were screened for
Zito et al. BMC Geriatrics (2015) 15:176 Page 2 of 10
eventual visual field defects by means of finger perim-etry. Monocular far visual acuity was assessed by meansof a Landolt-Ring chart at a distance of 5 m from theparticipants [24]. If needed, participants wore their ha-bitual correction (glasses, contact lenses).Cognitive abilities were assessed with standardized
paper-pencil tests. The Montreal Cognitive Assessment(MoCA) was used to check whether participants fulfilledthe respective inclusion criterion. The Trial Making Test(TMT) [25], parts A and B, was used to assess visual at-tention and executive functions, respectively [26]. TheClock Drawing Test (CDT) [27] was used to assessvisuo-constructional abilities and abstract thinking [28].The GST was administered to measure the walking
speed of the participants [29]. In this test, participantswere asked to walk three times in a corridor for amarked distance of 12 m, at a self-selected walkingspeed, as they would do while crossing a street, butwithout time pressure. The measured distance was onlyof 10 m, because the first and last meter were excludedfrom analysis due to the acceleration and deceleration(starting and stopping walking) of the participants.Afterwards, participants were asked to stand in front ofthe same corridor, to imagine themselves walkingstraight ahead for the same distance, and to estimatetheir own walking time for three times [14].
Street crossingThe main experiment of this study was the street cross-ing simulation. It took place in a temperature-, light-,and noise-controlled room, with a modified version of adriving simulator (F12PI-3/A88, Foerst GmbH, DE). Thecar component of the driving simulator was removed forthe purpose of the experiment. The virtual scene wasprojected by three projectors (Ultra-Short Focus LCDprojector, Sanyo), with a resolution of 1024 × 786 pixels,
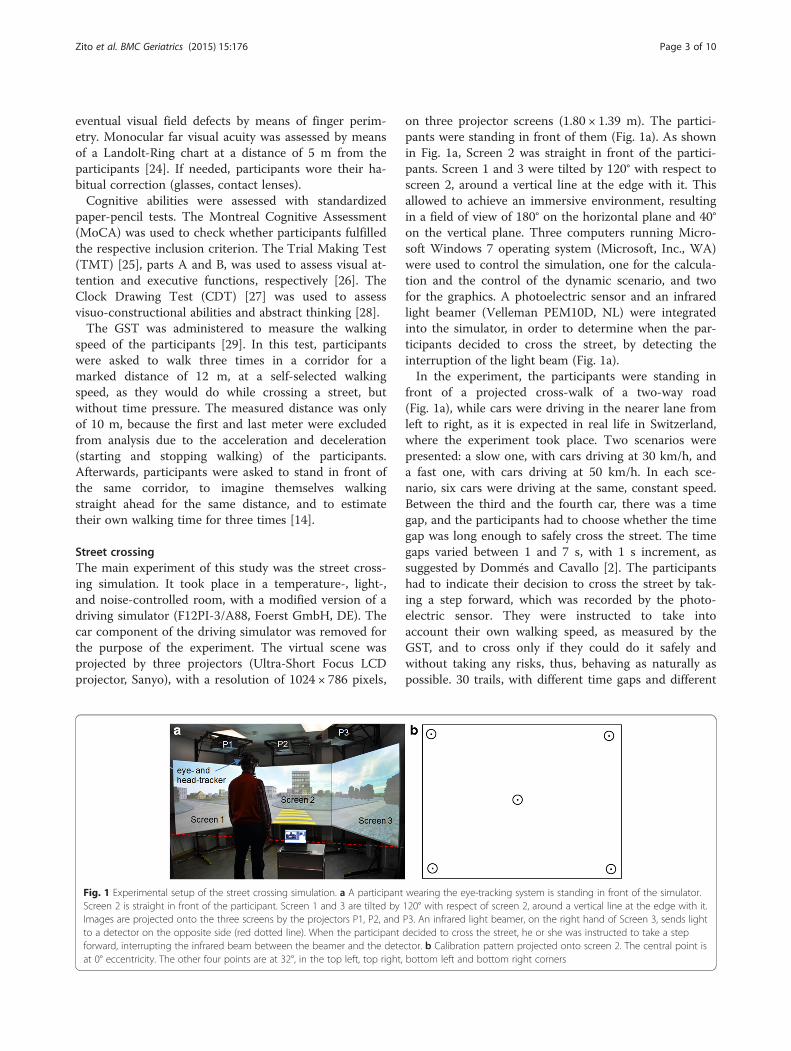
on three projector screens (1.80 × 1.39 m). The partici-pants were standing in front of them (Fig. 1a). As shownin Fig. 1a, Screen 2 was straight in front of the partici-pants. Screen 1 and 3 were tilted by 120° with respect toscreen 2, around a vertical line at the edge with it. Thisallowed to achieve an immersive environment, resultingin a field of view of 180° on the horizontal plane and 40°on the vertical plane. Three computers running Micro-soft Windows 7 operating system (Microsoft, Inc., WA)were used to control the simulation, one for the calcula-tion and the control of the dynamic scenario, and twofor the graphics. A photoelectric sensor and an infraredlight beamer (Velleman PEM10D, NL) were integratedinto the simulator, in order to determine when the par-ticipants decided to cross the street, by detecting theinterruption of the light beam (Fig. 1a).In the experiment, the participants were standing in
front of a projected cross-walk of a two-way road(Fig. 1a), while cars were driving in the nearer lane fromleft to right, as it is expected in real life in Switzerland,where the experiment took place. Two scenarios werepresented: a slow one, with cars driving at 30 km/h, anda fast one, with cars driving at 50 km/h. In each sce-nario, six cars were driving at the same, constant speed.Between the third and the fourth car, there was a timegap, and the participants had to choose whether the timegap was long enough to safely cross the street. The timegaps varied between 1 and 7 s, with 1 s increment, assuggested by Dommés and Cavallo [2]. The participantshad to indicate their decision to cross the street by tak-ing a step forward, which was recorded by the photo-electric sensor. They were instructed to take intoaccount their own walking speed, as measured by theGST, and to cross only if they could do it safely andwithout taking any risks, thus, behaving as naturally aspossible. 30 trails, with different time gaps and different
Fig. 1 Experimental setup of the street crossing simulation. a A participant wearing the eye-tracking system is standing in front of the simulator.Screen 2 is straight in front of the participant. Screen 1 and 3 are tilted by 120° with respect of screen 2, around a vertical line at the edge with it.Images are projected onto the three screens by the projectors P1, P2, and P3. An infrared light beamer, on the right hand of Screen 3, sends lightto a detector on the opposite side (red dotted line). When the participant decided to cross the street, he or she was instructed to take a stepforward, interrupting the infrared beam between the beamer and the detector. b Calibration pattern projected onto screen 2. The central point isat 0° eccentricity. The other four points are at 32°, in the top left, top right, bottom left and bottom right corners
Zito et al. BMC Geriatrics (2015) 15:176 Page 3 of 10
car speeds, were presented in a randomized order: timegaps of 1 and 7 s were presented once, time gaps of 2and 6 s were shown twice, and the time gaps of 3, 4, and5 s were presented three times, making 15 trials, per onespeed value.During the simulation, the participants wore a helmet
with a head-mounted eye- and head-tracking system(Fig. 1a). Eye-movements were recorded using a HED 4(SMI iView X HED, DE) video-based corneal reflectiontracker. After performing a five-point calibration on thecentral screen (points at 0° and 32°, as shown in Fig. 1b),the system tracked the gaze position for the whole dur-ation of the experiment. Additionally, participants’ headmovements were recorded by a passive head-trackingsystem (Atracsys InfiniTrack 500, CH). A passive markerwith four reflective spheres, with a diameter of 13 mmeach, was fixed on the back of the helmet. A sensorplaced behind the participant captured the position ofthe head in three dimensions for the whole duration ofthe experiment.
Data analysisThe outcome measures of the cognitive tests were theperformance on the single tasks, and the respective timeuntil completion of the same tasks. For the far visualacuity, only performance was recorded. For the streetcrossing simulation, the behavioral outcomes were thenumber of safe crossings, the number of virtual crashes,and the number of missed opportunities. The sum of allthe three outcomes was always equal to the total num-ber of repetitions, namely 30. A safe crossing was de-fined as a decision to cross the street that would notlead to any collision with the oncoming vehicles. A vir-tual crash was defined as the opposite of the safe cross-ing, namely a decision to cross the street that wouldlead to a collision with a vehicle. More in depth, thenumber of safe crossings and virtual crashes was com-puted in the following way: Given the moment when theparticipants decided to cross, the speed of the vehiclesand the own walking speed of the participants, measuredwith the GST, a virtual crash was identified as an eventwhere the vehicle and the pedestrian were at the samepoint in space, and at the same instant in time. A missedopportunity was defined as a decision to let the vehiclepass even if the time gap was sufficient to safely crossthe street.Eye-tracking outcomes were assessed in terms of num-
ber of visual fixations on three regions of interest (ROI):left part of the screen, the floor below the screen andright part of the screen (Fig. 3a). Head-tracking outcomewas the number of head movements rightward, leftward,and downward. The gaze behavior was calculated by tak-ing into account both eye and head movements [16]. Ina further analysis, head movements alone were also
analysed. Eye-tracking accuracy, during the calibration,was calculated as the distance between the position of adetected fixation in a calibration point and the actualposition of that calibration point.The software Statistica (StatSoft, Inc, OK) was used
for statistical analyses. Independent sample Mann-Whitney U tests were used to compare performancebetween the two groups in the general screening tests.To test differences in the actual, as compared to the esti-mated walking speed, between the two groups, inde-pendent sample Mann-Whitney U tests on thedifference between the two walking speeds was used.Gender differences in the own walking speed, the esti-mated walking speed, and the difference between actualand estimated walking speed, were also tested with inde-pendent sample Mann-Whitney U test. Performance onstreet crossing simulation was firstly assessed with aWilcoxon Signed Rank Test on factor Speed (30 and50 km/h), in the younger and older groups, respectively.Then a Mann-Whitney U Test was used to compare thetwo age groups, for 30 and 50 km/h, respectively. Visualexploration behavior was firstly assessed with a Fried-man’s Two-Way Analysis of Variance by Ranks on factorLocation (left part of the screen, right part of the screenand space below the screen), in the younger and oldergroup, respectively. Secondly, Wilcoxon Signed RankTests were used to compare different locations (left andright parts of the screen, left part of the screen and spacebelow the screen, right part of the screen and spacebelow the screen) within each age group. Then an inde-pendent sample Mann-Whitney U Test was used tocompare the two age groups in the left part of thescreen, the right part of the screen and the space belowthe screen, respectively. Holm-Šidàk corrected p-valueswere used to take into account multiple comparisons[30]. The following formula was used to compute thecorrected p-values:
pcorrected ¼ 1− 1−poriginal� �C−iþ1
where C represents the total number of comparisons,and i = 1…C represents the iteration index. The signifi-cance level for the corrected p-values was set to 0.05.
ResultsGeneral screeningA summary of the main results of the general screeningis shown in Table 1.The younger and the older groups significantly differed
regarding far visual acuity [U(34) = 62.0, p = 0.001], withbetter performance in the younger group. For both theTMT-A and -B, significant group differences were found:the younger group was faster in both tests ([U(34) = 9.0,p < 0.001] for TMT-A and [U(34) = 27.0, p < 0.001] for
Zito et al. BMC Geriatrics (2015) 15:176 Page 4 of 10
TMT-B), and showed better performance only on theTMT-B [U(34) = 63.0, p < 0.001]. The younger groupshowed better performance also on the CDT [U(34) =95.5, p = 0.034]. No significant group differences werefound for the GST [U(34) = 144.0, p = 0.584], nor theself-estimated walking speed [U(34) = 119.0, p = 0.181].A significant overestimation of their own walking speedcompared with the GST was found in the older group[U(34) = 95.0, p = 0.034]. No gender differences werefound in the walking speed ([U(16) = 28.5, p = 0.315] inthe younger group, [U(16) = 31.0, p = 0.536] in the olderone), neither in the estimated walking speed ([U(16) = 37.0,p = 0.829] in the younger group, [U(16) = 23.5, p = 0.179]in the older one), nor in the difference between actual andestimated walking speed ([U(16) = 38.5, p = 0.897] in theyounger group, [U(16) = 24.0, p = 0.211] in the older one).
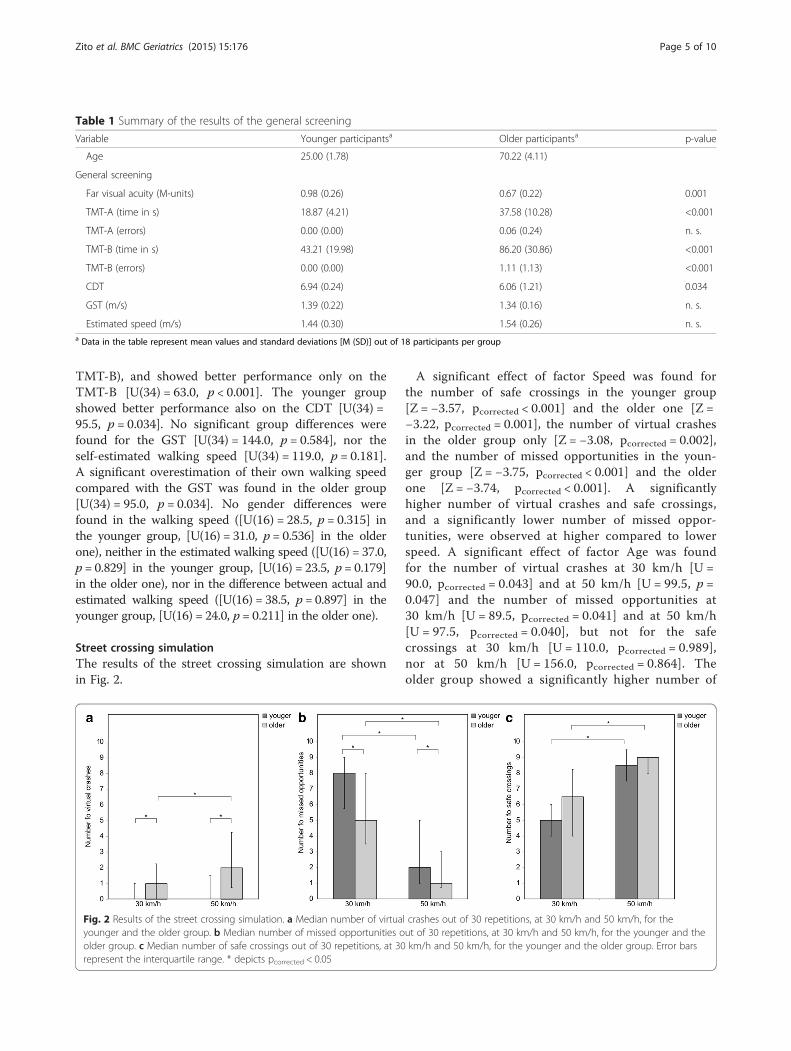
Street crossing simulationThe results of the street crossing simulation are shownin Fig. 2.
A significant effect of factor Speed was found forthe number of safe crossings in the younger group[Z = −3.57, pcorrected < 0.001] and the older one [Z =−3.22, pcorrected = 0.001], the number of virtual crashesin the older group only [Z = −3.08, pcorrected = 0.002],and the number of missed opportunities in the youn-ger group [Z = −3.75, pcorrected < 0.001] and the olderone [Z = −3.74, pcorrected < 0.001]. A significantlyhigher number of virtual crashes and safe crossings,and a significantly lower number of missed oppor-tunities, were observed at higher compared to lowerspeed. A significant effect of factor Age was foundfor the number of virtual crashes at 30 km/h [U =90.0, pcorrected = 0.043] and at 50 km/h [U = 99.5, p =0.047] and the number of missed opportunities at30 km/h [U = 89.5, pcorrected = 0.041] and at 50 km/h[U = 97.5, pcorrected = 0.040], but not for the safecrossings at 30 km/h [U = 110.0, pcorrected = 0.989],nor at 50 km/h [U = 156.0, pcorrected = 0.864]. Theolder group showed a significantly higher number of
Table 1 Summary of the results of the general screening
Variable Younger participantsa Older participantsa p-value
Age 25.00 (1.78) 70.22 (4.11)
General screening
Far visual acuity (M-units) 0.98 (0.26) 0.67 (0.22) 0.001
TMT-A (time in s) 18.87 (4.21) 37.58 (10.28) <0.001
TMT-A (errors) 0.00 (0.00) 0.06 (0.24) n. s.
TMT-B (time in s) 43.21 (19.98) 86.20 (30.86) <0.001
TMT-B (errors) 0.00 (0.00) 1.11 (1.13) <0.001
CDT 6.94 (0.24) 6.06 (1.21) 0.034
GST (m/s) 1.39 (0.22) 1.34 (0.16) n. s.
Estimated speed (m/s) 1.44 (0.30) 1.54 (0.26) n. s.a Data in the table represent mean values and standard deviations [M (SD)] out of 18 participants per group
Fig. 2 Results of the street crossing simulation. a Median number of virtual crashes out of 30 repetitions, at 30 km/h and 50 km/h, for theyounger and the older group. b Median number of missed opportunities out of 30 repetitions, at 30 km/h and 50 km/h, for the younger and theolder group. c Median number of safe crossings out of 30 repetitions, at 30 km/h and 50 km/h, for the younger and the older group. Error barsrepresent the interquartile range. * depicts pcorrected < 0.05
Zito et al. BMC Geriatrics (2015) 15:176 Page 5 of 10

virtual crashes and a significantly lower number ofmissed opportunities as compared to the youngergroup, irrespective of the speed condition.
Eye and head movement analysisThe accuracy of the eye and head movement data was(1.28 ± 0.94)° for the younger group, and (1.52 ± 1.09)°for the older one. The graph in Fig. 3b, c represents thedensity of fixations on the visual scene in the youngerand the older group for the entire duration of the ex-periment. The three ROIs are marked. This qualitativeanalysis revealed that the two groups had similar pat-terns in their visual exploration behavior, with most ofthe fixations towards the left part of the screen. Thepoint where the vehicles were expected to appear is ahot spot, with more than 20 fixations/cm2, but also thearea around it was largely explored. The extent of thisarea reaches the right part of the screen in both groups,
but it is larger in the younger participants. The oldergroup explored more often the region below the screen.The results of the statistical analysis on the visual ex-
ploration behavior and the head movements are shownin Fig. 4.For the visual exploration behavior, a significant main
effect of factor Location (χ2(2) = 29.78, p < 0.001 for theyounger group, χ2(2) = 28.79, p < 0.001 for the older one)was found. A similar pattern was found for the numberof head movements, with a main effect of factor Loca-tion (χ2(2) = 33.37, p < 0.001 for the younger group,χ2(2) = 27.41, p < 0.001 for the older one). WilcoxonSigned Rank Tests revealed that both groups producedmost fixations on the left part of the screen ([Z = −3.72,pcorrected < 0.01] and [Z = −3.72, pcorrected < 0.01] in thecomparison left and right parts of the screen for theyounger and the older groups, respectively, [Z = −3.72,pcorrected < 0.001] and [Z = −3.72, pcorrected < 0.001] in the
Fig. 3 Density of fixations. Density of fixations in the younger and older group for the entire duration of the experiment. a Visual scene, as it waspresented to the participants. In the present depiction, the images on the three screens have been aligned for better visualization. b Density offixations in the younger group. c Density of fixations in the older group
Zito et al. BMC Geriatrics (2015) 15:176 Page 6 of 10
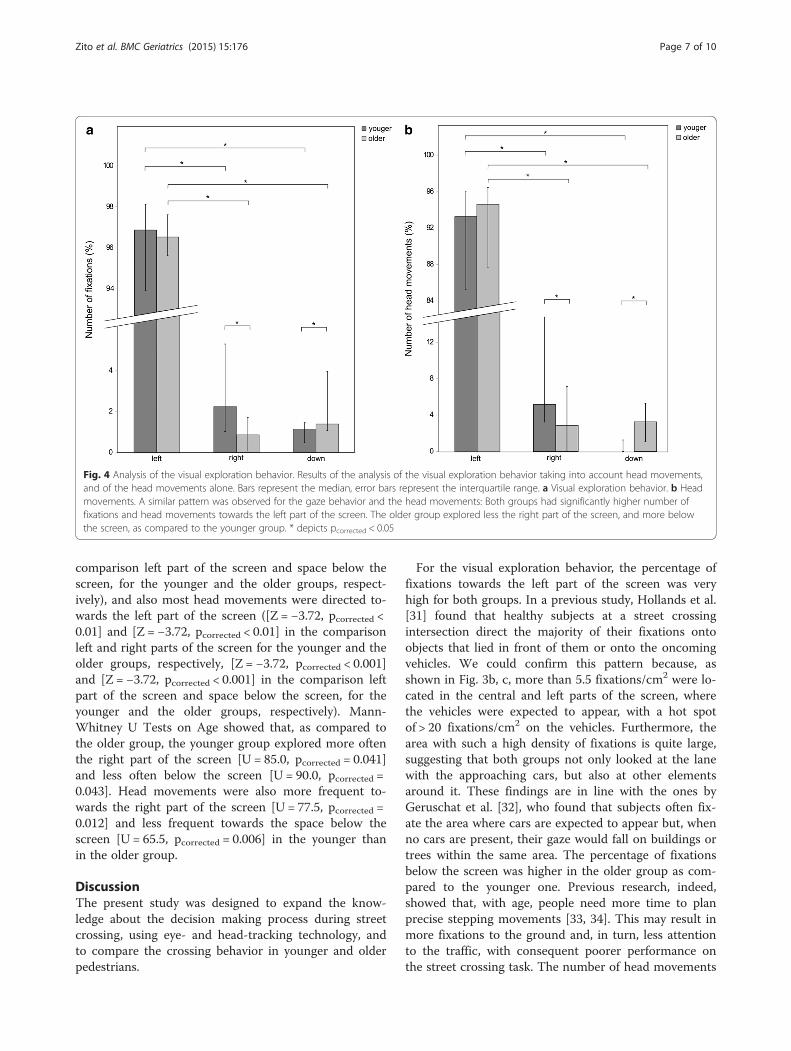
comparison left part of the screen and space below thescreen, for the younger and the older groups, respect-ively), and also most head movements were directed to-wards the left part of the screen ([Z = −3.72, pcorrected <0.01] and [Z = −3.72, pcorrected < 0.01] in the comparisonleft and right parts of the screen for the younger and theolder groups, respectively, [Z = −3.72, pcorrected < 0.001]and [Z = −3.72, pcorrected < 0.001] in the comparison leftpart of the screen and space below the screen, for theyounger and the older groups, respectively). Mann-Whitney U Tests on Age showed that, as compared tothe older group, the younger group explored more oftenthe right part of the screen [U = 85.0, pcorrected = 0.041]and less often below the screen [U = 90.0, pcorrected =0.043]. Head movements were also more frequent to-wards the right part of the screen [U = 77.5, pcorrected =0.012] and less frequent towards the space below thescreen [U = 65.5, pcorrected = 0.006] in the younger thanin the older group.
DiscussionThe present study was designed to expand the know-ledge about the decision making process during streetcrossing, using eye- and head-tracking technology, andto compare the crossing behavior in younger and olderpedestrians.
For the visual exploration behavior, the percentage offixations towards the left part of the screen was veryhigh for both groups. In a previous study, Hollands et al.[31] found that healthy subjects at a street crossingintersection direct the majority of their fixations ontoobjects that lied in front of them or onto the oncomingvehicles. We could confirm this pattern because, asshown in Fig. 3b, c, more than 5.5 fixations/cm2 were lo-cated in the central and left parts of the screen, wherethe vehicles were expected to appear, with a hot spotof > 20 fixations/cm2 on the vehicles. Furthermore, thearea with such a high density of fixations is quite large,suggesting that both groups not only looked at the lanewith the approaching cars, but also at other elementsaround it. These findings are in line with the ones byGeruschat et al. [32], who found that subjects often fix-ate the area where cars are expected to appear but, whenno cars are present, their gaze would fall on buildings ortrees within the same area. The percentage of fixationsbelow the screen was higher in the older group as com-pared to the younger one. Previous research, indeed,showed that, with age, people need more time to planprecise stepping movements [33, 34]. This may result inmore fixations to the ground and, in turn, less attentionto the traffic, with consequent poorer performance onthe street crossing task. The number of head movements
Fig. 4 Analysis of the visual exploration behavior. Results of the analysis of the visual exploration behavior taking into account head movements,and of the head movements alone. Bars represent the median, error bars represent the interquartile range. a Visual exploration behavior. b Headmovements. A similar pattern was observed for the gaze behavior and the head movements: Both groups had significantly higher number offixations and head movements towards the left part of the screen. The older group explored less the right part of the screen, and more belowthe screen, as compared to the younger group. * depicts pcorrected < 0.05
Zito et al. BMC Geriatrics (2015) 15:176 Page 7 of 10
and visual fixations towards the right part of the screenresulted higher in the younger group, and, as shown inFig. 3b, concentrated in the central part of the scenario.This could represent a further confirmation of a safety-relevant behavior of the younger group, focusing also onthe target to reach, namely the other side of the street,in order to correctly judge the distance to walk.The results of the general screening showed, as ex-
pected, age effects in global visual functions and cogni-tive testing. Older people showed significantly worseperformance in the far visual acuity test, although theywore their habitual correction, when needed. They alsoshowed a higher number of errors in the TMT-B, andobtained lower scores in the CDT. These cognitive dif-ferences can be expected with increasing age [35]. Fur-thermore, older people needed more time to completethe TMT-A and -B, and resulted to be globally slowerthan younger participants. This factor was shown to berelated with executive functions during walking [36],and plays an important role in street crossing, where fastdecisions have to be taken [37]. The results of theGST and the estimation of one’s own walking speedshowed that older participants significantly overesti-mated their walking speed, despite the fact that nosignificant group differences were found neither inthe actual walking speed, nor in estimating the ownwalking speed. This may indicate poor compensationfor declining cognitive abilities. Older pedestrians maynot be aware of, or deny, their diminished abilities,thus choosing gaps that are too short to accommo-date their slower walking speed [9].The results of the street crossing simulation showed
that both age groups performed more safe crossings andless missed opportunities in the condition with fastercars. However, more virtual crashes were found at higherspeed. This suggests that decisions of all age groups arebased rather on the distance than on the speed of an ap-proaching car. This is reflected in the fact that, for agiven time gap, lower speeds are associated with shortercar distances than higher speeds [2]. When vehicles werecloser, their angular size was bigger and their visual ex-pansion as they approached was greater. This ‘looming’effect [38] can lead to a feeling of danger and, therefore,to a rejection of an acceptable gap. In addition, consider-ing the higher number of virtual crashes and fewermissed opportunities in the older group compared to theyounger one, it can be argued that, for long distances,older people cross more often regardless of the oncom-ing vehicle’s speed. This leads to greater risk-taking be-havior, and increases the possibility of an accident with afast-moving car. It is likely that older pedestrians havemore difficulties in analyzing the movement of an ap-proaching car when this is still far away and, thus, at theedge of the visual field. These results are even more
distinctive under time constraint [17]. In agreement withthe results of the cognitive assessment, it can be arguedthat younger people have more cognitive capacities, andcan work more efficiently under time pressure, whereas,under the same time conditions, older people often takerisky decisions and make more errors. In addition, thenumerous missed opportunities of younger participants,as well as the fewer virtual crashes, can be interpreted asa very safe weighting of unclear situations, i.e., lettingthe vehicles pass in case of doubt.
ConclusionsThe present study has a few limitations. In real-life streetcrossing settings, there is an interaction between thepedestrian and the driver of a car, by means of eye con-tact or gestures. A more interactive virtual reality envir-onment might address this issue, but, like in otherstudies, this interaction was not implemented in thepresent study. Another limitation of our study was theuse of a traffic scenario with only one way, with cars ap-proaching only from left to right. Nevertheless, in otherstudies [14], two ways were used, but the time gaps werealways synchronized and, thus, did not reflect real condi-tions with two-way traffic. The noise of the cars chan-ging with their speed might also influence the decisionto cross a road, but our setup could not reproduce 3Dsound, and auditory stimuli were, thus, not taken intoaccount in the measurement.Our approach presents several strengths. Street cross-
ing behavior was investigated in a safe environment,where the visual exploration could be measured and an-alyzed. Eye-tracking technology opened new insightsinto the visual exploration behavior during everyday lifeactivities, such as street crossing. Furthermore, the simu-lated environment allowed a standardized comparisonacross all participants. In our study, the participantswere standing in front of three screens covering a largeproportion of the visual field, and inducing a realisticimpression of the size of the oncoming vehicles. More-over, the decision to cross was indicated in an activefashion, because a step forward was required, and ourparticipants behaved more likely as in a real-world streetcrossing setting.In summary, our study showed differences in street
crossing performance between the investigated agegroups. Younger participants acted in a safer way, whichwas reflected in fewer crashes and more missed oppor-tunities. The more risky behavior of older participantscould be explained by the complexity of the task. Manyvariables have to be simultaneously evaluated and, giventhe reduced cognitive and visual abilities of older people,this might result in difficulties, especially under timepressure. For both age groups, we found a tendency tobase decisions to cross a street on the distance of the
Zito et al. BMC Geriatrics (2015) 15:176 Page 8 of 10
oncoming cars, rather than on their speed. This patterncan lead to very dangerous decisions when cars are driv-ing fast. Eye- and head-tracking technology, the novelelement of the present study, allowed to measure visualexploration behavior and head movements of the partici-pants. We found, indeed, that the older participantslooked more often at the ground and, in turn, paid lessattention to the traffic.The practical implications of our study go in the direc-
tion of improving safety of seniors: as suggested byDommes et al., car-free islands in the middle of two-waystreets could help the older pedestrians to cross in twostages, introducing a break in the walk, decreasing thetime spent in the street, and dividing the cognitive loadby factor two [14]. Speed limit management, with the in-crease in the number of speed ramps, narrower streets,and zones at 30 km/h, would considerably improve se-nior safety too. Training programs can be used as wellas a supplement to safety regulations and pedestrian-friendly infrastructure measures (e.g., mixed physical-cognitive trainings) [2].
AbbreviationsGST: gait speed test; MoCA: montreal cognitive assessment; TMT: trial makingtest; CDT: clock drawing test; ROI: region of interest.
Competing interestsThe authors declare that they have no competing interests.
Authors’ contributionsGAZ carried out the analysis and interpretation of the results. DC gaveimportant help in the statistical analysis of the data. LS developed the mainbody of the experiment and collected the data. MJ developed the technicalsetup used in the study. RMM gave substantial help in the discussion of theresults. UPM contributed in the conceptual development of the study. TNprovided important feedbacks regarding the data analysis. FWM supervisedall the study and helped with the experiment design. TNef helped with theconceptual framework of the study design and coordinated the work. Allauthors contributed in reading, correcting and approving the finalmanuscript. All authors read and approved the final manuscript.
AcknowledgmentsThe Authors would like to acknowledge the ARTORG Center for BiomedicalEngineering Research (University of Bern, Switzerland), the Department ofNeurology of the Inselspital (Bern, Switzerland) and the University Hospital ofOld Age Psychiatry and Psychotherapy (University of Bern, Switzerland). Wewould also like to express our thankfulness to all the volunteers whoparticipated in our experiment.
Author details1Gerontechnology and Rehabilitation Group, University of Bern, Bern,Switzerland. 2Perception and Eye Movement Laboratory, Division ofCognitive and Restorative Neurology, Department of Neurology, UniversityHospital Inselspital, University of Bern, Bern, Switzerland. 3University Hospitalof Old Age Psychiatry and Psychotherapy, University of Bern, Bern,Switzerland. 4Center of Neurology and Neurorehabilitation, LuzernerKantonsspital, Spitalstrasse, Luzern, Switzerland. 5Department of Psychology,University of Bern, Bern, Switzerland. 6Center for Cognition, Learning andMemory, University of Bern, Bern, Switzerland. 7Private Hospital Wyss,Münchenbuchsee, Switzerland. 8ARTORG Center for Biomedical EngineeringResearch, University of Bern, Bern, Switzerland.
Received: 19 August 2015 Accepted: 17 December 2015
References1. Administration NHTS. Traffic safety facts: 2012 data. Washington, DC: US
Department of Transportation, National Highway Traffic SafetyAdministration [online]; 2014.
2. Dommès A, Cavallo V. The role of perceptual, cognitive, and motor abilitiesin street‐crossing decisions of young and older pedestrians. OphthalmicPhysiol Opt. 2011;31(3):292–301.
3. Pichierri G, Wolf P, Murer K, de Bruin ED. Cognitive and cognitive-motorinterventions affecting physical functioning: a systematic review. BMCGeriatr. 2011;11(1):29.
4. Oxley J, Charlton JL, Fildes B. The effect of cognitive impairment on olderpedestrian behaviour and crash risk, vol. 244. Australia: Monash UniversityAccident Research Centre Melbourne; 2005.
5. Li KZ, Lindenberger U. Relations between aging sensory/sensorimotor andcognitive functions. Neurosci Biobehav Rev. 2002;26(7):777–83.
6. Dommes A, Cavallo V, Vienne F, Aillerie I. Age-related differences in street-crossing safety before and after training of older pedestrians. Accid AnalPrev. 2012;44(1):42–7.
7. Lobjois R, Benguigui N, Cavallo V. The effects of age and traffic density onstreet-crossing behavior. Accid Anal Prev. 2013;53:166–75.
8. Oxley J, Fildes B, Ihsen E, Charlton J, Day R. Differences in trafficjudgements between young and old adult pedestrians. Accid Anal Prev.1997;29(6):839–47.
9. Holland C, Hill R. Gender differences in factors predicting unsafe crossingdecisions in adult pedestrians across the lifespan: a simulation study. AccidAnal Prev. 2010;42(4):1097–106.
10. Oxley JA, Ihsen E, Fildes BN, Charlton JL, Day RH. Crossing roads safely: anexperimental study of age differences in gap selection by pedestrians. AccidAnal Prev. 2005;37(5):962–71.
11. Lobjois R, Cavallo V. The effects of aging on street-crossing behavior: fromestimation to actual crossing. Accid Anal Prev. 2009;41(2):259–67.
12. Oxley J, Fildes BN, Ihsen E, editors. Older pedestrian safety: The role ofperceptual and cognitive factors and the ability to compensate for age-related changes, Proceedings of the Australasian road safety research,policing and education conference. Melbourne: Monash University; 2000.
13. Andersen GJ, Enriquez A. Aging and the detection of observer and movingobject collisions. Psychol Aging. 2006;21(1):74.
14. Dommes A, Cavallo V, Oxley J. Functional declines as predictors of risky street-crossing decisions in older pedestrians. Accid Anal Prev. 2013;59:135–43.
15. Oxley J. Age-related functional impairments and the impact on the abilityto cross roads safely. 2001.
16. Jäger M, Nyffeler T, Müri R, Mosimann U, Nef T. Adapting a driving simulatorto study pedestrians’ street-crossing decisions: a feasibility study. AssistTechnol. 2015;27(1):1–8.
17. Lobjois R, Cavallo V. Age-related differences in street-crossing decisions: theeffects of vehicle speed and time constraints on gap selection in anestimation task. Accid Anal Prev. 2007;39(5):934–43.
18. McComas J, MacKay M, Pivik J. Effectiveness of virtual reality for teachingpedestrian safety. CyberPsychol Behavior. 2002;5(3):185–90.
19. Reed MP, Green PA. Comparison of driving performance on-road and in alow-cost simulator using a concurrent telephone dialling task. Ergonomics.1999;42(8):1015–37.
20. Duchowski A. Eye tracking methodology: Theory and practice. 2007.Springer Science & Business Media.
21. Nguyen K, Wagner C, Koons D, Flickner M, editors. Differences in theinfrared bright pupil response of human eyes, Proceedings of the2002 symposium on eye tracking research & applications. New York:ACM; 2002.
22. Henderson JM, Hollingworth A. High-level scene perception. Annu RevPsychol. 1999;50(1):243–71.
23. Nasreddine ZS, Phillips NA, Bédirian V, Charbonneau S, Whitehead V, Collin I,et al. The montreal cognitive assessment, MoCA: a brief screening tool formild cognitive impairment. J Am Geriatr Soc. 2005;53(4):695–9.
24. Sloan LL. New test charts for the measurement of visual acuity at far andnear distances. Am J Ophthalmol. 1959;48(6):807–13.
25. Reitan RM. Validity of the trail making test as an indicator of organic braindamage. Percept Mot Skills. 1958;8(3):271–6.
26. Reitan RM. Trail making test: manual for administration and scoring. 1992.Reitan Neuropsychology Laboratory.
27. Shulman KI, Shedletsky R, Silver IL. The challenge of time: clock‐drawing andcognitive function in the elderly. Int J Geriatr Psychiatry. 1986;1(2):135–40.
Zito et al. BMC Geriatrics (2015) 15:176 Page 9 of 10
28. Thalmann B, Spiegel R, Stähelin HB, Brubacher D, Ermini-Fünfschilling D,Bläsi S, et al. Dementia screening in general practice: optimised scoring forthe clock drawing test. Brain Aging. 2002;2(2):36–43.
29. Peters DM, Fritz SL, Krotish DE. Assessing the reliability and validity of ashorter walk test compared with the 10-meter walk test for measurementsof gait speed in healthy, older adults. J Geriatr Phys Ther. 2013;36(1):24–30.
30. Holm S. A simple sequentially rejective multiple test procedure. Scand JStat. 1979;65–70.
31. Hollands MA, Patla AE, Vickers JN. “Look where you’re going!”: gazebehaviour associated with maintaining and changing the direction oflocomotion. Exp Brain Res. 2002;143(2):221–30.
32. Geruschat DR, Hassan SE, Turano KA. Gaze behavior while crossing complexintersections. Optom Vis Sci. 2003;80(7):515–28.
33. Zietz D, Hollands M. Gaze behavior of young and older adults during stairwalking. J Mot Behav. 2009;41(4):357–66.
34. Chapman G, Hollands MA. Evidence for a link between changes to gazebehaviour and risk of falling in older adults during adaptive locomotion.Gait Posture. 2006;24(3):288–94.
35. Levy R. Aging-associated cognitive decline. Int Psychogeriatr. 1994;6(01):63–8.36. Ble A, Volpato S, Zuliani G, Guralnik JM, Bandinelli S, Lauretani F, et al.
Executive function correlates with walking speed in older persons: theInCHIANTI study. J Am Geriatr Soc. 2005;53(3):410–5.
37. Ishaque MM, Noland RB. Behavioural issues in pedestrian speed choice andstreet crossing behaviour: a review. Transp Rev. 2008;28(1):61–85.
38. Schiff W, Caviness JA, Gibson JJ. Persistent fear responses in rhesus monkeysto the optical stimulus of“looming”. Science. 1962;136(3520):982–3.
• We accept pre-submission inquiries
• Our selector tool helps you to find the most relevant journal
• We provide round the clock customer support
• Convenient online submission
• Thorough peer review
• Inclusion in PubMed and all major indexing services
• Maximum visibility for your research
Submit your manuscript atwww.biomedcentral.com/submit
Submit your next manuscript to BioMed Central and we will help you at every step:
Zito et al. BMC Geriatrics (2015) 15:176 Page 10 of 10