strength and microstructure of laser fusion-welded …yly1/pdfs/gen ijamt.pdfstrength and...
TRANSCRIPT

ORIGINAL ARTICLE
Strength and microstructure of laser fusion-welded Ti–SSdissimilar material pair
Gen Satoh & Y. Lawrence Yao & Caian Qiu
Received: 8 March 2012 /Accepted: 21 June 2012 /Published online: 4 July 2012# Springer-Verlag London Limited 2012
Abstract The ability to efficiently create robust and reliabledissimilar metal joints has the potential to enable new func-tionalities and reduce the manufacturing costs of medicaldevices. The need for dissimilar material welds in the med-ical device industry is driven by the unique propertiesexhibited by biocompatible materials such as stainless steeland titanium, as well as shape memory materials such asNiTi. Many material pairs, however, suffer from significantintermetallic phase formation during welding which greatlyreduces their strength. This study investigates the micro-structures and strength of the laser fusion-welded titanium–stainless steel dissimilar material pair as a simplified model ofthe NiTi–stainless steel pair. Compositional and structuralanalysis of the weld pool is performed and fracture morphol-ogies are analyzed in different regions of the weld joint. Therole of weld pool geometry, heat flow, and quench rate on theresultant phases, microstructures, and strength of the welds isdiscussed.
Keywords Laser welding . Dissimilar material welding .
Stainless steel . Titanium . Intermetallic
1 Introduction
Joining of dissimilar materials is performed in order to takeadvantage of specific attributes of eachmaterial to enhance theperformance of a product or introduce new functionalities.
The need to join two different materials typically ariseswhen one possesses an attribute that is required forfunctionality of the device but also has some inherentdisadvantages such as increased cost or weight and thuscannot be used extensively. Some attributes of interestare corrosion resistance and biocompatibility, thermaland electrical properties, as well as mechanical proper-ties such as Young's modulus and hardness. In the casewhere one material is a smart material such as a shapememory alloy, specific attributes such as superelasticityor the shape memory effect may also be exploited.
A number of dissimilar material joints have been suc-cessfully formed using various methods from fusion weld-ing to diffusion bonding including metal–metal, metal–ceramic, and metal–polymer joints [1]. Materials with goodcompatibility such as Cu and Ni can be joined using fusionprocesses while pairs that form phases with undesirableproperties upon mixing are typically joined in the solid state[2] or with the aid of a non-reactive interlayer [3, 4]. Dis-similar metal welding of the biocompatible materials stain-less steel (SS) and the shape memory alloy nickel–titanium(NiTi) is of particular interest within the bio-medical indus-try due to the exceptional mechanical properties of NiTi andthe low cost of stainless steel 316. This particular materialpair, however, suffers from significant intermetallic forma-tion after mixing which results in brittle joints which areunable to withstand handling and use [5]. A number ofintermetallic phases exist even in the simplified binary Fe–Ti system as shown in Fig. 1 [6]. The addition of alloyingelements such as Cr and Ni found in SS and NiTi introducesfurther complexities in microstructure and phase formation.The dissimilar material pair between stainless steel andtitanium alleviates some of these complexities by reducingthe nickel composition from roughly 50 at% in the NiTi toonly ∼10 at% in the SS while still enabling the formation ofTi–Fe-based intermetallics.
G. Satoh (*) :Y. L. YaoDepartment of Mechanical Engineering, Columbia University,New York, NY, USAe-mail: [email protected]
C. QiuChampaign Simulation Center, Caterpillar,Champaign, IL, USA
Int J Adv Manuf Technol (2013) 66:469–479DOI 10.1007/s00170-012-4342-6

Traditional joining methods such as arc welding whenapplied to dissimilar material pairs have been found tointroduce excessive amounts of heat resulting in the forma-tion of large volumes of intermetallics [7]. Some success hasbeen found through the use of laser welding due to itsprecise, localized heat input capabilities which allows forsmall heat-affected zones, however, the joints still sufferfrom brittle intermetallic formation [8]. Li et al. have usedlaser brazing to join NiTi and SS through the use of silver-based filler materials; however, the addition of filler materi-als during welding adds significant complexity to the pro-cess and the filler material is not able to achieve corrosionresistances comparable to the base materials [9]. Diffusionbonding, where two materials are pushed together at highpressure and temperature in the solid state for extendedperiods of time to form a bond, has shown some successbut requires strict tolerances on surface flatness, significanttime, and the ability to impart large stresses on the materials[10]. These requirements are increasingly difficult toachieve as devices are created at small length scales asfound within bio-medical devices. Ultrasonic welding,which uses pressure and high-frequency vibrations to createsolid-state joints, has been shown to produce strong welds ina number of dissimilar metal pairs but is limited to lap jointsand can be difficult to perform on thick sections and onstrong and hard materials such as Ti [11]. A robust fusionwelding process for the NiTi–SS pair would allow for reli-able and efficient formation of strong joints for bio-medicalapplications. The development of such a process requirescomprehensive understanding of the microstructures andfailure mechanisms observed in this material pair in thefusion welding regime.
In this study, the use of pulsed laser welding to jointitanium to SS 316 is investigated through the use ofenergy-dispersive x-ray spectroscopy (EDX) and electronbackscatter diffraction (EBSD) for compositional andmicrostructural analysis. Fracture surface analysis is per-formed through scanning electron microscopy and EDX.Computational thermodynamics techniques are used tomodel phase evolution during solidification of multi-component systems.
2 Background
2.1 Equilibrium phases
The SS–Ti pair, while attractive for many applications,is not widely used due to the existence of multiplebrittle intermetallics within the Fe–Ti phase diagram.Stainless steel, with a composition primarily consistingof Fe, Cr, and Ni, will form many of the same phaseswhen combined with Ti as observed in the Fe–Ti ma-terial pair and thus suffers from many of the sameissues with regards to mechanical strength and ductility.Figure 1 is a binary phase diagram containing the twomain components expected in an SS–Ti dissimilar ma-terial weld, Fe and Ti [6]. While ternary Fe–Ti–Cr andFe–Ti–Ni phase diagrams are available, the phasesformed differ very little from the binary diagram atthe Cr and Ni compositions found in SS. Phases omit-ted in the binary diagram are NiTi2 and TiCr2, whichare expected to form in small amounts in an SS–Timixture. On the binary phase diagram a few phases
Fig. 1 Fe–Ti binary phasediagram showing existence ofat least two intermetallic phasesin the stainless steel–nickeltitanium material pair [6]
470 Int J Adv Manuf Technol (2013) 66:469–479

are formed, namely α-Ti, β-Ti, FeTi, λ, and α-Fe, inorder of increasing Fe content.
In this case, λ represents TiFe2 which has a C14 hexag-onal Laves intermetallic structure. In the ternary Fe–Ti–Crphase diagram, λ represents a solid solution of TiFe2 andTiCr2. The λ-Laves phase is close packed and has a homo-geneity range between 64.8 and 72.4 at% Fe. β-Ti has abase-centered cubic (BCC) structure which at equilibriumwill transform to α-Ti and TiFe through a eutectoid reaction.The intermetallic FeTi also has a BCC structure and onlyexists between 47.5 and 50.2 at% Fe. α-Fe also has a BCCstructure.
2.2 Eutectic solidification
As can be seen in Fig. 1, a eutectic reaction occurs on the Ti-rich side with the formation of β-Ti and TiFe from liquid. Atequilibrium, the formation of these two phases is typically ina lamellar structure with alternating β-Ti and TiFe plates.The microstructure is divided into colonies within whicheach set of plates has the same crystal orientation and aspecific orientation relationship that aims to minimize theinterfacial energy between the two phases. At higher coolingrates directionality is observed in the growth of the platesresulting in an oriented microstructure with the platesaligned in the direction of heat flow.
It has been shown by Yu et al. that during solidification ofnear-eutectic compositions in the Ti–Fe pair, a supersaturat-ed β-Ti(Fe) solid solution will form first followed by theFeTi intermetallic phase [12]. Dendrites in this material pairare typically in the form of TiFe dendrites within a super-saturated β-Ti(Fe) matrix. As with other eutectic structuressolidified under a thermal gradient, the dendrites will formpreferentially in the direction of heat flow. While it has beenshown by Louzguine-Luzgin et al., that the interfacesbetween coarse TiFe dendrites and the matrix cause crackpropagation to be arrested [13], the formation of a direction-al dendritic structure introduces a great deal of anisotropy tothe mechanical properties of the material which typicallyshow significantly more robust mechanical properties alongthe dendrite growth direction and limited strength in thetransverse direction.
While strict observation of the equilibrium phase diagram(Fig. 1) suggests that α-Ti, the hexagonal close-packed(HCP)-structured Ti phase, should form below 595 °C, it hasbeen shown that a number of factors can stabilize theβ-phase.One of the strongest effects comes from alloying. A number ofelements such as Mo, V, W, Nb, Ta, Fe, and Cr have beenshown to be β-stabilizers meaning that their existence lowersthe α/β transus. Still other elements such as Al and O are α-stabilizers and have the opposite effect. The overall effect ofthese elements in captured by calculating the %Mo-equivalentcomposition which is written as [14]
%MoEquivalent ¼ 1:0 %Moð Þ þ 0:67 %Vð Þþ0:44ð% Wð Þ þ 0:28 %Nbð Þ þ 0:22 %Tað Þ
þ2:9 %Feð Þ þ 1:6 %Crð Þ � 1:0 %Alð Þð1Þ
It is suggested that for %Mo-equivalent values exceeding10 %, a β-alloy will form. In the Ti–Fe pair, only a smallamount of mixing is required to exceed the 10 % Mo-equivalent threshold. In addition to compositional changesthat stabilize the β-phase, extended solubility of Fe in β-Tihas also been observed at high cooling rates [15]. Thisallows for the formation of single-phase β-Ti(Fe) at compo-sitions outside the equilibrium homogeneity range.
2.3 Numerical modeling
While binary and ternary phase diagrams are useful forunderstanding the effects of the two or three main alloycomponents on the phases formed during welding, they areunable to take into account any more than three compo-nents. In order to account for the effects of larger numbers ofcomponents, computational thermodynamics techniques areoften used. The basis for phase prediction using computa-tional thermodynamics is the calculation of the free energiesof different phases in a material as a function of temperature,T; pressure, P; and composition, X. For a mechanical mix-ture between two pure components the free energy can bewritten as [16]
GM ¼ XAHA þ XBHB � T XASA þ XBSBð Þ ð2ÞWhere Xi are the mole fractions, Hi are the enthalpies, and Siare the entropies of the pure components A and B. If,however, a solution is created, the free energy is written as
GS ¼ XAHA þ XBHB � T XASA þ XBSB� �� TΔSM ð3Þ
Where barred quantities indicate values when in solutionand ΔSM is the entropy of mixing which accounts for theconfigurational entropy of the solution. For dilute solutions,the configurational entropy can be written as
ΔSM ¼ �R XA lnXA þ XB lnXBð Þ ð4ÞFor non-ideal solutions where properties in the solution
and in pure form are different, the free energy is written as
GS ¼ GM þ XA HA � HA
� �
þXB HB � HB
� �
�T XA SA � SA� �þ XB SB � SB
� �� �
þRT XA lnXA þ XB lnXBð Þ¼ GM þΔHxs � TΔSxs � TΔSM
ð5Þ
Where xs quantities are the difference of the value relative toan ideal solution.
Int J Adv Manuf Technol (2013) 66:469–479 471

Equation 5 thus represents the free energy of a specificphase as a function of temperature and composition withpressure typically held constant. Once these relationshipsare known for each phase in the material, an equilibriumphase diagram can be created by plotting the phase whichhas the lowest free energy at each composition and temper-ature. This is the basis of the CALPHAD (CALculation ofPHAse Diagrams) method.
In order to extend these equations past binary combi-nations to higher-order systems, extra terms are addedfor each new component and higher-order free-energy“surfaces” are plotted rather than curves. In this study,these relationships are calculated using THERMOCALC[17]. In this study the TCFE2 THERMOCALC databaseis used in order to capture the phases formed in stain-less steel-titanium mixtures. Each material databaseincludes polynomials which describe the Gibbs freeenergy of individual phases in a system as a functionof temperature and composition and are developed withthe aid of experimental information as well as Gibbsenergy models [17]. By determining the phases with thelowest free energies at different temperature/compositionvalues, multi-component phase diagrams can be calcu-lated. In addition, the equilibrium phase evolution dur-ing solidification of a material can be determined as afunction of temperature.
3 Experimental setup
Titanium grade 2 (HCP α-phase) and Stainless Steel 316(FCC γ-phase) coupons measuring 50×36×0.8 mm weresectioned from rolled sheets. The surfaces of the sampleswere sanded with aluminum oxide abrasive pads with anequivalent grit of roughly 100 to remove impurities and dullany polished surfaces and cleaned with acetone immediatelyprior to welding. Welds were performed in a butt-weldgeometry with the SS coupon clamped in a fixture and theTi coupon placed next to it with no gap. The lack of a gapbetween the plates and free movement of the Ti couponlimits the thermal stresses induced by the welding process[18]. The samples were welded using a pulsed Nd:YAGlaser at a wavelength of 1,064 nm and a maximum averagepower of 2 kW. The diameter of the Gaussian laser spot onthe sample surface was 1 mm. Laser pulses were producedat controlled repetition rate of 100 Hz, each with a rectan-gular temporal pulse profile. A six-axis robotic arm with anend effector was used for positioning and translation at aconstant speed of 20 mm/s to achieve constant pulse over-laps. Additionally, ultra-high-purity Argon gas was used toshield the weld pool from atmospheric contamination alongthe top and bottom surfaces of the weld. A schematic dia-gram of the process is shown in Fig. 2.
Processing parameters were chosen using a three-level,three-factor design of experiment array. The three factorsanalyzed were the laser beam offset from the SS–Ti inter-face, pulse duration, and average power. Samples wereprocessed at offsets of 0, 150, and 300 μm from the SS–Tiinterface toward the Ti plate, pulse durations of ∼2.5, 3.6,and 6.5 ms, and average powers of 300, 525, and 750 W. Fora constant average power and repetition rate, changes in thepulse duration were accompanied by changes in the peakpower in order to maintain constant pulse energy. Weldedsamples were sectioned using wire electrical discharge ma-chining into small samples for cross-section analysis as wellas dog-bone samples for tensile testing. The dog-bone sam-ples were cut to sub-size specimen specifications as definedin ASTM standard #E8-09 [19].
Samples for cross-sectional analysis were ground usingcarbide paper and then polished using alumina slurries.After polishing, the titanium was etched using Kroll'sreagent while the stainless steel was etched using a mixtureof nitric acid, hydrofluoric acid, and water. Composi-tional analysis was performed using EDX and crystalstructure analysis was performed using EBSD. Surfacemorphologies were observed using a scanning electronmicroscope (SEM) and tensile testing was performedusing a uniaxial tensile testing machine operating at across-head speed of 0.1 mm/min.
4 Results and discussion
4.1 Weld geometry
Figure 3 is a typical weld cross-section (yz-plane) for sam-ples processed at an average power of 750 W. The weld pool
Fig. 2 Schematic diagram of welding geometry. Note offset of laserbeam from interface toward Ti sample
472 Int J Adv Manuf Technol (2013) 66:469–479

is observed to be confined to the upper portion of the platesand some variation in symmetry about the original SS–Tiinterface was observed for different laser offsets as expecteddue to the large differences in material properties across theweld interface. The thermal diffusivity for Ti, 6.9e−6 m2/s,is almost twice that of SS, 4.08e−6 m2/s, and Ti also has ahigher melting temperature, 1,665 versus 1,375 °C. Thisrequires a greater amount of heat to be supplied to the Tiin order to ensure it reaches its melting temperature which isachieved through the offset of the laser beam toward the Ti.Samples processed at high powers show greater penetrationand weld size compared to lower powers. The weld cross-section, however, shows that the main weld pool does notreach the bottom of the plates even for the highest powerwelds. The aspect ratio achieved by these welds indicates afusion mechanism rather than a keyhole weld which limitsthe penetration achievable. The top weld surface as ob-served from the cross-section in Fig. 3 is flat and nearlyflush with the base Ti and SS plates. The minimal gapbetween the plates and lack of filler material results in weldpools without any buildup above the surface of the originalplates. This surface morphology is typical of welds per-formed in the conduction welding regime.
4.2 Weld strength
Fracture stress values for samples processed at an averagepower of 750 W with various offsets and pulse durations areshown in Table 1. Load-extension curves acquired duringtensile testing showed no evidence of appreciable plasticdeformation and no necking was observed suggesting pri-marily brittle fracture of the weld joints. Samples processedat the highest average power, 750 W, were chosen foranalysis in this study due to their greater penetration depth.All samples processed at this power fractured at the weldjoint rather than in the base material and fracture occurredcloser to the SS side of the weld zone. Fracture stress valueswere calculated using the maximum load observed duringtensile testing and the fracture surface area (xz-plane)
observed under optical microscopy. The fracture stress val-ues reported in Table 1 show that the weld joints are weakerthan the base metal even when considering their smallercross-sectional area and have a great deal of scatter betweensamples. The strongest samples were able to achieve afailure stress that was ∼60 % of the yield stress of stainlesssteel and ∼35 % of the ultimate tensile strength of titanium.Ideally, the weld itself should be stronger than the basematerial and in the case of dissimilar material welds, shouldbe stronger than the weaker of the two materials beingjoined. Thus, these initial results suggest that further under-standing of the microstructure and failure mechanisms instainless steel to titanium dissimilar material welds is re-quired to form joints of adequate strength.
The lack of necking during tensile testing of the weldsalong with the large scatter in tensile strengths show highsensitivity to initial cracks within the weld and again sug-gests that brittle fracture is the main failure mode. Audiblecracking was noted during cooling of the welds after solid-ification which varied in degree for different processingparameters. Samples processed at the shortest pulse durationof ∼2.5 ms and thus the highest peak power are not included inTable 1 due to extensive cracking of the weld during coolingresulting in failure of the joints. Cracks similar to those shownin the cross-section in Fig. 11 were observed in the weld zonefor a number of laser parameters and were typically orientedperpendicular to the laser scanning direction on the yz-planeand are likely caused by the difference in the coefficients ofthermal expansion between the SS, ∼16e−6 m/m/°C, andTi, ∼9e−6 m/m/°C. After the laser passes, assuming thetwo materials are initially at the same temperature, thestainless steel will undergo a greater degree of contrac-tion than the titanium during cooling. Since the twomaterials are joined, this discrepancy leads to the for-mation of tensile stresses and cracks in the SS side andcompressive stresses in the Ti side of the weld.
I
II
IV
SSScan A
Ti
Scan B
Fig. 3 Typical weld cross-section (yz-plane). Note asymmetry ofweld pool and existence of various microstructures within weldpool. Laser power: 750 W, offset 300 μm, pulse width: 3.7 ms,scan speed: 20 mm/s
Table 1 Failure stresses from tensile tests
Condition Offset(μm)
Pulse duration(ms)
Failure stress(MPa)
1 0 6.5 81.4±72.5
2 150 6.5 41.1±12.0
3 300 6.5 –
4 0 3.6 65.1±2.8
5 150 3.7 –
6 300 3.7 81.0±64.1
7 0 2.5 –
8 150 2.5 –
9 300 2.5 –
Note large variance in strength. Samples with no stress value fracturedupon solidification
Int J Adv Manuf Technol (2013) 66:469–479 473

4.3 Weld pool microstructure and composition
To understand the cause of the low joint strength and highvariability microstructural analysis was performed on thejoints. Several different microstructures are observed in theweld pool in Fig. 3. A distinct layer lines the SS–weld poolinterface, passing through the lower left corner of region I,while further into the melt pool on the SS side, a coarsedendrite-like morphology is observed which extends acrossthe top of the weld pool toward the Ti side. The majority ofthe Ti side of the weld pool shows a finer microstructure.Some indication of joining below the weld zone is seen aswell in region II of the image. Figure 4 shows highermagnification optical micrographs of two sections outlinedin Fig. 3. Dendrites are clearly observed in Fig. 4a, alongwith a layer separating them from the base stainless steel.The existence of dendrites oriented primarily normal to thesolid–liquid interface indicates directional solidificationfrom the interface toward the center of the weld pool.Figure 4b shows the area below the main weld pool and athin melt zone between the two sheets is observed. Sincewelds performed in this study are within the conductionwelding mode, this joining below the main weld pool isconsidered to be caused by heat accumulation at the inter-face resulting in localized melting of the materials or weldpool flow along the interface.
Figure 5 shows an EDX line scan across scan B asdepicted in Fig. 3. While the average compositions acrossthe coarse/fine microstructure boundary are nearly identical,the coarse dendrite structure shows significantly more varia-tion in the composition. The average composition of ∼70 at%Ti, ∼20 at% Fe, and ∼3 at% Cr in addition to small amounts ofNi, Mo, and Mn when considered in the context of the binaryFe–Ti phase diagram suggests formation of a β-Ti/FeTi eu-tectic. Figure 6 shows the composition profile across dendritesin the coarse dendrite region toward the SS side of the weldpool. Clear differentiation between the dendrite and interden-dritic regions is observed in Fig. 6a with the Ti and Fecompositions moving in opposite directions. The averagecomposition of the Ti-rich regions (interdendritic regions)is ∼75 at% Ti and ∼18 at% Fe with the remainder being taken
up by components such as Mo and Cr. The dendritic regionshave a more balanced composition with the Ti compositionnearing ∼50 at% and the Fe composition nearing ∼40 at%.While these two compositions are different from thoseexpected during equilibrium eutectic solidification, it has beenshown that rapid solidification will cause extended solubilityin β-Ti and TiFe [15]. Thus, initial compositional analysissuggests that the dendrites are TiFe and the interdendriticregions are supersaturated β-Ti.
An EBSD surface map of a region containing a coarsedendritic microstructure (region IV in Fig. 3) is shown inFig. 7. The Euler angle map shown in Fig. 7b shows largeregions with similar dendrite growth directions as having thesame orientation. These areas include the darker interden-dritic regions as well. Each of these regions with the samecrystal orientation are considered to be eutectic colonies.Both the dendritic and interdendritic regions show a BCCstructure which when considered in terms of the equilibriumphase diagrams suggests a β-Ti/FeTi mixture. The compo-sition of these dendrites and their interdendrite regions wereshown to be close to TiFe and β-Ti, respectively. Both ofthese phases have a BCC crystal structure. The observationof BCC structure through EBSD is further evidence thatthese structures are in fact TiFe dendrites in a supersaturatedβ-Ti matrix.
V
(b) (a) Fig. 4 Optical micrographs ofregions a I and b II from Fig. 3.Note coarse dendritic structurein region I and joining in theform of a thin molten layer inregion II
Ti
Fe
Cr
Fig. 5 EDX line scan across SS–Ti interface (scan B in Fig. 3). Notedifference in composition uniformity across interface
474 Int J Adv Manuf Technol (2013) 66:469–479

A line scan EDX profile across the lower portion of theweld interface (scan A in Fig. 3) is shown in Fig. 8 andclearly shows the existence of a mixed layer at the interfacewith a composition between that of pure SS and pure Ti. Thecomposition abruptly changes at the SS interface while thetransition is more gradual on the Ti side of the joint. This isdue to the higher diffusivity of Fe and Cr into Ti than Ti intoSS [20]. When Fe and Cr diffuse into the Ti side of the joint,they will be dissolved into Ti to form a solid solution. Thissolution layer adjacent to the Ti has a gradual variation in Fecontent. With further diffusion of Fe, it will reach its solu-bility limit in Ti, and then the compound FeTi will start toform according to the Fe–Ti phase diagram in Fig. 1. Sincediffusion occurred between the multi-component alloy SSand pure Ti, a pure FeTi layer would not be formed. Instead,a mixture of FeTi and Ti-based solid solution will be pro-duced. The mixed zone is observed to also have a similarcomposition to that observed in the dendritic regions of theweld pool as discussed above. This again suggests a mixtureof FeTi and β-Ti in this region; however, no significantfluctuations in composition are observed across the interfaceor along the interface in the z-direction (not shown). If FeTiregions were to exist in this region, a similar profile to thatobserved in Fig. 6 would be expected. As discussed above,extended solubility of Fe in the β-Ti structure has beenshown to occur for high cooling rates such as those experi-enced during laser welding [15]; however within the mainweld pool, dendrites of TiFe were seen to form. Thus, thecooling rate in the lower section of the weld must be signif-icantly higher such that a single-phase region is formed from
a eutectic composition. This high cooling rate is likely dueto the thin film-like geometry of the molten zone with athickness of roughly 4 μm. The large surface area connect-ing the molten material to the surrounding solid on bothsides of the interface and the limited volume of moltenmaterial would allow for a significant increase in the coolingrate within this region and the formation of non-equilibriummicrostructures and phases.
Figure 9 shows EBSD scans of an area where a layeredstructure is observed in the weld pool (region V in Fig. 4b).The lighter-colored region on the left of Fig. 9a was deter-mined by EDX to be a nearly equiatomic Ti–Fe layer andthe darker colored region a ∼70 at% Ti layer that extendsfrom the bottom of the main melt pool toward the bottom ofthe joint. Figure 9b is a structure map of the same regionwith BCC-structured regions colored red and HCP-structured regions colored green. The layer closer to theSS side of the weld exhibits an HCP structure while thelayer closer to the Ti side of the weld shows a BCC struc-ture. The BCC structure, along with the homogeneous com-position of roughly 70 at% Ti and 20 at% Fe suggests thatthis layer is comprised of β-Ti grains supersaturated withFe. As discussed above, the adjacent HCP layer has acomposition which, at equilibrium, would form a mixtureof FeTi and TiFe2 (λ-Laves). The observation of a hexago-nal structure through EBSD suggests that this layer consistsprimarily of TiFe2.
Phase development curves for materials with similarcompositions to those observed in the aforementioned layersmodeled using CALPHAD techniques are shown in
Fe
Ti
Cr
(a) (b) Fig. 6 EDX line scan acrosscoarse dendrites observed oncross-section (yz-plane). Notehigher Ti content in interden-drite regions
(a) (b)Fig. 7 EBSD scan of area IV inFig. 3. a SEM scan showingdendritic structure and EBSDmeasured area (outlined). bEuler angle map of measuredarea from a showing variouscrystal orientations withineutectic colonies
Int J Adv Manuf Technol (2013) 66:469–479 475

Fig. 10a, b. Figure 10a shows the mole fraction of phasespresent in a material with a composition of 18.19 % Fe,74.00 % Ti, 4.53 % Cr, 1.38 % Ni, 1.66 % Mn, and 0.23 at%Mo, as a function of temperature. This composition is verysimilar to that observed in the Ti-rich interfacial layer as wellas in the main weld pool as determined through EDX. Themodel suggests that the first phase to form at roughly 1250 °Cis BCC or β-Ti. Once the temperature has reached ∼900 °Cthe intermetallic phase, FeTi, starts to form. In the main weldpool a microstructure consisting of TiFe dendrites within a β-Ti matrix was observed. This phase mixture is consistent withthat predicted by the CALPHAD model at this composition.The Ti-rich interfacial layer showed a BCC structure and ahomogeneous Ti-rich composition. The lack of TiFe in thislayer is considered to be due to the high quench rate experi-enced by the thin interfacial layer during solidification. As themodel shows, even at equilibrium, theβ-Ti begins to form at atemperature over 300 °C above FeTi. At high quench rates, ithas been shown that TiFe may not have time to nucleate andgrow resulting in a single-phase region near the eutecticcomposition [15].
Figure 10b shows the mole fraction of phases present in amaterial with a composition of 37.00 % Fe, 46.59 % Ti,10.70 % Cr, 2.95 % Ni, 2.47 % Mn, and 0.29 at% Mo as afunction of temperature. This composition is very similar tothat observed in the near-equiatomic layer toward the SSside of the joint in Fig. 4b. The model predicts the initial
Ti
Fe
Cr
Fig. 8 EDX line scan across SS–Ti interface (scan A in Fig. 3). Notehomogeneous composition within weld zone and significant diffusionof Fe and Cr into Ti
(a) (b) Fig. 9 EBSD scan of area V inFig. 4b. a SEM scan showinglayered structure as well asEBSD measured area(outlined). b Structure map ofmeasured area with redindicating BCC and greenindicating HCP structures
Fig. 10 Simulation results for mole fraction of phases for a 18.19 %Fe, 74.00 % Ti, 4.53 % Cr, 1.38 % Ni, 1.66 % Mn, and 0.23 at% Mo;and b 37.00 % Fe, 46.59 % Ti, 10.70 % Cr, 2.95 % Ni, 2.47 % Mn, and0.29 at% Mo regions
476 Int J Adv Manuf Technol (2013) 66:469–479
formation of the Laves phase, TiFe2 with FeTi forming at atemperature a few hundred degrees lower. Thus the exis-tence of predominantly TiFe2 in the near-equiatomic inter-facial layer is consistent with the CALPHAD model and islikely due to the high quench rate in the lower weld zone.The material in this section does not have sufficient time forTiFe formation during solidification.
4.4 Fracture surface analysis
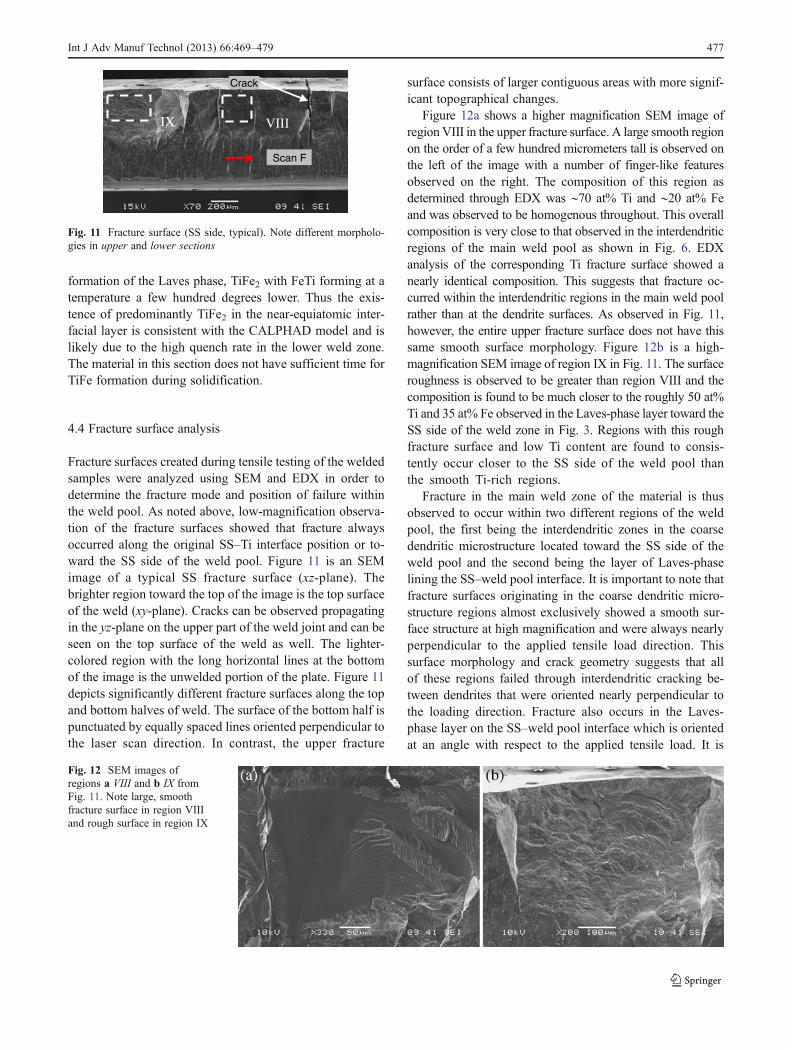
Fracture surfaces created during tensile testing of the weldedsamples were analyzed using SEM and EDX in order todetermine the fracture mode and position of failure withinthe weld pool. As noted above, low-magnification observa-tion of the fracture surfaces showed that fracture alwaysoccurred along the original SS–Ti interface position or to-ward the SS side of the weld pool. Figure 11 is an SEMimage of a typical SS fracture surface (xz-plane). Thebrighter region toward the top of the image is the top surfaceof the weld (xy-plane). Cracks can be observed propagatingin the yz-plane on the upper part of the weld joint and can beseen on the top surface of the weld as well. The lighter-colored region with the long horizontal lines at the bottomof the image is the unwelded portion of the plate. Figure 11depicts significantly different fracture surfaces along the topand bottom halves of weld. The surface of the bottom half ispunctuated by equally spaced lines oriented perpendicular tothe laser scan direction. In contrast, the upper fracture
surface consists of larger contiguous areas with more signif-icant topographical changes.
Figure 12a shows a higher magnification SEM image ofregionVIII in the upper fracture surface. A large smooth regionon the order of a few hundred micrometers tall is observed onthe left of the image with a number of finger-like featuresobserved on the right. The composition of this region asdetermined through EDX was ∼70 at% Ti and ∼20 at% Feand was observed to be homogenous throughout. This overallcomposition is very close to that observed in the interdendriticregions of the main weld pool as shown in Fig. 6. EDXanalysis of the corresponding Ti fracture surface showed anearly identical composition. This suggests that fracture oc-curred within the interdendritic regions in the main weld poolrather than at the dendrite surfaces. As observed in Fig. 11,however, the entire upper fracture surface does not have thissame smooth surface morphology. Figure 12b is a high-magnification SEM image of region IX in Fig. 11. The surfaceroughness is observed to be greater than region VIII and thecomposition is found to be much closer to the roughly 50 at%Ti and 35 at% Fe observed in the Laves-phase layer toward theSS side of the weld zone in Fig. 3. Regions with this roughfracture surface and low Ti content are found to consis-tently occur closer to the SS side of the weld pool thanthe smooth Ti-rich regions.
Fracture in the main weld zone of the material is thusobserved to occur within two different regions of the weldpool, the first being the interdendritic zones in the coarsedendritic microstructure located toward the SS side of theweld pool and the second being the layer of Laves-phaselining the SS–weld pool interface. It is important to note thatfracture surfaces originating in the coarse dendritic micro-structure regions almost exclusively showed a smooth sur-face structure at high magnification and were always nearlyperpendicular to the applied tensile load direction. Thissurface morphology and crack geometry suggests that allof these regions failed through interdendritic cracking be-tween dendrites that were oriented nearly perpendicular tothe loading direction. Fracture also occurs in the Laves-phase layer on the SS–weld pool interface which is orientedat an angle with respect to the applied tensile load. It is
VIII IX
Scan F
Crack
Fig. 11 Fracture surface (SS side, typical). Note different morpholo-gies in upper and lower sections
Fig. 12 SEM images ofregions a VIII and b IX fromFig. 11. Note large, smoothfracture surface in region VIIIand rough surface in region IX
Int J Adv Manuf Technol (2013) 66:469–479 477

considered that in regions where fracture is observed in theLaves phase, the TiFe dendrites are primarily oriented par-allel to the tensile loading direction resulting in greaterstrength.
A high-magnification SEM image of the lower fracturesurface from Fig. 11 is shown in Fig. 13. The surfaceappears rougher than that observed in the interdendriticfracture surfaces in the main weld pool suggesting a differ-ent fracture mechanism is active in this region. Figure 14a isan EDX line scan performed across the lower interface inthe x-direction (scan F in Fig. 11). The composition is seento fluctuate significantly within this scan and small sectionswith the same composition are observed. Upon careful anal-ysis, it is found that the composition changes at each verticalline is between Ti rich and Fe rich suggesting that eitherdifferent phases are formed alternately along the x-directionor that there are height differences between the differentsections.
Figure 14b is a topographical line profile obtained alongscan F in Fig. 11 through optical profilometry. The profileshows significant topographic variation along the laser scandirection with a period very similar to that observed in thecomposition profile in Fig. 14a. The vertical lines observedin the SEM images are considered to be cracks in the yz-
plane which separate regions located closer to the SS and Tisides of the thin melt zone. This structure can be understoodin the context of Fig. 8, the compositional profile across thelower weld pool interface. As discussed previously, thecomposition within the lower weld pool is homogeneous.The two main compositions observed on the lower fracturesurface (Fig. 14a) are ∼70 at% Ti/20 at% Fe and ∼20 at% Ti/60 at% Fe. In Fig. 8, these two compositions occur atdifferent locations. The ∼70 at% Ti composition occursacross the entire weld pool while the ∼60 at% Fe composi-tion only occurs at the interface between the base SS and theweld pool. When considered in the context of Fig. 14bwhich shows a height difference between adjacent surfacesof roughly 8 μm which is on the order of the width of thelower weld pool, it is likely that fracture is occurring alter-nately on the SS–weld and Ti–weld interfaces. Movement ofthe crack between the SS–weld and Ti–weld interfaces maybe due to cracks formed by thermal stresses during coolingof the dissimilar weld joint.
5 Conclusion
Laser fusion-welded dissimilar joints between stainless steel316 and titanium grade 2 have been investigated as a sim-plified model for the NiTi—stainless steel dissimilar mate-rial pair. While joints between the two materials reachingroughly 60 % of the yield stress of stainless steel wereformed, the variability in joint strengths and brittle natureof the welds were found to be limitations on the fusionwelding of this dissimilar material pair. EDX and EBSDanalysis indicated the formation of coarse intermetallic TiFedendrites within a β-Ti matrix in the main weld pool andsingle-phase supersaturated β-Ti(Fe) of the same averagecomposition in the lower weld zone. Fracture surface anal-ysis shows that smooth interdendritic fracture between den-drites oriented perpendicular to the tensile load is thepredominant mechanism of failure in the main weld pool,while alternating failure along the SS–weld and Ti–weld
Fig. 13 SEM image of lower fracture surface in Fig. 11. Note verti-cally oriented cracks formed through grains and surface indicative ofcleavage fracture
Fe
Ti
Cr
(a) (b)Fig. 14 a EDX compositionprofile and b topographicprofile across lower fracturesurface (scan F in Fig. 11).Abrupt changes in compositionand height coincide with theperiodic vertical crack-likefeatures
478 Int J Adv Manuf Technol (2013) 66:469–479

interfaces was observed in the lower weld zone. Significant-ly greater surface area formation was observed in the lowerportion of the weld suggesting that the single-phase super-saturated β-Ti(Fe) structure may be beneficial for fractureresistance. This non-equilibrium phase formed below themain weld pool where high cooling rates inhibited thegrowth of dendritic structures. Thus, further increasing thecooling rate experienced within the entire weld joint throughdecreases in weld pool size, greater heat localization, andexternal cooling is considered to be a promising approachfor creating robust dissimilar metal welds between titaniumand stainless steel.
Acknowledgment The authors would like to acknowledge Prof.James S. Im of the Materials Science Program in the Department ofApplied Physics and Applied Mathematics at Columbia University andthe Materials Research Science and Engineering Center, ColumbiaUniversity for the use of their equipment.
Conflict of interest The authors declare that they have no conflict ofinterest.
References
1. Bauer I, Russek UA, Herfurth HJ, Witte R, Heinemann S, NewazG, Mian A, Georgiev D, Auner GW (2004) “Laser microjoining ofdissimilar and biocompatible materials,” Proceedings of SPIE, pp.454–464
2. Ghosh M, Chatterjee S (2005) Effect of interface microstructure onthe bond strength of the diffusion welded joints between titaniumand stainless steel. Mater Charact 54(4–5):327–337
3. Lee MK, Lee JG, Choi YH, Kim DW, Rhee CK, Lee YB, Hong SJ(2010) Interlayer engineering for dissimilar bonding of titanium tostainless steel. Mater Lett 64(9):1105–1108
4. Li M, Sun D, Qiu X, Liu J, Miao K, Wu W (2007) Effects of silverbased filler metals on microstructure and properties of laser brazed
joints between TiNi shape memory alloy and stainless steel. SciTechnol Weld Join 12(2):183–189
5. Ghosh M, Chatterjee S (2002) Characterization of transition jointsof commercially pure titanium to 304 stainless steel. Mater Charact48(5):393–399
6. Raghavan V (1987) Phase diagrams of ternay iron alloys. ASMInternational, Metals Park
7. Sun Z, Ion JC (1995) Review laser welding of dissimilar metalcombinations. J Mater Sci 30:4205–4214
8. Vollertsen F, Grupp M (2005) Laser beam joining of dissimilar thinsheet materials. Steel Res Int 76(2):240–244
9. Li MG, Sun DQ, Qiu XM, Yin SQ (2006) Corrosion behavior ofthe laser-brazed joint of TiNi shape memory alloy and stainlesssteel in artificial saliva. Mater Sci Eng, A 441:271–277
10. Kundu S, Ghosh M, Laik A, Bhanumurthy K, Kale G, Chatterjee S(2005) Diffusion bonding of commercially pure titanium to 304stainless steel using copper interlayer. Mater Sci Eng, A 407(1–2):154–160
11. Graff K (2005) New developments in advanced welding. WoodheadPublishing, Cambridge
12. Yu C, Wu MF, Lu H (2006) Factors influencing formation andgrowth of coarse Ti–Fe compound in Ti–Fe eutectic reaction. SciTechnol 11(3):265–271
13. Louzguine-Luzgin DV, Louzguina-Luzgina LV, Kato H, Inoue A(2005) Non-equilibrium Ti–Fe bulk alloys with ultra-high strengthand enhanced ductility. Mater Res Soc Symp Proc 851:3–8
14. Polmear I (2005) Light alloys. Butterworth-Heinemann, Oxford15. Ray R (1972) The constitution of metastable titanium-rich
Ti–Fe alloys: an order–disorder transition. Metall Trans 126(3):362–629
16. Gordon P (1983) Principles of phase diagrams in materials sys-tems. Robert E. Krieger Publishing Company, Malabar
17. Jansson B (1993) The thermo calc project. Thermochim Acta 214(1):93–96
18. Ely KJ (2001) Conduction welding, handbook of laser materialsprocessing. Magnolia Publishing, Orlando, pp 354–357
19. ASTM (2009) Standard test methods for tension testing of metallicmaterials. ASTM International, West Conshohocken
20. Kale GB, Patil RV, Gawade PS (1998) Interdiffusion studiesin titanium-304 stainless steel system. J Nucl Mater 257(May):44–50
Int J Adv Manuf Technol (2013) 66:469–479 479