strength in stability - canaccord genuity · strength in stability our efforts to increase...
TRANSCRIPT

2018 ANNUAL REPORT
Strength in Stability
FRUKUS UAEAUCA
CA
NA
CC
OR
D G
EN
UITY
GR
OU
P IN
C. 2
01
8 A
NN
UA
L RE
PO
RT
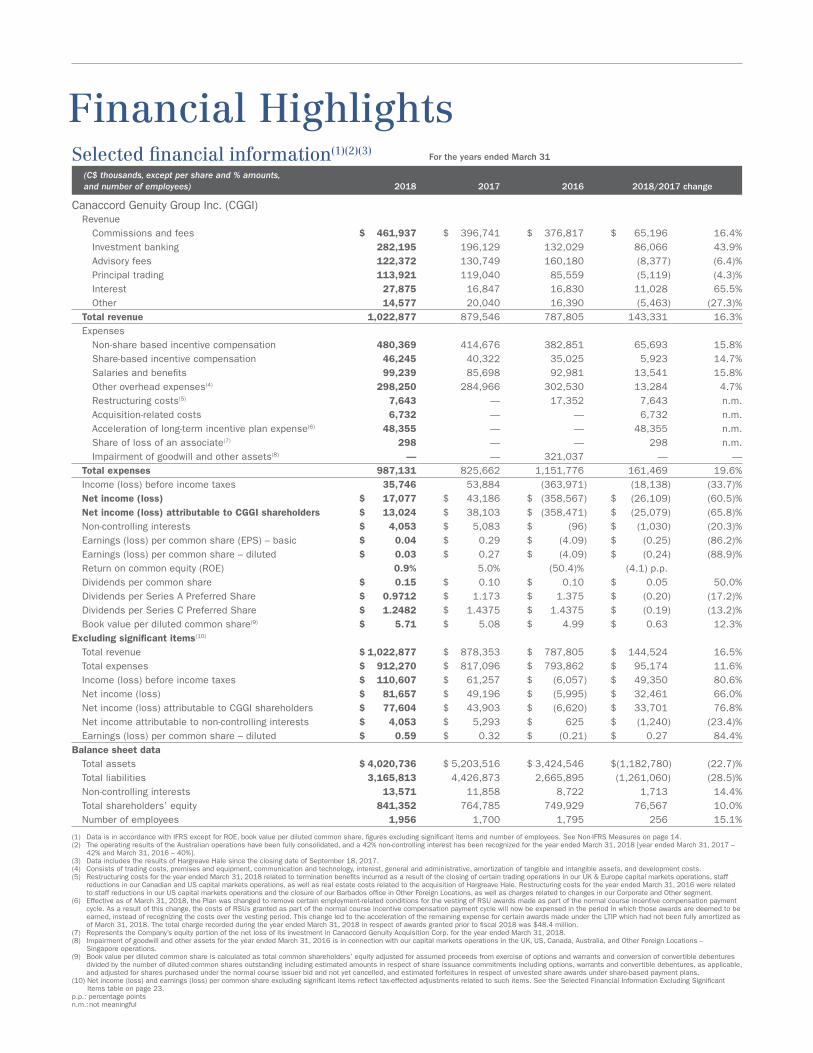
Financial HighlightsSelected financial information(1)(2)(3)
For the years ended March 31
(C$ thousands, except per share and % amounts, and number of employees)
2018
2017
2016
2018/2017 change
Canaccord Genuity Group Inc. (CGGI) Revenue Commissions and fees $ 461,937 $ 396,741 $ 376,817 $ 65,196 16.4% Investment banking 282,195 196,129 132,029 86,066 43.9% Advisory fees 122,372 130,749 160,180 (8,377) (6.4)% Principal trading 113,921 119,040 85,559 (5,119) (4.3)% Interest 27,875 16,847 16,830 11,028 65.5% Other 14,577 20,040 16,390 (5,463) (27.3)% Total revenue 1,022,877 879,546 787,805 143,331 16.3% Expenses Non-share based incentive compensation 480,369 414,676 382,851 65,693 15.8% Share-based incentive compensation 46,245 40,322 35,025 5,923 14.7% Salaries and benefits 99,239 85,698 92,981 13,541 15.8% Other overhead expenses(4) 298,250 284,966 302,530 13,284 4.7% Restructuring costs(5) 7,643 — 17,352 7,643 n.m. Acquisition-related costs 6,732 — — 6,732 n.m. Acceleration of long-term incentive plan expense(6) 48,355 — — 48,355 n.m. Share of loss of an associate(7) 298 — — 298 n.m. Impairment of goodwill and other assets(8) — — 321,037 — — Total expenses 987,131 825,662 1,151,776 161,469 19.6% Income (loss) before income taxes 35,746 53,884 (363,971) (18,138) (33.7)% Net income (loss) $ 17,077 $ 43,186 $ (358,567) $ (26,109) (60.5)% Net income (loss) attributable to CGGI shareholders $ 13,024 $ 38,103 $ (358,471) $ (25,079) (65.8)% Non-controlling interests $ 4,053 $ 5,083 $ (96) $ (1,030) (20.3)% Earnings (loss) per common share (EPS) – basic $ 0.04 $ 0.29 $ (4.09) $ (0.25) (86.2)% Earnings (loss) per common share – diluted $ 0.03 $ 0.27 $ (4.09) $ (0.24) (88.9)% Return on common equity (ROE) 0.9% 5.0% (50.4)% (4.1) p.p. Dividends per common share $ 0.15 $ 0.10 $ 0.10 $ 0.05 50.0% Dividends per Series A Preferred Share $ 0.9712 $ 1.173 $ 1.375 $ (0.20) (17.2)% Dividends per Series C Preferred Share $ 1.2482 $ 1.4375 $ 1.4375 $ (0.19) (13.2)% Book value per diluted common share(9) $ 5.71 $ 5.08 $ 4.99 $ 0.63 12.3%Excluding significant items(10)
Total revenue $ 1,022,877 $ 878,353 $ 787,805 $ 144,524 16.5% Total expenses $ 912,270 $ 817,096 $ 793,862 $ 95,174 11.6% Income (loss) before income taxes $ 110,607 $ 61,257 $ (6,057) $ 49,350 80.6% Net income (loss) $ 81,657 $ 49,196 $ (5,995) $ 32,461 66.0% Net income (loss) attributable to CGGI shareholders $ 77,604 $ 43,903 $ (6,620) $ 33,701 76.8% Net income attributable to non-controlling interests $ 4,053 $ 5,293 $ 625 $ (1,240) (23.4)% Earnings (loss) per common share – diluted $ 0.59 $ 0.32 $ (0.21) $ 0.27 84.4%Balance sheet data Total assets $ 4,020,736 $ 5,203,516 $ 3,424,546 $ (1,182,780) (22.7)% Total liabilities 3,165,813 4,426,873 2,665,895 (1,261,060) (28.5)% Non-controlling interests 13,571 11,858 8,722 1,713 14.4% Total shareholders’ equity 841,352 764,785 749,929 76,567 10.0% Number of employees 1,956 1,700 1,795 256 15.1%
(1) Data is in accordance with IFRS except for ROE, book value per diluted common share, figures excluding significant items and number of employees. See Non-IFRS Measures on page 14.(2) The operating results of the Australian operations have been fully consolidated, and a 42% non-controlling interest has been recognized for the year ended March 31, 2018 [year ended March 31, 2017 –
42% and March 31, 2016 – 40%].(3) Data includes the results of Hargreave Hale since the closing date of September 18, 2017.(4) Consists of trading costs, premises and equipment, communication and technology, interest, general and administrative, amortization of tangible and intangible assets, and development costs. (5) Restructuring costs for the year ended March 31, 2018 related to termination benefits incurred as a result of the closing of certain trading operations in our UK & Europe capital markets operations, staff
reductions in our Canadian and US capital markets operations, as well as real estate costs related to the acquisition of Hargreave Hale. Restructuring costs for the year ended March 31, 2016 were related to staff reductions in our US capital markets operations and the closure of our Barbados office in Other Foreign Locations, as well as charges related to changes in our Corporate and Other segment.
(6) Effective as of March 31, 2018, the Plan was changed to remove certain employment-related conditions for the vesting of RSU awards made as part of the normal course incentive compensation payment cycle. As a result of this change, the costs of RSUs granted as part of the normal course incentive compensation payment cycle will now be expensed in the period in which those awards are deemed to be earned, instead of recognizing the costs over the vesting period. This change led to the acceleration of the remaining expense for certain awards made under the LTIP which had not been fully amortized as of March 31, 2018. The total charge recorded during the year ended March 31, 2018 in respect of awards granted prior to fiscal 2018 was $48.4 million.
(7) Represents the Company’s equity portion of the net loss of its investment in Canaccord Genuity Acquisition Corp. for the year ended March 31, 2018. (8) Impairment of goodwill and other assets for the year ended March 31, 2016 is in connection with our capital markets operations in the UK, US, Canada, Australia, and Other Foreign Locations –
Singapore operations.(9) Book value per diluted common share is calculated as total common shareholders’ equity adjusted for assumed proceeds from exercise of options and warrants and conversion of convertible debentures
divided by the number of diluted common shares outstanding including estimated amounts in respect of share issuance commitments including options, warrants and convertible debentures, as applicable, and adjusted for shares purchased under the normal course issuer bid and not yet cancelled, and estimated forfeitures in respect of unvested share awards under share-based payment plans.
(10) Net income (loss) and earnings (loss) per common share excluding significant items reflect tax-effected adjustments related to such items. See the Selected Financial Information Excluding Significant Items table on page 23.
p.p.: percentage pointsn.m.: not meaningful

CANACCORD GENUITY GROUP INC. | 2018 ANNUAL REPORT 1
ABOUT CANACCORD GENUITY GROUP INC.Through its principal subsidiaries, Canaccord Genuity Group Inc. (the Company) is a leading independent, full-service financial services firm, with operations in two principal segments of the securities industry: wealth management and capital markets. Since its establishment in 1950, the Company has been driven by an unwavering commitment to building lasting client relationships. We achieve this by generating value for our individual, institutional and corporate clients through comprehensive investment solutions, brokerage services and investment banking services. The Company has wealth management offices located in Canada, the UK, Guernsey, Jersey, the Isle of Man and Australia. Canaccord Genuity, the international capital markets division, operates in North America, the UK & Europe, Asia, Australia and the Middle East. To us there are no foreign markets.™
Canaccord Genuity Group Inc. is publicly traded under the symbol CF on the TSX.
CONTENTS
Introduction 1
Global Performance 2
Letter to Shareholders 4
Letter from the Executive Chairman 7
Canaccord Genuity Wealth Management 8
Canaccord Genuity 10
Our Culture 12
MD&A and Financials 13
Shareholder Information Inside Back Cover
Fiscal 2018 was a pivotal year for our organization. We substantially increased scale in our global wealth management operations and extracted greater value from our global capital markets businesses. As we continue to advance our position as a dominant independent capital markets and wealth management firm in all of the regions where we operate, our efforts will always be centred on expanding our client relationships and increasing the value of our business for our shareholders.
Diluted Earnings (Loss) per Share(1) (C$, excluding significant items, fiscal years)
Revenue (C$ millions, fiscal years)
2018
2017
2016
2015
2014
$1,022.9
$879.5
$880.8
$787.8
$855.2
Net Income (Loss)(1) (C$ millions, excluding significant items, fiscal years)
2018
2017
2016
2015
2014
$81.7
$49.2
$39.3
($6.0)
$68.8
2018
2017
2016
2015
2014
$0.59
$0.32
$0.25
($0.21)
$0.54
Strength in Stability
(1) Figures excluding significant items are non-IFRS measures. See Non-IFRS Measures on page 14.

Global Performance
STRENGTH IN STABILITY
Our efforts to increase stability across our business have helped us to deliver enhanced outcomes for our clients, making us a stronger competitor in everything that we do.
$1.0 billionRecord revenue
for fiscal 2018
60% of fiscal 2018 EPS(1) from global wealth managementImportant contributor of
stable, recurring revenue
growth
$0.59 in fiscal 2018 diluted earnings per share(1)
Driving stronger returns
for our shareholders
61% of fiscal 2018 revenue from outside of CanadaGlobal platform provides
opportunities to benefit
from activity in all our
geographies
66% pre-tax net income(1) improvement in fiscal 2018Improved business mix
is driving earnings power
$575.6 million in working capitalWell capitalized for
continued investment
in our key priorities
(1) These figures exclude significant items. Figures excluding significant items are non-IFRS measures. See Non-IFRS Measures on page 14.
2 CANACCORD GENUITY GROUP INC. | 2018 ANNUAL REPORT

Fiscal 2018 Revenue by Division Geographic Distribution of Revenue(2) (Percent of total fiscal year revenue)
2018
2017
2016
2015
2014
Total Expenses (C$ millions, excluding significant items, non-IFRS and
non-GAAP , fiscal years)
2018
2017
2016
2015
2014
$912.3
$817.1
$827.5
$793.9
$770.6
Total Expenses as a Percent of Revenue (Excluding significant items, non-IFRS and non-GAAP,
fiscal years)
2018
2017
2016
2015
2014
89%
93%
94%
101%
90%
Canaccord Genuity(1) 62%
Canaccord Genuity
Wealth Management 36%
Corporate and Other 2%
(1) Includes Australia Wealth Management.
Canada
Australia
US
UK, Europe & Dubai
Other Foreign Locations
Driving earnings power by transforming our business mix and growing global wealth management
(2) Commencing in Q3/17, the operating results of our Australian operations are disclosed separately as Canaccord Genuity – Australia, and the operating results of Canaccord Genuity (Dubai) are included as Canaccord Genuity UK, Europe & Dubai. In previous quarters, the operating results have been reported as Other Foreign Locations. Comparatives for all prior periods have been reclassified.
CANACCORD GENUITY GROUP INC. | 2018 ANNUAL REPORT 3

Fellow Shareholders,
Fiscal 2018 was a good year for Canaccord Genuity Group Inc. Total firm-wide revenue surpassed $1 billion for the first time in our Company’s history. Excluding significant items(1), we delivered earnings per share of $0.59, an improvement of 84% compared to a year ago.
Throughout the year, we made excellent progress against our objectives: we achieved significant growth in our global wealth management operations and improved market share across our capital markets operations. Because of these efforts, we delivered solid financial results and set new benchmarks for our businesses.
Our strategic shift to strengthening contributions from our global wealth
management businesses has positioned this segment to deliver a significantly higher contribution to our overall profitability.
Total client assets grew to $61.3 billion, a year-over-year improvement of 59%. Excluding significant items, our global wealth management operations contributed 49% of the total pre-tax net income for our combined operating businesses for the fiscal year, in line with our stated goal. We have begun to break out our earnings per share(2) by business segment, and excluding significant items, we estimate that our global wealth management business contributed $0.36 in fiscal 2018, with the remaining $0.23 contributed by our global capital markets operation.
The most substantial contribution to this growth came from our expanded UK & Europe wealth management business, which contributed record revenue of $201.4 million for the year. With the closing of our acquisition of Hargreave Hale in September, we have been privileged to welcome over 200 new employees and more than 14,000 new clients, and we are making excellent progress with our integration efforts. Now a top 10 wealth manager in the UK with £24.8 billion in client assets, our teams are leveraging synergies across their expanded platform to deliver impressive asset and related revenue growth, while strengthening our national footprint across the UK.
We also achieved significant growth in our Canadian wealth management business. With a platform that welcomes and embraces established and entrepreneurial financial advisors, we have added Investment Advisory teams and new clients representing over $5.0 billion in assets since we began our recruiting efforts in 2016 and have meaningfully strengthened our competitive position as a leading independent wealth management business in Canada. Total assets under administration and management increased by 18% from a year ago, to $15.6 billion. Excluding significant items, this business contributed pre-tax net income of $20.2 million to our overall results.
A supportive backdrop for growth stocks allowed us to reinforce our market
position as a leading independent investment bank and advisory firm for mid-market growth companies.
Our global capital markets division was a major contributor to our firm-wide revenue growth in fiscal 2018 with a record revenue result of $637.5 million.
Despite the market being punctuated by periods of elevated volatility during fiscal 2018, our investment banking segment performed well. A healthy environment for capital raising activity in our core focus sectors – particularly during the second half of our fiscal year – led to a 39% year-over-year increase in revenues for this segment.
Our Canadian operation ended the fiscal year as the dominant independent investment bank in the country for both number of transactions and total amount raised. Revenue generated through investment banking activities in this business nearly doubled over the 12-month period to $125.1 million.
Letter to Shareholders
STRENGTH IN STABILITY
4 CANACCORD GENUITY GROUP INC. | 2018 ANNUAL REPORT
(1) Figures excluding significant items are non-IFRS measures. See Non-IFRS Measures on page 14.(2) Based on management estimates including certain assumptions made in respect of allocations
of taxes, non-direct costs and expenses.

An environment of growing earnings and elevated equity valuations led to a general trend of larger deal size across our advisory business, and we serviced increasing demand for independent advice that is free from conflict. We also experienced strong flows across our institutional equities business. Despite a softer trading environment, our US equities business continued to gain market share and the International Equities Group delivered continued growth. We anticipate that the acquisition of Jitneytrade and its related technology business, Finlogik Inc., will further strengthen our market share as the leading independent trader in Canada and provide access to new areas of growth through the development of fintech solutions for our capital markets and wealth management divisions.
Our efforts to intensify our focus on our core capabilities in our US capital markets division led to improved profitability in fiscal 2018. Excluding significant items, pre-tax net income in this business grew to $5.4 million over the year, while the total revenue contribution was in line with prior periods. Our teams in the UK, Europe & Dubai have continued to be productive on several notable investment banking and advisory mandates, and, despite a slow start to the year, delivered positive results for the last three consecutive quarters.
And finally, our Australian capital markets business delivered another strong performance. Despite the brief loss of momentum for growth stocks early in the year, an improved market backdrop allowed this business to deliver a record revenue result in the second half of the fiscal year. I am also very pleased that our increased investment in this operation supports our objective of more closely aligning this business with our global platform and exploring opportunities to grow our wealth management business in the region. Since our initial investment in 2011, this operation has steadily increased its contributions to our overall group results, and we look forward to capturing a greater share of this growth for our shareholders. By increasing share ownership among our partners and employees in Australia, we more closely align their incentives with the performance of the organization.
Our efforts to better focus and align our operations have allowed us to
strengthen our operating leverage and extract greater value from our business in any market environment.
Revenue per employee in our global capital markets business has improved by 38% since we began our realignment initiatives in fiscal 2016, a reflection of our efforts to capture greater efficiencies from our existing infrastructure while improving our execution capabilities. By strengthening collaboration across regions, we have been able to drive incremental revenue growth and harness opportunities to lead the market in emerging high growth sectors such as cannabis and blockchain.
We have continued to manage our fixed costs, leaving our business increasingly better positioned to generate meaningful
profits. Despite higher costs related to the expansion of our UK & Europe wealth management business and the increased activity across our capital markets operations, excluding significant items, our firm-wide expense ratio decreased by 3.8 percentage points over the fiscal year.
We have also improved our technological and operational infrastructure with a focus on strengthening the security and stability of our platform and ensuring compliance with an increasingly complex regulatory environment. Our enhanced back-office support capabilities provide us with the flexibility to continue adding scale across our wealth management operations while positioning our capital markets business to move swiftly into new areas of growth.
In keeping with our stated intention to review every aspect of our business with a view to improving long term value for our shareholders, we took steps to better align our compensation strategy with the performance of the business, shifting performance goals from a revenue basis to a longer term profitability basis. A significant portion of certain senior officers’ compensation will be in the form of Performance Share Units (PSUs), whose future payout will be conditioned on achievement of predetermined multi-year, market-based and financial performance metrics.
With an effective date of March 31, 2018, we made certain non-substantive changes to the Company’s long-term incentive plan, which governs our share-based awards program. These changes had the effect of causing a change in the method of expensing these awards so that they are now expensed in the period they are deemed to be earned rather than over the vesting period. With this accounting change, the cost of share-based awards granted in respect of fiscal 2018, as well as the unamortized expense as at March 31, 2018 of outstanding awards granted prior to fiscal 2018, was expensed in the fourth quarter of fiscal 2018. This change did not affect awards made in connection with new hires or for retention purposes, and the cost of those awards will continue to be recognized over the vesting period. The cost of awards granted prior to fiscal 2018 that was expensed in the current year was $48.4 million. This amount has been treated as a significant item for purposes of determining our adjusted (i.e., excluding significant items) fourth quarter and fiscal 2018 results. Share-based awards are generally covered through shares held in employee benefit trusts, so this change in accounting treatment does not have an impact on cash, book value or capital.
Others within the industry treat their share-based awards on a similar basis, and we believe this treatment provides greater transparency of our financial results and more closely aligns our revenues and expenses in reporting periods. Going forward, the share-based award expense recognized in each period will reflect only the cost of awards earned in respect of that period as well as the amortized cost of new hire and retention-based awards applicable to that period.
CANACCORD GENUITY GROUP INC. | 2018 ANNUAL REPORT 5

The strong performance we achieved this year reflects hard work and
diligence by all of our employees, who upheld our core values of entrepreneurialism, independence and partnership.
Our results for this fiscal year are indicative of the continued momentum in our business as we solidify our position as the dominant mid-market investment bank and wealth management firm in the regions where we operate. I believe that a significant market share opportunity exists across our businesses, and I am confident that Canaccord Genuity is best positioned versus our peers to capture this share.
We will continue to focus on key sectors of the global growth economy, because it’s what we do best. At the same time, we continue to make disciplined investments in our business, broadening our technological capability and further developing our digital offerings.
Looking ahead, I believe that our business is appropriately scaled to take advantage of market opportunities while allowing us to exceed our clients’ expectations in a range of market environments. The volatility that shocked the market toward the end of our fiscal year served as an important reminder that the markets are not always going to be predictable, and reinforced the value of maintaining liquidity in our business and being prepared for developments outside of our control.
I would like to thank our Board of Directors for their guidance throughout this pivotal year for our organization. And to you, our valued shareholders, I thank you for your continued support and would like to remind you that the values that drive our decisions are shared by all our employees, partners and directors. Getting here required hard work, and we know that continuing to advance our business will require ongoing discipline and commitment across the organization. As we begin a new fiscal year, we remain committed to operating a highly focused business that is thoughtful in the way it deploys capital and one where all employees are aligned with shareholders in their incentives.
Kind regards,
Dan Daviau President & CEO Canaccord Genuity Group Inc.
STRENGTH IN STABILITY
Canaccord Genuity Group Inc. is committed to creating a workplace where diversity is encouraged and in which all employees have the opportunity to realize their potential for excellence.We know that many of our greatest opportunities arise when we bring together the diverse and differentiated perspectives from across our talent pool, and we strive to operate as an organization that celebrates partnership and is free from discrimination and bias.
With a firm belief that diverse teams create better business outcomes, representatives in all our businesses have been working together to advance diversity and parity across our organization. While the activities may vary across businesses and regions – from advancing our recruitment, retention and talent development practices to ensuring that our parental leave policies are competitive – the goal is shared. Our collective success depends on sharing this responsibility across our organization and harnessing opportunities to drive measurable improvement.
While we realize this will take some time for our business and our industry, we believe this coordinated global diversity effort is further positioning our business – and our people – for long term success.
To learn more about our Diversity Policy, visit the Corporate Governance section of our website at www.canaccordgenuitygroup.com.
6 CANACCORD GENUITY GROUP INC. | 2018 ANNUAL REPORT
“Dan Daviau”

Our fiscal 2018 performance reflects our extensive efforts to adjust our business mix and adopt a responsible growth model that is capable of delivering more consistent results for our shareholders.
With a newly expanded wealth management business and a refocused and aligned capital markets business, we have improved our operating leverage and achieved our goal of making our Company less susceptible to changes in our operating environment.
Excluding significant items(1), we estimate that our global wealth management business contributed 60% of our diluted earnings per share for fiscal 2018, making the impact of periodic market-driven challenges in our capital markets less apparent in our overall results.
As we strive to increase the long term value of our business, we have taken a prudent approach to evaluating and implementing various strategies. The acquisition of Hargreave Hale – our most significant development of the year – was financed without diluting value for our shareholders or compromising our capital strength. In our Canadian wealth management business, we have been recruiting established Investment Advisory teams on a value-accretive basis. We also made a small investment to enhance our Canadian trading operation, which we expect will provide access to new areas of growth for our capital markets and wealth management businesses over the long term. And finally, we announced our intention to increase our investment in our Australian business, which serves to strengthen alignment of this operation with our global platform while we explore opportunities to expand our wealth management business in the region.
I am pleased with the steady progress we have made to adjust our business mix and strengthen our market position across our operations. The market has also responded favourably to our strategy, and the value of our common shares on the last trading day of fiscal 2018 increased by 36% compared to a year ago.
We have a capable and committed leadership team in place and a strong group of talented men and women to support our long term strategy. On behalf of the Board of Directors, I would like to thank the senior management team and all employees of Canaccord Genuity Group for their hard work and steadfast commitment.
Equity participation continues to be an important priority. Our strategy of increasingly aligning senior officers’ compensation with the longer term performance of the business has delivered positive change across all our operations. With a fully accountable leadership team, we now have a stronger culture of partnership that permeates throughout the organization. This has helped to improve collaboration across regions and businesses and drive stronger outcomes for our clients. Consequently, we have been able to increase our productivity while simultaneously increasing our market share in many of our regions and verticals.
We are also committed to ensuring strong corporate governance as we continually strive to advance the best interests of our shareholders. We will be adding to the quality and diversity of our Board of Directors with Merri Jones, who will be nominated as an Independent Director at our upcoming Annual General Meeting of Shareholders. Merri is a highly accomplished senior corporate executive with more than four decades of multi-faceted leadership experience within the financial services industry. Additionally, Massimo Carello has decided not to stand for re-election to the Board of Directors at our upcoming Annual General Meeting of Shareholders. I would like to thank Massimo for providing valuable guidance, expertise and perspective to senior management on behalf of our shareholders over the last decade. His deep business background, his extensive network in the UK & Europe, and his courtly manner and strong engagement with the Company and its employees at all levels have served us very well.
We remain committed to representing your best interests as we continue to deliver on our business plan, with a disciplined approach to capital allocation and a steady focus on achieving sustainable growth in the areas where we know we can add the most compelling value for our clients.
David Kassie Executive Chairman Canaccord Genuity Group Inc.
Letter from the Executive Chairman
CANACCORD GENUITY GROUP INC. | 2018 ANNUAL REPORT 7
(1) Figures excluding significant items are non-IFRS measures. See Non-IFRS Measures on page 14.
“David Kassie”

UK & EUROPE
In the UK & Europe, Canaccord Genuity Wealth Management has 188 investment professionals and fund managers who provide highly tailored discretionary portfolio management, advisory and execution stockbroking, wealth planning, and fund management services to individual investors, institutions and charities. With almost 70% of revenue from recurring, fee-based business, this operation continues to serve as an excellent model for the growth and business mix that we hope to achieve in our other geographies.
In September 2017, we closed our acquisition of Hargreave Hale in a transaction that established a substantially larger wealth management business in the region. With this development, Canaccord Genuity Wealth Management advanced
to become a top 10 wealth management business in the UK by assets, with even stronger growth potential from a larger asset base and an expanded national footprint.
When measured in local currency, total client assets in this business reached £24.8 billion at the end of fiscal 2018, an increase of 69.0% from a year ago. Revenue for the year increased by 49.4% to $201.4 million, and excluding significant items, this business recorded pre-tax net income of $37.4 million.
As we move ahead with a carefully orchestrated integration process, we look forward to unlocking greater operational efficiencies and enhanced revenue opportunities for our combined businesses.
8 CANACCORD GENUITY GROUP INC. | 2018 ANNUAL REPORT
STRENGTH IN STABILITY
UK & Europe Wealth Management Revenue(C$ millions, fiscal years)
2018
2017
2016
2015
2014
$201.4
$134.8
$125.6
$138.4
$113.0
UK & Europe Client Assets(1)
(Fiscal years)
2018
2017
2016
2015
2014
£24.8
£14.7
£11.6
£12.2
£10.9
$44.9
$24.5
$22.8
$21.8
$20.2
(1) Assets under administration, management and management contract in C$ billions and £ billions.
Canaccord Genuity Wealth Management
Top 10 wealth manager in the
UK & Europe by assets
Global Wealth Management Revenue (C$ millions, fiscal years)
2018
2017
2016
2015
2014
$370.3
$267.1
$250.9
$246.6
$224.0
GLOBAL WEALTH MANAGEMENT
Canaccord Genuity Wealth Management provides clients with the focused and personalized service they expect from a local investment manager with added benefits from the vast resources, expertise and support of a global financial institution.
In fiscal 2018, we added meaningful scale in our global wealth management operations, which has been an important driver of our stronger financial performance and a key element of the stability that we expect to deliver for our shareholders over the long term.

CANADA
Our Canadian wealth management business has Investment Advisory teams operating from a network of offices across the country who provide a full range of investment advisory and wealth planning strategies, with an emphasis on bespoke services, to meet the unique needs of their respective clients.
Throughout fiscal 2018, we continued to advance our strategy of adding new Investment Advisory teams in this business. At the end of the fiscal year, total client assets increased by 17.7% to $15.6 billion. Total revenue grew 27.7% year over year, driven by increased private client participation in new issue activity, strengthening valuations for small-cap equities and the addition of new advisors to our platform. This business also delivered a significant improvement in profitability and, excluding significant items, contributed pre-tax net income of $20.2 million, up from $2.0 million one year ago.
We have steadily improved the quality of our offering to improve the client experience and help our Investment Advisory teams capture a greater share of wealth. As part of our development efforts, discretionary assets under
management in this business increased by 6.8% and the average book size per Investment Advisory teams grew by 16.9% when compared to a year ago.
Our culture of independence and a platform which encourages advisors to operate in ways that best fit their business and client needs have helped us to further advance our recruiting strategy in this business. Looking ahead, we remain focused on developing and supporting our existing teams while continuing to invest in bringing new ones to our platform.
AUSTRALIA
Canaccord Genuity Wealth Management has offices in Melbourne and Sydney, and our team of seven advisors provides comprehensive wealth management solutions to growing numbers of clients in Australia and Southeast Asia. The exceptional performance of our capital markets business in the region has also been helpful for our wealth management brand. With our increased investment in our Australian operations, we look forward to exploring opportunities to expand our wealth management business in the region.
CANACCORD GENUITY GROUP INC. | 2018 ANNUAL REPORT 9 8 CANACCORD GENUITY GROUP INC. | 2018 ANNUAL REPORT
On track to become leading independent
Canadian wealth management business
Canada Wealth Management Revenue (C$ millions, fiscal years)
2018
2017
2016
2015
2014
$168.9
$132.3
$125.3
$108.2
$111.0
Canada Client Assets(1)
(C$ millions, fiscal years)
2018
2017
2016
2015
2014
$15.6
$13.2
$10.7
$9.2
$10.2
(1) Assets under administration and management.
Global Client Assets(1) (C$ billions, fiscal years)
2018
2017
2016
2015
2014
$61.3
$38.6
$33.3
$32.7
$30.9
(1) Assets under administration, management and management contract.
$61.3 billion in total client assets(1)
Growth will drive earnings power
$370.3 million in global wealth management revenuePositioned for margin expansion
and enhanced earnings
10 CANACCORD GENUITY GROUP INC. | 2018 ANNUAL REPORT
Canaccord Genuity
STRENGTH IN STABILITY
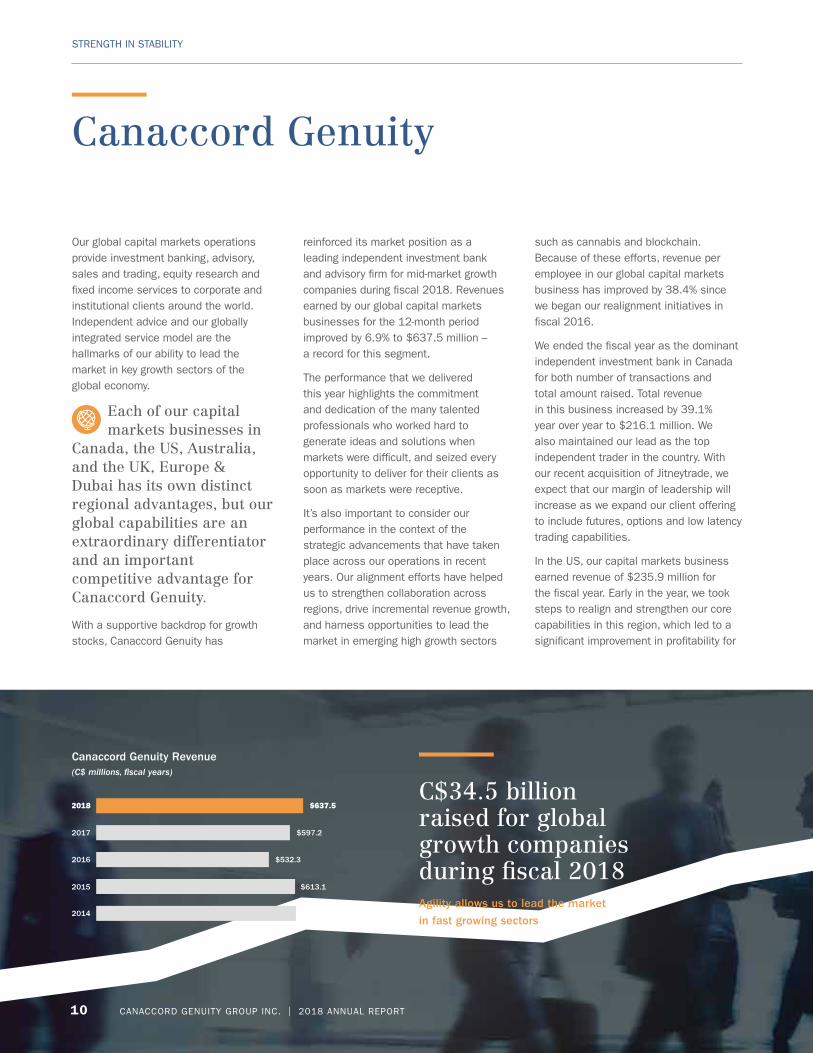
C$34.5 billion raised for global growth companies during fiscal 2018Agility allows us to lead the market
in fast growing sectors
Our global capital markets operations provide investment banking, advisory, sales and trading, equity research and fixed income services to corporate and institutional clients around the world. Independent advice and our globally integrated service model are the hallmarks of our ability to lead the market in key growth sectors of the global economy.
Each of our capital markets businesses in
Canada, the US, Australia, and the UK, Europe & Dubai has its own distinct regional advantages, but our global capabilities are an extraordinary differentiator and an important competitive advantage for Canaccord Genuity.
With a supportive backdrop for growth stocks, Canaccord Genuity has
reinforced its market position as a leading independent investment bank and advisory firm for mid-market growth companies during fiscal 2018. Revenues earned by our global capital markets businesses for the 12-month period improved by 6.9% to $637.5 million – a record for this segment.
The performance that we delivered this year highlights the commitment and dedication of the many talented professionals who worked hard to generate ideas and solutions when markets were difficult, and seized every opportunity to deliver for their clients as soon as markets were receptive.
It’s also important to consider our performance in the context of the strategic advancements that have taken place across our operations in recent years. Our alignment efforts have helped us to strengthen collaboration across regions, drive incremental revenue growth, and harness opportunities to lead the market in emerging high growth sectors
such as cannabis and blockchain. Because of these efforts, revenue per employee in our global capital markets business has improved by 38.4% since we began our realignment initiatives in fiscal 2016.
We ended the fiscal year as the dominant independent investment bank in Canada for both number of transactions and total amount raised. Total revenue in this business increased by 39.1% year over year to $216.1 million. We also maintained our lead as the top independent trader in the country. With our recent acquisition of Jitneytrade, we expect that our margin of leadership will increase as we expand our client offering to include futures, options and low latency trading capabilities.
In the US, our capital markets business earned revenue of $235.9 million for the fiscal year. Early in the year, we took steps to realign and strengthen our core capabilities in this region, which led to a significant improvement in profitability for
Canaccord Genuity Revenue (C$ millions, fiscal years)
2018
2017
2016
2015
2014
$637.5
$597.2
$613.1
$532.3
$615.8

CANACCORD GENUITY GROUP INC. | 2018 ANNUAL REPORT 11
$637.5 million in global revenue
Canaccord Genuity participated in 455 transactions(1) across the globe(1) Transactions valued above C$1.5 million.
this business. By leveraging our proven strengths in the healthcare and technology sectors, our Advisory professionals delivered a 47.9% year-over-year increase in revenues for this segment. We also experienced strong flows during the year, as our institutional equities business continued to grow its market share in an otherwise difficult market backdrop.
Revenue earned by our UK, Europe & Dubai operation amounted to $128.5 million for the fiscal year. Our teams in this business have leveraged our cross-border capabilities to help UK-based companies attract partnerships and investment from across Europe, and our Paris operation has been an important contributor to the positive momentum in this business.
A return to robust activity levels for small-cap equities in our core focus sectors led our Australian business to deliver a record revenue result for the second half of the fiscal year. This business has delivered very promising growth in recent years, and with our increased investment, we look forward to continuing to support its development initiatives in the region.
Across the organization, we are guided by one fundamental truth: that our own success depends on our ability to continuously support our clients’ success. We compete strongly on our ability to offer our clients highly relevant services and access to deep global expertise, which gives us a tremendous opportunity to lead the market in each of our businesses and geographies.
Fiscal 2018 Revenue by Activity
Investment Banking 37%
Commissions and Fees 24%
Advisory 19%
Trading 18%
Interest and Other 2%
Total Capital Markets Revenue by Region
United States 37%
Canada 34%
UK, Europe & Dubai 20%
Australia 9%
We leverage our competitive strengths across businesses and geographies to drive stronger outcomes for our clients and our business.

A Strong Culture to Drive Our Success
STRENGTH IN STABILITY
We Are Partners. How we interact with each other is critical to our culture. As a global investment bank, we differentiate ourselves every day by providing a truly global perspective, which by its very nature is a product of extensive collaboration and co-operation across borders and business units.
We Are Entrepreneurial. We are not a large bank and strive to be a flat organization, by eliminating bureaucratic thinking and fostering innovation.
We Are Collegial. We want to be the company where people feel empowered to satisfy their clients’ expectations with the help of all their partners.
We Work Hard. As a mid-market investment bank, we do not have many of the advantages (or disadvantages) of our larger competition. We work harder and smarter, and we always make the extra effort to create successful outcomes for our clients and our business.
We Operate with Integrity. From the types of clients we represent to the quality of our research and the people we hire, we must always operate with strength of character and integrity.
We Are Earnings Focused. Many of us are shareholders and we know that the end result of all our efforts must be in a sustainably stronger share price. Achieving this is a function of higher revenue and, importantly, lower costs.
12 CANACCORD GENUITY GROUP INC. | 2018 ANNUAL REPORT
Financial Review14 Management’s Discussion and Analysis14 Non-IFRS Measures15 Business Overview17 Key Developments During Fiscal 201820 Market Environment During Fiscal 201821 Fiscal 2019 Outlook21 Overview of Preceding Years − Fiscal 2017 vs. 201622 Financial Overview28 Quarterly Financial Information32 Business Segment Results43 Financial Condition44 Off-Balance Sheet Arrangements45 Liquidity and Capital Resources45 Preferred Shares46 Outstanding Share Data
47 Share-Based Payment Plans48 Related Party Transactions49 Critical Accounting Policies and Estimates53 Financial Instruments53 Future Changes in Accounting Policies and Estimates55 Disclosure Controls and Procedures and Internal Control
over Financial Reporting55 Risk Management59 Dividend Policy59 Dividend Declaration59 Additional Information60 Independent Auditors’ Report61 Consolidated Financial Statements and Notes107 Supplemental Information113 Glossary
CAUTION REGARDING FORWARD-LOOKING STATEMENTS:
This document may contain ‘‘forward-looking statements’’ (as defined under applicable securities laws). These statements relate tofuture events or future performance and reflect management’s expectations, beliefs, plans, estimates, intentions and similarstatements concerning anticipated future events, results, circumstances, performance or expectations that are not historical facts,including business and economic conditions and Canaccord Genuity Group’s growth, results of operations, performance and businessprospects and opportunities. Such forward-looking statements reflect management’s current beliefs and are based on informationcurrently available to management. In some cases, forward-looking statements can be identified by terminology such as ‘‘may’’, ‘‘will’’,‘‘should’’, ‘‘expect’’, ‘‘plan’’, ‘‘anticipate’’, ‘‘believe’’, ‘‘estimate’’, ‘‘predict’’, ‘‘potential’’, ‘‘continue’’, ‘‘target’’, ‘‘intend’’, ‘‘could’’ or thenegative of these terms or other comparable terminology. Disclosure identified as an ‘‘Outlook’’ including the section entitled ‘‘Fiscal2019 Outlook’’ contains forward looking information. By their very nature, forward-looking statements involve inherent risks anduncertainties, both general and specific, and a number of factors could cause actual events or results to differ materially from theresults discussed in the forward-looking statements. In evaluating these statements, readers should specifically consider variousfactors that may cause actual results to differ materially from any forward-looking statement. These factors include, but are not limitedto, market and general economic conditions, the nature of the financial services industry and the risks and uncertainties discussedfrom time to time in the Company’s interim condensed and annual consolidated financial statements and its annual report and AnnualInformation Form (AIF) filed on www.sedar.com as well as the factors discussed in the sections entitled ‘‘Risk Management’’ in thisMD&A and ‘‘Risk Factors’’ in the AIF, which include market, liquidity, credit, operational, legal, cyber and regulatory risks. Materialfactors or assumptions that were used by the Company to develop the forward-looking information contained in this document include,but are not limited to, those set out in the Fiscal 2019 Outlook section in the annual MD&A and those discussed from time to time inthe Company’s interim condensed and annual consolidated financial statements and its annual report and AIF filed on www.sedar.com.The preceding list is not exhaustive of all possible risk factors that may influence actual results. Readers are also cautioned that thepreceding list of material factors or assumptions is not exhaustive.
Although the forward-looking information contained in this document is based upon what management believes are reasonableassumptions, there can be no assurance that actual results will be consistent with these forward-looking statements. Theforward-looking statements contained in this document are made as of the date of this document and should not be relied uponas representing the Company’s views as of any date subsequent to the date of this document. Certain statements included in thisdocument may be considered ‘‘financial outlook’’ for purposes of applicable Canadian securities laws, and such financial outlookmay not be appropriate for purposes other than this document. Except as may be required by applicable law, the Company doesnot undertake, and specifically disclaims, any obligation to update or revise any forward-looking information, whether as a result ofnew information, further developments or otherwise.
13
2018 ANNUAL REPORT / CANACCORD GENUITY GROUP INC.

Management’s Discussion and Analysis
Fiscal year 2018 ended March 31, 2018 − this document is dated June 6, 2018.
The following discussion of Canaccord Genuity Group Inc.’s financial condition, financial performance and cash flows is provided toenable a reader to assess material changes in the financial condition, financial performance and cash flows for the year endedMarch 31, 2018 compared to the preceding fiscal year, with an emphasis on the most recent year. Unless otherwise indicated orthe context otherwise requires, the ‘‘Company’’ refers to Canaccord Genuity Group Inc. and its direct and indirect subsidiaries.‘‘Canaccord Genuity’’ refers to the investment banking and capital markets segment of the Company. The Management’sDiscussion and Analysis (MD&A) should be read in conjunction with the audited consolidated financial statements for the yearsended March 31, 2018 and 2017, beginning on page 60 of this report. The Company’s financial information is expressed inCanadian dollars unless otherwise specified. The Company’s consolidated financial statements for the years ended March 31,2018 and 2017 are prepared in accordance with International Financial Reporting Standards (IFRS).
Non-IFRS Measures
Certain non-IFRS measures are utilized by the Company as measures of financial performance. Non-IFRS measures do not haveany standardized meaning prescribed by IFRS and are therefore unlikely to be comparable to similar measures presented by othercompanies. Non-IFRS measures presented include assets under administration, assets under management, book value per dilutedcommon share, return on common equity and figures that exclude significant items.
The Company’s capital is represented by common and preferred shareholders’ equity and, therefore, management uses return oncommon equity (ROE) as a performance measure. Also used by the Company as a performance measure is book value per dilutedcommon share, which is calculated as total common shareholders’ equity adjusted for assumed proceeds from the exercise ofoptions and warrants and conversion of convertible debentures divided by the number of diluted common shares outstandingincluding estimated amounts in respect of share issuance commitments including options, warrants, and convertible debentures,as applicable, and adjusted for shares purchased under the normal course issuer bid and not yet cancelled, and estimatedforfeitures in respect of unvested share awards under share-based payment plans.
Assets under administration (AUA) and assets under management (AUM) are non-IFRS measures of client assets that are commonto the wealth management business. AUA − Canada, AUM − Australia and AUM − UK & Europe are the market value of clientassets managed and administered by the Company from which the Company earns commissions and fees. This measure includesfunds held in client accounts as well as the aggregate market value of long and short security positions. AUM − Canada includesall assets managed on a discretionary basis under programs that are generally described as or known as the Complete CanaccordInvestment Counselling Program and the Complete Canaccord Private Investment Management Program. Services provided includethe selection of investments and the provision of investment advice. The Company’s method of calculating AUA − Canada,AUM − Canada, AUM − Australia and AUM − UK & Europe may differ from the methods used by other companies and thereforemay not be comparable to other companies. Management uses these measures to assess operational performance of theCanaccord Genuity Wealth Management business segment. AUM − Canada is also administered by the Company and is includedin AUA − Canada.
Financial statement items that exclude significant items are non-IFRS measures. Significant items for these purposes includerestructuring costs, amortization of intangible assets acquired in connection with a business combination, impairment of goodwilland other assets, acquisition-related expense items, which include costs recognized in relation to both prospective and completedacquisitions, gains or losses related to business disposals including recognition of realized translation gains on the disposal offoreign operations, certain accounting charges related to the change in the Company’s long-term incentive plan (“LTIP” or the“Plan”) as recorded with effect on March 31, 2018, certain incentive-based payments related to the acquisition of Hargreave Hale,as well as certain expense items, typically included in development costs, which are considered by management to reflect asingular charge of a non-operating nature. See the Selected Financial Information Excluding Significant Items table on page 23.
Management believes that these non-IFRS measures allow for a better evaluation of the operating performance of the Company’sbusiness and facilitate meaningful comparison of results in the current period to those in prior periods and future periods. Figuresthat exclude significant items provide useful information by excluding certain items that may not be indicative of the Company’score operating results. A limitation of utilizing these figures that exclude significant items is that the IFRS accounting effects ofthese items do in fact reflect the underlying financial results of the Company’s business; thus, these effects should not be ignoredin evaluating and analyzing the Company’s financial results. Therefore, management believes that the Company’s IFRS measuresof financial performance and the respective non-IFRS measures should be considered together.
14
CANACCORD GENUITY GROUP INC. / 2018 ANNUAL REPORT

Business Overview
Through its principal subsidiaries, Canaccord Genuity Group Inc. is a leading independent, full-service financial services firm, withoperations in two principal segments of the securities industry: wealth management and capital markets. Since its establishmentin 1950, the Company has been driven by an unwavering commitment to building lasting client relationships. We achieve this bygenerating value for our individual, institutional and corporate clients through comprehensive investment solutions, brokerageservices and investment banking services. Canaccord Genuity Group has wealth management offices located in Canada, the UK,Guernsey, Jersey, the Isle of Man and Australia. Canaccord Genuity, the Company’s international capital markets division, operatesin North America, the UK & Europe, Asia, Australia and the Middle East. To us there are no foreign marketsTM.
Canaccord Genuity Group Inc. is publicly traded under the symbol CF on the TSX. Canaccord Genuity Series A Preferred Shares arelisted on the TSX under the symbol CF.PR.A. Canaccord Genuity Series C Preferred Shares are listed on the TSX under the symbolCF.PR.C.
ABOUT CANACCORD GENUITY GROUP INC.’S OPERATIONS
Canaccord Genuity Group Inc.’s operations are divided into two business segments: Canaccord Genuity (investment banking andcapital markets operations) and Canaccord Genuity Wealth Management. Together, these operations offer a wide range ofcomplementary investment banking services, investment products and brokerage services to the Company’s institutional,corporate and private clients. The Company’s administrative segment is referred to as Corporate and Other.
Canaccord Genuity
Canaccord Genuity is the global capital markets division of Canaccord Genuity Group Inc. (TSX: CF), offering institutional andcorporate clients idea-driven investment banking, merger and acquisition, research, sales and trading services with capabilities inNorth America, the UK & Europe, Asia, Australia and the Middle East. We are committed to providing valued services to our clientsthroughout the entire lifecycle of their business and operating as a gold standard independent investment bank − expansive inresources and reach, but targeted in industry expertise, market focus and individual client attention.
Canaccord Genuity Wealth Management
Canaccord Genuity Wealth Management operations provide comprehensive wealth management solutions and brokerage servicesto individual investors, private clients, charities and intermediaries through a full suite of services tailored to the needs of clientsin each of its markets. The Company’s wealth management division now has Investment Advisors (IAs) and professionals inCanada, the UK, Jersey, Guernsey, the Isle of Man and Australia.
Corporate and Other
Canaccord Genuity Group’s administrative segment, described as Corporate and Other, includes revenues and expensesassociated with providing correspondent brokerage services, bank and other interest, foreign exchange gains and losses, andactivities not specifically allocable to either the Canaccord Genuity or Canaccord Genuity Wealth Management divisions. Alsoincluded in this segment are the Company’s operations and support services, which are responsible for front- and back-officeinformation technology systems, compliance and risk management, operations, legal, finance, and all administrative functions ofCanaccord Genuity Group Inc.
Corporate structure
CanaccordGenuity
(Dubai) Ltd.
Canaccord GenuityGroup Inc.
CanaccordGenuity WealthManagement
(USA) Inc.
CanaccordGenuity Corp.
(Canada)
CanaccordGenuity
Wealth Limited(UK)
HargreaveHale
Limited(UK)
CanaccordGenuity LLC
(USA)
CanaccordGenuity Wealth(International)
Limited(Channel Islands)
USsub-group
UK and EuropeWealth Management
sub-group
UK and EuropeCapital Markets
sub-group50%
CanaccordGenuityLimited
(UK)
CanaccordGenuity Asia(China andHong Kong)
CanaccordGenuity
(Australia)Limited
The chart shows principal operating companies of the Canaccord Genuity Group.
The Company owns 50% of the issued shares of Canaccord Financial Group (Australia) Pty Ltd and Canaccord Genuity (Australia) Limited, but for accounting purposes, as of March 31, 2018, theCompany is considered to have a 58% interest because of the shares held in a trust controlled by Canaccord Financial Group (Australia) Pty Ltd [March 31, 2017 − 58%].
Management’s Discussion and Analysis 15
2018 ANNUAL REPORT / CANACCORD GENUITY GROUP INC.

BUSINESS ACTIVITY
Our business is affected by the overall condition of the worldwide debt and equity markets.
The timing of revenue recognition can also materially affect the Company’s quarterly results. The majority of revenue fromunderwriting and advisory transactions is recorded when the transaction has closed and, as a result, quarterly results can also beaffected by the timing for the recognition of such transactions in our capital markets business.
The Company has taken steps to reduce its exposure to variances in the equity markets and local economies by diversifying notonly its industry sector coverage but also its international scope. To improve recurring revenue streams and offset the inherentvolatility of the capital markets business, the Company has taken steps to increase the scale of its global wealth managementoperations. Historically, the Company’s diversification across major financial centres has allowed it to benefit from strong equitymarkets in certain regions and improve our capability for identifying and servicing opportunities in regional centres and across ourcore focus sectors.
IMPACT OF CHANGES IN CAPITAL MARKETS ACTIVITY
As a brokerage firm, the Company derives its revenue primarily from sales commissions, underwriting and advisory fees, andtrading activity. As a result, the Company’s business is materially affected by conditions in the financial marketplace and theeconomic environment, primarily in North America and Europe, and to some degree Asia and Australia. Canaccord Genuity Group’slong term international business development initiatives over the past several years have laid a solid foundation for revenuediversification. A conservative capital strategy allows the Company to remain competitive in today’s changing financial landscape.
During fiscal 2018, the Company’s capital markets activities were focused on the following sectors: Metals & Mining, Energy,Technology, Real Estate, Sustainability, Healthcare & Life Sciences, Consumer & Retail, Infrastructure, Aerospace & Defense,Financials and Private Equity. Coverage of these sectors included investment banking, mergers and acquisitions (M&A) andadvisory services, and institutional equity activities, such as sales, trading and research.
16 Management’s Discussion and Analysis
CANACCORD GENUITY GROUP INC. / 2018 ANNUAL REPORT

Key Developments During Fiscal 2018
CORPORATE
• On June 1, 2017, the Company announced that the dividend rate on its Cumulative 5-Year Rate Reset First Preferred Shares,Series C (the ‘‘Series C Preferred Shares’’) for the period from July 1, 2017 to June 30, 2022 would be 4.993% per annum.
• On June 16, 2017, the Company announced that the number of Series C Preferred Shares tendered for conversion intoCumulative Floating Rate First Preferred Shares, Series D (the ‘‘Series D Preferred Shares’’) did not meet the minimum requiredand, accordingly, no Series D Preferred Shares were issued.
• On July 5, 2017, the Company announced that through its UK & Europe based wealth management business, CanaccordGenuity Wealth Management (‘‘CGWM (UK)’’), it had agreed to acquire Hargreave Hale Limited (‘‘Hargreave Hale’’), a leadingindependent UK-based investment and wealth management business. This transaction closed on September 18, 2017. InSeptember 2017, the Company acquired 100% of Hargreave Hale for cash and deferred consideration of £52.1 million(C$86.0 million) and additional contingent consideration of up to £27.5 million (C$45.4 million). The contingent considerationis structured to be payable over a period of up to three years, subject to the achievement of certain performance targets relatedto the retention and growth of client assets and revenues and an amount determined with reference to the fund managementbusiness. The cash consideration was funded in part from a credit facility provided to CGWM (UK) by National WestminsterBank plc and HSBC Bank plc in the amount of £40.0 million (C$72.5 million as of March 31, 2018). Additional contingentconsideration, if paid, will be funded from the ongoing cash flow of the business.
The Company expensed $6.7 million of acquisition-related costs and $2.9 million of restructuring costs for the year endedMarch 31, 2018. In addition, the Company expensed $1.5 million of incentive-based payments determined with reference tofinancial targets and other performance criteria that are included as part of development costs. The Company anticipatesadditional costs related to these incentive-based payments of approximately £13.0 million (C$23.4 million) to be recorded as asignificant item over a four-year measurement period.
• On August 1, 2017, Canaccord Genuity Acquisition Corp. (‘‘CGAC’’), a newly organized special purpose acquisition corporationformed for the purpose of effecting a qualifying acquisition of one or more businesses, announced the closing of its initialpublic offering of $30.0 million of Class A Restricted Voting Units. The sponsor of CGAC is a wholly-owned subsidiary of theCompany and owns an approximate 26.2% interest in CGAC.
• On August 11, 2017, the Company announced the filing of a normal course issuer bid (NCIB) to purchase common shares ofthe Company through the facilities of the TSX and on alternative trading systems during the period from August 15, 2017 toAugust 14, 2018. The purpose of any purchase under this program is to enable the Company to acquire shares for cancellation.The maximum number of shares that may be repurchased represented 5.0% of the Company’s outstanding common shares atthe time of filing the NCIB. There have been no shares purchased under this and the previous NCIB during the year endedMarch 31, 2018.
• On April 25, 2018, the Company announced that it has entered into an agreement to acquire Jitneytrade Inc. and Finlogik Inc.directly and through the purchase of Finlogik Capital Inc. Jitneytrade Inc. is a direct access broker and an active trader infutures and equity options in Canada. Finlogik Inc. is in the business of delivering value-added fintech solutions in the Canadianmarket. The acquisition closed on June 6, 2018.
• At its meeting on June 6, 2018, the Board of Directors approved the grant of 6,220,000 performance share options (PSOs) tosenior management of the Company and its operating subsidiaries. The options will be granted under the terms of theCompany’s Performance Share Option (PSO) plan to be presented to the shareholders for their approval at the Company’sannual general meeting to be held on August 2, 2018. The grant is subject to ratification at that meeting. The options will havean exercise price determined within the context of the market at the time of the grant, will have a term of five years and willtime-vest rateably over four years (with one third vesting on each of the second, third and fourth anniversaries of the date ofgrant). PSOs will also be subject to market (stock price) performance vesting conditions, as well as have a three times exerciseprice cap on payout value.
CANACCORD GENUITY
• Canaccord Genuity generated revenue of $637.6 million in fiscal 2018• Net income before taxes excluding significant items(1) was $62.5 million, an increase of $16.2 million compared to the prior
year• Canaccord Genuity led 178 transactions globally, each over C$1.5 million, to raise total proceeds of C$6.1 billion during fiscal
2018. Of this:• Canada led 131 transactions, which raised C$3.5 billion• The UK, Europe & Dubai led 14 transactions, which raised C$1.8 billion• The US led 16 transactions, which raised C$650 million• Australia led 17 transactions, which raised C$149.1 million
(1) Figures excluding significant items are non-IFRS measures. See Non-IFRS Measures on page 14.
Management’s Discussion and Analysis 17
2018 ANNUAL REPORT / CANACCORD GENUITY GROUP INC.
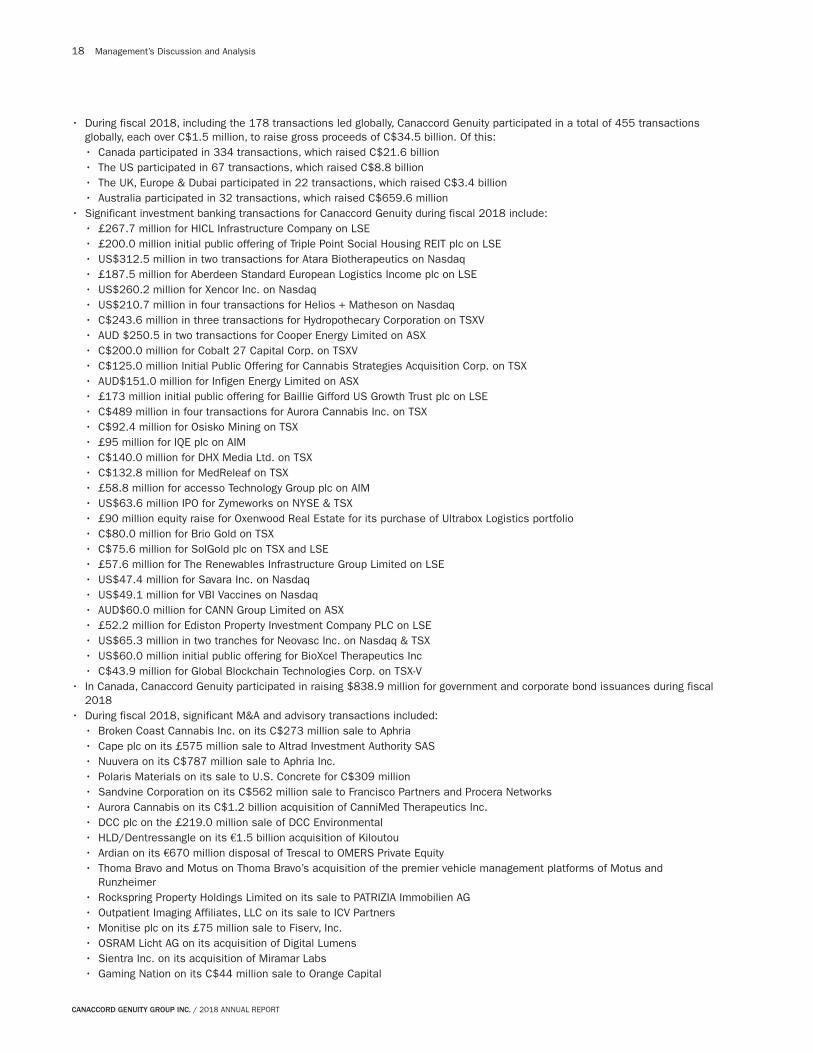
• During fiscal 2018, including the 178 transactions led globally, Canaccord Genuity participated in a total of 455 transactionsglobally, each over C$1.5 million, to raise gross proceeds of C$34.5 billion. Of this:• Canada participated in 334 transactions, which raised C$21.6 billion• The US participated in 67 transactions, which raised C$8.8 billion• The UK, Europe & Dubai participated in 22 transactions, which raised C$3.4 billion• Australia participated in 32 transactions, which raised C$659.6 million
• Significant investment banking transactions for Canaccord Genuity during fiscal 2018 include:• £267.7 million for HICL Infrastructure Company on LSE• £200.0 million initial public offering of Triple Point Social Housing REIT plc on LSE• US$312.5 million in two transactions for Atara Biotherapeutics on Nasdaq• £187.5 million for Aberdeen Standard European Logistics Income plc on LSE• US$260.2 million for Xencor Inc. on Nasdaq• US$210.7 million in four transactions for Helios + Matheson on Nasdaq• C$243.6 million in three transactions for Hydropothecary Corporation on TSXV• AUD $250.5 in two transactions for Cooper Energy Limited on ASX• C$200.0 million for Cobalt 27 Capital Corp. on TSXV• C$125.0 million Initial Public Offering for Cannabis Strategies Acquisition Corp. on TSX• AUD$151.0 million for Infigen Energy Limited on ASX• £173 million initial public offering for Baillie Gifford US Growth Trust plc on LSE• C$489 million in four transactions for Aurora Cannabis Inc. on TSX• C$92.4 million for Osisko Mining on TSX• £95 million for IQE plc on AIM• C$140.0 million for DHX Media Ltd. on TSX• C$132.8 million for MedReleaf on TSX• £58.8 million for accesso Technology Group plc on AIM• US$63.6 million IPO for Zymeworks on NYSE & TSX• £90 million equity raise for Oxenwood Real Estate for its purchase of Ultrabox Logistics portfolio• C$80.0 million for Brio Gold on TSX• C$75.6 million for SolGold plc on TSX and LSE• £57.6 million for The Renewables Infrastructure Group Limited on LSE• US$47.4 million for Savara Inc. on Nasdaq• US$49.1 million for VBI Vaccines on Nasdaq• AUD$60.0 million for CANN Group Limited on ASX• £52.2 million for Ediston Property Investment Company PLC on LSE• US$65.3 million in two tranches for Neovasc Inc. on Nasdaq & TSX• US$60.0 million initial public offering for BioXcel Therapeutics Inc• C$43.9 million for Global Blockchain Technologies Corp. on TSX-V
• In Canada, Canaccord Genuity participated in raising $838.9 million for government and corporate bond issuances during fiscal2018
• During fiscal 2018, significant M&A and advisory transactions included:• Broken Coast Cannabis Inc. on its C$273 million sale to Aphria• Cape plc on its £575 million sale to Altrad Investment Authority SAS• Nuuvera on its C$787 million sale to Aphria Inc.• Polaris Materials on its sale to U.S. Concrete for C$309 million• Sandvine Corporation on its C$562 million sale to Francisco Partners and Procera Networks• Aurora Cannabis on its C$1.2 billion acquisition of CanniMed Therapeutics Inc.• DCC plc on the £219.0 million sale of DCC Environmental• HLD/Dentressangle on its €1.5 billion acquisition of Kiloutou• Ardian on its €670 million disposal of Trescal to OMERS Private Equity• Thoma Bravo and Motus on Thoma Bravo’s acquisition of the premier vehicle management platforms of Motus and
Runzheimer• Rockspring Property Holdings Limited on its sale to PATRIZIA Immobilien AG• Outpatient Imaging Affiliates, LLC on its sale to ICV Partners• Monitise plc on its £75 million sale to Fiserv, Inc.• OSRAM Licht AG on its acquisition of Digital Lumens• Sientra Inc. on its acquisition of Miramar Labs• Gaming Nation on its C$44 million sale to Orange Capital
18 Management’s Discussion and Analysis
CANACCORD GENUITY GROUP INC. / 2018 ANNUAL REPORT

• SignUpGenius Inc. on its majority recapitalization by Providence Equity Partners• Halt Medical Inc. on its sale to Acessa AssetCo LLC pursuant to §363 of the U.S. bankruptcy code• DHX Media on its US$345 million acquisition of Peanuts and Strawberry Shortcake
WEALTH MANAGEMENT (GLOBAL)
• Globally, Canaccord Genuity Wealth Management generated $375.2 million in revenue during fiscal 2018• Total assets under administration, management & management contract (“Client Assets”) in Canada, the UK & Europe and
Australia were $61.3 billion at March 31, 2018(2), an increase of $22.7 billion or 58.7% compared to $38.6 billion at the endof fiscal 2017(2)
WEALTH MANAGEMENT (NORTH AMERICA)
• Canaccord Genuity Wealth Management (North America) generated $168.9 million in revenue during fiscal 2018 and, excludingsignificant items, recorded net income of $20.2 million(1)
• Assets under administration were $15.6 billion as of March 31, 2018, an increase of 17.7% from $13.2 billion at the end offiscal 2017(2)
• Assets under management (discretionary) were $2.8 billion as of March 31, 2018, an increase from $2.6 billion at the end offiscal 2017(2)
• At March 31, 2018, Canaccord Genuity Wealth Management had 142 Advisory Teams in Canada(3), an increase of one AdvisoryTeam from March 31, 2017
WEALTH MANAGEMENT (UK & EUROPE)
Contributions from Hargreave Hale from September 18, 2017 are included in the operating figures under Canaccord Genuity WealthManagement (UK & Europe) below.• Canaccord Genuity Wealth Management (UK & Europe) generated $201.4 million in revenue and, excluding significant items,
recorded net income of $37.4 million before taxes in fiscal 2018(1)
• Assets under management (discretionary and non-discretionary) were $44.9 billion (£24.8 billion) as at March 31, 2018, anincrease of 83.0% from $24.5 billion (£14.7 billion) at March 31, 2017(2). In local currency (GBP), assets under management atMarch 31, 2018 increased 69.0% compared to March 31, 2017. The acquisition of Hargreave Hale Limited in Q2/18 largelycontributed to the increase in AUM at March 31, 2018 compared to the prior year.
(1) Figures excluding significant items are non-IFRS measures. See Non-IFRS Measures on page 14.(2) See Non-IFRS Measures on page 14.(3) Advisory teams are normally comprised of one or more IAs and their assistants and associates, who together manage a shared set of client accounts. Advisory teams that are led by, or only include,
an IA who has been licensed for less than three years are not included in our advisory team count, as it typically takes a new IA approximately three years to build an average-sized book of business.
Management’s Discussion and Analysis 19
2018 ANNUAL REPORT / CANACCORD GENUITY GROUP INC.

Market Environment During Fiscal 2018:
ECONOMIC BACKDROP:
During fiscal 2018, the global economy generally enjoyed positive and synchronized economic growth for the first time since 2007.In the US, the tax reform and infrastructure changes fuelled a long-awaited earnings and corporate capital expenditure recovery.The combination of a weak US dollar, higher commodity prices, a strong labour market and positive earnings/economic momentumpushed inflation and interest rates higher. Against this backdrop, the Federal Reserve and the Bank of Canada continued theirmonetary tightening. Elsewhere, the European Central Bank and the Bank of Japan maintained highly accommodative policieswhile low inflation in emerging markets (EMs) provided more headroom for EM central banks to cut policy rates further. Late in thefiscal year, global equity markets experienced the first correction since 2015 on the back of rapidly rising interest rates and fearsthat US trade tariffs could ignite global trade wars. Overall, despite rising bond yields and policy rates in North America, therecovery in corporate earnings worldwide has allowed world equities to deliver above-average returns to investors throughout fiscal2018. On a total return basis, US (+14.0%), Canadian (+1.7%), EM (+22.3%) and world equities (+15.4%) all posted positivereturns.
INVESTMENT BANKING AND ADVISORY
Capital raising and advisory activity in our core focus areas improved markedly for most of the fourth fiscal quarter and in fiscal2018. As indicated in the table below, the performance gap between global large cap equities and global small cap equitiesclosed over the 12-month period. The continued strong performance of small cap equities remains an encouraging sign for capitalraising and advisory activities in our business.
Performance at End of Fiscal QuarterQ4/17 Q1/18 Q2/18 Q3/18 Q4/18
(Q/Q) (Y/Y) (Q/Q) (Y/Y) (Q/Q) (Y/Y) (Q/Q) (Y/Y) (Q/Q) (Y/Y)
S&P IFCI Global Small Cap 12.1% 14.9% 1.9% 16.5% 8.6% 18.4% 8.4% 34.5% 1.3% 21.5%
S&P IFCI Global Large Cap 11.3% 16.1% 5.7% 22.7% 6.7% 20.5% 7.2% 34.6% 0.8% 22.0%
Source: Thomson Reuters Datastream, Canaccord Genuity estimates
Our capital raising and advisory activities are primarily focused on small- and mid-capitalization companies in specific growthsectors of the global economy, as outlined on page 17. These sectors may experience growth or downturns independent ofbroader economic and market conditions, and government regulation can also have a more profound impact on capital formationfor smaller companies. Volatility in the business environment for these industries or in the market for securities of companieswithin these industries in the regions where we operate could adversely affect our financial results and ultimately, the marketvalue of our shares. Advisory revenues are primarily dependent on the successful completion of merger, acquisition orrestructuring mandates. Weak economic and global financial market conditions and lack of access to capital can result in achallenging business environment for small and mid-market M&A activity, but may provide opportunities for our restructuringbusiness.
TRADING
Trading volumes for small- and mid-cap equities in many of the markets where we operate improved compared to the previousfiscal quarter, and the rebound in new issue activity in small- and mid-cap equities has translated into somewhat stronger tradingactivity. Heightened market volatility during the fiscal fourth quarter also supported our agency trading activities.
Average ValueDuring FiscalQuarter/Year
Q4/17 Q1/18 Q2/18 Q3/18 Q4/18 FY1831-Mar-17 (Y/Y) 30-Jun-17 (Y/Y) 29-Sep-17 (Y/Y) 29-Dec-17 (Y/Y) 29-Mar-18 (Y/Y) (Q/Q) 29-Mar-18 (Y/Y)
Russell 2000 1374.8 32.0% 1390.4 22.7% 1416.1 15.8% 1511.5 17.4% 1554.4 13.1% 2.8% 1467.8 17.0%
S&P 400 Mid Cap 1706.4 27.6% 1729.7 17.8% 1745.6 12.8% 1853.4 16.5% 1914.6 12.2% 3.3% 1810.4 14.7%
FTSE 100 7271.7 21.3% 7388.2 19.1% 7380.7 9.1% 7480.4 8.0% 7359.4 1.2% −1.6% 7402.3 9.0%
MSCI EU Mid Cap 1003.9 14.1% 1067.4 18.3% 1071.5 15.5% 1107.9 18.0% 1105.0 10.1% −0.3% 1087.9 15.4%
S&P/TSX 15543.8 21.3% 15472.3 11.7% 15181.4 4.1% 15982.8 7.0% 15752.1 1.3% −1.4% 15596.5 5.9%
Source: Thomson Reuters Datastream, Canaccord Genuity estimates
20 Management’s Discussion and Analysis
CANACCORD GENUITY GROUP INC. / 2018 ANNUAL REPORT

GLOBAL WEALTH MANAGEMENT
The low-volatility environment that investors have enjoyed over the past few years ended in our fourth quarter of fiscal 2018, asheightened trade tensions between the US and their world trading counterparts and escalating geopolitical concerns in NorthKorea and Syria sent most world equity markets lower. Nevertheless, the strong returns enjoyed over the first three quarters of thefiscal year were such that world equities (+15.4%) and commodities (+13.8%) have boosted the performance of investors’portfolios in fiscal 2018.
Total Return (excl. currencies)
Q4/17Change
(Q/Q)
Q1/18Change
(Q/Q)
Q2/18Change
(Q/Q)
Q3/18Change
(Q/Q)
Q4/18Change
(Q/Q)Fiscal 2017
Change (Y/Y)Fiscal 2018
Change (Y/Y)
S&P 500 6.1% 3.1% 4.5% 6.6% -0.8% 17.2% 14.0%
S&P/TSX 2.4% -1.6% 3.7% 4.5% -4.5% 18.6% 1.7%
MSCI EM ERGING MARKETS 7.8% 6.7% 7.7% 5.7% 0.6% 15.5% 22.3%
MSCI WORLD 7.0% 4.5% 5.3% 5.8% -0.9% 15.7% 15.4%
S&P GS COMMODITY INDEX -5.1% -5.5% 7.2% 9.9% 2.2% 8.4% 13.8%
US 10-YEAR T-BONDS 0.8% 0.9% 0.6% -0.2% -2.5% -3.0% -1.2%
CAD/USD 0.9% 2.7% 4.0% -0.9% -2.4% -2.3% 3.3%
CAD/EUR -0.4% -4.3% 0.6% -2.4% -4.8% 4.4% -10.5%
Source: Thomson Reuters DataStream, Canaccord Genuity estimates
Fiscal 2019 Outlook
Recent economic data and leading economic indicators confirm that global economic growth is losing steam, albeit from a highlevel. However, the growth slowdown observed and projected appears to be spreading mainly over developed markets (DMs) whererising interest rates have begun to impact economic conditions. Our view is that this growth lull is temporary. We expect that fiscalreflation and weak currencies should act as shock absorbers in North America while monetary reflation should protect growth inEurope, Australia, Asia and Far East regions. Elsewhere, growth prospects remain upbeat in EM countries, which account forroughly 75% of global GDP growth and expected growth in calendar 2018 and 2019. We expect that disinflationary pressures andstrong EM currencies will allow central banks to further cut short-term rates. This positive decoupling between EM/DM monetarypolicy, leading economic indicators and economic momentum is a key reason why we see no imminent risk of a markeddeterioration in global growth into fiscal 2019. However, higher tariffs imposed by the US administration on imported goodsincrease the uncertainty on our longer-term global economic outlook. We will continue to monitor market trends and if we see adeterioration of the economic outlook we would expect to react quickly to any anticipated changes in market conditions.
US and Canadian equity market valuations remain elevated by historical standards, especially when accounting for debt oncorporate balance sheets. However, we believe equity markets will continue to benefit from strong earnings growth within a low,but rising, interest rate and inflationary environment. These conditions should benefit our global wealth management operations.Also, we expect investors to rotate out of expensive growth sectors into cheaper value sectors such as resource cyclicals,supporting agency trading activities in the process. This rotation, however, could mark the late stages of a maturing bull market,hence increased market volatility. Nevertheless, assuming pro-business industry regulations, we expect that financing and advisoryactivities in the health-care and technology sectors should stay vigorous while higher commodity prices could prompt resourcecompanies to raise capital for M&A or production-related growth objectives.
Overview of Preceding Years − Fiscal 2017 vs. 2016
Total revenue for the year ended March 31, 2017 (fiscal 2017) was $879.5 million, an increase of $91.7 million or 11.6%compared to the year ended March 31, 2016 mainly because of an increase in investment banking and principal trading revenues.Revenue generated from investment banking activities increased by $64.1 million to $196.1 million in fiscal 2017, most notablyin our Canadian and Australian capital markets operations. Revenue from principal trading revenue increased by $33.5 million forthe year ended March 31, 2017 compared to the prior year due to higher revenue earned across all regions.
Canaccord Genuity Group recorded net income of $43.2 million during fiscal 2017, compared to a net loss of $358.6 million infiscal 2016 attributable to certain significant items which included goodwill and other asset impairment charges and restructuringcosts recorded in fiscal 2016. Excluding significant items(1), net income for fiscal 2017 was $49.2 million compared to a net lossof $6.0 million for fiscal 2016, largely due to the higher revenue earned as a result of increased capital raising activities as wellas expansion of our wealth management operations during fiscal 2017.
(1) Figures excluding significant items are non-IFRS measures. See Non-IFRS Measures on page 14.
Management’s Discussion and Analysis 21
2018 ANNUAL REPORT / CANACCORD GENUITY GROUP INC.
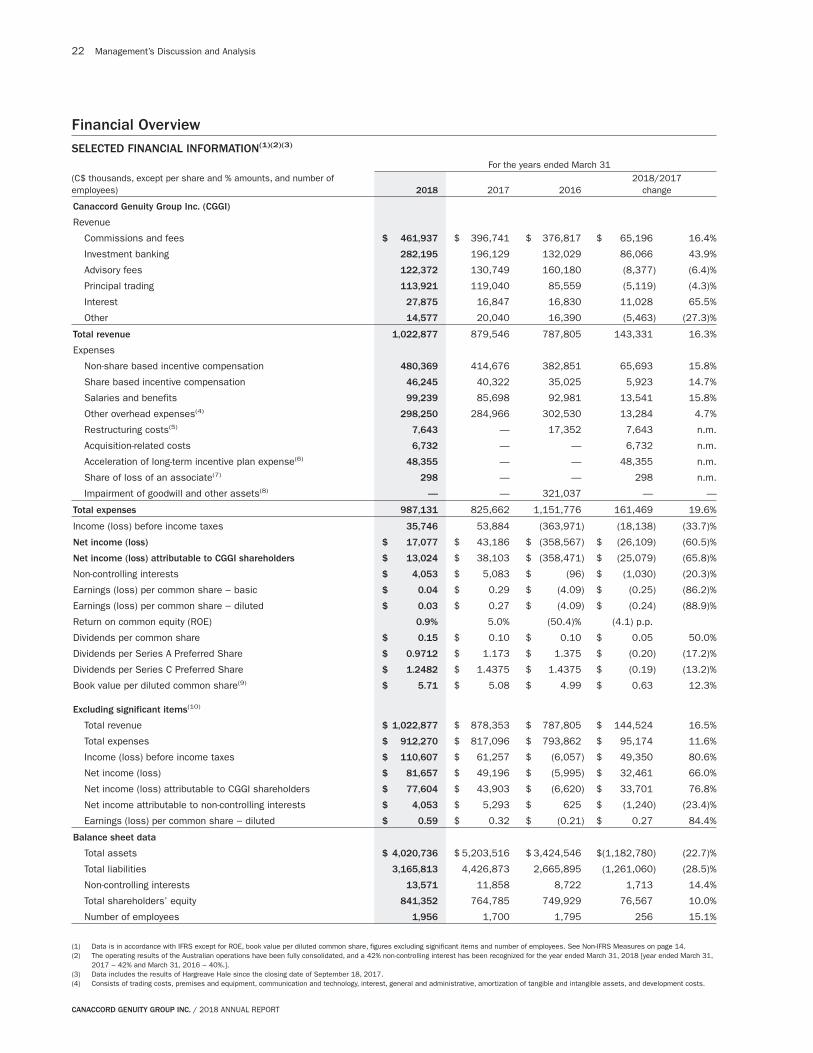
Financial OverviewSELECTED FINANCIAL INFORMATION(1)(2)(3)
For the years ended March 31(C$ thousands, except per share and % amounts, and number ofemployees) 2018 2017 2016
2018/2017change
Canaccord Genuity Group Inc. (CGGI)
Revenue
Commissions and fees $ 461,937 $ 396,741 $ 376,817 $ 65,196 16.4%
Investment banking 282,195 196,129 132,029 86,066 43.9%
Advisory fees 122,372 130,749 160,180 (8,377) (6.4)%
Principal trading 113,921 119,040 85,559 (5,119) (4.3)%
Interest 27,875 16,847 16,830 11,028 65.5%
Other 14,577 20,040 16,390 (5,463) (27.3)%
Total revenue 1,022,877 879,546 787,805 143,331 16.3%
Expenses
Non-share based incentive compensation 480,369 414,676 382,851 65,693 15.8%
Share based incentive compensation 46,245 40,322 35,025 5,923 14.7%
Salaries and benefits 99,239 85,698 92,981 13,541 15.8%
Other overhead expenses(4) 298,250 284,966 302,530 13,284 4.7%
Restructuring costs(5) 7,643 — 17,352 7,643 n.m.
Acquisition-related costs 6,732 — — 6,732 n.m.
Acceleration of long-term incentive plan expense(6) 48,355 — — 48,355 n.m.
Share of loss of an associate(7) 298 — — 298 n.m.
Impairment of goodwill and other assets(8) — — 321,037 — —
Total expenses 987,131 825,662 1,151,776 161,469 19.6%
Income (loss) before income taxes 35,746 53,884 (363,971) (18,138) (33.7)%
Net income (loss) $ 17,077 $ 43,186 $ (358,567) $ (26,109) (60.5)%
Net income (loss) attributable to CGGI shareholders $ 13,024 $ 38,103 $ (358,471) $ (25,079) (65.8)%
Non-controlling interests $ 4,053 $ 5,083 $ (96) $ (1,030) (20.3)%
Earnings (loss) per common share − basic $ 0.04 $ 0.29 $ (4.09) $ (0.25) (86.2)%
Earnings (loss) per common share − diluted $ 0.03 $ 0.27 $ (4.09) $ (0.24) (88.9)%
Return on common equity (ROE) 0.9% 5.0% (50.4)% (4.1) p.p.
Dividends per common share $ 0.15 $ 0.10 $ 0.10 $ 0.05 50.0%
Dividends per Series A Preferred Share $ 0.9712 $ 1.173 $ 1.375 $ (0.20) (17.2)%
Dividends per Series C Preferred Share $ 1.2482 $ 1.4375 $ 1.4375 $ (0.19) (13.2)%
Book value per diluted common share(9) $ 5.71 $ 5.08 $ 4.99 $ 0.63 12.3%
Excluding significant items(10)
Total revenue $ 1,022,877 $ 878,353 $ 787,805 $ 144,524 16.5%
Total expenses $ 912,270 $ 817,096 $ 793,862 $ 95,174 11.6%
Income (loss) before income taxes $ 110,607 $ 61,257 $ (6,057) $ 49,350 80.6%
Net income (loss) $ 81,657 $ 49,196 $ (5,995) $ 32,461 66.0%
Net income (loss) attributable to CGGI shareholders $ 77,604 $ 43,903 $ (6,620) $ 33,701 76.8%
Net income attributable to non-controlling interests $ 4,053 $ 5,293 $ 625 $ (1,240) (23.4)%
Earnings (loss) per common share − diluted $ 0.59 $ 0.32 $ (0.21) $ 0.27 84.4%
Balance sheet data
Total assets $ 4,020,736 $ 5,203,516 $ 3,424,546 $(1,182,780) (22.7)%
Total liabilities 3,165,813 4,426,873 2,665,895 (1,261,060) (28.5)%
Non-controlling interests 13,571 11,858 8,722 1,713 14.4%
Total shareholders’ equity 841,352 764,785 749,929 76,567 10.0%
Number of employees 1,956 1,700 1,795 256 15.1%
(1) Data is in accordance with IFRS except for ROE, book value per diluted common share, figures excluding significant items and number of employees. See Non-IFRS Measures on page 14.(2) The operating results of the Australian operations have been fully consolidated, and a 42% non-controlling interest has been recognized for the year ended March 31, 2018 [year ended March 31,
2017 − 42% and March 31, 2016 − 40%.].(3) Data includes the results of Hargreave Hale since the closing date of September 18, 2017.(4) Consists of trading costs, premises and equipment, communication and technology, interest, general and administrative, amortization of tangible and intangible assets, and development costs.
22 Management’s Discussion and Analysis
CANACCORD GENUITY GROUP INC. / 2018 ANNUAL REPORT
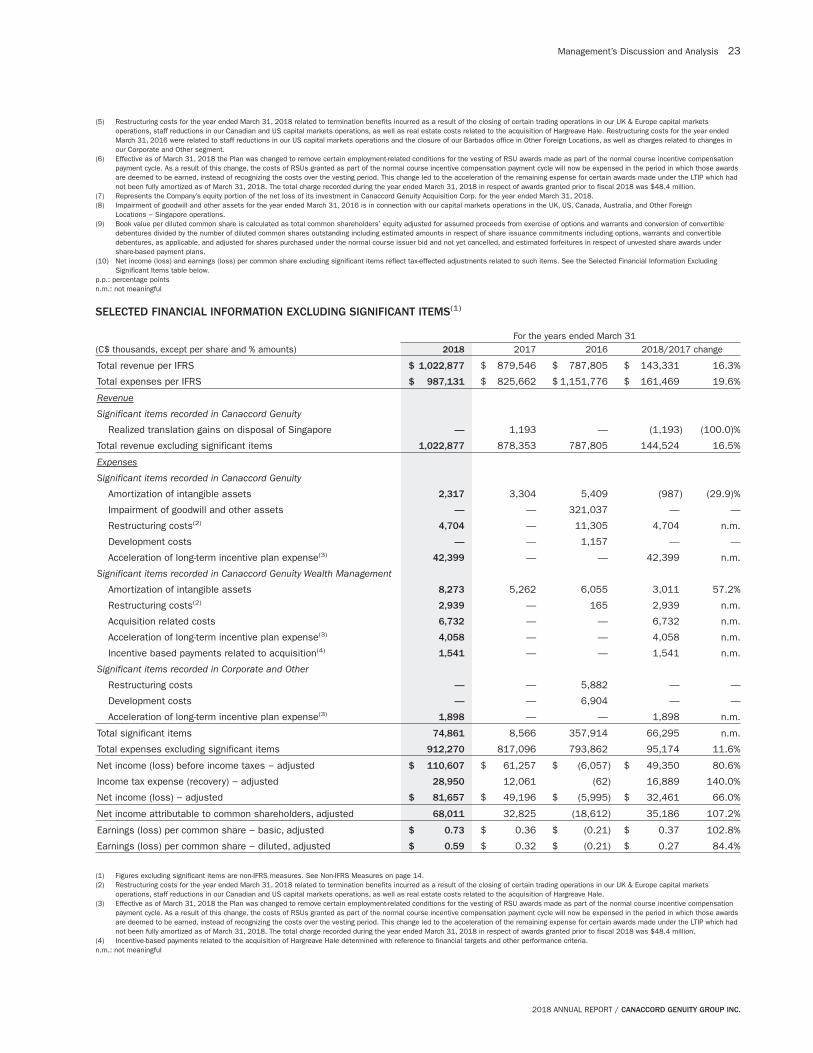
(5) Restructuring costs for the year ended March 31, 2018 related to termination benefits incurred as a result of the closing of certain trading operations in our UK & Europe capital marketsoperations, staff reductions in our Canadian and US capital markets operations, as well as real estate costs related to the acquisition of Hargreave Hale. Restructuring costs for the year endedMarch 31, 2016 were related to staff reductions in our US capital markets operations and the closure of our Barbados office in Other Foreign Locations, as well as charges related to changes inour Corporate and Other segment.
(6) Effective as of March 31, 2018 the Plan was changed to remove certain employment-related conditions for the vesting of RSU awards made as part of the normal course incentive compensationpayment cycle. As a result of this change, the costs of RSUs granted as part of the normal course incentive compensation payment cycle will now be expensed in the period in which those awardsare deemed to be earned, instead of recognizing the costs over the vesting period. This change led to the acceleration of the remaining expense for certain awards made under the LTIP which hadnot been fully amortized as of March 31, 2018. The total charge recorded during the year ended March 31, 2018 in respect of awards granted prior to fiscal 2018 was $48.4 million.
(7) Represents the Company’s equity portion of the net loss of its investment in Canaccord Genuity Acquisition Corp. for the year ended March 31, 2018.(8) Impairment of goodwill and other assets for the year ended March 31, 2016 is in connection with our capital markets operations in the UK, US, Canada, Australia, and Other Foreign
Locations − Singapore operations.(9) Book value per diluted common share is calculated as total common shareholders’ equity adjusted for assumed proceeds from exercise of options and warrants and conversion of convertible
debentures divided by the number of diluted common shares outstanding including estimated amounts in respect of share issuance commitments including options, warrants and convertibledebentures, as applicable, and adjusted for shares purchased under the normal course issuer bid and not yet cancelled, and estimated forfeitures in respect of unvested share awards undershare-based payment plans.
(10) Net income (loss) and earnings (loss) per common share excluding significant items reflect tax-effected adjustments related to such items. See the Selected Financial Information ExcludingSignificant Items table below.
p.p.: percentage pointsn.m.: not meaningful
SELECTED FINANCIAL INFORMATION EXCLUDING SIGNIFICANT ITEMS(1)
For the years ended March 31(C$ thousands, except per share and % amounts) 2018 2017 2016 2018/2017 change
Total revenue per IFRS $ 1,022,877 $ 879,546 $ 787,805 $ 143,331 16.3%
Total expenses per IFRS $ 987,131 $ 825,662 $ 1,151,776 $ 161,469 19.6%
Revenue
Significant items recorded in Canaccord Genuity
Realized translation gains on disposal of Singapore — 1,193 — (1,193) (100.0)%
Total revenue excluding significant items 1,022,877 878,353 787,805 144,524 16.5%
Expenses
Significant items recorded in Canaccord Genuity
Amortization of intangible assets 2,317 3,304 5,409 (987) (29.9)%
Impairment of goodwill and other assets — — 321,037 — —
Restructuring costs(2) 4,704 — 11,305 4,704 n.m.
Development costs — — 1,157 — —
Acceleration of long-term incentive plan expense(3) 42,399 — — 42,399 n.m.
Significant items recorded in Canaccord Genuity Wealth Management
Amortization of intangible assets 8,273 5,262 6,055 3,011 57.2%
Restructuring costs(2) 2,939 — 165 2,939 n.m.
Acquisition related costs 6,732 — — 6,732 n.m.
Acceleration of long-term incentive plan expense(3) 4,058 — — 4,058 n.m.
Incentive based payments related to acquisition(4) 1,541 — — 1,541 n.m.
Significant items recorded in Corporate and Other
Restructuring costs — — 5,882 — —
Development costs — — 6,904 — —
Acceleration of long-term incentive plan expense(3) 1,898 — — 1,898 n.m.
Total significant items 74,861 8,566 357,914 66,295 n.m.
Total expenses excluding significant items 912,270 817,096 793,862 95,174 11.6%
Net income (loss) before income taxes − adjusted $ 110,607 $ 61,257 $ (6,057) $ 49,350 80.6%
Income tax expense (recovery) − adjusted 28,950 12,061 (62) 16,889 140.0%
Net income (loss) − adjusted $ 81,657 $ 49,196 $ (5,995) $ 32,461 66.0%
Net income attributable to common shareholders, adjusted 68,011 32,825 (18,612) 35,186 107.2%
Earnings (loss) per common share − basic, adjusted $ 0.73 $ 0.36 $ (0.21) $ 0.37 102.8%
Earnings (loss) per common share − diluted, adjusted $ 0.59 $ 0.32 $ (0.21) $ 0.27 84.4%
(1) Figures excluding significant items are non-IFRS measures. See Non-IFRS Measures on page 14.(2) Restructuring costs for the year ended March 31, 2018 related to termination benefits incurred as a result of the closing of certain trading operations in our UK & Europe capital markets
operations, staff reductions in our Canadian and US capital markets operations, as well as real estate costs related to the acquisition of Hargreave Hale.(3) Effective as of March 31, 2018 the Plan was changed to remove certain employment-related conditions for the vesting of RSU awards made as part of the normal course incentive compensation
payment cycle. As a result of this change, the costs of RSUs granted as part of the normal course incentive compensation payment cycle will now be expensed in the period in which those awardsare deemed to be earned, instead of recognizing the costs over the vesting period. This change led to the acceleration of the remaining expense for certain awards made under the LTIP which hadnot been fully amortized as of March 31, 2018. The total charge recorded during the year ended March 31, 2018 in respect of awards granted prior to fiscal 2018 was $48.4 million.
(4) Incentive-based payments related to the acquisition of Hargreave Hale determined with reference to financial targets and other performance criteria.n.m.: not meaningful
Management’s Discussion and Analysis 23
2018 ANNUAL REPORT / CANACCORD GENUITY GROUP INC.

FOREIGN EXCHANGE
Revenues and expenses from our foreign operations are initially recorded in their respective functional currencies and translatedinto Canadian dollars at exchange rates prevailing during the period. The pound sterling depreciated slightly by 0.4% against theCanadian dollar and the US dollar depreciated by 2.2% against the Canadian dollar in fiscal 2018 when compared to fiscal 2017.This change in foreign exchange rates contributed to certain changes in revenue and expense items measured in Canadian dollarswhen compared to the applicable prior periods and should be considered when reviewing the following discussion in respect of ourconsolidated results as well as the discussion in respect of Canaccord Genuity and Canaccord Genuity Wealth ManagementUK & Europe.
GEOGRAPHIES
Commencing in Q3/17, the operating results of our Australian operations were disclosed as a separate geography. Prior to Q3/17Australia was included as part of Other Foreign Locations. Also, commencing in Q3/17, our Dubai operation, which was previouslyincluded in Other Foreign Locations, was included as part of Canaccord Genuity UK & Europe. The Other Foreign Locationsgeographic segment is now comprised of our Asian-based operations, including China and Hong Kong and prior to their sale orclosure also included Singapore and Barbados. These reclassifications reflect the growing contributions from Australia and theworking associations between the UK and Dubai. For purposes of the discussion provided herein the Canaccord Genuityoperations in the UK, Europe and Dubai are referred to as the ‘‘UK’’.
Operating results of Hargreave Hale are included since the closing date of September 18, 2017 as part of Canaccord GenuityWealth Management UK & Europe.
GOODWILL
The Company has recorded on its balance sheet as at March 31, 2018 goodwill in the amount of $258.0 million and included inintangible assets is an intangible asset with an indefinite life in the amount of $44.9 million. In determining whether to perform animpairment test, the Company considers factors such as its market capitalization, market conditions generally and overalleconomic conditions as well as market conditions in the key sectors in which the Company operates and the impact that suchconditions are expected to have on the Company’s operations.
Utilizing management’s estimates for revenue and operating performance, growth rates and other assumptions typically required inconnection with discounted cash flow models the Company determined that there was no impairment in the goodwill and indefinitelife intangible assets associated with any of its wealth management business units in the UK & Europe or its remaining goodwillrecorded in Canaccord Genuity Canada. Notwithstanding this determination as of March 31, 2018, changes or uncertainty in theeconomic environment may cause this determination to change. If the business climate changes and the Company is unable toachieve its internal forecasts the Company may determine that there has been impairment and the Company may be required torecord a goodwill impairment charge in future periods in respect of the Canaccord Genuity Wealth Management business units inthe UK & Europe or in respect of the remaining goodwill recorded in Canaccord Genuity Canada. Adverse changes in the keyassumptions utilized for purposes of impairment testing for goodwill and indefinite life intangible assets may result in theestimated recoverable amount of some or all of the applicable business units declining below the carrying value with the resultthat impairment charges may be required. The amount of any impairment charge would affect some or all of the amounts recordedfor goodwill and indefinite life intangible assets. Any such impairment charges would be determined after incorporating the effectof any changes in key assumptions including any consequential effects of such changes on estimated operating income and onother factors. In addition, notwithstanding that there may be no change in the performance estimates used by the Company forpurposes of determining whether there has been any impairment in its indefinite life intangible asset related to the Genuity brandname, in the event that the Company changes the way in which it uses that asset the Company may be required to record animpairment charge.
REVENUE
On a consolidated basis, revenue is generated through six activities: commissions and fees associated with agency trading andprivate client wealth management activity, investment banking, advisory fees, principal trading, interest and other.
Revenue for fiscal 2018 was $1.02 billion, an increase of 16.3% or $143.3 million from fiscal 2017, marking the first time ourconsolidated revenue has surpassed $1.0 billion. The increase in revenue compared to the prior year was mainly related to anincrease of $86.1 million in investment banking revenue as well as an increase of $65.2 million in commissions and feesrevenue.
As a result of an improvement in capital raising activity in our core focus areas, particularly during the second half of fiscal 2018,revenue in our Canaccord Genuity segment increased by $39.2 million or 6.6% compared to fiscal 2017. Our investment bankingrevenue experienced an increase of $65.9 million compared to the past fiscal year, largely related to an increase of $60.1 millionrecorded in our Canadian operations. Our Canadian business participated in numerous transactions in the blockchain andcannabis sectors leading to the higher investment banking revenue recorded during the year. Our Australian operations recorded adecrease of $2.7 million from our record year in fiscal 2017, but overall revenue was still very strong at $57.0 million for fiscal2018. Revenue in our UK & Europe operations decreased by $18.4 million or 12.5% as a result of a decrease in advisorymandates completed during the current fiscal year. Our US operations generated revenue of $235.9 million in fiscal 2018, a slightincrease of 0.7% from the prior year.
24 Management’s Discussion and Analysis
CANACCORD GENUITY GROUP INC. / 2018 ANNUAL REPORT
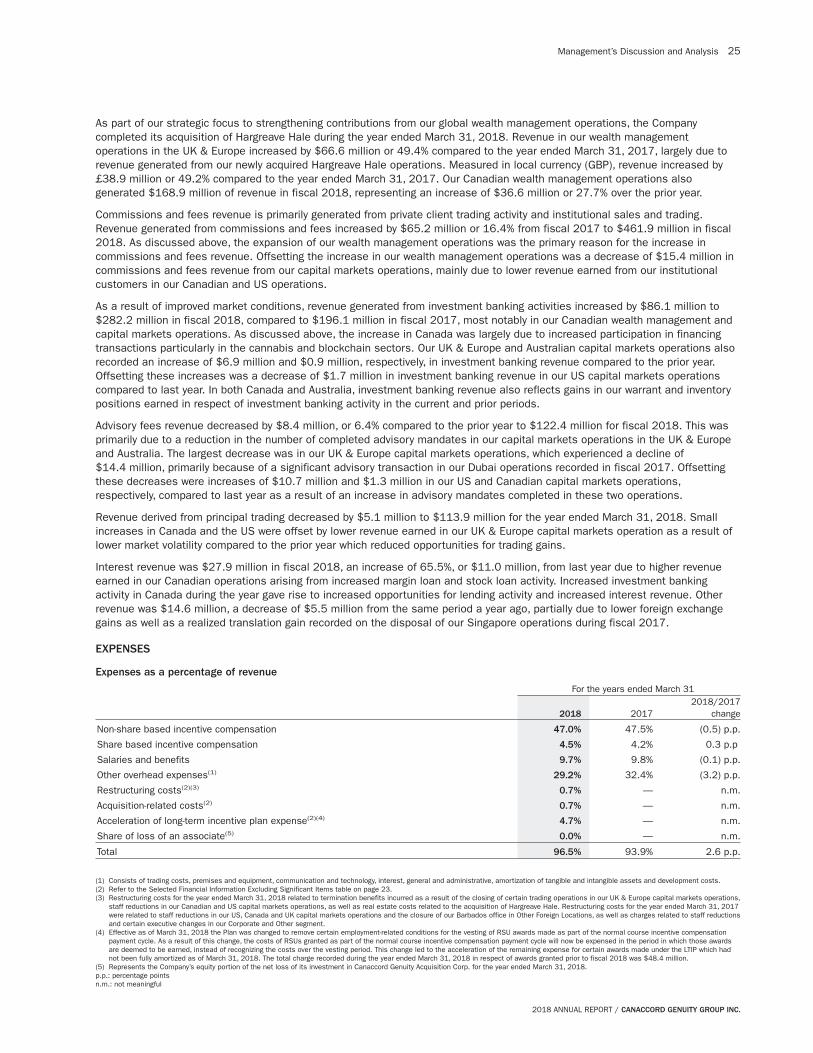
As part of our strategic focus to strengthening contributions from our global wealth management operations, the Companycompleted its acquisition of Hargreave Hale during the year ended March 31, 2018. Revenue in our wealth managementoperations in the UK & Europe increased by $66.6 million or 49.4% compared to the year ended March 31, 2017, largely due torevenue generated from our newly acquired Hargreave Hale operations. Measured in local currency (GBP), revenue increased by£38.9 million or 49.2% compared to the year ended March 31, 2017. Our Canadian wealth management operations alsogenerated $168.9 million of revenue in fiscal 2018, representing an increase of $36.6 million or 27.7% over the prior year.
Commissions and fees revenue is primarily generated from private client trading activity and institutional sales and trading.Revenue generated from commissions and fees increased by $65.2 million or 16.4% from fiscal 2017 to $461.9 million in fiscal2018. As discussed above, the expansion of our wealth management operations was the primary reason for the increase incommissions and fees revenue. Offsetting the increase in our wealth management operations was a decrease of $15.4 million incommissions and fees revenue from our capital markets operations, mainly due to lower revenue earned from our institutionalcustomers in our Canadian and US operations.
As a result of improved market conditions, revenue generated from investment banking activities increased by $86.1 million to$282.2 million in fiscal 2018, compared to $196.1 million in fiscal 2017, most notably in our Canadian wealth management andcapital markets operations. As discussed above, the increase in Canada was largely due to increased participation in financingtransactions particularly in the cannabis and blockchain sectors. Our UK & Europe and Australian capital markets operations alsorecorded an increase of $6.9 million and $0.9 million, respectively, in investment banking revenue compared to the prior year.Offsetting these increases was a decrease of $1.7 million in investment banking revenue in our US capital markets operationscompared to last year. In both Canada and Australia, investment banking revenue also reflects gains in our warrant and inventorypositions earned in respect of investment banking activity in the current and prior periods.
Advisory fees revenue decreased by $8.4 million, or 6.4% compared to the prior year to $122.4 million for fiscal 2018. This wasprimarily due to a reduction in the number of completed advisory mandates in our capital markets operations in the UK & Europeand Australia. The largest decrease was in our UK & Europe capital markets operations, which experienced a decline of$14.4 million, primarily because of a significant advisory transaction in our Dubai operations recorded in fiscal 2017. Offsettingthese decreases were increases of $10.7 million and $1.3 million in our US and Canadian capital markets operations,respectively, compared to last year as a result of an increase in advisory mandates completed in these two operations.
Revenue derived from principal trading decreased by $5.1 million to $113.9 million for the year ended March 31, 2018. Smallincreases in Canada and the US were offset by lower revenue earned in our UK & Europe capital markets operation as a result oflower market volatility compared to the prior year which reduced opportunities for trading gains.
Interest revenue was $27.9 million in fiscal 2018, an increase of 65.5%, or $11.0 million, from last year due to higher revenueearned in our Canadian operations arising from increased margin loan and stock loan activity. Increased investment bankingactivity in Canada during the year gave rise to increased opportunities for lending activity and increased interest revenue. Otherrevenue was $14.6 million, a decrease of $5.5 million from the same period a year ago, partially due to lower foreign exchangegains as well as a realized translation gain recorded on the disposal of our Singapore operations during fiscal 2017.
EXPENSES
Expenses as a percentage of revenue
For the years ended March 31
2018 20172018/2017
change
Non-share based incentive compensation 47.0% 47.5% (0.5) p.p.
Share based incentive compensation 4.5% 4.2% 0.3 p.p
Salaries and benefits 9.7% 9.8% (0.1) p.p.
Other overhead expenses(1) 29.2% 32.4% (3.2) p.p.
Restructuring costs(2)(3) 0.7% — n.m.
Acquisition-related costs(2) 0.7% — n.m.
Acceleration of long-term incentive plan expense(2)(4) 4.7% — n.m.
Share of loss of an associate(5) 0.0% — n.m.
Total 96.5% 93.9% 2.6 p.p.
(1) Consists of trading costs, premises and equipment, communication and technology, interest, general and administrative, amortization of tangible and intangible assets and development costs.(2) Refer to the Selected Financial Information Excluding Significant Items table on page 23.(3) Restructuring costs for the year ended March 31, 2018 related to termination benefits incurred as a result of the closing of certain trading operations in our UK & Europe capital markets operations,
staff reductions in our Canadian and US capital markets operations, as well as real estate costs related to the acquisition of Hargreave Hale. Restructuring costs for the year ended March 31, 2017were related to staff reductions in our US, Canada and UK capital markets operations and the closure of our Barbados office in Other Foreign Locations, as well as charges related to staff reductionsand certain executive changes in our Corporate and Other segment.
(4) Effective as of March 31, 2018 the Plan was changed to remove certain employment-related conditions for the vesting of RSU awards made as part of the normal course incentive compensationpayment cycle. As a result of this change, the costs of RSUs granted as part of the normal course incentive compensation payment cycle will now be expensed in the period in which those awardsare deemed to be earned, instead of recognizing the costs over the vesting period. This change led to the acceleration of the remaining expense for certain awards made under the LTIP which hadnot been fully amortized as of March 31, 2018. The total charge recorded during the year ended March 31, 2018 in respect of awards granted prior to fiscal 2018 was $48.4 million.
(5) Represents the Company’s equity portion of the net loss of its investment in Canaccord Genuity Acquisition Corp. for the year ended March 31, 2018.p.p.: percentage pointsn.m.: not meaningful
Management’s Discussion and Analysis 25
2018 ANNUAL REPORT / CANACCORD GENUITY GROUP INC.

Expenses for fiscal 2018 were $987.1 million, an increase of 19.6% or $161.5 million compared to the last fiscal year. Excludingsignificant items(1), total expenses were $912.3 million, up $95.2 million or 11.6% from fiscal 2017. As a result of the increase inrevenue during the year and the non-variable nature of certain infrastructure and overhead costs, total expenses excludingsignificant items(1) as a percentage of revenue decreased by 3.8 percentage points compared to the year ended March 31, 2017.
Compensation expenses
Long-term incentive plan
Employees (including senior executives) of the Company receive a component of their overall compensation in the form ofshare-based awards. Participating employees receive shares as they vest, typically over three years (the ‘‘RSUs’’). This program isreferred to as the Long-Term Incentive Plan (the ‘‘LTIP’’ or the ‘‘Plan’’). Effective as of March 31, 2018 the Plan was changed toremove certain employment-related conditions for the vesting of RSU awards that were made as part of the normal courseincentive compensation payment cycle. With the change, RSUs will continue to vest after termination of employment so long asthe employee does not violate certain post-termination restrictions and is not engaged in certain competitive or soliciting activitiesas provided in the Plan. Because of this change, for accounting purposes, the RSUs granted as part of the normal courseincentive compensation payment cycle will now be expensed in the period in which those awards are deemed to be earned, whichis generally the fiscal period in which the awards are either made or the immediately preceding fiscal year for those awards madeafter the end of such fiscal year but were determined and earned in respect of that fiscal year. Accordingly, a charge of$48.4 million in respect of awards granted prior to fiscal 2018 including the acceleration of the remaining expense for certainawards which had not been fully amortized as of March 31, 2018 was recorded in fiscal 2018. This non-cash accounting chargewas excluded from the calculation of the total compensation ratio as noted below and included as a significant item(1) as itrepresented a singular charge of a non-operating nature. The costs associated with LTIP awards granted for fiscal 2018 wasincluded as part of incentive compensation expense. Refer to Note 21 of the audited consolidated financial statements for theyear ended March 31, 2018 for further information on the share-based payment plans.
Incentive compensation expense was $526.6 million (excluding the accelerated expense related to certain share-based awardsreferred to above), an increase of $71.6 million or 15.7% from the prior year, in line with the increase in incentive-based revenue.Incentive compensation as a percentage of total revenue was 51.5% for fiscal 2018, a slight decrease of 0.2 percentage pointsfrom 51.7% in the prior year. Salaries and benefits expense of $99.2 million for the year ended March 31, 2018 was$13.5 million or 15.8% higher than the prior fiscal year. The increase was largely due to additional costs from our expansion in theUK & Europe wealth management operations including the acquisition of Hargreave Hale. Despite the increase in fixed staff costs,total compensation expense (incentive compensation expense excluding the accelerated expense related to certain share-basedawards referred to above plus salaries and benefits) as a percentage of total revenue was 61.2% in fiscal 2018, relativelyunchanged from the prior year representing a decrease of 0.4 percentage points.
OTHER OVERHEAD EXPENSES
For the years ended March 31
(C$ thousands, except % amounts) 2018 20172018/2017
change
Trading costs $ 68,209 $ 65,211 4.6%
Premises and equipment 39,605 42,286 (6.3)%
Communication and technology 56,346 52,381 7.6%
Interest 18,437 12,744 44.7%
General and administrative 83,982 79,011 6.3%
Amortization(1) 24,007 21,124 13.6%
Development costs 7,664 12,209 (37.2)%
Total other overhead expenses $ 298,250 $ 284,966 4.7%
(1) Includes amortization of intangible assets for the years ended March 31, 2018 and March 31, 2017, respectively. See the Selected Financial Information Excluding Significant Items table onpage 23.
Other overhead expenses were $298.3 million or 4.7% higher in fiscal 2018, which as a percentage of revenue was 29.2%compared to 32.4% in fiscal 2017. Most of our other overhead expenses increased as a result of business growth during fiscal2018, partially offset by lower premises and equipment expense and development costs.
In order to support the higher headcount and expansion of our wealth management business resulting from the completion of theHargreave Hale acquisition, many of our overhead expenses experienced increases compared to the year ended March 31, 2017.The expanded operations have contributed to increases in our trading costs and communication and technology expense of$3.0 million or 4.6% and $4.0 million or 7.6%, respectively, compared to the prior year. Trading costs also increased partially as aresult of higher costs recorded in our UK capital markets operations of $1.1 million compared to fiscal 2017.
(1) Figures excluding significant items are non-IFRS measures. See Non-IFRS Measures on page 14.
26 Management’s Discussion and Analysis
CANACCORD GENUITY GROUP INC. / 2018 ANNUAL REPORT
General and administrative expense, which includes reserves, promotion and travel expense, office expense, professional feesand donations, was up by $5.0 million or 6.3%, largely due to the additional costs to support the expanded UK & Europe wealthmanagement operations following the completion of the Hargreave Hale acquisition. In addition, our Canadian capital marketsoperations also experienced an increase of $8.4 million compared to the prior year as a result of additional costs such asprofessional fees and promotion and travel expenses required to support the increased level of activity and headcount in thisregion during fiscal 2018. Our US and UK capital markets operations both recorded decreases in general and administrativeexpenses, in line with the reduced headcount and our continued focus on cost reductions
Interest expense increased by $5.7 million or 44.7% compared to fiscal 2017 because fiscal 2018 reflects a full year’s worth ofinterest expense for the convertible debentures issued in Q3/17 as well as interest related to the bank loan obtained in Q2/18 inconnection with the acquisition of Hargreave Hale.
Amortization expense was $24.0 million, an increase of $2.9 million or 13.6% from fiscal 2017, mainly as a result of theamortization of intangible assets in connection with our acquisition of Hargreave Hale recorded in our UK & Europe wealthmanagement operations.
Offsetting the increases in expenses discussed above, premises and equipment expense decreased by $2.7 million or 6.3% infiscal 2018 because of the costs associated with the rationalization of our office space in Toronto recorded in our Corporate andOther segment in Q3/17. In addition, development costs decreased by $4.5 million or 37.2% from fiscal 2017 partially becauseof lower recruitment costs in our US and UK capital markets operations, as well as an impairment charge of $2.4 million related toan investment that was recorded in fiscal 2017 in our Corporate and Other segment. Offsetting these decreases in developmentcosts was $1.5 million of incentive-based payments related to the acquisition of Hargreave Hale determined with reference tofinancial targets and other performance criteria.
There were $7.6 million of restructuring costs recorded in fiscal 2018 related to staff reductions in our US and Canadian capitalmarkets operations, costs related to the closure of certain trading operations in Dublin, as well as costs associated with therationalization of office space related to the acquisition of Hargreave Hale. No restructuring costs were recorded during the sameperiod last year.
The Company also recorded $6.7 million of acquisition-related costs in relation to the acquisition of Hargreave Hale for the yearended March 31, 2018. The acquisition-related costs included professional and consulting fees incurred during the year.
NET INCOME
Net income for fiscal 2018 was $17.1 million compared to net income of $43.2 million in fiscal 2017, a decrease of$26.1 million or 60.5%, largely due to the acceleration of LTIP expense related to the change in the Plan as discussed above,offset by the significant increase in revenue in both our capital markets and wealth management operations. Net incomeattributable to common shareholders was $3.4 million for fiscal 2018 compared to $27.0 million for fiscal 2017. Earnings percommon share was $0.03 in fiscal 2018 compared to earnings per common share of $0.27 in the prior fiscal year. Excludingsignificant items(1), net income for fiscal 2018 was $81.7 million or net income attributable to common shareholders of$68.0 million, compared to net income of $49.2 million or net income attributable to common shareholders of $32.8 million infiscal 2017. Diluted earnings per share excluding significant items(1) was $0.59 for fiscal 2018 compared to $0.32 for the prioryear.
Income tax expense was $18.7 million for fiscal 2018, reflecting an effective tax rate of 52.2% compared to an effective tax rateof 19.9% in the prior year. Non-recognition of deferred tax assets in certain of our foreign operations contributed to a highereffective tax rate for the year ended March 31, 2018.
(1) Figures excluding significant items are non-IFRS measures. See Non-IFRS Measures on page 14.
Management’s Discussion and Analysis 27
2018 ANNUAL REPORT / CANACCORD GENUITY GROUP INC.

Quarterly Financial Information(1)(2)
The following table provides selected quarterly financial information for the eight most recently completed financial quarters endedMarch 31, 2018. This information is unaudited, but reflects all adjustments of a recurring nature that are, in the opinion ofmanagement, necessary to present a fair statement of the results of operations for the periods presented. Quarter-to-quartercomparisons of financial results are not necessarily meaningful and should not be relied upon as an indication of futureperformance.
(C$ thousands,except per share amounts)
Fiscal 2018 Fiscal 2017Q4 Q3 Q2 Q1 Q4 Q3 Q2 Q1
Revenue
Commissions and fees $ 135,148 $ 125,709 $ 96,125 $ 104,955 $ 105,890 $ 102,637 $ 95,342 $ 92,872
Investment banking 95,514 112,639 33,356 40,696 71,595 46,508 40,901 37,125
Advisory fees 40,930 31,947 30,589 18,896 52,474 17,127 21,554 39,594
Principal trading 36,047 29,138 22,849 25,887 31,066 33,569 26,859 27,546
Interest 10,045 6,861 5,793 5,176 5,217 4,017 4,005 3,608
Other 4,396 3,148 2,835 4,198 5,414 4,250 4,941 5,435
Total revenue 322,080 309,442 191,547 199,808 271,656 208,108 193,602 206,180
Total expenses 324,379 262,559 198,613 201,580 234,251 202,397 192,845 196,169
Net (loss) income before
income taxes (2,299) 46,883 (7,066) (1,772) 37,405 5,711 757 10,011
Net (loss) income $ (9,703) $ 36,598 $ (7,258) $ (2,560) $ 30,987 $ 4,544 $ 200 $ 7,455
(Loss) earnings per
share − basic(4) $ (0.15) $ 0.35 $ (0.11) $ (0.05) $ 0.29 0.01 (0.05) 0.04
(Loss) earnings per
share − diluted(4) $ (0.15) $ 0.29 $ (0.11) $ (0.05) $ 0.26 0.01 (0.05) 0.04
Excluding significant items(3)
Net income $ 37,312 $ 39,182 $ 3,548 $ 1,615 $ 32,740 $ 6,309 $ 2,008 $ 8,139
Earnings (loss) per
share − basic(4) $ 0.36 $ 0.38 $ 0.01 $ (0.01) $ 0.31 $ 0.03 $ (0.03) $ 0.05
Earnings (loss) per
share − diluted(4) $ 0.28 $ 0.31 $ 0.01 $ (0.01) $ 0.27 $ 0.03 $ (0.03) $ 0.05
(1) Data is in accordance with IFRS except for figures excluding significant items. See Non-IFRS Measures on page 14.(2) The operating results of our Australian operations have been fully consolidated and a 42% non-controlling interest has been recognized during fiscal 2018 [fiscal 2017 − 42%].(3) Figures excluding significant items are non-IFRS measures. See the Quarterly Financial Information Excluding Significant Items table on the next page.(4) Due to rounding or calculation of the dilutive impact of share issuance commitments in the quarterly and year to date EPS figures, the sum of the quarterly earnings (loss) per common share figures
may not equal the year to date earnings (loss) per share figure.
28 Management’s Discussion and Analysis
CANACCORD GENUITY GROUP INC. / 2018 ANNUAL REPORT

QUARTERLY FINANCIAL INFORMATION EXCLUDING SIGNIFICANT ITEMS(1)(2)
(C$ thousands,except per share amounts)
Fiscal 2018 Fiscal 2017Q4 Q3 Q2 Q1 Q4 Q3 Q2 Q1
Total revenue per IFRS $ 322,080 $ 309,442 $ 191,547 $ 199,808 $271,656 $208,108 $193,602 $ 206,180Total expenses per IFRS 324,379 262,559 198,613 201,580 234,251 202,397 192,845 196,169RevenueSignificant items recorded in
Canaccord GenuityRealized translation gains
on disposal ofSingapore — — — — — — — 1,193
Total revenue excludingsignificant items 322,080 309,442 191,547 199,808 271,656 208,108 193,602 204,987
ExpensesSignificant items recorded in
Canaccord GenuityAmortization of intangible
assets 579 579 579 580 830 829 827 818Restructuring costs(3) — — 4,256 448 — — — —Acceleration of long-term
incentive planexpense(4) 42,399 — — — — — — —
Significant items recorded inCanaccord Genuity WealthManagementAmortization of intangible
assets 2,867 2,820 1,262 1,324 1,260 1,274 1,323 1405Restructuring costs 939 — 2,000 — — — — —Acquisition-related costs 184 — 4,364 2,184 — — — —Acceleration of long-term
incentive planexpense(4) 4,058 — — — — — — —
Incentive payment relatedto acquisition(5) 1,541 — — — — — — —
Significant items recorded inCorporate and OtherAcceleration of long-term
incentive planexpense(4) 1,898 — — — — — — —
Total significant items 54,465 3,399 12,461 4,536 2,090 2,103 2,150 2,223Total expenses excluding
significant items 269,914 259,160 186,152 197,044 232,161 200,294 190,695 193,946Net income before income
taxes − adjusted $ 52,166 $ 50,282 $ 5,395 $ 2,764 39,495 7,814 2,907 11,041Income tax
expense − adjusted 14,854 11,100 1,847 1,149 6,755 1,505 899 2,902Net income − adjusted $ 37,312 $ 39,182 $ 3,548 $ 1,615 $ 32,740 $ 6,309 $ 2,008 $ 8,139Net income (loss)
attributable to commonshareholders $ 33,003 $ 34,665 $ 970 $ (627) $ 28,099 $ 2,907 $ (2,481) $ 4,300
Earnings (loss) pershare − basic − adjusted(6) $ 0.36 $ 0.38 $ 0.01 $ (0.01) $ 0.31 $ 0.03 $ (0.03) $ 0.05
Earnings (loss) pershare − diluted − adjusted(6) $ 0.28 $ 0.31 $ 0.01 $ (0.01) $ 0.27 $ 0.03 $ (0.03) $ 0.05
(1) Figures excluding significant items are non-IFRS measures. See Non-IFRS Measures on page 14.(2) The operating results of our Australian operations have been fully consolidated and a 42% non-controlling interest has been recognized during fiscal 2018 [fiscal 2017 − 42%].(3) Restructuring costs recorded in Q2 fiscal 2018 related to termination benefits incurred as a result of the closing of certain trading operations in our UK & Europe capital markets operations and
staff reductions in our Canadian and US capital markets operations. There were also real estate costs related to the acquisition of Hargreave Hale recorded in Q2 and Q4 of fiscal 2018.(4) Effective as of March 31, 2018 the Plan was changed to remove certain employment-related conditions for the vesting of RSU awards made as part of the normal course incentive compensation
payment cycle. As a result of this change, the costs of RSUs granted as part of the normal course incentive compensation payment cycle will be expensed in the period in which those awards aredeemed to be earned, instead of recognizing the costs over the vesting period. This change led to the acceleration of the remaining expense for certain awards made under the LTIP which had notbeen fully amortized as of March 31, 2018. The total charge recorded during Q4/18 in respect of awards granted prior to fiscal 2018 was $48.4 million.
(5) Incentive-based payments related to the acquisition of Hargreave Hale determined with reference to financial targets and other performance criteria.(6) Due to rounding or calculation of the dilutive impact of share issuance commitments in the quarterly and year to date EPS figures, the sum of the quarterly earnings (loss) per common share figures
may not equal the year to date earnings (loss) per share figure.
Management’s Discussion and Analysis 29
2018 ANNUAL REPORT / CANACCORD GENUITY GROUP INC.

Quarterly trends and risks
Our quarterly results are generally not significantly affected by seasonal factors. However, the Company’s revenue and income canexperience considerable variations from quarter to quarter and year to year due to factors beyond the Company’s control. Thebusiness is affected by the overall condition of the global capital markets and activity in our core focus sectors as well as growthcompany activity. The Company’s revenue from an underwriting transaction is recorded only when a transaction has beensubstantially completed or closed. Consequently, the timing of revenue recognition can materially affect Canaccord Genuity GroupInc.’s quarterly results.
With the increase in capital raising and advisory activity in our core focus areas over the recent quarters and higher contributionfrom our global wealth management operations, revenue and net income excluding significant items(1) generated in fiscal 2018have shown marked improvements over the past fiscal year. Revenue for Q4/18 was $322.1 million, an increase of 18.6% overthe same quarter in the prior year and 4.1% over Q3/18. Our fiscal 2018 revenue was $1.02 billion, marking the first time ourconsolidated revenue has surpassed $1.0 billion. Over 61.7% of total revenue for fiscal 2018 was generated in the second half offiscal 2018, which have historically been our stronger quarters.
The Canaccord Genuity division, which had been positively impacted by the increased market activity during the recent quarters,experienced an increase in revenue of 3.7% compared to Q4/17 and an increase of 2.3% from the prior quarter. Revenue in ourCanadian capital markets operations increased significantly in the last two quarters of fiscal 2018 compared to the firstsix months of fiscal 2018 and the prior year. This increase was largely driven by an increase in investment banking and advisoryfees, reflecting our active involvement with numerous transactions in the cannabis and blockchain sectors. The increase ininvestment banking revenue in Q3/18 and Q4/18 also reflects gains in our warrant and inventory positions earned fromtransactions in the current and prior year. As a result of the increase in revenue, commitment to our cost containment efforts andthe fixed nature of certain expenses, overhead expenses as a percentage of revenue excluding significant items(1) have decreasedin recent quarters, leading to higher pre-tax margins, with Q4/18 reaching 17.9% excluding significant items.(1)
Revenue in our US capital markets operations was $68.2 million in Q4/18, an increase of 5.3% compared to Q4/17, and thehighest revenue in this operating segment over the past eight quarters. Our International Equities Group continued to performwell, with principal trading revenue increasing by $4.4 million in Q4/18 for this region compared to the prior year. This increase inprincipal trading revenue was driven by increased trading volumes in smaller emerging companies in new and developing industrysectors. Profitability in our US capital markets operations has strengthened from our efforts in the first half of fiscal 2018 torealign and strengthen our core capabilities in this region. Excluding significant items(1), pre-tax income for this region was$6.8 million in Q4/18, more than double the $2.8 million pre-tax profit generated in Q4/17.
Our Australian operations generated higher revenue in the second half of fiscal 2018 and have recovered from weakened marketconditions in that region in the first half of the current fiscal year, with revenue reaching a record high of $22.1 million for Q3/18and $20.1 million for Q4/18. Contributing to the increase in revenue in this region were profits and gains recorded in certaininventory and warrant positions earned in respect of investment banking activity in the current and prior periods.
Our Canaccord Genuity Wealth Management North America operations have been positively impacted by stabilizing marketconditions, improved transaction activity and a growth in managed assets. Revenue increased by 27.8% during Q4/18 comparedto the same period a year ago and by 6.3% compared to Q3/18. In addition to an increase in commissions and fees revenue,revenue attributable to investment banking activity in this segment also increased significantly in the second half of fiscal 2018compared to the early part of fiscal 2018 and fiscal 2017, reflecting the increased private client participation in new issue activityin our Canadian operations because of the increased activity by companies in new and developing industry sectors such ascannabis. Excluding significant items(1), pre-tax income for Q4/18 was $8.5 million, the highest in the past eight quarter, reflectingthe growth in revenue discussed above. Assets under management increased in Q4/18 by 6.8% compared to Q4/17 to$2.8 billion as a result of additional client assets with the hiring of new investment advisors as well as generally higher marketvalues. Our fee related revenue continued to grow, but fee related revenue as a percentage of total revenue in Q4/18 decreasedby 4.2 percentage points compared to Q4/17 primarily as a result of an increase in transactional-based revenue during the yearwhich was led by an increase in investment banking revenue attributable to private client activity.
The Canaccord Genuity Wealth Management UK & Europe operations were expanded during fiscal 2018 with the completion of theHargreave Hale acquisition at the end of Q2/18. Revenue generated in this region increased from $37.5 million in Q2/18 to$64.9 million in Q4/18, reflecting the immediate contribution of Hargreave Hale to our operating results. Although this regionincurred higher operating expenses resulting from the expansion of this business and our increased headcounts, profit marginscontinued to be strong at 15.1% in Q4/18 on an excluding significant items basis(1). At the end of Q4/18, fee-related revenue wasat 67.3%, a 3.2 percentage point decrease from Q4/17 due to an increase in transaction activity during the year. Assets undermanagement for this group increased by $20.4 billion reaching $44.9 billion as of the end of Q4/18, compared to $24.5 billion atthe end of Q4/17. While a significant portion of this growth is attributable to the addition of Hargreave Hale, net new assets andmarket gains also contributed to the overall increase in AUM.
The movement in revenue in the Corporate and Other segment was mainly due to foreign exchange gains or losses resulting fromfluctuations in the Canadian dollar.
(1) Figures excluding significant items are non-IFRS measures. See Non-IFRS Measures on page 14.
30 Management’s Discussion and Analysis
CANACCORD GENUITY GROUP INC. / 2018 ANNUAL REPORT

Fourth quarter 2018 performance
Revenue for the fourth quarter was $322.1 million, an increase of $50.4 million or 18.6% compared to the same period in theprevious year. Our global wealth management operations generated an increase in revenue of $43.0 million or 58.7% compared toQ4/17, largely due to the acquisition of Hargreave Hale in Q2/18. In addition to an increase in commissions and fees revenue,investment banking fees generated in our wealth management operations also increased by $6.9 million or 70.4%, reflecting theincreased private client participation in new issue activity in our Canadian operations.
Our Canaccord Genuity segment also recorded an increase of $7.2 million or 3.7% compared to Q4/17, with the largest increasebeing generated by our Canadian capital markets division due to an increase in investment banking revenue and advisory fees, asa result of the completion of large transactions such as Nuuvera Inc. and Aurora Cannabis. Our US operations also recorded anincrease of $3.4 million or 5.3% compared to Q4/17, driven mainly by higher principal trading revenue resulting from increasedmarket volatility. These revenue increases were offset by a decrease in our UK capital markets operations of $27.4 million or44.0% compared to the same period in the previous year, of which $12.8 million of the decrease was attributable to a largeadvisory transaction completed in our Dubai operations during Q4/17 which caused advisory fee revenue during that quarter to besubstantially higher than a typical quarter. Revenue for the fourth quarter in our Australian operations was $20.1 million, a slightdecrease of $0.2 million or 1.2% compared to Q4/17. In our Other Foreign Locations, now comprised of only our Asian-basedoperations, no significant changes were reported compared to the same quarter last year.
On a consolidated basis, commissions and fees revenue increased by $29.3 million or 27.6% to $135.1 million compared to thesame period in the previous year, predominantly attributable to our expanded UK & Europe wealth management operations asdiscussed above. Investment banking revenue increased by $23.9 million or 33.4% to $95.5 million in Q4/18, largely attributableto our Canadian capital markets operations as a result of increased financing activity in this region. Principal trading revenueincreased by $5.0 million during the three months ended March 31, 2018 compared to the same period last year, mostly due tohigher trading revenue generated in our International Equities Group in our US operations. Interest revenue for Q4/18 was$10.0 million, an increase of $4.8 million over Q4/17, mainly attributable to our Canadian capital markets operations arising fromincreased margin loan and stock loan activity. Advisory fees revenue decreased by $11.5 million or 22.0% to $40.9 millioncompared to the same period in the previous year, predominantly attributable to our UK & Europe capital markets operations asQ4/17 reflected the completion of a large advisory transaction as discussed above.
Expenses were $324.4 million, up $90.1 million or 38.5% from Q4/17. Total expenses excluding significant items(1) were$269.9 million, an increase of $37.8 million or 16.3% from the same period last year.
Effective March 31, 2018, the LTIP Plan was changed to remove certain employment-related conditions for the vesting of certainRSU awards made as part of the normal course incentive compensation payment cycle. As a result of this change, the costs ofRSUs granted as part of the normal course incentive compensation payment cycle will be expensed in the period in which thoseawards are deemed to be earned, instead of recognizing the costs over the vesting period. This change led to the acceleration ofthe remaining expense for certain awards which had not been fully amortized as of March 31, 2018, resulting in a charge of$48.4 million recorded during Q4/18. The total charge recorded during Q4/18 in respect of awards granted prior to fiscal 2018was $48.4 million.
Incentive compensation expense excluding the accelerated expense related to certain share-based awards referred to aboveincreased by $24.0 million compared to the same period last year, in line with the increase in incentive-based revenue. Salariesand benefits expense was $6.5 million higher compared to the same period in the prior year largely due to higher headcount fromour Hargreave Hale acquisition. Total compensation expense (incentive compensation expense excluding the accelerated expenserelated to certain share-based awards referred to above plus salaries and benefits) as a percentage of revenue increased slightlyby 0.3 percentage point to 58.7% in Q4/18 compared to Q4/17 as a result of higher fixed staff costs offset by the increase inrevenue.
Other overhead expenses were $87.0 million compared to $75.8 million in Q4/17, an increase of 14.8% compared to Q4/17largely due to the restructuring and acquisition related costs recorded during Q4/18. Excluding significant items(1), overheadexpenses as a percentage of revenue decreased by 2.0 percentage points, reflecting the increase in revenue and the fixed natureof certain expenses. As a result of our expanded operations and higher headcount, particularly in our global wealth managementoperations, most of our overhead expenses increased compared to Q4/17. The largest increases in overhead expenses comparedto the same period in the prior year were general and administrative expense of $4.9 million or 25.2%, trading costs of$1.9 million or 10.0%, interest expense of $2.2 million or 56.8%, communication and technology of $1.7 million or 12.7%, as wellas amortization of $1.8 million or 36.1%.
General and administrative costs, which increased by $4.9 million, were largely affected by higher costs to support the expandedUK & Europe wealth management operations following the completion of the Hargreave Hale acquisition. In addition, our Canadiancapital markets operations also contributed to the increase as a result of higher costs in promotion and travel and professionalfees to support the growth in business activity in this region. Trading costs increased across our capital markets operations as aresult of increased trading activity. Communication and technology expense increased by $1.7 million due to the higher headcountin our wealth management operations. There was also an increase of $2.2 million in interest expense partially related to the bank
(1) Figures excluding significant items are non-IFRS measures. See Non-IFRS Measures on page 14.
Management’s Discussion and Analysis 31
2018 ANNUAL REPORT / CANACCORD GENUITY GROUP INC.

loan obtained in connection with the acquisition of Hargreave Hale during Q2/18. In addition, in connection with the acquisition ofHargreave Hale, amortization related to intangible assets led to an increase in amortization expense recorded in Q4/18 comparedto the same period in the prior year.
Offsetting these increases was a decrease of $2.2 million in development costs, due to a decline in hiring incentives in our USand UK operations, as well as an impairment charge related to an investment recorded in our Corporate and Other segment inQ4/17.
There were restructuring costs of $0.9 million and acquisition related expenses of $0.2 million recorded in Q4/18 in connectionwith the acquisition of Hargreave Hale. The restructuring costs related to rationalization of office space as part of our integrationefforts of the Hargreave Hale operations into our existing UK wealth management operations. There were no restructuring oracquisition-related costs recorded in Q4/17.
Net loss for the fourth quarter of fiscal 2018 was $9.7 million compared to net income of $31.0 million in Q4/17, largely due tothe acceleration of LTIP expense discussed above. Net loss attributable to common shareholders was $14.0 million for Q4/18compared to net income attributable to common shareholders of $26.3 million in Q4/17. Loss per common share in the currentquarter was $0.15, compared to diluted EPS of $0.26 in Q4/17. Excluding significant items(1), net income for Q4/18 was$37.3 million compared to $32.7 million in Q4/17, an increase of $4.6 million or 14.0%, primarily due to the increase in revenue.Net income attributable to common shareholders excluding significant items(1) was $33.0 million compared to $28.1 million in thesame period of the prior year. Diluted EPS excluding significant items(1) was $0.28 in Q4/18 compared to $0.27 in Q4/17.
Income tax expense was $7.4 million in Q4/18 compared to income tax expense of $6.4 million for the three months endedMarch 31, 2017. The effective tax rate was 322.1% in Q4/18, largely driven by the non-recognition of deferred tax assets incertain of our foreign operations in Q4/18 compared to Q4/17. Excluding significant items(1), the effective tax rate for Q4/18 was28.5% compared to 17.1% in Q4/17.
Business Segment Results(1)(2)
For the years ended March 312018 2017
(C$ thousands,except number of employees)
CanaccordGenuity
CanaccordGenuityWealth
ManagementCorporateand Other Total
CanaccordGenuity
CanaccordGenuityWealth
ManagementCorporateand Other Total
Revenue
Canada $ 216,106 $ 165,891 $ 15,056 $ 397,053 $ 155,411 $ 129,361 $ 14,044 $ 298,816
UK & Europe 128,458 201,383 — 329,841 146,812 134,819 — 281,631
US 235,942 2,991 — 238,933 234,211 2,931 — 237,142
Australia 57,022 — — 57,022 59,693 — — 59,693
Other Foreign Locations 28 — — 28 2,264 — — 2,264
Total revenue 637,556 370,265 15,056 1,022,877 598,391 267,111 14,044 879,546
Expenses 607,906 320,737 58,488 987,131 535,913 226,048 63,701 825,662
Intersegment allocations 16,524 15,529 (32,053) — 18,210 16,796 (35,006) —
Income (loss) before income
taxes (recovery) $ 13,126 $ 33,999 $ (11,379) $ 35,746 $ 44,268 $ 24,267 $ (14,651) $ 53,884
Excluding significant items(3)
Revenue 637,556 370,265 15,056 1,022,877 597,198 267,111 14,044 878,353
Expenses 558,486 297,194 56,590 912,270 532,609 220,786 63,701 817,096
Intersegment allocations 16,524 15,529 (32,053) — 18,210 16,796 (35,006) —
Income (loss) before income
taxes (recovery) $ 62,546 $ 57,542 $ (9,481) $ 110,607 $ 46,379 $ 29,529 $ (14,651) $ 61,257
Number of employees 730 938 288 1,956 749 672 279 1,700
(1) Data is in accordance with IFRS except for figures excluding significant items and number of employees. See Non-IFRS Measures on page 14. Detailed financial results for the business segmentsare shown in Note 23 of the Audited Consolidated Financial Statements on page 101.
(2) The operating results of Canaccord Genuity (Australia) Limited have been consolidated and a 42% non-controlling interest has been recognized and included in the Canaccord Genuity businesssegment in fiscal 2018 [fiscal 2017 − 42%].
(3) See the Selected Financial Information Excluding Significant Items table on page 23.
Canaccord Genuity Group’s operations are divided into three segments: Canaccord Genuity and Canaccord Genuity WealthManagement are the main operating segments while Corporate and Other is mainly an administrative segment.
(1) Figures excluding significant items are non-IFRS measures. See Non-IFRS Measures on page 14.
32 Management’s Discussion and Analysis
CANACCORD GENUITY GROUP INC. / 2018 ANNUAL REPORT

CANACCORD GENUITY
Overview
Canaccord Genuity provides investment banking, advisory, equity research, and sales and trading services to corporate,institutional and government clients as well as conducting principal trading activities in Canada, the US, the UK & Europe and theAsia-Pacific region. Canaccord Genuity has offices in 21 cities in 9 countries worldwide.
Our operating results demonstrate the strength of our global business and the success of our efforts to diversify our revenuestreams and improve alignment across our businesses and regions. For fiscal 2018, 66.1% of total Canaccord Genuity revenuewas earned outside of Canada.
Canaccord Genuity’s global alignment efforts are helping to firmly position the Company as a leading global independentinvestment bank focused on the mid-market.
During fiscal 2018, Canaccord Genuity participated in 455 transactions to raise gross proceeds of $34.5 billion(1). Of these,Canaccord Genuity led 178 transactions globally, raising total proceeds of $6.1 billion. Sector diversification remains a corecomponent of the Company’s strategy. Resource-related revenue accounted for 18.0% of Canaccord Genuity’s total investmentbanking revenue in fiscal 2018, versus 30.5% in fiscal 2017. Resource-related transactions comprised 25.8% of the total numberof Canaccord Genuity’s investment banking transactions in fiscal 2018, down from 29.3% in fiscal 2017.
Outlook
Canaccord Genuity continues to be very well positioned in many of the Company’s key markets. In the fiscal year ahead,management intends to focus on capturing operating efficiencies and improving profitability through further integration of its globalcapital markets platform and encouraging further cross-border coordination among our global offices.
We believe Canaccord Genuity’s integrated global platform provides a competitive advantage for our business compared to manyof the domestically focused firms we compete with. Smaller regional or local investment dealers are increasingly under pressureto diversify, and larger international competitors dedicate limited resources to servicing growth companies. We believe thiscompetitive landscape provides a significant opportunity for Canaccord Genuity in the global mid-market, as this space is currentlyrelatively underserviced by other global investment banks. Canaccord Genuity’s mid-market strategy and focus on key growthsectors differentiate the firm from its competition.
The continued shift towards electronic trading, and trading on alternative platforms, is expected to move some trading marketshare away from the main stock exchanges. In response to this, Canaccord Genuity is active in offering trading services on manyof the alternative exchanges (Chi-X, CX2, Alpha, Aequitas, Pure, CSE (Canadian Stock Exchange), Omega, Lynx, Triact). TheCompany has also developed a strong presence in the US with its American Depositary Receipts (ADR) and foreign equity tradingcapabilities from its International Equities Group. The Company continues to actively monitor shifts and trends in the capitalmarkets and regulatory environment.
Canaccord Genuity remains committed to operating as efficiently as possible in order to sustain its global platform during periodsof slower capital markets activity. A culture of cost containment continues to be reinforced throughout the Company, and strategiesto lower operating costs over the long term continue to be explored.
While we are optimistic about our prospects for the future, the Company has made the prudent decision to balance investments ingrowth with our ability to generate profit in the current market environment. The dynamic nature of our operating environmentrequires us to maintain a level of agility in our business mix that allows us to stay competitive and meet the evolving needs of ourclients. For this reason, the Company will continue to make disciplined investments with the addition of small teams in specificsector verticals or key service offerings to further strengthen our operations in areas where we believe we can capture additionalmarket share.
The management team believes the investments that the Company has made to improve Canaccord Genuity’s global presence andrefine its service offering have positioned the business very well for the future.
(1) Transactions over C$1.5 million
Management’s Discussion and Analysis 33
2018 ANNUAL REPORT / CANACCORD GENUITY GROUP INC.

FINANCIAL PERFORMANCE(1)(2)
For the years ended March 31
2018 2017
(C$ thousands, exceptnumber of employees) Canada UK(5) US Australia
OtherForeign
Locations Total Canada UK(5) US Australia
OtherForeign
Locations Total
Revenue $216,106 $128,458 $235,942 $57,022 $ 28 $637,556 $155,411 $146,812 $234,211 $59,693 $ 2,264 $598,391Expenses
Non-share basedincentivecompensation 96.653 72,081 115,049 29,452 3 313,238 66,802 85,746 113,086 30,583 1,092 297,309
Share based incentivecompensation 16,002 7,942 12,974 1,302 — 38,220 13,227 4,792 13,882 1,102 0 33,003
Salaries and benefits 5,381 5,672 11,890 1,881 688 25,512 5,381 5,520 12,551 1,649 997 26,098Other overhead expenses 45,875 40,621 87,565 9,195 577 183,833 35,721 43,165 89,811 9,232 1,574 179,503Acceleration of long term
incentive planexpense(6) 11,657 12,870 17,872 — — 42,399 — — — — — —
Restructuring costs 2,366 448 1,890 — — 4,704 — — — — — —Total expenses 177,934 139,634 247,240 41,830 1,268 607,906 121,131 139,223 229,330 42,566 3,663 535,913Intersegment allocations(3) 10,159 2,969 3,113 283 — 16,524 12,271 2,946 2,993 — — 18,210Income (loss) before
income taxes(recovery)(3) $ 28,013 $ (14,145)$ (14,411) $14,909 $(1,240)$ 13,126 $ 22,009 $ 4,643 $ 1,888 $17,127 $(1,399) $ 44,268
Excluding significantitems(4)
Total revenue 216,106 128,458 235,942 57,022 28 637,556 155,411 146,812 234,211 59,693 1,071 597,198Total expenses 161,599 126,316 227,473 41,830 1,268 558,486 118,818 139,223 229,328 41,577 3,663 532,609Intersegment allocations(3) 10,159 2,969 3,113 283 — 16,524 12,271 2,946 2,993 — — 18,210Income (loss) before
income taxes(recovery)(3) $ 44,348 $ (827)$ 5,356 $14,909 $(1,240)$ 62,546 $ 24,322 $ 4,643 $ 1,890 $18,116 $(2,592) $ 46,379
Number of employees 189 214 256 68 3 730 178 225 275 69 2 749
(1) Data is in accordance with IFRS except for figures excluding significant items and number of employees. See Non-IFRS Measures on page 14.(2) The operating results of Canaccord Genuity (Australia) Limited have been consolidated and a 42% non-controlling interest has been recognized and included in the Canaccord Genuity segment during
fiscal 2018 [fiscal 2017 − 42%].(3) Income (loss) before income taxes includes intersegment allocations. See the Intersegment Allocated Costs section on page 43.(4) Refer to the Selected Financial Information Excluding Significant Items table on page 23.(5) Includes our Dubai based operations(6) Effective as of March 31, 2018 the Plan was changed to remove certain employment-related conditions for the vesting of RSU awards made as part of the normal course incentive compensation
payment cycle. As a result of this change, the costs of RSUs granted as part of the normal course incentive compensation payment cycle will be expensed in the period in which those awards aredeemed to be earned, instead of recognizing the costs over the vesting period. This change led to the acceleration of the remaining expense for certain awards made under the LTIP which had notbeen fully amortized as of March 31, 2018. The total charge recorded during the year ended March 31, 2018 in respect of awards granted prior to fiscal 2018 was $42.4 million in the CanaccordGenuity segment.
REVENUE
REVENUE BY GEOGRAPHY AS A PERCENTAGE OF CANACCORD GENUITY REVENUE
For the years ended March 31
2018 20172018/2017
change
Revenue generated in:
Canada 33.9% 26.0% 7.9 p.p.
UK & Europe(1) 20.2% 24.5% (4.3) p.p.
US 37.0% 39.1% (2.1) p.p.
Australia 8.9% 10.0% (1.1) p.p.
Other Foreign Locations 0.0% 0.4% (0.4) p.p.
100.0% 100.0%
p.p.: percentage points(1) Includes our Dubai based operations
34 Management’s Discussion and Analysis
CANACCORD GENUITY GROUP INC. / 2018 ANNUAL REPORT

Canaccord Genuity generated revenue of $637.6 million, an increase of 6.6% or $39.2 million compared to fiscal 2017 as a resultof improved market activity. Revenue increased most notably in Canada, where revenue increased by $60.7 million or 39.1%compared to the prior year. The increase in revenue in our Canadian capital markets operations was driven largely by higherinvestment banking revenue and advisory fees, partially as a result of our active involvement with numerous transactions in thecannabis and blockchain sectors. Revenue in our UK operations decreased by $18.4 million to $128.5 million in fiscal 2018largely due to a decrease of $12.8 million in our Dubai operations related to a large advisory transaction completed in fiscal2017. Our Australian operations generated revenue of $57.0 million, which represents a decrease of $2.7 million or 4.5% fromfiscal 2017. Our Australian operations was impacted by slower market activity in the first half of fiscal 2018. However, a return tostrong activity levels for small cap equities in our focus sectors has largely improved our revenue performance in this region in thesecond half of the fiscal year. Revenue in our US operations remained the same as in prior year, a slight increase of0.7 percentage points over fiscal 2017. In our Other Foreign Locations, now comprised of only our Asian-based operations,revenue decreased by 98.8% or $2.2 million compared to the year ended March 31, 2017 due to the realized translation gain ondisposal of our Singapore operations recorded in the prior year. In both our Canadian and Australian operations, investmentbanking revenue also reflect profits and gains recorded in certain warrant and inventory positions earned in respect of investmentbanking activity in the current and prior periods.
Investment banking activity
The Company’s focus sector mix in fiscal 2018 showed increasing diversity, with 74.2% of total transactions occurring in sectorsoutside of Metals & Mining and Energy, which have traditionally been a higher component of the Company’s revenue.
Canaccord Genuity’s transactions and revenue by focus sectors are detailed below.
CANACCORD GENUITY − OVERALL
Investment banking transactions and revenue by sector
For the year ended March 31, 2018
Sectors
as a % ofinvestment
bankingtransactions
as a % ofinvestment
bankingrevenue
Healthcare & Life Sciences 9.5% 44.9%
Technology 12.0% 16.9%
Metals & Mining 19.1% 15.3%
Real Estate & Hospitality 12.2% 7.2%
Infrastructure 0.9% 2.8%
Energy 6.7% 2.7%
Financials, Diversified and Investment Trusts 27.0% 4.1%
Other 5.7% 2.1%
Media & Telecommunications 0.2% 1.4%
Sustainability 0.9% 1.0%
Consumer & Retail 3.5% 1.0%
Aerospace & Defense 0.2% 0.3%
Ag & Fertilizers 2.1% 0.2%
Structured Products — 0.1%
Total 100.0% 100.0%
Management’s Discussion and Analysis 35
2018 ANNUAL REPORT / CANACCORD GENUITY GROUP INC.

CANACCORD GENUITY − BY GEOGRAPHY
Investment banking transactions by sector (as a % of the number of investment banking transactions for each geographic region)
For the year ended March 31, 2018
Sectors Canada UK US AustraliaOther Foreign
Locations
Healthcare & Life Sciences 3.3% — 48.2% 11.4% —
Technology 7.9% 18.8% 31.5% 17.1% —
Metals & Mining 20.1% 6.3% — 45.7% —
Real Estate & Hospitality 13.1% 31.3% 9.3% — —
Infrastructure 0.9% 6.3% — — —
Energy 5.8% 12.3% — 22.9% —
Financials, Diversified and Investment Trusts 34.4% 25.0% — — —
Other 7.5% — — — —
Media & Telecommunications 0.3% — — — —
Sustainability — — 7.4% — —
Consumer & Retail 4.0% — 1.7% 2.9% —
Aerospace & Defense — — 1.9% — —
Ag & Fertilizers 2.7% — — — —
Total 100.0% 100.0% 100.0% 100.0% —
Investment banking revenue by sector (as a % of investment banking revenue for each geographic region)
For the year ended March 31, 2018
Sectors Canada UK US AustraliaOther Foreign
Locations
Healthcare & Life Sciences 59.4% — 47.2% 31.1% —
Technology 11.0% 16.7% 44.5% 3.8% —
Metals & Mining 11.2% 1.6% 0.1% 54.6% —
Real Estate & Hospitality 5.2% 34.1% 1.5% — —
Infrastructure 0.6% 19.8% — 0.1% —
Energy 2.1% 2.8% 0.2% 7.4% —
Financials, Diversified and Investment Trusts 1.8% 25.0% — 0.3% —
Other 4.1% — — 0.3% —
Media & Telecommunications 2.7% — — — —
Sustainability — — 4.0% 1.4% —
Consumer & Retail 1.3% — 0.7% 1.0% —
Aerospace & Defense — — 1.8% — —
Ag & Fertilizers 0.3% — — — —
Structured Products 0.2% — — — —
Transportation 0.1% — — — —
Total 100.0% 100.0% 100.0% 100.0% —
Note for reference in the tables above: transactions with companies in the cannabis sector in Canada are included under the Healthcare & Life Sciences sector.
36 Management’s Discussion and Analysis
CANACCORD GENUITY GROUP INC. / 2018 ANNUAL REPORT

EXPENSES
Expenses for fiscal 2018 were $607.9 million, an increase of 13.4% or $72.0 million compared year over year. Excludingsignificant items(1), total expenses for fiscal 2018 were $558.5 million, an increase of 4.9% or $25.9 million compared to fiscal2017, and decreased by 1.6 percentage points as a percentage of revenue.
Incentive compensation and salaries and benefits
Long-term incentive plan
Effective as of March 31, 2018 the Plan was changed to remove certain employment-related conditions for the vesting of RSUawards that were made as part of the normal course incentive compensation payment cycle. With the change, RSUs will continueto vest after termination of employment so long as the employee does not violate certain post-termination restrictions and is notengaged in certain competitive or soliciting activities as provided in the Plan. Because of this change, for accounting purposes, theRSUs granted as part of the normal course incentive compensation payment cycle will now be expensed in the period in whichthose awards are deemed to be earned, which is generally the fiscal period in which the awards are either made or theimmediately preceding fiscal year for those awards made after the end of such fiscal year but were determined and earned inrespect of that fiscal year. Accordingly, a charge of $42.4 million was recorded for the Canaccord Genuity segment in respect ofawards granted prior to fiscal 2018 including the acceleration of the remaining expense for certain awards which had not beenfully amortized as of March 31, 2018. This charge was excluded from the calculation of the total compensation ratios noted belowand included as a significant item(1) for purposes of our adjusted earnings (i.e. excluding significant items). The costs associatedwith LTIP awards granted for fiscal 2018 was included as part of incentive compensation expense.
Incentive compensation expense excluding the accelerated expense related to certain share-based awards referred to above forfiscal 2018 increased by $21.1 million or 6.4% compared to fiscal 2017. Incentive compensation expense as a percentage ofrevenue was 55.1%, a slight decrease of 0.1 percentage point from fiscal 2017. Salaries and benefits expense for fiscal 2018decreased by $0.6 million or 2.3% compared to fiscal 2017. Total compensation expense (incentive compensation expenseexcluding the accelerated expense related to certain share-based awards referred to above plus salaries and benefits) asa percentage of revenue was 0.4 percentage points lower than fiscal 2017, at 59.1% for the year ended March 31, 2018.
Across all regions, total compensation expense as a percentage of revenue has remained fairly consistent with fiscal 2017, in linewith our efforts to monitor all compensation costs closely. In Canada, total compensation as a percentage of revenue decreasedslightly by 0.4 percentage point compared to fiscal 2017. Our US operations recorded a compensation ratio of 59.3% in fiscal2018, also a slight decrease of 0.3 percentage points compared to the prior year. In our UK operations, total compensationexpense as a percentage of revenue increased by 1.3 percentage points compared to fiscal 2017 as a result of the decline inrevenue relative to fixed staff costs. Total compensation expense as a percentage of revenue in our Australian operations was57.2%, an increase of 1.4 percentage points due to the decrease in revenue and the non-variable nature of certain staff costs.
Canaccord Genuity total compensation expense (incentive compensation plus salaries and benefits) as a percentage of revenue bygeography
For the years ended March 31
2018 20172018/2017
change
Canada 54.6% 55.0% (0.4) p.p.
UK & Europe 66.7% 65.4% 1.3 p.p.
US 59.3% 59.6% (0.3) p.p.
Australia 57.2% 55.8% 1.4 p.p.
Other Foreign Locations n.m. 92.3% n.m.
Canaccord Genuity (total) 59.1% 59.6% (0.4) p.p.
p.p.: percentage pointsn.m.: not meaningful
Other overhead expenses
Other overhead expenses were $183.3 million for fiscal 2018 compared to $179.5 million in fiscal 2017, an increase of$3.8 million or 2.1%. As a percentage of revenue, other overhead expenses excluding significant items(1) was 1.0 percentagepoint lower compared to fiscal 2017, reflecting the increase in revenue as well as the fixed nature of certain overhead expenses.The most significant increases in overhead costs compared to the prior year include trading costs and general and administrativeexpense, offset by decreases in amortization expense and development costs.
The increase in trading costs was mainly due to higher execution and settlement charges in connection with our UK operations.
(1) Figures excluding significant items are non-IFRS measures. See Non-IFRS Measures on page 14.
Management’s Discussion and Analysis 37
2018 ANNUAL REPORT / CANACCORD GENUITY GROUP INC.

General and administrative expense increased by $5.3 million compared to fiscal 2017. Our Canadian operations experienced anincrease of $8.4 million compared to fiscal 2017 as a result of additional professional and promotion and travel expenses tosupport the growth in business activity and higher headcount in this region. Offsetting this increase in Canada were decreases inboth our US and UK capital markets operations, in line with the reduced headcount in these two regions and restructuring effortsundertaken during fiscal 2018.
Amortization expense decreased by $1.2 million to $9.5 million compared to the prior year due to a decrease in amortization ofintangible assets in our Australian operations.
Communication and technology expense increased by $0.7 million to $36.5 million for the year ended March 31, 2018, primarilyattributable to an increase in our Canadian operations due to higher headcount.
Development costs decreased by $1.9 million from last year to $0.7 million in fiscal 2018, partially due to lower hiring incentivesand recruitment costs in all regions.
During the year ended March 31, 2018, there were restructuring costs incurred of $4.7 million related to staff reductions in ourUS and Canadian capitals markets operations, as well as costs related to certain trading operations in Dublin. No restructuringcosts were recorded in the prior year.
INCOME BEFORE INCOME TAXES
Income before income taxes in fiscal 2018 was $13.1 million, a decrease of $31.1 million or 70.3% compared to fiscal 2017.Excluding significant items(1), income before income taxes, including allocated overhead expenses, increased from $46.4 millionto income before income taxes of $62.5 million in fiscal 2018. The increase in income before income tax excluding significantitems(1) was attributable to higher revenue generated in our Canadian and US operating segments combined with a reduction inoverhead expenses.
CANACCORD GENUITY WEALTH MANAGEMENT
Overview
Canaccord Genuity Group’s wealth management division provides a range of comprehensive financial services and investmentproducts to individual investors (private clients), institutions and intermediaries, and charities. Revenue from wealth managementoperations is generated through traditional commission-based brokerage services; the sale of fee-based products and services;client-related interest; and fees and commissions earned by Investment Advisors (IAs) from investment banking and venturecapital transactions. The Company has wealth management operations in Canada, the UK & Europe, and Australia. During the yearended March 31, 2018, the Company completed its acquisition of Hargreave Hale, expanding its wealth management operationsin the UK & Europe.
In the UK & Europe, Canaccord Genuity Wealth Management has 12 offices in the UK, Guernsey, Jersey and the Isle of Man.Revenue earned by this business is largely generated through fee-based accounts and portfolio management activities. With68.5% of its fiscal 2018 revenue generated from recurring fee-based activity, this geography has a significantly higher proportionof fee-based revenue than the Company’s Canadian wealth management businesses. The business offers services to bothdomestic (UK) and international and European clients and provides clients with investing options from both third party andproprietary financial products, including 18 funds managed by Canaccord Genuity Wealth Management portfolio managers.
At March 31, 2018 Canaccord Genuity Wealth Management had 15 offices located across Canada, including five IndependentWealth Management (IWM) locations. The Company is focused on actively recruiting established Advisory Teams to accelerategrowth in this business.
Outlook
Our strategic shift to strengthening contributions from our global wealth management performance will continue to be a mainfocus for the Company. Management’s priorities for Canaccord Genuity Wealth Management will be focused on growing assetsunder administration and management, and increasing the proportion of fee-based revenue as a percentage of total revenue. Byincreasing recurring revenue streams, we expect to meaningfully reduce our reliance on transaction-based revenue over thecoming years, making our business less sensitive to changes in market conditions.
With 68.5% of the division’s revenue derived from recurring, fee-based activities, the revenue stream generated through CanaccordGenuity Wealth Management’s UK & European wealth management business helps to improve the stability of its overallperformance. Client holdings in our in-house investment management products exceed $1 billion and are attracting growinginterest from domestic intermediaries and international fund companies. The Company will continue to pursue strategicopportunities to increase the scale of its UK wealth management business.
In Canada, the Company continues to focus on enhancing margins, managing costs, and growing the business through targetedrecruitment and training. While the recruiting environment remains competitive, we expect the benefits of our independent globalplatform to help drive continued recruiting success in select markets. The Company also intends to invest further in training
(1) Figures excluding significant items are non-IFRS measures. See Non-IFRS Measures on page 14.
38 Management’s Discussion and Analysis
CANACCORD GENUITY GROUP INC. / 2018 ANNUAL REPORT

programs for new and existing Investment Advisors to continue developing the skills of our Advisory Teams and to support thegrowth of fee-based services offered through the Canadian business. We maintain a strong focus on attracting and retaining highquality advisors, investing in training programs and building a comprehensive suite of premium products targeted at attracting highnet worth investors and helping advisors grow their businesses.
In Australia, the Company still has a relatively small wealth management operation; however, expansion is expected to occurthrough targeted recruiting, and through the build-out of wealth management services and products in this market.
FINANCIAL PERFORMANCE − NORTH AMERICA(1)(2)
For the years ended March 31
(C$ thousands, except AUM and AUA (in C$ millions),number of employees, Advisory Teams and % amounts) 2018 2017 2018/2017 change
Revenue $ 168,882 $ 132,292 $ 36,590 27.7%
Expenses
Non-share based incentive compensation 85,430 65,909 19,521 29.6%
Share based incentive compensation 952 824 128 15.5%
Salaries and benefits 11,315 11,335 (20) (0.2)%
Other overhead expenses 36,795 36,756 39 (0.1)%
Acceleration of long term incentive plan expense(6) 668 — 668 n.m.
Restructuring costs — — — —
Total expenses 135,160 114,824 20,336 17.7%
Intersegment allocations(3) 14,200 15,504 (1,304) (8.4)%
Income before income taxes(3) $ 19,522 $ 1,964 $ 17,558 n.m.
AUM − Canada (discretionary)(4) 2,815 2,637 178 6.8%
AUA − Canada(5) 15,567 13,228 2,339 17.7%
Number of Advisory Teams − Canada 142 141 1 0.7%
Number of employees 379 359 20 5.6%
Excluding significant items(7)
Total expenses $ 134,492 $ 114,824 $ 19,668 17.1%
Intersegment allocations(3) 14,200 15,504 (1,304) (8.4)%
Income before income taxes(3) 20,190 1,964 18,226 n.m.
(1) Data is in accordance with IFRS except for figures excluding significant items, AUA, AUM, number of Advisory Teams and number of employees. See Non-IFRS Measures on page 14.(2) Includes Canaccord Genuity Wealth Management operations in Canada and the US.(3) Income (loss) before income taxes includes intersegment allocations. See the Intersegment Allocated Costs section on page 43.(4) AUM represents assets managed on a discretionary basis under our programs generally described as or known as the Complete Canaccord Investment Counselling Program and the Complete
Canaccord Private Investment Management Program.(5) AUA is the market value of client assets administered by the Company, for which the Company earns commissions or fees. AUA includes AUM.(6) Effective as of March 31, 2018 the Plan was changed to remove certain employment-related conditions for the vesting of RSU awards made as part of the normal course incentive compensation
payment cycle. As a result of this change, the costs of RSUs granted as part of the normal course incentive compensation payment cycle will be expensed in the period in which those awards aredeemed to be earned, instead of recognizing the costs over the vesting period. This change led to the acceleration of the remaining expense for certain awards made under the LTIP which had notbeen fully amortized as of March 31, 2018. The total charge recorded during the year ended March 31, 2018 in respect of awards granted prior to fiscal 2018 was $0.7 million for the CanaccordGenuity Wealth Management North America segment.
(7) Refer to the Selected Financial Information Excluding Significant Items table on page 23.n.m.: not meaningful
Revenue from Canaccord Genuity Wealth Management North America was $168.9 million, an increase of $36.6 million or 27.7%from fiscal 2017, as a result of stabilizing market conditions and improved client and corporate finance activities. We continue tofocus on growth in our fee-based and proprietary asset management offerings. As a key distribution channel for our capitalmarkets business, the increased investment banking activity contributed to the overall increases in revenue in fiscal 2018compared to fiscal 2017 in our Canadian wealth management business.
AUA in Canada increased by 17.7% to $15.6 billion at March 31, 2018 from $13.2 billion at March 31, 2017, reflecting ourdevelopment initiatives in this sector as well as higher market values over the year. There were 142 Advisory Teams in Canada, anincrease of one from a year ago. The fee-based revenue in our North American operations was 1.2 percentage points lower than inthe prior year and accounted for 33.5% of the wealth management revenue earned in Canada during the year ended March 31,2018. The slight decrease in fee-based revenue as a percentage of revenue was primarily a result of strong transaction-basedrevenue during the year which was led by a 74.1% increase in investment banking revenue attributable to private client activityprimarily in companies in new and developing industries.
Expenses for fiscal 2018 were $135.2 million, an increase of $20.3 million or 17.7% from fiscal 2017. As a result of the revenueincrease in the current fiscal year compared to fiscal 2017 and the relatively fixed nature of expenses other than incentivecompensation, total expenses as a percentage of revenue decreased by 6.8 percentage points compared to last year.
Effective as of March 31, 2018 the LTIP was changed to remove certain employment-related conditions for the vesting of RSUawards that were made as part of the normal course incentive compensation payment cycle. With the change, RSUs will continue
Management’s Discussion and Analysis 39
2018 ANNUAL REPORT / CANACCORD GENUITY GROUP INC.
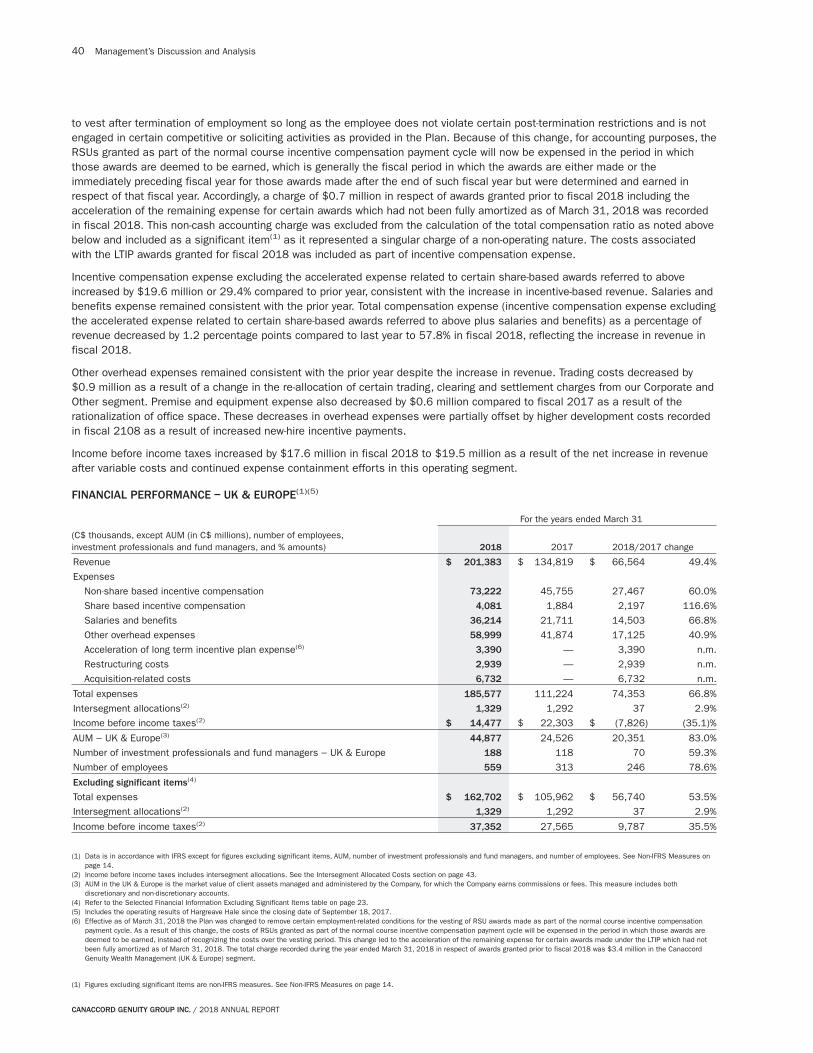
to vest after termination of employment so long as the employee does not violate certain post-termination restrictions and is notengaged in certain competitive or soliciting activities as provided in the Plan. Because of this change, for accounting purposes, theRSUs granted as part of the normal course incentive compensation payment cycle will now be expensed in the period in whichthose awards are deemed to be earned, which is generally the fiscal period in which the awards are either made or theimmediately preceding fiscal year for those awards made after the end of such fiscal year but were determined and earned inrespect of that fiscal year. Accordingly, a charge of $0.7 million in respect of awards granted prior to fiscal 2018 including theacceleration of the remaining expense for certain awards which had not been fully amortized as of March 31, 2018 was recordedin fiscal 2018. This non-cash accounting charge was excluded from the calculation of the total compensation ratio as noted abovebelow and included as a significant item(1) as it represented a singular charge of a non-operating nature. The costs associatedwith the LTIP awards granted for fiscal 2018 was included as part of incentive compensation expense.
Incentive compensation expense excluding the accelerated expense related to certain share-based awards referred to aboveincreased by $19.6 million or 29.4% compared to prior year, consistent with the increase in incentive-based revenue. Salaries andbenefits expense remained consistent with the prior year. Total compensation expense (incentive compensation expense excludingthe accelerated expense related to certain share-based awards referred to above plus salaries and benefits) as a percentage ofrevenue decreased by 1.2 percentage points compared to last year to 57.8% in fiscal 2018, reflecting the increase in revenue infiscal 2018.
Other overhead expenses remained consistent with the prior year despite the increase in revenue. Trading costs decreased by$0.9 million as a result of a change in the re-allocation of certain trading, clearing and settlement charges from our Corporate andOther segment. Premise and equipment expense also decreased by $0.6 million compared to fiscal 2017 as a result of therationalization of office space. These decreases in overhead expenses were partially offset by higher development costs recordedin fiscal 2108 as a result of increased new-hire incentive payments.
Income before income taxes increased by $17.6 million in fiscal 2018 to $19.5 million as a result of the net increase in revenueafter variable costs and continued expense containment efforts in this operating segment.
FINANCIAL PERFORMANCE − UK & EUROPE(1)(5)
For the years ended March 31
(C$ thousands, except AUM (in C$ millions), number of employees,investment professionals and fund managers, and % amounts) 2018 2017 2018/2017 change
Revenue $ 201,383 $ 134,819 $ 66,564 49.4%
Expenses
Non-share based incentive compensation 73,222 45,755 27,467 60.0%
Share based incentive compensation 4,081 1,884 2,197 116.6%
Salaries and benefits 36,214 21,711 14,503 66.8%
Other overhead expenses 58,999 41,874 17,125 40.9%
Acceleration of long term incentive plan expense(6) 3,390 — 3,390 n.m.
Restructuring costs 2,939 — 2,939 n.m.
Acquisition-related costs 6,732 — 6,732 n.m.
Total expenses 185,577 111,224 74,353 66.8%
Intersegment allocations(2) 1,329 1,292 37 2.9%
Income before income taxes(2) $ 14,477 $ 22,303 $ (7,826) (35.1)%
AUM − UK & Europe(3) 44,877 24,526 20,351 83.0%
Number of investment professionals and fund managers − UK & Europe 188 118 70 59.3%
Number of employees 559 313 246 78.6%
Excluding significant items(4)
Total expenses $ 162,702 $ 105,962 $ 56,740 53.5%
Intersegment allocations(2) 1,329 1,292 37 2.9%
Income before income taxes(2) 37,352 27,565 9,787 35.5%
(1) Data is in accordance with IFRS except for figures excluding significant items, AUM, number of investment professionals and fund managers, and number of employees. See Non-IFRS Measures onpage 14.
(2) Income before income taxes includes intersegment allocations. See the Intersegment Allocated Costs section on page 43.(3) AUM in the UK & Europe is the market value of client assets managed and administered by the Company, for which the Company earns commissions or fees. This measure includes both
discretionary and non-discretionary accounts.(4) Refer to the Selected Financial Information Excluding Significant Items table on page 23.(5) Includes the operating results of Hargreave Hale since the closing date of September 18, 2017.(6) Effective as of March 31, 2018 the Plan was changed to remove certain employment-related conditions for the vesting of RSU awards made as part of the normal course incentive compensation
payment cycle. As a result of this change, the costs of RSUs granted as part of the normal course incentive compensation payment cycle will be expensed in the period in which those awards aredeemed to be earned, instead of recognizing the costs over the vesting period. This change led to the acceleration of the remaining expense for certain awards made under the LTIP which had notbeen fully amortized as of March 31, 2018. The total charge recorded during the year ended March 31, 2018 in respect of awards granted prior to fiscal 2018 was $3.4 million in the CanaccordGenuity Wealth Management (UK & Europe) segment.
(1) Figures excluding significant items are non-IFRS measures. See Non-IFRS Measures on page 14.
40 Management’s Discussion and Analysis
CANACCORD GENUITY GROUP INC. / 2018 ANNUAL REPORT
Operating results of Hargreave Hale are included under Canaccord Genuity Wealth Management (UK & Europe) since the closingdate of September 18, 2017.
Revenue generated by our UK & Europe operations is largely produced through fee-based accounts and portfolio managementactivities, and, as such, is less sensitive to changes in market conditions. Revenue for fiscal 2018 was $201.4 million, anincrease of 49.4% compared to fiscal 2017. Measured in local currency (GBP), revenue was £118.0 million during fiscal 2018, anincrease of £38.4 million or 49.2% compared to the previous year. Hargreave Hale contributed £30.8 million or 79.2% of the totalincrease in revenue compared to fiscal 2017.
AUM in the UK & Europe as of March 31, 2018 was $44.9 billion, an increase of 83.0% compared to $24.5 billion as ofMarch 31, 2017. Measured in local currency (GBP), AUM increased by 69.0% when compared to March 31, 2017, with HargreaveHale contributing 96.0 percentage points of this increase. The fee-related revenue in our UK & European wealth managementoperations accounted for 68.5% of total revenue in this geography in fiscal 2018, a decrease of 0.7 percentage points comparedto last year as a result of the increase in transactional revenue.
As discussed above, effective as of March 31, 2018, the LTIP Plan was changed to remove certain employment-related conditionsfor the vesting of RUS awards made as part of the normal course incentive compensation payment cycle. As a result of thischange, the costs of RSUs granted as part of the normal course incentive compensation payment cycle are expensed in the periodin which those awards are deemed to be earned, instead of recognizing the costs over the vesting period. This change led to theacceleration of the remaining expense for certain awards which had not been fully amortized as of March 31, 2018. The totalamount of LTIP expense in respect of awards granted prior to fiscal 2018 including the acceleration of the remaining expense forcertain awards which had not been fully amortized as of March 31, 2018 was $3.4 million for our UK & Europe wealthmanagement operations. This non-cash accounting charge was excluded from the calculation of the total compensation ratio andincluded as a significant item(1) as it represented a singular charge of a non-operating nature. The costs associated with LTIPawards granted for fiscal 2018 was included as part of incentive compensation expense.
Incentive compensation expense (excluding the accelerated expense related to certain share-based awards referred to above) was$77.3 million, a $29.7 million increase from $47.6 million in fiscal 2017, in line with the increase in incentive-based commissionsand fees revenue. Salaries and benefits expense increased by $14.5 million compared to fiscal 2017 to $36.2 million primarily asa result of a larger team required to support the growth in the existing UK & Europe wealth management business as well as thenewly acquired Hargreave Hale operations. Total compensation expense (incentive compensation expense excluding theaccelerated expense related to certain share-based awards referred to above plus salaries and benefits) as a percentage ofrevenue increased by 4.9 percentage points from 51.4% in fiscal 2017 to 56.4% in fiscal 2018 mainly due to the increase in fixedstaff costs as discussed above.
Other overhead expenses for the year ended March 31, 2018 increased by $17.1 million or 40.9% compared to last year. Theincreased headcount and expanded operations resulting from the acquisition of Hargreave Hale in Q2/18 led to an increase inmost of our overhead expenses, particularly in communication and technology as well as general and administrative expense.Amortization expense for fiscal 2018 also increased by $3.5 million mainly as a result of the intangible assets amortization inconnection with the acquisition of Hargreave Hale. Partially offsetting these increases was a $0.4 million decrease in developmentcosts compared to the prior year as a result of lower hiring incentives.
Included in development costs were $1.5 million of incentive-based payments related to the acquisition of Hargreave Hale.
There were $2.9 million of restructuring costs recorded in fiscal 2018 related to the rationalization of office space due to theacquisition of Hargreave Hale. No restructuring costs were recorded during the same period last year.
The Company also recorded $6.7 million of acquisition-related costs in relation to the acquisition of Hargreave Hale for the yearended March 31, 2018. The acquisition-related costs included professional and consulting fees incurred during the year.
Income before income taxes was $14.5 million compared to $22.3 million in the same period a year ago mainly as a result of therestructuring and acquisition-related costs incurred during fiscal 2018, as well as the acceleration of LTIP expense, as discussedabove. Excluding significant items(1), income before income taxes was $37.4 million, an increase of $9.8 million or 35.5% fromthe prior year, reflecting the net contribution from our expanded operations.
CORPORATE AND OTHER SEGMENT
Overview
The Corporate and Other segment includes Pinnacle Correspondent Services, interest, foreign exchange revenue, and expensesnot specifically allocable to Canaccord Genuity or Canaccord Genuity Wealth Management.
Pinnacle Correspondent Services provides trade execution, clearing, settlement, custody, and other middle- and back-officeservices to other introducing brokerage firms, portfolio managers and other financial intermediaries. This business unit wasdeveloped as an extension and application of the Company’s substantial investment in its information technology and operatinginfrastructure.
(1) Figures excluding significant items are non-IFRS measures. See Non-IFRS Measures on page 14.
Management’s Discussion and Analysis 41
2018 ANNUAL REPORT / CANACCORD GENUITY GROUP INC.

Also included in this segment are the Company’s administrative, operational and support services departments, which areresponsible for front- and back-office information technology systems, compliance and risk management, operations, legal,finance, and other administrative functions. The Company has 288 employees in the Corporate and Other segment. Most of theCompany’s corporate support functions are based in Vancouver and Toronto, Canada.
Our operations group is responsible for processing securities transactions, including the clearing and settlement of securitiestransactions, account administration and custody of client securities. The finance department is responsible for internal financialaccounting and controls, and external financial and regulatory reporting, while the compliance department is responsible for clientcredit and account monitoring in relation to certain legal and financial regulatory requirements. The Company’s risk managementand compliance activities include procedures to identify, control, measure and monitor the Company’s risk exposure at all times.
FINANCIAL PERFORMANCE(1)
For the years ended March 31
(C$ thousands, except number of employees and % amounts) 2018 2017 2018/2017 change
Revenue $ 15,056 $ 14,044 $ 1,012 7.2%
Expenses
Non-share based incentive compensation 8,479 8,718 (239) (2.7)%
Share based incentive compensation 2,992 1,596 1,396 87.5%
Salaries and benefits 26,198 26,554 (356) (1.3)%
Other overhead expenses 18,623 26,833 (8,210) (30.6)%
Acceleration of long-term incentive plan expense(3) 1,898 — 1,898 n.m.
Share of loss of an associate 298 — 298 n.m.
Total expenses 58,488 63,701 (5,213) (8.2)%
Intersegment allocations(2) (32,053) (35,006) 2,953 8.4%
Loss before income tax recovery(2) $ (11,379) $ (14,651) $ 3,272 22.3%
Number of employees 288 279 9 3.2%
Excluding significant items(4)
Total expenses $ 56,590 $ 63,701 $ (7,111) (11.2)%
Intersegment allocations(2) (32,053) (35,006) 2,953 8.4%
Loss before income taxes (recovery)(2) (9,481) (14,651) 5,170 35.3%
(1) Data is in accordance with IFRS except for figures excluding significant items and number of employees. See Non-IFRS Measures on page 14.(2) Loss before income tax recovery includes intersegment allocations. See the Intersegment Allocated Costs section.(3) Effective as of March 31, 2018 the Plan was changed to remove certain employment-related conditions for the vesting of RSU awards made as part of the normal course incentive compensation
payment cycle. As a result of this change, the costs of RSUs granted as part of the normal course incentive compensation payment cycle will be expensed in the period in which those awards aredeemed to be earned, instead of recognizing the costs over the vesting period. This change led to the acceleration of the remaining expense for certain awards made under the LTIP which had notbeen fully amortized as of March 31, 2018. The total charge recorded during the year ended March 31, 2018 in respect of awards granted prior to fiscal 2018 was $1.9 million for our Corporate andOther segment.
(4) Refer to the Selected Financial Information Excluding Significant Items table on page 23.
Revenue for fiscal 2018 was $15.1 million, an increase of $1.0 million or 7.2% from fiscal 2017 primarily related to an increasein foreign exchange gains.
Total expenses were $58.5 million for the year ended March 31, 2018, a decrease of $5.2 million or 8.2% compared to the prioryear. Total compensation expense increased by $0.8 million compared to the prior year.
The total amount of LTIP expense recorded in respect of awards granted prior to fiscal 2018 including the acceleration of theremaining expense for certain awards which had not been fully amortized as of March 31, 2018 was $1.9 million. This non-cashaccounting charge was included as a significant item(1) in our adjusted earnings (i.e. excluding significant items).
Other overhead expenses decreased by $8.2 million or 30.6% compared to the prior year. The most significant decreases werepremises and equipment expense, general and administrative expense and development costs. Premises and equipment expensedecreased by $4.4 million compared to the year ended March 31, 2017 as a result of costs associated with the rationalization ofour office space in Toronto recorded in the prior year. General and administrative expense decreased by $5.0 million as a result ofhigher professional fees incurred in the prior year as well as cost reduction efforts made during the year. There was an accountingimpairment charge of $2.4 million recorded in fiscal 2017 related an investment which was the primary reason for the decrease indevelopment costs. Offsetting these decreases was a $3.3 million increase in interest expense, partially related to the convertibledebentures issued during the third quarter of fiscal 2017.
Loss before income taxes was $11.3 million for fiscal 2018 compared to a loss before income taxes of $14.7 million for the prioryear. Excluding significant items(1), loss before income taxes was $9.5 million for the year ended March 31, 2018 compared to aloss before income taxes of $14.7 million last year as a result of a reduction in overhead expenses.
(1) Figures excluding significant items are non-IFRS measures. See Non-IFRS Measures on page 14.
42 Management’s Discussion and Analysis
CANACCORD GENUITY GROUP INC. / 2018 ANNUAL REPORT

INTERSEGMENT ALLOCATED COSTS
Included in the Corporate and Other segment are certain support services, research and other expenses that have been incurredto support the activities within the Canaccord Genuity and Canaccord Genuity Wealth Management segments in Canada. Certaintrading, clearing and settlement charges are included as a trading cost in the applicable business units and as a trading costrecovery in Corporate and Other. In addition, certain overhead costs are charged by Canaccord Genuity UK & Europe to CanaccordGenuity Wealth Management UK & Europe and included in intersegment allocated costs for these business units.
Financial Condition
Below are selected balance sheet items for the past five years:
Balance sheet summary as at March 31
(C$ thousands) 2018 2017 2016 2015 2014
Assets
Cash and cash equivalents $ 862,838 $ 677,769 $ 428,329 $ 322,324 $ 364,296
Securities owned 469,217 784,230 564,746 848,128 1,143,201
Accounts receivable 2,215,837 3,395,736 2,041,150 2,491,488 2,785,898
Income taxes recoverable 1,170 1,085 12,537 5,295 3,983
Deferred tax assets 19,941 15,323 11,221 10,148 9,735
Investments 2,035 2,829 5,578 8,693 9,977
Equipment and leasehold improvements 30,967 31,479 37,049 43,373 50,975
Goodwill and other intangible assets 418,731 295,065 323,936 640,456 646,557
Total assets $ 4,020,736 $ 5,203,516 $ 3,424,546 $ 4,369,905 $ 5,014,622
Liabilities and shareholders’ equity
Bank indebtedness $ — $ 25,280 $ 14,910 $ 20,264 $ —
Securities sold short 301,006 645,742 427,435 654,639 913,913
Accounts payable and accrued liabilities 2,638,954 3,669,883 2,185,047 2,527,636 2,877,933
Provisions 8,428 11,793 18,811 14,320 10,334
Income taxes payable 7,851 10,093 4,242 8,172 10,822
Current portion of bank loan 9,679 — — — —
Deferred consideration 9,997 — — — —
Contingent consideration 49,844 — — — —
Bank loan 61,758 — — — —
Deferred tax liabilities 13,715 140 450 2,057 3,028
Liability portion of Convertible Debenture 57,081 56,442 — — —
Subordinated debt 7,500 7,500 15,000 15,000 15,000
Shareholders’ equity 841,352 764,785 749,929 1,117,542 1,168,680
Non-controlling interests 13,571 11,858 8,722 10,275 14,912
Total liabilities and shareholders’ equity $ 4,020,736 $ 5,203,516 $ 3,424,546 $ 4,369,905 $ 5,014,622
ASSETS
Cash and cash equivalents were $862.8 million at March 31, 2018 compared to $677.8 million at March 31, 2017. Refer to theLiquidity and Capital Resources section for more details.
Securities owned were $469.2 million at March 31, 2018 compared to $784.2 million at March 31, 2017 mainly due to adecrease in corporate and government debt owned.
Accounts receivable were $2.2 billion at March 31, 2018 compared to $3.4 billion at March 31, 2017, mainly due to a decreasein receivables from brokers and investment dealers.
Goodwill was $258.0 million and intangible assets were $160.8 million at March 31, 2018. At March 31, 2017, goodwill was$192.2 million and intangible assets were $102.8 million. These amounts represent the goodwill and intangible assets acquiredthrough the purchases of Genuity Capital Markets, Collins Stewart Hawkpoint plc (‘‘CSHP’’), Eden Financial Ltd., and as ofSeptember 18, 2017, Hargreave Hale.
Other assets, consisting of income taxes receivable, deferred tax assets, equipment, investments and leasehold improvementswere $54.1 million at March 31, 2018 compared to $50.7 million at March 31, 2017, mainly due to an increase in deferred taxassets. The Company, through a wholly-owned subsidiary, invested $2.5 million in Canaccord Genuity Acquisition Corp. (‘‘CGAC’’), a
Management’s Discussion and Analysis 43
2018 ANNUAL REPORT / CANACCORD GENUITY GROUP INC.
special purpose acquisition corporation formed for the purpose of effecting an acquisition of one or more businesses. Theinvestment is accounted for using the equity method. The Company’s equity portion of the net loss of CGAC for the year endedMarch 31, 2018 was $0.3 million.
LIABILITIES AND SHAREHOLDERS’ EQUITY
Bank overdrafts and call loan facilities utilized by the Company may vary significantly on a day-to-day basis and depend onsecurities trading activity. On March 31, 2018, Canaccord Genuity Group had available credit facilities with banks in Canada andthe UK & Europe in the aggregate amount of $669.2 million [March 31, 2017 − $602.6 million]. These credit facilities, consistingof call loans, letters of credit and daylight overdraft facilities, are collateralized by unpaid client securities and/or securities ownedby the Company. On March 31, 2018, there was bank indebtedness of $nil, compared to $25.3 million on March 31, 2017.
Securities sold short were $301.0 million at March 31, 2018 compared to $645.7 million at March 31, 2017, mostly due to adecrease in short positions in corporate and government debt.
Accounts payable and accrued liabilities, including provisions, were $2.6 billion, a decrease from $3.7 billion on March 31, 2017,mainly due to a decrease in payables to clients and brokers and investment dealers.
Other liabilities, including subordinated debt, income taxes payable and deferred tax liabilities, were $29.1 million at March 31,2018 compared to $17.7 million in the prior year. The increase was mostly due to an increase in deferred tax liabilities recognizedon intangible assets related to the acquisition of Hargreave Hale.
In connection with our acquisition of Hargreave Hale through a subsidiary of the Company, that subsidiary obtained a £40.0 million(C$72.5 million as of March 31, 2018) bank loan to finance a portion of the cash consideration. The loan is repayable ininstalments of principal and interest over a period of 4 years. The interest rate on this loan is LIBOR plus 3.375% per annum. Inconnection with the acquisition, there was also deferred and contingent consideration of $10.0 million and $49.8 million,respectively, recorded as of March 31, 2018. Refer to Note 12 of the audited consolidated financial statements for the year endedMarch 31, 2018 for further information on the purchase consideration for Hargreave Hale.
Bank overdrafts and call loan facilities utilized by the Company may vary significantly on a day-to-day basis and depend onsecurities trading activity. At March 31, 2018, excluding the bank loan discussed above related to the Hargreave Hale acquisition,the Company had available other credit facilities with banks in Canada and the UK in the aggregate amount of $669.2 million[March 31, 2017 − $602.6 million]. These credit facilities, consisting of call loans, subordinated debt, letters of credit anddaylight overdraft facilities, are collateralized by either unpaid client securities and/or securities owned by the Company. As ofMarch 31, 2018, and 2017, there were no balances outstanding under these other credit facilities.
Non-controlling interests were $13.6 million at March 31, 2018 compared to $11.9 million at March 31, 2017, which represents42% of the net assets of our operations in Australia.
Off-Balance Sheet Arrangements
A subsidiary of the Company has entered into secured irrevocable standby letters of credit from a financial institution totaling$2.6 million (US$2.0 million) [March 31, 2017 − $2.7 million (US$2.0 million)] as rent guarantees for its leased premises inNew York.
Bank Indebtedness and Other Credit Facilities
The Company enters into call loans or overdraft positions primarily to facilitate the securities settlement process for both client andCompany securities transactions. The bank indebtedness is collateralized by unpaid client securities and/or securities owned by theCompany. As of March 31, 2018, the Company had $nil of bank indebtedness outstanding [March 31, 2017 − $25.3 million].
In connection with the acquisition of Hargreave Hale, a subsidiary of the Company obtained a £40.0 million (C$72.5 million as ofMarch 31, 2018) bank loan to finance a portion of the cash consideration. The loan is repayable in instalments of principal andinterest over a period of 4 years. The interest rate on this loan is LIBOR plus 3.375% per annum.
As discussed above, excluding the bank loan related to the acquisition, subsidiaries of the Company also have other creditfacilities, such as call loans, letters of credit and overdraft facilities, with banks in Canada and the UK. The aggregate amount ofother credit facilities available to the Company was $669.2 million as of March 31, 2018 [March 31, 2017 − $602.6 million]. Asof March 31, 2018, there were no balances outstanding under these other credit facilities.
In the normal course of business, the Company enters into contracts that give rise to commitments of future minimum paymentsthat affect its liquidity.
44 Management’s Discussion and Analysis
CANACCORD GENUITY GROUP INC. / 2018 ANNUAL REPORT

The following table summarizes Canaccord Genuity Group’s long term contractual obligations on March 31, 2018:
(C$ thousands) Total Fiscal 2019Fiscal 2020 −
Fiscal 2021Fiscal 2022 −
Fiscal 2023 Thereafter
Premises and equipment operating leases 177,165 32,476 59,427 44,517 40,745
Bank loan(1) 72,500 9,679 24,179 38,642 —
Convertible debentures(2) 75,600 3,900 7,800 63,900 —
Total contractual obligations 325,265 46,055 91,406 147,059 40,745
(1) Bank loan consists of £40,000,000 credit facility obtained to finance a portion of the cash consideration for the acquisition of Hargreave Hale. The bank loan bears interest at LIBOR plus 3.375%per annum and is repayable in instalments of principal and interest over 4 years and matures in September of 2021.
(2) Convertible debentures consist of the unsecured senior subordinated convertible debentures (the ‘‘Debentures’’) issued in Q3/17. The Debentures bear interest at a rate of 6.50% per annum andmature on December 31, 2021. The Company, under certain circumstances, may redeem the Debentures on or after December 31, 2019.
Liquidity and Capital Resources
The Company has a capital structure comprised of preferred shares, common shares, contributed surplus, debentures, warrants,retained earnings and accumulated other comprehensive income. On March 31, 2018, cash and cash equivalents were$862.8 million, an increase of $185.1 million from $677.8 million as of March 31, 2017. During the year ended March 31, 2018,financing activities used cash in the amount of $10.3 million, mainly due to cash used in the acquisition of common shares forthe Company’s long-term incentive plan, payment of preferred and common share dividends, and a decrease in bankindebtedness, partially offset by the proceeds from the bank loan obtained in relation to the acquisition of Hargreave Hale.Investing activities used cash in the amount of $63.7 million mainly for the acquisition of Hargreave Hale and the purchase ofleasehold improvements. Operating activities generated cash of $244.1 million, which was largely due to changes in non-cashworking capital. An increase in cash of $15.0 million was attributable to the effect of foreign exchange translation on cashbalances.
The Company’s business requires capital for operating and regulatory purposes. The majority of current assets reflected on theCompany’s audited consolidated statements of financial position are highly liquid. The majority of the positions held as securitiesowned are readily marketable, and all are recorded at their fair value. Securities sold short are highly liquid securities. The fairvalue of these securities fluctuates daily as factors such as changes in market conditions, economic conditions and investoroutlook affect market prices. Client receivables are secured by readily marketable securities and are reviewed daily for impairmentin value and collectability. Receivables and payables from brokers and dealers represent the following: current open transactionsthat generally settle within the normal three-day settlement cycle (as of September 30, 2017, the North American markets movedto a two-day settlement cycle); collateralized securities borrowed and/or loaned in transactions that can be closed within a fewdays on demand; and balances on behalf of introducing brokers representing net balances in connection with their clientaccounts.
Preferred Shares
SERIES A PREFERRED SHARES
In fiscal 2012, the Company issued 4,540,000 Cumulative 5-Year Rate Reset First Preferred Shares, Series A (Series A PreferredShares) at a purchase price of $25.00 per share for gross proceeds of $113.5 million. The aggregate net amount recognized afterdeducting issue costs, net of deferred taxes of $1.0 million, was $110.8 million.
Quarterly cumulative cash dividends, as declared, were paid at an annual rate of 5.5% for the initial five-year period ended onSeptember 30, 2016. Commencing October 1, 2016 and ending on and including September 30, 2021, quarterly cumulativedividends, if declared, will be paid at an annual rate of 3.885%. Thereafter, the dividend rate will be reset every five years at a rateequal to the five-year Government of Canada bond yield plus 3.21%.
Holders of Series A Preferred Shares had the option to convert any or all of their shares into an equal number of CumulativeFloating Rate First Preferred Shares, Series B (Series B Preferred Shares), subject to certain conditions, on September 30, 2016and have the option on September 30 every five years thereafter. The number of shares tendered for conversion by the conversiondeadline of September 15, 2016 was below the minimum required to proceed with the conversion and, accordingly, no Series BPreferred Shares were issued. Series B Preferred Shares would entitle any holders thereof to receive floating rate, cumulative,preferential dividends payable quarterly, if declared, at a rate equal to the three-month Government of Canada Treasury Bill yieldplus 3.21%.
The Company had the option to redeem the Series A Preferred Shares on September 30, 2016, and has the option to redeem onSeptember 30 every five years thereafter, in whole or in part, at $25.00 per share together with all declared and unpaid dividends.
Management’s Discussion and Analysis 45
2018 ANNUAL REPORT / CANACCORD GENUITY GROUP INC.
SERIES C PREFERRED SHARES
In fiscal 2013, the Company issued 4,000,000 Cumulative 5-Year Rate Reset First Preferred Shares, Series C (Series C PreferredShares) at a purchase price of $25.00 per share for gross proceeds of $100.0 million. The aggregate net amount recognized afterdeducting issue costs, net of deferred taxes of $1.0 million, was $97.5 million.
Quarterly cumulative cash dividends, as declared, were paid at an annual rate of 5.75% for the initial five-year period ending onJune 30, 2017. Commencing July 1, 2017 and ending on and including June 30, 2022, quarterly cumulative dividends, if declared,will be paid at an annual rate of 4.993%. Thereafter, the dividend rate will be reset every five years at a rate equal to the five-yearGovernment of Canada bond yield plus 4.03%.
Holders of Series C Preferred Shares had the option to convert any or all of their shares into an equal number of CumulativeFloating Rate First Preferred Shares, Series D (Series D Preferred Shares), subject to certain conditions, on June 30, 2017 andhave the option on June 30 every five years thereafter. The number of shares tendered for conversion by the conversion deadlineof June 30, 2017 was below the minimum required to proceed with the conversion and, accordingly, no Series D Preferred Shareswere issued. Series D Preferred Shares would entitle any holders thereof to receive floating rate, cumulative, preferential dividendspayable quarterly, if declared, at a rate equal to the three-month Government of Canada Treasury Bill yield plus 4.03%.
The Company had the option to redeem the Series C Preferred Shares on June 30, 2017, and has the option to redeem onJune 30 every five years thereafter, in whole or in part, at $25.00 per share together with all declared and unpaid dividends.
CONVERTIBLE DEBENTURES
In fiscal 2017, the Company issued convertible unsecured senior subordinated debentures (‘‘Debentures’’) in the aggregateprincipal amount of $60.0 million. The Debentures bear interest at a rate of 6.50% per annum. The Debentures are convertible atthe holder’s option into common shares of the Company at a conversion price of $6.50 per share. The Debentures will mature onDecember 31, 2021 and may be redeemed by the Company, in certain circumstances, on or after December 31, 2019.
Outstanding Share Data
Outstanding shares as of March 31
2018 2017
Preferred shares
Series A − issued shares outstanding 4,540,000 4,540,000
Series C − issued shares outstanding 4,000,000 4,000,000
Common shares
Issued shares excluding unvested shares(1) 93,053,875 92,779,817
Issued shares outstanding(2) 113,522,629 113,511,468
Issued shares outstanding − diluted(3) 124,294,132 124,479,390
Average shares outstanding − basic 92,587,216 91,656,708
Average shares outstanding − diluted(4) 110,862,087 101,149,072
Average shares outstanding − diluted, excluding significant items(4)(5) 120,092,836 101,149,072
(1) Excludes 654,322 outstanding unvested shares related to share purchase loans for recruitment and 19,814,432 unvested shares purchased by the employee benefit trusts for the LTIP.(2) Includes 654,322 unvested shares related to share purchase loans for recruitment and 19,814,432 unvested shares purchased by the employee benefit trusts for the LTIP.(3) Includes 10,771,503 of share issuance commitments net of forfeitures.(4) This is the diluted share number used to calculate diluted EPS. For years with net losses attributable to common shareholders, all instruments involving potential common shares were excluded
from the calculation of diluted earnings per share as they were anti-dilutive.(5) See Non-IFRS Measures on page 14. This is the diluted share number used to calculate diluted EPS on an excluding significant items basis.
On August 11, 2017, the Company filed a notice to renew the normal course issuer bid (NCIB) to provide the Company with thechoice to purchase up to a maximum of 5,675,573 of its common shares during the period from August 15, 2017 to August 14,2018 through the facilities of the TSX and on alternative trading systems in accordance with the requirements of the TSX.Shareholders may obtain a copy of the notice, without charge, by contacting the Company. The purpose of the purchase ofcommon shares under the NCIB is to enable the Company to acquire shares for cancellation. The maximum number of shares thatmay be purchased under this and the previous NCIB represents 5.0% of the Company’s outstanding common shares at the time ofthe notice. There were no shares purchased and cancelled through the NCIB between April 1, 2017 and March 31, 2018.
The Company has entered into a predefined plan with a designated broker to allow for the repurchase of its common shares underthis NCIB. The Company’s broker may repurchase the common shares under the plan on any trading day during the NCIB, includingat any time during the Company’s internal trading blackout periods. The plan has been reviewed by the TSX and will terminate onthe earlier of the termination of the plan by the Company in accordance with its terms and the expiry of the NCIB.
The ability to make purchases under the current NCIB commenced on August 15, 2017, and will continue for one year (toAugust 14, 2018) at the discretion of the Company. The maximum consideration will be the market price of the securities at thetime of acquisition. In order to comply with the trading rules of the TSX, the daily purchases are limited to 54,968 common shares
46 Management’s Discussion and Analysis
CANACCORD GENUITY GROUP INC. / 2018 ANNUAL REPORT

of the Company (which is 25% of the average daily trading volume of common shares of the Company on the TSX in the sixcalendar months from February 2017 to July 2017.)
As of May 31, 2018, the Company has 113,531,412 common shares issued and outstanding.
ISSUANCE AND CANCELLATION OF COMMON SHARE CAPITAL
Fiscal 2018
Total common shares issued and outstanding as of March 31, 2017 113,511,468
Shares issued in connection with replacement plans 11,161
Total common shares issued and outstanding as of March 31, 2018 113,522,629
Share-Based Payment Plans
LONG-TERM INCENTIVE PLAN
Under the long-term incentive plan (LTIP), eligible participants are awarded restricted share units (RSUs), which generally vest overthree years. For employees in Canada, the United States, Channel Islands, Australia and the United Kingdom, employee benefittrusts (the Trusts) have been established. The Company or certain of its subsidiaries, as the case may be, fund the Trusts withcash which is used by the trustees to purchase common shares on the open market that will be held in the Trusts until the RSUsvest.
FORGIVABLE COMMON SHARE PURCHASE LOANS
The Company provides loans to certain employees (other than directors or executive officers) for the purpose of partially fundingthe purchase of shares of the Company and increasing share ownership by the employees. The Company has provided such loansto executive officers in the past but has now adopted a policy not to make any further such loans to directors or executive officers.When made, these loans are forgiven over a vesting period. No interest is charged related to the share purchase loans.
REPLACEMENT PLANS
As a result of the acquisition of CSHP, the Company introduced the Replacement Annual Bonus Equity Deferral (ABED) plan, whichreplaced the ABED plans that existed at CSHP as of the acquisition date. Eligible employees who participated in the CSHP ABEDplan were granted awards under the Replacement ABED plan. In addition, the Company introduced the Replacement Long-termIncentive Plan, which replaced the existing LTIPs at CSHP as of the acquisition date for eligible employees.
SHARE OPTIONS
The Company previously granted share options to purchase common shares of the Company to independent directors and seniormanagement. As at March 31, 2018, all share options have expired.
DEFERRED SHARE UNITS
Beginning April 1, 2011, the Company adopted a deferred share unit (DSU) plan for its independent directors. The independentdirectors can elect to have fees payable to them paid in the form of DSUs or in cash. Directors must elect annually as to how theywish their directors’ fees to be paid and can specify the allocation of their directors’ fees between DSUs and cash. When adirector leaves the Board of Directors, outstanding DSUs are paid out in cash, with the amount equal to the number of DSUsgranted multiplied by the closing share price as of the end of the fiscal quarter immediately following such terminations. Under theplan, the directors are not entitled to receive any common shares in the Company, and under no circumstances will DSUs conferon any participant any of the rights or privileges of a holder of common shares.
PERFORMANCE SHARE UNITS
For the year ended March 31, 2018, the Company adopted a performance share unit (‘‘PSU’’) plan for certain senior executives.The PSUs are a notional equity-based instrument linked to the value of the Company’s common shares. At the end of a 3-yearvesting period, the number of PSUs which vest is determined upon performance against certain pre-determined metrics. The PSUscliff vest on the 3rd anniversary of the date of the grant. The PSUs are settled in cash, based on the average share price of theCompany’s shares at the time of vesting.
OTHER RETENTION AND INCENTIVE PLANS
There were other retention and incentive plans, including the employee stock purchase plan, with individual employees, for whichthe amount incurred was not significant in the aggregate.
Management’s Discussion and Analysis 47
2018 ANNUAL REPORT / CANACCORD GENUITY GROUP INC.

Related Party Transactions
The Company’s related parties include the following persons and/or entities: (a) entities that are controlled or significantlyinfluenced by the Company, and (b) key management personnel, who are comprised of the directors of the Company, as well asexecutives involved in strategic decision-making for the Company.
The Company’s trading subsidiaries and intermediate holding companies are listed in the following table:
% equity interestCountry of
incorporationMarch 31,
2018March 31,
2017
Canaccord Genuity Corp. Canada 100% 100%
CG Investments Inc. Canada 100% n/a
Canaccord Genuity SAS France 100% 100%
Canaccord Genuity Wealth (International) Limited Guernsey 100% 100%
Canaccord Genuity Financial Planning Limited United Kingdom 100% 100%
Canaccord Genuity Wealth Limited United Kingdom 100% 100%
Canaccord Genuity Wealth Group Limited United Kingdom 100% 100%
Canaccord Genuity Wealth (International) Holdings Limited Guernsey 100% 100%
Hargreave Hale Limited United Kingdom 100% n/a
Canaccord Genuity Limited United Kingdom 100% 100%
Canaccord Genuity Wealth Group Holdings Ltd. Canada 100% 100%
Canaccord Genuity LLC United States 100% 100%
Canaccord Genuity Wealth Management (USA) Inc. United States 100% 100%
Canaccord Genuity Wealth & Estate Planning Services Ltd. Canada 100% 100%
Canaccord Asset Management Inc. Canada 100% 100%
Canaccord Adams Financial Group Inc. United States 100% 100%
Collins Stewart Inc. United States 100% 100%
Canaccord Adams BC ULC Canada 100% 100%
Canaccord Adams (Delaware) Inc. United States 100% 100%
Canaccord Genuity Securities LLC United States 100% 100%
Stockwave Equities Ltd. Canada 100% 100%
CLD Financial Opportunities Limited Canada 100% 100%
Canaccord Genuity (Hong Kong) Limited China (Hong Kong SAR) 100% 100%
Canaccord Financial Group (Australia) Pty Ltd* Australia 50% 50%
Canaccord Genuity (Australia) Limited* Australia 50% 50%
(Canaccord Genuity Asia
(Beijing) Limited) China 100% 100%
The Balloch Group Limited British Virgin Islands 100% 100%
Canaccord Genuity Asia (Hong Kong) Limited China (Hong Kong SAR) 100% 100%
Canaccord Genuity (Dubai) Ltd. United Arab Emirates 100% 100%
* The Company owns 50% of the issued shares of Canaccord Financial Group (Australia) Pty Ltd and Canaccord Genuity (Australia) Limited, but for accounting purposes, as of March 31, 2018 theCompany is considered to have a 58% interest because of the shares held in a trust controlled by Canaccord Financial Group (Australia) Pty Ltd [March 31, 2017 − 58%].
Security trades executed for employees, officers and directors of Canaccord Genuity Group Inc. are transacted in accordance withterms and conditions applicable to all clients. Commission income on such transactions in the aggregate is not material inrelation to the overall operations of Canaccord Genuity Group Inc.
The Company offers various share-based payment plans to its key management personnel, including common share purchaseloans, a long-term incentive plan, PSU plan, and share options. Directors have also been granted share options and have the rightto acquire DSUs.
48 Management’s Discussion and Analysis
CANACCORD GENUITY GROUP INC. / 2018 ANNUAL REPORT

Disclosed in the table below are the amounts recognized as expenses related to individuals who are key management personnelas at March 31, 2018 and March 31, 2017.
(in thousands)March 31,
2018March 31,
2017
Short term employee benefits $ 10,515 $ 7,053
Post termination benefits — 1,989
Share-based payments 4,933 3,979
Total compensation paid to key management personnel $ 15,448 $ 13,021
Accounts payable and accrued liabilities include the following balances with key management personnel:
(in thousands)March 31,
2018March 31,
2017
Accounts receivable $ 969 $ 211
Accounts payable and accrued liabilities $ 1,527 $ 219
Critical Accounting Policies and Estimates
The following is a summary of Canaccord Genuity Group’s critical accounting estimates. The Company’s significant accountingpolicies are in accordance with IFRS and are described in Note 5 to the Audited Consolidated Financial Statements for the yearended March 31, 2018. The Company’s consolidated financial statements for the years ended March 31, 2018 and 2017 werealso prepared in accordance with IFRS.
The preparation of the March 31, 2018 Audited Consolidated Financial Statements in conformity with IFRS requires managementto make estimates and assumptions that affect the reported amounts of assets and liabilities and the disclosure of contingentassets and liabilities at the date of the financial statements. Therefore, actual results may differ from those estimates andassumptions. The significant judgments, estimates and assumptions include consolidation, revenue recognition, share-basedpayments, income taxes, tax losses available for carryforward, impairment of goodwill and other assets, indefinite life intangibleassets and other long-lived assets, allowance for credit losses, fair value of financial instruments, capitalization of software costsand provisions. Amendments may be made to estimates relating to net assets acquired in an acquisition as well as the allocationof identifiable intangible assets between indefinite life and finite lives. Judgments, estimates and assumptions were also utilizedin connection with the valuation of goodwill and intangible assets acquired in connection with the acquisition of Hargreave Hale.
Significant accounting policies used and policies requiring management’s judgment and estimates are disclosed in Notes 2 and 5of the Audited Consolidated Financial Statements for the year ended March 31, 2018.
CONSOLIDATION
The Company owns 50% of the voting shares of Canaccord Genuity (Australia) Limited (CGAL) as at March 31, 2018. The Companyalso completed an evaluation of its contractual arrangement with the other shareholders and the control it has over the financialand operating policies of CGAL and determined it should consolidate under IFRS 10, ‘‘Consolidated Financial Statements’’(IFRS 10) as at March 31, 2018 and 2017. Therefore, the financial position, financial performance, and cash flows of CGAL havebeen consolidated. Although the Company owns 50% of the issued shares of CGAL, for accounting purposes, as of March 31,2018, the Company is considered to have a 58% interest because of the shares held in a trust controlled by Canaccord FinancialGroup (Australia) Pty Ltd. and therefore has recognized a 42% non-controlling interest (March 31, 2017 − 42%), which representsthe portion of CGAL’s net identifiable assets not owned by the Company. At the date of acquisition, the non-controlling interest wasdetermined using the proportionate method. Net income (loss) and each component of other comprehensive income (loss) areattributed to the non-controlling interest and to the owners of the parent.
The Company has established employee benefit trusts, which are considered special purpose entities (SPEs), to fulfill obligationsto employees arising from the Company’s share-based payment plans. The employee benefit trusts have been consolidated inaccordance with IFRS 10 since their activities are conducted on behalf of the Company, and the Company retains the majority ofthe benefits and risks of the employee benefit trusts.
INTANGIBLE ASSETS
Identifiable intangible assets acquired separately are measured on initial recognition at cost. The cost of identifiable intangibleassets acquired in a business combination is equal to their fair value as at the date of acquisition. Following initial recognition,identifiable intangible assets are carried at cost less any accumulated amortization and any accumulated impairment losses.
The useful lives of identifiable intangible assets are assessed to be either finite or indefinite. Identifiable intangible assets withfinite lives are amortized over their useful economic lives and assessed for impairment whenever there is an indication that theidentifiable intangible asset may be impaired. The amortization period and the amortization method for an identifiable intangible
Management’s Discussion and Analysis 49
2018 ANNUAL REPORT / CANACCORD GENUITY GROUP INC.

asset are reviewed at least annually, at each financial year end. Identifiable intangible assets with indefinite useful lives are notamortized, but are tested for impairment annually.
Technology development expenditures on an individual project are recognized as an intangible asset when the Company candemonstrate that the technical feasibility of the asset for use has been established. The asset is carried at cost less anyaccumulated amortization and accumulated impairment losses. Amortization of the asset begins when development is completeand the asset is available for use. It is amortized over the period of expected future benefit.
IMPAIRMENT OF NON-FINANCIAL ASSETS
The Company assesses, at each reporting date, whether there is an indication that an asset may be impaired. If any indicationexists, or when annual impairment testing for an asset is required, the Company estimates the asset’s recoverable amount. Anasset’s recoverable amount is the higher of an asset’s or cash-generating unit’s (CGU) fair value less costs to sell and itsvalue-in-use. The recoverable amount is determined for an individual asset, unless the asset does not generate cash inflows thatare largely independent of those from other assets or groups of assets. When the carrying amount of an asset or CGU exceeds itsrecoverable amount, the asset is considered impaired and is written down to its recoverable amount, and the impairment isrecognized in the consolidated statements of operations.
In assessing fair value less costs to sell, the estimated future cash flows are discounted to their present value using a pre-taxdiscount rate that reflects current market assessments of the time value of money and the risks specific to the asset. TheCompany bases its impairment calculation on annual budget calculations, which are prepared separately for each of theCompany’s CGUs to which the individual assets are allocated. These budget calculations generally cover a period of five years. Forlonger periods, a long-term growth rate is calculated and applied to project future cash flows after the fifth year.
Impairment losses are recognized in the consolidated statements of operations in expense categories consistent with the functionof the impaired asset.
For assets excluding goodwill, an assessment is made at each reporting date to determine whether there is an indication thatpreviously recognized impairment losses no longer exist or have decreased. If such indication exists, the Company estimates theasset’s or CGU’s recoverable amount. A previously recognized impairment loss is reversed only if there has been a change in theassumptions used to determine the asset’s recoverable amount since the last impairment loss was recognized. The reversal islimited so that the carrying amount of the asset does not exceed its recoverable amount, or exceed the carrying amount thatwould have been determined, net of depreciation, had no impairment loss been recognized for the asset in prior years. Suchreversal is recognized in the consolidated statement of operations unless the asset is carried at a revalued amount, in which casethe reversal is treated as a revaluation increase.
The following assets have specific characteristics for impairment testing:
Goodwill
Goodwill is tested for impairment at least annually as at March 31 and when circumstances indicate that the carrying value maybe impaired.
Impairment is determined for goodwill by assessing the recoverable amount of each CGU (or group of CGUs) to which goodwillrelates. When the recoverable amount of the CGU is less than its carrying amount, an impairment loss is recognized. Impairmentlosses relating to goodwill cannot be reversed in future periods.
Intangible assets
Intangible assets with indefinite useful lives are tested for impairment annually as at March 31 at the CGU level and whencircumstances indicate that the carrying value may be impaired.
REVENUE RECOGNITION
Revenue is recognized to the extent that it is probable that the economic benefits will flow to the Company and the revenue can bereliably measured. The Company assesses its revenue arrangements in order to determine if it is acting as principal or agent.
Commissions and fees revenue consists of revenue generated through commission-based brokerage services, recognized on atrade date basis, and the sale of fee-based products and services, recognized on an accrual basis. Realized and unrealized gainsand losses on securities purchased for client-related transactions are reported as net facilitation losses and recorded as areduction of commission revenues.
Investment banking revenue consists of underwriting fees and commissions earned on corporate finance activities. Revenue fromunderwritings and other corporate finance activities is recorded when the underlying transaction is substantially completed underthe engagement terms and the related revenue is reasonably determinable.
Advisory fees consist of management and advisory fees that are recognized on an accrual basis. Also included in advisory fees isrevenue from mergers and acquisitions activities, which is recognized when the underlying transaction is substantially completedunder the engagement terms and the related revenue is reasonably determinable.
50 Management’s Discussion and Analysis
CANACCORD GENUITY GROUP INC. / 2018 ANNUAL REPORT

Principal trading revenue consists of income earned in connection with principal trading operations and is recognized on a tradedate basis.
Interest revenue consists of interest earned on client margin accounts, interest earned on the Company’s cash and cashequivalents balances, interest earned on cash delivered in support of securities borrowing activity, and dividends earned onsecurities owned. Interest revenue is recognized on an effective interest rate basis. Dividend income is recognized when the rightto receive payment is established.
Other revenue includes foreign exchange gains or losses, revenue earned from our correspondent brokerage services andadministrative fees revenues.
INCOME TAXES
Current income tax
Current income tax assets and liabilities for the current period are measured at the amount expected to be recovered from or paidto the taxation authorities. The tax rates and tax laws used to compute the amounts are those that are enacted or substantivelyenacted, at the reporting date, in the countries where the Company operates and generates taxable income.
Management periodically evaluates positions taken in the tax returns with respect to situations in which applicable tax regulationsare subject to interpretation and establishes provisions where appropriate.
Current income tax relating to items recognized directly in equity is recognized in equity and not in the consolidated statements ofoperations.
Deferred tax
Deferred taxes are accounted for using the liability method. This method requires that deferred taxes reflect the expected deferredtax effect of temporary differences at the reporting date between the carrying amounts of assets and liabilities for financialstatement purposes and their tax bases.
Deferred tax liabilities are recognized for all taxable temporary differences, except for taxable temporary differences associatedwith investments in subsidiaries where the timing of the reversal of the temporary difference can be controlled and it is probablethat the temporary difference will not reverse in the foreseeable future.
Deferred tax assets are recognized for all deductible temporary differences, carryforward of unused tax credits and carryforward ofunused tax losses, to the extent that it is probable that taxable profit will be available against which the deductible temporarydifferences and the carryforward of unused tax credits and unused tax losses can be utilized. The carrying amounts of deferredtax assets are reviewed at each reporting date and reduced to the extent that it is no longer probable that sufficient taxable profitwill be available to allow all or part of the deferred tax assets to be utilized. Unrecognized deferred tax assets are assessed ateach reporting date and are recognized to the extent that it has become probable that future taxable profits will allow the deferredtax asset to be recovered.
Deferred tax assets and liabilities are measured at the tax rates that are expected to apply to the period when the asset isrealized or the liability is settled, based on tax rates (and tax laws) that have been enacted or substantively enacted by the end ofthe reporting period. Deferred tax is charged or credited in the statements of operations except where it relates to items that maybe credited directly to equity, in which case the deferred tax is recognized directly against equity.
Sales tax
Revenues, expenses and assets are recognized net of the amount of sales tax, except where the amount of sales tax incurred isnot recoverable from the tax authority. In these circumstances, sales tax is recognized as part of the cost of acquisition of theasset or as part of an item of the expense. The net amount of sales tax recoverable from, or payable to, the taxation authority isincluded as part of accounts receivable or accounts payable in the consolidated statements of financial position.
SHARE-BASED PAYMENTS
Employees (including senior executives) of the Company receive remuneration in the form of share-based payment transactions,whereby employees render services as consideration for equity instruments (equity-settled transactions). The participatingemployees are eligible to receive shares that generally vest over three years (the ‘‘RSUs’’). This program is referred to as the“LTIP” (or the ‘‘Plan’’).
Independent directors also receive deferred share units (DSUs) as part of their remuneration, which can only be settled in cash.For the year ended March 31, 2018, certain senior executives receive performance share units (PSUs) as part of theirremuneration, which can only be settled in cash (cash-settled transactions).
The dilutive effect, if any, of outstanding options and share-based payments is reflected as additional share dilution in thecomputation of diluted earnings (loss) per common share.
Management’s Discussion and Analysis 51
2018 ANNUAL REPORT / CANACCORD GENUITY GROUP INC.

Equity-settled transactions
For equity-settled transactions, the Company measures the fair value of share-based awards as of the grant date.
Effective as of March 31, 2018 the Plan was changed so that the vesting of certain RSUs was no longer necessarily contingentupon continued employment. With the change, RSUs will continue to vest after termination of employment so long as theemployee does not violate certain post-termination restrictions and is not engaged in certain competitive or soliciting activities asprovided in the Plan. Because of this change, the Company determined that the awards do not meet the criteria for anin-substance service condition, as defined by IFRS 2. Accordingly, RSUs granted as part of the normal course incentivecompensation payment cycle are expensed in the period in which those awards are deemed to be earned with a correspondingincrease in contributed surplus, which is generally the fiscal period in which the awards are either made or the immediatelypreceding fiscal year for those awards made after the end of such fiscal year but were determined and earned in respect of thatfiscal year.
For certain awards, typically new hire awards or retention awards, vesting is subject to continued employment and therefore theseawards are subject to a continuing service requirement. Accordingly, the Company recognizes the cost as an expense on a gradedbasis over the applicable vesting period with a corresponding increase in contributed surplus. The Company estimates the numberof equity instruments that will ultimately vest when calculating the expense attributable to equity-settled transactions. No expenseis recognized for awards that do not ultimately vest.
When share-based awards vest, contributed surplus is reduced by the applicable amount and share capital is increased by thesame amount.
Cash-settled transactions
The cost of cash-settled transactions is measured initially at fair value at the grant date. The fair values of DSUs and PSUs areexpensed upon grant, as there are no vesting conditions. The liability is remeasured to fair value at each reporting date up to andincluding the settlement date, with changes in fair value recognized through the statements of operations.
TRANSLATION OF FOREIGN CURRENCY TRANSACTIONS AND FOREIGN SUBSIDIARIES
The Company’s consolidated financial statements are presented in Canadian dollars, which is also the Company’s functionalcurrency. Each subsidiary of the Company determines its own functional currency, and items included in the financial statementsof each subsidiary are measured using that functional currency.
Transactions and balances
Transactions in foreign currencies are initially recorded by the Company and its subsidiaries at their respective functionalcurrencies using exchange rates prevailing at the date of the transaction.
Monetary assets and liabilities denominated in foreign currencies are translated by the Company and its subsidiaries into theirrespective functional currencies at the exchange rate in effect at the reporting date. All differences upon translation arerecognized in the consolidated statements of operations.
Non-monetary assets and liabilities denominated in foreign currencies are translated by the Company and its subsidiaries intotheir respective functional currencies at historical rates. Non-monetary items measured at fair value in a foreign currency aretranslated using the exchange rates in effect at the date when the fair value is determined.
Translation of foreign subsidiaries
Assets and liabilities of foreign subsidiaries with a functional currency other than the Canadian dollar are translated into Canadiandollars at rates prevailing at the reporting date, and income and expenses are translated at average exchange rates prevailingduring the period. Unrealized gains or losses arising as a result of the translation of the foreign subsidiaries are recorded inaccumulated other comprehensive income (loss). On disposal of a foreign operation, the component of other comprehensiveincome relating to that particular foreign operation is recognized in the consolidated statements of operations.
The Company also has monetary assets and liabilities that are receivable or payable from a foreign operation. If settlement of thereceivable or payable is neither planned nor likely to occur in the foreseeable future, the differences upon translation arerecognized in accumulated other comprehensive income (loss) as these receivables and payables form part of the net investmentin the foreign operation.
PROVISIONS
Provisions are recognized when the Company has a present obligation as a result of a past event, it is probable that an outflow ofresources embodying economic benefits will be required to settle the obligation and a reliable estimate can be made of theamount of the obligation. The expense relating to any provision is presented in the statements of operations net of anyreimbursement. If the effect of the time value of money is significant, provisions are discounted using a current pre-tax rate thatreflects, where appropriate, the risks specific to the liability. Where discounting is used, the increase in the provision due to thepassage of time is recognized as an interest expense.
52 Management’s Discussion and Analysis
CANACCORD GENUITY GROUP INC. / 2018 ANNUAL REPORT

Financial Instruments
A significant portion of the Company’s assets and liabilities are composed of financial instruments. The Company uses financialinstruments for both trading and non-trading activities. The Company engages in trading activities which include the purchase andsale of securities in the course of facilitating client trades and taking principal trading positions with the objective of earning aprofit.
The use of financial instruments may either introduce or mitigate exposures to market, credit and/or liquidity risks. See RiskManagement in this MD&A for details on how these risks are managed. For significant assumptions made in determining thevaluation of financial and other instruments, refer to Critical Accounting Policies and Estimates in this MD&A. For additionalinformation regarding the Company’s financial instruments, refer to Note 7 of the Audited Consolidated Financial Statements forthe year ended March 31, 2018.
FOREIGN EXCHANGE
The Company manages its foreign exchange risk by periodically hedging pending settlements in foreign currencies. Realized andunrealized gains and losses related to these transactions are recognized in income during the period. On March 31, 2018, forwardcontracts outstanding to sell US dollars had a notional amount of US$17.7 million, a decrease of US$4.4 million compared toMarch 31, 2017. Forward contracts outstanding to buy US dollars had a notional amount of US$2.1 million, a decrease ofUS$0.8 million from March 31, 2017. The fair value of these contracts was nominal. Some of the Company’s operations in theUS, the UK & Europe, Australia, Hong Kong and China are conducted in the local currency; however, any foreign exchange risk inrespect of these transactions is generally limited as pending settlements on both sides of the transaction are typically in the localcurrency.
These contracts were entered into in an attempt to mitigate foreign exchange risk on pending security settlements in foreigncurrencies. The fair value of these contracts is nominal due to their short term to maturity.
The Company’s Canaccord Genuity Wealth Management segment in the UK & Europe trades foreign exchange forward contracts onbehalf of its clients, and establishes matching contracts with the counterparties. The Company has no significant net exposure,assuming no counterparty default.
FUTURES
The Company’s Canadian operations are involved in trading various futures contracts, in an attempt to mitigate market risk,interest rate risk, yield curve risk and liquidity risk. Futures contracts are agreements to buy or sell a standardized amount of anunderlying asset, at a predetermined future date and price, in accordance with terms specified by a regulated futures exchange,and are subject to daily cash margining. The Company’s Canadian operations have traditionally engaged in the trading of Canadianand US government bond futures contracts to mitigate its risk. At March 31, 2018, the notional amount of the Canadian bondfutures contracts outstanding was long $0.1 million [March 31, 2017 − long $0.5 million].
The Company’s Canadian operations are also involved in trading US Treasury futures in an attempt to mitigate interest rate risk,yield curve risk and liquidity risk. There were no outstanding US Treasury futures contracts outstanding as at March 31, 2018 andMarch 31, 2017.
The fair value of all of the above futures contracts is nominal due to their short term to maturity. Realized and unrealized gainsand losses related to these contracts are recognized in net income (loss) during the reporting period.
Future Changes in Accounting Policies and Estimates
The Company monitors the potential changes proposed by the International Accounting Standards Board on an ongoing basis andanalyzes the effect that changes in the standards may have on the Company’s operations.
STANDARDS ISSUED BUT NOT YET EFFECTIVE
Standards issued, which may be reasonably expected to impact upon the Company’s financial statements, but which are not yeteffective are listed below.
IFRS 15, ‘‘REVENUE FROM CONTRACTS WITH CUSTOMERS’’
In May 2014, the IASB issued IFRS 15 − Revenue from Contracts with Customers (‘‘IFRS 15’’). IFRS 15 establishes a singlefive-step model framework for determining the nature, amount, timing and uncertainty of revenue and cash flows arising from acontract with a customer. The standard is effective for annual periods on or after January 1, 2018, with early adoption permitted.Either a modified retrospective application or full retrospective application is permitted under IFRS 15. The Company will beadopting IFRS 15 for its fiscal year ending March 31, 2019 using the modified retrospective application approach.
Management’s Discussion and Analysis 53
2018 ANNUAL REPORT / CANACCORD GENUITY GROUP INC.

The Company has evaluated the impact of IFRS 15 on its various revenue streams and the assessment is as follows:
• Commissions and fees − The Company concluded there is no material change in the amount or timing of revenue recognizedunder the new standard as the point of transfer of risk and reward for services and transfer of control occur at the sametime.
• Investment banking − The Company concluded that investment banking will generally not be affected by IFRS 15 as revenuewill be recognized upon completion of the performance obligation.
• Advisory fees − The Company concluded that advisory fees will generally not be affected by IFRS 15 as revenue will berecognized upon completion of the performance obligation. In certain cases, some fees are collected based on progress anddo not correspond to the satisfaction of any discrete performance obligation. Under IFRS 15, such payments may need to bedeferred until the performance obligation is satisfied. The impact of this change on the amount of revenue recognized in afiscal year is insignificant.
• Principal trading, interest and other revenue are excluded from the scope of IFRS 15.
IFRS 15 contains presentation and disclosure requirements which are more detailed than the current standards. Upon adoption ofIFRS 15, the Company will provide disclosures for each of the Company’s revenue streams, to supplement the revenue data thatare currently presented in the segmented information disclosure. New disclosures will be presented relating to the timing ofcompletion of the Company’s performance obligations.
IFRS 9, ‘‘FINANCIAL INSTRUMENTS’’
In July 2014, the IASB issued IFRS 9 − Financial Instruments (‘‘IFRS 9’’), which replaces the earlier versions of IFRS 9 (2009,2010, and 2013) and completes the IASB’s project to replace IAS 39 − Financial Instruments: Recognition and Measurement.IFRS 9 is effective for annual periods beginning on or after January 1, 2018 and must be applied retrospectively with the exceptionof hedge accounting. The Company will adopt IFRS 9 for its fiscal year ending March 31, 2019.
The Company has evaluated the impact of IFRS 9 on its consolidated financial statements and the assessment is as follows:
Classification − financial assets and liabilities
IFRS 9 sets out requirements for recognizing and measuring financial assets and financial liabilities. IFRS 9 contains a newclassification and measurement approach for financial assets that reflects the business model in which assets are managed andtheir cash flow characteristics. IFRS 9 contains three principal classification categories for financial assets: measured atamortized cost, fair value through other comprehensive income (‘‘FVOCI’’) and fair value through profit and loss (‘‘FVTPL’’). IFRS 9largely retains the existing requirements in IAS 39 for the classification of financial liabilities. The Company expects to continueto classify cash and cash equivalents and securities owned as financial assets classified as FVTPL and accounts receivable asfinancial assets measured at amortized costs. The Company’s investment in Euroclear, which is classified as available for saleas of March 31, 2018, will be reclassified as FVOCI. The classification of financial liabilities is expected to remain consistentunder IFRS 9.
Impairment − financial assets
IFRS 9 introduces the new ‘‘expected credit loss’’ impairment model which replaces the ‘‘incurred loss’’ model in IAS 39. Based onits assessment, the Company does not believe that new impairment requirements will have a material impact on its financialstatements given the short-term nature of the Company’s receivables.
Hedge accounting requirement
IFRS 9 offers greater flexibility to the types of transactions eligible for hedge accounting. The Company does not expect thischange to have any material impact on its consolidated financial statements upon adoption.
IFRS 16, ‘‘LEASES’’
In January 2016, the IASB issued IFRS 16 ‘‘Leases’’ (‘‘IFRS 16’’), which requires lessees to recognize assets and liabilities formost leases. The new standard will be effective for annual periods beginning on or after January 1, 2019. Early adoption ispermitted, provided the new revenue standard, IFRS 15, has been applied, or is applied at the same date as IFRS 16 using eithera full retrospective or a modified retrospective approach. The Company plans to apply IFRS 16 for its year ending March 31, 2020but has not yet selected a transition approach.
Upon adoption of IFRS 16, the Company anticipates it will result in an increase in assets and liabilities related to leases. Due tothe recognition of additional lease assets and liabilities, a higher amount of depreciation expense and interest expense on leaseliabilities will be recognized under IFRS 16 compared to the current standard. Lastly, the Company expects a reduction in operatingcash outflows with a corresponding increase in financing cash outflows under IFRS 16. The Company is in the process ofidentifying and collecting data relating to existing agreements to determine the impact of adoption of IFRS 16.
Please see Note 4 of the Audited Consolidated Financial Statements for the year ended March 31, 2018 for further information.
54 Management’s Discussion and Analysis
CANACCORD GENUITY GROUP INC. / 2018 ANNUAL REPORT

Disclosure Controls and Procedures and Internal Control over Financial Reporting
DISCLOSURE CONTROLS AND PROCEDURES
As of March 31, 2018, an evaluation was carried out, under the supervision of and with the participation of management,including the President & CEO and the Executive Vice President, Chief Financial Officer, of the effectiveness of our disclosurecontrols and procedures as defined under National Instrument 52-109. Based on that evaluation, the President & CEO and theExecutive Vice President, Chief Financial Officer concluded that the design and operation of these disclosure controls andprocedures were effective as of and during the fiscal year ended March 31, 2018.
INTERNAL CONTROL OVER FINANCIAL REPORTING
Management, including the President & CEO and the Executive Vice President, Chief Financial Officer, has designed internalcontrol over financial reporting as defined under National Instrument 52-109 to provide reasonable assurance regarding thereliability of financial reporting and the preparation of financial statements for external purposes in accordance with IFRS. Basedon that evaluation, the President & CEO and the Executive Vice President, Chief Financial Officer concluded that the Company’sinternal control over financial reporting was designed and operating effectively as of and during the year ended March 31, 2018and that there were no material weaknesses in our internal control over financial reporting.
CHANGES IN INTERNAL CONTROL OVER FINANCIAL REPORTING
There were no changes in internal control over financial reporting that occurred during the year ended March 31, 2018 that havematerially affected, or are reasonably likely to materially affect, the Company’s internal control over financial reporting.
Risk Management
OVERVIEW
Uncertainty and risk are inherent when conducting operations within financial markets. As an active participant in the Canadianand international capital markets, the Company is exposed to risks that could result in financial losses. The Company hasidentified its principal risks as: market risk, credit risk, operational risk and other risks. Accordingly, risk management and controlof the balance between risk and return are critical elements in maintaining the Company’s financial stability and profitability.Therefore, an effective risk management framework is integral to the success of Canaccord Genuity Group Inc.
RISK MANAGEMENT STRUCTURE AND GOVERNANCE
The Company’s disciplined risk management process encompasses a number of functional areas and requires frequentcommunication, judgment and knowledge of the business, products and markets. The Company’s senior management is activelyinvolved in the risk management process and has developed policies, procedures and reports that enable the Company to assessand control its risks. These policies and procedures are subject to ongoing review and modification as activities, markets andcircumstances change.
As part of the Company’s risk philosophy, the first line of responsibility for managing risk lies with branch managers, departmentheads and trading desk managers (within prescribed limits). The monitoring and control of the Company’s risk exposure isconducted through a variety of separate, but complementary, financial, credit, operational, compliance and legal reporting systems.
The Company’s governance structure includes the following elements:
Board of Directors
Audit Committee
Risk ManagementCommittee
CanaccordGenuity Group Inc.
Cyber SecurityCommittee
Canaccord Genuity GlobalOperating Committee
Corporate Governance &Compensation Committee
The Board of Directors (the Board) has oversight of the company-wide risk management framework. These responsibilities aredelegated to the Audit and Risk Management Committees. See the company’s current Annual Information Form (AIF) for details ofthe Audit Committee’s mandate as it relates to risk management.
Management’s Discussion and Analysis 55
2018 ANNUAL REPORT / CANACCORD GENUITY GROUP INC.

The Audit Committee assists the Board in fulfilling its oversight responsibility by monitoring the effectiveness of internal controlsand the control environment. It also receives and reviews various quarterly and annual updates, and reports on key risk metrics aswell as the overall risk management program.
The Risk Management Committee assists the Board in fulfilling its responsibilities for monitoring risk exposures against thedefined risk appetite and for general oversight of the risk management process. The Risk Management Committee is led by thefirm’s Chief Risk Officer and committee members include the CEO, the CFO and senior management representation from the keyrevenue-producing businesses and functional areas of the Company. The Risk Management Committee identifies, measures andmonitors the principal risks facing the business through review and approval of the Company’s risk appetite, policies, procedures,and limits/thresholds.
The segregation of duties and management oversight are important aspects of the Company’s risk management framework.The Company has a number of functions that are independent of the revenue-producing businesses that perform risk managementactivities, including the monitoring, evaluating and analyzing of risk. These functions include Enterprise Risk Management,Compliance, Operations, Internal Audit, Treasury, Finance, Information Technology and Legal.
In fiscal 2017, the Company formed a global Cyber Security Committee to help identify, monitor and manage risks specific to thecompany’s information networks, data and internal systems. This committee is chaired by the firm’s Chief Risk Officer andcommittee members include senior IT management from across the firm, as well as representation from Legal, Compliance,Internal Audit and Operations. The Cyber Security Committee is focused on issues such as cyber security risk assessment,IT safeguards and controls, risks related to third-party service provides, employee training and awareness and incident responseplanning.
MARKET RISK
Market risk is the risk that a change in market prices and/or any of the underlying market factors will result in losses. Eachbusiness area is responsible for ensuring that their market risk exposure is prudent within a set of risk limits set by the RiskManagement Committee and approved by the Audit Committee. In addition, the Company has established procedures to ensurethat risks are measured, closely monitored, controlled and visible to senior levels of management.
The Company is exposed to equity price risk, liquidity risk and volatility risk as a result of its principal trading activities in equitysecurities. The Company is also exposed to specific interest rate risk, credit spread risk and liquidity risk in respect of its principaltrading in fixed income securities. In addition to active supervision and review of trading activities by senior management,Canaccord Genuity Group mitigates its risk exposure through a variety of limits to control concentration, capital allocation andusage, as well as through trading policies and guidelines. The Company manages and monitors its risks in this area using bothqualitative and quantitative measures, on a company-wide basis, and also by trading desk and by individual trader. CanaccordGenuity Group utilizes scenario analysis and a Value-at-Risk (VaR) risk measurement system for its equity and fixed incomeinventories. Management also regularly reviews and monitors inventory levels and positions, trading results, liquidity profile,position aging and concentration levels. Consequently, the Company can ensure that it is adequately diversified with respect tomarket risk factors and that trading activity is within the risk tolerance levels established by senior management.
CREDIT RISK
Credit risk is the risk of loss associated with a counterparty’s inability to fulfill its payment obligations. The primary source forcredit risk to Canaccord Genuity Group is in connection with trading activity by clients in the Canaccord Genuity WealthManagement business segment and private client margin accounts. In order to minimize financial exposure in this area, theCompany applies certain credit standards and conducts financial reviews with respect to clients and new accounts.
The Company provides financing to clients by way of margin lending. In margin-based lending, the Company extends credit for aportion of the market value of the securities in a client’s account, up to certain limits. The margin loans are collateralized by thosesecurities in the client’s account. In connection with this lending activity, the Company faces a risk of financial loss in the eventthat a client fails to meet a margin call if market prices for securities held as collateral decline and if the Company is unable torecover sufficient value from the collateral held. For margin lending purposes, the Company has established risk-based limits thatare generally more restrictive than those required by applicable regulatory policies. In addition, the Company has establishedlimits to how much it will lend against an individual security or group of securities in a single sector so as to limit creditconcentration risk.
The extension of credit via margin lending is overseen by the firm’s Credit Committee. The Committee meets regularly to reviewand discuss the firm’s credit risks, including large individual loans, collateral quality, loan coverage ratios and concentration risk.The Committee will also meet, as required, to discuss any new loan arrangements proposed by senior management.
The Company also faces a risk of financial loss with respect to trading activity by clients if such trading results in overdue orunpaid amounts in under-secured cash accounts. The Company has developed a number of controls within its automated tradeorder management system to ensure that trading by individual account and advisor is done in accordance with customized limitsand risk parameters.
56 Management’s Discussion and Analysis
CANACCORD GENUITY GROUP INC. / 2018 ANNUAL REPORT

The Company is engaged in various trading and brokerage activities whose counterparties primarily include broker dealers, banks,clearing agents, exchanges, financial intermediaries and other financial institutions. These activities include agency and principaltrading, securities borrowing and lending, and entering into repurchase agreements and reverse repurchase agreements. In theevent that counterparties do not fulfill their obligations, the Company may be exposed to risk. The risk of default depends on thecreditworthiness of the counterparty and/or the issuer of the instrument. The Company manages this risk by imposing andmonitoring individual and aggregate trading and position limits within each business segment, for each counterparty, conductingregular credit reviews of financial counterparties, reviewing security and loan concentrations, holding and marking to marketcollateral on certain transactions, and conducting business through clearing organizations that guarantee performance.
The Company records a provision for bad debts in general and administrative expense. Any actual losses arising from orassociated with client trading activity as described above are charged to this provision. Historically, this provision has beensufficient to cover actual losses.
OPERATIONAL RISK
Operational risk is the risk of loss resulting from inadequate or failed internal processes, fraud, people and systems, or fromexternal events such as the occurrence of disasters or security threats. Operational risk exists in all of the Company’s activities,including processes, systems and controls used to manage other risks. Failure to manage operational risk can result in financialloss, reputational damage, regulatory fines and failure to manage market or credit risks.
The Company operates in different markets and relies on its employees and systems to process a high number of transactions. Inorder to mitigate this risk, the Company has developed a system of internal controls and checks and balances at appropriatelevels, which includes overnight trade reconciliation, control procedures related to clearing and settlement, transaction and dailyvalue limits within all trading applications, cash controls, physical security, independent review procedures, documentationstandards, billing and collection procedures, and authorization and processing controls for transactions and accounts. In addition,the Company has implemented an operational risk program that helps Canaccord Genuity Group measure, manage, report andmonitor operational risk issues (see RCSA below). The Company also has disaster recovery procedures, business continuity plansand built-in redundancies in place in the event of a systems or technological failure. In addition, the Company utilizes third partyservice agreements and security audits where appropriate.
Risk and Control Self-Assessment (RCSA)
The purpose of RCSAs is to:• Identify and assess key risks inherent to the business and categorize them based on severity and frequency of occurrence• Rate the effectiveness of the control environment associated with the key risks• Mitigate the risks through the identification of action plans to improve the control environment where appropriate• Provide management with a consistent approach to articulate and communicate the risk profiles of their areas of
responsibility• Meet regulatory requirements and industry standards
The Company has established a process to determine what the strategic objectives of each group/unit/department are andidentify, assess and quantify operational risks that hinder the Company’s ability to achieve those objectives. The RCSA results arespecifically used to calculate the operational risk regulatory capital requirements for operations in the UK and operational riskexposure in all geographies. The RCSAs are periodically updated and results are reported to the Risk Management and AuditCommittees.
OTHER RISKS
Other risks encompass those risks that can have an adverse material impact on the business but do not belong to market, creditor operational risk categories.
Regulatory and legal risk
Regulatory risk results from non-compliance with regulatory requirements, which could lead to fines and/or sanctions. TheCompany has established procedures to ensure compliance with all applicable statutory and regulatory requirements in eachjurisdiction in which it operates. These procedures address issues such as regulatory capital requirements, disclosurerequirements, internal controls over financial reporting, sales and trading practices, use of and safekeeping of client funds, use ofand safekeeping of client data, credit granting, collection activity, anti-money laundering, insider trading, employee misconduct,conflicts of interest and recordkeeping.
Legal risk results from potential criminal, civil or regulatory litigation against the Company that could materially affect theCompany’s business, operations or financial condition. The Company has in-house legal counsel, as well as access to externallegal counsel, to assist the Company in addressing legal matters related to operations and to defend the Company’s interests invarious legal actions.
Losses or costs associated with routine regulatory and legal matters are included in general and administrative expense in theCompany’s Audited Consolidated Financial Statements.
Management’s Discussion and Analysis 57
2018 ANNUAL REPORT / CANACCORD GENUITY GROUP INC.

The Company and its affiliates provide financial advisory, underwriting and other services to, and trade the securities of issuersthat are involved with new and emerging industries, including the US cannabis industry. Activities within such industries, includingthe US cannabis industry, typically have not had the benefit of a history of successful operating results. In addition to theeconomic uncertainties associated with new industries, new activities and new issuers, the laws applicable to such industries oractivities, particularly the US cannabis industry and the activities of issuers in that industry, and the effect or enforcement of suchlaws are undetermined, conflicting and uncertain. With respect to the US cannabis industry, cannabis continues to be a controlledsubstance under the United States Controlled Substances Act and as such, there is a risk that certain issuers, while incompliance with applicable state law, may be prosecuted under federal law. Accordingly, the Company has adopted policies andprocedures reasonably designed to ensure compliance with the United States Currency and Foreign Transactions Reporting Act of1970 (the ‘‘Bank Secrecy Act’’) and the guidance issued by the United States Department of the Treasury Financial CrimesEnforcement Network, FIN-2014-G001 (the “FinCEN Guidance”) relating to providing financial services to marijuana relatedbusinesses in the United States (as that term is used in the FinCEN Guidance). While the Company takes steps to identify therisks associated with emerging industries, including the US cannabis industry, and only provides services to those issuers where itdetermines that there is no material risk to the Company or where any risk is unlikely to result in a material adverse consequenceto the Company, there is a risk that the Company could be the subject of third party proceedings which may have a materialadverse effect on the Company business, revenues, operating results and financial condition as well as the Company’s reputation,even if such proceedings were concluded successfully in favour of the Company. The Company has determined that any suchproceedings are unlikely and, accordingly, has not recorded a provision in respect of such matters.
Cybersecurity risk
Cybersecurity risk is the risk that the Company’s information networks, data or internal systems will be damaged, disrupted,misappropriated, stolen, accessed without permission or otherwise attacked. This risk exists due to the interconnected natureof the Company’s business with its clients, suppliers, vendors, partners and the public via the internet and other networks.As a result of this interconnectivity, third parties with which the Company does business with or that facilitate the Company’sbusiness may also be a source of cybersecurity risk to the firm. The Company devotes considerable effort and resources todefend against and mitigate cybersecurity risk, including increasing awareness throughout the organization by implementing afirmwide cybersecurity training program for all employees. The Company’s management of cybersecurity risk, as well as anyreported incidents, is regularly presented to both senior management via the Cybersecurity Committee and the Audit Committee ofthe Board of Directors.
Reputational risk
Reputational risk is the risk that an activity undertaken, or alleged to have been undertaken, by an organization or itsrepresentatives will impair its image in the community or lower public confidence in it, resulting in a loss of revenue, legal action orincreased regulatory oversight. Possible sources of reputational risk could come from operational failures, non-compliance withlaws and regulations, disparaging media coverage, or leading an unsuccessful financing. The Company could face reputational riskthrough its association with past or present corporate finance clients who are the subject of regulatory and/or legal scrutiny.Reputational risk can also be reflected within customer satisfaction and external ratings, such as equity analyst reports. Inaddition to its various risk management policies, controls and procedures, the Company has a formal Code of Business Conductand Ethics and an integrated program of marketing, branding, communications and investor relations to help manage and supportthe Company’s reputation.
CONTROL RISK
As of March 31, 2018, senior officers and directors of the Company collectively owned approximately 9.3% of the issued andoutstanding (13.7% fully diluted) common shares of Canaccord Genuity Group Inc. If a sufficient number of these shareholders actor vote together, they will have the power to exercise significant influence over all matters requiring shareholder approval, includingthe election of the Company’s directors, amendments to its articles, amalgamations and plans of arrangement under Canadian lawand mergers or sales of substantially all of its assets. This could prevent Canaccord Genuity Group from entering into transactionsthat could be beneficial to the Company or its other shareholders. Also, third parties could be discouraged from making a tenderoffer or takeover bid to acquire any or all of the outstanding common shares of the Company.
Any significant change in these shareholdings through sale or other disposition, or significant acquisitions by others of thecommon shares in the public market or by way of private transactions, could result in a change of control and changes in businessfocus or practices that could affect the profitability of the Company’s business.
Restrictions on ownership and transfer of common shares
Restrictions on ownership and transfer of common shares in the articles of Canaccord Genuity Group Inc. to prevent unauthorizedchange in control without regulatory approval could, in certain cases, affect the marketability and liquidity of the common shares.
Risk factors
For a detailed list of the risk factors that are relevant to the Company’s business and the industry in which it operates, see theRisk Factors section in the Company’s current AIF. Risks include, but are not necessarily limited to, those listed in the AIF.Investors should carefully consider the information about risks, together with the other information in this document, before
58 Management’s Discussion and Analysis
CANACCORD GENUITY GROUP INC. / 2018 ANNUAL REPORT
making investment decisions. It should be noted that this list is not exhaustive, but contains risks that the Company considers tobe of particular relevance. Other risk factors may apply.
Further discussion regarding risks can be found in our Annual Information Form.
Dividend Policy
Although dividends are expected to be declared and paid quarterly, the Board of Directors, in its sole discretion, will determine theamount and timing of any dividends. All dividend payments will depend on general business conditions, the Company’s financialcondition, results of operations, capital requirements and such other factors as the Board determines to be relevant.
Dividend Declaration
On June 6, 2018, the Board of Directors approved a dividend of $0.12 per common share, payable on July 3, 2018, with a recorddate of June 22, 2018. This dividend is comprised of a $0.01 base quarterly dividend and an $0.11 supplemental dividend asoutlined below.
The Company’s dividend policy which became effective March 31, 2017 reflects its commitment to return a portion of earnings toshareholders, in balance with the inherent variability of its business, which is impacted by the overall condition of debt and equitymarkets, and the market for securities in specific growth sectors. In the context of its dividend policy, the Company expects toreturn 25% to 50% of net earnings attributable to common shareholders on an annual basis. The policy is to pay a quarterlydividend of $0.01 per common share that will be declared and paid quarterly, which commenced with the fourth quarter of fiscal2017. Following the end of each fiscal year, the Board will review the capital position of the Company in the context of the marketenvironment in combination with capital allocation requirements for its strategic priorities, and determine whether a supplementaldividend should be paid. Supplemental dividends, if declared, may be highly variable from year to year, given the nature of theCompany’s operating environment and the potential need to conserve cash and for certain corporate growth opportunities.Although dividends are expected to be declared and paid on an ongoing basis, the Board of Directors, in its sole discretion, willdetermine the amount and timing of any dividends. All dividend payments will depend on general business conditions, theCompany’s financial condition, results of operations, capital requirements and such other factors as the Board determines to berelevant.
On June 6, 2018, the Board of Directors approved the following cash dividends: $0.24281 per Series A Preferred Share payableon July 3, 2018 with a record date of June 22, 2018; and $0.31206 per Series C Preferred Share payable on July 3, 2018 with arecord date of June 22, 2018.
Additional Information
Additional information relating to Canaccord Genuity Group Inc., including our Annual Information Form, is available on our websiteat www.canaccordgenuitygroup.com/EN/IR/FinReports/Pages/default.aspx and on SEDAR at www.sedar.com.
Management’s Discussion and Analysis 59
2018 ANNUAL REPORT / CANACCORD GENUITY GROUP INC.

Independent Auditors’ Report
To the Shareholders ofCanaccord Genuity Group Inc.
We have audited the accompanying consolidated financial statements of Canaccord Genuity Group Inc., which comprise theconsolidated statements of financial position as at March 31, 2018 and 2017, and the consolidated statements of operations,comprehensive income, changes in equity and cash flows for the years then ended, and a summary of significant accountingpolicies and other explanatory information.
Management’s Responsibility for the Consolidated Financial Statements
Management is responsible for the preparation and fair presentation of these consolidated financial statements in accordancewith International Financial Reporting Standards, and for such internal control as management determines is necessary to enablethe preparation of consolidated financial statements that are free from material misstatement, whether due to fraud or error.
Auditors’ Responsibility
Our responsibility is to express an opinion on these consolidated financial statements based on our audits. We conducted ouraudits in accordance with Canadian generally accepted auditing standards. Those standards require that we comply with ethicalrequirements and plan and perform the audit to obtain reasonable assurance about whether the consolidated financial statementsare free from material misstatement.
An audit involves performing procedures to obtain audit evidence about the amounts and disclosures in the consolidated financialstatements. The procedures selected depend on the auditors’ judgment, including the assessment of the risks of materialmisstatement of the consolidated financial statements, whether due to fraud or error. In making those risk assessments, theauditors consider internal control relevant to the entity’s preparation and fair presentation of the consolidated financial statementsin order to design audit procedures that are appropriate in the circumstances, but not for the purpose of expressing an opinion onthe effectiveness of the entity’s internal control. An audit also includes evaluating the appropriateness of accounting policies usedand the reasonableness of accounting estimates made by management, as well as evaluating the overall presentation of theconsolidated financial statements.
We believe that the audit evidence we have obtained in our audits is sufficient and appropriate to provide a basis for our auditopinion.
Opinion
In our opinion, the consolidated financial statements present fairly, in all material respects, the financial position of CanaccordGenuity Group Inc. as at March 31, 2018 and 2017, and its financial performance and its cash flows for the years then ended inaccordance with International Financial Reporting Standards.
Chartered Professional AccountantsLicensed Public Accountants
Toronto, CanadaJune 6, 2018
60
CANACCORD GENUITY GROUP INC. / 2018 ANNUAL REPORT

Consolidated Statements of Financial Position
As at (in thousands of Canadian dollars) NotesMarch 31,
2018March 31,
2017
ASSETS
Current
Cash and cash equivalents $ 862,838 $ 677,769
Securities owned 6 469,217 784,230
Accounts receivable 9, 22 2,215,837 3,395,736
Income taxes receivable 1,170 1,085
Total current assets 3,549,062 4,858,820
Deferred tax assets 14 19,941 15,323
Investments 10 2,035 2,829
Equipment and leasehold improvements 11 30,967 31,479
Intangible assets 13 160,757 102,799
Goodwill 13 257,974 192,266
$ 4,020,736 $ 5,203,516
LIABILITIES AND EQUITY
Current
Bank indebtedness 7 $ — $ 25,280
Securities sold short 6 301,006 645,742
Accounts payable and accrued liabilities 9, 22 2,638,954 3,669,883
Provisions 26 8,428 11,793
Income taxes payable 7,851 10,093
Subordinated debt 15 7,500 7,500
Current portion of bank loan 16 9,679 —
Total current liabilities 2,973,418 4,370,291
Deferred tax liabilities 14 13,715 140
Convertible debentures 17 57,081 56,442
Deferred consideration 7, 12 9,997 —
Contingent consideration 7, 12 49,844 —
Bank loan 16 61,758 —
3,165,813 4,426,873
Equity
Preferred shares 18 205,641 205,641
Common shares 19 649,846 641,449
Equity portion of convertible debentures 17 2,604 2,604
Warrants 19 1,975 1,975
Contributed surplus 145,426 85,405
Retained deficit (277,472) (267,559)
Accumulated other comprehensive income 113,332 95,270
Total shareholders’ equity 841,352 764,785
Non-controlling interests 8 13,571 11,858
Total equity 854,923 776,643
$ 4,020,736 $ 5,203,516
See accompanying notes
On behalf of the Board:
‘‘Daniel Daviau’’ ‘‘Terrence A. Lyons’’
DANIEL DAVIAU TERRENCE A. LYONSDirector Director
61
2018 ANNUAL REPORT / CANACCORD GENUITY GROUP INC.

Consolidated Statements of Operations
For the years ended (in thousands of Canadian dollars, except per share amounts) NotesMarch 31,
2018March 31,
2017
REVENUE
Commissions and fees $ 461,937 $ 396,741
Investment banking 282,195 196,129
Advisory fees 122,372 130,749
Principal trading 113,921 119,040
Interest 27,875 16,847
Other 14,577 20,040
1,022,877 879,546
EXPENSES
Share-based incentive compensation 94,600 40,322
Non share-based incentive compensation 480,369 414,676
Salaries and benefits 99,239 85,698
Trading costs 68,209 65,211
Premises and equipment 39,605 42,286
Communication and technology 56,346 52,381
Interest 18,437 12,744
General and administrative 83,982 79,011
Amortization 11, 13 24,007 21,124
Development costs 7,664 12,209
Restructuring costs 26 7,643 —
Acquisition-related costs 6,732 —
Share of loss of an associate 298 —
$ 987,131 $ 825,662
Income before income taxes 35,746 53,884
Income tax expense (recovery) 14
Current 20,620 16,322
Deferred (1,951) (5,624)
18,669 10,698
Net income for the year $ 17,077 $ 43,186
Net income attributable to:
CGGI shareholders $ 13,024 $ 38,103
Non-controlling interests 8 $ 4,053 $ 5,083
Weighted average number of common shares outstanding (thousands)
Basic 19 92,587 91,657
Diluted 19 110,862 101,149
Income per common share
Basic 19 $ 0.04 $ 0.29
Diluted 19 $ 0.03 $ 0.27
Dividend per Series A Preferred Share 20 $ 0.9712 $ 1.173
Dividend per Series C Preferred Share 20 $ 1.2482 $ 1.4375
Dividend per common share 20 $ 0.15 $ 0.10
See accompanying notes
62
CANACCORD GENUITY GROUP INC. / 2018 ANNUAL REPORT

Consolidated Statements of Comprehensive Income
For the years ended (in thousands of Canadian dollars)March 31,
2018March 31,
2017
Net income for the year $ 17,077 $ 43,186
Other comprehensive income
Realized translation gains related to foreign operations disposed of during the year — (1,560)
Net change in valuation of available for sale investments, net of tax 2,993 —
Net change in unrealized gains (losses) on translation of foreign operations, net of tax 15,671 (37,889)
Comprehensive income for the year $ 35,741 $ 3,737
Comprehensive income (loss) attributable to:
CGGI shareholders $ 31,086 $ (1,510)
Non-controlling interests $ 4,655 $ 5,247
See accompanying notes
63
2018 ANNUAL REPORT / CANACCORD GENUITY GROUP INC.
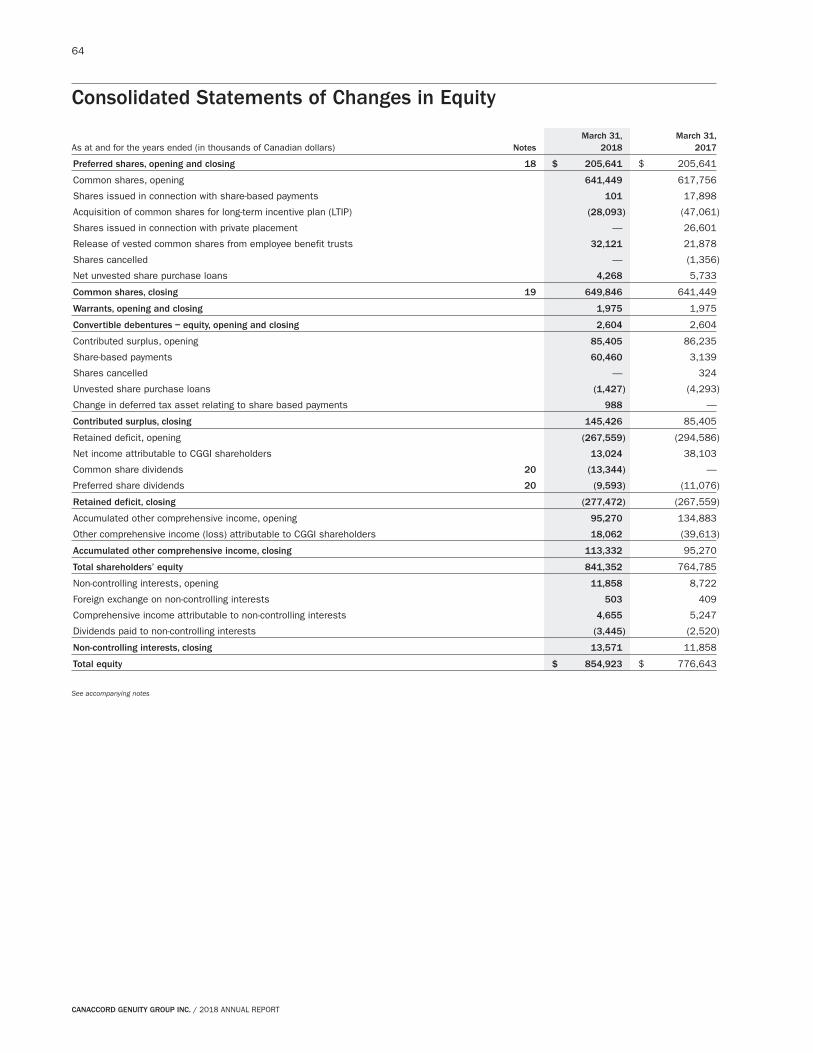
Consolidated Statements of Changes in Equity
As at and for the years ended (in thousands of Canadian dollars) NotesMarch 31,
2018March 31,
2017
Preferred shares, opening and closing 18 $ 205,641 $ 205,641
Common shares, opening 641,449 617,756
Shares issued in connection with share-based payments 101 17,898
Acquisition of common shares for long-term incentive plan (LTIP) (28,093) (47,061)
Shares issued in connection with private placement — 26,601
Release of vested common shares from employee benefit trusts 32,121 21,878
Shares cancelled — (1,356)
Net unvested share purchase loans 4,268 5,733
Common shares, closing 19 649,846 641,449
Warrants, opening and closing 1,975 1,975
Convertible debentures − equity, opening and closing 2,604 2,604
Contributed surplus, opening 85,405 86,235
Share-based payments 60,460 3,139
Shares cancelled — 324
Unvested share purchase loans (1,427) (4,293)
Change in deferred tax asset relating to share based payments 988 —
Contributed surplus, closing 145,426 85,405
Retained deficit, opening (267,559) (294,586)
Net income attributable to CGGI shareholders 13,024 38,103
Common share dividends 20 (13,344) —
Preferred share dividends 20 (9,593) (11,076)
Retained deficit, closing (277,472) (267,559)
Accumulated other comprehensive income, opening 95,270 134,883
Other comprehensive income (loss) attributable to CGGI shareholders 18,062 (39,613)
Accumulated other comprehensive income, closing 113,332 95,270
Total shareholders’ equity 841,352 764,785
Non-controlling interests, opening 11,858 8,722
Foreign exchange on non-controlling interests 503 409
Comprehensive income attributable to non-controlling interests 4,655 5,247
Dividends paid to non-controlling interests (3,445) (2,520)
Non-controlling interests, closing 13,571 11,858
Total equity $ 854,923 $ 776,643
See accompanying notes
64
CANACCORD GENUITY GROUP INC. / 2018 ANNUAL REPORT

Consolidated Statements of Cash Flows
For the years ended (in thousands of Canadian dollars) NotesMarch 31,
2018March 31,
2017
OPERATING ACTIVITIES
Net income for the year $ 17,077 $ 43,186
Items not affecting cash
Amortization 11, 13 24,007 21,124
Deferred income tax recovery (1,951) (5,624)
Share-based compensation expense 21 95,357 40,322
Impairment of investment in a private company 7 — 2,390
Share of loss of associate 298 —
Changes in non-cash working capital
Decrease (increase) in securities owned 314,871 (219,496)
Decrease (increase) in accounts receivable 1,185,922 (1,394,913)
Increase in income taxes payable, net 8,582 18,514
(Decrease) increase in securities sold short (344,736) 218,307
(Decrease) increase in accounts payable, accrued liabilities, and provisions (1,055,366) 1,513,070
Cash provided by operating activities 244,061 236,880
FINANCING ACTIVITIES
(Decrease) increase in bank indebtedness (25,280) 10,370
Purchase of shares for cancellation — (360)
Acquisition of common shares for long-term incentive plan (28,093) (47,061)
Proceeds from Private Placement — 28,321
Repayment of subordinated debt — (7,500)
Proceeds from bank loan 66,016 —
Proceeds from convertible debentures — 60,000
Cash dividends paid on common shares (13,345) —
Cash dividends paid on preferred shares (9,592) (11,076)
Cash paid related to CSH Inducement Plan — (1,905)
Cash (used in) provided by financing activities (10,294) 30,789
INVESTING ACTIVITIES
Purchase of equipment and leasehold improvements (6,311) (5,202)
Acquisition of Hargreave Hale Limited, net of cash acquired (54,051) —
Investment in associate (2,500) —
Purchase of intangible assets (795) (440)
Cash used in investing activities (63,657) (5,642)
Effect of foreign exchange on cash balances 14,959 (12,587)
Increase in cash position 185,069 249,440
Cash position, beginning of year 677,769 428,329
Cash position, end of year 862,838 677,769
Supplemental cash flow information
Interest received $ 27,900 $ 12,571
Interest paid $ 17,470 $ 11,009
Income taxes paid $ 24,023 $ 10,385
See accompanying notes
65
2018 ANNUAL REPORT / CANACCORD GENUITY GROUP INC.

Notes to Consolidated Financial Statements
As at March 31, 2018 and March 31, 2017and for the years ended March 31, 2018 and 2017(in thousands of Canadian dollars, except per share amounts)
NOTE 01 Corporate Information
Through its principal subsidiaries, Canaccord Genuity Group Inc. (the Company or CGGI) is a leading independent, full-serviceinvestment dealer with capital markets operations in Canada, the United Kingdom (UK) & Europe, the United States of America(US), Australia, China and Dubai. The Company also has wealth management operations in Canada, the UK & Europe, andAustralia. The Company has operations in each of the two principal segments of the securities industry: capital markets andwealth management. Together, these operations offer a wide range of complementary investment products, brokerage servicesand investment banking services to the Company’s private, institutional and corporate clients.
Canaccord Genuity Group Inc. was incorporated on February 14, 1997 by the filing of a memorandum and articles with theRegistrar of Companies for British Columbia under the Company Act (British Columbia) and continues in existence under theBusiness Corporations Act (British Columbia). The Company’s head office is located at Suite 2200 − 609 Granville Street,Vancouver, British Columbia, V7Y 1H2. The Company’s registered office is located at Suite 400 − 725 Granville Street, Vancouver,British Columbia, V7Y 1G5.
The Company’s common shares are publicly traded under the symbol CF on the Toronto Stock Exchange (TSX). The Company’sSeries A Preferred Shares are listed on the TSX under the symbol CF.PR.A. The Company’s Series C Preferred Shares are listed onthe TSX under the symbol CF.PR.C.
The Company’s business experiences considerable variations in revenue and income from quarter to quarter and year to year dueto factors beyond the Company’s control. The Company’s business is affected by the overall condition of the worldwide equity anddebt markets.
NOTE 02 Basis of Preparation
STATEMENT OF COMPLIANCE
These consolidated financial statements have been prepared in accordance with International Financial Reporting Standards(IFRS) as issued by the International Accounting Standards Board (IASB).
These audited consolidated financial statements have been prepared on a historical cost basis except for investments, securitiesowned, securities sold short and certain impaired non-current assets, which have been measured at fair value as set out in therelevant accounting policies.
These audited consolidated financial statements are presented in Canadian dollars and all values are in thousands of dollars,except when otherwise indicated.
These audited consolidated financial statements were authorized for issuance by the Company’s Board of Directors on June 6,2018.
PRINCIPLES OF CONSOLIDATION
These consolidated financial statements include the financial statements of the Company, its subsidiaries and controlled specialpurpose entities (SPEs).
The financial results of a subsidiary or controlled SPE are consolidated if the Company acquires control. Control is achieved whenan entity has power over the investee, is exposed, or has rights, to variable returns from its involvement with the investee and hasthe ability to affect those returns through its power over the investee.
The results of subsidiaries acquired or disposed of during the year are included in the statements of operations from the effectivedate of the acquisition or up to the effective date of the disposal, as appropriate.
All inter-company transactions and balances have been eliminated. In cases where an accounting policy of a subsidiary differsfrom the Company’s accounting policies, the Company has made the appropriate adjustments to ensure conformity for purposes ofthe preparation of these consolidated financial statements. The financial statements of the subsidiaries are prepared for thesame reporting period as the parent company.
USE OF JUDGMENTS, ESTIMATES AND ASSUMPTIONS
The preparation of these consolidated financial statements requires management to make judgments, estimates and assumptionsthat affect the reported amounts of revenues, expenses, assets and liabilities, accompanying note disclosures, and the disclosureof contingent liabilities at the reporting date. Therefore, actual results may differ from those estimates and assumptions. The
66
CANACCORD GENUITY GROUP INC. / 2018 ANNUAL REPORT

significant judgments, estimates and assumptions include consolidation, revenue recognition, share-based payments, incometaxes and valuation of deferred tax assets, impairment of goodwill, intangible assets and other long-lived assets, allowance forcredit losses, fair value of financial instruments, capitalization of intangible assets related to software costs, and provisions.Amendments may be made to estimates relating to net assets acquired in an acquisition as well as the allocation of identifiableintangible assets between indefinite life and finite lives. Judgments, estimates and assumptions were also utilized in connectionwith the valuation of goodwill and intangible assets acquired in connection with the acquisition of Hargreave Hale [Note 12].
Consolidation
The Company owns 50% of the voting shares of Canaccord Genuity (Australia) Limited (CGAL) as at March 31, 2018. The Companyalso completed an evaluation of its contractual arrangements with the other shareholders of CGAL and the control it has over thefinancial and operating policies of CGAL and determined it should consolidate under IFRS 10, ‘‘Consolidated FinancialStatements’’ (IFRS 10) as at March 31, 2018 and 2017. Therefore, the financial position, financial performance, and cash flows ofCGAL have been consolidated. Although the Company owns 50% of the issued shares of CGAL as at March 31, 2018, foraccounting purposes, the Company is considered to have a 58% interest because of the shares held in a trust controlled byCanaccord Financial Group (Australia) Pty Ltd. Accordingly, the Company has consolidated the entity and recognized a 42%non-controlling interest as at March 31, 2018 (March 31, 2017 − 42%), which represents the portion of CGAL’s net identifiableassets not owned by the Company. At the date of acquisition, the non-controlling interest was determined using the proportionatemethod. Net income and each component of other comprehensive income are attributed to the non-controlling interest and to theowners of the parent.
The Company has employee benefit trusts, which are considered SPEs [Note 21], to fulfill obligations to employees arising fromthe Company’s share-based payment plans. The employee benefit trusts have been consolidated in accordance with IFRS 10 sincetheir activities are conducted on behalf of the Company, and the Company retains the majority of the benefits and risks of theemployee benefit trusts.
Revenue recognition
Revenue is recognized to the extent that it is probable that the economic benefit will flow to the Company and the revenue can bereliably measured. Estimation may be required to determine the amount of revenue that can be recognized and also the timing ofthe substantial completion of the underlying investment banking or advisory transactions.
Share-based payments
The Company measures the cost of equity-settled and cash-settled transactions with employees and directors based on the fairvalue of the awards granted. The fair value is determined based on the observable share prices or by using an appropriatevaluation model. The use of option pricing models to determine the fair value requires the input of highly subjective assumptionsincluding the expected price volatility, expected forfeitures, expected life of the award and dividend yield. Changes in the subjectiveassumptions can materially affect the fair value estimates. The assumptions and models used for estimating the fair value ofshare-based payments, if and as applicable, are disclosed in Note 21.
Income taxes and valuation of deferred taxes
Accruals for income tax liabilities require management to make estimates and judgments with respect to the ultimate outcome oftax filings and assessments. Actual results could vary from these estimates. The Company operates within different taxjurisdictions and is subject to individual assessments by these jurisdictions. Tax filings can involve complex issues, which mayrequire an extended period of time to resolve in the event of a dispute or re-assessment by tax authorities. Deferred taxes arerecognized for all unused tax losses to the extent that it is probable that taxable profit will be available against which the lossescan be utilized. Significant management judgment is required to determine the amount of deferred tax assets that can berecognized based upon the likely timing and the level of future taxable profit.
Uncertainties exist with respect to the interpretation of complex tax regulations, changes in tax laws and the amount and timing offuture taxable income. The Company establishes tax provisions, based on reasonable estimates, for possible consequences ofaudits by the tax authorities of the respective countries in which it operates. The amount of such provisions is based on variousfactors, such as the Company’s experience of previous tax audits.
Impairment of goodwill and indefinite life intangible assets
Goodwill and indefinite life intangible assets are tested for impairment at least annually, or whenever an event or change incircumstance may indicate potential impairment, to ensure that the recoverable amount of the cash-generating unit (CGU) to whichgoodwill and indefinite life intangible assets are attributed is greater than or equal to their carrying values.
In determining the recoverable amount, which is the higher of fair value less costs to sell (FVLCS) and value-in-use, managementuses valuation models that consider such factors as projected earnings, price-to-earnings multiples, relief of royalties related tobrand names and discount rates. Management must apply judgment in the selection of the approach to determining therecoverable amount and in making any necessary assumptions. These judgments may affect the recoverable amount and anyresulting impairment write-down. The key assumptions used to determine recoverable amounts for the differentcash-generating units are disclosed in Note 13.
Notes to Consolidated Financial Statements 67
2018 ANNUAL REPORT / CANACCORD GENUITY GROUP INC.
Impairment of other long-lived assets
The Company assesses its amortizable long-lived assets at each reporting date to determine whether there is an indication thatan asset may be impaired. If any indication exists, the Company estimates the recoverable amount of the asset or the CGUcontaining the asset using management’s best estimates and available information.
Allowance for credit losses
The Company records allowances for credit losses associated with clients’ receivables, loans, advances and other receivables.The Company establishes an allowance for credit losses based on management’s estimate of probable unrecoverable amounts.Judgment is required as to the timing of establishing an allowance for credit losses and the amount of the required specificallowance, taking into consideration counterparty creditworthiness, current economic trends and past experience. Clients’receivable balances are generally collateralized by securities; therefore, any provision is generally measured after considering themarket value of the collateral, if any.
Fair value of financial instruments
The Company measures its financial instruments at fair value. Fair value is determined based on market prices from independentsources, if available. If there is no available market price, then the fair value is determined by using valuation models. The inputsto these models, such as expected volatility and liquidity discounts, are derived from observable market data where possible; butwhere observable data is not available, judgment is required to select or determine inputs to a fair value model.
There is inherent uncertainty and imprecision in estimating the factors that can affect fair value, and in estimating fair valuesgenerally, when observable data is not available. Changes in assumptions and inputs used in valuing financial instruments couldaffect the reported fair values.
Provisions
The Company records provisions related to pending or outstanding legal matters and regulatory investigations. Provisions inconnection with legal matters are determined on the basis of management’s judgment in consultation with legal counsel,considering such factors as the amount of the claim, the possibility of wrongdoing by an employee of the Company andprecedents. Contingent litigation loss provisions are recorded by the Company when it is probable that the Company will incur aloss as a result of a past event and the amount of the loss can be reliably estimated. The Company also records provisionsrelated to restructuring costs when the recognition criteria for provisions as they apply to restructuring costs are fulfilled.
NOTE 03 Adoption of New and Revised Standards
There were no new or revised standards adopted by the Company during the fiscal year.
NOTE 04 Future Changes in Accounting Policies
Standards issued but not yet effective
Standards issued, which may be reasonably expected to impact upon the Company’s financial statements, but which are not yeteffective are listed below.
IFRS 15, ‘‘Revenue from Contracts with Customers’’
In May 2014, the IASB issued IFRS 15 − Revenue from Contracts with Customers (‘‘IFRS 15’’). IFRS 15 establishes a singlefive-step model framework for determining the nature, amount, timing and uncertainty of revenue and cash flows arising from acontract with a customer. The standard is effective for annual periods on or after January 1, 2018, with early adoption permitted.Either a modified retrospective application or full retrospective application is permitted under IFRS 15. The Company will beadopting IFRS 15 for its fiscal year ending March 31, 2019 using the modified retrospective application approach.
The Company has evaluated the impact of IFRS 15 on its various revenue streams and the assessment is as follows:• Commissions and fees − The Company concluded there is no material change in the amount or timing of revenue
recognized under the new standard as the point of transfer of risk and reward for services and transfer of control occur atthe same time.
• Investment banking − The Company concluded that investment banking will generally not be affected by IFRS 15 asrevenue will be recognized upon completion of the performance obligation.
• Advisory fees − The Company concluded that advisory fees will generally not be affected by IFRS 15 as revenue will berecognized upon completion of the performance obligation. In certain cases, some fees are collected based on progressand do not correspond to the satisfaction of any discrete performance obligation. Under IFRS 15, such payments mayneed to be deferred until the performance obligation is satisfied. The impact of this change on the amount of revenuerecognized in a fiscal year is insignificant.
• Principal trading, interest and other revenue are excluded from the scope of IFRS 15
68 Notes to Consolidated Financial Statements
CANACCORD GENUITY GROUP INC. / 2018 ANNUAL REPORT

IFRS 15 contains presentation and disclosure requirements which are more detailed than the current standards. Upon adoption ofIFRS 15, the Company will provide disclosures for each of the Company’s revenue streams, to supplement the revenue data thatare currently presented in the segmented information disclosure. New disclosures will be presented relating to the timing ofcompletion of the Company’s performance obligations.
IFRS 9, ‘‘Financial Instruments’’
In July 2014, the IASB issued IFRS 9 − Financial Instruments, which replaces the earlier versions of IFRS 9 (2009, 2010, and2013) and completes the IASB’s project to replace IAS 39 − Financial Instruments: Recognition and Measurement. IFRS 9 iseffective for annual periods beginning on or after January 1, 2018 and must be applied retrospectively with the exception of hedgeaccounting. The Company will adopt IFRS 9 for its fiscal year ending March 31, 2019.
The Company has evaluated the impact of IFRS 9 on its consolidated financial statements and the assessment is as follows:
Classification − financial assets and liabilities
IFRS 9 sets out requirements for recognizing and measuring financial assets and financial liabilities. IFRS 9 contains a newclassification and measurement approach for financial assets that reflects the business model in which assets are managed andtheir cash flow characteristics. IFRS 9 contains three principal classification categories for financial assets: measured atamortized cost, fair value through other comprehensive income (‘‘FVOCI’’) and fair value through profit and loss (‘‘FVTPL’’). IFRS 9largely retains the existing requirements in IAS 39 for the classification of financial liabilities. The Company expects to continue toclassify cash and cash equivalents and securities owned as financial assets classified as FVTPL and accounts receivable asfinancial assets measured at amortized costs. The Company’s investment in Euroclear, which is classified as available for sale asof March 31, 2018, will be reclassified as FVOCI. The classification of financial liabilities is expected to remain consistent underIFRS 9.
Impairment − financial assets
IFRS 9 introduces the new ‘‘expected credit loss’’ impairment model which replaces the ‘‘incurred loss’’ model in IAS 39. Based onits assessment, the Company does not believe that new impairment requirements will have a material impact on its financialstatements given the short-term nature of the Company’s receivables.
Hedge accounting requirement
IFRS 9 offers greater flexibility to the types of transactions eligible for hedge accounting. The Company does not expect thischange to have any material impact on its consolidated financial statements upon adoption.
IFRS 16, ‘‘Leases’’
In January 2016, the IASB issued IFRS 16 ‘‘Leases’’ (‘‘IFRS 16’’), which requires lessees to recognize assets and liabilities formost leases. The new standard will be effective for annual periods beginning on or after January 1, 2019. Early adoption ispermitted, provided the new revenue standard, IFRS 15, has been applied, or is applied at the same date as IFRS 16 using eithera full retrospective or a modified retrospective approach. The Company plans to apply IFRS 16 for its year ending March 31, 2020but has not yet selected a transition approach.
Upon adoption of IFRS 16, the Company anticipates it will result in an increase in assets and liabilities related to leases. Due tothe recognition of additional lease assets and liabilities, a higher amount of depreciation expense and interest expense on leaseliabilities will be recognized under IFRS 16 compared to the current standard. Lastly, the Company expects a reduction in operatingcash outflows with a corresponding increase in financing cash outflows under IFRS 16. The Company is in the process ofidentifying and collecting data relating to existing agreements to determine the impact of adoption of IFRS 16.
NOTE 05 Summary of Significant Accounting Policies
TRANSLATION OF FOREIGN CURRENCY TRANSACTIONS AND FOREIGN SUBSIDIARIES
The Company’s consolidated financial statements are presented in Canadian dollars, which is also the Company’s functionalcurrency. Each subsidiary of the Company determines its own functional currency, and items included in the financial statementsof each subsidiary are measured using that functional currency.
Transactions and balances
Transactions in foreign currencies are initially recorded by the Company and its subsidiaries at their respective functionalcurrencies using exchange rates prevailing at the date of the transaction.
Notes to Consolidated Financial Statements 69
2018 ANNUAL REPORT / CANACCORD GENUITY GROUP INC.

Monetary assets and liabilities denominated in foreign currencies are translated by the Company and its subsidiaries into theirrespective functional currencies at the exchange rate in effect at the reporting date. All differences upon translation arerecognized in the consolidated statements of operations.
Non-monetary assets and liabilities denominated in foreign currencies are translated by the Company and its subsidiaries intotheir respective functional currencies at historical rates. Non-monetary items measured at fair value in a foreign currency aretranslated using the exchange rates in effect at the date when the fair value is determined.
Translation of foreign subsidiaries
Assets and liabilities of foreign subsidiaries with a functional currency other than the Canadian dollar are translated into Canadiandollars at rates prevailing at the reporting date, and income and expenses are translated at average exchange rates prevailingduring the period. Unrealized gains or losses arising as a result of the translation of the foreign subsidiaries are recorded inaccumulated other comprehensive income (loss). On disposal of a foreign operation, the component of other comprehensiveincome relating to that particular foreign operation is recognized in the consolidated statements of operations.
The Company also has monetary assets and liabilities that are receivable or payable from a foreign operation. If settlement of thereceivable or payable is neither planned nor likely to occur in the foreseeable future, the differences upon translation arerecognized in accumulated other comprehensive income (loss) as these receivables and payables form part of the net investmentin the foreign operation.
INTANGIBLE ASSETS
Identifiable intangible assets acquired separately are measured on initial recognition at cost. The cost of identifiable intangibleassets acquired in a business combination is equal to their fair value as at the date of acquisition. Following initial recognition,identifiable intangible assets are carried at cost less any accumulated amortization and any accumulated impairment losses. Theamortization of intangible assets is recognized in the consolidated statements of operations as part of amortization expense.
The useful lives of identifiable intangible assets are assessed to be either finite or indefinite. Identifiable intangible assets withfinite lives are amortized over their useful economic lives and assessed for impairment whenever there is an indication that theidentifiable intangible asset may be impaired. The amortization period and the amortization method for an identifiable intangibleasset are reviewed at least annually, at each financial year end.
Identifiable intangible assets with indefinite useful lives are not amortized, but are tested for impairment annually.
Identifiable intangible assets purchased through the acquisitions of Genuity Capital Markets (Genuity), the 50% interest inCanaccord Genuity (Australia) Limited (Canaccord Genuity Australia), Collins Stewart Hawkpoint plc (CSHP), Eden Financial andHargreave Hale are customer relationships, non-competition agreements, trading licenses, fund management contract andtechnology, which have finite lives and are amortized on a straight-line basis over their estimated useful lives. Branding acquiredthrough the acquisition of Genuity is considered to have an indefinite life, as it will provide benefit to the Company over acontinuous period. Software under development or acquired is amortized over its useful life once the asset is available for use.The estimated amortization periods of the amortizable intangible assets are as follows:
Acquired in business combinationsInternally
developed or acquired
GenuityCanaccord Genuity
Australia CSHPEden
FinancialHargreave
Hale Software
Brand names indefinite n/a n/a n/a n/a n/a
Customer relationships 11 years 5 years 8 to 24 years 8 years
11.5 to
12.5 years n/a
Non-competition agreements 5 years 4.5 years n/a n/a n/a n/a
Technology n/a n/a 3 years n/a n/a 10 years
Fund management contract n/a n/a n/a n/a 10.5 years n/a
Internally developed or acquired software
Expenditures towards the development or acquisition of projects are recognized as intangible assets when the Company candemonstrate that the technical feasibility of the assets for use has been established. The assets are carried at cost less anyaccumulated amortization and accumulated impairment losses in accordance with IAS 38 ‘‘Intangible Assets’’. Capitalized costsare expenditures directly attributable to the software development, such as employment, consulting or professional fees.Amortization of the assets begins when development is complete, and the assets are available for use. The assets are amortizedover the period of expected future benefit.
70 Notes to Consolidated Financial Statements
CANACCORD GENUITY GROUP INC. / 2018 ANNUAL REPORT

IMPAIRMENT OF NON-FINANCIAL ASSETS
The Company assesses, at each reporting date, whether there is an indication that an asset may be impaired. If any indicationexists, or when annual impairment testing for an asset is required, the Company estimates the asset’s recoverable amount. Anasset’s recoverable amount is the higher of the FVLCS and the value-in-use of a particular asset or CGU. The recoverable amountis determined for an individual asset, unless the asset does not generate cash inflows that are largely independent of those fromother assets or groups of assets. When the carrying amount of an asset or CGU exceeds its recoverable amount, the asset isconsidered impaired and is written down to its recoverable amount, and the impairment is recognized in the consolidatedstatements of operations.
In assessing FVLCS, the estimated future cash flows are discounted to their present value using a pre-tax discount rate thatreflects current market assessments of the time value of money and the risks specific to the asset. The Company bases itsimpairment calculation on annual budget calculations, which are prepared separately for each of the Company’s CGUs to which theindividual assets are allocated. These budget calculations generally cover a period of five years. A long-term growth rate is thencalculated and applied to project future cash flows after the fifth year.
Impairment losses are recognized in the consolidated statements of operations.
For assets excluding goodwill, an assessment is made at each reporting date to determine whether there is an indication thatpreviously recognized impairment losses no longer exist or have decreased. If such an indication exists, the Company estimatesthe asset’s or CGU’s recoverable amount. A previously recognized impairment loss is reversed only if there has been a change inthe assumptions used to determine the asset’s recoverable amount since the last impairment loss was recognized. The reversalis limited so that the carrying amount of the asset does not exceed its recoverable amount, or exceed the carrying amount thatwould have been determined, net of depreciation, had no impairment loss been recognized for the asset in prior years. Suchreversal is recognized in the consolidated statements of operations.
The following assets have specific characteristics for impairment testing:
Goodwill
Goodwill is tested for impairment annually as at March 31 and when circumstances indicate that the carrying value may beimpaired.
Impairment is determined for goodwill by assessing the recoverable amount of each CGU (or group of CGUs) to which goodwillrelates. When the recoverable amount of the CGU is less than its carrying amount, an impairment loss is recognized. Impairmentlosses relating to goodwill cannot be reversed in future periods.
Intangible assets
Intangible assets with indefinite useful lives are tested for impairment annually as at March 31 at the CGU level and whencircumstances indicate that the carrying value may be impaired.
CASH AND CASH EQUIVALENTS
Cash and cash equivalents consist of cash on deposit, commercial paper and bankers’ acceptances with a term to maturity ofless than three months from the date of purchase, which are subject to an insignificant risk of changes in value.
FINANCIAL INSTRUMENTS
A financial instrument is any contract that gives rise to a financial asset of one entity and a financial liability or equity instrumentof another entity.
[i] Financial assets
Initial recognition and measurement
Financial assets are classified, at initial recognition, as financial assets at fair value through profit or loss, loans and receivables,held to maturity investments or available for sale financial assets, as applicable.
Financial assets are recognized when the entity becomes a party to the contractual provisions of the instrument. For financialassets, trade date accounting is applied, the trade date being the date at which the Company commits itself to either thepurchase or sale of the asset.
All financial assets are initially measured at fair value. Transaction costs related to financial instruments classified as fair valuethrough profit or loss are recognized in the consolidated statements of operations when incurred. Transaction costs for allfinancial instruments other than those classified as fair value through profit or loss are included in the costs of the assets.
Notes to Consolidated Financial Statements 71
2018 ANNUAL REPORT / CANACCORD GENUITY GROUP INC.

Classification and subsequent measurement
Financial assets classified as fair value through profit or loss
Financial assets classified as fair value through profit or loss include financial assets held for trading and financial assetsdesignated upon initial recognition as fair value through profit or loss. Financial assets purchased for trading activities areclassified as held for trading and are measured at fair value, with unrealized gains (losses) recognized in the consolidatedstatements of operations. In addition, provided that the fair value can be reliably determined, IAS 39 permits an entity todesignate any financial instrument as fair value through profit or loss on initial recognition or adoption of this standard even if thatinstrument would not otherwise meet the definition of fair value through profit or loss as specified in IAS 39. The Company did notdesignate any financial assets upon initial recognition as fair value through profit or loss. The Company’s financial assetsclassified as held for trading include cash and cash equivalents, and securities owned, including derivative financial instruments.
The Company periodically evaluates the classification of its financial assets as held for trading based on whether the intent to sellthe financial assets in the near term is still appropriate. If the Company is unable to trade these financial assets due to inactivemarkets or if management’s intent to sell them in the foreseeable future significantly changes, the Company may elect toreclassify these financial assets in rare circumstances.
Financial assets classified as available for sale
Available for sale assets are measured at fair value, with subsequent changes in fair value recorded in other comprehensiveincome, net of tax, until the assets are sold or impaired, at which time the difference is recognized in net income for the year.Investments in equity instruments classified as available for sale that do not have a quoted market price in an active market aremeasured at fair value unless fair value is not reliably measurable. The Company’s investments in Euroclear are classified asavailable for sale and measured at their estimated fair value.
Financial assets classified as loans and receivables and held to maturity
Financial assets classified as loans and receivables and held to maturity are measured at amortized cost using the effectiveinterest rate (EIR) method, less impairment. Amortized cost is calculated by taking into account discounts or premiums onacquisition and fees or costs that are an integral part of the EIR method. The EIR amortization is included in the consolidatedstatements of operations. The Company classifies accounts receivable as loans and receivables. The Company did not have anyheld to maturity investments during the years ended March 31, 2018 and 2017.
Impairment of financial assets
The Company assesses at each reporting date whether there is objective evidence that a financial asset or group of financialassets is impaired. A financial asset or group of financial assets is deemed to be impaired if there is objective evidence ofimpairment as a result of one or more events that have occurred since the initial recognition of the asset and those events havehad a significant or prolonged impact on the estimated future cash flows of the asset that can be reliably estimated. Thedetermination of what is significant or prolonged requires judgment. In making this judgment, the Company evaluates, amongother factors, the duration or extent to which the fair value of an investment is less than its cost.
In the case of debt instruments classified as available for sale, the impairment is assessed based on the same criteria asfinancial assets carried at amortized cost.
If there is objective evidence that an impairment loss has been incurred, the amount of the loss is recognized in the consolidatedstatements of operations and is measured as the difference between the carrying value and the fair value.
Derecognition
A financial asset is derecognized primarily when the rights to receive cash flows from the asset have expired, or the Company hastransferred its right to receive cash flows from the asset.
[ii] Financial liabilities
Initial recognition and measurement
Financial liabilities are classified, at initial recognition, as financial liabilities at fair value through profit or loss, or loans andborrowings. All financial liabilities are recognized initially at fair value less, in the case of other financial liabilities, directlyattributable transaction costs.
Classification and subsequent measurement
Financial liabilities classified as fair value through profit or loss
Financial liabilities classified as fair value through profit or loss include financial liabilities held for trading and financial liabilitiesdesignated upon initial recognition as fair value through profit or loss. Financial liabilities are classified as held for trading if theyare acquired for the purpose of selling in the near term. Gains or losses on liabilities held for trading are recognized in thestatements of operations. The Company has not designated any financial liabilities as fair value through profit or loss that would
72 Notes to Consolidated Financial Statements
CANACCORD GENUITY GROUP INC. / 2018 ANNUAL REPORT

not otherwise meet the definition of fair value through profit or loss upon initial recognition. Bank indebtedness, securities soldshort, including derivative financial instruments, contingent and deferred considerations are classified as held for trading andrecognized at fair value.
Financial liabilities classified as loans and borrowings
After initial recognition, financial liabilities classified as loans and borrowings are subsequently measured at amortized cost usingthe EIR method. Gains and losses are recognized in the statements of operations through the EIR method of amortization. Loansand borrowings include accounts payable and accrued liabilities, bank loan, and subordinated debt. The carrying value of loansand borrowings approximates their fair value.
[iii] Offsetting of financial instruments
Financial assets and financial liabilities are offset, and the net amount is reported in the consolidated statements of financialposition if, and only if, there is a currently enforceable legal right to offset the recognized amounts and there is an intention tosettle on a net basis, or to realize the assets and settle the liabilities simultaneously.
[iv] Derivative financial instruments
Derivative financial instruments are financial contracts, the value of which is derived from the value of the underlying assets,interest rates, indices or currency exchange rates.
The Company uses derivative financial instruments to manage foreign exchange risk on pending security settlements in foreigncurrencies. The fair value of these contracts is nominal due to their short term to maturity.
Realized and unrealized gains and losses related to these contracts are recognized in the consolidated statements of operationsduring the reporting period.
The Company trades in futures contracts, which are agreements to buy or sell standardized amounts of a financial instrument at apredetermined future date and price, in accordance with terms specified by a regulated futures exchange, and subject to dailycash margining. The Company trades in futures in an attempt to mitigate interest rate risk, yield curve risk and liquidity risk.
The Company also trades in forward contracts, which are non-standardized contracts to buy or sell a financial instrument at aspecified price on a future date. The Company trades in forward contracts in an attempt to mitigate foreign exchange risk onpending security settlements in foreign currencies.
FAIR VALUE MEASUREMENT
The Company measures financial instruments at fair value at each reporting period. Fair value is the price that would be receivedto sell an asset or paid to transfer a liability in an orderly transaction between market participants at the measurement date. Thefair value measurement is based on the presumption that the transaction to sell the asset or transfer the liability takes placeeither in the principal market for the asset or liability, or in the absence of a principal market, in the most advantageous market forthe asset or liability.
When available, quoted market prices or dealer price quotations (bid price for long positions and ask price for short positions),without any deduction for transaction costs, are used to determine fair value. For financial instruments not traded in an activemarket, the fair value is determined using appropriate and reliable valuation techniques. Such techniques may include recentarm’s length market transactions; reference to the current fair value of another instrument that is substantially the same;discounted cash flow analysis or other valuation models. Valuation techniques may require the use of estimates or managementassumptions if observable market data is not available. When the fair value cannot be reliably measured using a valuationtechnique, then the financial instrument is measured at cost.
The Company categorizes its fair value measurements according to a three-level hierarchy. The hierarchy prioritizes the inputs usedby the Company’s valuation techniques. A level is assigned to each fair value measured based on the lowest level input significantto the fair value measurement in its entirety [Note 7]. For assets and liabilities that are recognized in the consolidated financialstatements on a recurring basis, the Company determines whether transfers have occurred between levels in the hierarchy byre-assessing categorization (based on the lowest level input that is significant to the fair value measurement as a whole) at theend of each reporting period.
The convertible unsecured senior subordinated debentures are classified as compound financial instruments. On initialrecognition, the fair value of the liability was calculated based on the present value of future cash flows under the instruments,discounted at 8%, being equal to the rate of interest applied by the market at the time of issue to instruments of comparablecredit status and future cash flows, without the conversion feature. The residual amount is recorded as a component ofshareholders’ equity.
Notes to Consolidated Financial Statements 73
2018 ANNUAL REPORT / CANACCORD GENUITY GROUP INC.

SECURITIES OWNED AND SOLD SHORT
Securities owned and sold short are recorded at fair value based on quoted market prices in an active market or a valuationmodel if no market prices are available. Unrealized gains and losses are reflected in income. Certain securities owned have beenpledged as collateral for securities borrowing transactions. Securities owned and sold short are classified as held for tradingfinancial instruments.
SECURITIES LENDING AND BORROWING
The Company employs securities lending and borrowing activities primarily to facilitate the securities settlement process. Thesearrangements are typically short term in nature, with interest being received when cash is delivered, and interest being paid whencash is received. Securities borrowed, and securities loaned are carried at the amounts of cash collateral delivered and receivedin connection with the transactions.
Securities borrowed transactions require the Company to deposit cash, letters of credit or other collateral with the lender. Forsecurities loaned, the Company receives collateral in the form of cash or other collateral in an amount generally in excess of themarket value of the securities loaned. The Company monitors the fair value of the securities loaned and borrowed against thecash collateral on a daily basis and, when appropriate, the Company may require counterparties to deposit additional collateral orit may return collateral pledged to ensure such transactions are adequately collateralized.
Securities purchased under agreements to resell and securities sold under agreements to repurchase represent collateralizedfinancing transactions. The Company receives securities purchased under agreements to resell, makes delivery of securities soldunder agreements to repurchase, monitors the market value of these securities on a daily basis and delivers or obtains additionalcollateral as appropriate.
The Company manages its credit exposure by establishing and monitoring aggregate limits by customer for these transactions.Interest earned on cash collateral is based on a floating rate.
SECURITIES PURCHASED UNDER REVERSE REPURCHASE AGREEMENTS AND OBLIGATIONS RELATED TO SECURITIES SOLDUNDER REPURCHASE AGREEMENTS
The Company recognizes these transactions on the trade date at amortized cost using the effective interest rate method.Securities sold and purchased under repurchase agreements remain on the consolidated statement of financial position. Reverserepurchase agreements and repurchase agreements are treated as collateralized lending and borrowing transactions.
REVENUE RECOGNITION
Revenue is recognized to the extent that it is probable that the economic benefits will flow to the Company and the revenue can bereliably measured. The Company assesses its revenue arrangements in order to determine if it is acting as principal or agent.
Commissions and fees revenue consists of revenue generated through commission-based brokerage services, recognized on atrade date basis, and the sale of fee-based products and services, recognized on an accrual basis. Realized and unrealized gainsand losses on securities purchased for client-related transactions are reported as net facilitation losses and recorded as areduction of commission revenues. Facilitation losses for the year ended March 31, 2018 were $8.4 million [March 31,2017 − $12.8 million].
Investment banking revenue consists of underwriting fees and commissions earned on corporate finance activities. Revenue fromunderwritings and other corporate finance activities is recorded when the underlying transaction is substantially completed underthe engagement terms and the related revenue is reasonably determinable.
Advisory fees consist of management and advisory fees that are recognized on an accrual basis. Also included in advisory fees isrevenue from mergers and acquisitions activities, which is recognized when the underlying transaction is substantially completedunder the engagement terms and the related revenue is reasonably determinable.
Principal trading revenue consists of revenue earned in connection with principal trading operations and is recognized on a tradedate basis.
Interest revenue consists of interest earned on client margin accounts, interest earned on the Company’s cash and cashequivalents balances, interest earned on cash delivered in support of securities borrowing activity, and dividends earned onsecurities owned. Interest revenue is recognized on an effective interest rate basis. Dividend income is recognized when the rightto receive payment is established.
Other revenue includes foreign exchange gains or losses, revenue earned from our correspondent brokerage services andadministrative fees revenues.
74 Notes to Consolidated Financial Statements
CANACCORD GENUITY GROUP INC. / 2018 ANNUAL REPORT

EQUIPMENT AND LEASEHOLD IMPROVEMENTS
Computer equipment, furniture and equipment, and leasehold improvements are recorded at cost less accumulated amortization.Amortization is being recorded as follows:
Computer equipment 33% declining balance basisFurniture and equipment 10% to 20% declining balance basisLeasehold improvements Straight-line over the shorter of useful life and respective term of the leases
An item of property, plant and equipment, and any specific part initially recognized, is derecognized upon disposal or when nofuture economic benefits are expected from its use or disposal. Any gain or loss arising upon derecognition of the asset(calculated as the difference between the net disposal proceeds and the carrying amount of the asset) is included in theconsolidated statements of operations when the asset is derecognized.
The assets’ residual values, useful lives and methods of amortization are reviewed at each financial year end, and are adjustedprospectively where appropriate.
INCOME TAXES
Current income tax
Current income tax assets and liabilities for the current period are measured at the amount expected to be recovered from or paidto the taxation authorities. The tax rates and tax laws used to compute the amounts are those that are enacted or substantivelyenacted, at the reporting date, in the countries where the Company operates and generates taxable income.
Management periodically evaluates positions taken in the Company’s tax returns with respect to situations in which applicable taxregulations are subject to interpretation and establishes provisions where appropriate.
Current income tax relating to items recognized directly in equity is recognized in equity and not in the consolidated statements ofoperations.
Deferred tax
Deferred taxes are accounted for using the liability method. This method requires that deferred taxes reflect the expected deferredtax effect of temporary differences at the reporting date between the carrying amounts of assets and liabilities for financialstatement purposes and their tax bases.
Deferred tax liabilities are recognized for all taxable temporary differences, except for taxable temporary differences associatedwith investments in subsidiaries where the timing of the reversal of the temporary difference can be controlled and it is probablethat the temporary difference will not reverse in the foreseeable future.
Deferred tax assets are recognized for all deductible temporary differences, carryforward of unused tax credits and carryforward ofunused tax losses, to the extent that it is probable that taxable profit will be available against which the deductible temporarydifferences, and the carryforward of unused tax credits and unused tax losses, can be utilized. The carrying amounts of deferredtax assets are reviewed at each reporting date and reduced to the extent that it is no longer probable that sufficient taxable profitwill be available to allow all or part of the deferred tax assets to be utilized. Unrecognized deferred tax assets are assessed ateach reporting date and are recognized to the extent that it has become probable that future taxable profits will allow the deferredtax asset to be recovered.
No deferred tax liability has been recognized for taxable temporary differences associated with investments in subsidiaries fromundistributed profits and foreign exchange translation differences as the Company is able to control the timing of the reversal ofthese temporary differences. The Company has no plans or intention to perform any actions that will cause the temporarydifferences to reverse in the foreseeable future.
Deferred tax assets and liabilities are measured at the tax rates that are expected to apply to the period when the asset isrealized, or the liability is settled, based on tax rates (and tax laws) that have been enacted or substantively enacted by the end ofthe reporting period. Deferred tax is charged or credited in the statements of operations except where it relates to items that maybe credited directly to equity, in which case the deferred tax is recognized directly against equity.
Deferred tax assets and deferred tax liabilities are offset if a legally enforceable right exists to set off current tax assets againstcurrent tax liabilities and the deferred tax assets and the deferred tax liabilities relate to income taxes levied by the same taxationauthority on the same taxable entity.
Sales tax
Revenues, expenses and assets are recognized net of the amount of sales tax, except where the amount of sales tax incurred isnot recoverable from the tax authority. In these circumstances, sales tax is recognized as part of the cost of acquisition of theasset or as part of an item of the expense. The net amount of sales tax recoverable from, or payable to, the taxation authority isincluded as part of accounts receivable or accounts payable in the consolidated statements of financial position.
Notes to Consolidated Financial Statements 75
2018 ANNUAL REPORT / CANACCORD GENUITY GROUP INC.

TREASURY SHARES
The Company’s own equity instruments that are reacquired (treasury shares) are recognized at cost and deducted from equity. Thisincludes shares held in the employee benefits trusts and unvested share purchase loans and preferred shares held in treasury.No gain or loss is recognized in the statements of operations on the purchase, sale, issue or cancellation of the Company’s ownequity instruments. Any difference between the carrying amount and the consideration, if reissued, is recognized in contributedsurplus. Voting rights related to treasury shares are nullified for the Company and no dividends are allocated to them.
EARNINGS (LOSS) PER COMMON SHARE
Basic earnings (loss) per common share is computed by dividing the net income (loss) attributable to common shareholders forthe period by the weighted average number of common shares outstanding. Diluted earnings per common share reflects thedilutive effect in connection with the LTIP, warrants, other share-based payment plans as well as the convertible debentures basedon the treasury stock method. The treasury stock method determines the number of incremental common shares by assumingthat the number of shares the Company has granted to employees has been issued.
SHARE-BASED PAYMENTS
Employees (including senior executives) of the Company receive remuneration in the form of share-based payment transactions,whereby employees render services as consideration for equity instruments (equity-settled transactions). The participatingemployees are eligible to receive shares that generally vest over three years (the ‘‘RSUs’’). This program is referred to as theLong-Term Incentive Plan (the ‘‘LTIP’’ or the ‘‘Plan’’).
Independent directors also receive deferred share units (DSUs) as part of their remuneration, which can only be settled in cash(cash-settled transactions). For the year ended March 31, 2018, certain senior executives receive performance share units (PSUs)as part of their remuneration, which can only be settled in cash (cash-settled transactions).
The dilutive effect, if any, of outstanding options and share-based payments is reflected as additional share dilution in thecomputation of diluted earnings per common share.
Equity-settled transactions
For equity-settled transactions, the Company measures the fair value of share-based awards as of the grant date.
Effective as of March 31, 2018 the Plan was changed to remove certain employment-related conditions for the vesting of RSUawards made as part of the normal course incentive compensation payment cycle. With the change, RSUs will continue to vestafter termination of employment so long as the employee does not violate certain post-termination restrictions and is not engagedin certain competitive or soliciting activities as provided in the Plan. Because of this change, the Company determined that theawards do not meet the criteria for an in-substance service condition, as defined by IFRS 2. Accordingly, RSUs granted as part ofthe normal course incentive compensation payment cycle are expensed in the period in which those awards are deemed to beearned with a corresponding increase in contributed surplus, which is generally the fiscal period in which the awards are eithermade or the immediately preceding fiscal year for those awards made after the end of such fiscal year but were determined andearned in respect of that fiscal year.
For certain awards, typically new hire awards or retention awards, vesting is subject to continued employment and therefore theseawards are subject to a continuing service requirement. Accordingly, the Company recognizes the cost of such awards as anexpense on a graded basis over the applicable vesting period with a corresponding increase in contributed surplus.
The Company estimates the number of equity instruments that will ultimately vest when calculating the expense attributable toequity-settled transactions. No expense is recognized for awards that do not ultimately vest.
When share-based awards vest, contributed surplus is reduced by the applicable amount and share capital is increased by thesame amount.
Cash-settled transactions
The cost of cash-settled transactions is measured initially at fair value at the grant date. The fair values of DSUs and PSUs areexpensed upon grant [Note 21]. The liability is remeasured to fair value at each reporting date up to and including the settlementdate, with changes in fair value recognized through the statements of operations.
PROVISIONS
Provisions are recognized when the Company has a present obligation as a result of a past event, it is probable that an outflow ofresources embodying economic benefits will be required to settle the obligation and a reliable estimate can be made of theamount of the obligation. The expense relating to any provision is presented in the statements of operations net of anyreimbursement. If the effect of the time value of money is significant, provisions are discounted using a current pre-tax rate thatreflects, where appropriate, the risks specific to the liability. Where discounting is used, the increase in the provision due to thepassage of time is recognized as an interest expense.
76 Notes to Consolidated Financial Statements
CANACCORD GENUITY GROUP INC. / 2018 ANNUAL REPORT

Legal provisions
Legal provisions are recognized when it is probable that the Company will be liable for the future obligation as a result of a pastevent related to legal matters and when they can be reasonably estimated.
Restructuring provisions
Restructuring provisions are only recognized when the recognition criteria for provisions are fulfilled. In order for the recognitioncriteria to be met, the Company needs to have in place a detailed formal plan about the business or part of the businessconcerned, the location and number of employees affected, a detailed estimate of associated costs and an appropriate timeline.In addition, either the personnel affected must have a valid expectation that the restructuring is being carried out or theimplementation must have been initiated. The restructuring provision recognized includes staff restructuring costs, reorganizationexpenses, onerous lease provisions and impairment of equipment and leasehold improvements.
LEASES
The determination of whether an arrangement is, or contains, a lease is based on the substance of the arrangement at theinception date, whether fulfillment of the arrangement is dependent on the use of a specific asset or assets or the arrangementconveys a right to use the asset, even if that right is not explicitly specified in an arrangement. The Company has assessed itslease arrangements and concluded that the Company only has leases that have the characteristics of an operating lease. Anoperating lease is a lease that does not transfer substantially all of the risks and benefits and ownership of an asset to thelessee. Operating lease payments are recognized as an expense in the statements of operations on a straight-line basis over thelease term.
CLIENT MONEY
The Company’s UK and Europe operations hold money on behalf of their clients in accordance with the client money rules of theFinancial Conduct Authority in the United Kingdom. Such money and the corresponding liabilities to clients are not included in theconsolidated statements of financial position as the Company is not beneficially entitled thereto. The amounts held on behalf ofclients at the reporting date are included in Note 25.
SEGMENT REPORTING
The Company’s segment reporting is based on the following operating segments: Canaccord Genuity, Canaccord Genuity WealthManagement and Corporate and Other. The Company’s business operations are grouped into the following geographic regions:Canada, UK, Europe and Dubai, Australia, the US, and Other Foreign Locations which comprised of our Asian based operations.
NOTE 06 Securities Owned and Securities Sold Short
March 31, 2018 March 31, 2017Securities
ownedSecurities sold
shortSecurities
ownedSecurities sold
short
Corporate and government debt $ 254,671 $ 220,792 $ 571,066 $ 541,827
Equities and convertible debentures 214,546 80,214 213,164 103,915
$ 469,217 $ 301,006 $ 784,230 $ 645,742
As at March 31, 2018, corporate and government debt maturities range from 2018 to 2098 [March 31, 2017 − 2017 to 2098]and bear interest ranging from 0.00% to 14.00% [March 31, 2017 − 0.00% to 14.00%].
Notes to Consolidated Financial Statements 77
2018 ANNUAL REPORT / CANACCORD GENUITY GROUP INC.

NOTE 07 Financial Instruments
CATEGORIES OF FINANCIAL INSTRUMENTS
The categories of financial instruments, other than cash and cash equivalents and bank indebtedness, held by the Company atMarch 31, 2018 and 2017 are as follows:
Held fortrading
Availablefor sale
Loans andreceivables
Loans andborrowings Total
March 31,2018
March 31,2017
March 31,2018
March 31,2017
March 31,2018
March 31,2017
March 31,2018
March 31,2017
March 31,2018
March 31,2017
Financial assetsSecurities owned $ 469,217 $ 784,230 $ — $ — $ — $ — $ — $ — $ 469,217 $ 784,230Accounts receivable from
brokers andinvestment dealers — — — — 1,405,380 2,625,939 — — 1,405,380 2,625,939
Accounts receivable fromclients — — — — 333,434 373,300 — — 333,434 373,300
RRSP cash balances heldin trust — — — — 330,369 302,532 — — 330,369 302,532
Other accountsreceivable — — — — 146,654 93,965 — 146,654 93,965
Investments — — — 2,829 — — — — — 2,829
Total financial assets $ 469,217 $ 784,230 $ — $ 2,829 $ 2,215,837 $3,395,736 $ — $ — $ 2,685,054 $ 4,182,795
Financial liabilitiesSecurities sold short $ 301,006 $ 645,742 $ — $ — $ — $ — $ — $ — $ 301,006 $ 645,742Accounts payable to
brokers andinvestment dealers — — — — — — 1,051,546 1,913,177 1,051,546 1,913,177
Accounts payable toclients — — — — — — 1,228,201 1,468,410 1,228,201 1,468,410
Other accounts payableand accrued liabilities — — — — — — 359,207 288,296 359,207 288,296
Subordinated debt — — — — — — 7,500 7,500 7,500 7,500Convertible debentures — — — — — — 57,081 56,442 57,081 56,442Deferred consideration — — — — — — 9,997 — 9,997 —Contingent consideration — — — — — — 49,844 — 49,844 —Bank loan — — — — — — 71,437 — 71,437 —
Total financial liabilities $ 301,006 $ 645,742 $ — $ — $ — $ — $ 2,834,813 $3,733,825 $ 3,135,819 $ 4,379,567
The Company has not designated any financial instruments as fair value through profit or loss upon initial recognition using thefair value option.
FAIR VALUE HIERARCHY
All financial instruments for which fair value is recognized or disclosed are categorized within a fair value hierarchy, described asfollows, and based on the lowest level input that is significant to the fair value measurement as a whole:
Level 1 − Quoted market prices in an active market (that are unadjusted) for identical assets or liabilities
Level 2 − Valuation techniques (for which the lowest level input that is significant to the fair value measurement is directly orindirectly observable)
Level 3 − Valuation techniques (for which the lowest level input that is significant to the fair value measurement isunobservable)
For financial instruments that are recognized at fair value on a recurring basis, the Company determines whether transfers haveoccurred between levels in the hierarchy by re-assessing categorization (based on the lowest level input that is significant to thefair value measurement as a whole) at the end of each reporting period.
78 Notes to Consolidated Financial Statements
CANACCORD GENUITY GROUP INC. / 2018 ANNUAL REPORT

As at March 31, 2018 and 2017, the Company held the following classes of financial instruments measured at fair value:
Estimated fair value
March 31, 2018March 31, 2018 Level 1 Level 2 Level 3
Securities owned
Corporate debt $ 13,794 $ — $ 13,794 $ —
Government debt 240,877 30,593 210,284 —
Corporate and government debt 254,671 30,593 224,078 —
Equities 214,086 165,546 48,404 136
Convertible debentures 460 — 460 —
Equities and convertible debentures 214,546 165,546 48,864 136
469,217 196,139 272,942 136
Securities sold short
Corporate debt (4,836) — (4,836) —
Government debt (215,956) (34,388) (181,568) —
Corporate and government debt (220,792) (34,388) (186,404) —
Equities (79,011) (66,714) (12,297) —
Convertible debentures (1,203) — (1,203) —
Equities and convertible debentures (80,214) (66,714) (13,500) —
(301,006) (101,102) (199,904) —
Deferred considerations (9,997) — — (9,997)
Contingent consideration (49,844) — — (49,844)
(360,847) (101,102) (199,904) (59,841)
Estimated fair valueMarch 31, 2017
March 31, 2017 Level 1 Level 2 Level 3
Securities owned
Corporate debt $ 15,071 $ — $ 15,071 $ —
Government debt 555,995 277,121 278,874 —
Corporate and government debt 571,066 277,121 293,945 —
Equities 207,050 165,292 41,616 142
Convertible debentures 6,114 — 6,114 —
Equities and convertible debentures 213,164 165,292 47,730 142
Available for sale investments 2,829 — 2,829 —
787,059 442,413 344,504 142
Securities sold short
Corporate debt (11,524) — (11,524) —
Government debt (530,303) (313,077) (217,226) —
Corporate and government debt (541,827) (313,077) (228,750) —
Equities (103,915) (77,562) (26,353) —
(645,742) (390,639) (255,103) —
Notes to Consolidated Financial Statements 79
2018 ANNUAL REPORT / CANACCORD GENUITY GROUP INC.

Movement in net Level 3 financial liabilities
Balance, March 31, 2016 $ 2,593
Purchase of Level 3 assets (2,390)
Other (61)
Balance, March 31, 2017 $ 142
Other (6)
Addition of deferred consideration (9,997)
Addition of contingent consideration (49,844)
Balance, March 31, 2018 $ (59,705)
There were $59.8 million of contingent and deferred consideration included as part of the total purchase consideration for theacquisition of Hargreave Hale Limited [Note 12]. The deferred and contingent considerations are settled in cash and are thereforeclassified as financial liability measured at fair value, with any subsequent gains or losses recognized in earnings.
During the year ended March 31, 2017, the Company recorded an unrealized loss of $2.4 million related to the impairment of aninvestment in a private company.
Fair value estimation
i. Level 2 financial instruments
Level 2 financial instruments include the Company’s investment in certain corporate and government debt, convertible debt, andover-the-counter equities. The fair values of corporate and government debt, and convertible debt classified as Level 2 aredetermined using the quoted market prices of identical assets or liabilities in markets that do not have transactions which takeplace with sufficient frequency and volume to provide pricing information on an ongoing basis. The Company regularly reviews thetransaction frequency and volume of trading in these instruments to determine the accuracy of pricing information.
Level 2 financial instruments also include the Company’s equity investment in Euroclear, which has an estimated fair value of$6.4 million as at March 31, 2018 [March 31, 2017 − $2.8 million]. The current fair value is determined using a market-basedapproach based on recent share buyback transactions.
ii. Level 3 financial instruments
Held for Trading
The fair value for level 3 investments classified as held for trading is determined by the Company using a market-based approachwith information that the Company has determined to be reliable, and represents the best estimate of fair value readily available.Prices for held for trading investments are determined based on the last trade price or offer price, or, if these prices areconsidered stale, the Company obtains information based on certain inquiries, recent trades or pending new issues. The fair valueof the held for trading investments as at March 31, 2018 was $0.1 million [March 31, 2017 − $0.1 million].
Level 3 financial liabilities also include the deferred and contingent considerations included as part of the total purchaseconsideration for the acquisition of Hargreave Hale [Note 12]. The fair value for these financial liabilities approximate their carryingvalue as of March 31, 2018.
The fair value measurements determined as described above may not be indicative of net realizable value or reflective of futurevalues. Furthermore, the Company believes its valuation methods are appropriate and consistent with those which would beutilized by a market participant.
RISK MANAGEMENT
Credit risk
Credit risk is the risk of loss associated with a counterparty’s inability to fulfill its payment obligations. Credit risk arises from cashand cash equivalents, net receivables from clients and brokers and investment dealers, and other accounts receivable. Themaximum exposure of the Company to credit risk before taking into account any collateral held or other credit enhancements isthe carrying amount of financial assets as disclosed in the consolidated financial statements as at March 31, 2018 and 2017.
The primary source of credit risk to the Company is in connection with trading activity by private clients and private client marginaccounts. To minimize its exposure, the Company applies certain credit standards, applies limits to transactions and requiressettlement of securities transactions on a cash basis or delivery against payment. Margin transactions are collateralized bysecurities in the clients’ accounts in accordance with limits established by the applicable regulatory authorities and are subject tothe Company’s credit review and daily monitoring procedures. Management monitors the collectability of receivables andestimates an allowance for doubtful accounts. The accounts receivable outstanding are expected to be collectible withinone year. The Company has recorded an allowance for doubtful accounts of $3.4 million as at March 31, 2018 [March 31,2017 − $4.9 million] [Note 9].
80 Notes to Consolidated Financial Statements
CANACCORD GENUITY GROUP INC. / 2018 ANNUAL REPORT

The Company is also exposed to the risk that counterparties to transactions will not fulfill their obligations. Counterpartiesprimarily include investment dealers, clearing agencies, banks and other financial institutions. The Company does not rely entirelyon ratings assigned by credit rating agencies in evaluating counterparty risk. The Company mitigates credit risk by performing itsown due diligence assessments on the counterparties, obtaining and analyzing information regarding the structure of the financialinstruments, and keeping current with new innovations in the market. The Company also manages this risk by conducting regularcredit reviews to assess creditworthiness, reviewing security and loan concentrations, holding and marking to market collateral oncertain transactions and conducting business through clearing organizations with performance guarantees.
As at March 31, 2018 and 2017, the Company’s most significant counterparty concentrations were with financial institutions andinstitutional clients. Management believes that they are in the normal course of business and does not anticipate loss fornon-performance.
Liquidity risk
Liquidity risk is the risk that the Company cannot meet a demand for cash or fund its obligations as they become due. TheCompany’s management is responsible for reviewing liquidity resources to ensure funds are readily available to meet its financialobligations as they become due, as well as ensuring adequate funds exist to support business strategies and operational growth.The Company’s business requires capital for operating and regulatory purposes. The current assets reflected on the statements offinancial position are highly liquid. The majority of the positions held as securities owned are readily marketable and all arerecorded at their fair value. Client receivables are generally collateralized by readily marketable securities and are reviewed dailyfor impairment in value and collectability. Receivables and payables from brokers and dealers represent the following: currentopen transactions that generally settle within the normal three-day settlement cycle; collateralized securities borrowed and/orloaned in transactions that can be closed within a few days on demand; and balances on behalf of introducing brokersrepresenting net balances in connection with their client accounts. Additional information regarding the Company’s capitalstructure and capital management objectives is discussed in Note 24.
The following table presents the contractual terms to maturity of the financial liabilities owed by the Company as at March 31,2018:
Financial liability Carrying amount Contractual term to maturityMarch 31, 2018 March 31, 2017
Bank indebtedness $ — $ 25,280 Due on demand
Accounts payable and accrued liabilities 2,638,954 3,669,883 Due within one year
Securities sold short 301,006 645,742 Due within one year
Subordinated debt 7,500 7,500 Due on demand(1)
Convertible debentures 57,081 56,442 Due in December 2021
Current portion of bank loan 9,679 — Due within one year
Bank loan 61,758 — 2019 to 2021
Deferred consideration 9,997 — September 2023
(1) Subject to Investment Industry Regulatory Organization of Canada’s approval.
The fair values for cash, accounts receivable and accounts payable and accrued liabilities approximate their carrying values andwill be paid within 12 months.
Market risk
Market risk is the risk that the fair value of financial instruments will fluctuate because of changes in market prices. The Companyseparates market risk into three categories: fair value risk, interest rate risk and foreign exchange risk.
Fair value risk
When participating in underwriting activities, the Company may incur losses if it is unable to resell the securities it is committed topurchase or if it is forced to liquidate its commitment at less than the agreed upon purchase price. The Company is also exposedto fair value risk as a result of its principal trading activities in equity securities, fixed income securities, and derivative financialinstruments. Securities at fair value are valued based on quoted market prices where available and, as such, changes in fair valueaffect earnings as they occur. Fair value risk also arises from the possibility that changes in market prices will affect the value ofthe securities the Company holds as collateral for client margin accounts. The Company mitigates its fair value risk exposurethrough controls to limit concentration levels and capital usage within its inventory trading accounts, as well as through monitoringprocedures of the margin accounts.
Notes to Consolidated Financial Statements 81
2018 ANNUAL REPORT / CANACCORD GENUITY GROUP INC.

The following table summarizes the effect on earnings as a result of a fair value change in financial instruments as at March 31,2018. This analysis assumes all other variables remain constant. The methodology used to calculate the fair value sensitivity isconsistent with the prior year.
March 31, 2018 March 31, 2017
Financial instrumentCarrying value
Asset (Liability)
Effect of a10% increase in
fair value onnet income
Effect of a10% decrease in
fair value onnet income
Carrying valueAsset (Liability)
Effect of a10% increase in
fair value onnet income
Effect of a10% decrease in
fair value onnet income
Equities and convertible
debentures owned 214,546 8,850 (8,850) 213,164 8,793 (8,793)
Equities and convertible
debentures sold short (80,214) (3,308) 3,308 (103,915) (4,286) 4,286
The following table summarizes the effect on other comprehensive income (OCI) as a result of a fair value change in the financialinstruments classified as available for sale. This analysis assumes all other variables remain constant and there is no permanentimpairment. The methodology used to calculate the fair value sensitivity is consistent with the prior year.
March 31, 2018 March 31, 2017
Financial instrument Carrying value
Effect of a10% increase in
fair valueon OCI
Effect of a10% decrease in
fair valueon OCI Carrying value
Effect of a10% increase in
fair valueon OCI
Effect of a10% decrease in
fair valueon OCI
Investments $ — $ — $ — $ 2,829 $ 283 $ (283)
Interest rate risk
Interest rate risk arises from the possibility that changes in interest rates will affect the fair value or future cash flows of financialinstruments held by the Company. The Company incurs interest rate risk on its cash and cash equivalent balances, bankindebtedness, fixed income portion of securities owned and securities sold short, net clients’ balances, RRSP cash balances heldin trust and net brokers’ and investment dealers’ balances, as well as its subordinated debt and bank loan. The Companyattempts to minimize and monitor its exposure to interest rate risk through quantitative analysis of its net positions of fixedincome securities, clients’ balances, securities lending and borrowing activities, and short-term borrowings. The Company alsotrades in futures in an attempt to mitigate interest rate risk. Futures are included in marketable securities owned, net ofmarketable securities sold short, for the purpose of calculating interest rate sensitivity.
All cash and cash equivalents mature within three months. Net clients’ receivable (payable) balances charge (incur) interest basedon floating interest rates. Subordinated debt bears interest at a rate of prime plus 4.0%, payable monthly.
The following table provides the effect on net income for the years ended March 31, 2018 and 2017 if interest rates hadincreased or decreased by 100 basis points applied to balances as of March 31, 2018 and 2017. Fluctuations in interest ratesdo not have an effect on OCI. This sensitivity analysis assumes all other variables remain constant. The methodology used tocalculate the interest rate sensitivity is consistent with the prior year.
March 31, 2018 March 31, 2017
Carrying valueAsset (Liability)
Net incomeeffect of a
100 bpsincrease in
interest rates
Net incomeeffect of a
100 bpsdecreases in
interest rates(1)Carrying value
Asset (Liability)
Net incomeeffect of a
100 bpsincrease in
interest rates
Net incomeeffect of a
100 bpsdecreases in
interest rates(1)
Cash and cash equivalents, net of
bank indebtedness $ 862,838 $ 6,471 $ (6,471) $ 652,489 $ 4,894 $ (4,894)
Marketable securities owned, net
of marketable securities sold
short 168,211 (1,211) 1,365 138,488 (359) 225
Clients’ payable, net (894,767) (6,783) (1,949) (1,095,110) (8,215) (2,249)
RRSP cash balances held in trust 330,369 2,478 (2,478) 302,532 2,269 (2,269)
Brokers’ and investment dealers’
balance, net 353,834 1,343 (3,560) 712,762 (8,117) 406
Subordinated debt (7,500) (56) 56 7,500 (56) 56
Bank loan (71,437) (536) 536 — — —
(1) Subject to a floor of zero
82 Notes to Consolidated Financial Statements
CANACCORD GENUITY GROUP INC. / 2018 ANNUAL REPORT

Foreign exchange risk
Foreign exchange risk arises from the possibility that changes in foreign currency exchange rates will result in losses. TheCompany’s primary foreign exchange risk results from its investment in its US, Australia, and UK and Europe subsidiaries. Thesesubsidiaries are translated using the foreign exchange rate at the reporting date. Any fluctuation in the Canadian dollar against theUS dollar, the pound sterling, or the Australian dollar will result in a change in the unrealized gains (losses) on translation offoreign operations recognized in accumulated other comprehensive income (loss).
All of the subsidiaries may also hold financial instruments in currencies other than their functional currency; therefore, anyfluctuations in foreign exchange rates will impact foreign exchange gains or losses in the statement of operations.
The following table summarizes the estimated effects on net income (loss) and OCI as a result of a 5% change in the value of theforeign currencies where there is significant exposure. The analysis assumes all other variables remain constant. Themethodology used to calculate the foreign exchange rate sensitivity is consistent with the prior year.
As at March 31, 2018:
Currency
Effect of a5% appreciation
in foreignexchange rateon net income
Effect of a5% depreciation
in foreignexchange rateon net income
Effect of a5% appreciation
in foreignexchange rate
on OCI
Effect of a5% depreciation
in foreignexchange rate
on OCI
US dollar $ (1,074) $ 1,074 $ 16,956 $ (16,956)
Pound sterling (1,560) 1,560 74,619 (74,619)
Australian dollar nil nil 1,724 (1.724)
As at March 31, 2017:
Currency
Effect of a5% appreciation
in foreignexchange rateon net income
Effect of a5% depreciation
in foreignexchange rateon net income
Effect of a5% appreciation
in foreignexchange rate
on OCI
Effect of a5% depreciation
in foreignexchange rate
on OCI
US dollar $ (395) $ 395 $ 11,120 $ (11,120)
Pound sterling (560) 560 27,578 (27,578)
Australian dollar nil nil 1,407 (1,407)
DERIVATIVE FINANCIAL INSTRUMENTS
Derivative financial instruments are financial contracts, the value of which is derived from the value of the underlying assets,interest rates, indices or currency exchange rates. All derivative financial instruments are expected to be settled within six monthssubsequent to fiscal year end.
Foreign exchange forward contracts
The Company uses derivative financial instruments to manage foreign exchange risk on pending security settlements in foreigncurrencies. The fair value of these contracts is nominal due to their short term to maturity.
Realized and unrealized gains and losses related to these contracts are recognized in the consolidated statements of operationsduring the reporting period.
Forward contracts outstanding at March 31, 2018:
Notional amount(millions) Average price Maturity Fair value
To sell US dollars USD $ 17.7 $1.28 (CAD/USD) April 2, 2018 $ (240)
To buy US dollars USD $ 2.1 $1.29 (CAD/USD) April 2, 2018 $ 3
Forward contracts outstanding at March 31, 2017:
Notional amount(millions) Average price Maturity Fair value
To sell US dollars USD $ 22.1 $1.33 (CAD/USD) April 3, 2017 $ 71
To buy US dollars USD $ 2.9 $1.33 (CAD/USD) April 3, 2017 $ (2)
Notes to Consolidated Financial Statements 83
2018 ANNUAL REPORT / CANACCORD GENUITY GROUP INC.

The Company’s Canaccord Genuity Wealth Management segment in the UK and Europe trades foreign exchange forward contractson behalf of its clients, and establishes matching contracts with the counterparties. The Company has no significant net exposure,assuming no counterparty default. The principal currencies of the forward contracts are: the UK pound sterling, the US dollar, orthe euro. The weighted average term to maturity is 85 days as at March 31, 2018 [March 31, 2017 − 61 days]. The table belowshows the fair value of the forward contract assets and liabilities, and the notional value of these forward contracts as atMarch 31, 2018. The fair value of the forward contract assets and liabilities is included in the accounts receivable and payablebalances.
March 31, 2018 March 31, 2017
Assets LiabilitiesNotionalamount Assets Liabilities
Notionalamount
Foreign exchange forward contracts $ 847 $ 747 $ 141,662 $ 1,806 $ 1,640 $ 177,384
FUTURES
The Company’s Canadian operations are involved in trading bond futures contracts, which are agreements to buy or sell astandardized amount of an underlying Government of Canada bond, at a predetermined future date and price, in accordance withterms specified by a regulated futures exchange, and are subject to daily cash margining. The Company’s Canadian operationstrade in bond futures in an attempt to mitigate interest rate risk, yield curve risk and liquidity risk. At March 31, 2018, the notionalamount of the bond futures contracts outstanding was long $0.1 million [March 31, 2017 − $0.5 million].
The Company’s Canadian operations are also involved in trading US Treasury futures in an attempt to mitigate interest rate risk,yield curve risk and liquidity risk. There were no outstanding US Treasury futures contracts outstanding as at March 31, 2018 andMarch 31, 2017.
The fair value of all of the above futures contracts is nominal due to their short term to maturity and are included in accountsreceivable and accounts payable and accrued liabilities. Realized and unrealized gains and losses related to these contracts arerecognized in the statement of operations during the reporting period.
SECURITIES LENDING AND BORROWING
The Company employs securities lending and borrowing primarily to facilitate the securities settlement process. Thesearrangements are typically short term in nature, with interest being received when cash is delivered, and interest being paid whencash is received. These transactions are fully collateralized and are subject to daily margin calls for any deficiency between themarket value of the security given and the amount of collateral received. These transactions are collateralized by either cash orsecurities, including government treasury bills and government bonds, and are reflected within accounts receivable and accountspayable. Interest earned on cash collateral is based on a floating rate. At March 31, 2018, the floating rates ranged from 0.50% to0.75% [March 31, 2017 − 0.00% to 0.25%].
Cash Securities
Loaned ordelivered as
collateral
Borrowed orreceived as
collateral
Loaned ordelivered as
collateral
Borrowed orreceived as
collateral
March 31, 2018 $ 185,042 $ 36,359 $ 52,685 $ 227,677
March 31, 2017 182,474 41,098 43,252 233,811
BANK INDEBTEDNESS
The Company enters into call loans or overdraft positions primarily to facilitate the securities settlement process for both clientand Company securities transactions. The bank indebtedness is collateralized by unpaid client securities and/or securities ownedby the Company. As at March 31, 2018 the Company had $nil bank indebtedness outstanding [March 31, 2017 − $25.3 million].
BANK LOAN
A subsidiary of the Company entered a £40.0 million (C$72.5 million as of March 31, 2018) senior credit facility to finance aportion of the cash consideration for its acquisition of Hargreave Hale Limited [Notes 12 and 16]. The balance outstanding as ofMarch 31, 2018 net of unamortized financing fees was $71.4 million. The loan is repayable in instalments of principal andinterest over a period of 4 years. The interest rate on this loan is LIBOR plus 3.375% per annum.
OTHER CREDIT FACILITIES
Subsidiaries of the Company have credit facilities with banks in Canada and the UK for an aggregate amount of $669.2 million[March 31, 2017 − $602.6 million]. These credit facilities, consisting of call loans, letters of credit and daylight overdraft facilities,are collateralized by unpaid client securities and/or securities owned by the Company. As of March 31, 2018 and 2017, therewere no balances outstanding under these other credit facilities.
84 Notes to Consolidated Financial Statements
CANACCORD GENUITY GROUP INC. / 2018 ANNUAL REPORT

A subsidiary of the Company has also entered into secured irrevocable standby letters of credit from a financial institution totaling$2.6 million (US$2.0 million) [March 31, 2017 − $2.7 million (US$2.0 million)] as rent guarantees for its leased premises in NewYork. As of March 31, 2018 and 2017, there were no outstanding balances under these standby letters of credit.
NOTE 08 Interest in Other Entities
The Company has a 58% controlling interest for accounting purposes in Canaccord Financial Group (Australia) Pty Ltd. andCanaccord Genuity (Australia) Limited as of March 31, 2018 [March 31, 2017 − 58%]. Together, these entities operate asCanaccord Genuity Australia and the operation’s principal place of business is in Australia. As discussed in Note 24, CanaccordGenuity (Australia) Limited is regulated by the Australian Securities and Investments Commission.
Canaccord Genuity Australia reported total net income of $9.6 million in fiscal 2018 [2017: net income of $12.5 million]. As atMarch 31, 2018, accumulated non-controlling interest was $13.6 million [March 31, 2017 − $11.9 million]. Summarized financialinformation including goodwill on acquisition and consolidation adjustments before inter-company eliminations is presented.
Summarized statement of profit or loss for the years ended March 31, 2018 and 2017:
Canaccord Genuity Australia
For the years endedMarch 31,
2018March 31,
2017
Revenue $ 57,022 $ 59,693
Expenses (42,113) (42,088)
Net income before taxes 14,909 17,605
Income tax expense 5,261 5,153
Net income 9,648 12,452
Attributable to:
CGGI shareholders 5,595 7,369
Non-controlling interests 4,053 5,083
Total comprehensive income 11,084 12,844
Attributable to:
CGGI shareholders 6,429 7,597
Non-controlling interests 4,655 5,247
Dividends paid to non-controlling interests 3,445 2,520
Summarized statement of financial position as at March 31, 2018 and 2017:
Canaccord Genuity Australia
March 31,2018
March 31,2017
Current assets $ 55,486 $ 51,817
Non-current assets 1,302 5,460
Current liabilities 21,974 25,189
Non-current liabilities 3,525 —
Summarized cash flow information for the years ended March 31, 2018 and 2017:
Canaccord Genuity Australia
March 31,2018
March 31,2017
Cash provided by operating activities $ 2,069 $ 11,623
Cash used by financing activities (6,890) (3,679)
Cash used by investing activities (120) (201)
Foreign exchange impact on cash balance 10 276
Net (decrease) increase in cash and cash equivalents $(4,931) $ 8,019
Notes to Consolidated Financial Statements 85
2018 ANNUAL REPORT / CANACCORD GENUITY GROUP INC.

NOTE 09 Accounts Receivable and Accounts Payable and Accrued Liabilities
ACCOUNTS RECEIVABLEMarch 31,
2018March 31,
2017
Brokers and investment dealers $ 1,405,380 $ 2,625,939
Clients 333,434 373,300
RRSP cash balances held in trust 330,369 302,532
Other 146,654 93,965
$ 2,215,837 $ 3,395,736
ACCOUNTS PAYABLE AND ACCRUED LIABILITIES
March 31,2018
March 31,2017
Brokers and investment dealers $ 1,051,546 $ 1,913,177
Clients 1,228,201 1,468,410
Other 359,207 288,296
$ 2,638,954 $ 3,669,883
Amounts due from and to brokers and investment dealers include balances from resale and repurchase agreements, securitiesloaned and borrowed, as well as brokers’ and dealers’ counterparty balances.
Client security purchases are entered into on either a cash or a margin basis. In the case of a margin account, the Companyextends a loan to a client for the purchase of securities, using securities purchased and/or other securities in the client’s accountas collateral. Amounts loaned to any client are limited by the margin regulations of the Investment Industry RegulatoryOrganization of Canada (IIROC) and other regulatory authorities and are subject to the Company’s credit review and dailymonitoring procedures.
Amounts due from and to clients are due by the settlement date of the trade transaction. Margin loans are due on demand andare collateralized by the assets in the clients’ accounts. Interest on margin loans and on amounts due to clients is based on afloating rate [March 31, 2018 − 6.45% to 7.50% and 0.00% to 0.45%, respectively; March 31, 2017 − 5.70% to 6.75% and0.00% to 0.05%, respectively].
As at March 31, 2018, the allowance for doubtful accounts was $3.4 million [March 31, 2017 − $4.9 million]. See below for themovements in the allowance for doubtful accounts:
Balance, March 31, 2016 $ 10,763
Charge for the year 4,153
Recoveries (4,601)
Write-offs (5,317)
Foreign exchange (56)
Balance, March 31, 2017 $ 4,942
Charge for the year 4,831
Recoveries (4,168)
Write-offs (2,235)
Foreign exchange (7)
Balance, March 31, 2018 $ 3,363
86 Notes to Consolidated Financial Statements
CANACCORD GENUITY GROUP INC. / 2018 ANNUAL REPORT

NOTE 10 Investments
March 31,2018
March 31,2017
Available for sale $ 2,035 $ 2,829
During the year ended March 31, 2018, the Company reclassified its investment in Euroclear, one of the principal clearing housesfor securities traded in the Euromarket, from investments to securities owned as a result of a change in the business model inwhich it is held. The investment is classified as level 2 available for sale financial instrument.
During the year ended March 31, 2018, the Company, through a wholly-owned subsidiary, invested $2.5 million for 833,333Class B Units, at $3.00 per unit, in Canaccord Genuity Acquisition Corp. (‘‘CGAC’’). CGAC is a special purpose acquisitioncorporation formed to effect an acquisition of one or more businesses. Each Class B Unit consists of one Class B Share and onewarrant.
The Company holds a 26.2% interest in CGAC and is considered to exert significant influence over the operations of CGAC.Accordingly, the investment in CGAC is accounted for using the equity method.
The Company’s equity portion of the net loss of CGAC for the year ended March 31, 2018 was $0.3 million.
NOTE 11 Equipment and Leasehold Improvements
CostAccumulatedamortization
Net bookvalue
March 31, 2018
Computer equipment $ 19,929 $ 13,350 $ 6,579
Furniture and equipment 26,265 20,237 6,028
Leasehold improvements 86,533 68,173 18,360
132,727 101,760 30,967
March 31, 2017
Computer equipment 9,999 4,476 5,523
Furniture and equipment 21,953 17,764 4,189
Leasehold improvements 83,513 61,746 21,767
115,465 83,986 31,479
Computerequipment
Furniture andequipment
Leaseholdimprovements Total
Cost
Balance, March 31, 2016 $ 10,825 $ 21,446 $ 82,734 $ 115,005
Additions 1,358 915 2,929 5,202
Disposals (1,525) (131) (929) (2,585)
Foreign exchange (659) (277) (1,221) (2,157)
Balance, March 31, 2017 $ 9,999 $ 21,953 $ 83,513 $ 115,465
Acquisition of a subsidiary 6,523 3,933 — 10,456
Additions 2,656 1,390 2,265 6,311
Disposals (501) (1,567) (239) (2,307)
Foreign exchange 1,252 556 994 2,802
Balance, March 31, 2018 $ 19,929 $ 26,265 $ 86,533 $ 132,727
Notes to Consolidated Financial Statements 87
2018 ANNUAL REPORT / CANACCORD GENUITY GROUP INC.

Computerequipment
Furniture andequipment
Leaseholdimprovements Total
Accumulated amortization and impairment
Balance, March 31, 2016 $ 3,603 $ 16,555 $ 57,798 $ 77,956
Amortization 2,474 1,537 5,314 9,325
Disposals (1,130) (130) (918) (2,178)
Foreign exchange (471) (198) (448) (1,117)
Balance, March 31, 2017 $ 4,476 $ 17,764 $ 61,746 $ 83,986
Acquisition of a subsidiary 5,083 2,608 — 7,691
Amortization 3,347 934 5,964 10,245
Disposals (501) (1,474) (238) (2,213)
Foreign exchange 945 405 701 2,051
Balance, March 31, 2018 $ 13,350 $ 20,237 $ 68,173 $ 101,760
The carrying value of any temporarily idle property, plant and equipment is not considered material as at March 31, 2018 andMarch 31, 2017.
NOTE 12 Business Combinations
On July 5, 2017, the Company announced that it has agreed to acquire 100% of the outstanding shares of Hargreave Hale Limited(‘‘Hargreave Hale’’), a leading independent UK-based investment and wealth management business. This transaction closed onSeptember 18, 2017. This acquisition is part of the Company’s strategy of growing its global wealth management business andincreasing its wealth management contribution to overall consolidated results. Total purchase consideration was $131.4 million(£79.6 million), of which $76.1 million (£46.1 million) was paid on closing. There is deferred consideration of $9.9 million(£6.0 million) which has been withheld by the Company for a maximum period of six years from completion pending the outcomeof a regulatory matter. In addition, there is contingent consideration of up to $45.4 million (£27.5 million) which will be payableover a period of up to three years, subject to achievement of certain performance targets related to the retention and growth ofclient assets and revenues and an amount determined with reference to the fund management business.
Further payments of up to $4.1 million (£2.5 million) will be paid to certain continuing Hargreave Hale employees subject toachievement of certain performance targets related to the retention and growth of client assets and revenues. This amount hasbeen recognized as an expense during the year ended March 31, 2018 in connection with the acquisition.
The purchase price, determined by the fair value of the consideration given at the date of the acquisition and the fair value of thenet assets acquired on the date of the acquisition, was as follows:
Consideration paid
Cash $ 76,103
Deferred consideration 9,902
Contingent consideration 45,386
$ 131,391
Net assets acquired
Cash $ 22,052
Accounts receivable 21,710
Other tangible assets 1,408
Liabilities (16,793)
Identifiable intangible assets 61,560
Deferred tax liability related to identifiable intangible assets (10,800)
Goodwill 52,254
131,391
Identifiable intangible assets of $61.6 million were recognized and include customer relationships and a fund managementcontract. The goodwill of $52.3 million represents the value of expected synergies arising from the acquisition. Goodwill is notdeductible for tax purposes.
Management has estimated the fair value of the contingent consideration related to this acquisition to be up to $45.4 million(£27.5 million) as of the acquisition date and will be payable over a period of three years. The contingent consideration must besettled in cash and meets the definition of a financial liability, and subsequent changes to the fair value of the contingentconsideration will be recognized in the statement of operations. The determination of the fair value is based upon discounted cashflows, and the key assumption affecting the fair value is the probability that the performance targets will be met.
88 Notes to Consolidated Financial Statements
CANACCORD GENUITY GROUP INC. / 2018 ANNUAL REPORT

The above amounts are estimates, which were made by management at the time of the preparation of these consolidatedfinancial statements based on available information. Amendments may be made to these amounts as well as the allocation ofidentifiable intangible assets between indefinite life and finite lives. Values based on estimates are subject to changes during theperiod ending 12 months after the acquisition date.
The aggregate acquisition-related expenses incurred by the Company in connection with the acquisition of Hargreave Hale are$6.7 million. These expenses are mainly comprised of professional and consulting fees. In addition, the Company also incurredrestructuring expenses of $2.9 million related to an onerous lease provision related to the acquisition.
Contributions to revenue and net loss by Hargreave Hale, including restructuring and acquisition-related costs, were $52.9 millionand $4.8 million respectively since the acquisition date.
Had Hargreave Hale been consolidated from April 1, 2017, as part of the consolidated statement of operations, the consolidatedrevenue and net income would have been approximately $1.1 billion and $21.4 million, respectively, for the year ended March 31,2018. These figures represent historical results and are not necessarily indicative of future performance.
NOTE 13 Goodwill and Other Intangible Assets
Identifiable intangible assets
GoodwillBrand
namesCustomer
relationships Technology
Softwareunder
developmentNon-
competitionTrading
licensesFund
management Total
Gross amount
Balance, March 31, 2016 $ 526,364 $ 44,930 $ 97,426 $ 30,512 $ 4,506 $ 14,153 $ 196 $ — $ 191,723
Additions — — — 440 — — — — 440
Transfer between
categories — — — 1,382 (1,382) — — — —
Foreign exchange (11,466) — (6,303) (3,132) (79) — — — (9,514)
Balance, March 31, 2017 514,898 44,930 91,123 29,202 3,045 14,153 196 — 182,649
Additions 52,254 — 24,921 795 — — — 36,639 62,355
Transfer between
categories — — — 3,045 (3,045) — — — —
Foreign exchange 13,454 — 7,130 2,359 — — — 3,599 13,088
Balance, March 31, 2018 580,606 44,930 123,174 35,401 — 14,153 196 40,238 258,092
Accumulated amortization
and impairment
Balance, March 31, 2016 (322,632) — (44,266) (10,554) (2,350) (14,153) (196) — (71,519)
Amortization — — (8,617) (3,182) — — — (11,799)
Foreign exchange — — 2,351 1,117 — — — — 3,468
Balance, March 31, 2017 (322,632) — (50,532) (12,619) (2,350) (14,153) (196) — (79,850)
Transfer between
categories — — — (2,350) 2,350 — — — —
Amortization — — (8,700) (3,339) — — — (1,723) (13,762)
Foreign exchange — — (2,546) (1,065) — — — (112) (3,723)
Balance, March 31, 2018 (322,632) — (61,778) (19,373) — (14,153) (196) (1,835) (97,335)
Net book value
March 31, 2017 192,266 44,930 40,591 16,583 695 — — — 102,799
March 31, 2018 257,974 44,930 61,396 16,028 — — — 38,403 160,757
Notes to Consolidated Financial Statements 89
2018 ANNUAL REPORT / CANACCORD GENUITY GROUP INC.

IMPAIRMENT TESTING OF GOODWILL AND OTHER ASSETS
The carrying amounts of goodwill and indefinite life intangible assets acquired through business combinations are as follows:
Intangible assets with indefinite lives Goodwill Total
March 31, 2018 March 31, 2017 March 31, 2018 March 31, 2017 March 31, 2018 March 31, 2017
Canaccord Genuity CGUs
Canada $ 44,930 $ 44,930 $ 92,074 $ 92,074 $ 137,004 $ 137,004
Canaccord Genuity Wealth
Management CGUs
UK and Europe (Channel Islands) — — 97,754 90,257 97,754 90,257
UK and Europe (Eden Financial Ltd
(‘‘Eden’’) — — 10,761 9,935 10,761 9,935
UK and Europe (Hargreave Hale) — — 57,385 — 57,385 —
$ 44,930 $ 44,930 $ 257,974 $ 192,266 $ 302,904 $ 237,196
The Genuity brand name is considered to have an indefinite life as the Company has no plans to cease its use in the future.
Goodwill and intangible assets with indefinite lives are tested for impairment annually at March 31, and when circumstancesindicate the carrying value may potentially be impaired. If any indication of impairment exists, the Company estimates therecoverable amount of the CGU to which goodwill and indefinite life intangible assets are allocated. Where the carrying amount ofa CGU exceeds its recoverable amount, an impairment loss is recognized. Any impairment loss first reduces the carrying amountof any goodwill allocated to the CGUs and then if any impairment loss remains, the other assets of the unit are reduced on apro rata basis. Impairment losses relating to goodwill cannot be reversed in future periods. The Company considers therelationship between its market capitalization and the book value of its equity, among other factors, when reviewing for indicatorsof impairment. Consequently, interim goodwill and other assets impairment testing was carried out for all applicable CGUs atJune 30, September 30 and December 31, 2017.
In accordance with IAS 36, ‘‘Impairment of Assets’’ (IAS 36), the recoverable amounts of the CGUs’ net assets have beendetermined using fair value less costs to sell (FVLCS) calculations, which are based on future cash flow assumptions which areconsidered to be appropriate for the purposes of such calculations. In accordance with IFRS 13 fair value represents an estimateof the price at which an orderly transaction to sell an asset or transfer a liability would take place between market participants asat the end of the reporting period under market conditions as at that date (an exit price as at the measurement date). There is amaterial degree of uncertainty with respect to the estimates of the recoverable amounts of the CGUs’ net assets given that theseestimates involve making key assumptions about the future. In making such assumptions, management has used its bestestimate of future economic and market conditions within the context of the Company’s capital markets and wealth managementactivities. These valuations are categorized as Level 3 in the fair value hierarchy.
The FVLCS calculations are based on assumptions, as described above, made in connection with future cash flows, relief ofroyalties with respect to the brand name indefinite life intangible asset, terminal growth rates and discount rates. In order toestimate the FVLCS for each CGU, cash flows are forecast over a five-year period, a terminal growth rate is applied and then suchcash flows are discounted to their present value. The discount rate is based on the specific circumstances of each CGU and isderived from the estimated weighted average cost of capital of the Company. The CGUs which recorded goodwill in their carryingvalue as of March 31, 2018 were Canaccord Genuity, Canada and Canaccord Genuity Wealth Management UK & Europe (ChannelIslands), UK (Eden) and UK (Hargreave Hale). The discount rate utilized for each of these CGUs for the purposes of thesecalculations was 12.5% [March 31, 2017 − 12.5%]. Cash flow estimates for each of these CGUs were based on managementassumptions as described above and utilize five-year compound annual revenue growth rates was 5.0% [March 31, 2017 − 5.0%]as well as estimates in respect of operating margins. The terminal growth rate used for each of Canaccord Genuity, Canada andCanaccord Genuity Wealth Management UK & Europe (Channel Islands), UK (Eden) and UK (Hargreave Hale) was 2.5%[March 31, 2017 − 2.5%].
Sensitivity testing was conducted as part of the annual impairment test of goodwill and indefinite life intangible assets for theCanaccord Genuity − Canada CGU. The sensitivity testing includes assessing the impact that reasonably possible declines inrevenue estimates for the 12-month period ending on March 31, 2019 and declines in growth rates after that period andincreases in the discount rates would have on the recoverable amounts of the CGUs, with other assumptions being held constant.An increase in the discount rate of 7.1 percentage points, a decrease in the estimated revenue for the year ending March 31,2019 of $40.1 million or a decrease in the five-year compound annual growth rate of 15.8 percentage points would result in theestimate of the recoverable amount declining below the carrying value with the result that an impairment charge would berequired. Any such impairment charge would be determined after incorporating the effect of any changes in key assumptionsincluding any consequential effects of such changes on estimated operating income and on other factors.
90 Notes to Consolidated Financial Statements
CANACCORD GENUITY GROUP INC. / 2018 ANNUAL REPORT

NOTE 14 Income Taxes
The major components of income tax expense are:
March 31,2018
March 31,2017
Consolidated statements of operationsCurrent income tax expense
Current income tax expense $ 23,630 $ 16,286Adjustments in respect of prior years (3,010) 36
20,620 16,322
Deferred income tax recoveryOrigination and reversal of temporary differences (1,807) (5,667)Impact of change in tax rates (144) 43
(1,951) (5,624)Income tax expense reported in the statements of operations $ 18,669 $ 10,698
The Company’s income tax expense differs from the amount that would be computed by applying the combined federal andprovincial income tax rates as a result of the following:
March 31,2018
March 31,2017
Net income before income taxes $ 35,746 $ 53,884Income tax expense at the statutory rate of 26.25% (2017: 26.0%) 9,381 13,999Difference in tax rates in foreign jurisdictions (1,631) (4,096)Non-deductible items affecting the determination of taxable income 2,555 3,051Change in accounting and tax base estimate 3,248 (1,143)Change in deferred tax asset − reversal period of temporary difference and other 6,759 (2,292)Tax losses and other temporary differences not recognized (5,409) 1,208Share based payments 3,766 (29)Income tax expense reported in the statements of operations $ 18,669 $ 10,698
The following were the deferred tax assets and liabilities recognized by the Company and movements thereon during the year:
Consolidated statementsof financial position
Consolidated statementsof operations
March 31,2018
March 31,2017
March 31,2018
March 31,2017
Unrealized gain on securities owned $ (10,053) $ (114) $ 9,939 $ (992)Legal provisions 774 1,195 421 (839)Unpaid remunerations 6,359 4,971 (1,388) (2,713)Unamortized capital cost of equipment and leasehold improvements
over their net book value 2,984 2,974 (10) (287)Unamortized common share purchase loans 2,434 1,792 (641) (541)Loss carryforwards 5,224 6,491 1,267 2,145Long-term incentive plan 25,365 14,398 (10,967) (541)Other intangible assets (28,066) (17,523) (1,318) (2,296)Other 1,205 999 746 440
$ 6,226 $ 15,183 $ (1,951) $ (5,624)
Notes to Consolidated Financial Statements 91
2018 ANNUAL REPORT / CANACCORD GENUITY GROUP INC.

Deferred tax assets and liabilities as reflected in the consolidated statements of financial position are as follows:
March 31,2018
March 31,2017
Deferred tax assets $ 19,941 $ 15,323
Deferred tax liabilities (13,715) (140)
$ 6,226 $ 15,183
The movement for the year in the net deferred tax position was as follows:
2018 2017
Opening balance as of April 1 $ 15,183 $ 10,771
Tax recovery recognized in the consolidated statements of operations 1,951 5,624
Foreign exchange on deferred tax position 1,111 (810)
Deferred tax liability on convertible debentures — (990)
Deferred taxes acquired in business combination (11,308) —
Other (711) 588
Ending balance as of March 31 $ 6,226 $ 15,183
Deferred tax assets and deferred tax liabilities are offset if a legally enforceable right exists to set off current tax assets againstcurrent tax liabilities and if the deferred tax assets and the deferred tax liabilities relate to income taxes levied by the sametaxation authority on the same taxable entity.
At the balance sheet date, the Company has tax loss carryforwards of approximately $35.5 million [2017 − $37.9 million] forwhich a deferred tax asset has not been recognized. These losses relate to subsidiaries outside of Canada that have a history oflosses and may also be subject to legislative limitations on use and may not be used to offset taxable income elsewhere in theconsolidated group of companies. The subsidiaries have no taxable temporary differences or any tax planning opportunitiesavailable that could partly support the recognition of these losses as deferred tax assets, as the likelihood of future economicbenefit is not sufficiently assured. These losses begin expiring in 2029.
Other temporary differences not recognized as deferred tax assets in relation to subsidiaries outside of Canada amount to$38.8 million at March 31, 2018 [2017 − $33.7 million]. Since the subsidiaries outside of Canada have a history of losses andthe deductible temporary differences may not be used to offset taxable income elsewhere in the consolidated group of companies,no asset has been recognized as the likelihood of future economic benefit is not sufficiently assured.
NOTE 15 Subordinated Debt
March 31,2018
March 31,2017
Loan payable, interest payable monthly at prime + 4% per annum, due on demand $ 7,500 7,500
The loan payable is subject to a subordination agreement and may only be repaid with the prior approval of IIROC. As at March 31,2018 and 2017, the interest rates for the subordinated debt were 7.45% and 6.7%, respectively. The carrying value ofsubordinated debt approximates its fair value due to the short-term nature of this liability.
NOTE 16 Bank Loan
March 31,2018
March 31,2017
Loan $ 72,500 $ —
Less: Unamortized financing fees (1,063) —
71,437 —
Current portion 9,679 —
Long term portion 61,758 —
92 Notes to Consolidated Financial Statements
CANACCORD GENUITY GROUP INC. / 2018 ANNUAL REPORT

In connection with the acquisition of Hargreave Hale [Note 12], a subsidiary of the Company entered into a senior credit facility inthe amount of £40.0 million (C$72.5 million as of March 31, 2018) to finance a portion of the cash consideration. The balanceoutstanding as of March 31, 2018 net of unamortized financing fees was $71.4 million. The loan is repayable in instalments ofprincipal and interest over a period of 4 years. The interest rate on this loan is LIBOR plus 3.375% per annum.
NOTE 17 Convertible Debentures
On October 27, 2016, the Company closed a private placement of convertible unsecured senior subordinated debentures (the‘‘Debentures’’) in the aggregate principal amount of $60.0 million. The net amount recognized after deducting issue costs net ofdeferred tax liability was $58.9 million. The Debentures were placed with funds managed by a large Canadian asset manager.
The Debentures bear interest at a rate of 6.50% per annum, payable semi-annually on the last day of June and December eachyear commencing December 31, 2016. The Debentures are convertible at the holder’s option into common shares of the Companyat a conversion price of $6.50 per share. The Debentures will mature on December 31, 2021 and may be redeemed by theCompany, in certain circumstances, on or after December 31, 2019.
The Debentures are classified as compound financial instruments. On initial recognition, the fair value of the liability wascalculated based on the present value of future cash flows under the instruments, discounted at 8%, being equal to the rate ofinterest applied by the market at the time of issue to instruments of comparable credit status and future cash flows, without theconversion feature. The residual amount is recorded as a component of shareholders’ equity.
March 31, 2018 March 31, 2017Liability Equity Liability Equity
Convertible debentures $ 57,081 $ 2,604 $ 56,442 $ 2,604
NOTE 18 Preferred Shares
March 31, 2018 March 31, 2017
AmountNumber of
shares AmountNumber of
shares
Series A Preferred Shares issued and outstanding $ 110,818 4,540,000 $ 110,818 4,540,000
Series C Preferred Shares issued and outstanding 97,450 4,000,000 97,450 4,000,000
Series C Preferred Shares held in treasury (2,627) (106,794) (2,627) (106,794)
94,823 3,893,206 94,823 3,893,206
$ 205,641 8,433,206 $ 205,641 8,433,206
[i] SERIES A PREFERRED SHARES
The Company issued 4,540,000 Cumulative 5-Year Rate Reset First Preferred Shares, Series A (Series A Preferred Shares) at apurchase price of $25.00 per share for gross proceeds of $113.5 million. The aggregate net amount recognized after deductingissue costs, net of deferred taxes of $1.0 million, was $110.8 million.
Quarterly cumulative cash dividends, as declared, were paid at an annual rate of 5.5% for the initial five-year period ended onSeptember 30, 2016. Commencing October 1, 2016 and ending on and including September 30, 2021, quarterly cumulativedividends, if declared, will be paid at an annual rate of 3.885%. Thereafter, the dividend rate will be reset every five years at a rateequal to the five-year Government of Canada bond yield plus 3.21%.
Holders of Series A Preferred Shares had the option to convert any or all of their shares into an equal number of CumulativeFloating Rate First Preferred Shares, Series B (Series B Preferred Shares), subject to certain conditions, on September 30, 2016and have the option on September 30 every five years thereafter. The number of shares tendered for conversion by the conversiondeadline of September 15, 2016 was below the minimum required to proceed with the conversion and, accordingly, no Series BPreferred Shares were issued. Series B Preferred Shares would entitle any holders thereof to receive floating rate, cumulative,preferential dividends payable quarterly, if declared, at a rate equal to the three-month Government of Canada Treasury Bill yieldplus 3.21%.
The Company had the option to redeem the Series A Preferred Shares on September 30, 2016, and has the option to redeem onSeptember 30 every five years thereafter, in whole or in part, at $25.00 per share together with all declared and unpaid dividends.
[ii] SERIES C PREFERRED SHARES
The Company issued 4,000,000 Cumulative 5-Year Rate Reset First Preferred Shares, Series C (Series C Preferred Shares) at apurchase price of $25.00 per share for gross proceeds of $100.0 million. The aggregate net amount recognized after deductingissue costs, net of deferred taxes of $1.0 million, was $97.5 million.
Notes to Consolidated Financial Statements 93
2018 ANNUAL REPORT / CANACCORD GENUITY GROUP INC.

Quarterly cumulative cash dividends, as declared, were paid at an annual rate of 5.75% for the initial five-year period ending onJune 30, 2017. Commencing July 1, 2017 and ending on and including June 30, 2022, quarterly cumulative dividends, if declared,will be paid at an annual rate of 4.993%. Thereafter, the dividend rate will be reset every five years at a rate equal to the five-yearGovernment of Canada bond yield plus 4.03%.
Holders of Series C Preferred Shares had the option to convert any or all of their shares into an equal number of CumulativeFloating Rate First Preferred Shares, Series D (Series D Preferred Shares), subject to certain conditions, on June 30, 2017 andhave the option on June 30 every five years thereafter. The number of shares tendered for conversion by the conversion deadlineof June 30, 2017 was below the minimum required to proceed with the conversion and, accordingly, no Series D Preferred Shareswere issued. Series D Preferred Shares would entitle any holders thereof to receive floating rate, cumulative, preferential dividendspayable quarterly, if declared, at a rate equal to the three-month Government of Canada Treasury Bill yield plus 4.03%.
The Company had the option to redeem the Series C Preferred Shares on June 30, 2017, and has the option to redeem onJune 30 every five years thereafter, in whole or in part, at $25.00 per share together with all declared and unpaid dividends.
NOTE 19 Common Shares and Warrants
March 31, 2018 March 31, 2017
AmountNumber of
shares AmountNumber of
shares
Issued and fully paid $ 772,746 113,522,629 $ 772,645 113,511,468
Unvested share purchase loans (5,098) (654,322) (9,366) (1,590,146)
Held for the LTIP (117,802) (19,814,432) (121,830) (19,141,505)
$ 649,846 93,053,875 $ 641,449 92,779,817
Warrants March 31, 2018 March 31, 2017
AmountNumber of
warrants AmountNumber of
warrants
Warrants issued in connection with Private Placement $ 1,975 3,438,412 $ 1,975 3,438,412
[i] AUTHORIZED
Unlimited common shares without par value.
[ii] ISSUED AND FULLY PAID
Number of shares Amount
Balance, March 31, 2016 103,812,814 $ 729,502
Shares issued in connection with share-based payment plans [Note 21] 2,433,285 14,840
Shares issued in connection with replacement plans [Note 21] 76,088 685
Shares issued for other stock-based award 507,051 2,373
Shares issued in connection with private placement 6,876,824 26,601
Shares cancelled (194,594) (1,356)
Balance, March 31, 2017 113,511,468 772,645
Shares issued in connection with replacement plans [Note 21] 11,161 101
Balance, March 31, 2018 113,522,629 $ 772,746
On August 11, 2017, the Company filed a notice to renew the normal course issuer bid (NCIB) to provide the Company with thechoice to purchase up to a maximum of 5,675,573 of its common shares during the period from August 15, 2017 to August 14,2018 through the facilities of the TSX and on alternative trading systems in accordance with the requirements of the TSX. Thepurpose of the purchase of common shares under the NCIB is to enable the Company to acquire shares for cancellation. Themaximum number of shares that may be purchased under the current NCIB represents 5.0% of the Company’s outstandingcommon shares at the time of the notice. There were no shares purchased through this and the previous NCIB between April 1,2017 and March 31, 2018.
During the year ended March 31, 2017, the Company completed the closings of a non-brokered private placement (PrivatePlacement) to employees of the Company. In aggregate, the Company issued 6,876,824 units at a price of $4.17 per unit foraggregate proceeds to the Company of $28.6 million. Each unit consists of one common share (‘‘Common Share’’) of theCompany and one-half of one Common Share purchase warrant (‘‘Warrant’’). Each whole Warrant will entitle the holder to acquireone Common Share at an exercise price of $4.99 for the period from June 17, 2019 to December 17, 2019. Warrants are notlisted and are not transferable.
94 Notes to Consolidated Financial Statements
CANACCORD GENUITY GROUP INC. / 2018 ANNUAL REPORT

The Warrants are classified as equity instruments. The fair value of the Warrants, calculated using an option pricing model, wasdetermined to be $1.975 million. Option pricing models require the input of highly subjective assumptions including the expectedprice volatility. Volatility is based on the historical trend of the share prices of the Company. Changes in the subjectiveassumptions can materially affect the fair value estimate, and therefore the existing models do not necessarily provide a reliablesingle measure of the fair value of the Warrants.
[iii] FORGIVABLE COMMON SHARE PURCHASE LOANS
The Company provides forgivable common share purchase loans to certain employees (other than directors or executive officers)in order to purchase common shares of the Company. The Company has provided such loans to executive officers in the past buthas now adopted a policy not to make any further such loans to directors or executive officers. The unvested balance of forgivablecommon share purchase loans is presented as a deduction from share capital. The forgivable common share purchase loans areamortized over the vesting period. The difference between the unvested and unamortized values is included in contributedsurplus.
[iv] EARNINGS PER COMMON SHARE
For the years endedMarch 31,
2018March 31,
2017
Earnings per common share
Net income attributable to CGGI shareholders $ 13,024 $ 38,103
Preferred shares dividends (9,593) (11,076)
Net income attributable to common shareholders 3,431 27,027
Weighted average number of common shares (number) 92,587,216 91,656,708
Basic earnings per share $ 0.04 $ 0.29
Diluted earnings per common share
Net income attributable to common shareholders 3,431 27,027
Weighted average number of common shares (number) 92,587,216 91,656,708
Dilutive effect in connection with LTIP (number) 17,089,575 8,248,790
Dilutive effect in connection with other share-based payment plans (number) 978,809 1,243,574
Dilutive effect in connection with warrants (number) 206,487 —
Adjusted weighted average number of common shares (number) 110,862,087 101,149,072
Diluted earnings per common share $ 0.03 $ 0.27
The convertible debentures were excluded from the diluted earnings per share calculation for the year ended March 31, 2018 and2017 as they were anti-dilutive
There have been no other transactions involving common shares or potential common shares between the reporting period andthe date of authorization of these financial statements which would have a significant impact on earnings per common share.
NOTE 20 Dividends
COMMON SHARE DIVIDENDS
The Company declared the following common share dividend during the year ended March 31, 2018:
Record date Payment dateCash dividend per
common shareTotal common
dividend amount
March 2, 2018 March 15, 2018 $ 0.01 $ 1,135
December 1, 2017 December 15, 2017 $ 0.01 $ 1,135
September 1, 2017 September 15, 2017 $ 0.01 $ 1,135
June 16, 2017 July 3, 2017 $ 0.10 $ 11,351
On June 6, 2018, the Board of Directors approved a dividend of $0.12 per common share, payable on July 3, 2018, with a recorddate of June 22, 2018. This dividend is comprised of a $0.01 base quarterly dividend and an $0.11 variable supplementaldividend [Note 28].
Notes to Consolidated Financial Statements 95
2018 ANNUAL REPORT / CANACCORD GENUITY GROUP INC.

PREFERRED SHARE DIVIDENDS
Record date Payment date
Cash dividend perSeries A
Preferred Share
Cash dividend perSeries C
Preferred ShareTotal preferred
dividend amount
March 16, 2018 April 2, 2018 $ 0.24281 $ 0.31206 $ 2,351
December 22, 2017 January 2, 2018 $ 0.24281 $ 0.31206 $ 2,351
September 15, 2017 October 2, 2017 $ 0.24281 $ 0.31206 $ 2,351
June 16, 2017 June 30, 2017 $ 0.24281 $ 0.359375 $ 2,540
On June 6, 2018, the Board approved a cash dividend of $0.24281 per Series A Preferred Share payable on July 3, 2018 toSeries A Preferred shareholders of record as at June 22, 2018 [Note 28].
On June 6, 2018, the Board approved a cash dividend of $0.31206 per Series C Preferred Share payable on July 3, 2018 toSeries C Preferred shareholders of record as at June 22, 2018 [Note 28].
NOTE 21 Share-Based Payment Plans
[i] LONG-TERM INCENTIVE PLAN
Under the long-term incentive plan (LTIP) or the ‘‘Plan’’, eligible participants are awarded restricted share units (RSUs), whichgenerally vest over three years. All awards under the LTIP plan are settled by transfer of shares from employee benefit trusts(“Trusts”) which are funded by the Company, or certain of its subsidiaries, as the case may be, with cash which is used by thetrustees to purchase common shares on the open market that will be held in the Trusts until the RSUs vest. No further sharesmay be issued from treasury under the LTIP.
Effective as of March 31, 2018 the Plan was changed to remove certain employment-related conditions for the vesting of RSUawards made as part of the normal course incentive compensation payment cycle. With the change, RSUs will continue to vestafter termination of employment so long as the employee does not violate certain post-termination restrictions and is not engagedin certain competitive or soliciting activities as provided in the Plan. Because of this change, the Company determined that theawards do not meet the criteria for an in-substance service condition, as defined by IFRS 2 ‘‘Share based payments’’. Accordingly,RSUs granted as part of the normal course incentive compensation payment cycle are expensed in the period in which thoseawards are deemed to be earned with a corresponding increase in contributed surplus, which is generally the fiscal period in whichthe awards are either made or the immediately preceding fiscal year for those awards made after the end of such fiscal year butwere determined and earned in respect of that fiscal year. With this change to the Plan, the Company recorded an expense of$48.4 million during the year ended March 31, 2018 in respect of the unamortized portion of outstanding awards as of March 31,2018 which would have otherwise been expensed in periods after March 31, 2018 if the Plan had not been changed.
For certain awards, typically new hire awards or retention awards, vesting is subject to continued employment and therefore theseawards are subject to a continuing service requirement. Accordingly, the Company recognizes the cost of such awards as anexpense on a graded basis over the applicable vesting period with a corresponding increase in contributed surplus.
There were 7,292,403 RSUs [year ended March 31, 2017 − 11,895,720 RSUs] granted in lieu of cash compensation toemployees during the year ended March 31, 2018. The Trusts purchased 5,681,240 common shares [year ended March 31,2017 − 9,838,528 common shares] during the year ended March 31, 2018.
96 Notes to Consolidated Financial Statements
CANACCORD GENUITY GROUP INC. / 2018 ANNUAL REPORT

The fair value of the RSUs at the measurement date is based on the fair value on grant date. The weighted average fair value ofRSUs granted during the year ended March 31, 2018 was $5.00 [March 31, 2017 − $4.75].
Number
Awards outstanding, March 31, 2016 11,962,855
Grants 11,895,720
Vested (4,598,904)
Forfeited (1,079,926)
Awards outstanding, March 31, 2017 18,179,745
Grants 7,292,403
Vested (4,906,479)
Forfeited (435,281)
Awards outstanding, March 31, 2018 20,130,388
Number
Common shares held by the Trusts, March 31, 2016 12,171,624
Acquired 9,838,528
Released on vesting (2,868,647)
Common shares held by the Trusts, March 31, 2017 19,141,505
Acquired 5,681,240
Released on vesting (5,008,313)
Common shares held by the Trusts, March 31, 2018 19,814,432
[ii] FORGIVABLE COMMON SHARE PURCHASE LOANS
The Company provides loans to certain employees (other than directors or executive officers) for the purpose of partially fundingthe purchase of shares of the Company and increasing share ownership by the employees. The Company has provided such loansto executive officers in the past but has now adopted a policy not to make any further such loans to directors or executive officers.These loans are equity-settled transactions that are generally forgiven over a three- to five-year period from the initial advance ofthe loan or at the end of that three- to five-year period [Note 19 [iii]].
[iii] REPLACEMENT PLANS
As a result of the acquisition of CSHP, the following share-based payment plans were introduced to replace the share-basedpayment plans that existed at CSHP at the acquisition date:
Canaccord Genuity Group Inc. Collins Stewart Hawkpoint Replacement Annual Bonus Equity Deferral (ABED) Plan
On March 21, 2012, the Company introduced the Replacement ABED Plan, which replaced the ABED plans that existed at CSHPas of the acquisition date. Eligible employees who participated in the CSHP ABED plans were granted options to purchasecommon shares of the Company under the Replacement ABED Plan. The exercise price of these options was $nil. The options,which are now vested, vested between one and three years from the acquisition date of CSHP. In accordance with IFRS 3,‘‘Business Combinations’’ (IFRS 3), a portion of the awards granted was included as part of the purchase consideration for theacquisition of CSHP and a portion was deferred and amortized to incentive compensation expense over the vesting period. Theawards were fully amortized as of March 31, 2015.
Number
Balance, March 31, 2016 25,637
Exercised (7,155)
Balance, March 31, 2017 18,482
Exercised —
Balance, March 31, 2018 18,482
Notes to Consolidated Financial Statements 97
2018 ANNUAL REPORT / CANACCORD GENUITY GROUP INC.

The following table summarizes the share options outstanding under the Replacement ABED Plan as at March 31, 2018:
Options outstanding Options exercisable
Range of exercise priceNumber of
common shares
Weighted averageremaining
contractual life
Weightedaverage exercise
price
Number ofoptions
exercisable
Weightedaverage exercise
price
$nil 18,482 2.0 Nil 18,482 $ nil
Canaccord Genuity Group Inc. Collins Stewart Hawkpoint Replacement Long-Term Incentive Plan Award
On March 21, 2012, the Company introduced the Replacement LTIP, which replaced the existing LTIPs at CSHP on the acquisitiondate. Eligible employees who participated in the CSHP LTIPs were granted options to purchase shares of the Company awardsunder the Replacement LTIP. The exercise price of these options was $nil. The options, which are now vested, vested annually ona graded basis over a three-year period. In accordance with IFRS 3, a portion of awards granted was included as part of thepurchase consideration for the acquisition of CSHP and a portion was deferred and amortized to incentive compensation expenseover the vesting period. The awards were fully amortized as of March 31, 2015.
Number
Awards outstanding, March 31, 2016 201,552
Exercised (68,933)
Balance, March 31, 2017 132,619
Exercised (11,161)
Balance, March 31, 2018 121,458
The following table summarizes the share options outstanding under the Replacement LTIP as at March 31, 2018:
Options outstanding Options exercisable
Range of exercise priceNumber of
common shares
Weighted averageremaining
contractual life
Weightedaverage exercise
price
Number ofoptions
exercisable
Weightedaverage exercise
price
$nil 121,458 2.0 $nil 121,458 $ nil
[iv] CSH Inducement Plan
In connection with the acquisition of CSHP, the Company agreed to establish a retention plan for key CSHP staff. The awards werefully vested and fully amortized as of March 31, 2017. As of March 31, 2018, the only CSH inducement Plan award outstanding, ifexercised, would result in the issuance of 9,257 common shares. This is also the maximum number of common shares that maybe issued from treasury under the CSH Inducement Plan. These shares are subject to resolution of a dispute about the status ofa participant who was awarded this number of restricted share units.
[v] DEFERRED SHARE UNITS
Beginning April 1, 2011, the Company adopted a deferred share units (‘‘DSU’’) plan for its independent directors. Independentdirectors must elect annually as to how they wish their directors’ fees to be paid and can specify the allocation of their directors’fees between DSUs and cash. When a director leaves the Board of Directors, outstanding DSUs are paid out in cash, with theamount equal to the number of DSUs granted multiplied by the closing share price as of the end of the fiscal quarter immediatelyfollowing such terminations. Under the plan, the directors are not entitled to receive any common shares in the Company, andunder no circumstances will DSUs confer on any participant any of the rights or privileges of a holder of common shares.
During the year ended March 31, 2018, the Company granted 77,720 DSUs [2017 − 84,990 DSUs]. The carrying amount of theliability relating to DSUs at March 31, 2018 was $2.2 million [2017 − $1.1 million].
[vi] PERFORMANCE SHARE UNITS
For the year ended March 31, 2018, the Company adopted a performance share unit (‘‘PSU’’) plan for certain senior executives.The PSUs are a notional equity-based instrument linked to the value of the Company’s common shares. At the end of a 3-yearvesting period, the number of PSUs which vest is determined upon performance against certain pre-determined metrics. ThePSUs cliff vest on the 3rd anniversary of the date of the grant. The PSUs are settled in cash, based on the average share price ofthe Company’s shares at the time of vesting.
The carrying amount of the liability relating to PSUs at March 31, 2018 was $6.1 million.
98 Notes to Consolidated Financial Statements
CANACCORD GENUITY GROUP INC. / 2018 ANNUAL REPORT
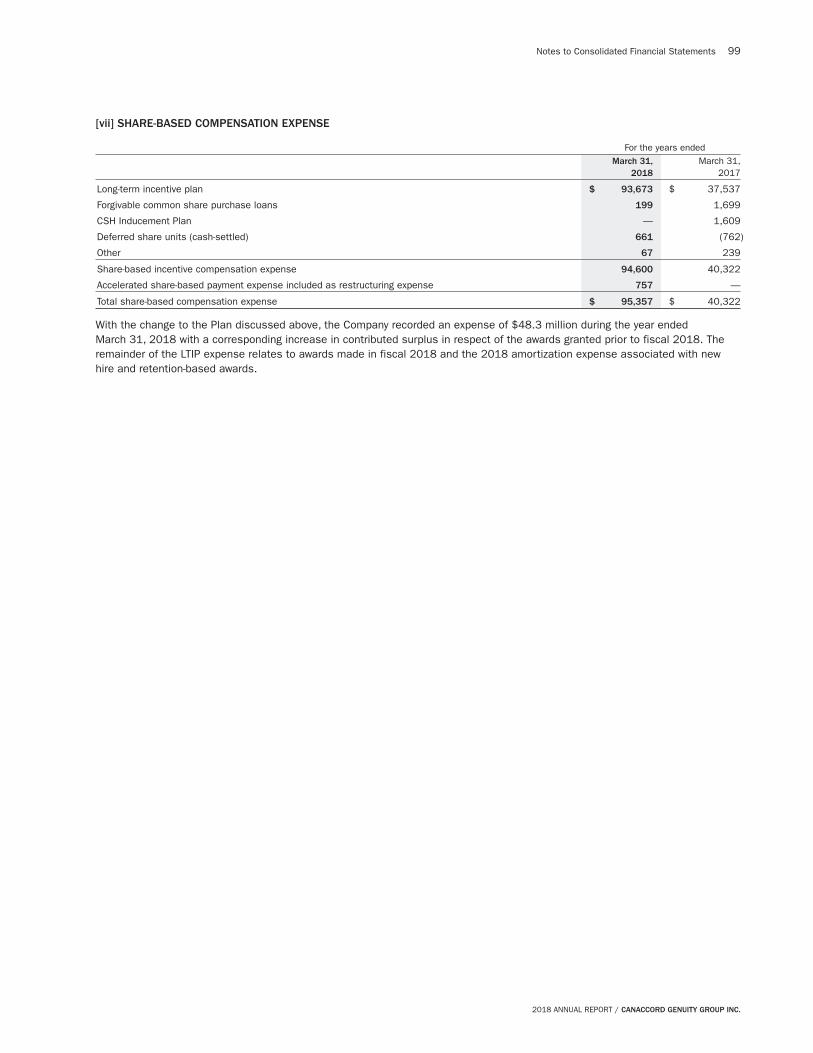
[vii] SHARE-BASED COMPENSATION EXPENSE
For the years endedMarch 31,
2018March 31,
2017
Long-term incentive plan $ 93,673 $ 37,537
Forgivable common share purchase loans 199 1,699
CSH Inducement Plan — 1,609
Deferred share units (cash-settled) 661 (762)
Other 67 239
Share-based incentive compensation expense 94,600 40,322
Accelerated share-based payment expense included as restructuring expense 757 —
Total share-based compensation expense $ 95,357 $ 40,322
With the change to the Plan discussed above, the Company recorded an expense of $48.3 million during the year endedMarch 31, 2018 with a corresponding increase in contributed surplus in respect of the awards granted prior to fiscal 2018. Theremainder of the LTIP expense relates to awards made in fiscal 2018 and the 2018 amortization expense associated with newhire and retention-based awards.
Notes to Consolidated Financial Statements 99
2018 ANNUAL REPORT / CANACCORD GENUITY GROUP INC.

NOTE 22 Related Party Transactions
[i] CONSOLIDATED SUBSIDIARIES
The consolidated financial statements include the financial statements of the Company and the Company’s operating subsidiariesand intermediate holding companies listed in the following table:
% equity interestCountry of
incorporationMarch 31,
2018March 31,
2017
Canaccord Genuity Corp. Canada 100% 100%
CG Investments Inc. Canada 100% n/a
Canaccord Genuity SAS France 100% 100%
Canaccord Genuity Wealth (International) Limited Guernsey 100% 100%
Canaccord Genuity Financial Planning Limited United Kingdom 100% 100%
Canaccord Genuity Wealth Limited United Kingdom 100% 100%
Canaccord Genuity Wealth Group Limited United Kingdom 100% 100%
Canaccord Genuity Wealth (International) Holdings Limited Guernsey 100% 100%
Hargreave Hale Limited United Kingdom 100% n/a
Canaccord Genuity Limited United Kingdom 100% 100%
Canaccord Genuity Wealth Group Holdings Ltd. Canada 100% 100%
Canaccord Genuity LLC United States 100% 100%
Canaccord Genuity Wealth Management (USA) Inc. United States 100% 100%
Canaccord Genuity Wealth & Estate Planning Services Ltd. Canada 100% 100%
Canaccord Asset Management Inc. Canada 100% 100%
Canaccord Adams Financial Group Inc. United States 100% 100%
Collins Stewart Inc. United States 100% 100%
Canaccord Adams BC ULC Canada 100% 100%
Canaccord Adams (Delaware) Inc. United States 100% 100%
Canaccord Genuity Securities LLC United States 100% 100%
Stockwave Equities Ltd. Canada 100% 100%
CLD Financial Opportunities Limited Canada 100% 100%
Canaccord Genuity (Hong Kong) Limited China (Hong Kong SAR) 100% 100%
Canaccord Financial Group (Australia) Pty Ltd* Australia 50% 50%
Canaccord Genuity (Australia) Limited* Australia 50% 50%
(Canaccord Genuity Asia
(Beijing) Limited) China 100% 100%
The Balloch Group Limited British Virgin Islands 100% 100%
Canaccord Genuity Asia (Hong Kong) Limited China (Hong Kong SAR) 100% 100%
Canaccord Genuity (Dubai) Ltd. United Arab Emirates 100% 100%
* The Company owns 50% of the issued shares of Canaccord Financial Group (Australia) Pty Ltd and Canaccord Genuity (Australia) Limited, but for accounting purposes, as of March 31, 2018 theCompany is considered to have a 58% interest because of the shares held in a trust controlled by Canaccord Financial Group (Australia) Pty Ltd [March 31, 2017 − 58%] [Note 8]
[ii] COMPENSATION OF KEY MANAGEMENT PERSONNEL OF THE COMPANY
Disclosed in the table below are the amounts recognized as expenses related to individuals who are key management personnelas at March 31, 2018 and 2017:
March 31,2018
March 31,2017
Short term employee benefits $ 10,515 $ 7,053
Post termination benefits — 1,989
Share-based payments 4,933 3,979
Total compensation paid to key management personnel $ 15,448 $ 13,021
100 Notes to Consolidated Financial Statements
CANACCORD GENUITY GROUP INC. / 2018 ANNUAL REPORT

[iii] OTHER TRANSACTIONS WITH KEY MANAGEMENT PERSONNEL
Accounts payable and accrued liabilities include the following balances with key management personnel:
March 31,2018
March 31,2017
Accounts receivable $ 969 $ 211
Accounts payable and accrued liabilities 1,527 219
[iv] TERMS AND CONDITIONS OF TRANSACTIONS WITH RELATED PARTIES
Security trades executed by the Company for officers and directors are transacted in accordance with the terms and conditionsapplicable to all clients. Commission income on such transactions in the aggregate is not material in relation to the overalloperations of the Company.
NOTE 23 Segmented Information
The Company operates in two industry segments as follows:
Canaccord Genuity − includes investment banking, advisory, research and trading activities on behalf of corporate, institutionaland government clients as well as principal trading activities in Canada, the UK, Europe and Dubai, Australia and the US.Operations located in Other Foreign Locations under Canaccord Genuity Asia are also included in Canaccord Genuity.
Canaccord Genuity Wealth Management − provides brokerage services and investment advice to retail or institutional clients inCanada, the US, and the UK and Europe.
Corporate and Other includes correspondent brokerage services, interest and foreign exchange revenue and expenses notspecifically allocable to Canaccord Genuity or Canaccord Genuity Wealth Management.
The Company’s industry segments are managed separately because each business offers different services and requires differentpersonnel and marketing strategies. The Company evaluates the performance of each business based on operating results,without regard to non-controlling interests.
The Company does not allocate total assets, liabilities or equipment and leasehold improvements to the segments. Amortizationof tangible assets is allocated to the segments based on the square footage occupied. Amortization of identifiable intangibleassets is allocated to the Canaccord Genuity segment, as it relates to the acquisitions of Genuity and the 50% interest inCanaccord Genuity Australia. Amortization of the identifiable intangible assets acquired through the purchase of Collins StewartHawkpoint plc (CSHP) is allocated to Canaccord Genuity and Canaccord Genuity Wealth Management segments in the UK andEurope (Channel Islands). Amortization of identifiable intangible assets acquired through the acquisition of Eden Financial Ltd. isallocated to Canaccord Genuity Wealth Management segments in the UK and Europe (Eden Financial Ltd.). Amortization ofidentifiable intangible assets acquired through the acquisition of Hargreave Hale is allocated to Canaccord Genuity WealthManagement segments in the UK and Europe (Hargreave Hale). There are no significant intersegment revenues. Income taxes aremanaged on a Company basis and are not allocated to operating segments. All revenue and operating profit is derived fromexternal customers. The Company also does not allocate cash flows by reportable segments.
Notes to Consolidated Financial Statements 101
2018 ANNUAL REPORT / CANACCORD GENUITY GROUP INC.

For the years ended
March 31, 2018 March 31, 2017
CanaccordGenuity
CanaccordGenuityWealth
ManagementCorporateand Other Total
CanaccordGenuity
CanaccordGenuityWealth
ManagementCorporateand Other Total
Revenues, excluding interest
revenue $ 627,821 $ 358,193 $ 8,988 $ 995,002 $ 593,447 $ 258,230 $ 11,022 $ 862,699
Interest revenue 9,735 12,072 6,068 27,875 4,944 8,881 3,022 16,847
Expenses, excluding
undernoted 583,577 288,400 50,373 922,350 512,933 210,226 56,426 779,585
Amortization 9,464 13,152 1,391 24,007 10,651 9,102 1,371 21,124
Development costs 690 6,773 201 7,664 2,616 6,585 3,008 12,209
Interest expense 9,471 2,741 6,225 18,437 9,713 135 2,896 12,744
Restructuring costs 4,704 2,939 — 7,643 — — — —
Acquisition-related costs — 6,732 — 6,732 — — — —
Share of loss of an
associate — — 298 298 — — — —
Income (loss) before income
taxes and intersegment
allocations 29,650 49,528 (43,432) 35,746 62,478 41,063 (49,657) 53,884
Less: Intersegment
allocations 16,524 15,529 (32,053) — 18,210 16,796 (35,006) —
Income (loss) before
income taxes $ 13,126 $ 33,999 $ (11,379) $ 35,746 $ 44,268 $ 24,267 $ (14,651) $ 53,884
For geographic reporting purposes, the Company’s business operations are grouped into Canada, the UK and Europe (includingDubai), the United States, Australia, and Other Foreign Locations which is comprised of our Asian operations. The following tablepresents the revenue of the Company by geographic location (revenue is attributed to geographic areas on the basis of thelocation of the underlying corporate operating results):
For the years endedMarch 31,
2018March 31,
2017
Canada $ 397,053 $ 298,816
UK & Europe (including Dubai) 329,841 281,631
United States 238,933 237,142
Australia 57,022 59,693
Other Foreign Locations 28 2,264
$ 1,022,877 $ 879,546
The following table presents selected figures pertaining to the financial position of each geographic location:
CanadaUK, Europeand Dubai
UnitedStates
Other ForeignLocations Australia Total
As at March 31, 2018
Equipment and leasehold improvements $ 9,483 $ 13,156 $ 6,960 $ 66 $ 1,302 $ 30,967
Goodwill 92,074 165,900 — — — 257,974
Intangible assets 53,201 107,464 92 — — 160,757
Non-current assets 154,758 286,520 7,052 66 1,302 449,698
As at March 31, 2017
Equipment and leasehold improvements 11,080 9,884 8,757 31 1,727 31,479
Goodwill 92,074 100,192 — — — 192,266
Intangible assets 55,630 47,074 95 — — 102,799
Non-current assets $ 158,784 $ 157,150 $ 8,852 $ 31 $ 1,727 $ 326,544
102 Notes to Consolidated Financial Statements
CANACCORD GENUITY GROUP INC. / 2018 ANNUAL REPORT
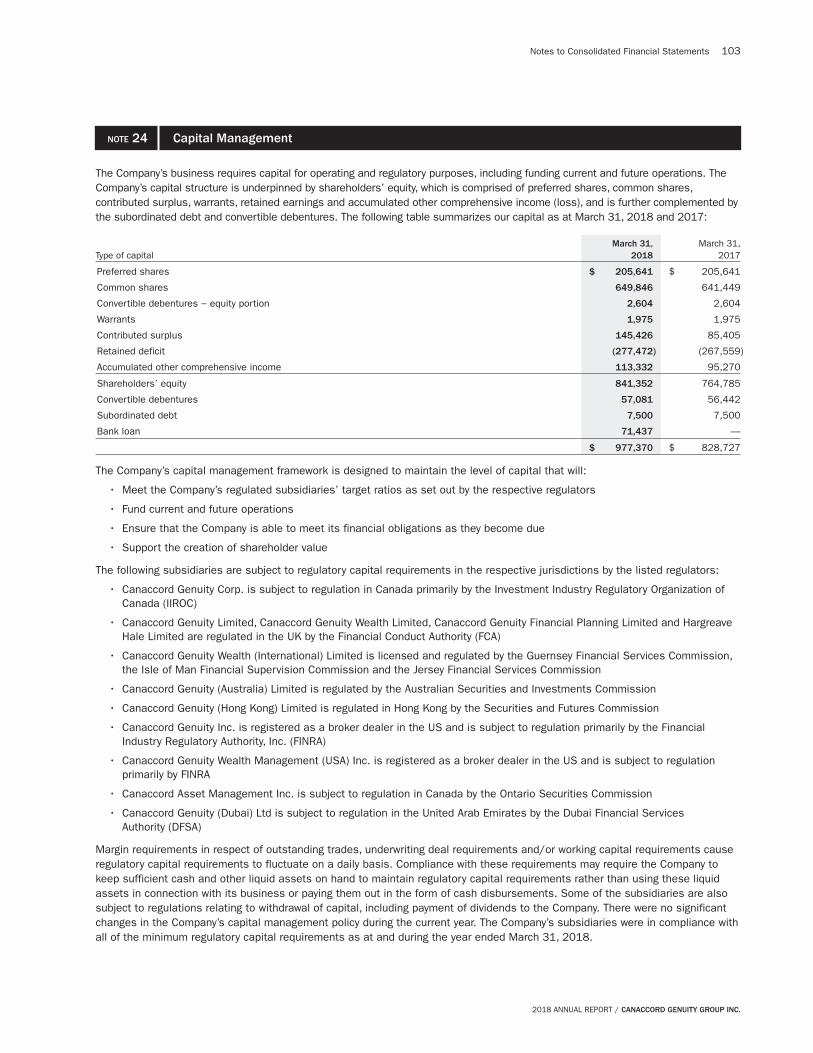
NOTE 24 Capital Management
The Company’s business requires capital for operating and regulatory purposes, including funding current and future operations. TheCompany’s capital structure is underpinned by shareholders’ equity, which is comprised of preferred shares, common shares,contributed surplus, warrants, retained earnings and accumulated other comprehensive income (loss), and is further complemented bythe subordinated debt and convertible debentures. The following table summarizes our capital as at March 31, 2018 and 2017:
Type of capitalMarch 31,
2018March 31,
2017
Preferred shares $ 205,641 $ 205,641
Common shares 649,846 641,449
Convertible debentures − equity portion 2,604 2,604
Warrants 1,975 1,975
Contributed surplus 145,426 85,405
Retained deficit (277,472) (267,559)
Accumulated other comprehensive income 113,332 95,270
Shareholders’ equity 841,352 764,785
Convertible debentures 57,081 56,442
Subordinated debt 7,500 7,500
Bank loan 71,437 —
$ 977,370 $ 828,727
The Company’s capital management framework is designed to maintain the level of capital that will:
• Meet the Company’s regulated subsidiaries’ target ratios as set out by the respective regulators
• Fund current and future operations
• Ensure that the Company is able to meet its financial obligations as they become due
• Support the creation of shareholder value
The following subsidiaries are subject to regulatory capital requirements in the respective jurisdictions by the listed regulators:
• Canaccord Genuity Corp. is subject to regulation in Canada primarily by the Investment Industry Regulatory Organization ofCanada (IIROC)
• Canaccord Genuity Limited, Canaccord Genuity Wealth Limited, Canaccord Genuity Financial Planning Limited and HargreaveHale Limited are regulated in the UK by the Financial Conduct Authority (FCA)
• Canaccord Genuity Wealth (International) Limited is licensed and regulated by the Guernsey Financial Services Commission,the Isle of Man Financial Supervision Commission and the Jersey Financial Services Commission
• Canaccord Genuity (Australia) Limited is regulated by the Australian Securities and Investments Commission
• Canaccord Genuity (Hong Kong) Limited is regulated in Hong Kong by the Securities and Futures Commission
• Canaccord Genuity Inc. is registered as a broker dealer in the US and is subject to regulation primarily by the FinancialIndustry Regulatory Authority, Inc. (FINRA)
• Canaccord Genuity Wealth Management (USA) Inc. is registered as a broker dealer in the US and is subject to regulationprimarily by FINRA
• Canaccord Asset Management Inc. is subject to regulation in Canada by the Ontario Securities Commission
• Canaccord Genuity (Dubai) Ltd is subject to regulation in the United Arab Emirates by the Dubai Financial ServicesAuthority (DFSA)
Margin requirements in respect of outstanding trades, underwriting deal requirements and/or working capital requirements causeregulatory capital requirements to fluctuate on a daily basis. Compliance with these requirements may require the Company tokeep sufficient cash and other liquid assets on hand to maintain regulatory capital requirements rather than using these liquidassets in connection with its business or paying them out in the form of cash disbursements. Some of the subsidiaries are alsosubject to regulations relating to withdrawal of capital, including payment of dividends to the Company. There were no significantchanges in the Company’s capital management policy during the current year. The Company’s subsidiaries were in compliance withall of the minimum regulatory capital requirements as at and during the year ended March 31, 2018.
Notes to Consolidated Financial Statements 103
2018 ANNUAL REPORT / CANACCORD GENUITY GROUP INC.

NOTE 25 Client Money
At March 31, 2018, the UK and Europe operations held client money in segregated accounts of $2.978 billion (£1.643 billion)[2017 − $2.120 billion; £1.267 billion]. This is comprised of $11.1 million (£6.1 million) [2017 − $11.2 million; £6.7 million] ofbalances held on behalf of clients to settle outstanding trades and $2.967 billion (£1.637 billion) [2017 − $2.109 billion;£1.260 billion] of segregated deposits, held on behalf of clients, which are not reflected on the consolidated statements of financialposition. Movement in settlement balances is reflected in operating cash flows.
NOTE 26 Provisions and Contingencies
PROVISIONS
Provisions are recognized when the Company has a present legal or constructive obligation as a result of a past event, when it isprobable that an outflow of resources will be required to settle the obligation and when a reliable estimate of the amount can bemade. At each reporting date, the Company assesses the adequacy of its pre-existing provisions and adjusts the amounts asnecessary. The following is a summary of the changes during the years ended March 31, 2018 and 2017:
Legalprovisions
Restructuringprovisions
Totalprovisions
Balance, March 31, 2016 $ 3,600 $ 15,211 $ 18,811
Additions 5,870 — 5,870
Utilized (2,530) (10,358) (12,888)
Balance, March 31, 2017 $ 6,940 $ 4,853 $ 11,793
Additions 2,704 7,643 10,347
Utilized (5,991) (7,321) (13,312)
Recoveries (400) — (400)
Balance, March 31, 2018 $ 3,253 $ 5,175 $ 8,428
The restructuring provision recorded during the period ended March 31, 2018 related to termination benefits incurred as a resultof the closing of certain trading operations in our UK and Europe capital markets operations, staff reductions in our Canadian andUS capital markets operations, as well as an onerous lease provision related to the acquisition of Hargreave Hale.
Commitments, litigation proceedings and contingent liabilities
In the normal course of business, the Company is involved in litigation, and as of March 31, 2018, it was a defendant in variouslegal actions. The Company has established provisions for matters where payments are probable and can be reasonablyestimated. While the outcome of these actions is subject to future resolution, management’s evaluation and analysis of theseactions indicate that, individually and in the aggregate, the probable ultimate resolution of these actions will not have a materialeffect on the financial position of the Company.
The Company is also subject to asserted and unasserted claims arising in the normal course of business which, as of March 31,2018, have not resulted in the commencement of legal actions. The Company cannot determine the effect of all asserted andunasserted claims on its financial position; however, where losses arising from asserted and unasserted claims are consideredprobable and where such losses can be reasonably estimated, the Company has recorded a provision.
Certain claims have been asserted against the Company in respect of the sale of certain conventional wealth management taxadvantaged film partnership products in the UK by a predecessor which could be material if such claims are advanced, additionalclaims are made and the Company’s assumptions used to evaluate the matter as neither probable nor estimable change in futureperiods. In that event, the Company may be required to record a provision for an adverse outcome which could have a materialadverse effect on the Company’s financial position. The aggregate investment by the Company’s clients in respect of theseproducts is estimated to be $10.4 million (£5.8 million). The aggregate initial tax deferral realized by the Company’s clients inrespect of these products when they were purchased by those clients during the period from 2006 to 2009 is estimated to be$14.4 million (£8.0 million). Enforcement in accordance with announcements from the UK taxation authority, the outcome ofcertain litigation proceedings in respect of the taxation of other similar products sold by other financial advisors and certainsettlements reached with the UK taxation authority by some investors will likely result in tax liabilities to the purchasers of thoseproducts in excess of the initial tax deferral amount. The potential tax liability for the Company’s clients that is in excess of theinitial tax deferral amount is estimated to be $14.8 million (£8.3 million). The probable outcome of the enforcement actions bythe UK taxation authority in respect of this matter and the likelihood of a loss or the amount of any such loss to the Company inconnection with any claims asserted against the Company, or which may be asserted against the Company, are not determinableat the date of these audited consolidated financial statements.
104 Notes to Consolidated Financial Statements
CANACCORD GENUITY GROUP INC. / 2018 ANNUAL REPORT

An action has been commenced in Alberta by a former client and others claiming the return of losses in certain accounts, return ofadministration fees, interest and costs. The claim alleges breach of contract and negligence in the administration of the accounts.The damages claimed in this action are in excess of $14 million. Although the Company has denied the allegations and intends tovigorously defend itself, the probable outcome of this action and a reliable estimate of the amount of damages in the event of anadverse outcome are not determinable at the date of these audited consolidated financial statements.
The Company has been joined as a defendant in three actions commenced in British Columbia and Manitoba by anotherinvestment dealer against a number of its former employees who are now employed in those provinces by the Company. Theclaims seek damages for intentional interference with economic relations and inducing breach of contract, among other things, inconnection with the transfer of significant books of wealth management business from the plaintiff to the Company. The claims donot quantify the amount claimed in damages. Although the Company and the employee defendants have denied the allegationsand intend to vigorously defend themselves, the outcome of these actions cannot be predicted with certainty and an estimate ofthe amount of damages in the event of adverse outcomes are not determinable at the date of these audited annual consolidatedfinancial statements.
An action has been commenced in the Dubai International Financial Centre (DIFC) against the Company and one other claimingUS$10 million in damages against the defendants in connection with a takeover bid made by a third party in the United Statesand the use of the plaintiff’s name by that third party. Although the Company has denied the allegations and intends to vigorouslydefend itself, the outcome of this action cannot be predicted with certainty and an estimate of the amount of damages in theevent of an adverse outcome is not determinable at the date of these audited consolidated financial statements.
The Company provide financial advisory, underwriting and other services to, and trade the securities of issuers that are involvedwith new and emerging industries, including the US cannabis industry. Activities within such industries, including the US cannabisindustry, typically have not had the benefit of a history of successful operating results. In addition to the economic uncertaintiesassociated with new industries, new activities and new issuers, the laws applicable to such industries or activities, particularly theUS cannabis industry and the activities of issuers in that industry, and the effect or enforcement of such laws are undetermined,conflicting and uncertain. With respect to the US cannabis industry, cannabis continues to be a controlled substance under theUnited States Controlled Substances Act and as such, there is a risk that certain issuers, while in compliance with applicablestate law, may be prosecuted under federal law. Accordingly, the Company has adopted policies and procedures reasonablydesigned to ensure compliance with the United States Currency and Foreign Transactions Reporting Act of 1970 (the ‘‘BankSecrecy Act’’) and the guidance issued by the United States Department of the Treasury Financial Crimes Enforcement Network,FIN-2014-G001 (the ‘‘FinCEN Guidance’’) relating to providing financial services to marijuana related businesses in the UnitedStates (as that term is used in the FinCEN Guidance). While the Company takes steps to identify the risks associated withemerging industries, including the US cannabis industry, and only provides services to those issuers where it determines thatthere is no material risk to the Company or where any risk is unlikely to result in a material adverse consequence to the Company,there is a risk that the Company could be the subject of third party proceedings which may have a material adverse effect on theCompany business, revenues, operating results and financial condition as well as the Company’s reputation, even if suchproceedings were concluded successfully in favour of the Company. The Company has determined that any such proceedings areunlikely and, accordingly, has not recorded a provision in respect of such matters.
NOTE 27 Commitments
Subsidiaries of the Company are committed to approximate minimum lease payments for premises and equipment over the nextfive years and thereafter as follows:
2019 $ 32,476
2020 30,304
2021 29,123
2022 25,343
2023 19,174
Thereafter 40,745
$ 177,165
Some leases include extension options and provide for stepped rents, which mainly relate to lease of office space.
Notes to Consolidated Financial Statements 105
2018 ANNUAL REPORT / CANACCORD GENUITY GROUP INC.

Certain subsidiaries of the Company have agreed to sublease agreements and the approximate minimum lease receipts forpremises and equipment over the next five years and thereafter as follows:
2019 $ 2,155
2020 2,121
2021 2,107
2022 2,080
2023 867
Thereafter —
$ 9,330
The Company is committed to principal and interest payments under the convertible debentures as follows:
2019 $ 3,900
2020 3,900
2021 3,900
2022 63,900
$ 75,600
The Company is committed to principal and interest payments under the bank loan as follows:
2019 $ 9,679
2020 9,679
2021 14,500
2022 38,642
$ 72,500
NOTE 28 Subsequent Events
(i) ACQUISITION
On April 25, 2018, the Company announced that it entered into an agreement to acquire Jitneytrade Inc. and Finlogik Inc. directlyand through the purchase of Finlogik Capital Inc. Jitneytrade Inc. is a direct access broker and an active trader in futures andequity options in Canada. Finlogik Inc. is in the business of delivering value-added fintech solutions in the Canadian market. Theacquisition closed on June 6, 2018.
(ii) STOCK OPTIONS
At its meeting on June 6, 2018, the Board of Directors approved the grant of 6,220,000 performance share options (PSOs) tosenior management of the Company and its operating subsidiaries. The options will be granted under the terms of the Company’sPerformance Share Option (PSO) plan to be presented to the shareholders for their approval at the Company’s annual generalmeeting to be held on August 2, 2018. The grant is subject to ratification at that meeting. The options will have an exercise pricedetermined within the context of the market at the time of the grant, will have a term of five years and will time-vest rateably overfour years (with one third vesting on each of the second, third and fourth anniversaries of the date of grant). PSOs will also besubject to market (stock price) performance vesting conditions, as well as have a three times exercise price cap on payout value.
(iii) DIVIDENDS
On June 6, 2018, the Board of Directors approved a dividend of $0.12 per common share, payable on July 3, 2018, with a recorddate of June 22, 2018 [Note 20]. This dividend is comprised of a $0.01 base quarterly dividend and an $0.11 supplementaldividend.
On June 6, 2018, the Board approved a cash dividend of $0.24281 per Series A Preferred Share payable on July 3, 2018 toSeries A Preferred shareholders of record as at June 22, 2018 [Note 20].
On June 6, 2018, the Board approved a cash dividend of $0.31206 per Series C Preferred Share payable on July 3, 2018 toSeries C Preferred shareholders of record as at June 22, 2018 [Note 20].
106 Notes to Consolidated Financial Statements
CANACCORD GENUITY GROUP INC. / 2018 ANNUAL REPORT

Supplemental InformationAdvisory note: This supplemental information is not audited and should be read in conjunction with the audited financialstatements contained herein.
Financial Highlights(1)
(C$ thousands, except for AUM, AUA, common and preferredshare information, financial measures and percentages)
For the years ended and as at March 312018 2017 2016 2015 2014
Financial resultsRevenue 1,022,877 879,546 787,805 880,763 855,244Expenses 987,131 825,662 1,151,776 886,420 790,656Income taxes expense (recovery) 18,669 10,698 (5,404) 5,661 12,531Net income (loss) 17,077 43,186 (358,567) (11,318) 52,057Net income (loss) attributable to CGGI shareholders 13,024 38,103 (358,471) (13,184) 51,413Net income (loss) attributable to common shareholders 3,431 27,025 (370,463) (25,061) 39,651
Business segmentIncome (loss) before income taxes
Canaccord Genuity(2) 13,126 44,268 (349,110) 1,932 74,391Canaccord Genuity Wealth Management(3) 33,999 24.267 10,171 6,097 (7,389)Corporate and Other (11,379) (14,651) (25,032) (13,686) (2,414)
Geographic segmentIncome (loss) before income taxes
Canada(4) 36,156 8,604 (179,586) 16,487 (8,572)UK and Europe(5) 332 26,946 (104,685) (3,216) 47,431US(6) (14,411) 2,606 (24,606) (6,658) 27,320Australia 14,909 17,127 (23,889) 6,686 1,761Other Foreign Locations(7) (1,240) (1,399) (31,205) (18,956) (3,352)
Client assets information ($ millions)AUM − Canada (discretionary) 2,815 2,637 1,257 1,561 1,204AUA − Canada 15,567 13,228 9,192 10,729 10,160AUM − UK and Europe 44,877 24,526 22,791 21,763 20,156AUM − Australia 830 862 731 836 555Total 61,274 38,616 32,714 33,328 30,871
Common share informationPer common share ($)
Basic (loss) earnings 0.04 0.29 (4.09) (0.27) 0.42Diluted (loss) earnings 0.03 0.27 (4.09) (0.27) 0.39Book value per diluted common share(8) 5.71 5.08 4.99 8.71 9.05
Common share price ($)High 7.49 5.70 8.58 13.49 8.45Low 4.08 3.53 3.50 5.98 5.05Close 6.93 5.09 4.01 6.52 8.20
Common shares outstanding (thousands)Issued shares excluding unvested shares 93,054 92,780 89,084 91,795 93,115Issued and outstanding 113,523 113,511 103,812 102,608 101,471Diluted shares 124,294 124,479 109,072 104,704 107,937Average basic 92,587 91,657 90,553 91,693 94,125Average diluted 110,862 101,149 n/a n/a 101,993Market capitalization (thousands) 861,357 633,598 437,379 682,673 885,087
Preferred share information (thousands)Shares issued and outstanding 8,540 8,540 8,540 8,540 8,540Financial measures
Dividends per common share 0.15 0.10 0.10 0.25 0.20Common dividend yield (closing common share price) 2.2% 2.0% 2.5% 3.8% 2.4%Common dividend payout ratio 496.3% 42.0% (2.8)% (101.9)% 51.6%Total shareholder return(9) 39.1% 26.9% (37.0)% (17.4)% 23.2%ROE(10) 0.9% 5.0% (50.4)% (2.9)% 4.4%Price to earnings multiple(11) (346.5) 19.6 (1.0) (21.0) 21.0Price to book ratio(12) 1.2 0.9 0.8 0.7 0.9
(1) Certain non-IFRS measures are utilized by the Company as measures of financial performance. Non-IFRS measures do not have any standardized meaning prescribed by IFRS and are thereforeunlikely to be comparable to similar measures presented by other companies. Non-IFRS measures included are: return on average common equity (ROE), book value per diluted common share,common dividend yield, common dividend payout ratio, total shareholder return, price to earnings multiple (P/E), price to book ratio (P/B), assets under management (AUM) and assets underadministration (AUA).
(2) Includes the global capital markets division in Canada, the UK and Europe, the US, Australia, China, Dubai and Singapore. The Company disposed 100% of its shares in Canaccord GenuitySingapore Pte Ltd. as of June 30, 2016. Commencing in Q3/17, the operating results of Canaccord Genuity (Dubai) are included as Canaccord Genuity UK, Europe, and Dubai.
(3) Operating results of Hargreave Hale are included under Canaccord Genuity Wealth Management (UK & Europe) since the closing date of September 18, 2017.(4) The Company’s Canada geographic segment includes operations for Canaccord Genuity, Canaccord Genuity Wealth Management and Corporate and Other business segments.(5) The Company’s UK and Europe geographic segment engages in capital markets and wealth management activities. Results of former CSHP entities located in the UK and Europe since March 22,
2012 and the wealth management operations of Eden Financial Ltd. since October 1, 2012 are also included. Commencing in Q3/17, the operating results of Canaccord Genuity (Dubai) areincluded as Canaccord Genuity UK, Europe, and Dubai. The operating results of Hargreave Hale are included since the closing date of September 18, 2017.
(6) The Company’s US geographic segment includes US capital markets and wealth management operations. Results of former CSHP entities located in the US are included since March 22, 2012.(7) Commencing in Q3/17, the operating results of our Australian operations are disclosed as a separate geography. Prior to Q3/17 Australia was included as part of Other Foreign Locations. Also,
commencing in Q3/17, our Dubai operation, which was previously included in Other Foreign Locations, is now included as part of Canaccord Genuity UK & Europe. The Other Foreign Locationsgeographic segment is now comprised of our Asian based operations, including China and Hong Kong and prior to their sale of closure also included Singapore and Barbados.
(8) Book value per diluted common share, a non-IFRS measure, is calculated as total common shareholders’ equity adjusted for assumed proceeds from exercise of options and warrants andconversion of convertible debentures divided by the number of diluted common shares outstanding including estimated amounts in respect of share issuance commitments including options,warrants, and convertible debentures, as applicable, and adjusted for shares purchased under the normal course issuer bid and not yet cancelled, and estimated forfeitures in respect of unvestedshare awards under share-based payment plans.
(9) Total shareholder return is calculated as the change in share price plus dividends paid to common shares and special distributions paid in the current period as a percentage of the prior period’sclosing common share price, assuming reinvestment of all dividends.
(10) ROE is calculated by dividing the annual net income attributable to common shareholders over the average common shareholders’ equity.(11) The price to earnings multiple is calculated based on the end of period share price and 12-month trailing diluted EPS.(12) The price to book ratio is calculated based on the end of period common share price and book value per diluted common share.
107
2018 ANNUAL REPORT / CANACCORD GENUITY GROUP INC.

Condensed Consolidated Statements of Operations and Retained Earnings(1)(2)(3)
(C$ thousands, exceptper share amounts and percentages)
For the years ended March 312018 2017 2016 2015 2014
RevenueCommissions and fees 461,937 396,741 376,817 374,058 361,647Investment banking 282,195 196,129 132,029 236,551 219,718Advisory fees 122,372 130,749 160,180 153,302 140,834Principal trading 113,921 119,040 85,559 75,217 91,313Interest 27,875 16,847 16,830 22,212 24,549Other 14,577 20,040 16,390 19,423 17,183
1,022,877 879,546 787,805 880,763 855,244Expenses
Non share based incentive compensation(4) 480,369 414,676 382,851 414,680 375,807Share based incentive compensation 46,245 40,322 35,025 40,800 37,482Salaries and benefits 99,239 85,698 92,981 85,770 91,135Trading costs 68,209 65,211 56,998 52,795 47,872Premises and equipment 39,605 42,286 40,863 40,281 38,461Communication and technology 56,346 52,381 55,975 51,758 46,065Interest 18,437 12,744 10,222 13,424 16,359General and administrative 83,982 79,011 87,004 94,688 83,834Amortization 24,007 21,124 25,339 28,428 26,786Development costs 7,664 12,209 26,129 24,448 21,369Restructuring costs(5) 7,643 — 17,352 24,813 5,486Acceleration of long-term incentive plan expense(6) 48,355 — — — —Impairment of goodwill — — 321,037 14,535 —Share of loss from associate(7) 298 — — — —Acquisition-related costs 6,732 — — — —
987,131 825,662 1,151,776 886,420 790,656Income (loss) before income taxes 35,746 53,884 (363,971) (5,657) 64,588Income taxes expense (recovery) 18,669 10,698 (5,404) 5,661 12,531Net income (loss) for the year 17,077 43,186 (358,567) (11,318) 52,057Non-controlling interests 4,053 5,083 (96) 1,866 644Net income (loss) attributable to CGGI shareholders 13,024 38,103 (358,471) (13,184) 51,413Retained earnings, beginning of year (267,559) (294,586) 92,815 144,799 126,203Common shares dividends (13,344) — (16,938) (26,806) (21,055)Preferred shares dividends (9,593) (11,076) (11,992) (11,994) (11,762)Retained earnings, end of year (277,742) (267,559) (294,586) 92,815 144,799Incentive compensation expenses as a % of revenue 51.5% 51.7% 53.0% 51.7% 48.3%Total compensation expenses as a % of revenue(8) 61.2% 61.5% 64.8% 61.5% 59.0%Non-compensation expenses as a % of revenue 30.6% 32.4% 81.4% 39.2% 33.5%Total expenses as a % of revenue 96.5% 93.9% 146.2% 100.6% 92.4%Pre-tax profit margin 3.5% 6.1% (46.2)% (0.6)% 7.6%Effective tax rate 52.2% 19.9% 1.5% (100.1)% 19.4%Net profit margin 1.7% 4.9% (45.5)% (1.3)% 6.1%Basic earnings (loss) per share 0.04 0.29 (4.09) (0.27) 0.42Diluted earnings (loss) per share 0.03 0.27 (4.09) (0.27) 0.39Book value per diluted common share(9) 5.71 5.08 4.99 8.71 9.05Supplemental segmented revenue informationCanaccord Genuity 637,556 598,391 532,270 613,105 615,790Canaccord Genuity Wealth Management 370,265 267,111 246,567 250,890 224,036Corporate and Other 15,056 14,044 8,968 16,768 15,418
1,022,877 879,546 787,805 880,763 855,244(1) Certain non-IFRS measures are utilized by the Company as measures of financial performance. Non-IFRS measures do not have any standardized meaning prescribed by IFRS and are therefore
unlikely to be comparable to similar measures presented by other companies. Non-IFRS measures included are: incentive compensation expenses as a % of revenue, total compensation expensesas a % of revenue, non-compensation expenses as a % of revenue, total expenses as a % of revenue, and book value per diluted common share.
(2) The operating results of the Australian operations have been fully consolidated, and a 42% non-controlling interest has been recognized for the year ended March 31, 2018 [year ended March 31,2017 — 42% and March 31, 2016 — 40%.].
(3) Data includes the results of Hargreave Hale since the closing date of September 18, 2017.(4) Incentive compensation expenses include the National Insurance Tax applicable to the UK.(5) Restructuring costs for the year ended March 31, 2018 related to termination benefits incurred as a result of the closing of certain trading operations in our UK & Europe capital markets
operations, staff reductions in our Canadian and US capital markets operations, as well as real estate costs related to the acquisition of Hargreave Hale. Restructuring costs for the year endedMarch 31, 2016 were related to staff reductions in our US capital markets operations and the closure of our Barbados office in Other Foreign Locations, as well as charges related to changes inour Corporate and Other segment.
(6) Effective as of March 31, 2018 the Plan was changed to remove certain employment-related conditions for the vesting of RSU awards made as part of the normal course incentive compensationpayment cycle. As a result of this change, the costs of RSUs granted as part of the normal course incentive compensation payment cycle will now be expensed in the period in which those awardsare deemed to be earned, instead of recognizing the costs over the vesting period. This change led to the acceleration of the remaining expense for certain awards made under the LTIP which hadnot been fully amortized as of March 31, 2018. The total charge recorded during the year ended March 31, 2018 in respect of awards granted prior to fiscal 2018 was $48.4 million.
(7) Represents the Company’s equity portion of the net loss of its investment in Canaccord Genuity Acquisition Corp. for the year ended March 31, 2018.(8) Total compensation expenses include incentive compensation and salaries and benefits, but exclude hiring incentives, which are included in development costs.(9) Book value per diluted common share, a non-IFRS measure, is calculated as total common shareholders’ equity adjusted for assumed proceeds from exercise of options and warrants and
conversion of convertible debentures divided by the number of diluted common shares outstanding including estimated amounts in respect of share issuance commitments including options,warrants, and convertible debentures, as applicable, and adjusted for shares purchased under the normal course issuer bid and not yet cancelled, and estimated forfeitures in respect of unvestedshare awards under share-based payment plans.
108 Supplemental Information
CANACCORD GENUITY GROUP INC. / 2018 ANNUAL REPORT

Condensed Consolidated Statements of Financial Position
As at March 31 (C$ thousands) 2018 2017 2016 2015 2014Assets
Cash and cash equivalents 862,838 677,769 428,329 322,324 364,296Securities owned, at market 469,217 784,230 564,746 848,128 1,143,201Accounts receivable 2,215,837 3,395,736 2,041,150 2,491,488 2,785,898Income taxes recoverable 1,170 1,085 12,537 5,295 3,983Deferred tax assets 19,941 15,323 11,221 10,148 9,735Investments 2,035 2,829 5,578 8,693 9,977Equipment and leasehold improvements 30,967 31,479 37,049 43,373 50,975Goodwill and other intangibles 418,731 295,065 323,936 640,456 646,557
4,020,736 5,203,516 3,424,546 4,369,905 5,014,622Liabilities and shareholders’ equity
Bank indebtedness — 25,280 14,910 20,264 —Short term credit facility — — — — —Securities sold short 301,006 645,742 427,435 654,639 913,913Accounts payable, accrued liabilities and other 2,647,382 3,681,676 2,203,858 2,541,956 2,888,267Income taxes payable 7,851 10,093 4,242 8,172 10,822Current portion of bank loan 9,679 — — — —Deferred consideration 9,997 — — — —Contingent consideration 49,844 — — — —Bank loan 61,758 — — — —Deferred tax liabilities 13,715 140 450 2,057 3,028Subordinated debt 7,500 7,500 15,000 15,000 15,000Convertible debentures 57,081 56,442Non-controlling interests 13,571 11,858 8,722 10,275 14,912Shareholders’ equity 841,352 764,785 749,929 1,117,542 1,168,680
4,020,736 5,203,516 3,424,546 4,369,905 5,014,622
Miscellaneous Operational Statistics(1)
As at March 31 2018 2017 2016 2015 2014Number of employees in Canada
Number in Canaccord Genuity 189 178 180 201 215Number in Canaccord Genuity Wealth Management 379 359 354 400 420Number in Corporate and Other 288 279 288 324 316Total Canada 856 816 822 925 951
Number of employees in the UK and EuropeNumber in Canaccord Genuity 214 225 282 329 372Number in Canaccord Genuity Wealth Management 559 313 312 303 294
Number of employees in the USNumber in Canaccord Genuity 256 275 291 269 286
Number of employees in AustraliaNumber in Canaccord Genuity 57 58 55 56 51Number in Canaccord Genuity Wealth Management 11 11 10 13 12
Number of employees in Other Foreign LocationsNumber in Canaccord Genuity 3 2 23 33 38
Number of employees company-wide 1,956 1,700 1,795 1,928 2,004Number of Advisory Teams in Canada(2) 142 141 139 152 160Number of licensed professionals in Canada 374 367 392 437 436Number of investment professionals and fund managers in the
UK and Europe(3) 188 118 118 114 118Number of Advisors − Australia 7 8 7 9 9AUM − Canada (discretionary) (C$ millions) 2,815 2,637 1,257 1,561 1,204AUA − Canada (C$ millions) 15,567 13,228 9,192 10,729 10,160AUM − UK and Europe (C$ millions) 44,877 24,526 22,791 21,763 20,156AUM − Australia (C$ millions) 830 862 731 836 555Total (C$ millions) 61,274 38,616 32,714 33,328 30,871Number of companies with Canaccord Genuity
Limited as brokerLondon Stock Exchange (LSE) 48 51 67 53 52Alternative Investment Market (AIM) 33 32 32 40 43Total broker 81 83 99 93 95
Number of companies with Canaccord GenuityLimited as Nomad(4)
LSE — — — 1 —AIM 33 32 32 30 33Total Nomad 33 32 32 31 33
(1) These miscellaneous operational statistics are non-IFRS measures.(2) Advisory Teams in Canada are normally comprised of one or more Investment Advisors (IAs) and their assistants and associates, who together manage a shared set of client accounts. Advisory
Teams that are led by, or only include, an IA who has been licensed for less than three years are not included in our Advisory Team count, as it typically takes a new IA approximately three years tobuild an average-sized book.
(3) Investment professionals include all staff with direct sales responsibilities, which includes brokers and assistants with direct client contacts. Fund managers include all staff who manage clientassets.
(4) A company listed on AIM is required to retain a Nominated Adviser (commonly referred to as a Nomad) during the company’s life on the market. Among other duties, Nomads are responsible forwarranting that a company is appropriate for joining AIM. A Nomad is similar to a Financial Advisor on the LSE, but is specific to AIM.
Supplemental Information 109
2018 ANNUAL REPORT / CANACCORD GENUITY GROUP INC.

Quarterly Financial Highlights(1)
(C$ thousands, except for AUM, AUA,common and preferred share information,financial measures and percentages)
Fiscal 2018 Fiscal 2017Q4 Q3 Q2 Q1 Q4 Q3 Q2 Q1
Financial resultsRevenue 322,080 309,442 191,547 199,808 271,656 208,108 193,602 206,180Expenses 324,379 262,559 198,613 201,580 234,251 202,397 192,845 196,169Income taxes expense (recovery) 7,404 10,285 192 788 6,418 1,167 557 2,556Net income (loss) (9,703) 36,598 (7,258) (2,560) 30,987 4,544 200 7,455Net income (loss) attributable to CGGI
shareholders (11,661) 34,432 (7,485) (2,262) 28,886 3,755 (1,220) 6,682Net income (loss) attributable to common
shareholders (14,012) 32,081 (9,836) (4,802) 26,346 1,215 (4,219) 3,683Business segmentIncome (loss) before income taxes
Canaccord Genuity(2) (6,977) 34,266 (6,773) (7,390) 36,027 4,938 (4,049) 7,352Canaccord Genuity Wealth Management(3) 8,642 16,322 919 8,116 5,723 6,346 6,894 5,304Corporate and Other (3,964) (3,705) (1,212) (2,498) (4,345) (5,573) (2,088) (2,645)
Geographic segmentIncome (loss) before income taxes
Canada(4) 12,282 24,740 (4,139) 3,273 6,443 (4,262) (3,672) 10,095UK and Europe(5) (10,073) 8,959 2,387 (941) 21,370 7,481 553 (2,458)US(6) (11,032) 5,111 (6,257) (2,233) 2,954 678 (293) (733)Australia 6,786 8,379 1,059 (1,315) 7,078 2,615 4,876 2,558Other Foreign Locations(7) (262) (306) (116) (556) (440) (801) (707) 549
Client assets ($ millions)AUM − Canada (discretionary) 2,815 2,838 2,688 2,647 2,637 2,527 1,219 1,268AUA − Canada 15,567 14,451 12,801 12,669 13,228 11,969 10,334 9,817AUM − UK and Europe 44,877 43,791 40,797 25,755 24,526 23,383 23,208 22,410AUM − Australia 830 928 866 860 862 769 845 742Total 61,274 59,170 54,464 39,284 38,616 36,121 34,387 32,969
Common share informationPer common share ($)
Basic earnings (loss) (0.15) 0.35 (0.11) (0.05) 0.29 0.01 (0.05) 0.04Diluted earnings (loss) (0.15) 0.29 (0.11) (0.05) 0.26 0.01 (0.05) 0.04Book value per diluted common share(8) 5.71 5.11 4.74 4.91 5.08 4.85 4.70 4.75
Common share price ($)High 7.49 5.91 6.68 5.42 5.70 4.81 5.11 5.11Low 5.50 4.08 4.26 4.17 4.11 3.53 3.98 3.63Close 6.93 5.80 4.29 5.33 5.09 4.77 4.71 4.92
Common shares outstanding (thousands)Issued shares excluding unvested shares 93,054 92,281 91,602 92,904 92,780 91,780 91,163 96,657Issued and outstanding 113,523 113,511 113,511 113,511 113,511 112,777 112,057 111,601Diluted shares 124,294 124,209 124,141 124,281 124,479 124,346 115,222 115,167Average basic 92,730 92,030 92,529 93,069 91,985 91,229 92,249 89,786Average diluted 112,187 113,613 104,741 n/a 102,296 98,647 n/a 92,849Market capitalization (thousands) 861,357 720,412 532,565 662,418 633,598 593,130 542,696 566,622
Preferred shares outstanding (thousands)Shares issued and outstanding 8,540 8,540 8,540 8,540 8,540 8,540 8,540 8,540
Financial measuresDividends per common share 0.12 0.01 0.01 0.01 0.10 — — —Common dividend yield (closing share price) 1.7% 0.7% 0.9% 0.8% 2.0% — — —Common dividend payout ratio (97.2)% 3.5% (11.5)% (23.6)% 43.1% — — —Total shareholder return(9) 21.6% 35.4% (19.3)% 4.9% 6.7% 1.3% (4.3)% 22.7%Annualized ROE(10) (9.5)% 23.7% (7.4)% (3.5)% 19.6% 0.9% (3.2)% 2.8%Price to earnings multiple (11) (346.5) 14.9 39.0 31.4 19.6 (16.4) (1.1) (1.2)Price to book ratio(12) 1.2 1.1 0.9 1.1 0.9 1.0 1.0 1.0
(1) Certain non-IFRS measures are utilized by the Company as measures of financial performance. Non-IFRS measures do not have any standardized meaning prescribed by IFRS and are thereforeunlikely to be comparable to similar measures presented by other companies. Non-IFRS measures included are: return on average common equity (ROE), book value per diluted common share,common dividend yield, common dividend payout ratio, total shareholder return, price to earnings multiple (P/E), price to book ratio (P/B), assets under management (AUM) and assets underadministration (AUA).
(2) Includes the global capital markets division in Canada, the UK and Europe, the US, Australia, China, Barbados and Singapore. The Company disposed 100% of its shares in Canaccord GenuitySingapore Pte Ltd. as of June 30, 2016. Commencing in Q3/17, the operating results of Canaccord Genuity (Dubai) are included as Canaccord Genuity UK, Europe, and Dubai.
(3) Operating results of Hargreave Hale are included under Canaccord Genuity Wealth Management (UK & Europe) since the closing date of September 18, 2017(4) The Company’s Canada geographic segment includes operations for Canaccord Genuity, Canaccord Genuity Wealth Management and Corporate and Other business segments.(5) The Company’s UK and Europe geographic segment engages in capital markets and wealth management activities. Results of former CSHP entities located in the UK and Europe since March 22,
2012 and the wealth management operations of Eden Financial Ltd. since October 1, 2012 are also included. Commencing in Q3/17, the operating results of Canaccord Genuity (Dubai) areincluded as Canaccord Genuity UK, Europe, and Dubai.
(6) The Company’s US geographic segment includes US capital markets and wealth management operations. Results of former CSHP entities located in the US are included since March 22, 2012.(7) Commencing in Q3/17, the operating results of our Australian operations are disclosed as a separate geography. Prior to Q3/17 Australia was included as part of Other Foreign Locations. Also,
commencing in Q3/17, our Dubai operation, which was previously included in Other Foreign Locations, is now included as part of Canaccord Genuity UK & Europe. The Other Foreign Locationsgeographic segment is now comprised of our Asian based operations, including China and Hong Kong and prior to their sale of closure also included Singapore and Barbados.
(8) Book value per diluted common share, a non-IFRS measure, is calculated as total common shareholders’ equity adjusted for assumed proceeds from exercise of options and warrants andconversion of convertible debentures divided by the number of diluted common shares outstanding including estimated amounts in respect of share issuance commitments including options,warrants, and convertible debentures, as applicable, and adjusted for shares purchased under the normal course issuer bid and not yet cancelled, and estimated forfeitures in respect of unvestedshare awards under share-based payment plans.
(9) Total shareholder return is calculated as the change in share price plus dividends paid to common shares and special distributions paid in the current period as a percentage of the prior period’sclosing common share price, assuming reinvestment of all dividends.
(10) ROE is presented on an annualized basis. Quarterly annualized ROE is calculated by dividing the annualized net income attributable to common shareholders for the three-month period over theaverage common shareholders’ equity.
(11) The price to earnings multiple is calculated based on the end of period share price and 12-month trailing diluted EPS.(12) The price to book ratio is calculated based on the end of period common share price and book value per diluted common share.
110 Supplemental Information
CANACCORD GENUITY GROUP INC. / 2018 ANNUAL REPORT

Condensed Consolidated Statements of Operations(1)(2)(3)
(C$ thousands, except per share amountsand percentages)
Fiscal 2018 Fiscal 2017Q4 Q3 Q2 Q1 Q4 Q3 Q2 Q1
RevenueCommissions and fees 135,148 125,709 96,125 104,955 105,890 102,637 95,342 92,872Investment banking 95,514 112,639 33,356 40,696 71,595 46,508 40,901 37,125Advisory fees 40,930 31,947 30,589 18,896 52,474 17,127 21,554 39,594Principal trading 36,047 29,138 22,849 25,887 31,066 33,569 26,859 27,546Interest 10,045 6,861 5,793 5,176 5,217 4,017 4,005 3,608Other 4,396 3,148 2,835 4,198 5,414 4,250 4,941 5,435
322,080 309,442 191,547 199,808 271,656 208,108 193,602 206,180Expenses
Non share based incentive compensation(4) 149,255 146,324 90,725 94,065 124,839 96,737 94,206 98,894Share based incentive compensation 11,154 12,307 10,545 12,239 11,563 10,204 9,874 8,681Salaries and benefits 28,631 26,537 21,664 22,407 22,092 21,064 20,633 21,909Trading costs 20,428 16,521 14,008 17,252 18,563 16,660 15,852 14,136Premises and equipment 10,138 10,511 8,847 10,109 10,301 12,723 9,514 9,748Communication and technology 14,967 14,558 14,163 12,658 13,279 12,359 14,409 12,334Interest 6,090 4,171 3,731 4,445 3,884 2,834 2,584 3,442General and administrative 24,106 23,108 17,468 19,300 19,250 21,478 18,735 19,548Amortization 6,949 6,916 5,148 4,994 5,105 5,454 5,180 5,385Development costs 3,187 1,512 1,486 1,479 5,375 2,884 1,858 2,092Restructuring costs(5) 939 — 6,256 448 — — — —Acquisition-related costs 184 — 4,364 2,184 — — — —Acceleration of long-term Incentive plan(6) 48,355 — — — — — — —Share of loss from associate(7) (4) 94 208 — — — — —Impairment of goodwill — — — — — — — —
324,379 262,559 198,613 201,580 234,251 202,397 192,845 196,169(Loss) income before income taxes (2,299) 46,883 (7,066) (1,772) 37,405 5,711 757 10,011Income tax (recovery) expense 7,404 10,285 192 788 6,418 1,167 557 2,556Net (loss) income for the period (9,703) 36,598 (7,258) (2,560) 30,987 4,544 200 7,455Non-controlling interests 1,958 2,166 227 (298) 2,101 789 1,420 773Net (loss) income attributable to CGGI
shareholders (11,661) 34,432 (7,485) (2,262) 28,886 3,755 (1,220) 6,682Incentive compensation expenses as a % of
revenue 49.8% 51.3% 52.9% 53.2% 50.2% 51.4% 53.8% 52.2%Total compensation expenses as a % of
revenue(8) 58.7% 59.8% 64.2% 64.4% 58.3% 61.5% 64.4% 62.8%Non-compensation expenses as a % of revenue 27.0% 25.0% 39.5% 36.5% 27.9% 35.7% 35.2% 32.3%Total expenses as a % of revenue 100.7% 84.8% 103.7% 100.9% 86.2% 97.3% 99.6% 95.1%Pre-tax profit margin (0.7)% 15.2% (3.7)% (0.9)% 13.8% 2.7% 0.4% 4.9%Effective tax rate (322.1)% 21.9% (2.7)% (44.5)% 17.2% 20.4% 73.6% 25.5%Net profit margin (3.0)% 11.8% (3.8)% (1.3)% 11.4% 2.2% 0.1% 3.6%Basic (loss) earnings per share (0.15) 0.35 (0.11) (0.05) 0.29 0.01 (0.05) 0.04Diluted (loss) earnings per share (0.15) 0.29 (0.11) (0.05) 0.26 0.01 (0.05) 0.04Book value per diluted common share(9) 5.71 5.11 4.74 4.91 5.08 4.85 4.70 4.75Canaccord Genuity 200,687 196,203 118,880 121,786 193,520 137,268 127,005 140,598Canaccord Genuity Wealth Management 116,378 109,373 69,563 74,951 73,333 67,368 63,690 62,720Corporate and Other 5,015 3,866 3,104 3,071 4,803 3,472 2,907 2,862
322,080 309,442 191,547 199,808 271,656 208,108 193,602 206,180(1) Certain non-IFRS measures are utilized by the Company as measures of financial performance. Non-IFRS measures do not have any standardized meaning prescribed by IFRS and are therefore
unlikely to be comparable to similar measures presented by other companies. Non-IFRS measures included are: incentive compensation expenses as a % of revenue, total compensation expensesas a % of revenue, non-compensation expenses as a % of revenue, total expenses as a % of revenue, and book value per diluted common share.
(2) The operating results of the Australian operations have been fully consolidated, and a 42% non-controlling interest has been recognized for the year ended March 31, 2018 [year ended March 31,2017 — 42% and March 31, 2016 — 40%.].
(3) Data includes the results of Hargreave Hale since the closing date of September 18, 2017.(4) Incentive compensation expenses include the National Insurance Tax applicable to the UK.(5) Restructuring costs for the year ended March 31, 2018 related to termination benefits incurred as a result of the closing of certain trading operations in our UK & Europe capital markets
operations, staff reductions in our Canadian and US capital markets operations, as well as real estate costs related to the acquisition of Hargreave Hale. Restructuring costs for the year endedMarch 31, 2016 were related to staff reductions in our US capital markets operations and the closure of our Barbados office in Other Foreign Locations, as well as charges related to changes inour Corporate and Other segment.
(6) Effective as of March 31, 2018 the Plan was changed to remove certain employment-related conditions for the vesting of RSU awards made as part of the normal course incentive compensationpayment cycle. As a result of this change, the costs of RSUs granted as part of the normal course incentive compensation payment cycle will now be expensed in the period in which those awardsare deemed to be earned, instead of recognizing the costs over the vesting period. This change led to the acceleration of the remaining expense for certain awards made under the LTIP which hadnot been fully amortized as of March 31, 2018. The total charge recorded during the year ended March 31, 2018 in respect of awards granted prior to fiscal 2018 was $48.4 million.
(7) Represents the Company’s equity portion of the net loss of its investment in Canaccord Genuity Acquisition Corp. for the year ended March 31, 2018.(8) Total compensation expenses include incentive compensation and salaries and benefits, but exclude hiring incentives, which are included in development costs.(9) Book value per diluted common share, a non-IFRS measure, is calculated as total common shareholders’ equity adjusted for assumed proceeds from exercise of options and warrants and
conversion of convertible debentures divided by the number of diluted common shares outstanding including estimated amounts in respect of share issuance commitments including options,warrants, and convertible debentures, as applicable, and adjusted for shares purchased under the normal course issuer bid and not yet cancelled, and estimated forfeitures in respect of unvestedshare awards under share-based payment plans.
Supplemental Information 111
2018 ANNUAL REPORT / CANACCORD GENUITY GROUP INC.

Condensed Consolidated Statements of Financial Position
(C$ thousands)Fiscal 2018 Fiscal 2017
Q4 Q3 Q2 Q1 Q4 Q3 Q2 Q1Assets
Cash and cash equivalents 862,838 592,873 543,109 521,725 677,769 470,243 317,527 282,170Securities owned 469,217 514,220 469,433 585,258 784,230 421,181 651,068 726,857Accounts receivable 2,215,837 1,758,532 1,944,939 2,171,795 3,395,736 1,534,449 2,629,075 2,704,228Income taxes recoverable 1,170 242 2,716 884 1,085 4,586 11,429 9,870Deferred tax assets 19,941 12,412 15,006 16,231 15,323 11,442 9,950 9,790Investments 2,035 2,030 2,321 2,960 2,829 5,197 5,264 5,330Equipment and leasehold
improvements 30,967 31,966 30,717 30,592 31,479 30,991 32,815 34,728Goodwill and other intangibles 418,731 404,929 405,157 293,805 295,065 298,009 303,773 310,134
4,020,736 3,317,204 3,413,398 3,623,250 5,203,516 2,776,098 3,960,901 4,083,107Liabilities and shareholders’ equity
Bank indebtedness — 2,767 27,300 — 25,280 11,577 49,069 89,878Short Term credit facility — — — — — — — —Securities sold short 301,006 342,754 316,003 410,303 645,742 299,508 491,483 580,665Accounts payable, accrued liabilities
and other 2,647,382 1,982,336 2,130,560 2,383,957 3,681,676 1,648,727 2,670,764 2,655,093Income taxes payable 7,851 12,988 9,666 10,394 10,093 7,269 4,957 4,324Current portion of bank loan 9,679 4,529 4,463 — — — — —Deferred consideration 9,997 9,958 10,030 — — — — —Contingent consideration 49,844 46,643 45,969 — — — — —Bank loan 61,758 62,230 61,244 — — — — —Deferred tax liabilities 13,715 10,220 10,170 141 140 — 208 77Subordinated debt 7,500 7,500 7,500 7,500 7,500 7,500 7,500 7,500Convertible debentures 57,081 56,916 56,755 56,597 56,442 56,263 — —Non-controlling interests 13,571 12,031 13,354 12,481 11,858 9,651 8,992 9,892Shareholders’ equity 841,352 766,332 720,384 741,877 764,785 735,603 727,928 735,678
4,020,736 3,317,204 3,413,398 3,623,250 5,203,516 2,776,098 3,960,901 4,083,107
Miscellaneous Operational Statistics(1)
Fiscal 2018 Fiscal 2017Q4 Q3 Q2 Q1 Q4 Q3 Q2 Q1
Number of employees in CanadaNumber in Canaccord Genuity 189 189 194 190 178 184 178 177Number in Canaccord Genuity
Wealth Management 379 352 353 351 359 354 342 342Number in Corporate and Other 288 282 276 274 279 281 274 277Total Canada 856 823 823 815 816 819 794 796
Number of employees in the UK andEuropeNumber in Canaccord Genuity 214 214 217 222 225 250 250 255Number in Canaccord Genuity
Wealth Management 559 574 586 314 313 309 312 310Number of employees in the US
Number in Canaccord Genuity 256 257 258 275 275 282 297 303Number of employees in Australia
Number in Canaccord Genuity 57 56 55 58 58 59 60 56Number in Canaccord Genuity
Wealth Management 11 12 12 11 11 11 11 11Number of employees in Other Foreign
LocationsNumber in Canaccord Genuity 3 3 2 2 2 3 3 6
Number of employees company-wide 1,956 1,939 1,953 1,697 1,700 1,733 1,727 1,737Number of Advisory Teams in Canada(2) 142 134 134 135 141 139 139 138Number of licensed professionals in
Canada 374 353 356 355 367 367 356 392Number of investment professionals
and fund managers in the UK andEurope(3) 188 197 200 119 118 115 118 117
Number of Advisors − Australia 7 8 8 8 8 7 7 7AUM − Canada (discretionary)
(C$ millions) 2,815 2,838 2,688 2,647 2,637 2,527 1,219 1,268AUA − Canada (C$ millions) 15,567 14,451 12,801 12,669 13,228 11,969 10,334 9,817AUM − UK and Europe (C$ millions) 44,877 43,791 40,797 25,755 24,526 23,383 23,208 22,410AUM − Australia (C$ millions) 830 928 866 860 862 769 845 742Total (C$ millions) 61,274 59,170 54,464 39,284 38,616 36,121 34,387 32,969Number of companies with Canaccord
Genuity Limited as brokerLondon Stock Exchange (LSE) 48 50 47 48 51 51 50 49Alternative Investment Market (AIM) 33 32 31 35 32 31 28 29Total broker 81 82 78 83 83 82 78 78
Number of companies with CanaccordGenuity Limited as Nomad(4)
LSE — — — — — 1 — —AIM 33 32 31 35 32 22 28 29Total Nomad 33 32 31 35 32 23 28 29
(1) These miscellaneous operational statistics are non-IFRS measures.(2) Advisory Teams are normally comprised of one or more Investment Advisors (IAs) and their assistants and associates, who together manage a shared set of client accounts. Advisory Teams that
are led by, or only include, an IA who has been licensed for less than three years are not included in our Advisory Team count, as it typically takes a new IA approximately three years to build anaverage-sized book.
(3) Investment professionals include all staff with direct sales responsibilities, which includes brokers and assistants with direct client contacts. Fund managers include all staff who manage client assets.(4) A company listed on AIM is required to retain a Nominated Adviser (commonly referred to as a Nomad) during the company’s life on the market. Among other duties, Nomads are responsible for
warranting that a company is appropriate for joining AIM. A Nomad is similar to a Financial Advisor on the LSE, but is specific to AIM.
112 Supplemental Information
CANACCORD GENUITY GROUP INC. / 2018 ANNUAL REPORT

GlossaryAcquisition-related expense itemsAcquisition-related expense items include costs incurred toacquire Genuity Capital Markets. The Balloch Group Limited,50% interest in BGF Capital Pty Ltd, Collins Stewart Hawkpointplc, certain assets and liabilities of Kenosis Capital Partners,Hargreave Hale Limited, and the wealth management businessof Eden Financial Ltd., as well as the amortization of intangibleassets related to these acquisitions. Acquisition-relatedexpense items also include costs incurred for prospectiveacquisitions not pursued. Figures that excludeacquisition-related items are considered non-IFRS measures.
Advisory feesRevenue related to the fees the Company charges for corporateadvisory, mergers and acquisitions or corporate restructuringservices is recorded as Advisory fees.
Advisory Teams (IA Teams)Advisory Teams are normally comprised of one or more IAs andtheir assistants and associates, who together manage ashared set of client accounts. Advisory Teams that are led by,or only include, an IA who has been licensed for less thanthree years are not included in our Advisory Team count, as ittypically takes a new IA approximately three years to build anaverage-sized book. As Independent Wealth Managementbranches are led by one advisor (with a team), each IWMbranch is counted as a single Advisory Team.
Alternative Investment Market (AIM)The junior arm of the London Stock Exchange (LSE), AIMprovides a global market for smaller, growing companies.
Assets under administration (AUA) CanadaAUA is the market value of client assets administered by theCompany, for which the Company earns commissions or fees.This measure includes funds held in client accounts, as well asthe aggregate market value of long and short securitypositions. Management uses this measure to assessoperational performance of the Canaccord Genuity WealthManagement business segment. This measure is non-IFRS.
Assets under management (AUM) CanadaAUM consists of assets that are beneficially owned by clientsand discretionarily managed by the Company as part of theComplete Canaccord Investment Counselling Program andComplete Canaccord Private Investment Management. Servicesprovided include the selection of investments and the provisionof investment advice. AUM is also administered by theCompany and is therefore included in AUA. This measure isnon-IFRS.
Assets under management (AUM) UK and EuropeAUM is the market value of client assets managed andadministered by the Company, for which the Company earnscommissions or fees. This measure includes both discretionaryand non-discretionary accounts. This measure is non-IFRS.
Book value per diluted common shareA measure of common equity per share calculated as totalcommon shareholders’ equity adjusted for assumed proceedsfrom exercise of options and warrants and conversion ofconvertible debentures divided by the number of dilutedcommon shares outstanding including estimated amounts inrespect of share issuance commitments including options,warrants, and convertible debentures, as applicable, andadjusted for shares purchased under the normal course issuerbid and not yet cancelled, and estimated forfeitures in respectof unvested share awards under share-based payment plans.
Canaccord GenuityCanaccord Genuity refers to the Company’s global capitalmarkets division.
Canaccord Genuity AsiaCanaccord Genuity Asia is the brand used for CanaccordGenuity’s operations in the Asia-Pacific region.
Canaccord Genuity Wealth Management (CGWM)Canaccord Genuity Wealth Management refers to theCompany’s global wealth management operations.
Collins Stewart Hawkpoint plc (CSHP)Canaccord Genuity Group acquired Collins Stewart Hawkpointplc (CSHP) on March 21, 2012. CSHP was a leadingindependent financial advisory group with operations in the UK,the US, Europe and Singapore. Subsequent to the acquisition,CSHP was rebranded Canaccord Genuity.
Common equityAlso referred to as common shares, which are, as the nameimplies, the most usual and commonly held form of stock in acorporation. Dividends paid to the stockholders must be paidto preferred shares before being paid to common stockshareholders.
Corporate and otherCorporate and other refers to the Company’s administrativesegment.
Correspondent brokerage servicesThe provision of secure administrative, trade execution andresearch services to other brokerage firms through theCompany’s existing technology and operations infrastructure(Pinnacle Correspondent Services).
DilutionThe change in earnings and book value per share resultingfrom the exercise of all warrants and options and conversion ofconvertible securities.
113
2018 ANNUAL REPORT / CANACCORD GENUITY GROUP INC.

Dividend yieldA financial ratio that shows how much a company pays out individends each year relative to its share price. It is calculatedas total annual dividends per share divided by the companyshare price.
Earnings (loss) per share (EPS), dilutedNet income (loss) attributable to common shareholders dividedby the weighted average number of shares outstandingadjusted for the dilutive effects of stock options and othershare-based compensation.
Employee Stock Purchase Plan (ESPP)Voluntary plan that provides eligible employees with the abilityto purchase shares in the Company through payroll deductions,with an additional contribution by the Company.
Escrowed securitiesCommon shares in the Company that are subject to specificterms of release.
Fair value adjustmentAn estimate of the fair value of an asset (or liability) for which amarket price cannot be determined, usually because there isno established market for the asset.
Fixed income tradingTrading in new issues, government and corporate bonds,treasury bills, commercial paper, strip bonds, high-yield debtand convertible debentures.
Incentive-based revenueA percentage of incentive-based revenue earned is directly paidout as incentive compensation expense, including commission,investment banking, advisory fees, and principal tradingrevenue.
Independent Wealth Management (IWM)An independent operating platform of Canaccord GenuityWealth Management, under which Investment Advisors operateas independent agents of the Company. Each IWM branch isclassified as one Advisory Team, which is comprised of one ormore Investment Advisors and their assistants and associates,who together manage a shared set of client accounts.
Institutional sales and tradingA capital markets business segment providing marketinformation and research, advice and trade execution toinstitutional clients.
International Equities Group (IEG)The International Equities Group is a premium, low cost, orderrouting destination for both US listed securities and foreignlisted ordinary shares for local market execution in the USoperations.
International tradingExecuting trades in Canadian securities on behalf of USbrokerage firms.
Investment bankingAssisting public and private businesses and governments toobtain financing in the capital markets through the issuance ofdebt, equity and derivative securities on either an underwrittenor an agency basis.
Investment professionals and fund managersInvestment professionals include all staff with direct salesresponsibilities, which include brokers and assistants withdirect contacts. Fund managers include all staff who manageclient assets.
LiquidityThe total of cash and cash equivalents available to theCompany as capital for operating and regulatory purposes.
London Stock Exchange (LSE)One of the world’s largest stock exchanges, the LSE has beenin existence for more than 300 years and has over 3,000 listedcompanies. The exchange has four main sectors: the MainMarket; the AIM Market; the Professional Securities Market;and the Specialist Fund Market.
Long-term incentive plan (LTIP)A reward system designed to align employee and externalshareholder interests. Under the Company’s LTIP, a portion ofan eligible employee’s annual compensation is held back topurchase restricted share units (RSUs) of the Company. TheRSUs are topped up by the firm and generally vest overthree years.
National Insurance (NI) taxPayroll tax applicable to UK employees based on a percentageof incentive compensation payout.
Nominated Adviser (NOMAD)A company approved by the LSE to act as an adviser forcompanies who wish to be admitted to AIM. A Nomad warrantsto the LSE that the company is appropriate for admission andassists the listed company on an ongoing basis with disclosureand other market-related matters.
Non-cash chargesCharges booked by a company that do not impact its cashbalance or working capital.
Non-IFRS MeasuresNon-IFRS Measures do not have any standardized meaningprescribed by International Financial Reporting Standards(IFRS) and are therefore unlikely to be comparable to similarmeasured presented by other companies. See page 14 of thisAnnual Report.
Preferred sharesA class of ownership in a corporation that has a higher claimon the assets and earnings than common stock. Preferredshares generally do not have voting rights; however, preferredshareholders receive a dividend that must be paid out beforedividends are paid to common stockholders.
Principal tradingTrading in equity securities in principal and inventory accounts.Revenue is generated through inventory trading gains and losses.
Registered tradingTrading in equity securities in principal and inventory accountsby registered traders who operate by taking positions, tradingand making markets in equity securities including securities ofcompanies with small to medium-sized market capitalizations.Revenue is generated through inventory trading gains andlosses.
114 Glossary
CANACCORD GENUITY GROUP INC. / 2018 ANNUAL REPORT

Return on average common equity (ROE)Net income expressed as a percentage of average commonequity. This measure is non-IFRS.
RiskFinancial institutions face a number of risks that may exposethem to losses, including market, credit, operational, regulatoryand legal risk.
Separately managed accounts (SMAs)Investment portfolios available to clients that are managed by asenior portfolio manager. In SMAs, clients own the individualsecurities within the portfolio, rather than a portion of a pooledfund.
Significant itemsFinancial statement items that exclude significant items arenon-IFRS measures. Charges not considered to be recurring orindicative of operating earnings. Significant items for theCompany includes restructuring costs, amortization ofintangible assets acquired in connection with a businesscombination, impairment of goodwill and other assets, andacquisition-related expense items, which include costsrecognized in relation to both prospective and completedacquisitions, gains or losses related to business disposalsincluding recognition of realized translation gains on thedisposal of foreign operations, certain accounting chargesrelated to the change in the Company’s long-term incentiveplan, incentive-based payments related to the acquisition ofHargreave Hale, as well as certain expense items, typicallyincluded in development costs, which are considered bymanagement to reflect a singular charge of a non-operating.
Syndicate participationA group of investment banking firms coordinating themarketing, distribution, pricing and stabilization of equityfinancing transactions.
Trading servicesQuotation services, trade reconciliation, executionmanagement, order book management and trade reporting.
Underwriter − investment bankingPurchases securities or other instruments from a corporateissuer for resale to investors.
Value-at-Risk (VaR)VaR is a generally accepted risk measurement concept that isdefined as the predicted minimum loss in market value of aportfolio at a specific confidence level (e.g., 95%) over acertain period of time (e.g., daily).
Wrap accountsA type of brokerage account in which a single or flat fee coversall administrative, research, advisory and managementexpenses.
Glossary 115
2018 ANNUAL REPORT / CANACCORD GENUITY GROUP INC.

Corporate Governance
The Board of Directors (Board) assumes responsibility for the stewardship of the Company, acting as a whole and through itscommittees, and has approved a formal Board Governance Manual (Mandate) including terms of reference for the Board andsetting forth the Board’s stewardship responsibilities and other specific duties and responsibilities. The Board’s responsibilitiesare also governed by:
• The Business Corporations Act (British Columbia)• The Company’s articles• The charters of its committees• Other corporate policies and applicable laws
Communication with Independent Members of the Board
Terrence Lyons has been appointed by the Board of Directors of Canaccord Genuity Group Inc. as its Lead Director. One of hisresponsibilities is to receive and determine appropriate action on any communications from interested parties that areaddressed to the independent directors of the Board. Such communications can be sent to Mr. Lyons in writing by mail to2039 West 35th Avenue, Vancouver, BC, Canada, V6M 1J1.
Strategic Planning Process
The Board’s Mandate provides that the Board is responsible for ensuring that the Company has an effective strategic planningprocess. As such, the Board reviews, approves, monitors and provides guidance on the Company’s strategic plan.
Identification and Management of Risks
The Board’s Mandate includes:
• Assisting management to identify the principal business risks of the Company• Taking reasonable steps to ensure the implementation of appropriate systems to manage and monitor those risks• Reviewing plans for evaluating and testing the Company’s internal financial controls• Overseeing the external auditors, including the approval of the external auditors’ terms of reference
Succession Planning and Evaluation
The Board’s Mandate includes keeping in place adequate and effective succession plans for the Chief Executive Officer (CEO) andsenior management.
• The Corporate Governance and Compensation Committee (CGCC) receives periodic updates on the Company’s successionplan at the senior officer level and monitors the succession planning process
• The succession plan is reviewed, at least annually, by the CGCC• On the recommendation of the Chairman & CEO, the Board appoints the senior officers of the Company
116
CANACCORD GENUITY GROUP INC. / 2018 ANNUAL REPORT

Communications and Public Disclosure
The Company’s Disclosure Controls Policy (DCP) addresses the accurate and timely communication of all important informationrelating to the Company and its interaction with shareholders, investment analysts, other stakeholders and the public generally.
• The DCP is reviewed annually by the Board• The DCP, public securities regulatory filings, press releases and investor presentations are posted on the Company’s website• The Board reviews all quarterly and annual consolidated financial statements and related management discussion and
analysis, the Company’s earnings releases, management information circulars, annual information forms (AIFs) and financingdocuments
Internal Controls
The Board requires management to maintain effective internal controls and information systems. The Board, with the assistanceof the Audit Committee, oversees the integrity of the Company’s internal control and information systems.
• The Audit Committee meets no less than four times a year with the Company’s Chief Financial Officer (CFO) and seniorfinance staff to review internal controls over financial reporting and related information systems
• External auditors provide recommendations to the Audit Committee on an annual basis in relation to the Company’s internalcontrols and information systems
As of March 31, 2018 an evaluation was carried out, under the supervision of and with the participation of management, includingthe President & CEO and the Executive Vice President & CFO, of the effectiveness of our disclosure controls and procedures asdefined under National Instrument 52-109. Based on that evaluation, the President & CEO and the Executive Vice President & CFOconcluded that the design and operation of these disclosure controls and procedures were effective as of March 31, 2018.
Governance
The Board is currently composed of eight directors, six of whom are independent of management as determined under applicablesecurities legislation. In order to facilitate the exercise of independent judgment by the Board of Directors, the Board hasappointed a lead director and holds regular meetings without management directors present.
• The CGCC is responsible for periodically reviewing the composition of the Board and its committees• A formal annual assessment process has been established to include feedback by all the directors to the full Board,
including the completion of a confidential survey• New directors are provided with substantial reference material on the Company’s strategic focus, financial and operating
history, corporate governance practices and corporate vision
Corporate Governance 117
2018 ANNUAL REPORT / CANACCORD GENUITY GROUP INC.

Summary of Charters and Committees
The Board has delegated certain of its responsibilities to two committees, each of which has specific roles and responsibilities asdefined by the Board. Both of these Board committees are made up of independent directors.
AUDIT COMMITTEE
The Audit Committee assists the Board of Directors in fulfilling its oversight responsibilities by monitoring the Company’s financialreporting practices and financial disclosure. It comprises four independent directors. All members of the Audit Committee arefinancially literate; that is, they are able to read and understand a set of financial statements that present a breadth and level ofcomplexity of accounting issues that are generally comparable to the breadth and complexity of the issues that can reasonably beexpected to be raised by the Company’s financial statements. The current members of the Audit Committee are Messrs. Lyons(Chair), Bralver, Carello and Shah.
The Audit Committee has adopted a charter which specifically defines the roles and responsibilities of the Audit Committee.The Audit Committee Charter can be found in the Company’s AIF filed on SEDAR. The Audit Committee has direct communicationchannels with the external auditors and CFO and senior finance staff and discusses and reviews issues with each of them on aregular basis. The Audit Committee’s mandate was updated in Fiscal 2015 to better reflect the Audit Committee’s oversight of theCompany’s risk management function.
The Audit Committee is responsible for ensuring management has designed and implemented an effective system of internalcontrol. The external auditors are hired by and report directly to the Audit Committee. After consultation with management, theAudit Committee is responsible for setting the external auditors’ compensation. The external auditors attend each meeting of theAudit Committee, and a portion of each meeting is held without the presence of management. The Audit Committee annuallyreviews and approves the external auditors’ audit plan and must approve any audit and non-audit work performed by the externalauditors. The CFO and senior finance staff attend each meeting of the Audit Committee other than the portion of the meetingwhich is held without management present to allow more open discussion. The Audit Committee annually reviews and approvesthe internal audit plan.
CORPORATE GOVERNANCE AND COMPENSATION COMMITTEE
The Corporate Governance and Compensation Committee is responsible for developing the Company’s approach to governanceissues, reviewing the Company’s overall governance principles and recommending changes to those principles from time to time.It comprises four unrelated directors: Messrs. Harris (Chair), Bralver and Lyons, and Ms. Desai. The committee has full access tostaff and resources. At all regular committee meetings during the year, a portion of each meeting is held without managementpresent to allow more open discussion.
118 Corporate Governance
CANACCORD GENUITY GROUP INC. / 2018 ANNUAL REPORT

Board of DirectorsCharles N. Bralver (2010)Audit CommitteeCorporate Governance and Compensation CommitteeCharles N. Bralver, age 66, is a financial services executivewith over thirty years of capital markets experience. For morethan 23 years — from 1984 to 2007 — Mr. Bralver was afounder and Vice Chairman of management consultancy Oliver,Wyman & Co. where he specialized in strategy, risk andoperational work for leading investment banks, assetmanagers, exchanges and other market utilities. He continuesto serve as a member of the senior advisory board of OliverWyman and is also a Senior Advisor to the hedge fundSilverpoint Capital. Mr. Bralver served as Senior AssociateDean for International Business and Finance at the FletcherSchool of Law and Diplomacy from 2007 to 2010, and from2007 to 2009 as a strategic advisor to Warburg Pincus LLC.Mr. Bralver serves as a director of the Company, as a directorand member of the risk committee of NewStar Financial, Inc.and on the Board of Visitors of the Fletcher School. Mr. Bralverstarted his career at Booz Allen Hamilton. He is a US citizenand a graduate of the Fletcher School of Law and Diplomacyand Dartmouth College.
In addition to Canaccord Genuity Group Inc., Mr. Bralver is adirector of the following public company: the Co-operativeBank p.l.c.
Massimo Carello, is a corporate director and a private investorin public companies. Dr. Carello was the Chairman and ChiefExecutive Officer of Diners Club UK Ltd. from 2001 to 2004and he was the Chairman and Chief Executive Officer of Fiat UKLtd. from 1990 to 2001. He served as a member of theConfederation of British Industry (CBI) President’s Committeefrom 1998 to 2003 and was a member of the CBI EuropeanCommittee. From 1998 to 2005, he was Vice President of theItalian Chamber of Commerce in the UK. He is HonoraryVice-President of CLIC Sargent, a leading UK based cancercharity. From 1978 to 1990, prior to moving to the UK, Dr.Carello was CEO of Carello Lighting Group, one of the largestEuropean manufacturers of lighting for the automotive industry.
In addition to Canaccord Genuity Group Inc., Dr. Carello is adirector of the following public company: Canadian OverseasPetroleum Limited. Until 2010, he was a director and memberof the Audit Committee of Uranium One Inc. and until 2016, hewas a director of Orsu Metals Corporation.
Daniel Daviau (2015)Dan Daviau, age 53, was appointed President and ChiefExecutive Officer and a director of the Company and ChiefExecutive Officer of Canaccord Genuity Corp. effective onOctober 1, 2015. Mr. Daviau served as President of CanaccordGenuity’s North American capital markets business fromFebruary 2015. From 2012 to 2015, he was President of thefirm’s US capital markets business, where he helped tostructure the firm’s investment banking, research, sales andtrading operations in the region and improve cross-bordercapabilities. From 2010 to 2012, Mr. Daviau was Head ofInvestment Banking for Canaccord Genuity. Before theCanaccord/Genuity merger that was announced in 2010,Mr. Daviau was a Principal and Founder of Genuity CapitalMarkets, where he held a variety of senior roles since 2005.
Before 2005, Mr. Daviau was Co-Head of Investment Banking atCIBC World Markets, a firm he joined in 1991. While at CIBCWorld Markets, Mr. Daviau also served as the Head of the Mediaand Telecommunications Group since 2000 and Head of theTechnology Investment Banking Group in Canada since 1997.
Having started his career as a securities lawyer withGoodman & Co., Mr. Daviau has extensive experience in a broadrange of financing transactions and M&A assignments.Mr. Daviau is based in Toronto, Canada. He holds an MBA fromYork University, an LL.B. from Osgoode Hall/York University and aB.A. (Math and Statistics) from the University of Western Ontario.
Mr. Daviau is not currently a director of any other publiccompanies.
Kalpana Desai (2014)Corporate Governance and Compensation CommitteeKalpana Desai, age 51, is a corporate director and advisor. Shehas over 25 years of international investment banking andadvisory experience. She was Head of Macquarie Capital Asia,the investment banking division of Macquarie Group, anExecutive Director and a member of the Global MacquarieCapital Operations Committee from 2010 to 2013. Beforejoining Macquarie Group in 2009, Ms. Desai was Head of theAsia-Pacific Mergers & Acquisitions Group and a SeniorManaging Director in the investment banking division of Bankof America Merrill Lynch based in Hong Kong, having joinedMerrill Lynch in 1998. Earlier, Ms. Desai worked in theinvestment banking divisions of Barclays de Zoete Wedd (nowpart of Credit Suisse) and J. Henry Schroder Wagg (now part ofCitibank) in London, having started her career in the financialservices consulting division of PricewaterhouseCoopers.
Ms. Desai was a member of the Takeovers and Mergers Panelof the Securities and Futures Commission in Hong Kong from2007 to 2014.
Born in Kenya and educated in the United Kingdom, Ms. Desailived in Hong Kong from 1997 to 2017 and now lives in theUnited Kingdom. Ms. Desai holds a B.Sc. (honours) from theLondon School of Economics and Political Science and is anAssociate Member of the Institute of Chartered Accountants ofEngland and Wales.
In addition to Canaccord Genuity Group Inc., Ms. Desai is anon-executive director of Janus Henderson Group plc which islisted on the New York Stock Exchange (NYSE), the LondonStock Exchange and the Australian Securities Exchange (ASX).
Michael D. Harris, ICD.D. (2004)Corporate Governance and Compensation CommitteeMichael Harris, ICD.D, age 73, is the President of his ownconsulting firm, Steane Consulting Ltd., and, in this capacity, actsas a consultant to various Canadian companies, including FaskenMartineau DuMoulin LLP. Before joining Fasken Martineau inSeptember 2013, he was a senior business advisor with the lawfirm of Cassels Brock & Blackwell in Toronto.
Mr. Harris was born in Toronto in 1945 and was raised inCallander and North Bay, Ontario. Before his election to theOntario Legislature in 1981, Mr. Harris was a schoolteacher, aschool board trustee and chair and an entrepreneur in theNipissing area. On June 8, 1995, Mr. Harris became the 22ndPremier of Ontario following a landslide election victory. In 1999,
119
2018 ANNUAL REPORT / CANACCORD GENUITY GROUP INC.

he was re-elected — making him the first Ontario Premier in over30 years to form a second consecutive majority government.
In addition to sitting on several boards of Canadiancorporations, he has also served as a director of the ManningCentre for Building Democracy and as the Honorary Chair of theNorth Bay District Hospital Capital Campaign and the NipissingUniversity and Canadore College Capital Campaign. Mr. Harrisis also a Senior Fellow of the Fraser Institute and a director ofthe New Haven Housing Centre. He has received his ICD.Dcertification from the Institute of Corporate Directors.
In addition to Canaccord Genuity Group Inc., Mr. Harris is adirector of the following public companies: ChartwellRetirement Residences (Chair), Colliers International Group Inc.(CIGI) and Routel Inc. (Chair).
David Kassie (2010)David Kassie, age 62, became Group Chairman and a directorof the Company on the closing of the acquisition of GenuityCapital Markets, a Canadian investment bank, on April 23,2010, and became Chairman on April 1, 2012. He was thePrincipal, Chairman and Chief Executive Officer of GenuityCapital Markets from 2004 until May 9, 2010, when theintegration of the businesses of Genuity Capital Markets andCanaccord Financial Ltd. was completed under the nameCanaccord Genuity. Before 2004, he was Chairman and ChiefExecutive Officer of CIBC World Markets and the Vice Chairmanof CIBC. On the death of Paul Reynolds on April 1, 2015,Mr. Kassie was appointed as the Chief Executive Officer of theCompany and on October 1, 2015, upon succession,Mr. Kassie became the Executive Chairman.
Mr. Kassie has extensive experience as an advisor, underwriterand principal. He sits on a number of corporate boards.Mr. Kassie is actively involved in community and charitableorganizations and is the Chairman of the Board of BaycrestHealth Sciences and is on the board of the Richard Ivey Schoolof Business and was formerly on the boards of the TorontoInternational Film Festival Group and the Hospital for SickChildren.
Mr. Kassie holds a B.Comm. (Honours) in Economics fromMcGill University (1977), and an MBA from the University ofWestern Ontario (1979).
In addition to Canaccord Genuity Group Inc., Mr. Kassie is adirector of the following public company: Reitmans (Canada)Limited.
Terrence A. Lyons, ICD.D. (2004)
Audit CommitteeCorporate Governance and Compensation CommitteeTerrence (Terry) Lyons, ICD.D, age 68, is a corporate director.He is a director of several public and private corporationsincluding Sprott Resource Holdings Inc. (Chairman) andMartinrea International Inc. Mr. Lyons is a retired ManagingPartner of Brookfield Asset Management, past Chairman ofNorthgate Minerals Corporation which was acquired by AuRicoGold Inc. (now Alamos Gold Inc.), past Chairman of EacomTimber Corporation which was sold to a private equity firm, past
Chairman of Westmin Mining, past Vice-Chairman of BattleMountain Gold and past Chairman of Polaris MaterialsCorporation.
Mr. Lyons is a Civil Engineer (UBC) with an MBA from theUniversity of Western Ontario (1974). He sits on the AdvisoryBoard of the Richard Ivey School of Business and is active insports and charitable activities, is a past Governor of theOlympic Foundation of Canada, past Chairman of the MiningAssociation of B.C., past Governor and member of theExecutive Committee of the B.C. Business Council and a pastdirector of the Institute of Corporate Directors (B.C.). In 2007,Mr. Lyons was awarded the INCO Medal by the CanadianInstitute of Mining and Metallurgy for distinguished service tothe mining industry.
In addition to Canaccord Genuity Group Inc., Mr. Lyons is adirector of the following public companies: MartinreaInternational Inc. and Sprott Resource Holdings Inc.
Dipesh Shah (2012)Audit CommitteeDipesh Shah, OBE, FRSA, age 65, is Chairman of Notting HillGenesis and Genesis Housing Association and a director onthe boards of The Crown Estate and the two 2020 EuropeanFunds for Energy, Climate Change and Infrastructure (‘‘EUMarguerite Fund I’’ and ‘‘EU Marguerite Fund II’’, for each ofwhich he is Chairman of the Investment Committee). He is alsoa Trustee of the British Youth Opera and a Governor ofMerchant Taylors’ School.
Mr. Shah was formerly the Chief Executive of the UK AtomicEnergy Authority and of various large businesses in BP Plc,where he was a member of the Group Leadership for more thana decade and latterly also the Global Head of Acquisitions andDivestitures. Mr. Shah was Chairman, inter alia, of ViridianGroup plc, HgCapital Renewable Power Partners LLP and theEuropean Photovoltaic Industry Association. He was the SeniorIndependent Director and Chair of the RemunerationCommittee of JKX Oil & Gas Plc from 2008 to 2015, the SeniorIndependent Director and Chair of the Nominations Committeeof Equus Petroleum Plc from 2013 to 2016 and a Director ofThames Water from 2007 to August 2017 and of CavendishFluor Partnership from 2014 to August 2017. In addition, hehas been a Director of several major organizations, includingBabcock International Group Plc and Lloyd’s of London, theinsurance market. He was also a member of the UKGovernment’s Renewable Energy Advisory Committee from1994 to 2002. Earlier, Mr. Shah was the Chief Economist forBP Oil UK.
Born in India, and brought up in Uganda, Mr. Shah is a graduateof the University of London, the University of Warwick and theHarvard Business School management program. He wasappointed an Officer of the Order of the British Empire (OBE) inthe 2007 New Year Honours and is a Life Fellow of the RoyalSociety of Arts (FRSA).
Mr. Shah is not currently a director of any other publiccompanies.
120 Board of Directors
CANACCORD GENUITY GROUP INC. / 2018 ANNUAL REPORT

LocationsCapital Markets
CANACCORD GENUITY
Canada
TorontoBrookfield Place161 Bay Street, Suite 3000P.O. Box 516Toronto, ONCanada M5J 2S1Telephone: 416.869.7368Toll free (Canada): 1.800.382.9280Toll free (US): 1.800.896.1058
VancouverPacific Centre609 Granville Street, Suite 2200P.O. Box 10337Vancouver, BCCanada V7Y 1H2Telephone: 604.643.7300Toll free (Canada): 1.800.663.1899Toll free (US): 1.800.663.8061
CalgaryCentennial Place − East TowerSuite 2400, 520 3rd Ave. SWCalgary, ABCanada T2P 0R3Telephone: 403.508.3800
Montréal1250 René-Lévesque Boulevard WestSuite 2930Montréal, QCCanada H3B 4W8Telephone: 514.844.5443Toll free: 1.800.361.4805
United States
New York535 Madison AvenueNew York, NYUSA 10022Telephone: 212.389.8000
Boston99 High Street, Suite 1200Boston, MAUSA 02110Telephone: 617.371.3900Toll free: 1.800.225.6104
San Francisco101 Montgomery Street, Suite 2000San Francisco, CAUSA 94104Telephone: 415.229.7171Toll free: 1.800.225.6104
Nashville1033 Demonbreun Street, Suite 620Nashville, TNUSA 37203Telephone: 615.490.8500
Chicago1880 Oak Avenue, Suite 135Evanston, ILUSA 60201Telephone: 847.864.1139
Minneapolis45 South 7th Street, Suite 2640Minneapolis, MNUSA 55402-1648Telephone: 805.205.0589
Washington1200 G Street, NWSuite 725Washington, DC 20036USATelephone: 202.849.4100
UK, Europe and Dubai
London88 Wood StreetLondon, UKEC2V 7QRTelephone: 44.20.7523.8000
DublinHuguenot House35-38 St Stephen’s GreenDublin 2IrelandTelephone: 353.1.635.0210
ParisWashington Plaza29 rue de Berri75008 ParisFranceTelephone: 33.1.56.69.66.66
DubaiUnit 402, Level 4,Gate Village Building 4,DIFC, PO Box 507023,Dubai, UAETelephone: 971.4.454.1209Fax: 971.4.454.1239
121
2018 ANNUAL REPORT / CANACCORD GENUITY GROUP INC.
Asia-Pacific
BeijingUnit 2401-33, Level 24, China WorldOffice 2, 1 Jianguomenwai Avenue,Chaoyang DistrictBeijing 100004ChinaTelephone: 8610.5929 8650
MelbourneLevel 4, 60 Collins StreetMelbourne, VIC, 3000, AustraliaTelephone: 61.3.8688.9100
Perth1292 Hay StreetSuite 2.4, Level 2West Perth 6005 WA
SingaporeLevel 42, Six Battery RoadSingapore 049909Telephone: 65.6232.2187
SydneyLevel 26, 9 Castlereagh StreetSydney, NSW, 2000, AustraliaTelephone: 61.2.9263.2700
Hong Kong1505, 15/F, ICBC Tower, ThreeGarden Road, Central, Hong KongTelephone: 852.3919.2500Fax: 852.3919.2599
Wealth Management
CANACCORD GENUITY WEALTHMANAGEMENT
Canada
British ColumbiaVancouverPacific Centre609 Granville Street, Suite 2200P.O. Box 10337Vancouver, BCCanada V7Y 1H2Telephone: 604.643.7300Toll free (Canada): 1.800.663.1899Toll free (US): 1.800.663.8061
KelownaLandmark 5, 320 − 1620 DicksonAvenueKelowna, BCCanada V1Y 9Y2Telephone: 250.712.1100Toll free: 1.888.389.3331
Penticton200 − 498 Ellis StreetPenticton, BCCanada V2A 4M2Telephone: 855.643.7770
OntarioTorontoBrookfield Place, Suite 2900P.O. Box 516161 Bay StreetToronto, ONCanada M5J 2S1Telephone: 416.869.7368Toll free (Canada): 1.800.382.9280Toll free (US): 1.800.896.1058
Waterloo80 King Street South, Suite 101Waterloo, ONCanada N2J 1P5Telephone: 519.886.1060Toll free: 1.800.495.8071
AlbertaCalgaryCentennial Place − East Tower520 3rd Avenue SW, Suite 2400Calgary, ABCanada T2P 0R3Telephone: 403.508.3800Toll free: 1.800.818.4119
EdmontonManulife Place10180 − 101st Street, Suite 2700Edmonton, ABCanada T5J 3S4Telephone: 780.408.1500Toll free: 1.877.313.3035
ManitobaWinnipeg1010-201 Portage AvenueWinnipeg, MBCanada R3B 3K6Telephone: 204.259.2850Toll free: 1.877.259.2888
QuébecMontréal1250 René-Lévesque Boulevard West,Suite 2930Montreal, QCCanada H3B 4W8Telephone: 514.844.5443Toll free: 1.800.361.4805
Nova ScotiaHalifaxPurdy’s Wharf Tower IISuite 20041969 Upper Water StreetHalifax, NSCanada B3J 3R7Telephone: 902.442.3162Toll free: 1.866.371.2262
122 Locations
CANACCORD GENUITY GROUP INC. / 2018 ANNUAL REPORT
Canaccord Genuity Wealth Management(USA), Inc.
Pacific Centre, Suite 2200P.O. Box 10337609 Granville StreetVancouver, BCCanada V7Y 1H2Telephone: 604.743.7300
Independent Wealth ManagementBranches
OntarioKitchener4281 King Street East, Unit EKitchener, ONCanada N2P 2E9Telephone: 519.219.6611Toll free: 1.866.232.1894
British ColumbiaPrince George101 − 1840 Third AvenuePrince George, BCCanada V2M 1G4Telephone: 250.614.0888
Trail1277 Cedar AvenueTrail, BCCanada V1R 4B9Telephone: 250.368.3838
AlbertaCalgary#207 − 322 11th Avenue SWCalgary, ABCanada T2R 0W7Telephone: 403.531.2444Toll free: 1.866.531.2444
Calgary1409 − 2nd Street SWCalgary, ABCanada T2R 0W7Telephone: 403.263.7999Toll free: 1.877.263.7999
UK & EuropeLondon41 LothburyLondon, UKEC2R 7AETelephone: 44.20.7665.4500
Jersey37 The EsplanadeSt HelierJersey JE4 0XQTelephone: 44.1534.708090
GuernseyTrafalgar Court,Admiral Park,St. Peter Port GY1 2JATelephone: 44.1481.733900
Isle of ManAnglo International HouseBank HillDouglasIsle of Man IM1 4LNTelephone: 44.1624.690100
BlackpoolTalisman HouseBoardmans WayBlackpool FY4 5FYTelephone: 44.1253.621575
Carlisle10b Clifford CourtCooper WayParkhouseCarlisle CA3 0JGTelephone: 44.1228.515224
Lancaster25 Brock StreetLancaster LA1 1URTelephone: 44.1524.541560
Norwich13-15 St Georges StreetNorwichNorfolk NR3 1ABTelephone: 44.1603.567120
Llandudno JunctionAnson House1 Cae’r LlynenLlandudno JunctionConwy LL31 9LSTelephone: 44.1492.558359
NottinghamThe PointLoughborough RoadWest Bridgford,Nottingham NG2 7QWTelephone: 44.1158.965840
WorcesterSaggar HousePrinces DriveWorcester WR1 2PGTelephone: 44.1905.723551
York23 High PetergateYork YO1 7HSTelephone: 44.1904.232780
OTHER LOCATIONS
Pinnacle Correspondent Services
VancouverPacific Centre609 Granville Street, Suite 2200P.O. Box 10337Vancouver, BCCanada V7Y 1H2Telephone: 604.643.7300
TorontoBrookfield Place161 Bay Street, Suite 3000P.O. Box 516Toronto, ONCanada M5J 2S1Telephone: 416.869.7368
Locations 123
2018 ANNUAL REPORT / CANACCORD GENUITY GROUP INC.

Shareholder Information
Common Share Trading Information (Fiscal 2018)
Stock exchange Ticker
Diluted sharesoutstanding at
March 31, 2018Year-end price
March 31, 2018 High LowTotal volume
of shares
Toronto TSX CF 113,522,629 $ 6.93 $ 7.49 $ 5.50 50,465,674
Fiscal 2018 Preferred Dividend Dates and Amounts
Quarter end date
Preferreddividend
record date
Preferreddividend
payment date
Series Apreferreddividend
Series Cpreferreddividend
Totalpreferreddividend
June 30, 2017 September 15, 2017 October 2, 2017 $ 0.24281 $ 0.31206 $ 0.55487
September 30, 2017 December 22, 2017 January 2, 2018 $ 0.24281 $ 0.31206 $ 0.55487
December 31, 2017 March 16, 2018 April 2, 2018 $ 0.24281 $ 0.31206 $ 0.55487
March 31, 2018 June 22, 2018 July 3, 2018 $ 0.24281 $ 0.31206 $ 0.55487
$ 0.97124 $ 1.295555 $ 2.21948
Fiscal 2018 Common Dividend Dates and Amounts
Quarter end dateCommon dividend
record dateCommon dividend
payment dateCommondividend
June 30, 2017 September 1, 2017 September 15, 2017 $ 0.01
September 30, 2017 December 1, 2017 December 15, 2017 $ 0.01
December 31, 2017 March 2, 2018 March 15, 2018 $ 0.01
March 31, 2018 June 22, 2018 July 3, 2018 $ 0.12
$ 0.15
Fiscal 2019 Expected Dividend(1) and Earnings Release Dates
Expected earningsrelease date
Preferred dividendrecord date
Preferred dividendpayment date
Common dividendrecord date
Common dividendpayment date
Q1/19 August 1, 2018 September 14, 2018 October 1, 2018 August 31, 2018 September 10, 2018
Q2/19 November 6, 2018 December 14, 2018 December 31, 2018 November 30, 2018 December 10, 2018
Q3/19 February 7, 2019 March 15, 2019 April 1, 2019 March 1, 2019 March 15, 2019
Q4/19 June 5, 2019 June 21, 2019 July 2, 2019 June 21, 2019 July 2, 2019
(1) Dividends are subject to Board of Directors approval. All dividend payments will depend on general business conditions and the Company’s financial conditions, results of operations, capitalrequirements and such other factors as the Board determines to be relevant.
124
CANACCORD GENUITY GROUP INC. / 2018 ANNUAL REPORT

Shareholder Information
STOCK EXCHANGE LISTINGTSX: CF
FISCAL YEAR ENDMarch 31
WEBSITE AND FINANCIAL INFORMATIONFor TSX required corporate governance disclosures and current financial information, please visitwww.canaccordgenuitygroup.com.
REGULATORY FILINGSTo view Canaccord Genuity Group Inc.’s regulatory filings on SEDAR, please visit www.sedar.com.
MEDIA RELATIONS ANDINQUIRIES FROM INSTITUTIONALINVESTORS AND ANALYSTSChristina MarinoffVice President, Investor Relations & CommunicationsTelephone: 416.687.5507Email: [email protected]
GENERAL SHAREHOLDER INQUIRIES For all general shareholder info or to request a copy of this report.
INVESTOR RELATIONS161 Bay Street, Suite 3000Toronto, ON, CanadaTelephone: 416.869.7293Email: [email protected]
TRANSFER AGENT AND REGISTRARFor information about stock transfers, address changes, dividends, lost stock certificates, tax forms and estate transfers, contact:
COMPUTERSHAREINVESTOR SERVICES INC.100 University Avenue, 8th FloorToronto, ON M5J 2Y1
Telephone toll free (North America):1.800.564.6253International: 514.982.7555Fax: 1.866.249.7775Toll free fax (North America) orInternational fax: 416.263.9524
Email: [email protected]: www.computershare.com
ELIGIBLE DIVIDEND DESIGNATION:INCOME TAX ACT (CANADA)In Canada, the Federal Income TaxAct and most provincial income taxlegislation provide lower levels oftaxation for Canadian individualswho receive eligible dividends. All ofthe common share dividends paidby Canaccord Genuity Group Inc. since 2006 are eligible, as are commonshare dividends paid hereafter, unlessotherwise indicated.
CORPORATE HEADQUARTERS
STREET ADDRESSCanaccord Genuity Group Inc.609 Granville Street, Suite 2200Vancouver, BC, Canada
MAILING ADDRESSPacific Centre609 Granville Street, Suite 2200P .O. Box 10337Vancouver, BC V7Y 1H2 Canada
INDEPENDENT AUDITORErnst & Young LLPChartered Professional AccountantsVancouver, BC
For information about fees paid to shareholders’ auditors, refer to our Annual Information Form.
QUALIFIED FOREIGN CORPORATIONCanaccord Genuity Group Inc. is a “qualified foreign corporation” for US tax purposes under the Jobs & Growth Tax Reconciliation Act of 2003.
ANNUAL GENERAL MEETINGThursday, August 2, 2018at 10:00 a.m. (Eastern time)
Bay Adelaide Centre333 Bay Street34th FloorToronto, ON, Canada
EDITORIAL AND DESIGN SERVICESThe Works Design Communications Ltd.

Beijing
Blackpool
Boston
Calgary
Carlisle
Dubai
Dublin
Edmonton
Guernsey
Halifax
Hong Kong
Isle of Man
Jersey
Kelowna
Kitchener
Lancaster
Llandudno
London
Melbourne
Minneapolis
Montréal
Nashville
New York
Norwich
Nottingham
Paris
Penticton
Perth
Prince George
San Francisco
Singapore
Sydney
Toronto
Trail
Vancouver
Washington
Waterloo
Winnipeg
Worcester
York
More information about Canaccord Genuity Group Inc., including the Company’s Fiscal 2018 online Annual Report, can be found at canaccordgenuitygroup.com.
FRUKUS UAEAUCA
CA
NA
CC
OR
D G
EN
UITY
GR
OU
P IN
C. 2
01
8 A
NN
UA
L RE
PO
RT