strengthening families initiative evaluation report 2014-15, year 4 of the sf initiative first 5...
TRANSCRIPT

Strengthening Families Initiative
Evaluation Report 2014-15, Year 4 of the SF Initiative
First 5 Butte County Children and Families Commission
Prepared By: Social Entrepreneurs, Inc.

Introduction The Strengthening Families Initiative (SF Initiative) is a
Commission-funded effort with investments designed to ensure that all families are well-equipped to help their children reach their optimal development and full potential.
Expected long term outcomes include that: Families access necessary support systems and community
services
Children are raised in safe and supportive homes and communities
Families have the opportunity to come together and build networks of support
With four years of consistent data, we can now, for the first time, assert that SFI has successfully demonstrated evidence of those three long term outcomes.

Five Protective Factors

Three Levers for Change
Research indicates that participants in the Strengthening Families National Network have found three key “levers for change” that are critical for fully realizing the promise of the Strengthening Families framework.

Questions to be Answered through Evaluation
Is the Strengthening Families Initiative changing systems to increase the Protective Factors?
Is the Strengthening Families Initiative Network increasing Protective Factors within the families that they serve?
Are families accessing help from the Strengthening Families Initiative Network partners and other community organizations, as well as improving self-help skills?
Is the Strengthening Families Initiative positively impacting the three levers for change?
How does formative evaluation help programs implement the Protective Factors?

Findings SF Initiative impacted systems it funded and
increased the Protective Factors for families served through Network Partners. However, extending that impact outside of funded partners has been challenging. Initiative Network partners are increasing Protective
Factors within the families that they serve. Families continue to access help from the SF Initiative
Network partners and other community organizations, and report improved self-help skills.

Findings Continued The SF Initiative has positively impacted the three
levers for change within the Network and the Commission but has been less able to impact the three levers countywide, with systems outside the Commission’s funding capacity.
Formative evaluation and increasingly, Network Meetings has helped Network partners implement the Protective Factors and Network partners routinely assist each other and programs outside of the Initiative to strengthen the Protective Factors with families they serve.

Conclusion A number of things have proven effective in the
past four years and should be acknowledged as strengths. Systems are in place to effectively train staff using
the online training system and more staff working with families with young children have completed Strengthening Families training than ever before in the county.
Tools such as the retrospective survey, BUILD Assessment, and program self-assessment have been useful in measuring impact and in identifying priorities to strengthen programs and systems.
Quarterly Network meetings foster collaboration and a peer learning environment.
Parent advisory teams are more evident and are used to evaluate program design and provide input into service delivery strategies.
Conclusion Continued More culturally and linguistically appropriate
resources and training are available than ever before.
ASQ’s, Parent Café’s and home visits have been successful in supporting parents, teaching them about child development and positive parenting while reducing isolation.
Parents have more opportunities to meet other parents and form networks of support.
More programs serving children in Butte County are aware of and implementing the Strengthening Families Framework.
Conclusion Continued Opportunities exist to expand the Strengthening
Families Initiative and make it sustainable countywide. Partner with agencies that promote financial stability to
help families learn, earn, save, invest and protect financial resources, which has been an ongoing concern for the majority of families served in the Initiative.
Encourage Network Partners to deepen their relationships with parent advisory groups by soliciting their input in staff hiring and training.
Engage leaders throughout the county to steer a Strengthening Families effort that goes beyond programs that receive First 5 funding.

Conclusion Continued Link other Commission Initiatives to Strengthening Families
in a more meaningful way as visually depicted in the Commission’s strategic plan.
Ensure that First 5 data systems can produce meaningful reports for Network partners to tell their story and seek funding from sources beyond First 5.

Evaluation Approach
Processes Outcomes
• Site visits
• Technical Assistance
• Quarterly Network Meetings
• Strengthening Families Program Self-Assessment
• Training Evaluation
• First 5ERS
• Family Support Outcomes Protective Factors Survey
• Ages & Stages Questionnaire
Changes in the 2014-15 Methodology New Evaluation Components
Information from the CSCC pilot project
Self-assessment results
Changes in Emphasis of Evaluations Components The 2014-15 report had more focus on the agency self-
assessments and more focus on their progress in addressing areas in the evaluation report that were included as recommendations and didn’t report on the BUILD Assessment, which had been utilized three times previously.

Changes in the 2014-15 Methodology Cont. Evaluation Components Consistent Between Reports
A comparison of SF participant demographics to the county as a whole
Retrospective Protective Factors Survey (PFS) results
Administration of the Ages & Stages Questionnaire (ASQ) by Network partners
SF Initiative Network meeting milestones

Limitations SF PFS surveys are not a true random sample Lack of control group SF Initiative Network Service Partner Variables Survey administration Generalization of Initiative results countywide based
on program participants
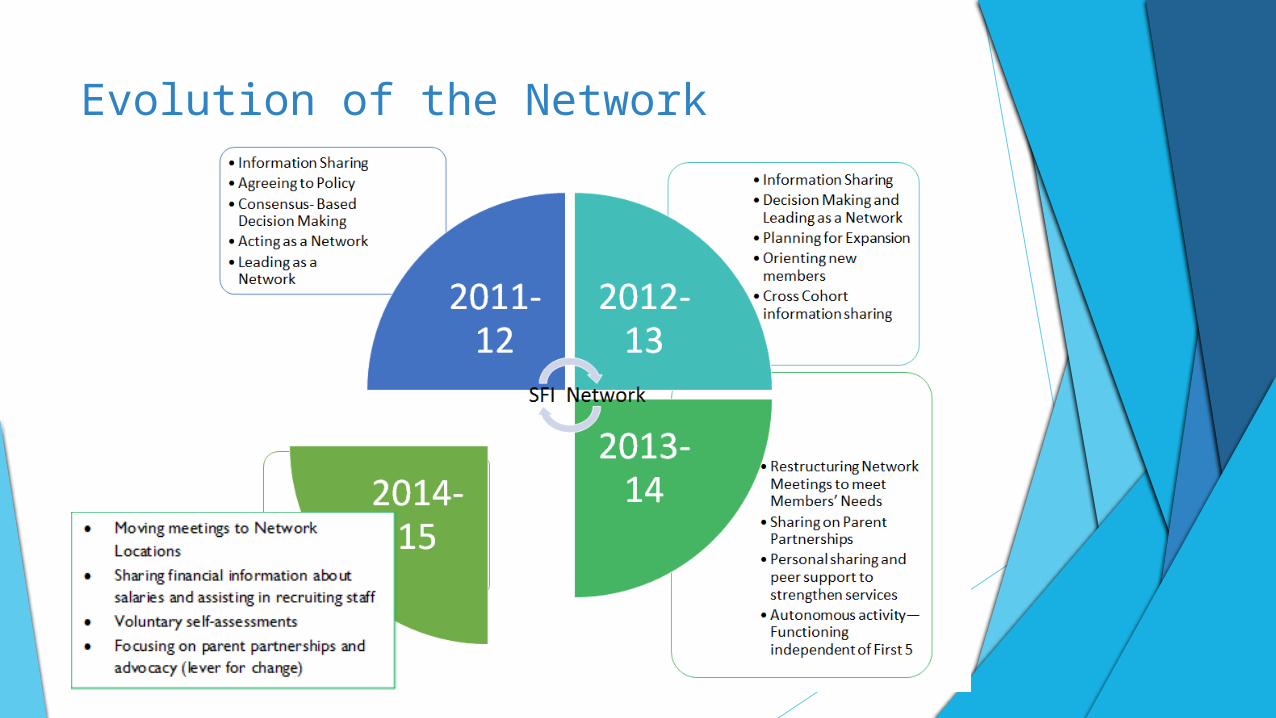
Evolution of the Network

Self-Assessments and Milestones The self-assessments were organized around seven
program strategies. Questions within each strategy were answered using the following rating descriptions: strongly agree, agree, neither agree nor disagree, disagree, strongly disagree, or not applicable. The seven strategies are:1) Facilitate Friendships and Mutual Support
2) Strengthen Parenting
3) Respond to Family Crises
4) Link Families to Services and Opportunities
5) Facilitate Children’s Social and Emotional Development
6) Observe and Respond to Early Warning Sign of Child Abuse or Neglect
7) Value and Support Parents

Self Assessment Results Four programs re-administered the self-assessment
in 2015 to identify changes between the initial assessment and the current assessment period: Butte Baby Steps Parents as Teachers – Thermalito Valley Oak Children’s Services, and Paradise Ridge
Initial assessment: a total of 25 respondents from the four agencies participated in the survey
2015: 43 respondents

Self Assessment Results Continued
Strategy 1 (n=1,076)
Strategy 2 (n=2,005)
Strategy 3 (n=1,435)
Strategy 4 (n=960)
Strategy 5 (n=918)
Strategy 6 (n=918)
Strategy 7 (n=1,523)
0.0%
10.0%
20.0%
30.0%
40.0%
50.0%
60.0%
70.0%
80.0%
90.0%
100.0%
77.1% 79.8% 83.1%78.7%
70.2%
56.0%
71.9%
8.4% 5.6% 4.7% 5.3% 7.1%12.1% 9.3%
Agreement vs Disagreement by Strategy: 2015
Agreed Disagreed
Strategy
Description
Strategy 1
Facilitate Friendships and Mutual Support
Strategy 2
Strengthen Parenting
Strategy 3
Respond to Family Crises
Strategy 4
Link Families to Services and Opportunities
Strategy 5
Facilitate Children’s Social and Emotional Development
Strategy 6
Recognize and Respond to Early Warning Signs of Child Abuse or Neglect
Strategy 7
Values and Support Parents

Self Assessment Results Continued
Strategy 1Prev: (n=611)
2015: (n=1,076)
Strategy 2Prev: (n=1,232)2015: (n=2,005)
Strategy 3Prev: (n=902)
2015: (n=1,435)
Strategy 4Prev: (n=584)2015: (n=935)
Strategy 5Prev: (n=596)2015: (n=960)
Strategy 6Prev: (n=443)2015: (n=918)
Strategy 7Prev: (n=872)
2015: (n=1,523)
0.0%10.0%20.0%30.0%40.0%50.0%60.0%70.0%80.0%90.0%
100.0%
42.2% 63.8% 75.8% 62.2% 60.4% 55.8% 50.6%
77.1% 79.8% 83.1% 78.7%70.2%
56.0%
71.9%
Agreement Comparison by Strategy
Previous 2015
Strategy
Description
Strategy 1
Facilitate Friendships and Mutual Support
Strategy 2
Strengthen Parenting
Strategy 3
Respond to Family Crises
Strategy 4
Link Families to Services and Opportunities
Strategy 5
Facilitate Children’s Social and Emotional Development
Strategy 6
Recognize and Respond to Early Warning Signs of Child Abuse or Neglect
Strategy 7
Values and Support Parents

Self Assessment Results Continued
Strategy 1Prev: (n=611)
2015: (n=1,076)
Strategy 2Prev: (n=1,232)2015: (n=2,005)
Strategy 3Prev: (n=902)
2015: (n=1,435)
Strategy 4Prev: (n=584)2015: (n=935)
Strategy 5Prev: (n=596)2015: (n=960)
Strategy 6Prev: (n=443)2015: (n=918)
Strategy 7Prev: (n=872)
2015: (n=1,523)
0.0%10.0%20.0%30.0%40.0%50.0%60.0%70.0%80.0%90.0%
100.0%
41.2%
16.6%10.2%
16.1% 14.9% 15.6%23.5%
8.4% 5.6% 4.7% 5.3% 7.1% 12.1% 9.3%
Disagreement Comparison by Strategy
Previous 2015
Strategy
Description
Strategy 1
Facilitate Friendships and Mutual Support
Strategy 2
Strengthen Parenting
Strategy 3
Respond to Family Crises
Strategy 4
Link Families to Services and Opportunities
Strategy 5
Facilitate Children’s Social and Emotional Development
Strategy 6
Recognize and Respond to Early Warning Signs of Child Abuse or Neglect
Strategy 7
Values and Support Parents

Self Assessment Results Continued Opportunities
Strategy 1: Facilitate Friendships and Mutual Support
Question 4b (n=34, 26.5% disagreement): The program provides opportunities for families to socialize and foster a sense of community through celebrations, graduations, and holidays.
Question 4d (n=42, 26.2% disagreement): The program provides opportunities for families to socialize and foster a sense of community through events celebrating cultural customs, potlucks, and other opportunities for parents to share and learn about each other’s home lives and cultural backgrounds.
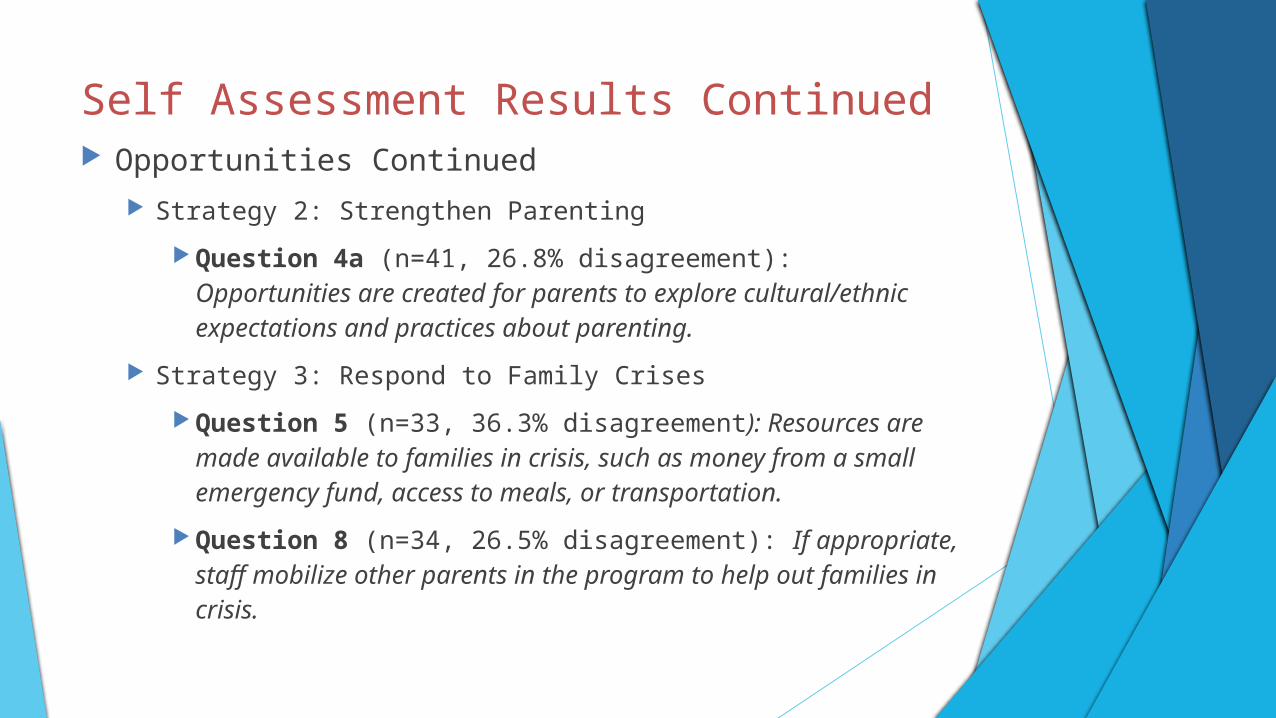
Self Assessment Results Continued Opportunities Continued
Strategy 2: Strengthen Parenting
Question 4a (n=41, 26.8% disagreement): Opportunities are created for parents to explore cultural/ethnic expectations and practices about parenting.
Strategy 3: Respond to Family Crises
Question 5 (n=33, 36.3% disagreement): Resources are made available to families in crisis, such as money from a small emergency fund, access to meals, or transportation.
Question 8 (n=34, 26.5% disagreement): If appropriate, staff mobilize other parents in the program to help out families in crisis.

Self Assessment Results Continued Opportunities Continued
Strategy 4: Link Families to Services and Opportunities
There were no questions that had over 20 percent disagreement in strategy 4.
Strategy 5: Facilitate Children’s Social and Emotional Development
Question 2e (n=35, 25.7% disagreement): Staff receive training on sensory awareness and integration.

Self Assessment Results Continued Opportunities Continued
Strategy 6: Recognize and Respond to Early Warning Signs of Child Abuse or Neglect
Question 1b (n=30, 33.3% disagreement): When parents enter the program they are informed of what constitutes abuse and neglect within the state.
Question 1c (n=31, 25.8% disagreement): When parents enter the program they are informed of the program’s protocols regarding child abuse and neglect.
Question 5 (n=34, 35.3% disagreement): All staff are trained on the impact of loss and trauma on children and how to respond appropriately.

Self Assessment Results Continued Opportunities Continued
Strategy 7: Value and Support Parents
Question 19d (n=32, 43.7% disagreement): The program provides parents opportunities for input into staff hiring and training.

Parent Satisfaction Comments What helped you the most in this program?
“The ability to ask for advice and also just someone who understands you and your struggles in life and helps you by explaining their own life experience.”
“That they learn new things. It helps me to better communicate with my children. We do new activities and my children are more attentive. I like it a lot.”
“That the teacher encouraged my daughter to eat better, to develop her mind. Learning new things that would help her in her development.”
“The additional resources and extra support (moral) I received from the program greatly reduced my stress.”
“Encouragement from others, support systems when in need, and positive reinforcement when making decisions!”
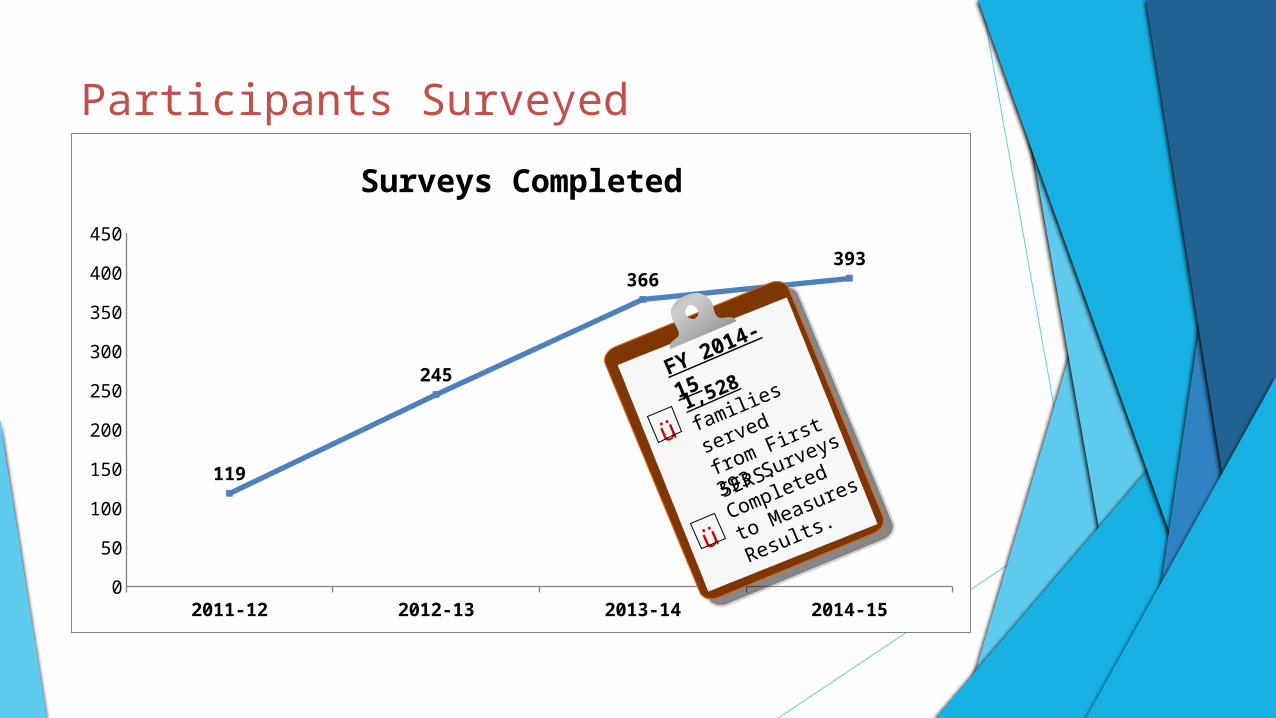
Participants Surveyed
2011-12 2012-13 2013-14 2014-150
50
100
150
200
250
300
350
400
450
119
245
366393
Surveys Completed
1,528 families
served from
First 5ERS.ü
ü
393 Surveys
Completed to
Measures
Results.
FY 2014-15
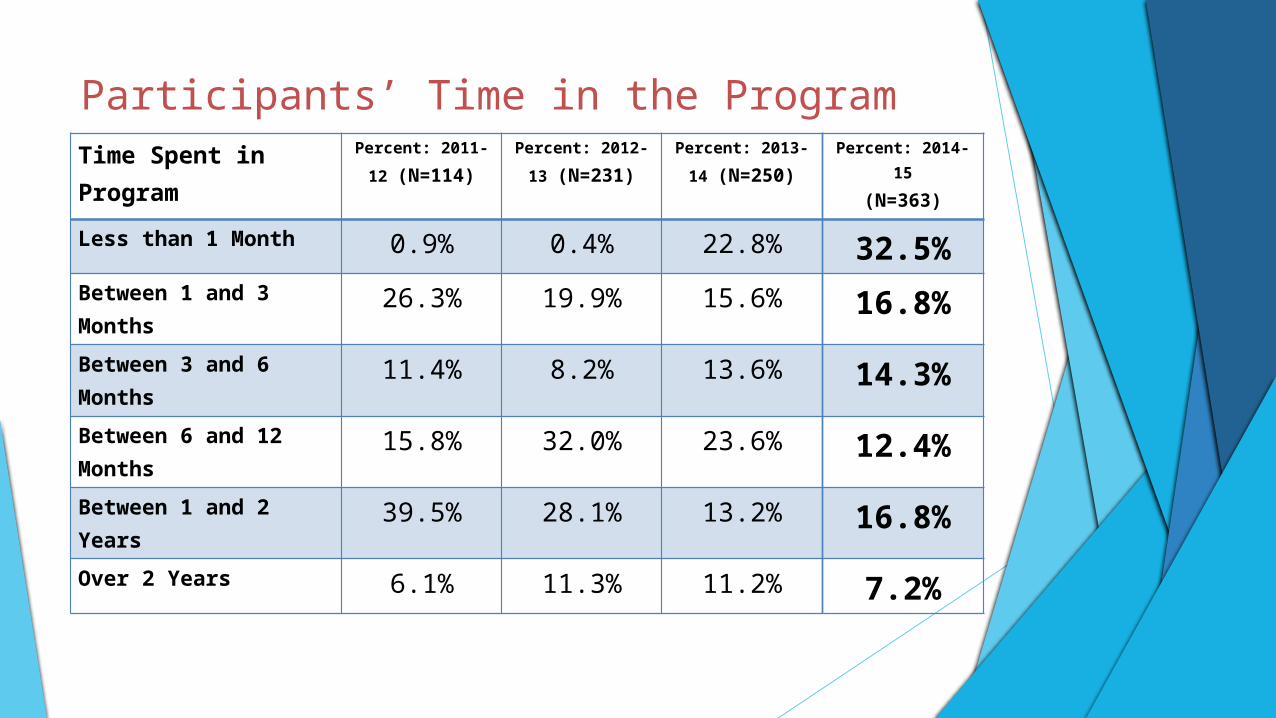
Participants’ Time in the ProgramTime Spent in Program Percent: 2011-12
(N=114)Percent: 2012-13
(N=231)Percent: 2013-14
(N=250)Percent: 2014-15
(N=363)
Less than 1 Month 0.9% 0.4% 22.8% 32.5%
Between 1 and 3 Months 26.3% 19.9% 15.6% 16.8%
Between 3 and 6 Months 11.4% 8.2% 13.6% 14.3%
Between 6 and 12 Months 15.8% 32.0% 23.6% 12.4%
Between 1 and 2 Years 39.5% 28.1% 13.2% 16.8%
Over 2 Years 6.1% 11.3% 11.2% 7.2%
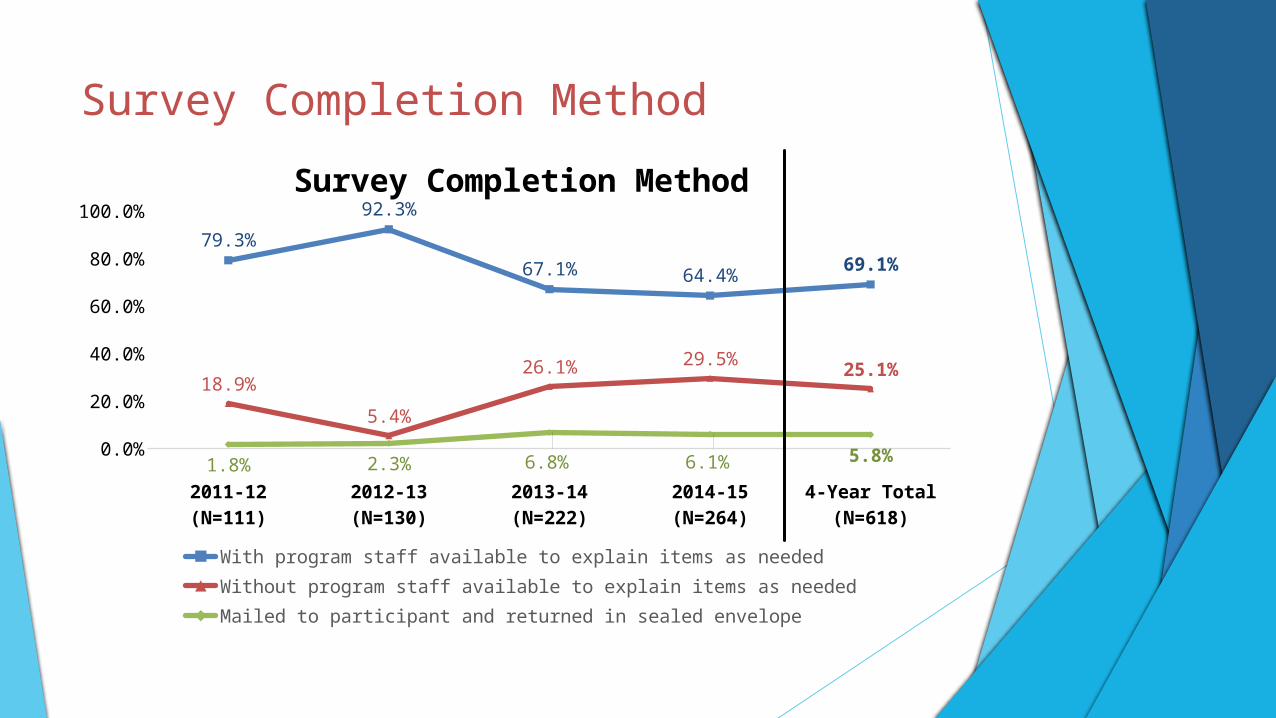
Survey Completion Method
2011-12 (N=111) 2012-13 (N=130) 2013-14 (N=222) 2014-15 (N=264) 4-Year Total (N=618)
0.0%10.0%20.0%30.0%40.0%50.0%60.0%70.0%80.0%90.0%
100.0%
79.3%
92.3%
67.1% 64.4% 69.1%
18.9%
5.4%
26.1% 29.5% 25.1%
1.8% 2.3% 6.8% 6.1% 5.8%
Survey Completion Method
With program staff available to explain items as neededWithout program staff available to explain items as neededMailed to participant and returned in sealed envelope

Language PFS Surveys were Administered
2011-12 (N=68) 2012-13 (N=141) 2013-14 (N=155) 2014-15 (N=218) 4-Year Total (N=544)
0.0%
10.0%
20.0%
30.0%
40.0%
50.0%
60.0%
70.0%
80.0%
90.0%
100.0%
73.5% 73.8%
83.9%89.4%
83.1%
8.8% 2.8% 7.7% 4.6% 4.6%
17.6%23.4%
8.4% 6.0%12.3%
Survey Language
English Hmong Spanish

Participant Gender
2011-12 (N=114) 2012-13 (N=235) 2013-14 (N=341) 2014-15 (N=363) 4-Year total (N=544)
0.0%
10.0%
20.0%
30.0%
40.0%
50.0%
60.0%
70.0%
80.0%
90.0%79.8% 79.6%
83.0%
73.0%76.6%
20.2% 20.4%17.0%
27.0%23.4%
Participant Gender
Female Male
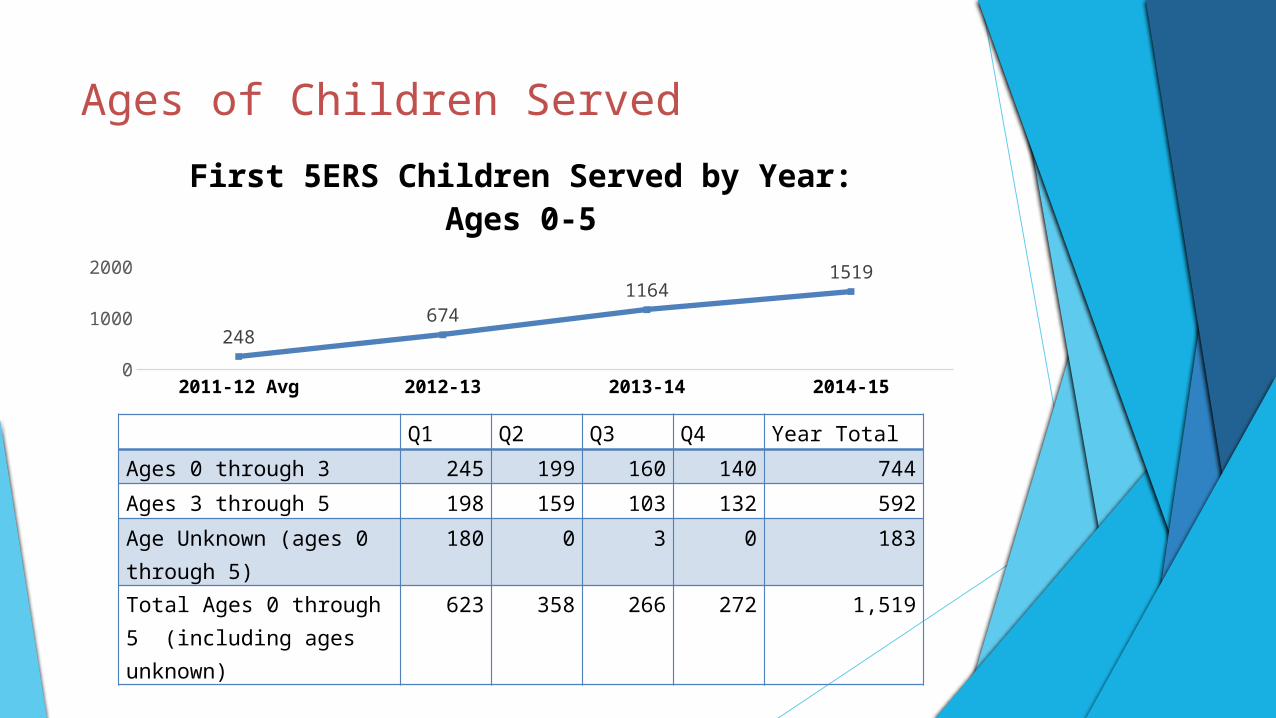
Ages of Children Served
Q1 Q2 Q3 Q4 Year Total
Ages 0 through 3 245 199 160 140 744
Ages 3 through 5 198 159 103 132 592
Age Unknown (ages 0 through 5)
180 0 3 0 183
Total Ages 0 through 5 (including ages unknown)
623 358 266 272 1,519
2011-12 Avg 2012-13 2013-14 2014-150
200400600800
1000120014001600
248
674
1164
1519
First 5ERS Children Served by Year: Ages 0-5
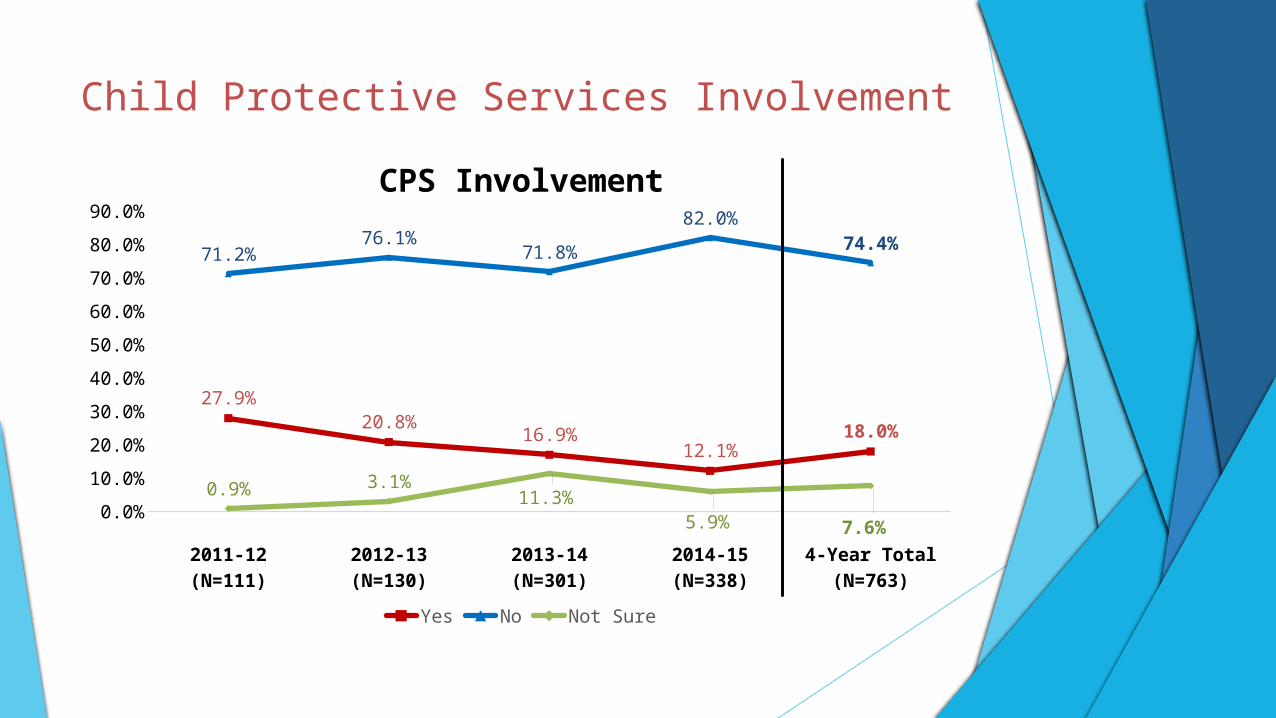
Child Protective Services Involvement
2011-12 (N=111) 2012-13 (N=130) 2013-14 (N=301) 2014-15 (N=338) 4-Year Total (N=763)
0.0%
10.0%
20.0%
30.0%
40.0%
50.0%
60.0%
70.0%
80.0%
90.0%
27.9%20.8%
16.9%12.1%
18.0%
71.2%76.1%
71.8%
82.0%74.4%
0.9% 3.1%11.3%
5.9% 7.6%
CPS Involvement
Yes No Not Sure

Family Income
$0 - $10,000 $10,001 - $20,000
$20,001 - $30,000
$30,001 - $40,000
$40,001 - $50,000
$50,001+0.0%
5.0%
10.0%
15.0%
20.0%
25.0%
30.0%
35.0%
40.0%
45.0%
50.0%
37.3%
22.7%
13.0%
7.8% 6.2%
13.0%
43.3%
22.8%
13.4%
8.0%
4.0%
8.5%
Family Income
2014-15 (N=370) 4-Year Total (N=923)
2009 - 2013 Butte County Median Household Income: $43,752

Education Attainment
2011-12 (N=113) 2012-13 (N=218) 2013-14 (N=334) 2014-15 (N=356) 4-Year Total (N=890)
0.0%
10.0%
20.0%
30.0%
40.0%
50.0%
60.0%
70.0%
64.6%
32.6%21.3%
18.8%24.6%
22.1%32.6%
25.1% 27.2% 27.4%
13.3%
34.9%
53.6% 53.9%48.0%
Education Comparison by Year
Fewer than 12 HS Diploma or equivalent More than 12

ASQ: Children Screened
Butte Baby Steps32.2%
PAT - Thermalito9.0%
PEER - Chico6.2%
PEER - Oroville7.9%
Teenage Parenting and Pregnancy Program (TAPP)
31.1%
Paradise Ridge13.6%
Children Screened: (N=177)
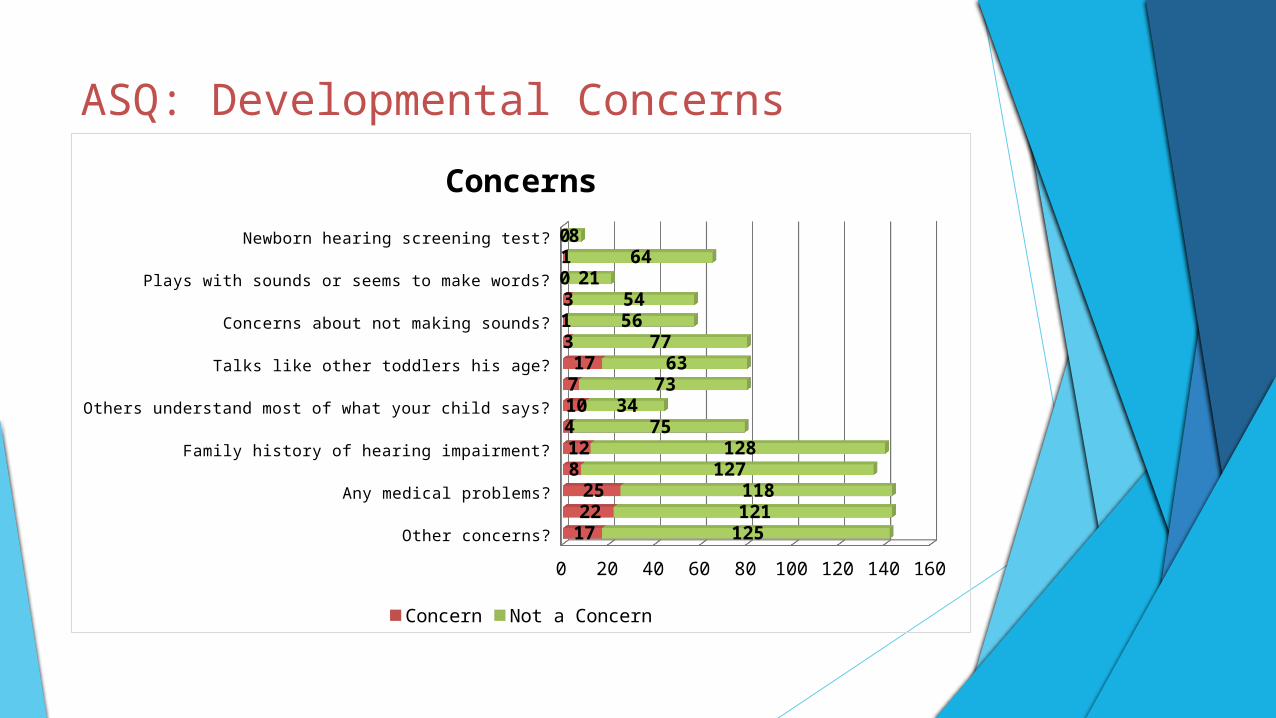
ASQ: Developmental Concerns
Newborn hearing screening test?Move both hands and legs equally well?
Plays with sounds or seems to make words?Feet are flat on the surface most of the time?
Concerns about not making sounds?Hears well?
Talks like other toddlers his age?Understand most of what your child says?
Others understand most of what your child says?Walks, runs, and climbs like other toddlers?
Family history of hearing impairment?Concerns about vision?Any medical problems?
Concerns about behavior?Other concerns?
0 20 40 60 80 100 120 140 160
010313
17710
4128
2522
17
864
215456
7763
7334
75128
127118
121125
Concerns
Concern Not a Concern

ASQ: Developmental Concerns Continued Most identified concerns
Medical problems Concerns about behaviors Talks like other kids his/her age
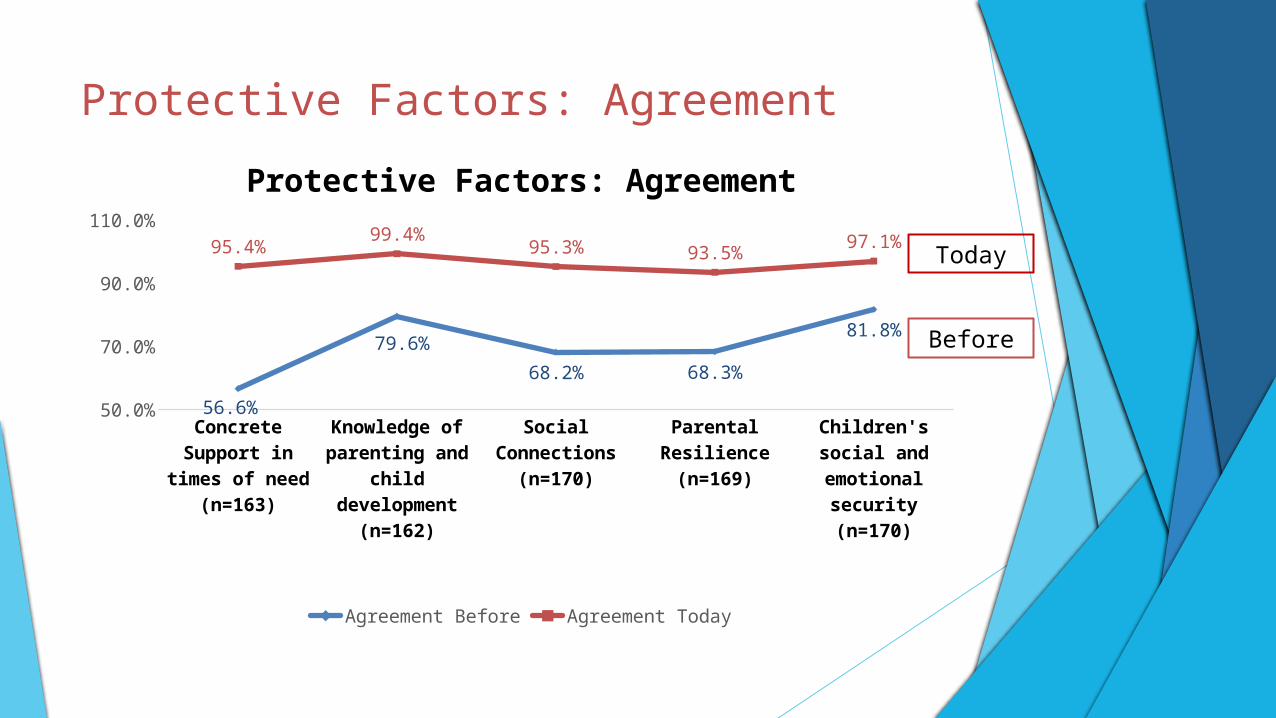
Protective Factors: Agreement
50.0%
70.0%
90.0%
110.0%
56.6%
79.6%68.2% 68.3%
81.8%
95.4% 99.4% 95.3% 93.5% 97.1%
Protective Factors: Agreement
Agreement Before Agreement Today
Today
Before

Protective Factors
2011-12(N=114-118)
2012-13(N=234-240)
2013-14(N=176-192)
2014-15(N=170-179)
4-Year Total(N=578-593)
86.0%
88.0%
90.0%
92.0%
94.0%
96.0%
98.0%
100.0%
96.2% 95.8%
90.8%
94.2% 94.4%
Protective Factor: Concrete Support in Times of Need

Protective Factors
2011-12(N=114-118)
2012-13(N=234-240)
2013-14(N=176-192)
2014-15(N=170-179)
4-Year Total(N=578-593)
95.0%
95.5%
96.0%
96.5%
97.0%
97.5%
98.0%
98.5%
99.0%
99.5%
100.0%
98.3%98.7%
97.0%
98.5%
97.7%
Protective Factor: Knowledge of Parenting and Child Development

Protective Factors
2011-12(N=114-118)
2012-13(N=234-240)
2013-14(N=176-192)
2014-15(N=170-179)
4-Year Total(N=578-593)
90.0%
91.0%
92.0%
93.0%
94.0%
95.0%
96.0%
97.0%
98.0%
99.0%
100.0%
98.3%97.9%
94.1%93.4%
95.6%
Protective Factor: Social Connections

Protective Factors
2011-12(N=114-118)
2012-13(N=234-240)
2013-14(N=176-192)
2014-15(N=170-179)
4-Year Total(N=578-593)
88.0%
90.0%
92.0%
94.0%
96.0%
98.0%
100.0%
93.9%
95.9%
93.1%92.2%
94.1%
Protective Factor: Parental Resilience

Protective Factors
2011-12(N=114-118)
2012-13(N=234-240)
2013-14(N=176-192)
2014-15(N=170-179)
4-Year Total(N=578-593)
93.0%
94.0%
95.0%
96.0%
97.0%
98.0%
99.0%
100.0%
95.6%
98.8%
98.0%
97.1% 97.3%
Protective Factor: Children's Social and Emotional Security

Parent/Couples Cafés: Participants Served
2013-14 2014-15 2-Year Total0
50
100
150
200
250
300
350
400
450
369 377
219 230
409
Parent/Couples Café Participants Served
First 5ERS - Participants Served between VOCS and Paradise RidgeUnique Participants Surveyed
Participants Surveyed
First 5ERS
A total of 14 surveys, in 2014-15, were Couples Café Participants

Parent Cafés: Positive Changes
2013-14 (N=49) 2014-15 (N=79) 2-Year Total (N=112)90.0%
91.0%
92.0%
93.0%
94.0%
95.0%
96.0%
97.0%
98.0%
99.0%
100.0%
98.0%97.5% 97.3%
Parent Café Resulting in Positive Family/Life Changes
*All respondents who answered this question were part of Valley Oak Children’s Services’ Parent Cafés.
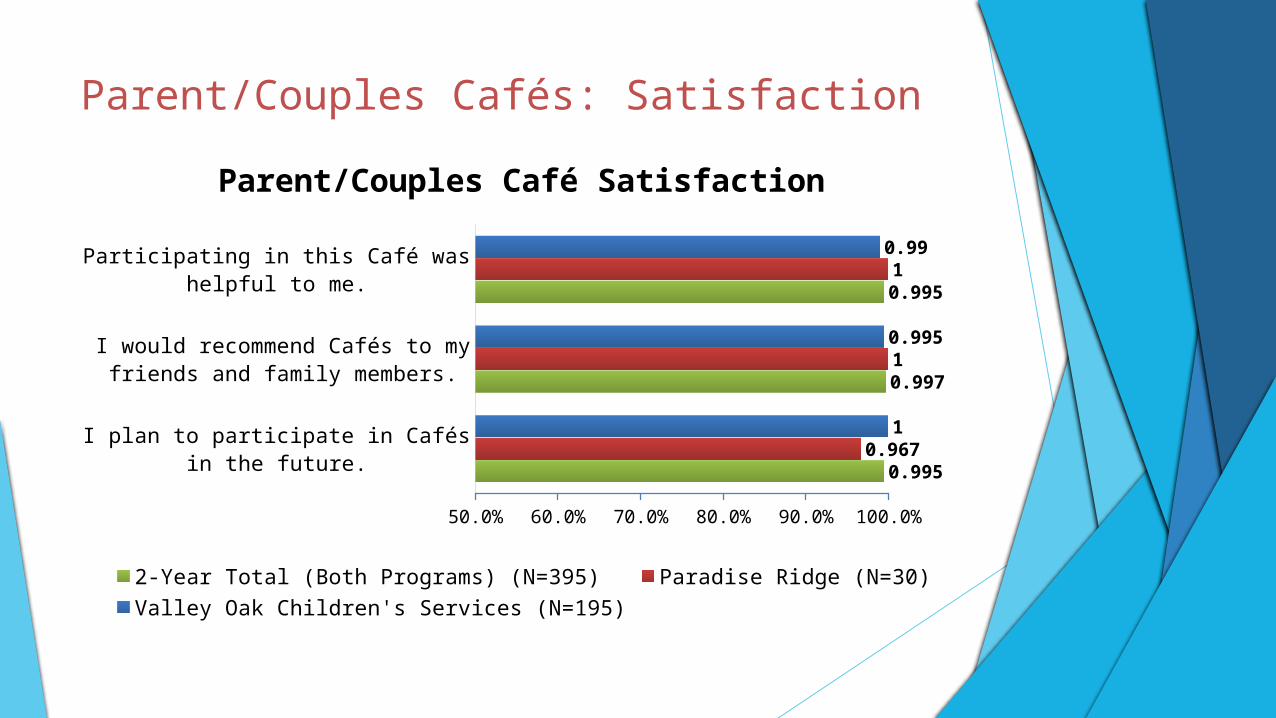
Parent/Couples Cafés: Satisfaction
Participating in this Café was helpful to me.
I would recommend Cafés to my friends and family members.
I plan to participate in Cafés in the future.
50.0% 60.0% 70.0% 80.0% 90.0% 100.0%
0.99
0.995
1
1
1
0.967
0.995
0.997
0.995
Parent/Couples Café Satisfaction
2-Year Total (Both Programs) (N=395) Paradise Ridge (N=30)Valley Oak Children's Services (N=195)

Satisfaction Questions
Change was statistically significant for each question.
A t-test confirms that the change on Questions 1-7 was “significant at a p<.01 level.”

Ability to Meet Family Needs with Available Resources
Strongly Disagree
2 3 4 5 6 Strongly Agree
0.0%
10.0%
20.0%
30.0%
40.0%
50.0%
60.0%
70.0%
6.4% 6.4% 7.0%13.5% 12.9%
15.8%
38.0%
1.8% 0.6% 0.6% 5.8%7.0%
20.5%
63.7%N = 171
Before Today
“I know how to meet my family’s needs with the money and resources I have.”

Participant Choices for Reducing Family Stress
Strongly Disagree
2 3 4 5 6 Strongly Agree
0.0%
10.0%
20.0%
30.0%
40.0%
50.0%
60.0%
70.0%
6.6% 4.2% 6.0%
13.2%16.2%
19.8%
34.1%
0.6% 0.0% 1.2% 2.4%
13.2%
24.6%
58.1%
N = 167
Before Today
“I make choices about family schedules and activities that reduce family stress”

Respect from Staff
Strongly Disagree
Disagree Slightly Disagree
Neutral Slightly Agree Agree Strongly Agree
0
20
40
60
80
100
120
140
160
180
1 0 0 1 4 13 160
0.6%
0.0% 0.0%
0.6% 2.2% 7.3%
89.4%
Perceived Respect from Staff (N=179)
Suggestions for Improvement Services
A desire for more home visiting, more frequent sessions, longer sessions and sessions conducted in the language of origin (Hmong) were all suggestions made for program improvement. As had been the case in previous years, participants also asked to not be limited to participation in TAPP to age 19 but to extend the age to 21.
Activities Parents asked for more activities and events, noting how
much they enjoy those that are offered.

Suggestions for Improvement Continued A significant majority of participants indicated
that they value and are satisfied with Network services.
Those participants that were part of SF Network programs that will not be funded in the future indicated their sadness and sense of loss that the programming would end.
Survey results across the four years of the evaluation have consistently demonstrated the impact that the funded programs have had on families, building the Protective Factors in those they have served.

Suggestions for Improvement Continued As the Initiative continues, it is clear the foundation has
been laid for continued positive results. The challenge of the future is more systemic in
nature. At the systems level, the opportunity exists to
engage other service providers and leaders in implementing the Strengthening Families Framework.
For families, the ongoing challenge has been to attain the resources they need to move out of crisis toward stability.
Exploring strategies that have been proven to help families achieve financial stability may be of value in addressing this challenge.

Recommendations Tremendous gains have been made in implementing
the Strengthening Families Framework and Initiative. For 2015-16, the following recommendations could strengthen the Initiative, moving it to more of a countywide effort.
Strengthen Parent Partnerships: Continue to support existing and evaluate ways to develop new parent directed partnerships, including engaging parents in staff hiring and training activities
Support Fatherhood Programs: Continue to support father-friendly practices, father-centered services, and emerging fatherhood programs and coalitions.
Support County-wide Implementation: Evaluate and if feasible, convene a leadership group within the county to focus on policies and systems that promote Strengthening Families, potentially through the Systems Strengthening Initiative.
Engage Network Partners: Engage Network partners to train their peers on issues identified in the program self-assessments.

Commissioner Pause for Thought…