stress induced crystallization in elongational flo · 2008-11-28 · stress-induced crystallization...
TRANSCRIPT
F. H. M. Swartjes, G. W. M. Peters*, S. Rastogi, H. E. H. Meijer
Dutch Polymer Institute, Eindhoven University of Technology, Eindhoven, The Netherlands
Stress Induced Crystallization in Elongational Flow
Stress-induced crystallization is studied in an extensional flowdevice (a cross-slot flow cell) for an isotactic Polypropylene(iPP) by measuring the micro-structure that develops afterflow. Birefringence and Wide Angle X-ray experiments wereperformed. The birefringence experiments with flow below themelting temperature showed the occurrence of a fiber-likestructure around the outflow centerline and, later in time, of‘streamlines’. The latter are explained by the influence of sheargradients close to the optical windows. The WAXS experimentsalso showed the fiber-like structure around the outflow center-line, having orientations in the (110), (040) and (130) reflec-tions, with a width of about 80 lm. This dominance of the elon-gational flow around the stagnation line could not be observedin experiments with flow above and subsequent crystallizationbelow the melting temperature.
Structure development in this cell was numerically predictedusing the Leonov and the extended Pompom (XPP) model. Theoriented structures can be predicted. Moreover, process condi-tions are found with less influence of the (unwanted) shear gra-dients. Finally, it was concluded that the strain hardening be-havior in the Leonov model over-estimates the first componentof the Finger tensor, and thus the number of flow-induced nu-clei. Therefore it is recommended to use the extended Pompommodel as a more realistic basis for a quantitative flow-inducedcrystallization model.
1 Introduction
The properties of products made of semi-crystalline polymersdepend on both, molecular properties and the processing condi-tions applied. Therefore in order to predict properties, a firststep is to quantify the thermal-mechanical history experiencedby the polymer in e. g. injection moulding, film blowing or fi-ber spinning. The next step is to model nucleation and crystal-lization kinetics and flow-induced structure formation.
Deformation influences the orientation of polymer chainsand thus the resulting anisotropy of the crystals formed. Kellerand Kolnaar [1] showed that fiber-like structures (shish) arecreated, beyond a critical elongational rate, orienting the highend tail of the molecular weight distribution with the largestconfigurational relaxation time. The lower molecular weightparts relax faster during and after deformation and crystallize
as lamellae (kebab) nucleated by the fibers. Eder and Ja-neschitz-Kriegl [2] demonstrated that these structures are notonly observed in (strong, irrotational) elongational flows, butalso can be found in shear flows with high enough viscoelasticstresses. Shish-kebab structures were found in many polymermaterials, like PE [1], iPP [2], PA6 [3] and PB [4]. They havean important influence on properties like warpage, anisotropicshrinkage, and even toughness (Schrauwen et al. [5]). Tas [6]observed that in the film blowing process, mechanical proper-ties of different LDPE’s correlate surprisingly well with theviscoelastic stress at the crystallization line, much more thanwith macroscopic strain or strain rate, leading to the conclusionthat chain orientation/extension is the governing phenomenon(see also Meijer [7]).
Chain extension can most easily be achieved in stagnationflows, see Schoonen [8] for an overview. Examples of theseflows include the two roll mill, Frank and Mackley [9], Geffroyand Leal [10], the four roll mill, Crowley et al. [11], Dunlapand Leal [12], McHugh et al. [13], the (lubricated) convergingflow with a free stagnation point, van Aken and Janeschitz-Kriegl [14], Macosko et al. [15], the cross-slot device, Gardneret al. [16], Miles and Keller [17] and the opposed jets device,Janeschitz-Kriegl et al. [18], Keller et al. [19], Mackay et al.[20]. The basic principle of a stagnation flow is, in all cases,the same: two liquid streams are impinged. A free stagnationpoint is created in the center where the extensional strain canbecome very high.
In this study a cross-slot flow cell is used to investigatestress-induced crystallization in a melt (isotactic Polypropy-lene). The cell was designed to be operated in the in-situX-ray facilities at the European Synchrotron Radiation Facility(ESRF) in Grenoble, France, and a numerical tool was devel-oped to predict the resulting structure in this cell. The samegeometry was also used by Gardner et al. [16], Miles and Kel-ler [17], to investigate coil-stretch transitions in polymer solu-tions.
2 Measurement of Flow-induced Crystallization
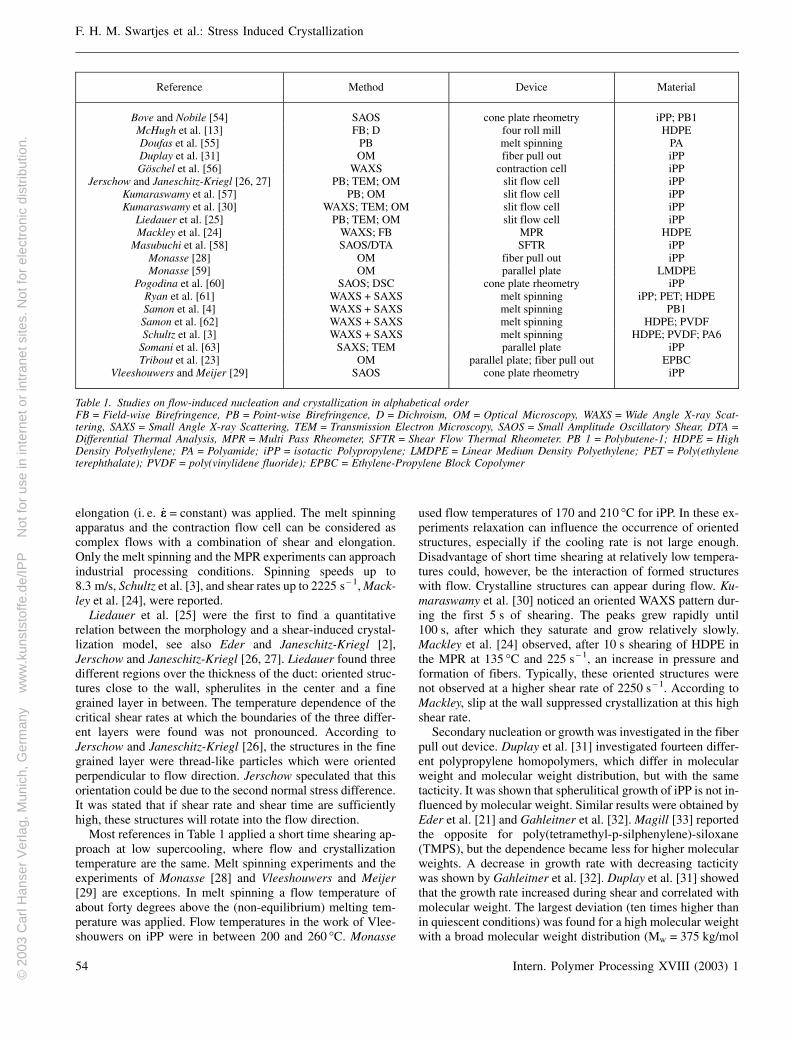
Reviews on flow-induced crystallization can be found in Ederet al. [21], McHugh [22] and Tribout et al. [23]. Here, we willfocus on measurements and limit the review to work of the lastdecennium. About eight different experimental devices wereused to measure flow-induced nucleation and crystallization(see Table 1). Shear flow was generated with the fiber pull outdevice, between sliding plates, in slits, in the Multi Pass Rhe-ometer (MPR) and in shear or stress controlled rheometers.The four roll mill was the only device in which (local) pure
IPP_ipp1719 – 2.4.03/druckhaus köthen
FIBER AND FILM
Intern. Polymer Processing XVIII (2003) 1 Hanser Publishers, Munich 53
* Mail address: G. W. M. Peters, Eindhoven University of Technol-ogy, Dutch Polymer Institute, P. O. Box 513, 5600 MB Eindhoven,The Netherlands
© 2
003
Car
l Han
ser
Ver
lag,
Mun
ich,
Ger
man
y
ww
w.k
unst
stof
fe.d
e/IP
P
Not
for
use
in in
tern
et o
r in
tran
et s
ites.
Not
for
elec
tron
ic d
istr
ibut
ion.
IPP_ipp1719 – 2.4.03/druckhaus köthen
F. H. M. Swartjes et al.: Stress Induced Crystallization
elongation (i. e. _ee = constant) was applied. The melt spinningapparatus and the contraction flow cell can be considered ascomplex flows with a combination of shear and elongation.Only the melt spinning and the MPR experiments can approachindustrial processing conditions. Spinning speeds up to8.3 m/s, Schultz et al. [3], and shear rates up to 2225 s – 1, Mack-ley et al. [24], were reported.
Liedauer et al. [25] were the first to find a quantitativerelation between the morphology and a shear-induced crystal-lization model, see also Eder and Janeschitz-Kriegl [2],Jerschow and Janeschitz-Kriegl [26, 27]. Liedauer found threedifferent regions over the thickness of the duct: oriented struc-tures close to the wall, spherulites in the center and a finegrained layer in between. The temperature dependence of thecritical shear rates at which the boundaries of the three differ-ent layers were found was not pronounced. According toJerschow and Janeschitz-Kriegl [26], the structures in the finegrained layer were thread-like particles which were orientedperpendicular to flow direction. Jerschow speculated that thisorientation could be due to the second normal stress difference.It was stated that if shear rate and shear time are sufficientlyhigh, these structures will rotate into the flow direction.
Most references in Table 1 applied a short time shearing ap-proach at low supercooling, where flow and crystallizationtemperature are the same. Melt spinning experiments and theexperiments of Monasse [28] and Vleeshouwers and Meijer[29] are exceptions. In melt spinning a flow temperature ofabout forty degrees above the (non-equilibrium) melting tem-perature was applied. Flow temperatures in the work of Vlee-shouwers on iPP were in between 200 and 260 °C. Monasse
used flow temperatures of 170 and 210 °C for iPP. In these ex-periments relaxation can influence the occurrence of orientedstructures, especially if the cooling rate is not large enough.Disadvantage of short time shearing at relatively low tempera-tures could, however, be the interaction of formed structureswith flow. Crystalline structures can appear during flow. Ku-maraswamy et al. [30] noticed an oriented WAXS pattern dur-ing the first 5 s of shearing. The peaks grew rapidly until100 s, after which they saturate and grow relatively slowly.Mackley et al. [24] observed, after 10 s shearing of HDPE inthe MPR at 135 °C and 225 s – 1, an increase in pressure andformation of fibers. Typically, these oriented structures werenot observed at a higher shear rate of 2250 s – 1. According toMackley, slip at the wall suppressed crystallization at this highshear rate.
Secondary nucleation or growth was investigated in the fiberpull out device. Duplay et al. [31] investigated fourteen differ-ent polypropylene homopolymers, which differ in molecularweight and molecular weight distribution, but with the sametacticity. It was shown that spherulitical growth of iPP is not in-fluenced by molecular weight. Similar results were obtained byEder et al. [21] and Gahleitner et al. [32]. Magill [33] reportedthe opposite for poly(tetramethyl-p-silphenylene)-siloxane(TMPS), but the dependence became less for higher molecularweights. A decrease in growth rate with decreasing tacticitywas shown by Gahleitner et al. [32]. Duplay et al. [31] showedthat the growth rate increased during shear and correlated withmolecular weight. The largest deviation (ten times higher thanin quiescent conditions) was found for a high molecular weightwith a broad molecular weight distribution (Mw = 375 kg/mol
54 Intern. Polymer Processing XVIII (2003) 1
Reference Method Device Material
Bove and Nobile [54] SAOS cone plate rheometry iPP; PB1McHugh et al. [13] FB; D four roll mill HDPEDoufas et al. [55] PB melt spinning PADuplay et al. [31] OM fiber pull out iPPGöschel et al. [56] WAXS contraction cell iPP
Jerschow and Janeschitz-Kriegl [26, 27] PB; TEM; OM slit flow cell iPPKumaraswamy et al. [57] PB; OM slit flow cell iPPKumaraswamy et al. [30] WAXS; TEM; OM slit flow cell iPP
Liedauer et al. [25] PB; TEM; OM slit flow cell iPPMackley et al. [24] WAXS; FB MPR HDPE
Masubuchi et al. [58] SAOS/DTA SFTR iPPMonasse [28] OM fiber pull out iPPMonasse [59] OM parallel plate LMDPE
Pogodina et al. [60] SAOS; DSC cone plate rheometry iPPRyan et al. [61] WAXS + SAXS melt spinning iPP; PET; HDPESamon et al. [4] WAXS + SAXS melt spinning PB1Samon et al. [62] WAXS + SAXS melt spinning HDPE; PVDFSchultz et al. [3] WAXS + SAXS melt spinning HDPE; PVDF; PA6
Somani et al. [63] SAXS; TEM parallel plate iPPTribout et al. [23] OM parallel plate; fiber pull out EPBC
Vleeshouwers and Meijer [29] SAOS cone plate rheometry iPP
Table 1. Studies on flow-induced nucleation and crystallization in alphabetical orderFB = Field-wise Birefringence, PB = Point-wise Birefringence, D = Dichroism, OM = Optical Microscopy, WAXS = Wide Angle X-ray Scat-tering, SAXS = Small Angle X-ray Scattering, TEM = Transmission Electron Microscopy, SAOS = Small Amplitude Oscillatory Shear, DTA =Differential Thermal Analysis, MPR = Multi Pass Rheometer, SFTR = Shear Flow Thermal Rheometer. PB 1 = Polybutene-1; HDPE = HighDensity Polyethylene; PA = Polyamide; iPP = isotactic Polypropylene; LMDPE = Linear Medium Density Polyethylene; PET = Poly(ethyleneterephthalate); PVDF = poly(vinylidene fluoride); EPBC = Ethylene-Propylene Block Copolymer
© 2
003
Car
l Han
ser
Ver
lag,
Mun
ich,
Ger
man
y
ww
w.k
unst
stof
fe.d
e/IP
P
Not
for
use
in in
tern
et o
r in
tran
et s
ites.
Not
for
elec
tron
ic d
istr
ibut
ion.
and MWD = 3.2). Also Tribout et al. [23] showed a shear de-pendent growth rate. The growth rates during shear were aboutfive times, and after shear about 1.5 times, higher than in staticconditions, and increased linearly with increasing shear rate.Thus tacticity seems to be the most important molecular para-meter on growth rate in quiescent conditions at a constant tem-perature. Moreover, growth rate after shear depends slightly onthe deformation history while during shear it correlates withthe molecular weight.
McHugh et al. [13] investigated the extensional flow of anUHWPE droplet in a four roll mill using point-wise birefrin-gence and dichroism measurements on the outflow centerline.Flow birefringence showed an increase in orientation with dis-tance from the stagnation point. After cessation of flow, bire-fringence showed complete relaxation of the carrier phase,while birefringence of the droplet phase showed retention oforientation and development of crystallinity. The maximum inbirefringence intensity occurred on the outflow centerline andnot in the stagnation point. The time to obtain this maximumincreased for decreasing distance from the stagnation point. In-itial crystallization was seen to be a function of both orientationand strain. It was suggested that the viscoelastic molecularstrain due to flow orientation might be the controlling processfor enhancing crystallization.
Blundell et al. [34] and Mahendrasingam et al. [35] per-formed in-situ WAXS experiments at the micro-focus beam-lineof the ESRF on fast drawing of PET close to Tg. Three differentregimes were observed. In the first regime, corresponding to lowtemperatures and high draw rates, orientation was insensitive todraw rate and was mainly in drawing direction. The onset ofcrystallization was delayed until the end of deformation. In thethird regime, corresponding to high temperatures and low drawrates, no oriented structures were observed. In the second re-gime, corresponding to intermediate temperatures and drawrates, orientation decreased with increasing temperature and de-creasing draw rate, and was tilted with respect to the drawing di-rection. The tilting in the orientation was explained by the inter-action of the nuclei formed with the surrounding network. Theonset of crystallization could be seen before the end of drawing.The difference in onset in the first two regimes was ascribed tothe lack of freedom and mobility to organize chains into crystalsduring deformation at high deformation rates. The strain-in-duced crystallization rate was found to be insensitive to tempera-ture, and was explained by two counteracting processes. An in-crease in temperature reduces the crystallization rate as a resultof lower network orientation for a given deformation rate, thisis counteracted by the influence of increased molecular mobilityon crystallization kinetics.
One of the few studies on the influence of nucleation agentson flow-induced crystallization was by Jerschow and Ja-neschitz-Kriegl [27] using a slit flow. Nucleating agentsstrongly enhanced shear-induced crystallization. Thick, highlyoriented layers far into the core were found even for low mole-cular weight materials.
In this study, a cross-slot flow cell is used to investigatestress-induced crystallization in a complex flow with a strongelongational component. The main advantages of this confinedgeometry is the high attainable strain. Schoonen [8] comparedthe cross-slot flow with the flow around a cylinder and the con-traction flow, and concluded that the highest strain, combined
with constant strain rate is obtained in a sufficiently large areain the cross-slot flow geometry. Even higher strains can be ob-tained in fiber spinning experiments, but here both thermal anddeformation history are not well defined and, moreover, the ba-sically unknown deformation history in extruder and die couldbe of influence. A second advantage of the cross-slot flow de-vice is the wide range of materials that can be investigated. Nospecific material properties are necessary, like spinnability. Athird advantage of this flow geometry is the centered stagnationpoint, which is of practical use in the WAXS measurements (inshear flows part of the scattering is absorbed by the walls). Alast advantage is the compactness of the cell, which results incontrollable thermal gradients and thermal history.
3 Modeling Aspects
3.1 Constitutive Models for the Stress Tensor
In this study, three constitutive equations were used, one gener-alised Newtonian and two viscoelasic equations. The Carreau-Yasuda viscosity model was used to compute the three-dimen-sional velocity field in the cross-slot device:
s ¼ 2gD; g ¼ g0 1 þ kjII2Dj12
� �a� �n�1a; ð1Þ
with g0 the zero shear-rate viscosity, k the relaxation time, nthe power law parameter and II 2D the second invariant of thedeformation rate tensor D. The parameter a controls the transi-tion between the zero shear-rate and the power law region.
To compute the viscoelastic stress distribution in a de-coupled way, two non-linear models were used: the Leonovand the extended Pompom model. The Leonov model excel-lently captures the (non)-linear viscoelastic behavior in shearflows if multi modes are used; elongation is, however, less ac-curately described, see e. g. Larson [36]. The differential formof the Leonov model is given by (for one mode)
rsþ 1
ksþ 1
2Gks � s� 1
6GkIðsþGIÞ � G2IðsþGIÞ�1
h i|fflfflfflfflfflfflfflfflfflfflfflfflfflfflfflfflfflfflffl{zfflfflfflfflfflfflfflfflfflfflfflfflfflfflfflfflfflfflffl}
ðaÞ
ðsþ GIÞ ¼ 2GD:
(2)
The parameters can be determined by fitting linear viscoelasticdata only. For incompressible, planar deformations, part (a) ofEq. 2 is equal to zero (and the Giesekus model with α = 0.5 re-mains).
The Pompom model, McLeish and Larson [37], separatesstretch and orientation of a polymer molecule. The original ap-proximative differential model showed discontinuities in stea-dy state elongation and no second normal stress difference,which was shown to influence flow-induced crystallization,Jerschow and Janeschitz-Kriegl [26]. Verbeeten et al. [38] pro-posed an extended version of the Pompom model (XPP), whichimproved upon these two disadvantages. Excellent quantitativeagreement with measurements of branched (LDPE) and linearpolymers (HDPE) was found by using a multi mode version.
The differential equation of the XPP model is given by (forone mode)rsþ 1
kðsÞ � s ¼ 2GD; ð3Þ
IPP_ipp1719 – 2.4.03/druckhaus köthen
F. H. M. Swartjes et al.: Stress Induced Crystallization
Intern. Polymer Processing XVIII (2003) 1 55
© 2
003
Car
l Han
ser
Ver
lag,
Mun
ich,
Ger
man
y
ww
w.k
unst
stof
fe.d
e/IP
P
Not
for
use
in in
tern
et o
r in
tran
et s
ites.
Not
for
elec
tron
ic d
istr
ibut
ion.
IPP_ipp1719 – 2.4.03/druckhaus köthen
F. H. M. Swartjes et al.: Stress Induced Crystallization
with the relaxation tensor
1kðsÞ ¼
1k0b
�αGsþ 1
fðsÞ I þ G1
fðsÞ � 1
� �s�1
�ð4Þ
and the extra function
1k0bfðsÞ ¼
2ks
1 � 1K
� �þ 1
k0bK2 1 � αI s�s
3G2
� �: ð5Þ
Backbone stretch and stretch relaxation time are defined as
K ¼ffiffiffiffiffiffiffiffiffiffiffiffiffiffiffiffiffi1 þ I s
3G0
r; ks ¼ k0s expð�mðK� 1ÞÞ; m ¼ 2
q; ð6Þ
in which q is the number of branches. Parameter α (α � 0) de-scribes a Giesekus type of anisotropy, Bird et al. [39]. Thisparameter influences the second normal stress difference only.The Extended Pompom model is equivalent to the original ap-proximative Pompom model for α = 0. The orientation relaxa-tion times of the backbone k0b are obtained from linear visco-elastic data. The number of branches q, the stretch relaxationtimes ks and the anisotropy parameter α are determined foreach mode. For both models the corresponding recoverablestrain tensor Be is given by
Be ¼s
G
� �þ I: ð7Þ
The second invariant of the deviatoric part of Be is used in thenext section as the driving force for flow-induced nucleationand crystallization.
3.2 Constitutive Equations for Quiescent and Flow-inducedNucleation and Crystallization
Two sets of equations were used to model quiescent and flow-induced crystallization, respectively. Non-isothermal crystalli-zation of spherulites was described by the Schneider’s rateequations [40], a set of differential equations for the structure,developing in quiescent conditions. Mean number of spheru-lites and their mean radius, surface and volume were calcu-lated, Eqs. 8 to 11:
_uu3 ¼ 8pα; ðu3 ¼ 8pNÞ rate; ð8Þ
_uu2 ¼ Gu3; ðu2 ¼ 8pRtotÞ radius; ð9Þ
_uu1 ¼ Gu2 ðu1 ¼ StotÞ surface; ð10Þ
_uu0 ¼ Gu1 ðu0 ¼ VtotÞ volume; ð11Þ
u0 ¼ � lnð1 � ngÞ space filling; ð12Þ
with α the nucleation rate and G the growth rate. Impingementof spherulites is captured by an Avrami model, Eq. 12. Themorphology is described per unit volume by the total volumeof spherulites Vtot, their total surface Stot, the sum of their radiiRtot and the number of nuclei N. The relation of these para-meters with ui is given between brackets. The number of nucleiand the growth rate have to be measured as a function of tem-perature. Relations for these properties will be given in sec-tion 4.
For flow-induced crystallization, the model of Eder and Ja-neschitz-Kriegl [2] was used. Zuidema [41, 42] proposed amodification of this model and used the recoverable strain,computed with the Leonov model, rather than the shear rate asa driving force, the SJ2-model. He showed that flow-inducedstructures correlate most strongly with the viscoelastic modewith the highest relaxation time. Therefore, only the second in-variant of the deviatoric part of the recoverable strain (J2ð�BBd
eÞ)for the largest rheological relaxation time was used. This invar-iant can be considered as a measure for the molecular orienta-tion, Larson [36].
The SJ2-model has the same structure as Schneider’s rateequations. Mean number of shish-kebabs and their meanlength, surface and volume are calculated, Eqs. 13 to 16:
_ww3 þw3
sn¼ 8pJ2g0
n; ðw3 ¼ 8pNfÞ rate; ð13Þ
_ww2 þw2
sl¼ w3J2
g0lg0n
; ðw2 ¼ 4pLtotÞ length; ð14Þ
_ww1 ¼ Gw2; ðw1 ¼ StotÞ surface; ð15Þ
_ww0 ¼ Gw1; ðw0 ¼ VtotÞ volume; ð16Þ
w0 ¼ � lnð1 � ngÞ space filling; ð17Þ
with J2 the driving force, G the growth rate, g0n and g0l scaling
factors to describe the sensitivity of flow-induced nuclei andlength on J2, and sn and sl characteristic times to describe therelaxation behavior of flow-induced nuclei and length, respec-tively. Impingement of the cylindrical structures formed isagain captured by an Avrami model, Eq. 17. The morphologyis described per unit volume by the total volume of shish-ke-babs Vtot, their total surface Stot, the sum of their lengths Ltot
and the number of flow-induced nuclei Nf. The relation ofthese parameters with wi is given between brackets.
Their meaning is as follows: flow-induced molecular orien-tation can generate extra nuclei, Eq. 13. When the orientationis strong enough, these nuclei grow out in one direction,Eq. 14. The radial growth rate of the cylindrical structures is ta-ken equal to the spherulitical growth rate, see Eq. 15. Accord-ing to Tribout et al. [23] growth rate depends weakly on flowafter cessation of flow. Of course, other choices for the radialgrowth dependent on J2 are possible. The relaxation time sl isin general taken very large, because reduction of length canonly occur via melting. The relaxation time sn was chosenequal to the rheological relaxation time.
Zuidema [41, 42] considered nucleation as physical cross-linking. Consequently, an increased number of nuclei causesan increase in the rheological relaxation time. The most simpleform of a linear relationship between flow-induced nuclei andthe highest rheological relaxation time was chosen.
hj ¼ aTðTÞ hj0 1 þ bNf
g0n
� �; ð18Þ
with hj0 the highest rheological relaxation time at the referencetemperature, aT the shift factor and b a scaling factor that de-scribes the interaction between nuclei and rheology. Conse-quently, the scaling factors b, g0n and g0
l should be measured asa function of flow conditions.
56 Intern. Polymer Processing XVIII (2003) 1
© 2
003
Car
l Han
ser
Ver
lag,
Mun
ich,
Ger
man
y
ww
w.k
unst
stof
fe.d
e/IP
P
Not
for
use
in in
tern
et o
r in
tran
et s
ites.
Not
for
elec
tron
ic d
istr
ibut
ion.
In case of flow, both spherulitical and flow-induced struc-tures contribute to the degree of space filling, depending onthe influence of J2. The Avrami model for impingement is thendescribed by
u0 þ w0 ¼ � lnð1 � ngÞ: ð19Þ
4 Materials and Methods
4.1 Materials
Experiments were carried out on StamylanP 13E10, an isotac-tic polypropylene provided by DSM, with molecular weightof 501 kg/mol and molecular weight distribution 6.0. Rheolo-gical characterization was performed in simple shear and uni-axial elongation. The determination of the number of nucleiand the growth rate were performed using a hotstage under amicroscope see Swartjes [43]. The parameters resulting fromthis characterization are summarized in Table 2. The WLFequation is defined by
logðaTÞ ¼ � c1ðT � TrefÞc2 þ ðT � TrefÞ
; ð20Þ
with c1 and c2 the WLF constants. The Maxwell parameters(Gi, ki) were determined by fitting the Maxwell model on thelinear viscoelastic data. The dynamic moduli are given by
G0 ¼XN
i¼1
Gik2i x
2
1 þ k2i x
2; ð21Þ
G00 ¼XN
i¼1
Gikix
1 þ k2i x
2; ð22Þ
with N the number of modes. The number of nuclei is de-scribed by
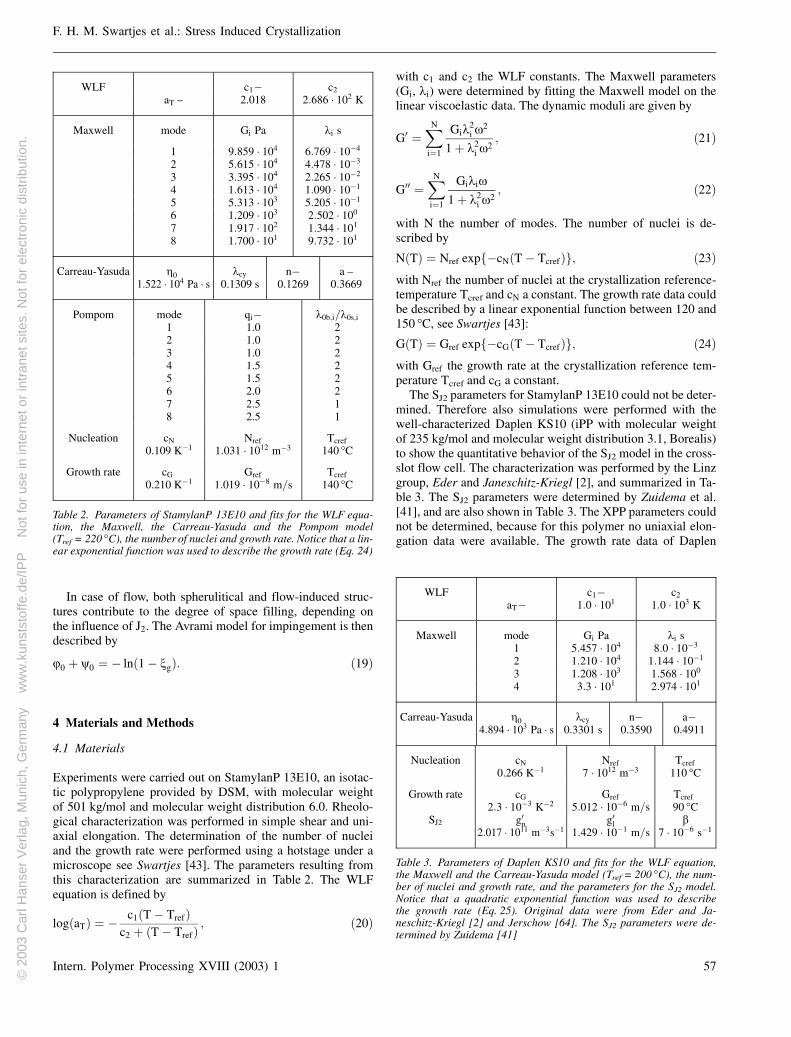
NðTÞ ¼ Nref exp �cNðT � TcrefÞf g; ð23Þwith Nref the number of nuclei at the crystallization reference-temperature Tcref and cN a constant. The growth rate data couldbe described by a linear exponential function between 120 and150 °C, see Swartjes [43]:
GðTÞ ¼ Gref exp �cGðT � TcrefÞf g; ð24Þwith Gref the growth rate at the crystallization reference tem-perature Tcref and cG a constant.
The SJ2 parameters for StamylanP 13E10 could not be deter-mined. Therefore also simulations were performed with thewell-characterized Daplen KS10 (iPP with molecular weightof 235 kg/mol and molecular weight distribution 3.1, Borealis)to show the quantitative behavior of the SJ2 model in the cross-slot flow cell. The characterization was performed by the Linzgroup, Eder and Janeschitz-Kriegl [2], and summarized in Ta-ble 3. The SJ2 parameters were determined by Zuidema et al.[41], and are also shown in Table 3. The XPP parameters couldnot be determined, because for this polymer no uniaxial elon-gation data were available. The growth rate data of Daplen
IPP_ipp1719 – 2.4.03/druckhaus köthen
F. H. M. Swartjes et al.: Stress Induced Crystallization
Intern. Polymer Processing XVIII (2003) 1 57
WLF c1� c2
aT – 2.018 2:686 � 102 K
Maxwell mode Gi Pa ki s
1 9:859 � 104 6:769 � 10�4
2 5:615 � 104 4:478 � 10�3
3 3:395 � 104 2:265 � 10�2
4 1:613 � 104 1:090 � 10�1
5 5:313 � 103 5:205 � 10�1
6 1:209 � 103 2:502 � 100
7 1:917 � 102 1:344 � 101
8 1:700 � 101 9:732 � 101
Carreau-Yasuda g0 kcy n� a –1:522 � 104 Pa � s 0.1309 s 0.1269 0:3669
Pompom mode qi� k0b;i=k0s;i1 1.0 22 1.0 23 1.0 24 1.5 25 1.5 26 2.0 27 2.5 18 2.5 1
Nucleation cN Nref Tcref0.109 K�1 1:031 � 1012 m�3 140 °C
Growth rate cG Gref Tcref
0.210 K�1 1:019 � 10�8 m=s 140 °C
Table 2. Parameters of StamylanP 13E10 and fits for the WLF equa-tion, the Maxwell, the Carreau-Yasuda and the Pompom model(Tref = 220 °C), the number of nuclei and growth rate. Notice that a lin-ear exponential function was used to describe the growth rate (Eq. 24)
WLF c1� c2
aT� 1:0 � 101 1:0 � 103 K
Maxwell mode Gi Pa ki s1 5:457 � 104 8:0 � 10�3
2 1:210 � 104 1:144 � 10�1
3 1:208 � 103 1:568 � 100
4 3:3 � 101 2:974 � 101
Carreau-Yasuda g0 kcy n� a�4:894 � 103 Pa � s 0.3301 s 0.3590 0.4911
Nucleation cN Nref Tcref0.266 K�1 7 � 1012 m�3 110 °C
Growth rate cG Gref Tcref
2:3 � 10�3 K�2 5:012 � 10�6 m=s 90 °CSJ2 g0n g0l b
2:017 � 1011 m�3s�1 1:429 � 10�1 m=s 7 � 10�6 s�1
Table 3. Parameters of Daplen KS10 and fits for the WLF equation,the Maxwell and the Carreau-Yasuda model (Tref = 200 °C), the num-ber of nuclei and growth rate, and the parameters for the SJ2 model.Notice that a quadratic exponential function was used to describethe growth rate (Eq. 25). Original data were from Eder and Ja-neschitz-Kriegl [2] and Jerschow [64]. The SJ2 parameters were de-termined by Zuidema [41]
© 2
003
Car
l Han
ser
Ver
lag,
Mun
ich,
Ger
man
y
ww
w.k
unst
stof
fe.d
e/IP
P
Not
for
use
in in
tern
et o
r in
tran
et s
ites.
Not
for
elec
tron
ic d
istr
ibut
ion.
IPP_ipp1719 – 2.4.03/druckhaus köthen
F. H. M. Swartjes et al.: Stress Induced Crystallization
KS10 were described by a quadratic exponential function, Ederand Janeschitz-Kriegl [2].
GðTÞ ¼ Gref exp �cGðT � TcrefÞ2n o
: ð25Þ
These two examples clearly demonstrate one of the problemsin modelling of flow-induced nucleation and crystalization.One really need well-characterized materials, which requires amultitude of different experiments and skills. Completely char-acterized materials do not exist, yet.
4.2 Experimental Methods
4.2.1 Cross-Slot Flow Cell
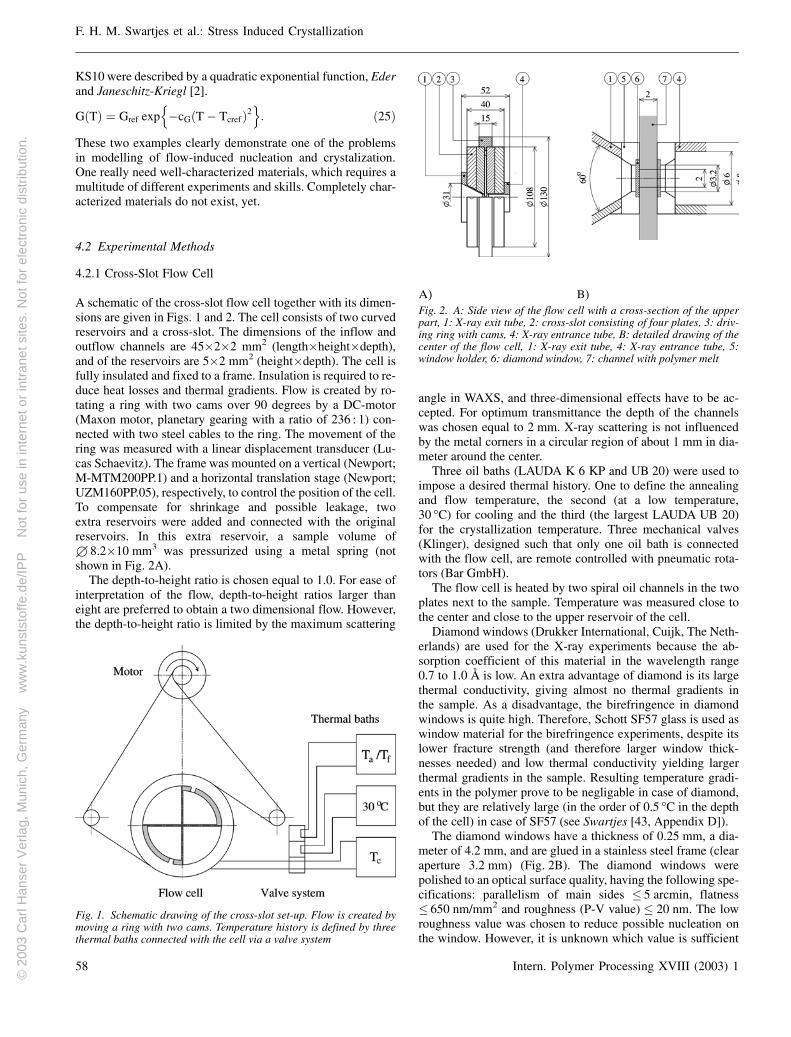
A schematic of the cross-slot flow cell together with its dimen-sions are given in Figs. 1 and 2. The cell consists of two curvedreservoirs and a cross-slot. The dimensions of the inflow andoutflow channels are 45�2�2 mm2 (length�height�depth),and of the reservoirs are 5�2 mm2 (height�depth). The cell isfully insulated and fixed to a frame. Insulation is required to re-duce heat losses and thermal gradients. Flow is created by ro-tating a ring with two cams over 90 degrees by a DC-motor(Maxon motor, planetary gearing with a ratio of 236 : 1) con-nected with two steel cables to the ring. The movement of thering was measured with a linear displacement transducer (Lu-cas Schaevitz). The frame was mounted on a vertical (Newport;M-MTM200PP.1) and a horizontal translation stage (Newport;UZM160PP.05), respectively, to control the position of the cell.To compensate for shrinkage and possible leakage, twoextra reservoirs were added and connected with the originalreservoirs. In this extra reservoir, a sample volume of1 8.2�10 mm3 was pressurized using a metal spring (notshown in Fig. 2A).
The depth-to-height ratio is chosen equal to 1.0. For ease ofinterpretation of the flow, depth-to-height ratios larger thaneight are preferred to obtain a two dimensional flow. However,the depth-to-height ratio is limited by the maximum scattering
angle in WAXS, and three-dimensional effects have to be ac-cepted. For optimum transmittance the depth of the channelswas chosen equal to 2 mm. X-ray scattering is not influencedby the metal corners in a circular region of about 1 mm in dia-meter around the center.
Three oil baths (LAUDA K 6 KP and UB 20) were used toimpose a desired thermal history. One to define the annealingand flow temperature, the second (at a low temperature,30 °C) for cooling and the third (the largest LAUDA UB 20)for the crystallization temperature. Three mechanical valves(Klinger), designed such that only one oil bath is connectedwith the flow cell, are remote controlled with pneumatic rota-tors (Bar GmbH).
The flow cell is heated by two spiral oil channels in the twoplates next to the sample. Temperature was measured close tothe center and close to the upper reservoir of the cell.
Diamond windows (Drukker International, Cuijk, The Neth-erlands) are used for the X-ray experiments because the ab-sorption coefficient of this material in the wavelength range0.7 to 1.0 Å is low. An extra advantage of diamond is its largethermal conductivity, giving almost no thermal gradients inthe sample. As a disadvantage, the birefringence in diamondwindows is quite high. Therefore, Schott SF57 glass is used aswindow material for the birefringence experiments, despite itslower fracture strength (and therefore larger window thick-nesses needed) and low thermal conductivity yielding largerthermal gradients in the sample. Resulting temperature gradi-ents in the polymer prove to be negligable in case of diamond,but they are relatively large (in the order of 0.5 °C in the depthof the cell) in case of SF57 (see Swartjes [43, Appendix D]).
The diamond windows have a thickness of 0.25 mm, a dia-meter of 4.2 mm, and are glued in a stainless steel frame (clearaperture 3.2 mm) (Fig. 2B). The diamond windows werepolished to an optical surface quality, having the following spe-cifications: parallelism of main sides � 5 arcmin, flatness� 650 nm/mm2 and roughness (P-V value) � 20 nm. The lowroughness value was chosen to reduce possible nucleation onthe window. However, it is unknown which value is sufficient
58 Intern. Polymer Processing XVIII (2003) 1
Fig. 1. Schematic drawing of the cross-slot set-up. Flow is created bymoving a ring with two cams. Temperature history is defined by threethermal baths connected with the cell via a valve system
A) B)Fig. 2. A: Side view of the flow cell with a cross-section of the upperpart, 1: X-ray exit tube, 2: cross-slot consisting of four plates, 3: driv-ing ring with cams, 4: X-ray entrance tube, B: detailed drawing of thecenter of the flow cell, 1: X-ray exit tube, 4: X-ray entrance tube, 5:window holder, 6: diamond window, 7: channel with polymer melt
© 2
003
Car
l Han
ser
Ver
lag,
Mun
ich,
Ger
man
y
ww
w.k
unst
stof
fe.d
e/IP
P
Not
for
use
in in
tern
et o
r in
tran
et s
ites.
Not
for
elec
tron
ic d
istr
ibut
ion.

to neglect this influence. The low-birefringent SF57 glass win-dows have a thickness of 1.8 mm, a diameter of 6 mm, and arealso glued to a stainless steel frame (clear aperture 5.0 mm).
4.2.2 Set-up for Birefringence Experiments
The optical train for field-wise birefringence experiments isshown in Fig. 3. The train is fixed, while the flow cell ismounted on a traverse system. A HeNe-laser with a wave lengthof 632.8 nm is used in combination with a beam expander toobtain a parallel light beam with a diameter of about 15 mm.The first polarizer is used to set the intensity hitting the camera.The polarization state generator consists of a polarizer and aquarter wave plate, which is placed at an orientation angle of45 degrees relative to the second polarizer. The polarizationstate analyzer also consists of a polarizer and a quarter waveplate, which are placed at an orientation angle of 135 and90 degrees, respectively, relative to the second polarizer. Or-ientation of the polymer chains is expected to be in outflow di-rection. Therefore, the optical train is mounted at 45 degreeswith respect to the outflow channel of the flow cell, to obtainthe maximum intensity on the outflow centerline, see Fuller[44, Section 8.2.2.]. Birefringence is visualized with a camera(Panasonic WV-CD130) in combination with a microscope(Zeiss SV-11).
4.2.3 Set-up for WAXS Experiments
The Wide Angle X-ray Scattering experiments were carried outin Grenoble (France) at the materials beam-line ID11 and themicro-focus beam-line ID13 of the European Synchrotron Ra-diation Facility (ESRF), where a high X-ray flux allows fortime-resolved experiments. The combination of a high fluxand a micro-focus beam in order to measure in-situ structuredevelopment locally, is fulfilled at the micro-focus beam-line.
A beam-size of 0.2�0.2 mm2 was used at the materialsbeam-line (ID11). The collimator-to-sample distance and thebeam-stop-to-sample distance were about 80 mm and100 mm, respectively. The detector was a Frelon CCD detectorhaving a measuring area of 179�179 mm2 (1024�1024 pixelswith a horizontal and vertical pixel size of 175 lm) and a dy-namic range of 14 bit. The exposure time was 5 s, the sample-to-detector distance was 377 mm, and the wavelength was0.718 Å.
A smaller beam-size of about 30 lm was used at the micro-focus beam line (ID13). The collimator-to-sample distancewas about 50 mm. The lead beam-stop was placed at a distanceof about 50 mm from the sample. The detector was a PhotonicsScience CCD detector having a measuring area of 92�69 mm2
(768�576 pixels with a horizontal and vertical pixel size of120 lm). The exposure time was 8.5 s, the sample-to-detectordistance was 143 mm, and the wavelength used was 0.785 Å.
All images were corrected for spatial distortion using the‘Fit2d’ software of the ESRF, Hammersley et al. [45].
4.3 Numerical Method
Since three-dimensional finite or spectral element calculationswith non-linear viscoelastic models are expensive and timeconsuming, the calculation of the velocities and stresses wereperformed in a decoupled way, Douven et al. [46]. The 3D,generalised Newtonian velocity field was computed with the fi-nite and spectral element package SEPRAN, Segal [47], usingthe Carreau-Yasuda model. Only the inner part of the crosswas modeled to minimalize computational costs and use allcomputational capacity to obtain a high accuracy for the velo-city. Moreover, due to symmetry, only one eight of the cellwas modeled. The spectral element mesh consisted of 32, eightorder elements giving 18.785 nodal points. The inflow and out-flow length are equal to 2.5 mm and the height and width of themesh are both equal to 1.0 mm.
Next, the deformation history for some user defined pointswas determined by tracking particles using the velocity field.Velocities and velocity gradients were determined on thesepaths by using the polynomial basis functions, Anderson [48].Finally, stresses and stress related properties were calculatedusing the two viscoelastic constitutive equations mentioned:Leonov and XPP. All modes of the time relaxation spectrumwere used to determine the stresses, while only the highest re-laxation time is used for the calculation of the orientation para-meter (the second invariant of the deviatoric part of the elasticFinger tensor). A first order implicit Euler scheme is used todetermine the stress, the quiescent part and the flow-inducedpart of the crystallization.
The influence of an undershoot in temperature was takeninto account by keeping all nuclei that were created at the low-est temperature, while the growth rate was dependent on the in-stantaneous temperature.
5 Experimental Results
5.1 Birefringence Experiments
Field-wise birefringence experiments were performed usingStamylanP 13E10 to check the experimental conditions and tofind an useful experimental time range. Only qualitative resultsare presented. Flow was created at the crystallization tempera-ture to show flow-induced enhancement of crystallization atrather extreme conditions.
The sample was annealed at 215 °C for one hour, and cooled,_TT � 25 °C/min to the flow or crystallization temperature. Next,flow was created after about 30 min. The elongational rate, es-
IPP_ipp1719 – 2.4.03/druckhaus köthen
F. H. M. Swartjes et al.: Stress Induced Crystallization
Intern. Polymer Processing XVIII (2003) 1 59
Fig. 3. Optical train for field-wise birefringence measurementsL = laser, BE = beam expander, P = polarizer, Q = quarter waveplate, FC = flow cell, M = microscope, C = camera, TR = tilt/rotationstage, Trz = translation stage in beam direction and LJ = laboratoryjack
© 2
003
Car
l Han
ser
Ver
lag,
Mun
ich,
Ger
man
y
ww
w.k
unst
stof
fe.d
e/IP
P
Not
for
use
in in
tern
et o
r in
tran
et s
ites.
Not
for
elec
tron
ic d
istr
ibut
ion.
IPP_ipp1719 – 2.4.03/druckhaus köthen
F. H. M. Swartjes et al.: Stress Induced Crystallization
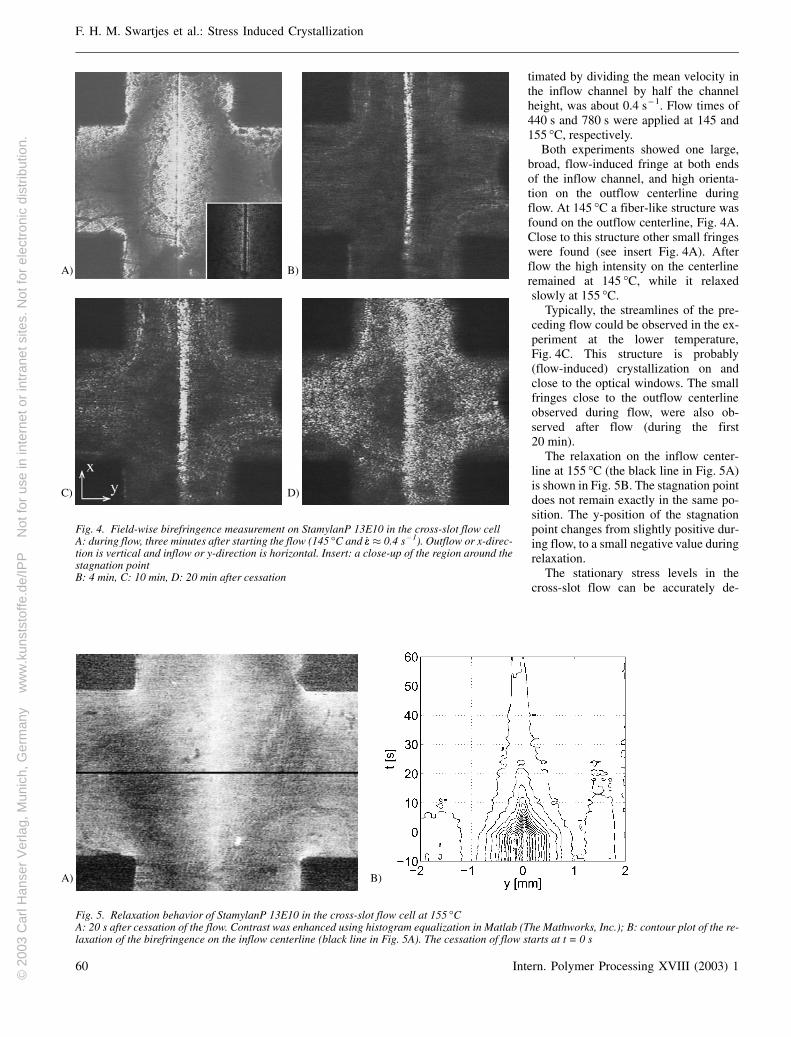
timated by dividing the mean velocity inthe inflow channel by half the channelheight, was about 0.4 s – 1. Flow times of440 s and 780 s were applied at 145 and155 °C, respectively.
Both experiments showed one large,broad, flow-induced fringe at both endsof the inflow channel, and high orienta-tion on the outflow centerline duringflow. At 145 °C a fiber-like structure wasfound on the outflow centerline, Fig. 4A.Close to this structure other small fringeswere found (see insert Fig. 4A). Afterflow the high intensity on the centerlineremained at 145 °C, while it relaxedslowly at 155 °C.
Typically, the streamlines of the pre-ceding flow could be observed in the ex-periment at the lower temperature,Fig. 4C. This structure is probably(flow-induced) crystallization on andclose to the optical windows. The smallfringes close to the outflow centerlineobserved during flow, were also ob-served after flow (during the first20 min).
The relaxation on the inflow center-line at 155 °C (the black line in Fig. 5A)is shown in Fig. 5B. The stagnation pointdoes not remain exactly in the same po-sition. The y-position of the stagnationpoint changes from slightly positive dur-ing flow, to a small negative value duringrelaxation.
The stationary stress levels in thecross-slot flow can be accurately de-
60 Intern. Polymer Processing XVIII (2003) 1
A) B)
C) D)
Fig. 4. Field-wise birefringence measurement on StamylanP 13E10 in the cross-slot flow cellA: during flow, three minutes after starting the flow (145 °C and _ee � 0.4 s – 1). Outflow or x-direc-tion is vertical and inflow or y-direction is horizontal. Insert: a close-up of the region around thestagnation pointB: 4 min, C: 10 min, D: 20 min after cessation
A) B)
Fig. 5. Relaxation behavior of StamylanP 13E10 in the cross-slot flow cell at 155 °CA: 20 s after cessation of the flow. Contrast was enhanced using histogram equalization in Matlab (The Mathworks, Inc.); B: contour plot of the re-laxation of the birefringence on the inflow centerline (black line in Fig. 5A). The cessation of flow starts at t = 0 s
© 2
003
Car
l Han
ser
Ver
lag,
Mun
ich,
Ger
man
y
ww
w.k
unst
stof
fe.d
e/IP
P
Not
for
use
in in
tern
et o
r in
tran
et s
ites.
Not
for
elec
tron
ic d
istr
ibut
ion.
scribed by the Pompom model, Verbeeten et al. [49]. However,optical properties are strongly varying along the propagationdirection of the light beam in this three dimensional flow. Aquantitative comparison can only be obtained using the differ-ential propagation matrix theorem, Azzam [50], see also Fuller[44] or Schoonen [8]. Moreover, the point-wise polarizationmodulation technique of Fuller and Mikkelsen [51] is recom-mended to obtain a continuous and more sensitive birefrin-gence value.
5.2 WAXS Experiments
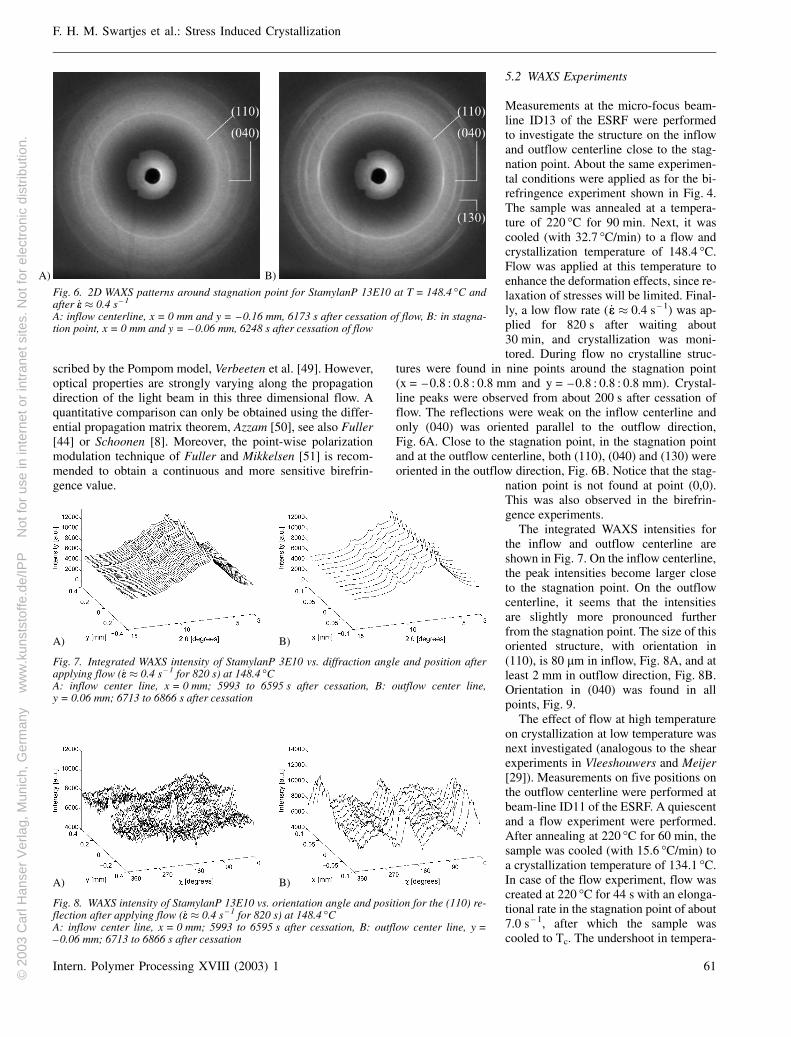
Measurements at the micro-focus beam-line ID13 of the ESRF were performedto investigate the structure on the inflowand outflow centerline close to the stag-nation point. About the same experimen-tal conditions were applied as for the bi-refringence experiment shown in Fig. 4.The sample was annealed at a tempera-ture of 220 °C for 90 min. Next, it wascooled (with 32.7 °C/min) to a flow andcrystallization temperature of 148.4 °C.Flow was applied at this temperature toenhance the deformation effects, since re-laxation of stresses will be limited. Final-ly, a low flow rate ( _ee � 0.4 s – 1) was ap-plied for 820 s after waiting about30 min, and crystallization was moni-tored. During flow no crystalline struc-
tures were found in nine points around the stagnation point(x = – 0.8 : 0.8 : 0.8 mm and y = – 0.8 : 0.8 : 0.8 mm). Crystal-line peaks were observed from about 200 s after cessation offlow. The reflections were weak on the inflow centerline andonly (040) was oriented parallel to the outflow direction,Fig. 6A. Close to the stagnation point, in the stagnation pointand at the outflow centerline, both (110), (040) and (130) wereoriented in the outflow direction, Fig. 6B. Notice that the stag-
nation point is not found at point (0,0).This was also observed in the birefrin-gence experiments.
The integrated WAXS intensities forthe inflow and outflow centerline areshown in Fig. 7. On the inflow centerline,the peak intensities become larger closeto the stagnation point. On the outflowcenterline, it seems that the intensitiesare slightly more pronounced furtherfrom the stagnation point. The size of thisoriented structure, with orientation in(110), is 80 lm in inflow, Fig. 8A, and atleast 2 mm in outflow direction, Fig. 8B.Orientation in (040) was found in allpoints, Fig. 9.
The effect of flow at high temperatureon crystallization at low temperature wasnext investigated (analogous to the shearexperiments in Vleeshouwers and Meijer[29]). Measurements on five positions onthe outflow centerline were performed atbeam-line ID11 of the ESRF. A quiescentand a flow experiment were performed.After annealing at 220 °C for 60 min, thesample was cooled (with 15.6 °C/min) toa crystallization temperature of 134.1 °C.In case of the flow experiment, flow wascreated at 220 °C for 44 s with an elonga-tional rate in the stagnation point of about7.0 s – 1, after which the sample wascooled to Tc. The undershoot in tempera-
IPP_ipp1719 – 2.4.03/druckhaus köthen
F. H. M. Swartjes et al.: Stress Induced Crystallization
Intern. Polymer Processing XVIII (2003) 1 61
A) B)
Fig. 6. 2D WAXS patterns around stagnation point for StamylanP 13E10 at T = 148.4 °C andafter _ee � 0.4 s – 1
A: inflow centerline, x = 0 mm and y = –0.16 mm, 6173 s after cessation of flow, B: in stagna-tion point, x = 0 mm and y = –0.06 mm, 6248 s after cessation of flow
A) B)
Fig. 7. Integrated WAXS intensity of StamylanP 3E10 vs. diffraction angle and position afterapplying flow (_ee � 0.4 s – 1 for 820 s) at 148.4 °CA: inflow center line, x = 0 mm; 5993 to 6595 s after cessation, B: outflow center line,y = 0.06 mm; 6713 to 6866 s after cessation
A) B)
Fig. 8. WAXS intensity of StamylanP 13E10 vs. orientation angle and position for the (110) re-flection after applying flow (_ee � 0.4 s – 1 for 820 s) at 148.4 °CA: inflow center line, x = 0 mm; 5993 to 6595 s after cessation, B: outflow center line, y =–0.06 mm; 6713 to 6866 s after cessation
© 2
003
Car
l Han
ser
Ver
lag,
Mun
ich,
Ger
man
y
ww
w.k
unst
stof
fe.d
e/IP
P
Not
for
use
in in
tern
et o
r in
tran
et s
ites.
Not
for
elec
tron
ic d
istr
ibut
ion.

IPP_ipp1719 – 2.4.03/druckhaus köthen
F. H. M. Swartjes et al.: Stress Induced Crystallization
ture was equal to 3.2 and 2.5 °C, for the quiescent and flow ex-periment, respectively.
The two dimensional WAXS patterns were integrated alongthe Debye ring. Next, the peak area was integrated to obtain ameasure for the crystallinity, and plotted as a function of timefor five points on the outflow centerline in Fig. 10. Crystalliza-tion rates are higher if flow was applied, however, the X-raypatterns didn’t show any indication of orientation. This
could be due to the ‘large’ beam size(0.2�0.2 mm2) used. These conclusionsdid not change when flow was applied at170 °C and the influence of flow wasmuch less pronounced than anticipated.Numerical simulations were used to ex-plain these findings, focusing on the in-fluence of shear gradients in the depth ofthe flow cell.
6 Numerical Results
In the simulations the characteristics ofDaplen KS10 are used, because its crys-
tallization behavior is known both in quiescent conditions andafter flow, see Table 3. The recoverable strain modeled withthe Leonov model is used as the driving force.
A flow rate of 1.85 � 10 – 8 m3/s is applied (in one inflowchannel) for 40 s at a temperature of 200 °C. Next, the sampleis cooled with a cooling rate of 30 °C/min to an isothermalcrystallization temperature of 140 °C. Time t = 0 s is definedas the time reaching Tc. Space filling during crystallization iscalculated in ten planes in depth (z = 0.05 : 0.1 : 0.95 mm) for150 points. Some extra points are used close to the outflowcenterline.
The predicted space fillings in the planes z = 0.05 mm andz = 0.95 mm are shown in Fig. 11. Large values are found closeto the outflow stagnation line and in the corner (Fig. 11A). Theinfluence of the shear rate components _ccxy and _ccyz, which aremore pronounced close to the windows, are shown in Fig. 11B.The average space filling is raised to a value of about 0.40. In-teresting is the increasing value close to the outflow centerlinewith increasing x-coordinate. The low value for the space fill-ing at the corner is caused by the low shear rates in this region.
The averaged space filling (mean value of the space fillingsin the ten planes) is shown in Fig. 12A. The behavior lookssimilar to Fig. 11 and, although the influence of shear flow isless pronounced, the increase at the outflow centerline is stillobserved.
The dependence of space filling on the depth of the cell iscalculated in four characteristic points, Fig. 12B. Close to thestagnation point space filling decreases with depth and in-creases slightly close to the wall. In the point close to the corner
space filling decreases continuously withdepth, while in the point on the inflowcenterline it increases with depth. Thispoint shows most clearly the influence ofthe shear rate in the neutral direction, be-cause its value is zero in absence of shearrate (in the plane z = 0 mm). The largestchanges are found in the point on the out-flow centerline. Initially, its value is veryclose to the value in the stagnation pointand decreases with depth, but it increasesrapidly close to the wall. In conclusion,three-dimensional effects are consider-able for the depth-to-height ratio of theflow channels that had to be compro-mised, see section 4.
62 Intern. Polymer Processing XVIII (2003) 1
A) B)
Fig. 9. WAXS intensity of StamylanP 13E10 vs. orientation angle and position for the (040)reflection after applying flow (_ee � 0.4 s – 1 for 820 s) at 148.4 °CA: inflow center line, x = 0 mm; 5993 to 6595 s after cessation, B: outflow center line, y =–0.06 mm; 6713 to 6866 s after cessation
Fig. 10. Scaled crystallinity against time in five points on the outflowcenterline (y = 0 mm) of the cross-slot at Tc = 134.1 °C. The elonga-tional rate in the flow experiment was about 7.0 s – 1. The measurementwas performed at the ID11 of the ESRF (Grenoble, France) using abeam-size of 0.2 × 0.2 mm2
A) B)
Fig. 11. Prediction of the space filling in the cross-slot flow cell (D/H = 1) for Daplen KS10after applying a flow rate of 1.85.10 – 8 m3/s for 40 s at 200 °C, subsequent cooling to 140 °C,and waiting 1200 s, using the SJ2 modelA: plane z = 0.05 mm, B: plane z = 0.95 mm
© 2
003
Car
l Han
ser
Ver
lag,
Mun
ich,
Ger
man
y
ww
w.k
unst
stof
fe.d
e/IP
P
Not
for
use
in in
tern
et o
r in
tran
et s
ites.
Not
for
elec
tron
ic d
istr
ibut
ion.
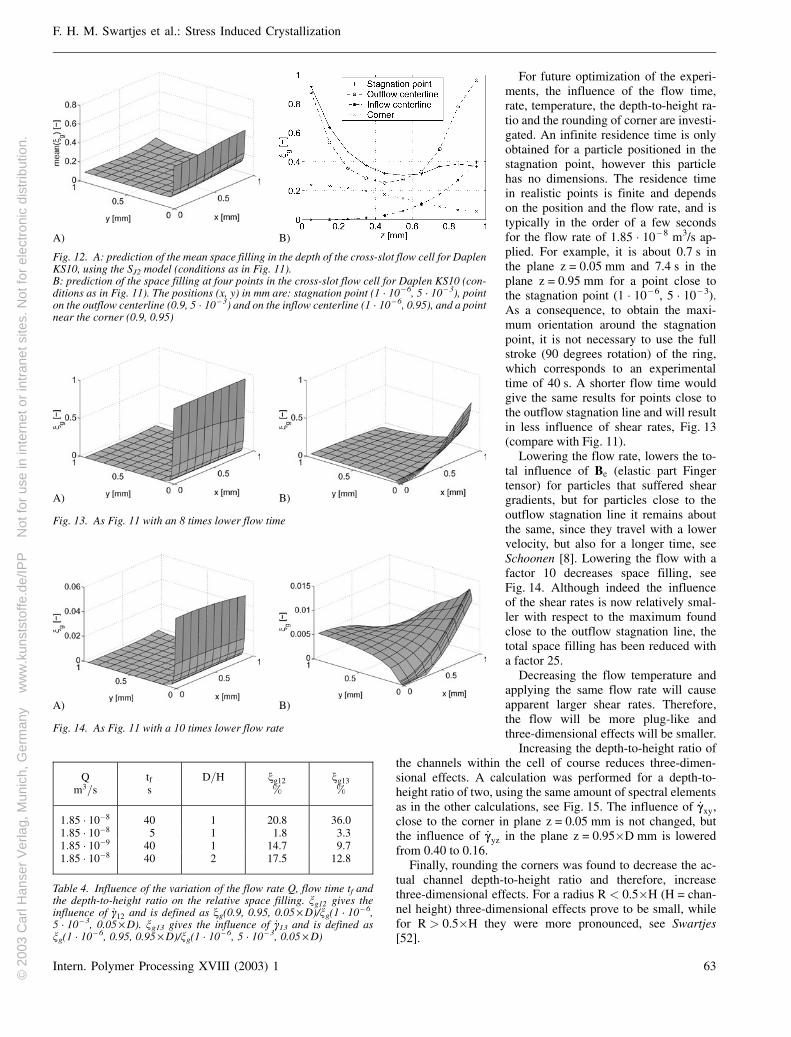
For future optimization of the experi-ments, the influence of the flow time,rate, temperature, the depth-to-height ra-tio and the rounding of corner are investi-gated. An infinite residence time is onlyobtained for a particle positioned in thestagnation point, however this particlehas no dimensions. The residence timein realistic points is finite and dependson the position and the flow rate, and istypically in the order of a few secondsfor the flow rate of 1.85 � 10 – 8 m3/s ap-plied. For example, it is about 0.7 s inthe plane z = 0.05 mm and 7.4 s in theplane z = 0.95 mm for a point close tothe stagnation point (1 � 10 – 6, 5 � 10 – 3).As a consequence, to obtain the maxi-mum orientation around the stagnationpoint, it is not necessary to use the fullstroke (90 degrees rotation) of the ring,which corresponds to an experimentaltime of 40 s. A shorter flow time wouldgive the same results for points close tothe outflow stagnation line and will resultin less influence of shear rates, Fig. 13(compare with Fig. 11).
Lowering the flow rate, lowers the to-tal influence of Be (elastic part Fingertensor) for particles that suffered sheargradients, but for particles close to theoutflow stagnation line it remains aboutthe same, since they travel with a lowervelocity, but also for a longer time, seeSchoonen [8]. Lowering the flow with afactor 10 decreases space filling, seeFig. 14. Although indeed the influenceof the shear rates is now relatively smal-ler with respect to the maximum foundclose to the outflow stagnation line, thetotal space filling has been reduced witha factor 25.
Decreasing the flow temperature andapplying the same flow rate will causeapparent larger shear rates. Therefore,the flow will be more plug-like andthree-dimensional effects will be smaller.
Increasing the depth-to-height ratio ofthe channels within the cell of course reduces three-dimen-sional effects. A calculation was performed for a depth-to-height ratio of two, using the same amount of spectral elementsas in the other calculations, see Fig. 15. The influence of _ccxy,close to the corner in plane z = 0.05 mm is not changed, butthe influence of _ccyz in the plane z = 0.95�D mm is loweredfrom 0.40 to 0.16.
Finally, rounding the corners was found to decrease the ac-tual channel depth-to-height ratio and therefore, increasethree-dimensional effects. For a radius R < 0.5�H (H = chan-nel height) three-dimensional effects prove to be small, whilefor R > 0.5�H they were more pronounced, see Swartjes[52].
IPP_ipp1719 – 2.4.03/druckhaus köthen
F. H. M. Swartjes et al.: Stress Induced Crystallization
Intern. Polymer Processing XVIII (2003) 1 63
A) B)
Fig. 12. A: prediction of the mean space filling in the depth of the cross-slot flow cell for DaplenKS10, using the SJ2 model (conditions as in Fig. 11).B: prediction of the space filling at four points in the cross-slot flow cell for Daplen KS10 (con-ditions as in Fig. 11). The positions (x, y) in mm are: stagnation point (1 · 10 – 6, 5 · 10 – 3), pointon the outflow centerline (0.9, 5 · 10 – 3) and on the inflow centerline (1 · 10 – 6, 0.95), and a pointnear the corner (0.9, 0.95)
A) B)
Fig. 13. As Fig. 11 with an 8 times lower flow time
A) B)
Fig. 14. As Fig. 11 with a 10 times lower flow rate
Qm3=s
tf
sD=H ng12
%ng13%
1:85 � 10�8 40 1 20.8 36.01:85 � 10�8 5 1 1.8 3.31:85 � 10�9 40 1 14.7 9.71:85 � 10�8 40 2 17.5 12.8
Table 4. Influence of the variation of the flow rate Q, flow time tf andthe depth-to-height ratio on the relative space filling. ng12 gives theinfluence of _cc12 and is defined as ng(0.9, 0.95, 0.05 × D)/ng(1 · 10 – 6,5 · 10 – 3, 0.05 × D). ng13 gives the influence of _cc13 and is defined asng(1 · 10 – 6, 0.95, 0.95 × D)/ng(1 · 10 – 6, 5 · 10 – 3, 0.05 × D)
© 2
003
Car
l Han
ser
Ver
lag,
Mun
ich,
Ger
man
y
ww
w.k
unst
stof
fe.d
e/IP
P
Not
for
use
in in
tern
et o
r in
tran
et s
ites.
Not
for
elec
tron
ic d
istr
ibut
ion.

IPP_ipp1719 – 2.4.03/druckhaus köthen
F. H. M. Swartjes et al.: Stress Induced Crystallization
The results of all calculations shown in Fig. 13 to 15 aresummarized in Table 4. The influence of the shear rate _cc12 canbe found in the point close to the corner in the plane 0.05�D,while the influence of _cc13 can be seen on the inflow centerlinein the plane 0.95�D. Therefore, the values of the space fillingclose to the corner in plane z = 0.05�D (ng12) and on the inflowcenterline in plane z = 0.95�D (ng13) are given, and normal-ized with the space filling value close to the stagnation point(1�10 – 6, 5 � 10 – 3) in plane z = 0.05�D. A lower value of theflow rate or a larger depth-to-height ratio reduces the influence
of _cc13 with respect to _cc12. By far, the lar-gest influence is seen in reducing the flowtime.
7 Discussion
Structure development in the cross-slotflow device was analyzed, experimen-tally and numerically. A qualitativeagreement was found between the twoexperimental methods used (flow at lowand at a high temperature prior to isother-mal crystallization) and the numericalprediction.
An highly oriented structure was foundin the birefringence en WAXS experi-ments. The birefringence experimentsshowed that this structure survived up to20 min after cessation of flow, when flowwas applied at the crystallization tem-perature. The presence of the front andback wall (the optical windows) causedthe occurrence of ‘streamlines’. This phe-nomenon can be explained by the influ-ence of shear gradients close to the win-dows. Moreover, crystallization at thewindows is enhanced due to the thermalgradient in the depth of the cell intro-duced by the optical windows (SchottSF57 glass).
The WAXS experiments showed anhighly oriented structure close to the outflow stagnation line,having orientation in the (110), (040) and (130) reflections.An increase of orientation in (110) and (130) corresponds toan increasing material ordering. Nadella et al. [53] observedhigher orientations for larger molecular weights. An off-equa-tor arcing in (110) and (130) corresponds to the daughter la-mellae, which grow in the a� direction (or flow direction, seeFig. 17). A rotation around the b-axis will only affect the non-(0k0) planes (in this case (110) and (130)). This explains the or-ientation in (040) in Fig. 16B, C), while the structure isbranched. In highly oriented samples (Fig. 16D, a fiber-likestructure is seen with equatorial reflections in (110), (040) and(130). Fujiyama proposed a structure as given in Fig. 17 corre-sponding to the WAXS pattern in Fig. 16C. It is a branchedshish-kebab structure. The orientation in both (110) and (130)in our experiments corresponds to a highly oriented, non-branched structure. WAXS experiments showed that large flowrates also create a large influence of the shear gradients in theheight and depth of the flow channel. The effects of flow oncrystallization close to the outflow centerline was not as pro-nounced as expected.
The influence of the shear gradients can be reduced byusing a shorter flow time and/or using a cell with a largerdepth-to-height ratio. However, the experimental set-upshould be able to allow for experiments with large elonga-tional rates also at temperatures below the melting tempera-ture, to investigate the influence of relaxation. This is notpossible with the current set-up, because of the mechanical
64 Intern. Polymer Processing XVIII (2003) 1
A) B)
Fig. 15. As Fig. 11 with a twice larger D/H ratioA: plane z = 0.05 × D mm, B: plane z = 0.95 × D mm
A) B) C) D)
Fig. 16. Two-dimensional WAXS patterns of �-iPP. Flow direction was vertical. Sample orien-tation increases from A to D.A: core of an injection moulded sample, Fujiyama and Wakino [65], Kalay et al. [66]B: oriented part of � spherulite, Norton and Keller [67], and unidirectional crystallized sample,Lovinger [68]C: skin of an injection moulded sample, Fujiyama and Wakino [65], SCORIM (Shear ControlledOrientation Injection Moulding) sample, Kalay et al. [66], during melt spinning, Nadella et al.[53], stretching above the melting temperature, Andersen and Carr [69], and a short time shear-ing experiment at 141 °C, Kumaraswamy et al. [30]D: stretched near the melting temperature, Andersen and Carr [69]
Fig. 17. Proposed lamellar branched shish-kebab structure in the skinof an injection moulded sample, Fujiyama and Wakino [65]. Flow di-rection is vertical
© 2
003
Car
l Han
ser
Ver
lag,
Mun
ich,
Ger
man
y
ww
w.k
unst
stof
fe.d
e/IP
P
Not
for
use
in in
tern
et o
r in
tran
et s
ites.
Not
for
elec
tron
ic d
istr
ibut
ion.
limits (too high pressures and forces). Moreover, larger cool-ing rates should be used to enhance the flow-induced crystal-lization effect.
A rather general model was used to describe the combina-tion of quiescent, Schneider et al. [40], and flow-induced crys-tallization, Eder and Janeschitz-Kriegl [2], Zuidema [42]. Theadvantage of the SJ2 model above the Eder rate equations isthe dependence of nucleation rate and growth on a (molecular)strain measure rather than the macroscopic shear rate. More-over, improvements can be easily inserted (for example a de-formation dependent growth rate).
The mutual dependence of rheology and nucleation is mod-eled by physical cross-links, resulting in an increased relaxa-tion time. The sensitivity of this relation between number ofnuclei and rheological relaxation time has to be determinedfrom experiments.
The concept of the equivalence of physical cross-linking andnucleation in the Leonov model can be used in the Pompommodel in rather natural way. Increase in the number of nucleigives an increase in the number of branches and relaxationtime. This means that the scaling factor b in Eq. 18 is relatedto the number of branches in the Pompom model.
Originally, the extended Pompom model was proposed forbranched polymers, but it captures also the physics for linear
polymers, as shown by Verbeeten et al.[38] for HDPE. There are two big advan-tages when applying this model for the lin-ear polymers used in this study. First, bothelongation and shear data can be de-scribed excellent with the same set ofparameters. Second, the physical descrip-tion that serves as a basis for this model(i. e. the Pompom molecule) results in amore transparant model. The physicalcross-linking process, proposed by Zuide-ma in the SJ2 model, can be related to theincrease in the number of branches duringcrystallization.
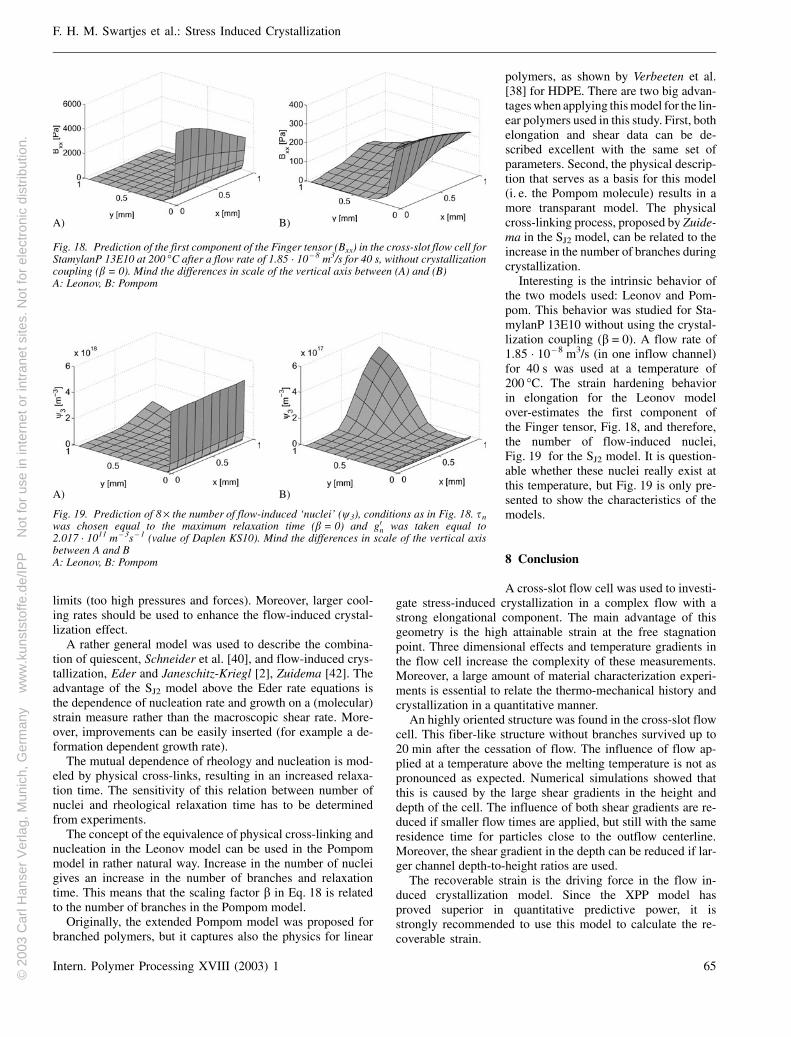
Interesting is the intrinsic behavior ofthe two models used: Leonov and Pom-pom. This behavior was studied for Sta-mylanP 13E10 without using the crystal-lization coupling (b = 0). A flow rate of1.85 � 10 – 8 m3/s (in one inflow channel)for 40 s was used at a temperature of200 °C. The strain hardening behaviorin elongation for the Leonov modelover-estimates the first component ofthe Finger tensor, Fig. 18, and therefore,the number of flow-induced nuclei,Fig. 19 for the SJ2 model. It is question-able whether these nuclei really exist atthis temperature, but Fig. 19 is only pre-sented to show the characteristics of themodels.
8 Conclusion
A cross-slot flow cell was used to investi-gate stress-induced crystallization in a complex flow with astrong elongational component. The main advantage of thisgeometry is the high attainable strain at the free stagnationpoint. Three dimensional effects and temperature gradients inthe flow cell increase the complexity of these measurements.Moreover, a large amount of material characterization experi-ments is essential to relate the thermo-mechanical history andcrystallization in a quantitative manner.
An highly oriented structure was found in the cross-slot flowcell. This fiber-like structure without branches survived up to20 min after the cessation of flow. The influence of flow ap-plied at a temperature above the melting temperature is not aspronounced as expected. Numerical simulations showed thatthis is caused by the large shear gradients in the height anddepth of the cell. The influence of both shear gradients are re-duced if smaller flow times are applied, but still with the sameresidence time for particles close to the outflow centerline.Moreover, the shear gradient in the depth can be reduced if lar-ger channel depth-to-height ratios are used.
The recoverable strain is the driving force in the flow in-duced crystallization model. Since the XPP model hasproved superior in quantitative predictive power, it isstrongly recommended to use this model to calculate the re-coverable strain.
IPP_ipp1719 – 2.4.03/druckhaus köthen
F. H. M. Swartjes et al.: Stress Induced Crystallization
Intern. Polymer Processing XVIII (2003) 1 65
A) B)
Fig. 18. Prediction of the first component of the Finger tensor (Bxx) in the cross-slot flow cell forStamylanP 13E10 at 200 °C after a flow rate of 1.85 · 10 – 8 m3/s for 40 s, without crystallizationcoupling (b = 0). Mind the differences in scale of the vertical axis between (A) and (B)A: Leonov, B: Pompom
A) B)
Fig. 19. Prediction of 8 × the number of flow-induced ‘nuclei’ (w3), conditions as in Fig. 18. snwas chosen equal to the maximum relaxation time (b = 0) and g0
n was taken equal to2.017 · 1011 m – 3s – 1 (value of Daplen KS10). Mind the differences in scale of the vertical axisbetween A and BA: Leonov, B: Pompom
© 2
003
Car
l Han
ser
Ver
lag,
Mun
ich,
Ger
man
y
ww
w.k
unst
stof
fe.d
e/IP
P
Not
for
use
in in
tern
et o
r in
tran
et s
ites.
Not
for
elec
tron
ic d
istr
ibut
ion.
IPP_ipp1719 – 2.4.03/druckhaus köthen
F. H. M. Swartjes et al.: Stress Induced Crystallization
References
1 Keller, A., Kolnaar, J. W. H., in: Processing of Polymers, Meijer,H. E. H. (Ed.), VCH, Weinheim (1997)
2 Eder, G., Janeschitz-Kriegl, H., in: Processing of Polymers, Meijer,H. E. H. (Ed.), VCH, Weinheim (1997)
3 Schultz, J. M., Hsiao, B. S., Samon, J. M.: Polymer 41, p. 8887(2000)
4 Samon, J. M., Schultz, J. M., Hsiao, B. S.: Macromolecules 34,p. 2008 (2001)
5 Schrauwen, B. A. G., Govaert, L. E., Peters, G. W. M., Meijer,H. E. H.: Macromol. Symp. 185, p. 89 (2002)
6 Tas, P. P.: Ph.D. thesis, Eindhoven University of Technology, Eind-hoven (1994)
7 Meijer, H. E. H., in: Processing of Polymers, Meijer, H. E. H. (Ed.),VCH, Eindhoven (1997)
8 Schoonen, J. F. M.: Ph.D. thesis, Eindhoven University of Technol-ogy, www.mate.tue.nl, Eindhoven (1998)
9 Frank, F. C., Mackley, M. R.: J. Polym. Sci. Polym. Phys. Ed. 14,p. 1121 (1976)
10 Geffroy, E., Leal, L. G.: J. Polym. Sci. Part B: Polym. Phys. 30,p. 1329 (1992)
11 Crowley, D. G., Frank, F. C., Mackley, M. R., Stephenson, R. G.: J.Polym. Sci. Polym. Phys. Ed. 14, p. 1111 (1976)
12 Dunlap, P. N., Leal, L. G.: J. Non-Newtonian Fluid Mech. 23, p. 5(1987)
13 McHugh, A. J., Guy, R. K., Tree, D. A.: Colloid Polym. Sci. 271,p. 629 (1993)
14 Aken, J. A. van, Janeschitz-Kriegl, H.: Rheol. Acta 20, p. 419(1980)
15 Macosko, C. W., Ocansey, M. A., Winter, H. H.: J. Non-NewtonianFluid Mech. 11, p. 301 (1980)
16 Gardner, K., Pike, E. R., Miles, M. J., Keller, A., Tanaka, K.: Poly-mer 23, p. 1435 (1982)
17 Miles, M. J., Keller, A.: Polymer 21, p. 1295 (1980)18 Janeschitz-Kriegl, H., Wippel, H., Lin, J. P., Lipp, M.: Rheol. Acta
40, p. 248 (2001)19 Keller, A., Müller, A. J., Odell, J. A.: Prog. Colloid Polym. Sci. 75,
p. 179 (1987)20 Mackay, M. E., Dajan, A. M., Wippel, H., Janeschitz-Kriegl, H.,
Lipp, M.: J. Rheol. 39, p. 1 (1995)21 Eder, G., Janeschitz-Kriegl, H., Liedauer, S.: Prog. Polym. Sci. 15,
p. 629 (1990)22 McHugh, A. J: Polym. Eng. Sci. 22, p. 15 (1982)23 Tribout, C., Monasse, B., Haudin, J. M.: Colloid Polym. Sci. 274,
p. 197 (1996)24 Mackley, M. R., Moggridge, G. D., Saquet, O.: J. Mater. Sci. 35, p. 1
(2000)25 Liedauer, S., Eder, G., Janeschitz-Kriegl, H., Jerschow, P., Gey-
mayer, W., Ingolic, E.: Int. Polym. Process. 12, p. 236 (1993)26 Jerschow, P., Janeschitz-Kriegl, H.: Rheol. Acta 35, p. 127 (1996)27 Jerschow, P., Janeschitz-Kriegl, H.: Int. Polym. Process. 12, p. 72
(1997)28 Monasse, B.: J. Mater. Sci. 27, p. 6047 (1992)29 Vleeshouwers, S., Meijer, H. E. H.: Rheol. Acta 35, p. 391 (1996)30 Kumaraswamy, G., Verma, R. K., Issaian, A. M., Wang, P., Korn-
field, J. A., Yeh, F., Hsiao, B. S., Olley, R. H.: Polymer 41, p. 8931(2000)
31 Duplay, C., Monasse, B., Haudin, J.-M., Costa, J.-L.: J. Mater. Sci.35, p. 6093 (2000)
32 Gahleitner, M., Bachner, C., Ratajski, E., Rohaczek, G., Neifil, W.:J. Appl. Polym. Sci. 73, p. 2507 (1999)
33 Magill, J. H.: J. Polym. Sci. Part-A2 5, p. 89 (1967)34 Blundell, D. J., Mahendrasingam, A., Martin, C., Fuller, W.,
MacKerron, D. H., Harvie, J. L., Oldman, R. J., Riekel, C.: Polymer41, p. 7793 (2000)
35 Mahendrasingam, A., Blundell, D. J., Martin, C., Fuller, W.,MacKerron, D. H., Harvie, J. L., Oldman, R. J., Riekel, C.: Polymer41, p. 7803 (2000)
36 Larson, R. G.: Constitutive Equations for Polymer Melts and Solu-tions, Butterworths Publishers (1988)
37 McLeish, T. C. B., Larson, R. G.: J. Rheol. 42, p. 81 (1998)38 Verbeeten, W. M. H., Peters, G. W. M., Baaijens, F. P. T: J. Rheol.
45, p. 823 (2001)39 Bird, R. B., Curtiss, C. F., Armstrong, R. C., Hassager, O.: Dy-
namics of Polymeric Liquids, John Wiley and Sons, New York40 Schneider, W., Köppl, A., Berger, J.: Int. Polym. Process. 2, p. 151
(1988)41 Zuidema, H., Peters, G. W. M., Meijer, H. E. H.: Macromol. Theory
Simul. 10, p. 447 (2001)42 Zuidema, H.: Ph.D. thesis, Eindhoven University of Technology,
www.mate.tue.nl, Eindhoven (2000)43 Swartjes, F. H. M.: Ph.D. thesis, Eindhoven University of Technol-
ogy, www.mate.tue.nl, Eindhoven (2001)44 Fuller, G. G.: Optical Rheometry of Complex Fluids. Oxford Uni-
versity Press (1995)45 Hammersley, A. P., Svensson, S. O., Thompson, A.: Nucl. Instrum.
Methods Phys. Res. Sect. A 346, p. 312 (1994)46 Douven, L. F. A., Baaijens, F. P. T, Meijer, H. E. H.: Prog. Polym.
Sci. 20, p. 403 (1995)47 Segal, A.: Manual SEPRAN package. Ingenieursburo SEPRA,
Leidschendam, The Netherlands (1992)48 Anderson, P. D.: Ph.D. thesis, Eindhoven University of Technology,
www.mate.tue.nl, Eindhoven (1999)49 Verbeeten, W. M. H., Peters, G. W. M., Baaijens, F. P. T.: Non-New-
tonian Fluid Mech. in press (2002)50 Azzam, R. M. A.: J. Opt. Soc. Am. 68, p. 1756 (1978)51 Fuller, G. G., Mikkelsen, K. J.: J. Rheol. 33, p. 761 (1989)52 Swartjes, F. H. M.: Master’s thesis WFW 96.157, Eindhoven Uni-
versity of Technology, Eindhoven (1996)53 Nadella, H. P., Henson, H. M., Spruiell, J., White, J. L.: J. Appl.
Polym. Sci. 21, p. 3003 (1977)54 Bove, L., Nobile, M. R.: Macromol. Symp. 180, p. 169 (2002)55 Doufas, A. K., McHugh, A. J., Miller, C., Immaneni, A.: J. Non-
Newtonian Fluid Mech. 92, p. 81 (2000)56 Göschel, U., Swartjes, F. H. M., Peters, G. W. M., Meijer, H. E. H.:
Polymer 41, p. 1541(2000)57 Kumaraswamy, G., Issaian, A. M., Kornfield, J. A.: Macromolecules
32, p. 7537 (1999)58 Masubuchi, Y., Watanabe, K., Nagatake, W., Takimoto, J.-I., Koya-
ma, K.: Polymer 42, p. 5023 (2001)59 Monasse, B.: J. Mater. Sci. 30, p. 5002 (1995)60 Pogodina, N. V., Winter, H. H., Srinivas, S.: J. Polym. Sci. Part B:
Polym. Phys. 37, p. 3512 (1999)61 Ryan, A. J., Fairclough, J. P. A., Terrill, N. J., Olmsted, P. D.,
Poon, W. C. K.: Faraday Discuss. 112, p. 13 (1999)62 Samon, J. M., Schultz, J. M., Hsiao, B. S., Seifert, S., Stribeck, N.,
Gurke, I., Collins, G., Saw, C.: Macromolecules 32, p. 8121 (1999)63 Somani, R. H., Hsiao, B. S., Nogales, A., Srinivas, S., Tsou, A. H.,
Sics, I., Balta-Calleja, F. J., Ezquerra, T. A.: Macromolecules 33,p. 9385 (2000)
64 Jerschow, P.: Ph.D. thesis, Johannes Kepler Universität, Linz, Aus-tria (1994)
65 Fujiyama, M., Wakino, T.: J. Appl. Polym. Sci. 35, p. 29 (1988)66 Kalay, G., Allan, P., Bevis, J.: Polymer 35, p. 2480 (1994)67 Norton, D. R., Keller, A.: Polymer 26, p. 704 (1985)68 Lovinger, A. J.: J. Polym. Sci. Polym. Phys. Ed. 21, p. 97 (1983)69 Andersen, P. G., Carr, S. H.: J. Mater. Sci. 10, p. 870 (1975)
Acknowledgments
The ESRF is acknowledged for using their facilities and theirprogram ‘Fit2d’. Special thanks to the scientists of the materi-als beam-line ID11 and the microfocus beam-line ID13, in par-ticular Ann Terry (ID11), Manfred Burghammer (ID13) andChristian Riekel (ID13).
Date received: December 9, 2002Date accepted: December 15, 2002
66 Intern. Polymer Processing XVIII (2003) 1
© 2
003
Car
l Han
ser
Ver
lag,
Mun
ich,
Ger
man
y
ww
w.k
unst
stof
fe.d
e/IP
P
Not
for
use
in in
tern
et o
r in
tran
et s
ites.
Not
for
elec
tron
ic d
istr
ibut
ion.