stress-laminated wood bridge decks contents construction of stress-laminated timber bridge decks by...
TRANSCRIPT
United StatesDepartment ofAgriculture
Forest Service
ForestProductsLaboratory
ResearchPaperFPL-RP-495
Stress-LaminatedWood Bridge DecksExperimental andAnalytical Evaluations
Michael G. OlivaAl G. DimakisMichael A. RitterRoger L. Tuomi
Abstract Contents
Construction of stress-laminated timber bridge decks bytransverse prestressing of wood laminae is a relativelynew concept that originated in Ontario, Canada. Thisreport presents results of recent research completedon solid wood stress-laminated decks. The primaryobjective was to quantify the behavior of the bridgedecks when loaded with simulated truck loadings.Identification of an accurate analytical technique forpredicting deck response and development of a newsimplified prestressing anchorage system were alsoachieved. Our objectives were accomplished throughan experimental laboratory test program on full-size bridges followed by computer-aided analyticalcorrelation studies. A summary of the project andexperimental and analytical results is presented withconclusions and recommendations for tasks that shouldbe completed before stress-laminated decks are used inbridge construction.
Keywords: Timber, bridges, stress-laminating, pre-stressing, bridge decks, orthotropic plates, creep.
March 1990
Oliva, Michael G.; Dimakis, Al G.; Ritter, Michael A.;Tuomi, Roger L. 1990. Stress-laminated wood bridgedecks: experimental and analytical evaluations. Res.Pap. FPL-RP-495. Madison, WI: U.S. Department ofAgriculture, Forest Service, Forest Products Laboratory.24 p.
A limited number of free copies of this publicationare available to the public from the Forest ProductsLaboratory, One Gifford Pinchot Drive, Madison, WI53705-2398. Laboratory publications are sent to more than1,000 libraries in the United States and elsewhere.
Introduction . . . . . . . . . . . . . . . . . 1
Background . . . . . . . . . . . . . . . . 2
Objectives and Scope . . . . . . . . . . . . 2
Experimental Procedures . . . . . . . . . . . 3
Deck Construction . . . . . . . . . . . . . 3
Deck Testing . . . . . . . . . . . . . . . . 4
Material Properties . . . . . . . . . . . . 4
Loading . . . . . . . . . . . . . . . . . 5
Prestress Distribution . . . . . . . . . . . 6
Data Collection . . . . . . . . . . . . . . . 6
Prestress Distribution . . . . . . . . . . . 6
Vertical Deflections . . . . . . . . . . . . 6
Bridge Deck Testing Results . . . . . . . . . . 6
Vertical Loading . . . . . . . . . . . . . . 6
Prestress Distribution . . . . . . . . . . . . 8
Loss of Prestress Over Time . . . . . . . . . 8
Analytical Procedures . . . . . . . . . . . . . 10
Vertical Loading . . . . . . . . . . . . . . 10
Continuous Laminae . . . . . . . . . . . 11
Steel Channels . . . . . . . . . . . . . . 13
Butt Joints . . . . . . . . . . . . . . . . 13
Prestress Distribution . . . . . . . . . . . . 13
Analysis of Results . . . . . . . . . . . . . . 14
Moduli and Level of Prestress . . . . . . . . 14
Loss of Stress Over Time . . . . . . . . . . 15
Steel Channels . . . . . . . . . . . . . . . 15
Conclusions . . . . . . . . . . . . . . . . . 15
Analytical Capability . . . . . . . . . . . . 15
Elastic Constants . . . . . . . . . . . . . . 15
Loss of Stress Over Time . . . . . . . . . . 17
Prestress Distribution . . . . . . . . . . . . 17
Recommendations . . . . . . . . . . . . . . 17
Literature Cited . . . . . . . . . . . . . . . 18
Appendix: Plate Tests . . . . . . . . . . . . . 19
The Forest Products Laboratory is maintained in coopera-tion with the University of Wisconsin.
Stress-Laminated Wood Bridge DecksExperimental and Analytical Evaluations
Michael G. Oliva, Associate ProfessorAl G. Dimakis, graduate student1
Department of Civil and Environmental EngineeringUniversity of Wisconsin, Madison, Wisconsin
Michael A. Ritter, Research General Engineer2
Roger L. Tuomi, Research General Engineer3
Forest Products Laboratory, Madison, Wisconsin
Introduction
The U.S. Secretary of Transportation has estimatedthat 99,800 structurally deficient bridges exist in non-federal-aid highway networks. Most of these bridges arethe responsibility of State or local governments or ofthe Forest Service, U.S. Department of Agriculture.It is obvious that a substantial need has developedfor economical new bridges and for rehabilitation ofexisting bridges. This report focuses upon evaluatingthe behavior of timber bridges fabricated using anew method of longitudinal deck assembly. This newmethod of assembly, stress laminating, may provide aneconomical method of building new timber decks aswell as rehabilitating existing nail-laminated lumberbridge decks.
In addition to high maintenance costs, nail-laminatedlumber decks present a delamination problem. Analternative to the existing method of nailing may befound by stress-laminating the bridge deck. Decklumber in older bridges is laminated together by closelyspaced nails. When a wheel load is placed over alamina, the load is partially transferred into adjacentlaminae by the nails, acting as shear dowels.
1 Now Research Engineer, Weyerhaeuser, Tacoma,Washington2 Formerly Structural Engineer, National Forest
System, Division of Engineering, Washington, D.C.3 Retired.
Cyclic swelling due to moisture content variation andmovement from repeated loading, however, causesthe nails and laminae to loosen with time. Once thenails loosen, the transverse transfer of wheel loadsdecreases, and the deck no longer efficiently resists theloads, resulting in increased flexibility and movementof laminae. In this situation, maintenance becomesexpensive because the deck movement creates rapiddeterioration of the wearing surfaces.
Transverse prestressing or stress laminating the deckenables shear to be transferred among laminae by ameans other than a mechanical fastener. The wheelload is distributed among the laminae in this new sys-tem by friction and bending when the deck is stresslaminated together. The deck will be able to resisttransverse bending if the induced precompression ishigh enough to counteract the transverse flexural ten-sion stress. With this combination of load transfer andresistance mechanisms, the stress-laminated deck out-performs a nail-laminated deck and avoids the deterio-ration problem. However, it is essential that sufficientprecompression be induced during construction and re-main in the deck over its service life if the laminatingby stress is to be successful. Stress laminating is a rel-atively new system of bridge construction. Therefore,methods need to be identified and developed for apply-ing the prestress, for determining the necessary initiallevels of prestress to compensate for expected lossesover time, and for estimating the load-carrying capacityof the bridges.

Background
The U.S. Transportation Secretary’s third annual re-port to Congress (1982) provided a definitive descrip-tion of the deteriorated condition of our highway bridgesystem. Two hundred forty thousand bridges werelisted as structurally deficient or functionally obso-lete, representing an estimated replacement cost, of$18.8 billion. McWilliams (1984) indicated that theFederal Highway Administration found the rural collec-tor system of roads to be in the poorest condition, with90 percent of the listed bridge deficiencies.
The continued decline in the quality of the highwaysystem, and bridges in particular, is due to advancingage, deferred maintenance, and heavier or more fre-quent truck loading. Nearly 140,000 of the off-systembridges are more than 40 years old and were designedfor lower loads than are currently used in bridge designor experienced by actual bridges.
The first use of stress laminating to rehabilitate andupgrade the capacity of nail-laminated timber decks,and later use for replacement bridge construction, oc-curred in Ontario, Canada. Research completed by theOntario Ministry of Transportation and Communica-tion (MTC) in cooperation with Queen’s University(Batchelor and others 1979, 1981, 1982; Taylor 1981)showed that posttensioning considerably improvedthe load distribution characteristics of decks. Basedon their findings, the Ontario Highway Bridge DesignCode (OHBDC) (OMTC 1983) now includes specifica-tions for the design of stress-laminated wood deck sys-tems that have steel channel bulkheads located alongthe edge to distribute the stressing. The OHBDC de-sign techniques vary significantly from present designtechniques in the American Association of State High-way and Transportation Officials Standard Specifica-tions for Highway Bridges (AASHTO 1986). The loaddistribution assumed for prestressed bridges in theOHBDC is considerably higher than that currentlyallowed in the AASHTO specification for wood deckbridges with nailed connections. The AASHTO spec-ifications do not have separate distribution factors forprestressed bridges.
Although transverse prestressing is apparently beingused successfully in Ontario, there is a lack of infor-mation on the time-dependent losses of prestress, theoptimum distribution of prestress, the environmentaleffects, and the actual load distribution characteristics.
Simple design guides are also needed. Additional re-search seemed necessary, particularly with large-scalemodels, to identify more clearly the problems or bene-fits associated with the actual construction of this typeof system.
The construction and testing of the deck describedin this report, referred to as the FPL deck, followeda research program conducted on another stress-laminated deck as part of the University of Wisconsin’sresearch on solid-sawn stress-laminated wood decks.The earlier deck, which will be referred to in thisreport, was designated the Wheeler deck and wasassembled using 4- by 16-in. timber laminae witha span length of 48 ft. A complete description ofconstruction and testing of that deck was reported byOliva and Dimakis (1986).
Objectives and Scope
The overall objective was to verify the desirable be-havior of the bridge decks under simulated truck load-ings that had been identified in earlier Ontario studiesand the general design method compiled in Ontario.Secondary objectives included developing an analyti-cal modeling technique for predicting the behavior ofstress-laminated decks and for identifying new stressingand anchorage systems that could economically replacemethods required in the Ontario approach.
This report describes the extensive research that wascompleted during a first-phase study on the perfor-mance of full-size solid-stressed deck systems. Nu-merous simulated truck load tests were conducted onbridges, with and without steel channels placed at theedges of the deck, to investigate load resistance anddistribution of prestress induced into the deck fromthe tensioning rods and the possibility of replacingthe channels with alternative systems. The decks un-derwent various load tests in the University of Wis-consin Laboratory for Structures and Material Test-ing, and basic analytical correlation work was com-pleted. In the remainder of this report, a brief sum-mary of the project is followed by a detailed descriptionof the test program. Experimental and analytical re-sults are presented, along with conclusions and recom-mendations for tasks that should be completed beforestress-laminated decks are commonly used in bridgeconstruction.
2
Experimental Procedures
Verification of the behavior reported in the Ontariostudies and the development of new, more economicalstressing methods could only be achieved through aseries of experimental tests. Analytical simulationof the response of bridge decks could also be usedto efficiently examine how a wide range of designmodifications might improve bridge behavior. Butfirst, the analytical techniques were verified throughcomparison with the experimental data.
Several bridges of various configurations were testedin the laboratory to measure their overall vehicle-load-resisting capability with full-span wood laminae andbutt-jointed laminae. The impact of various stressingarrangements, such as spacing of prestressing rods andusing steel channel sections or plates at rod anchorages,was measured by comparing the bridge performancewhen the arrangements were modified. Achieving thenecessary level of prestress, without using hydraulic-jacking equipment, was also attempted in laboratorystudies by using specially threaded rods and tighteninganchor nuts to a specified torque.
Deck Construction
The stress-laminated bridge decks assembled in thelaboratory were of the configuration and componentsas follows:
• The deck was 24 ft long (clear spans of 12 and23.5 ft) and 8 ft 8 in. wide and made of 70 verticallaminae nominal surfaced 2- by 12-in. Douglas-firNo. 1 or Better
• A steel channel (C10 × 15) was used on both sidesof the deck when needed to perform certain tests incombination with small bearing plates
• Prestressing rods were spaced at 2- and 4-ft intervals
• Rods were 3/4 in. diameter, 150 × 103 lb/in2 steel,and 9- by 9- by 3/4-in. steel plates were used asbearing plates when the steel channels were notused.
The design of the experimental bridge was in generalaccord with the OHBDC design specifications. In theinitial configuration, the deck consisted of 2- by 12-in.by 24-ft full-span laminae. Subsequently, the laminaewere cut to lengths of 6, 10, 14, and 18 ft and laid out
such that butt joints in adjacent pieces occurred in aprecise sequence.
The deck was tested at two different span lengths, 12 ftand 24 ft. Rods to prestress the deck were placed at2-ft intervals initially and later at 4-ft intervals to studythe effect of rod spacing on the stiffness and prestressdistribution.
Construction of the deck was possible without theassistance of heavy machinery. Several laminae weretransferred from the stockpile inside the laboratoryto their permanent position, and rods were insertedthrough the predrilled holes. This procedure wasrepeated until construction of the deck was completed.The flexibility of the small prestressing rods (3/4-in. diameter) and misalignment problems made itnecessary to assemble the deck laminae and insert therods simultaneously. When all the pieces were in place,the system was prestressed.
The objective of developing a simple stressing methodwas pursued by trying a manual torquing procedure asa means of applying prestress by relating rod tension toapplied torque on an anchor nut. The special threadedhigh strength rods, manufactured by Dywidag Inc.,which were used on the Wheeler deck (Oliva andDimakis 1986), cannot be calibrated reliably due to thelong pitch of the thread. Rods used on this deck werestandard machine threaded with a very small pitch.Torque calibration tests conducted using a torquewrench prior to testing of the deck gave unreliableresults. An attempt to improve the results by usingTeflon4 washers was unsuccessful, thus the procedurewas abandoned. All subsequent stressings were doneusing a hydraulic jack and pump.
The major problem encountered during constructionwas inserting the rods through the predrilled holes.Misalignment of the holes or warping of the wood candelay construction considerably. The holes shouldbe drilled oversize to twice the bar diameter to makeinsertion possible.
Illustrations of the construction of the FPL deck,the Wheeler deck (Oliva and Dimakis 1986), and the
4 The use of trade or firm names in this publication isfor reader information and does not imply endorsementby the U.S. Department of Agriculture of any productor service.
3
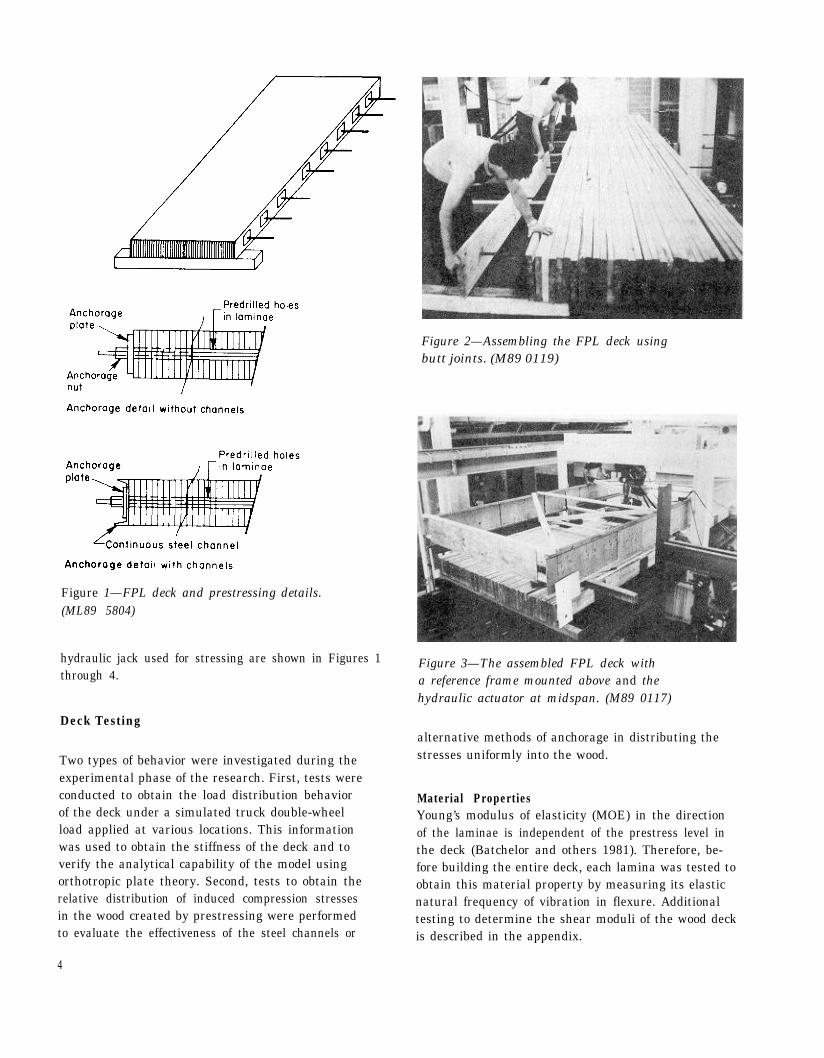
Figure 1—FPL deck and prestressing details.(ML89 5804)
hydraulic jack used for stressing are shown in Figures 1through 4.
Deck Testing
Two types of behavior were investigated during theexperimental phase of the research. First, tests wereconducted to obtain the load distribution behaviorof the deck under a simulated truck double-wheelload applied at various locations. This informationwas used to obtain the stiffness of the deck and toverify the analytical capability of the model usingorthotropic plate theory. Second, tests to obtain therelative distribution of induced compression stressesin the wood created by prestressing were performedto evaluate the effectiveness of the steel channels or
Figure 2—Assembling the FPL deck usingbutt joints. (M89 0119)
Figure 3—The assembled FPL deck witha reference frame mounted above and thehydraulic actuator at midspan. (M89 0117)
alternative methods of anchorage in distributing thestresses uniformly into the wood.
Material PropertiesYoung’s modulus of elasticity (MOE) in the directionof the laminae is independent of the prestress level inthe deck (Batchelor and others 1981). Therefore, be-fore building the entire deck, each lamina was tested toobtain this material property by measuring its elasticnatural frequency of vibration in flexure. Additionaltesting to determine the shear moduli of the wood deckis described in the appendix.
4
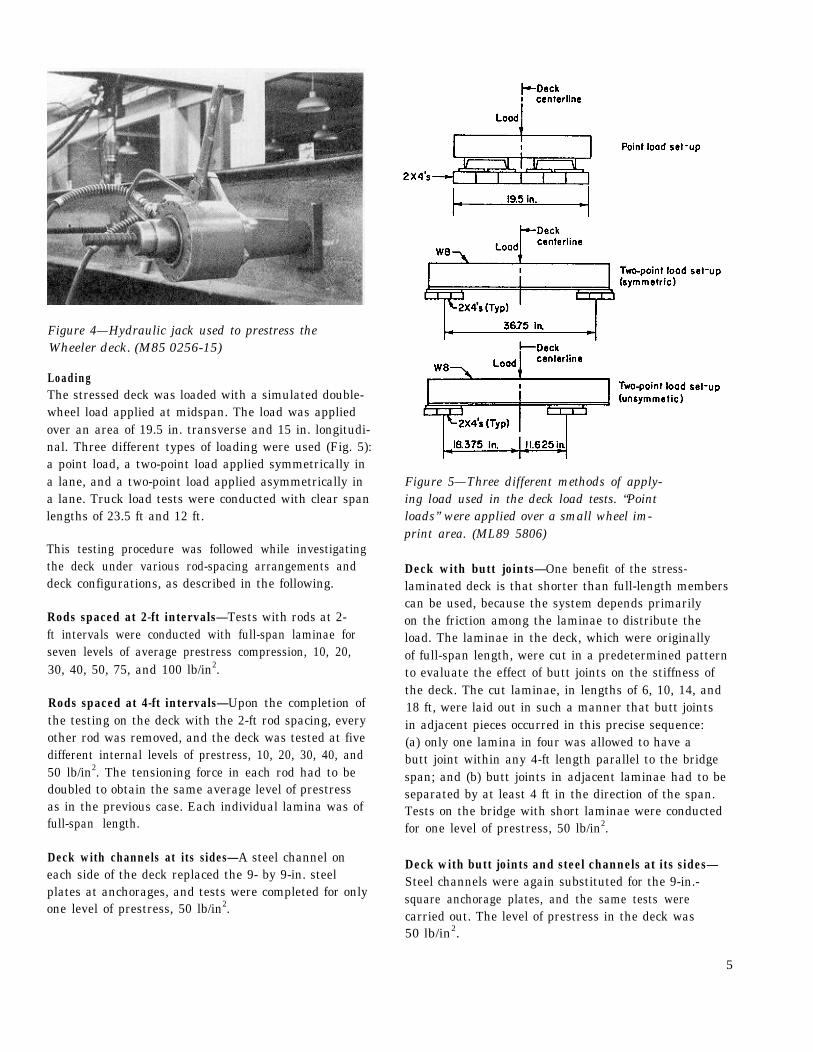
Figure 4—Hydraulic jack used to prestress theWheeler deck. (M85 0256-15)
LoadingThe stressed deck was loaded with a simulated double-wheel load applied at midspan. The load was appliedover an area of 19.5 in. transverse and 15 in. longitudi-nal. Three different types of loading were used (Fig. 5):a point load, a two-point load applied symmetrically ina lane, and a two-point load applied asymmetrically ina lane. Truck load tests were conducted with clear spanlengths of 23.5 ft and 12 ft.
This testing procedure was followed while investigatingthe deck under various rod-spacing arrangements anddeck configurations, as described in the following.
Rods spaced at 2-ft intervals—Tests with rods at 2-ft intervals were conducted with full-span laminae forseven levels of average prestress compression, 10, 20,30, 40, 50, 75, and 100 lb/in2.
Rods spaced at 4-ft intervals—Upon the completion ofthe testing on the deck with the 2-ft rod spacing, everyother rod was removed, and the deck was tested at fivedifferent internal levels of prestress, 10, 20, 30, 40, and50 lb/in2. The tensioning force in each rod had to bedoubled to obtain the same average level of prestressas in the previous case. Each individual lamina was offull-span length.
Deck with channels at its sides—A steel channel oneach side of the deck replaced the 9- by 9-in. steelplates at anchorages, and tests were completed for onlyone level of prestress, 50 lb/in2.
Figure 5—Three different methods of apply-ing load used in the deck load tests. “Pointloads” were applied over a small wheel im-print area. (ML89 5806)
Deck with butt joints—One benefit of the stress-laminated deck is that shorter than full-length memberscan be used, because the system depends primarilyon the friction among the laminae to distribute theload. The laminae in the deck, which were originallyof full-span length, were cut in a predetermined patternto evaluate the effect of butt joints on the stiffness ofthe deck. The cut laminae, in lengths of 6, 10, 14, and18 ft, were laid out in such a manner that butt jointsin adjacent pieces occurred in this precise sequence:(a) only one lamina in four was allowed to have abutt joint within any 4-ft length parallel to the bridgespan; and (b) butt joints in adjacent laminae had to beseparated by at least 4 ft in the direction of the span.Tests on the bridge with short laminae were conductedfor one level of prestress, 50 lb/in2.
Deck with butt joints and steel channels at its sides—Steel channels were again substituted for the 9-in.-square anchorage plates, and the same tests werecarried out. The level of prestress in the deck was50 lb/in2.
5
Prestress DistributionThe OHBDC requires steel channels along the edgesof stressed wood decks to distribute the prestress uni-formly into the wood laminae. To evaluate the effectof the steel channels, the deformations in a transversedirection were measured within a region of the deck ad-jacent to a single rod as the prestress in the rod wasvaried. The test was repeated three times: once withthe rods spaced at 2-ft intervals, then with rods spacedat 4-ft intervals with only the 9- by 9-in. steel bearingplates, and finally with the steel channels replacing theplates and using 4-ft rod spacing.
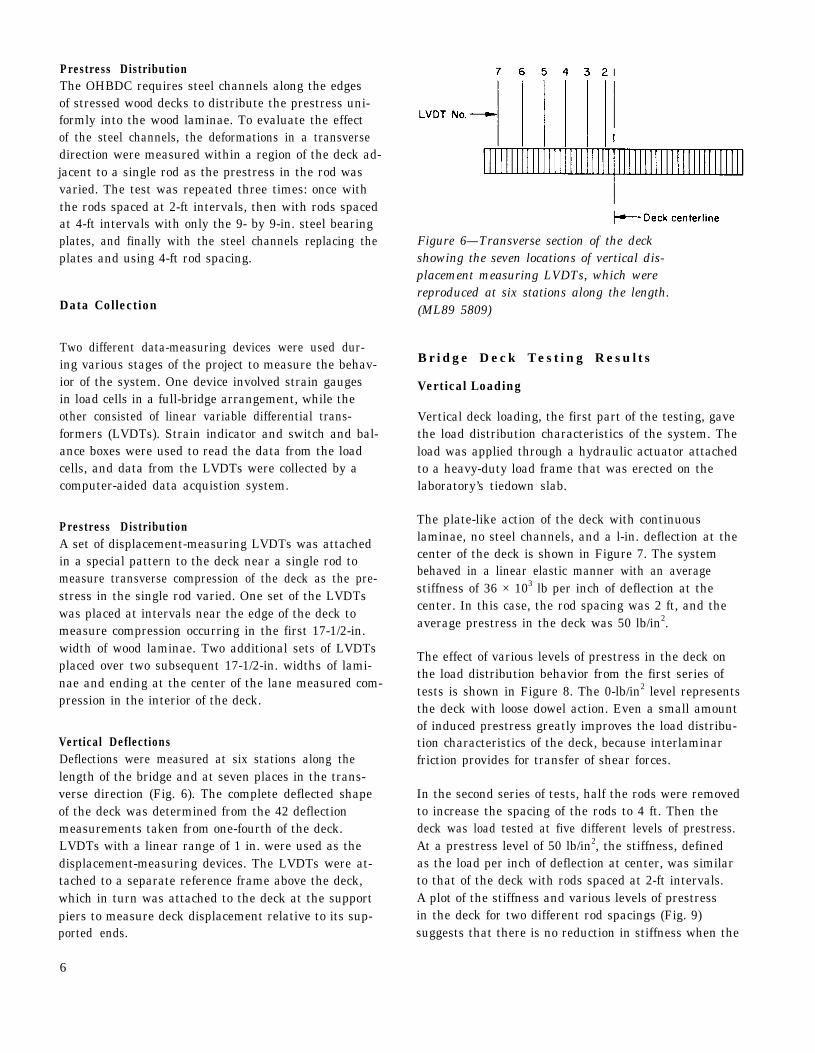
Figure 6—Transverse section of the deckshowing the seven locations of vertical dis-placement measuring LVDTs, which werereproduced at six stations along the length.(ML89 5809)Data Collection
Two different data-measuring devices were used dur-ing various stages of the project to measure the behav-ior of the system. One device involved strain gaugesin load cells in a full-bridge arrangement, while theother consisted of linear variable differential trans-formers (LVDTs). Strain indicator and switch and bal-ance boxes were used to read the data from the loadcells, and data from the LVDTs were collected by acomputer-aided data acquistion system.
Prestress DistributionA set of displacement-measuring LVDTs was attachedin a special pattern to the deck near a single rod tomeasure transverse compression of the deck as the pre-stress in the single rod varied. One set of the LVDTswas placed at intervals near the edge of the deck tomeasure compression occurring in the first 17-1/2-in.width of wood laminae. Two additional sets of LVDTsplaced over two subsequent 17-1/2-in. widths of lami-nae and ending at the center of the lane measured com-pression in the interior of the deck.
Vertical DeflectionsDeflections were measured at six stations along thelength of the bridge and at seven places in the trans-verse direction (Fig. 6). The complete deflected shapeof the deck was determined from the 42 deflectionmeasurements taken from one-fourth of the deck.LVDTs with a linear range of 1 in. were used as thedisplacement-measuring devices. The LVDTs were at-tached to a separate reference frame above the deck,which in turn was attached to the deck at the supportpiers to measure deck displacement relative to its sup-ported ends.
Bridge Deck Testing Results
Vertical Loading
Vertical deck loading, the first part of the testing, gavethe load distribution characteristics of the system. Theload was applied through a hydraulic actuator attachedto a heavy-duty load frame that was erected on thelaboratory’s tiedown slab.
The plate-like action of the deck with continuouslaminae, no steel channels, and a l-in. deflection at thecenter of the deck is shown in Figure 7. The systembehaved in a linear elastic manner with an averagestiffness of 36 × 103 lb per inch of deflection at thecenter. In this case, the rod spacing was 2 ft, and theaverage prestress in the deck was 50 lb/in2.
The effect of various levels of prestress in the deck onthe load distribution behavior from the first series oftests is shown in Figure 8. The 0-lb/in2 level representsthe deck with loose dowel action. Even a small amountof induced prestress greatly improves the load distribu-tion characteristics of the deck, because interlaminarfriction provides for transfer of shear forces.
In the second series of tests, half the rods were removedto increase the spacing of the rods to 4 ft. Then thedeck was load tested at five different levels of prestress.At a prestress level of 50 lb/in2, the stiffness, definedas the load per inch of deflection at center, was similarto that of the deck with rods spaced at 2-ft intervals.A plot of the stiffness and various levels of prestressin the deck for two different rod spacings (Fig. 9)suggests that there is no reduction in stiffness when the
6
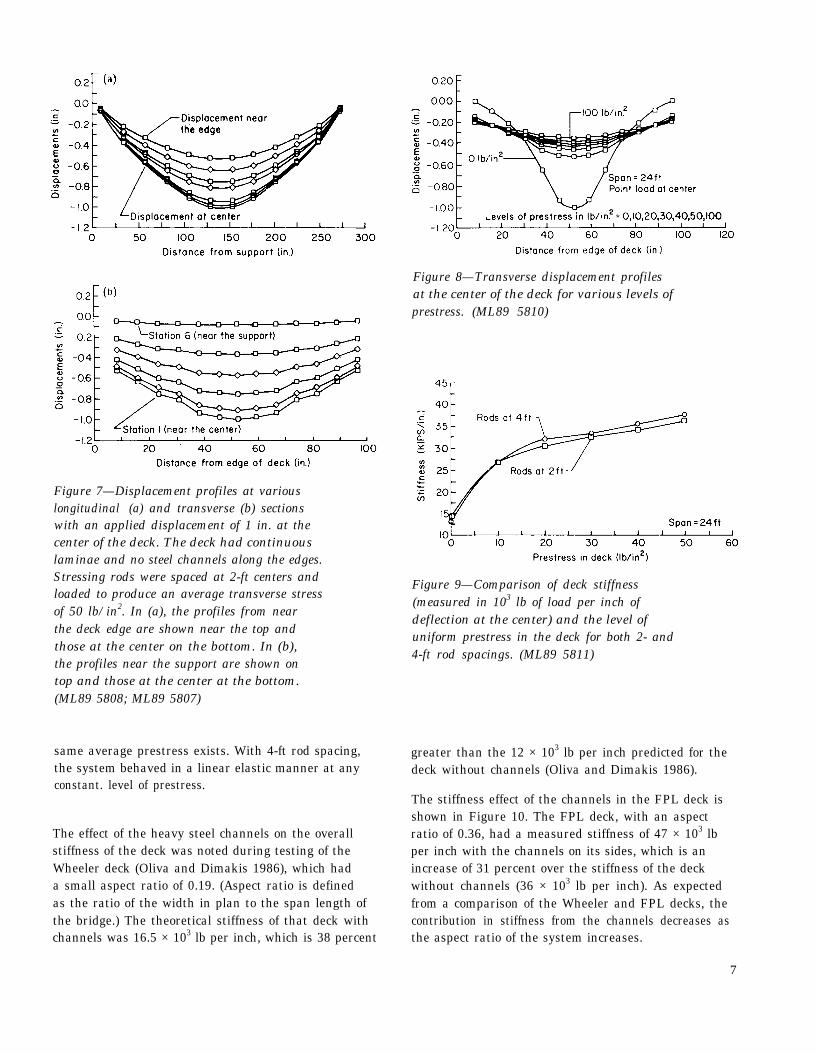
Figure 7—Displacement profiles at variouslongitudinal (a) and transverse (b) sectionswith an applied displacement of 1 in. at thecenter of the deck. The deck had continuouslaminae and no steel channels along the edges.Stressing rods were spaced at 2-ft centers andloaded to produce an average transverse stressof 50 lb/in2. In (a), the profiles from nearthe deck edge are shown near the top andthose at the center on the bottom. In (b),the profiles near the support are shown ontop and those at the center at the bottom.(ML89 5808; ML89 5807)
same average prestress exists. With 4-ft rod spacing,the system behaved in a linear elastic manner at anyconstant. level of prestress.
The effect of the heavy steel channels on the overallstiffness of the deck was noted during testing of theWheeler deck (Oliva and Dimakis 1986), which hada small aspect ratio of 0.19. (Aspect ratio is definedas the ratio of the width in plan to the span length ofthe bridge.) The theoretical stiffness of that deck withchannels was 16.5 × 10³ lb per inch, which is 38 percent
Figure 8—Transverse displacement profilesat the center of the deck for various levels ofprestress. (ML89 5810)
Figure 9—Comparison of deck stiffness(measured in 103 lb of load per inch ofdeflection at the center) and the level ofuniform prestress in the deck for both 2- and4-ft rod spacings. (ML89 5811)
greater than the 12 × 103 lb per inch predicted for thedeck without channels (Oliva and Dimakis 1986).
The stiffness effect of the channels in the FPL deck isshown in Figure 10. The FPL deck, with an aspectratio of 0.36, had a measured stiffness of 47 × 103 lbper inch with the channels on its sides, which is anincrease of 31 percent over the stiffness of the deckwithout channels (36 × 103 lb per inch). As expectedfrom a comparison of the Wheeler and FPL decks, thecontribution in stiffness from the channels decreases asthe aspect ratio of the system increases.
7
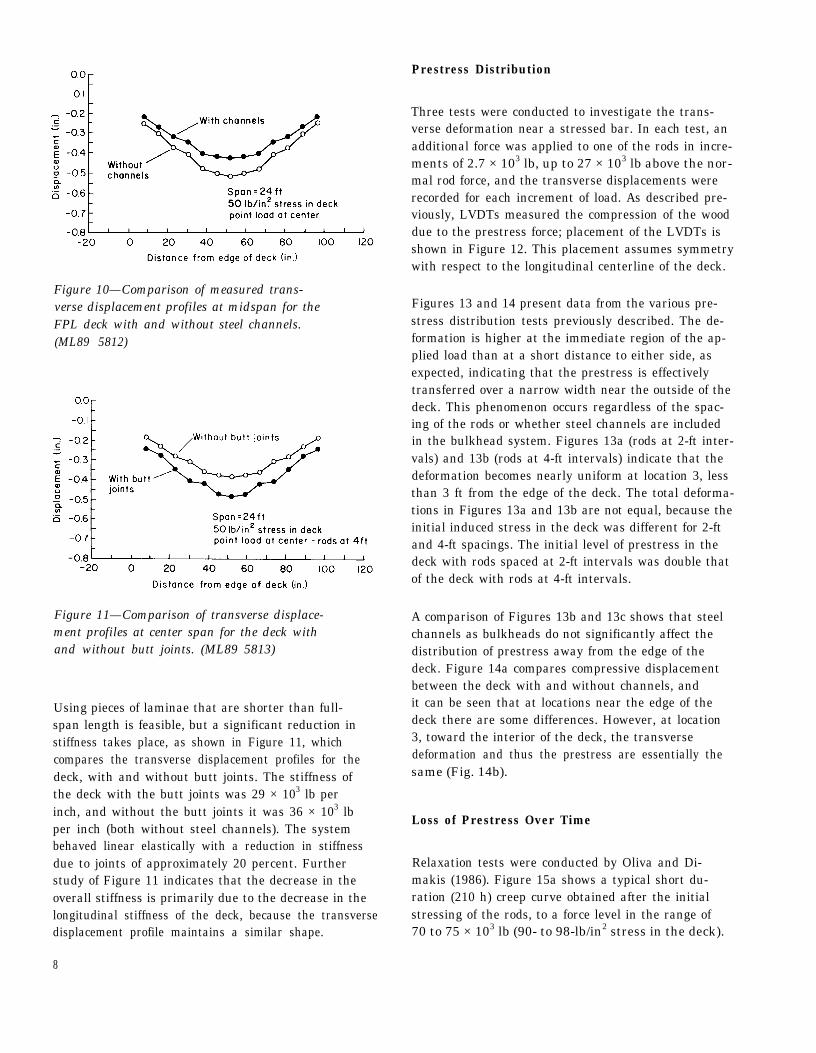
Prestress Distribution
Figure 10—Comparison of measured trans-verse displacement profiles at midspan for theFPL deck with and without steel channels.(ML89 5812)
Figure 11—Comparison of transverse displace-ment profiles at center span for the deck withand without butt joints. (ML89 5813)
Using pieces of laminae that are shorter than full-span length is feasible, but a significant reduction instiffness takes place, as shown in Figure 11, whichcompares the transverse displacement profiles for thedeck, with and without butt joints. The stiffness ofthe deck with the butt joints was 29 × 103 lb perinch, and without the butt joints it was 36 × 103 lbper inch (both without steel channels). The systembehaved linear elastically with a reduction in stiffnessdue to joints of approximately 20 percent. Furtherstudy of Figure 11 indicates that the decrease in theoverall stiffness is primarily due to the decrease in thelongitudinal stiffness of the deck, because the transversedisplacement profile maintains a similar shape.
Three tests were conducted to investigate the trans-verse deformation near a stressed bar. In each test, anadditional force was applied to one of the rods in incre-ments of 2.7 × 10³ lb, up to 27 × 103 lb above the nor-mal rod force, and the transverse displacements wererecorded for each increment of load. As described pre-viously, LVDTs measured the compression of the wooddue to the prestress force; placement of the LVDTs isshown in Figure 12. This placement assumes symmetrywith respect to the longitudinal centerline of the deck.
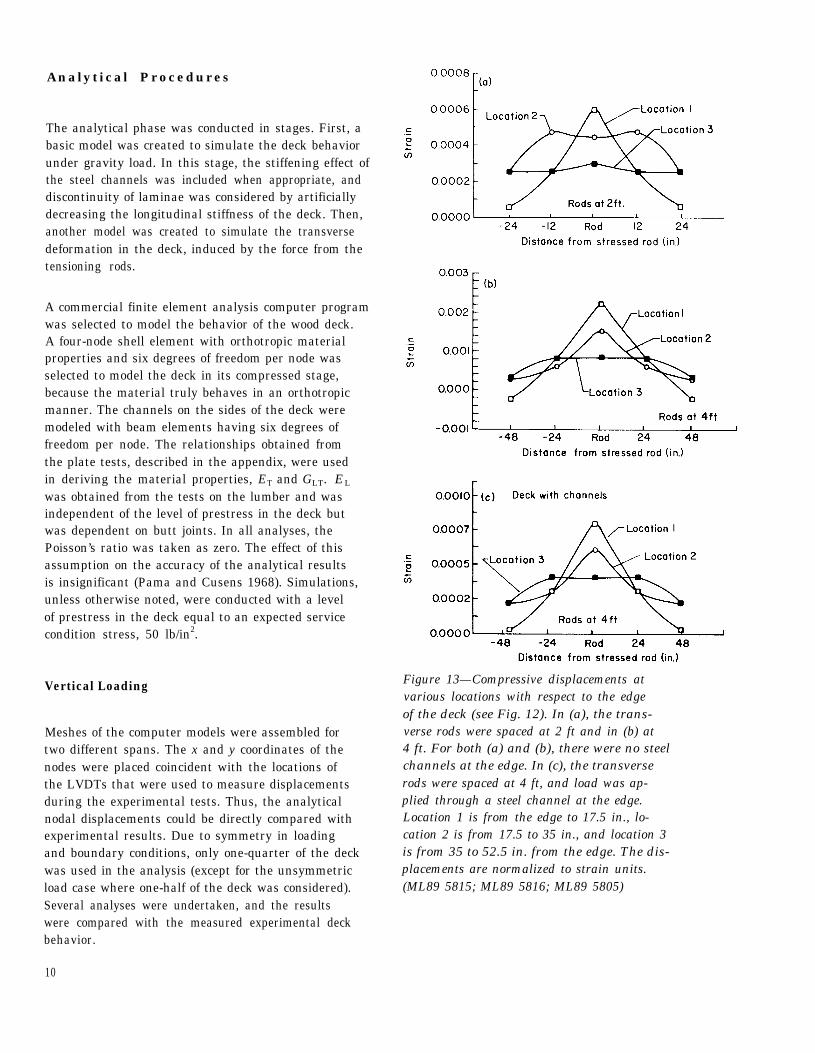
Figures 13 and 14 present data from the various pre-stress distribution tests previously described. The de-formation is higher at the immediate region of the ap-plied load than at a short distance to either side, asexpected, indicating that the prestress is effectivelytransferred over a narrow width near the outside of thedeck. This phenomenon occurs regardless of the spac-ing of the rods or whether steel channels are includedin the bulkhead system. Figures 13a (rods at 2-ft inter-vals) and 13b (rods at 4-ft intervals) indicate that thedeformation becomes nearly uniform at location 3, lessthan 3 ft from the edge of the deck. The total deforma-tions in Figures 13a and 13b are not equal, because theinitial induced stress in the deck was different for 2-ftand 4-ft spacings. The initial level of prestress in thedeck with rods spaced at 2-ft intervals was double thatof the deck with rods at 4-ft intervals.
A comparison of Figures 13b and 13c shows that steelchannels as bulkheads do not significantly affect thedistribution of prestress away from the edge of thedeck. Figure 14a compares compressive displacementbetween the deck with and without channels, andit can be seen that at locations near the edge of thedeck there are some differences. However, at location3, toward the interior of the deck, the transversedeformation and thus the prestress are essentially thesame (Fig. 14b).
Loss of Prestress Over Time
Relaxation tests were conducted by Oliva and Di-makis (1986). Figure 15a shows a typical short du-ration (210 h) creep curve obtained after the initialstressing of the rods, to a force level in the range of70 to 75 × 103 lb (90- to 98-lb/in2 stress in the deck).
8
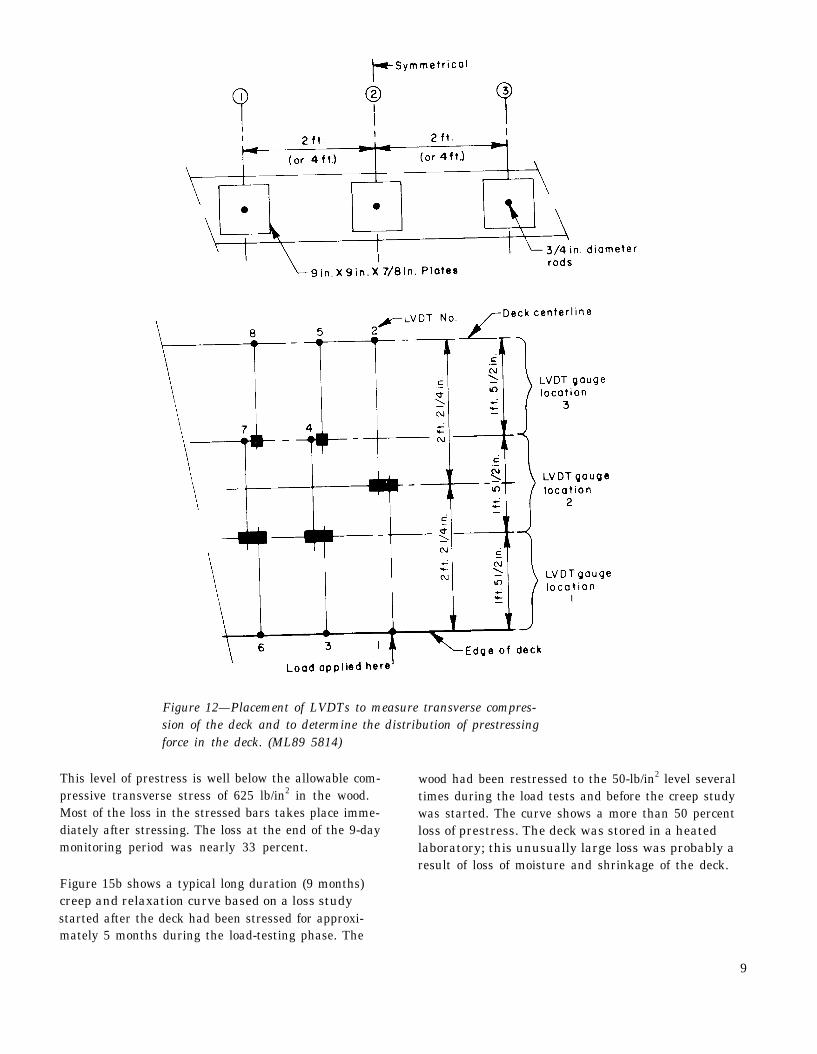
Figure 12—Placement of LVDTs to measure transverse compres-sion of the deck and to determine the distribution of prestressingforce in the deck. (ML89 5814)
This level of prestress is well below the allowable com-pressive transverse stress of 625 lb/in2 in the wood.Most of the loss in the stressed bars takes place imme-diately after stressing. The loss at the end of the 9-daymonitoring period was nearly 33 percent.
wood had been restressed to the 50-lb/in2 level severaltimes during the load tests and before the creep studywas started. The curve shows a more than 50 percentloss of prestress. The deck was stored in a heatedlaboratory; this unusually large loss was probably aresult of loss of moisture and shrinkage of the deck.
Figure 15b shows a typical long duration (9 months)creep and relaxation curve based on a loss studystarted after the deck had been stressed for approxi-mately 5 months during the load-testing phase. The
9
Analytical Procedures
The analytical phase was conducted in stages. First, abasic model was created to simulate the deck behaviorunder gravity load. In this stage, the stiffening effect ofthe steel channels was included when appropriate, anddiscontinuity of laminae was considered by artificiallydecreasing the longitudinal stiffness of the deck. Then,another model was created to simulate the transversedeformation in the deck, induced by the force from thetensioning rods.
A commercial finite element analysis computer programwas selected to model the behavior of the wood deck.A four-node shell element with orthotropic materialproperties and six degrees of freedom per node wasselected to model the deck in its compressed stage,because the material truly behaves in an orthotropicmanner. The channels on the sides of the deck weremodeled with beam elements having six degrees offreedom per node. The relationships obtained fromthe plate tests, described in the appendix, were usedin deriving the material properties, ET and GLT. EL
was obtained from the tests on the lumber and wasindependent of the level of prestress in the deck butwas dependent on butt joints. In all analyses, thePoisson’s ratio was taken as zero. The effect of thisassumption on the accuracy of the analytical resultsis insignificant (Pama and Cusens 1968). Simulations,unless otherwise noted, were conducted with a levelof prestress in the deck equal to an expected servicecondition stress, 50 lb/in2.
Vertical Loading
Meshes of the computer models were assembled fortwo different spans. The x and y coordinates of thenodes were placed coincident with the locations ofthe LVDTs that were used to measure displacementsduring the experimental tests. Thus, the analyticalnodal displacements could be directly compared withexperimental results. Due to symmetry in loadingand boundary conditions, only one-quarter of the deckwas used in the analysis (except for the unsymmetricload case where one-half of the deck was considered).Several analyses were undertaken, and the resultswere compared with the measured experimental deckbehavior.
10
Figure 13—Compressive displacements atvarious locations with respect to the edgeof the deck (see Fig. 12). In (a), the trans-verse rods were spaced at 2 ft and in (b) at4 ft. For both (a) and (b), there were no steelchannels at the edge. In (c), the transverserods were spaced at 4 ft, and load was ap-plied through a steel channel at the edge.Location 1 is from the edge to 17.5 in., lo-cation 2 is from 17.5 to 35 in., and location 3is from 35 to 52.5 in. from the edge. The dis-placements are normalized to strain units.(ML89 5815; ML89 5816; ML89 5805)
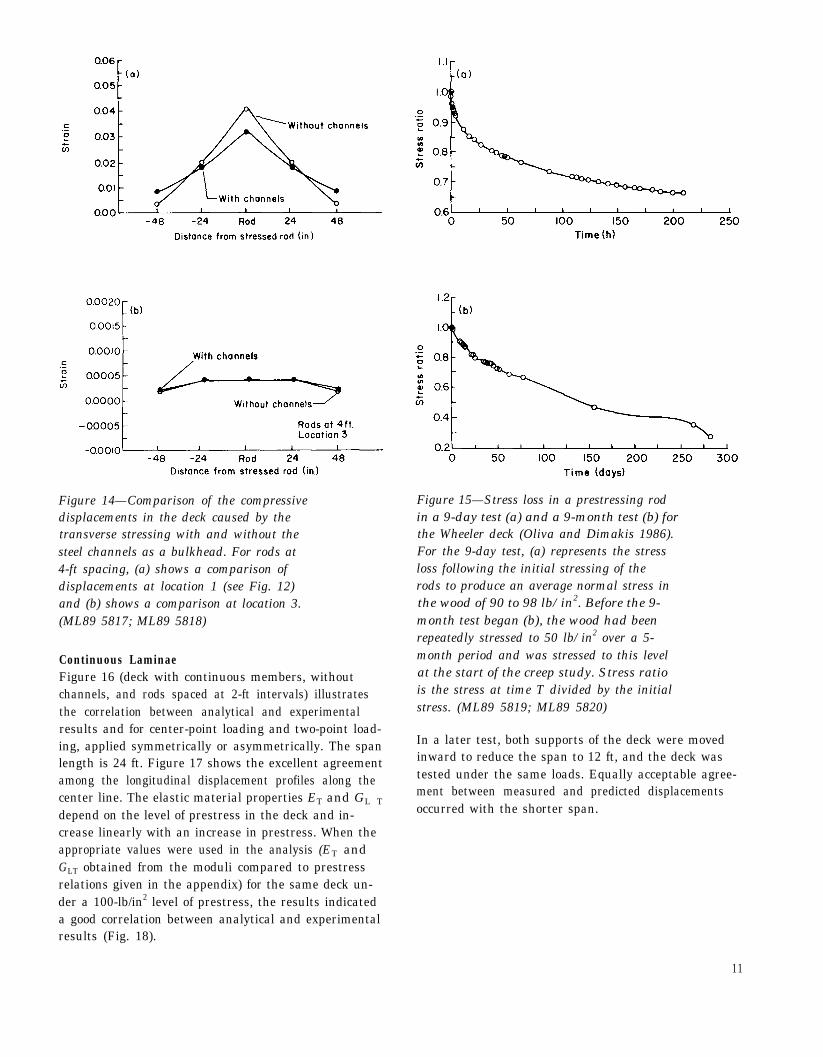
Figure 14—Comparison of the compressivedisplacements in the deck caused by thetransverse stressing with and without thesteel channels as a bulkhead. For rods at4-ft spacing, (a) shows a comparison ofdisplacements at location 1 (see Fig. 12)and (b) shows a comparison at location 3.(ML89 5817; ML89 5818)
Continuous LaminaeFigure 16 (deck with continuous members, withoutchannels, and rods spaced at 2-ft intervals) illustratesthe correlation between analytical and experimentalresults and for center-point loading and two-point load-ing, applied symmetrically or asymmetrically. The spanlength is 24 ft. Figure 17 shows the excellent agreementamong the longitudinal displacement profiles along thecenter line. The elastic material properties ET and GL T
depend on the level of prestress in the deck and in-crease linearly with an increase in prestress. When theappropriate values were used in the analysis (ET andGLT obtained from the moduli compared to prestressrelations given in the appendix) for the same deck un-der a 100-lb/in2 level of prestress, the results indicateda good correlation between analytical and experimentalresults (Fig. 18).
Figure 15—Stress loss in a prestressing rodin a 9-day test (a) and a 9-month test (b) forthe Wheeler deck (Oliva and Dimakis 1986).For the 9-day test, (a) represents the stressloss following the initial stressing of therods to produce an average normal stress inthe wood of 90 to 98 lb/in2. Before the 9-month test began (b), the wood had beenrepeatedly stressed to 50 lb/in2 over a 5-month period and was stressed to this levelat the start of the creep study. Stress ratiois the stress at time T divided by the initialstress. (ML89 5819; ML89 5820)
In a later test, both supports of the deck were movedinward to reduce the span to 12 ft, and the deck wastested under the same loads. Equally acceptable agree-ment between measured and predicted displacementsoccurred with the shorter span.
11
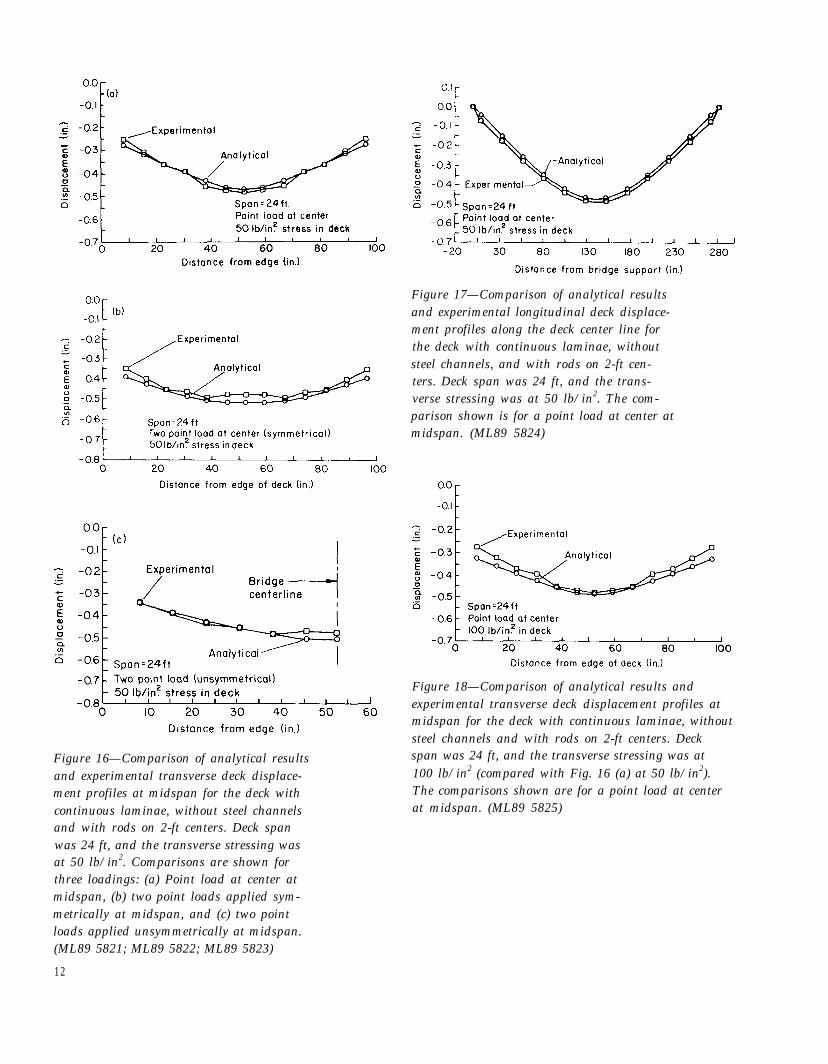
Figure 16—Comparison of analytical resultsand experimental transverse deck displace-ment profiles at midspan for the deck withcontinuous laminae, without steel channelsand with rods on 2-ft centers. Deck spanwas 24 ft, and the transverse stressing wasat 50 lb/in2. Comparisons are shown forthree loadings: (a) Point load at center atmidspan, (b) two point loads applied sym-metrically at midspan, and (c) two pointloads applied unsymmetrically at midspan.(ML89 5821; ML89 5822; ML89 5823)
Figure 17—Comparison of analytical resultsand experimental longitudinal deck displace-ment profiles along the deck center line forthe deck with continuous laminae, withoutsteel channels, and with rods on 2-ft cen-ters. Deck span was 24 ft, and the trans-verse stressing was at 50 lb/in2. The com-parison shown is for a point load at center atmidspan. (ML89 5824)
Figure 18—Comparison of analytical results andexperimental transverse deck displacement profiles atmidspan for the deck with continuous laminae, withoutsteel channels and with rods on 2-ft centers. Deckspan was 24 ft, and the transverse stressing was at100 lb/in2 (compared with Fig. 16 (a) at 50 lb/in2).The comparisons shown are for a point load at centerat midspan. (ML89 5825)
12

Steel ChannelsAnother set of experiments involved deck testing withthe steel channels on the sides. The analytical modelshad to be modified to include the stiffening effect of thechannels. The agreement between predicted and actualdisplacements is shown in Figure 19 for center-pointloading with two different levels of prestress.
Butt JointsThe last tests were conducted on the deck with buttjoints. The experimental results clearly indicate thatthe effective longitudinal stiffness is reduced when buttjoints are introduced into the system. A reduction instiffness was implemented in the plate analysis by de-creasing the longitudinal modulus EL. Reducing stiff-ness by 25 percent (because one of any four laminaemay have a butt joint in any 4-ft length along the deck)gave good agreement between analytical and experi-mental results. If any portion of a laminae 2 ft to ei-ther side of a butt joint was considered ineffective, thelongitudinal stiffness would theoretically be decreasedby 21 percent. Butt joints have little effect on thetransverse stiffness. The correlation of analytical andexperimental results is shown in Figure 20 when a lon-gitudinal stiffness reduction of 21 percent due to buttjoints is used.
Finally, an analysis was performed on the deck withbutt joints, including the contribution in stiffness fromthe steel channels. Again, good agreement betweenanalytical and experimental results was obtained.
Prestress Distribution
Plane stress-plane strain finite elements were used toanalytically model the deck and the anchorage plates,and a beam element was used to model the steel chan-nel team to try to simulate the compressive deforma-tion of the deck caused by a prestress force. The 2 andy coordinates of the nodes coincided with the locationof the LVDTs that were used to measure the transversein-plane displacements. The experimental data fromthe Wheeler deck (Oliva and Dimakis 1986) were usedto verify the analytical model (Fig. 21).
Figure 19—Comparison of analytical re-sults and experimental transverse deck dis-placement profiles at midspan for the deckwith continuous laminae, with steel chan-nels, and with rods on 2-ft centers. Deckspan was 24 ft, and the transverse stressingwas at 50 lb/in2 for (a) and 100 lb/in2 for(b). The comparisons shown are for a pointload at center at midspan. Compare withFigures 16(a) and 18 for the deck having nochannels. (ML89 5826; ML89 5827)
plates were provided to distribute the rod-bearing pres-sure over a satisfactory wood area. An analysis wasdone using 16- by 16- by 1-in. plates instead of thesteel channels on the Wheeler deck. Figure 22 indicatesthat, although the deformation is larger near the edge(Fig. 22a), at a distance into the interior of the deckless than 3 ft from the edge (Fig. 22b) the deformationsusing a channel or steel plate are essentially the same.
The displacement measurements taken near a pre-stressed rod indicate that the prestress is effectivelytransferred into the wood over a narrow width near theedge of the deck. This suggests that the steel channelbulkheads would not be necessary if substantial steel
13
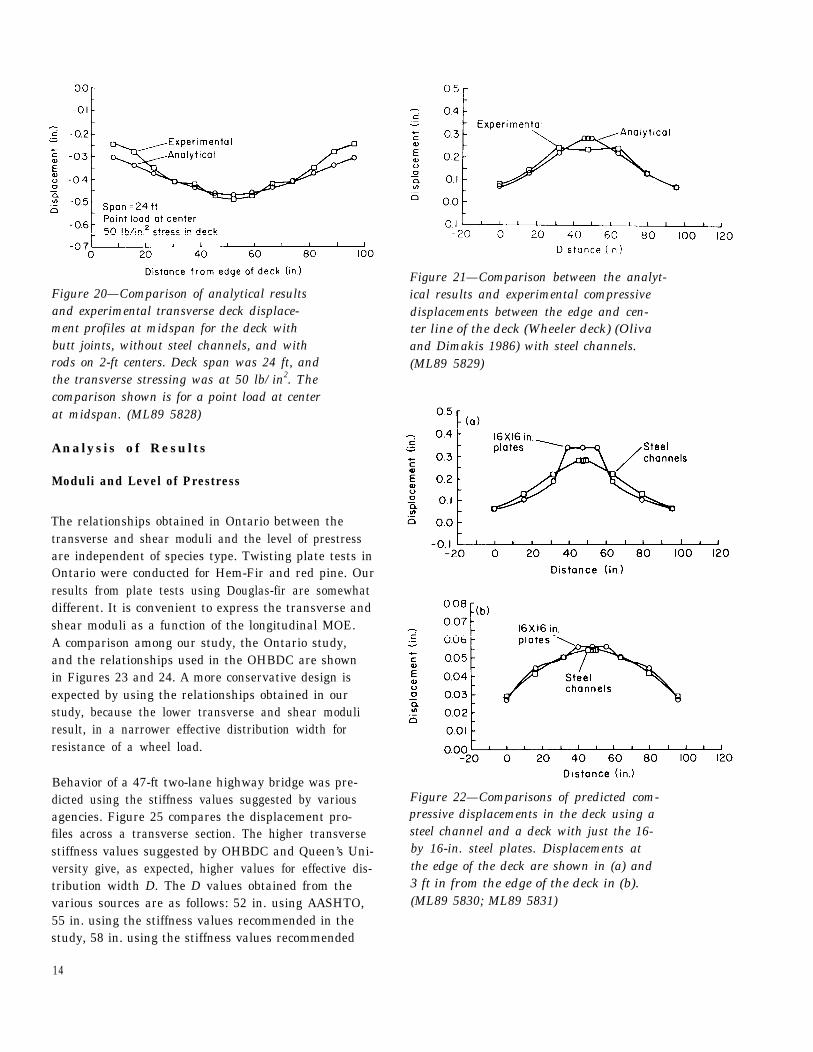
Figure 20—Comparison of analytical resultsand experimental transverse deck displace-ment profiles at midspan for the deck withbutt joints, without steel channels, and withrods on 2-ft centers. Deck span was 24 ft, andthe transverse stressing was at 50 lb/in2. Thecomparison shown is for a point load at centerat midspan. (ML89 5828)
Analysis of Results
Moduli and Level of Prestress
The relationships obtained in Ontario between thetransverse and shear moduli and the level of prestressare independent of species type. Twisting plate tests inOntario were conducted for Hem-Fir and red pine. Ourresults from plate tests using Douglas-fir are somewhatdifferent. It is convenient to express the transverse andshear moduli as a function of the longitudinal MOE.A comparison among our study, the Ontario study,and the relationships used in the OHBDC are shownin Figures 23 and 24. A more conservative design isexpected by using the relationships obtained in ourstudy, because the lower transverse and shear moduliresult, in a narrower effective distribution width forresistance of a wheel load.
Behavior of a 47-ft two-lane highway bridge was pre-dicted using the stiffness values suggested by variousagencies. Figure 25 compares the displacement pro-files across a transverse section. The higher transversestiffness values suggested by OHBDC and Queen’s Uni-versity give, as expected, higher values for effective dis-tribution width D. The D values obtained from thevarious sources are as follows: 52 in. using AASHTO,55 in. using the stiffness values recommended in thestudy, 58 in. using the stiffness values recommended
Figure 21—Comparison between the analyt-ical results and experimental compressivedisplacements between the edge and cen-ter line of the deck (Wheeler deck) (Olivaand Dimakis 1986) with steel channels.(ML89 5829)
Figure 22—Comparisons of predicted com-pressive displacements in the deck using asteel channel and a deck with just the 16-by 16-in. steel plates. Displacements atthe edge of the deck are shown in (a) and3 ft in from the edge of the deck in (b).(ML89 5830; ML89 5831)
14
by Queen’s University, and 61 in. following OHBDCrecommendations.
Steel Channels
Loss of Stress Over Time
The relaxation and creep behavior of the systemshould be well comprehended before construction ofthe stressed deck. The OHBDC predicts a total loss ofstress of 50 percent over time, based on results obtainedfrom several tests conducted at Queen’s Universityon small-scale models (Batchelor and others 1979,1982). The Queen’s University results indicate thatchanges in the relative humidity cause a change ofthe same sign in the stress ratio (prestress at time Tdivided by initial prestress) regardless of initial stress,stage in the stressing sequence, or ratio of prestressingelement stiffness to stiffness of wood being compressed.The magnitude of the eventual change in the stressratio depends upon the length of time the humidityis maintained at the new level. The wood respondsmore quickly to an increase in humidity than to adecrease. Also, note that the decrease in stress ratiofor a given percentage decrease in humidity is largerthan the increase in stress ratio for the same increase inhumidity. This would indicate that a cycle in humiditychange would result in a net reduction in the stressratio. The 50 percent total loss assumption was verifiedlater by tests conducted on the Hebert Creek Bridge(Taylor and others 1983).
However, recent unpublished information obtained fromOntario suggests that an actual loss of 60 percent maydevelop in some of the earlier bridges that used stresslaminating. A long-duration stress relaxation test con-ducted on the 47- by 9-ft Wheeler deck indicated aloss of stress exceeding 50 percent. The test was con-ducted under controlled temperature but uncontrolledhumidity conditions and moisture contents. Compar-ison of results from laboratory tests conducted here(9 months) and in Ontario (4 months) are shown inFigure 26. (Additional data to complete the Queen’sUniversity plot were extrapolated from a log fit expres-sion (Batchelor and others 1979).) A comparison oflong-duration creep results from a field test (HebertCreek Bridge) and a laboratory test (Wheeler deck)is shown in Figure 27. The increased creep loss in theWheeler bridge test may have been a result of decreas-ing moisture in the wood and subsequent shrinkage.
A steel channel bulkhead to distribute the prestressfrom the rod uniformly into the deck is required byOHBDC. Extensive measurements of prestress distribu-tion into the deck near a prestressing rod appear to in-dicate that the steel channel is unnecessary. We foundthat the prestress distribution characteristics of bothbulkhead systems are essentially the same (Fig. 22b)at a short distance from the edge. Removal of the steelchannels will effectively reduce construction complexityand cost. When the aesthetic appearance of the sidesof the deck is important, use of the steel channel sec-tion may be preferred, because local crushing of woodfibers and some splitting of the exterior laminae mayoccur and be visible when only steel plates are used.The same phenomena are likely to occur with channelsbut are no longer visible.
Conclusions
Our conclusions are based on experimental testing andsubsequent analytical studies, conducted on prestresseddecks of different rod configurations, anchorage config-urations, and span lengths constructed of two differenttypes of laminae.
Analytical Capability
A commercial finite element computer program withorthotropic plate modeling capabilities can accuratelypredict the behavior of stress-laminated bridge decks.An orthotropic plate Fourier series algorithm wassuccessfully used to verify the finite element analyticalcapability. The deformation responses obtained by bothanalyses agreed closely. Both analytical techniques arecapable of providing satisfactory simulation of actualstressed deck behavior as measured experimentally.
Elastic Constants
Longitudinal MOE can be obtained from static ordynamic beam tests and should generally be nearpublished values for the wood species and grade, butmodification is necessary to account for loss of stiffnesswhen butt joints are used. The transverse and shearmoduli increase linearly with the level of prestress in
15
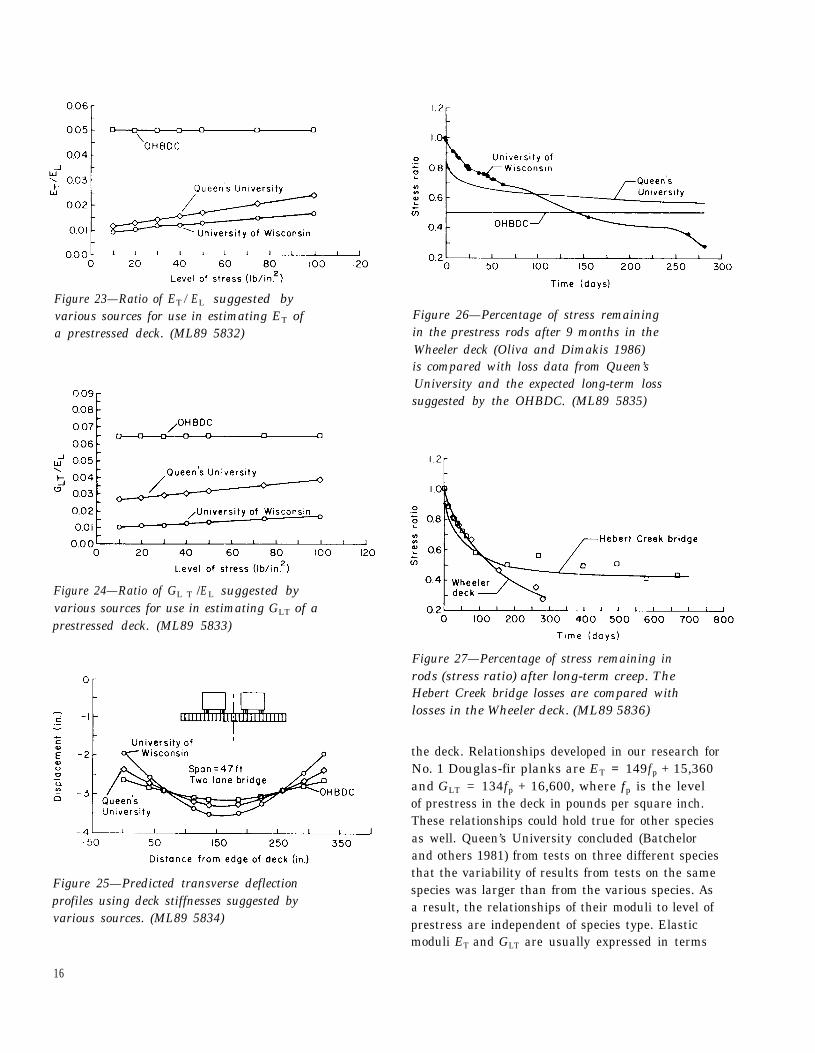
Figure 23—Ratio of ET /EL suggested byvarious sources for use in estimating ET ofa prestressed deck. (ML89 5832)
Figure 24—Ratio of GL T /EL suggested byvarious sources for use in estimating GLT of aprestressed deck. (ML89 5833)
Figure 25—Predicted transverse deflectionprofiles using deck stiffnesses suggested byvarious sources. (ML89 5834)
Figure 26—Percentage of stress remainingin the prestress rods after 9 months in theWheeler deck (Oliva and Dimakis 1986)is compared with loss data from Queen’sUniversity and the expected long-term losssuggested by the OHBDC. (ML89 5835)
Figure 27—Percentage of stress remaining inrods (stress ratio) after long-term creep. TheHebert Creek bridge losses are compared withlosses in the Wheeler deck. (ML89 5836)
the deck. Relationships developed in our research forNo. 1 Douglas-fir planks are ET = 149fp + 15,360and GLT = 134fp + 16,600, where fp is the levelof prestress in the deck in pounds per square inch.These relationships could hold true for other speciesas well. Queen’s University concluded (Batchelorand others 1981) from tests on three different speciesthat the variability of results from tests on the samespecies was larger than from the various species. Asa result, the relationships of their moduli to level ofprestress are independent of species type. Elasticmoduli ET and GLT are usually expressed in terms
16
of the longitudinal MOE. Recommended ratios underservice conditions (i.e., level of prestress of 50 lb/in2)are ET = 0.0129EL and GLT = 0.0132EL. In designinga prestressed deck, it is recommended that ET andGLT be obtained first, using these relations. Then themoduli and level of prestress relationships given inthis section should be used to solve for the constants(15,360 and 16,600 for the Douglas-fir in this program)by taking fp, = 50 lb/in2. The elastic constants ET
and GLT can then be obtained for the required levelof prestress. Note that these ratios vary significantlyfrom those recommended by Queen’s University orthe OHBDC, but they are more conservative. In theanalysis, the Poisson’s ratio can be taken as zero.A limited parameter study, conducted by varyingthe Poisson’s ratio, indicated that the effect of thisassumption on the accuracy of the analytical resultsis insignificant.
Loss of Stress Over Time
A long-duration (9 months) stress relaxation test wasconducted under dry environmental conditions on theWheeler deck after multiple stressings of the rods. Thetotal loss of rod prestress exceeded 60 percent, whichexceeds that predicted by the OHBDC. The wood-to-steel stiffness ratios (ET Aw /EsAps, appendix) for thedecks tested were in the range of 0.8 to 1.2, which isthe practical range for systems of this type.
Ontario (Batchelor 1979; Taylor 1983) has completedadditional studies on prestress loss. Their resultsindicate that changes in the relative humidity causea change of the same sign in the stress ratio (ratio ofprestress at time T to initial prestress). Also, notethat the decrease in stress ratio for a given percentagedecrease in humidity is larger than the increase instress ratio for the same increase in humidity. Thisindicates that a cycle in humidity change would resultin a net reduction in the stress ratio. Cyclic humiditychanges might cause greater overall loss of stress thanexpected at present.
Prestress Distribution
Assuming a 12-in. curb width, the minimum distancebetween the edge of the deck and the centerline ofdual wheels is likely to be greater than 20 in. Atthis distance from the edge, when plates of adequate
dimensions and stiffness are used for anchorage, theprestress distribution from a stressed rod is nearlyuniform if rods are spaced less than 4 ft apart. A moreuniform distribution is obtained near the edge whena heavy steel channel is used, as expected, but at 3 ftfrom the edge, the distribution of prestress for eitherthe channel or the steelplate bulkhead systems is thesame. Stress distribution plots. obtained when platesare used as the bulkhead system indicate that the stressdistribution from the stressed rod flows into the deck atapproximately a 45° angle from the rod centerline.
Recommendations
Tests conducted here and in Ontario have shown thattransverse prestressing considerably improves theload distribution characteristics over those of a nail-laminated lumber deck. The analytical capability of theorthotropic plate theory has been verified extensively.However, questions remain regarding design and use ofstressed deck bridges.
Tests on small-scale specimens conducted in Ontariohave shown that the wood responds quickly to a changein relative humidity and that a cycle in humiditychange results in a net reduction in the stress ratio.Difference in the scale between laboratory specimensand actual structures influences the migration ofmoisture and consequently the amount of prestressloss that may occur due to moisture cycling. Specifictesting is needed to investigate cyclic moisture changesthat occur in a full-size creosote-treated wood deck andtheir effect in changing the level of prestress.
Additional development work needs to be completed,from the construction point of view, to allow the con-nection of multiple prebuilt panels with full prestress-ing during erection. A method was developed by Olivaand Dimakis (1988) to connect two separate plant-builtpanels and attain continuous prestressing across thejoint without needing any temporary supports or scaf-folding. Similar construction methods should be de-veloped for bridges with lane widths that require morethan two prebuilt panels.
Our study and the studies at Queen’s University in On-tario successfully used orthotropic plate modeling topredict the behavior of stressed wood decks. However,the relationships determined in the two research pro-grams to define transverse stiffness and shear stiffness
17
moduli of the deck are substantially different. Addi-tional parameter studies should be completed to iden-tify the sensitivity of predicted results to those stiffnessmoduli and to guide analysts in selecting the correct,relationships.
Literature Cited
18

Appendix :
Plate Tests
Plate Tests toObtain Elastic Constants
A method proposed by Tsai (1965) was used to obtainthe elastic constants GLT and ET for various levels ofprestress. The method involved twisting tests on threesquare plates of different laminae orientation. Datafrom these tests were used to develop relationshipsbetween the effective elastic moduli and the level ofprestress in the deck.
Young’s MOE
A dynamic MOE machine from the FPL was usedto obtain the longitudinal modulus of the individual2 by 12 (nominal) lamina. Each beam was positionedflatwise on two knife supports; cross-section dimen-sions were measured. Then, free vibration was im-posed on the member, and a sensing device read thenatural period of the vibrating lamina. This infor-mation was used to obtain MOE, the effective mate-rial modulus parallel to grain. Each beam was testedthree times. The average MOE of the 78 pieces was1.77 × 106 lb/in2 with a coefficient of variation of22.1 percent. This average was used in the analysisstage of the study.
Twisting Plate Tests toObtain Elastic Constants
Elastic moduli ET and GLT (the transverse elasticand shear moduli) are usually expressed in terms ofthe longitudinal MOE. Typical relationships that areused for Douglas-fir glulam decks or solid wood areET = 0.05EL and GLT = 0.078EL. These ratios, whenused in a previous study (Oliva and Dimakis 1986), didnot give good correlation between experimental andpredicted response. Ratios that provided the closestanalytic and experimental correlation were ET =0.011EL, and GLT = 0.012EL for a level of prestressin the deck equal to 50 lb/ in2. Currently, the OHBDCuses the ET = 0.05EL and GLT = 0.065EL in the designof stressed wood decks. A study conducted at Queen’sUniversity indicates that these relationships are validfor stressed decks made out of red pine under a high
level of prestress, 130 lb/in2. This would indicate that
the elastic constants used by the OHBDC may not beconservative, because the likely level of prestress in adeck under service conditions may be around 50 lb/in2
due to long-term losses (with an initial minimumstress of 100 lb/in2). Also, the same study gives ratioseven lower for the same high level of prestress forother common species, such as Hem-Fir and whitepine. Separate tests were undertaken to determinethe stiffness moduli for the wood in the FPL deckand compare them with the expected and measuredparallel-to-grain modulus.
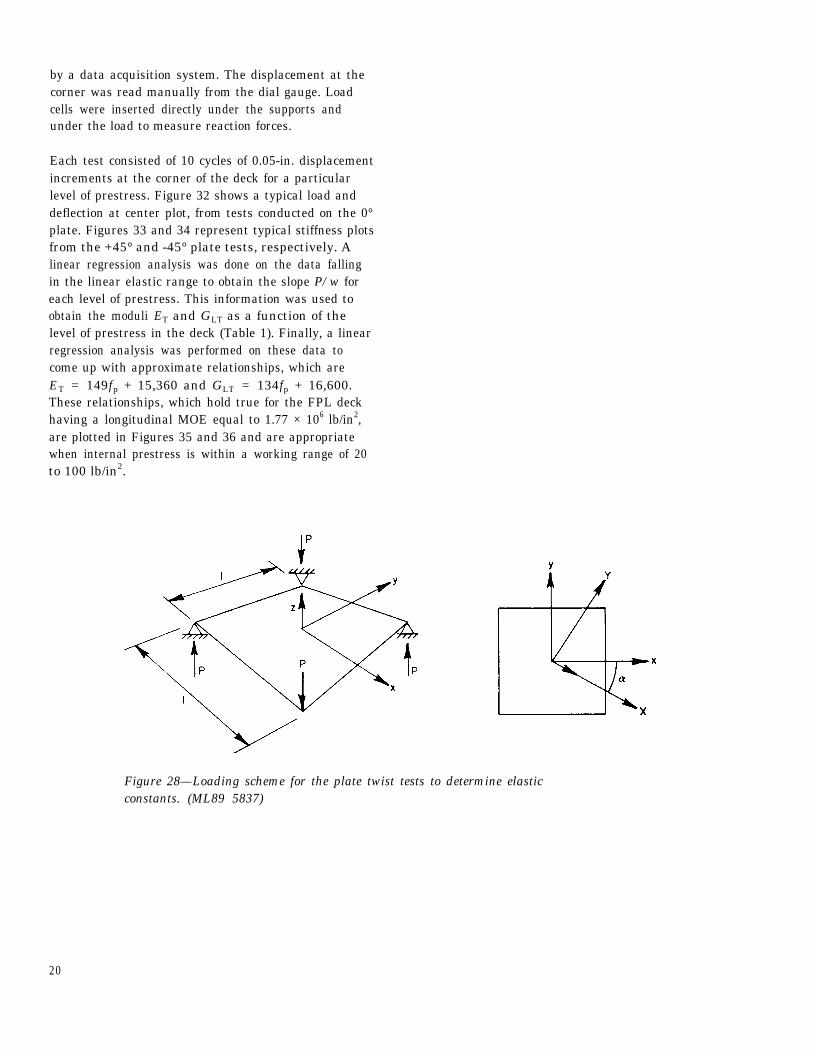
The test method used in this study was proposed byTsai (1965) and consists of load application at thecorners of various plate configurations as diagrammedin Figure 28.
Before testing, an analysis was performed to determinethe required dimensions of the plate. In the analysis,the relationships of the Queen’s University studywere used, ET = 0.02EL and GLT = 0.03EL for alow level of prestress. It was predicted that a platewith dimensions 4 by 4 ft by 11.25 in. thick woulddeflect 1 in. at the corner (0.25 in. at center), whensubjected to pure twisting action with a 10.5 × 10³ lbload at the corner. The maximum principal stresseswere predicted as approximately 250 lb/in2, wellbelow the allowable stresses. Although a more flexibleplate would be preferable, space limitations madeit impossible. The accuracy of the LVDTs used tomeasure the displacements was 0.001 in.
The laminae from the FPL deck were cut as neededto fabricate the two plates. There were no butt jointsbetween laminae in the plate decks. The configurationsof the 0° and -45/+45° plates, and their dimensionsare shown in Figures 29 and 30, respectively. Themeasuring devices consisted of an LVDT at the centerof the plate to measure the center line displacementand a dial gauge at the corner to measure the cornerdisplacement. All displacements were measured withrespect to a rigid frame attached to the deck at thesupported corners of the plate. The plates rested onbail-bearing supports at two corners and were pinsupported at the uplift corner (Fig. 31).
Each plate was tested under seven different levels ofprestress, 10, 20, 30, 40, 50, 75, and 100 lb/in2 ofaverage prestress between laminae in the plate. Thedisplacement at the center and the load were recorded
19
by a data acquisition system. The displacement at thecorner was read manually from the dial gauge. Loadcells were inserted directly under the supports andunder the load to measure reaction forces.
Each test consisted of 10 cycles of 0.05-in. displacementincrements at the corner of the deck for a particularlevel of prestress. Figure 32 shows a typical load anddeflection at center plot, from tests conducted on the 0°plate. Figures 33 and 34 represent typical stiffness plotsfrom the +45° and -45° plate tests, respectively. Alinear regression analysis was done on the data fallingin the linear elastic range to obtain the slope P/w foreach level of prestress. This information was used toobtain the moduli ET and GLT as a function of thelevel of prestress in the deck (Table 1). Finally, a linearregression analysis was performed on these data tocome up with approximate relationships, which areET = 149fp + 15,360 and GLT = 134fp + 16,600.These relationships, which hold true for the FPL deckhaving a longitudinal MOE equal to 1.77 × 10⁶ lb/in2,are plotted in Figures 35 and 36 and are appropriatewhen internal prestress is within a working range of 20to 100 lb/in2.
Figure 28—Loading scheme for the plate twist tests to determine elasticconstants. (ML89 5837)
20

Figure 29—Plan diagram of the 0° plate. (ML89 5838)
21
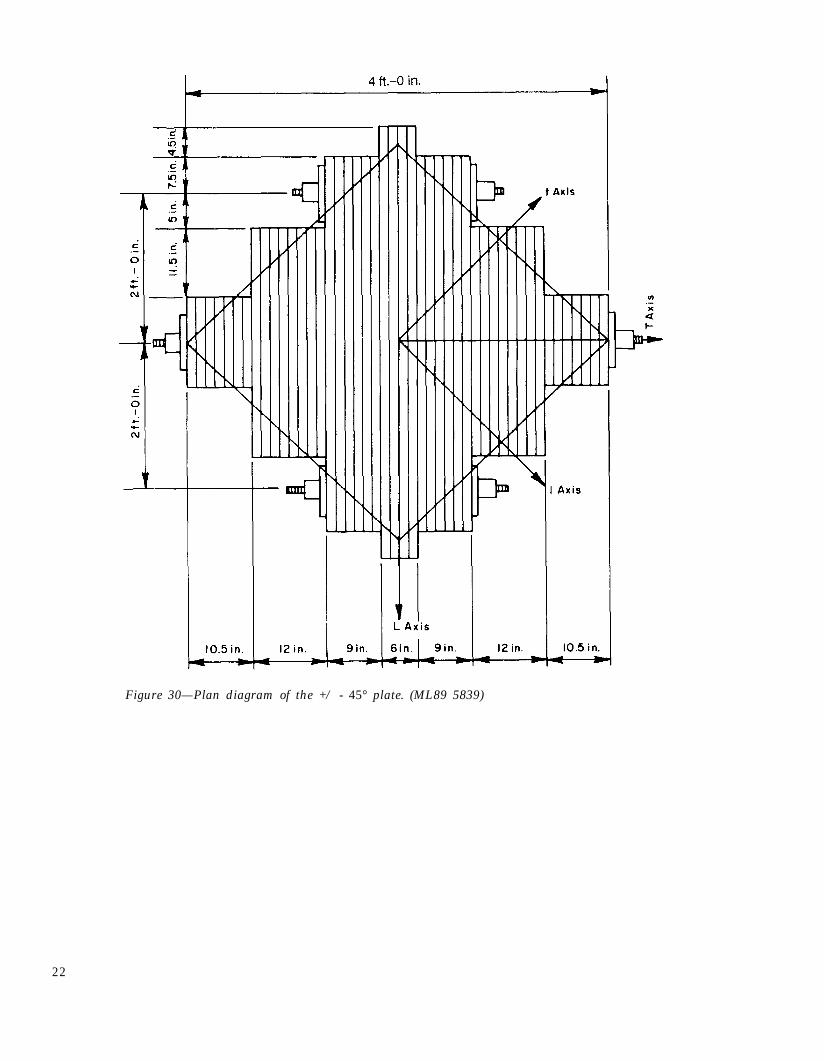
Figure 30—Plan diagram of the +/ - 45° plate. (ML89 5839)
22

Figure 31—The 45° plate with corner loadingduring testing. Note direction of laminae.(ML89 0118)
Figure 32—Test results of corner load anddisplacement at the center of the 0° plate.(ML89 5840)
Figure 33—Result of loading the +45° plate,displacement at the center and corner load.(ML89 5841)
Figure 34—Result of loading the - 45° plate,displacement at the center and corner load.(ML89 5842)
Figure 35—The values of transverse stiffnessET measured with different levels of prestressin the plate. (ML89 5843)
Figure 36—Shearing stiffness GLT as mea-sured with various prestress levels in theplate. (ML89 5844)
23
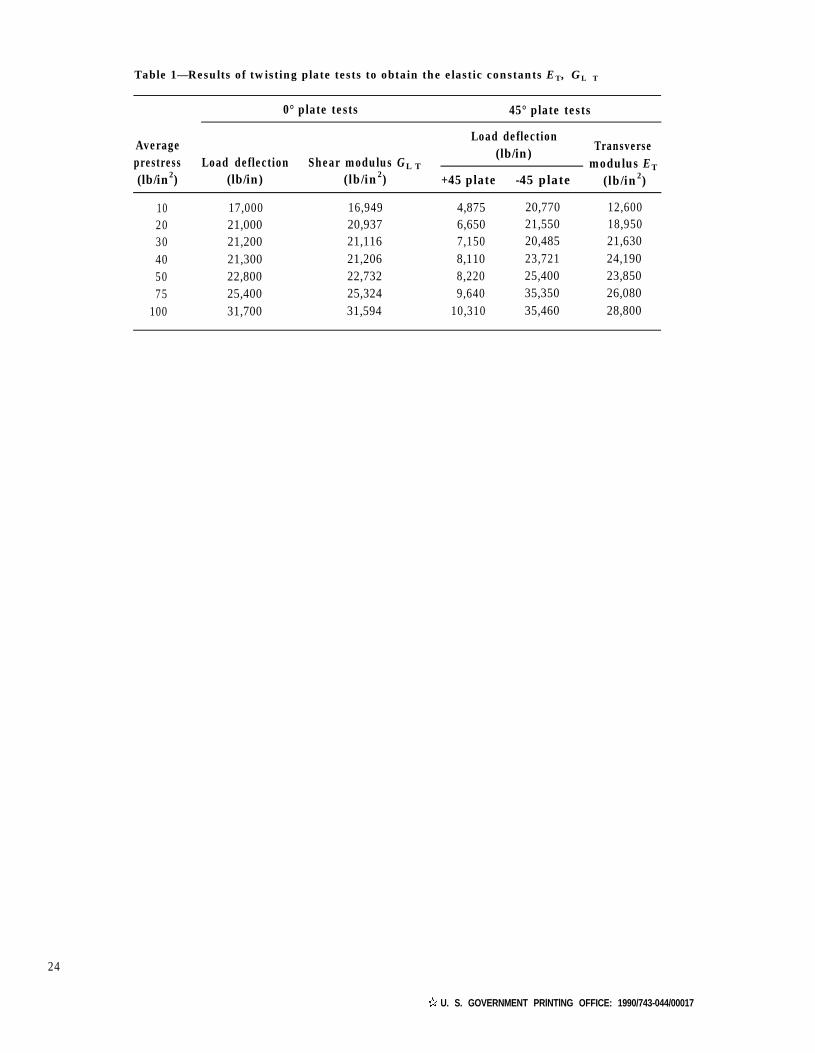
Table 1—Results of twisting plate tests to obtain the elastic constants ET, GL T
0° plate tests 45° plate tests
AverageLoad deflection
Transverseprestress Load deflection Shear modulus GL T
(lb/in)modulus ET
(lb/in2) (lb/in) (lb/in2) +45 plate -45 plate (lb/in2)
10 17,000 16,949 4,875 20,770 12,60020 21,000 20,937 6,650 21,550 18,95030 21,200 21,116 7,150 20,485 21,63040 21,300 21,206 8,110 23,721 24,19050 22,800 22,732 8,220 25,400 23,85075 25,400 25,324 9,640 35,350 26,080
100 31,700 31,594 10,310 35,460 28,800
24
U. S. GOVERNMENT PRlNTlNG OFFICE: 1990/743-044/00017