stress sensitivity of fault seismicity: a comparison ... · of static friction. ... to apply in...
TRANSCRIPT
JOURNAL OF GEOPHYSICAL RESEARCH, VOL. 104, NO. B9, PAGES 20,183-20,202, SEPTEMBER 10, 1999
Stress sensitivity of fault seismicity: A comparison between limited-offset oblique and major strike-slip faults
Tom Parsons, Ross S. Stein, Robert W. Simpson, and Paul A. Reasenberg U.S. Geological Survey, Menlo Park, California
Abstract. We present a new three-dimensional inventory of the southern San Francisco Bay area faults and use it to calculate stress applied principally by the 1989 M = 7.1 Loma Prieta earthquake and to compare fault seismicity rates before and after 1989. The major high-angle right-lateral faults exhibit a different response to the stress change than do minor oblique (right-lateral/thrust) faults. Seismicity on oblique-slip faults in the southern Santa Clara Valley thrust belt increased where the faults were unclamped. The strong dependence of seismicity change on normal stress change implies a high coefficient of static friction. In contrast, we observe that faults with significant offset (>50-100 km) behave differently; microseismicity on the Hayward fault diminished where right-lateral shear stress was reduced and where it was unclamped by the Loma Prieta earthquake. We observe a similar response on the San Andreas fault zone in southern California after the Landers earthquake sequence. Additionally, the offshore San Gregorio fault shows a seismicity rate increase where right-lateral/oblique shear stress was increased by the Loma Prieta earthquake despite also being clamped by it. These responses are consistent with either a low coefficient of static friction or high pore fluid pressures within the fault zones. We can explain the different behavior of the two styles of faults if those with large cumulative offset become impermeable through gouge buildup; coseismically pressurized pore fluids could be trapped and negate imposed normal stress changes, whereas in more limited offset faults, fluids could rapidly escape. The difference in behavior between minor and major faults may explain why frictional failure criteria that apply intermediate coefficients of static friction can be effective in describing the broad distributions of aftershocks that follow large earthquakes, since many of these events occur both inside and outside major fault zones.
1. Introduction
The calculation of static stress changes associated with large earthquakes has provided a potential explanation of aftershock patterns [e.g., King et al., 1994], microseismicity rate changes [e.g., Reasenberg and Simpson, 1992] as well as triggered se- quences of larger events [e.g., Stein et al., 1994, 1997; Harris, 1998]. These studies suggest that very small perturbations in the stress field (as low as 0.1 bar) promote failure on some faults. Dislocation calculations simulate static earthquake slip in an elastic half-space; the earthquake-induced stress changes are applied to neighboring "receiver" faults, often using the Coulomb failure criterion
where A ?t. is the change in shear stress on a receiver fault,/• is the coefficient of friction, A•r n is the change in normal stress acting on the receiver fault, and Ap is pore pressure change. Since a change in the Coulomb failure stress is calculated,/• on the receiver faults is treated as a constant and is assumed not
to change as a result of slip on the rupture plane. Commonly, Skempton's coefficient Bk (which varies from 0 to 1) is used to incorporate pore fluid effects, in which the effective coefficient of friction
= - (2)
This paper is not subject to U.S. copyright. Published in 1999 by the American Geophysical Union.
Paper number 1999JB900056.
is adjusted and used in the Coulomb failure criterion as
ACF = xlfl + (3)
after Rice [1992]. The Coulomb failure criterion assumes that the coefficient
of friction/• is a constant. However, it has been demonstrated that/• is not constant but is instead time and velocity depen- dent [e.g., Dieterich, 1978; Ruina, 1983]. The dependence is suggested to result from changes in the age and population of contact points in the fault, with older, more static contacts having greater strength than younger ones introduced by slip on the fault [Dieterich, 1979]. The resisting stress can thus be expressed as
*r:(o',-P) /•o+Aln •+ 1 +Bln •¾+ 1 , (4)
where rr, is the normal stress; p is pore fluid pressure;/x o, A, and B are experimentally determined constants; V* and 0* are normalizing constants; V is slip speed; and 0 is the state vari- able [Dieterich, 1992]. The evolution of the state variable with time,
dO OV
at = • ac ' (5)
was reported by Ruina [1983]. This relation shows that when a fault patch is locked (V = 0), the state variable increases as time, leading to a higher coefficient of friction.
20,183
20,184 PARSONS ET AL.: STRESS SENSITIVITY OF FAULT SEISMICITY
Coulomb failure and rate and state friction have been shown
to apply in repeated laboratory studies on confined rock sam- ples [e.g., Jaeger and Cook, 1979; Dieterich, 1978, 1979]. Inher- ent in applying these ideas is the assumption that brittle failure occurs on a preexisting surface and that increased normal stress ("clamping") acts to inhibit failure (limited to the unsta- ble sliding regime (where A - B < 0 in equation (4)) for time and velocity dependent friction). However, examination of the stresses imposed on the Parkfield segment of the San Andreas fault zone by the 1982-1985 New Idria, Coalinga, and Kettle- man Hills earthquakes indicates that those earthquakes acted to reduce the fault-normal stress component on the San An- dreas. Applying the above discussed approaches to frictional failure predicts an increased seismicity rate on the San An- dreas fault after 1985, whereas the imposed stresses appear instead to have inhibited seismicity [Miller, 1996], perhaps through a compaction weakening mechanism [Miller et al., 1996] that was inhibited by unclamping from the 1982-1985 thrust events. On the basis of these calculations, it appears possible that some faults respond to normal stress perturba- tions in a predictable fashion while others such as the San Andreas might not.
To address the problem of different fault responses to nor- mal and shear stress changes, we apply a new three- dimensional fault model for the southern San Francisco Bay area, generated from geological data, to investigate the effects on seismicity rates before and after the 1989 M = 7.1 Loma Prieta earthquake on a variety of faults. Additionally, we ex- amine the seismicity rate change on the San Andreas fault in southern California before and after the April 23, 1992, M = 6.1 Joshua Tree and the June 28 M = 7.4 Landers and M =
6.5 Big Bear earthquakes. We calculate changes in the fault- parallel and fault-normal components of stress on our model after a large earthquake and compare seismicity rates before and after the event. Spatial correlations between the changes in fault-normal stress component and seismicity rates are evi- dent. From these correlations we generalize the responses of faults to applied stress changes.
2. Southern San Francisco Bay Area Fault Inventory
The San Francisco Bay region lies within the surface expres- sion of a broad (-70-80 km wide), highly deformed and faulted plate boundary zone between the Pacific and North American plates. Right-lateral shear takes place on the San Andreas, Hayward, San Gregorio, and Calaveras fault systems (Plate 1). In addition, numerous smaller faults are distributed throughout the region. The Santa Clara Valley thrust belt, for example, is a broad zone of oblique (right-lateral, reverse) slip that occurs near a bend in the San Andreas fault [e.g., Aydin and Page, 1984] (Plate 1). A similar group of oblique faults is clustered near the southern Hayward and Calaveras faults, east of the San Andreas fault. Cumulatively, these zones of crustal shear accommodate -40-50 mm yr -• of relative motion be- tween the Pacific and North American plates [e.g., De Mets et al., 1990; Kelson et al., 1992].
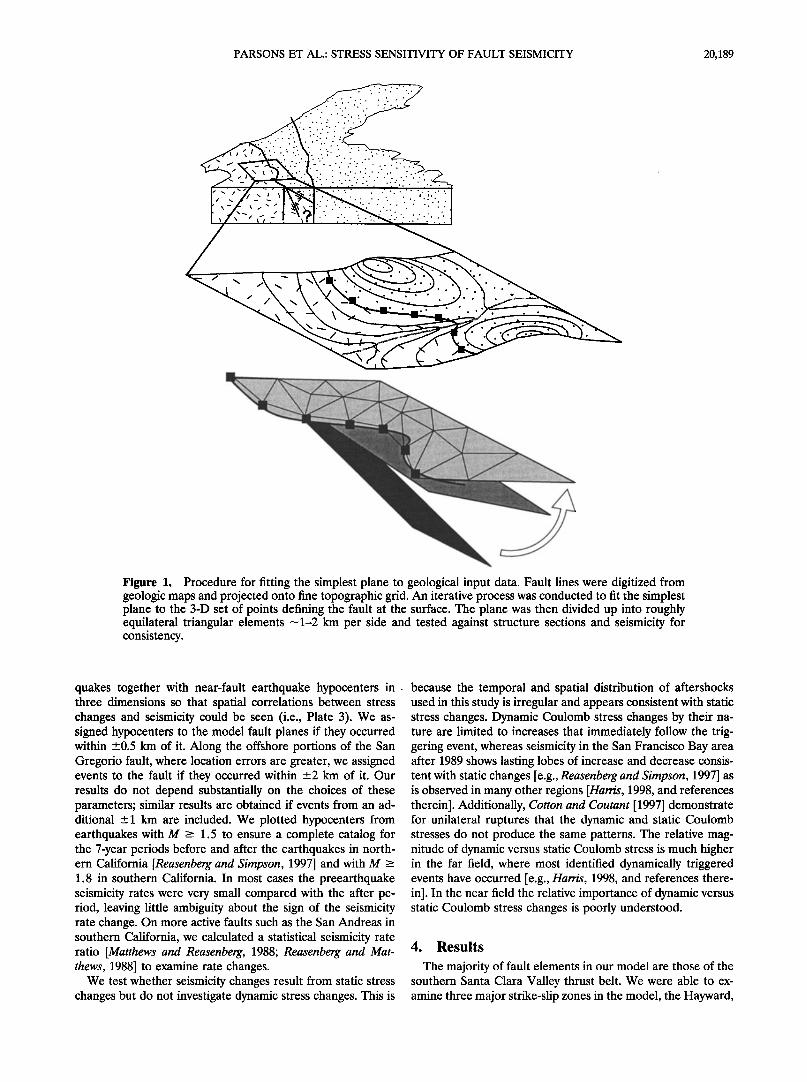
We attempted a complete inventory of the major vertical strike-slip faults and the oblique faults in the southern Santa Clara Valley near the San Andreas, Hayward, and Calaveras faults. To generate a three-dimensional fault model, we ap- plied an iterative process of projecting the simplest possible fault planes that fit input geological data (Figure 1). Fault
traces with known Quaternary activity were digitized from geo- logic maps and dips constrained by structure sections or seis- mic velocity models when available [Aydin and Page, 1984; Brabb, 1993; Brabb and Olson, 1986; Clark, 1981; Clark et al., 1989; Dibblee, 1972a, b; Graymet et al., 1995; Holbrook et al., 1996; Jayko and Lewis, 1996; Jennings, 1994; Jennings and Bur- nett, 1961; Helley and Wesling, 1990a, b; Lienkaemper, 1992; McLaughlin et al., 1972, 1991; Pampeyan, 1994; Parsons and Zoback, 1997; Rogers, 1966; Schwartz and Ponti, 1990; Wallace, 1990; Wesling and Helley, 1989; R. C. Jachens, written commu- nication, 1997; M. L. Zoback, written communication, 1997].
The mapped fault traces were projected onto a grid of the topography and dipping faults were fit to the simplest possible surface (Figure 1), although even the simplest surfaces repre- senting oblique faults can be curved and variably dipping. Dip- ping faults are represented by a grid of roughly equilateral triangular dislocation elements -1-2 km per side (Plate 1 and Figure 1). Vertical faults were segmented into rectangular el- ements. To avoid spurious fault crossings or contacts, the fault model was repeatedly tested visually using a virtual reality viewer to examine projected fault interactions at depth with adjustment of fault dips as needed. Lesser oblique-slip and thrust faults were assumed to end at or before their projected intersections with major vertical strike-slip faults such as the San Andreas. Where available, earthquake hypocenters were projected in the vicinity of each fault to test that its dip was in accordance with local earthquake activity. There is close agree- ment between the fault model developed geologically and an interpretation of nodal planes developed by Zoback et al. [1998] from focal mechanisms. The final model is expressed as a series of dislocation elements that enable postseismic static stresses to be calculated on each fault surface.
3. Calculation of Static Stress and Seismicity Rate Changes
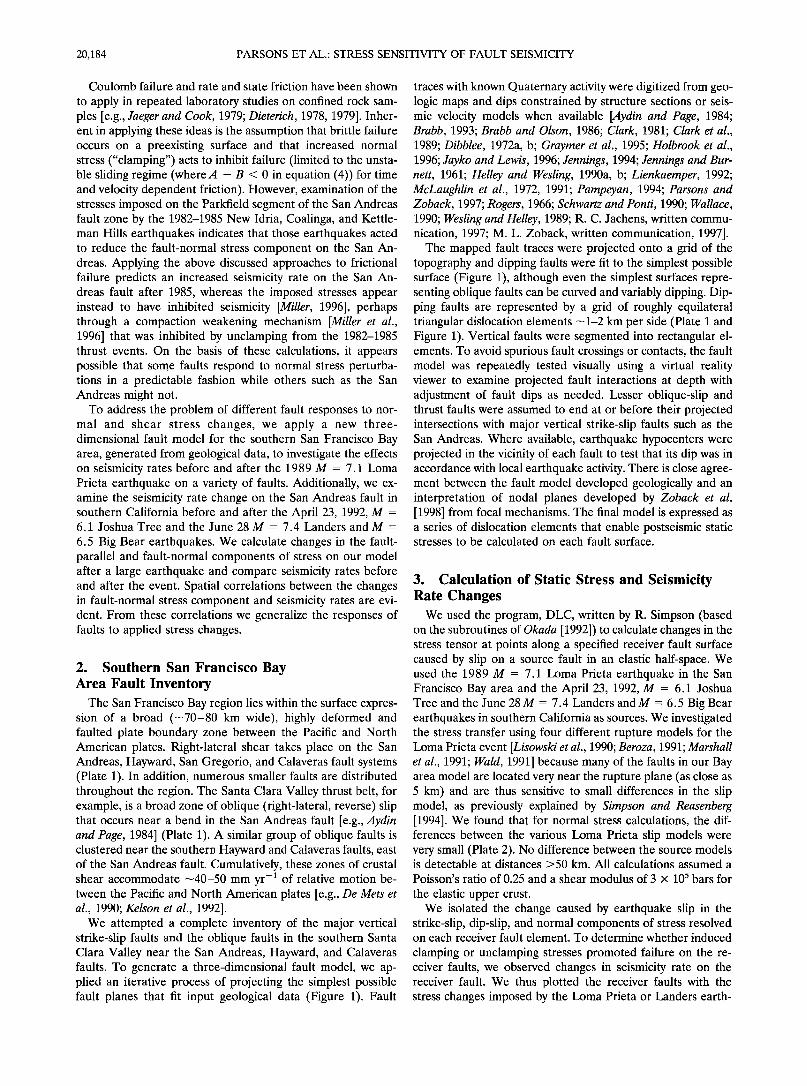
We used the program, DLC, written by R. Simpson (based on the subroutines of Okada [1992]) to calculate changes in the stress tensor at points along a specified receiver fault surface caused by slip on a source fault in an elastic half-space. We used the 1989 M - 7.1 Loma Prieta earthquake in the San Francisco Bay area and the April 23, 1992, M -- 6.1 Joshua Tree and the June 28 M = 7.4 Landers and M = 6.5 Big Bear earthquakes in southern California as sources. We investigated the stress transfer using four different rupture models for the Loma Prieta event [Lisowski et al., 1990; Beroza, 1991; Marshall et al., 1991; Wald, 1991] because many of the faults in our Bay area model are located very near the rupture plane (as close as 5 km) and are thus sensitive to small differences in the slip model, as previously explained by Simpson and Reasenberg [1994]. We found that for normal stress calculations, the dif- ferences between the various Loma Prieta slip models were very small (Plate 2). No difference between the source models is detectable at distances >50 km. All calculations assumed a
Poisson's ratio of 0.25 and a shear modulus of 3 x l0 s bars for
the elastic upper crust. We isolated the change caused by earthquake slip in the
strike-slip, dip-slip, and normal components of stress resolved on each receiver fault element. To determine whether induced
clamping or unclamping stresses promoted failure on the re- ceiver faults, we observed changes in seismicity rate on the receiver fault. We thus plotted the receiver faults with the stress changes imposed by the Loma Prieta or Landers earth-
•ARSONS ET AL.: STRESS SENSITIVITY OF FAULT SEISMICITY 20,185
38 ø
37.75 •_
37.5 ø
37.25 •_
37 ø ß -123 ø -121.5 ø
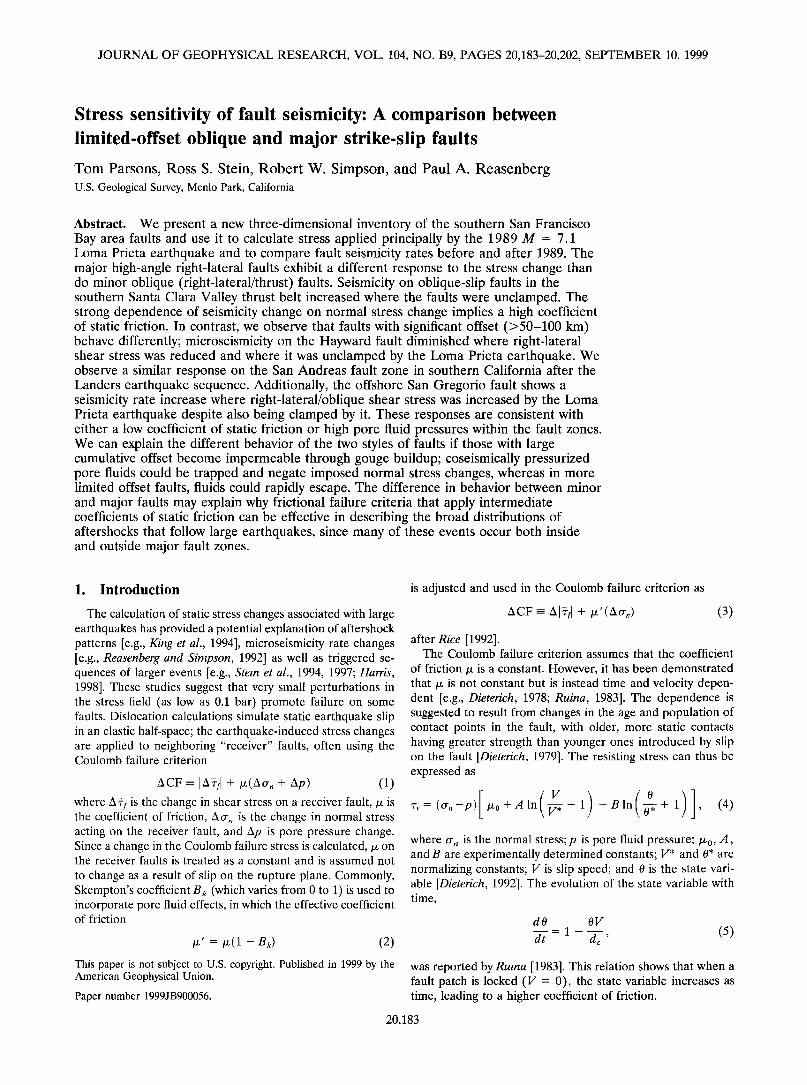
Plate 1. (top) Satellite image of the southern San Francisco Bay area and (middle) excerpt of the three- dimensional fault model used in this study showing the southern Santa Clara Valley thrust belt. Explanation of the model development is given in the text. (bottom) The faults for which we studied stress and seismicity rate changes shown in map view.
20,186 PARSONS ET AL.: STRESS SENSITIVITY OF FAULT SEISMICITY
Loma Prieta Earthquake Slip Models - Resulting Normal Stress Changes on Aldercroft Fault
A Lisowski et al. [1990] N •', m SE NW SE
• lO
B Marshall et al. [1991]
B
1 1.5 2 ; -... slip (m) ! -...
Wald [1991 ] '
c I "'1 'i I • I I i•[--i---1'--] ; C
..,
0.3 0.9 1.5 2.1 2.7 3.3 slip(m) •.,,,, D Beroza [1991]
ii I III I i I D
I I • " Ill • I '-.. ,
II I I '- • .,. ;,. .•.. • •, .,,•
0.5 1.5 '2.5 3.5 4.5 5.• slip (m)
<-20.0 &Normal Stress (bars) >20.0
Plate 2. Normal component of the postseismic static stress change on the Aldercroft fault (Figure 1), which is located as close as 5 km to the Loma Prieta rupture. The stress change was calculated from four different Loma Prieta slip models (shown at right) to assess the importance of differences in the models.
PARSONS ET AL.: STRESS SENSITIVITY OF FAULT SEISMICITY 20,187
A 0 km 10 20 30
l .............. ;, . I .............. I 40
EQ After Loma Prieta
EQ Before Loma Prieta
B
Left Lateral
(Slip Discouraged) 2.0 0.0 2.0 Shear Stress (bars)
Right Lateral (Slip Encouraged)
Clamping Unclamping (Slip Discouraged) 3.0 0.0 3.0 (Slip Encouraged)
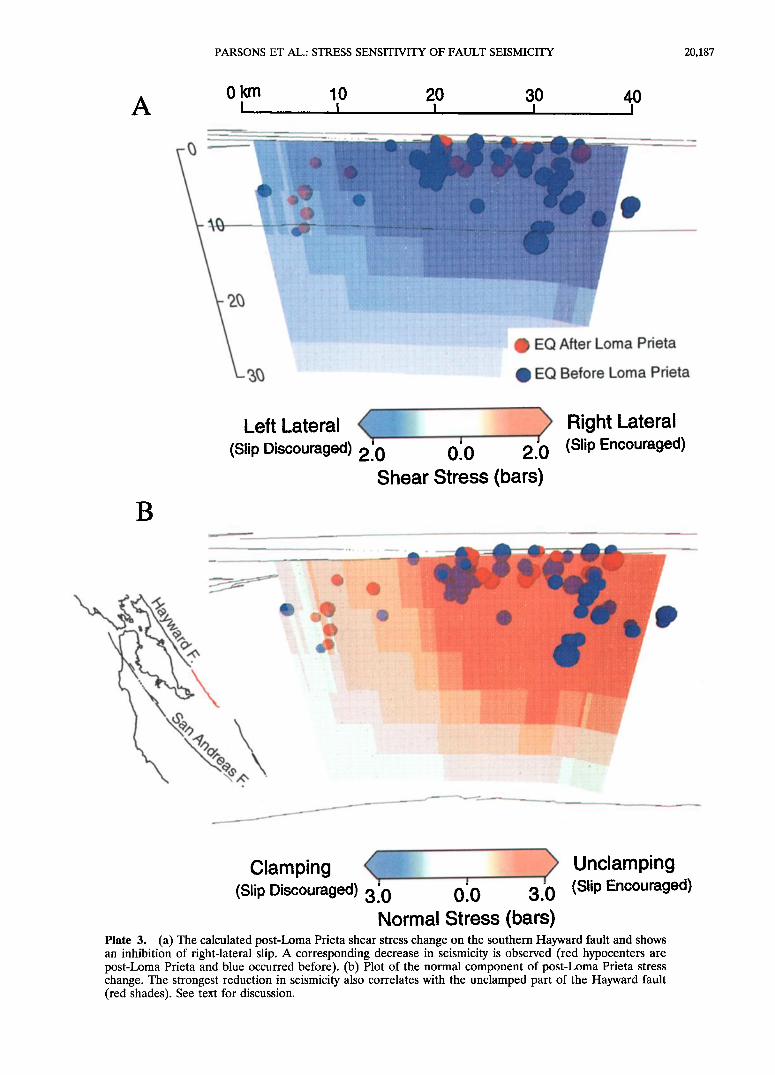
Normal Stress (bars) Plate 3. (a) The calculated post-Loma Prieta shear stress change on the southern Hayward fault and shows an inhibition of right-lateral slip. A corresponding decrease in seismicity is observed (red hypocenters are post-Loma Prieta and blue occurred before). (b) Plot of the normal component of post-Loma Prieta stress change. The strongest reduction in seismicity also correlates with the unclamped part of the Hayward fault (red shades). See text for discussion.
20,188 PARSONS ET AL.: STRESS SENSITIVITY OF FAULT SEISMICITY
E
I
PARSONS ET AL.: STRESS SENSITIVITY OF FAULT SEISMICITY 20,189
Figure 1. Procedure for fitting the simplest plane to geological input data. Fault lines were digitized from geologic maps and projected onto fine topographic grid. An iterative process was conducted to fit the simplest plane to the 3-D set of points defining the fault at the surface. The plane was then divided up into roughly equilateral triangular elements -1-2 km per side and tested against structure sections and seismicity for consistency.
quakes together with near-fault earthquake hypocenters in. because the temporal and spatial distribution of aftershocks three dimensions so that spatial correlations between stress changes and seismicity could be seen (i.e., Plate 3). We as- signed hypocenters to the model fault planes if they occurred within _+0.5 km of it. Along the offshore portions of the San Gregorio fault, where location errors are greater, we assigned events to the fault if they occurred within +_2 km of it. Our results do not depend substantially on the choices of these parameters; similar results are obtained if events from an ad- ditional -+1 km are included. We plotted hypocenters from earthquakes with M -> 1.5 to ensure a complete catalog for the 7-year periods before and after the earthquakes in north- ern California [Reasenberg and Simpson, 1997] and with M -> 1.8 in southern California. In most cases the preearthquake seismicity rates were very small compared with the after pe- riod, leaving little ambiguity about the sign of the seismicity rate change. On more active faults such as the San Andreas in southern California, we calculated a statistical seismicity rate ratio [Matthews and Reasenberg, 1988; Reasenberg and Mat- thews, 1988] to examine rate changes.
We test whether seismicity changes result from static stress changes but do not investigate dynamic stress changes. This is
used in this study is irregular and appears consistent with static stress changes. Dynamic Coulomb stress changes by their na- ture are limited to increases that immediately follow the trig- gering event, whereas seismicity in the San Francisco Bay area after 1989 shows lasting lobes of increase and decrease consis- tent with static changes [e.g., Reasenberg and Simpson, 1997] as is observed in many other regions [Harris, 1998, and references therein]. Additionally, Cotton and Coutant [1997] demonstrate for unilateral ruptures that the dynamic and static Coulomb stresses do not produce the same patterns. The relative mag- nitude of dynamic versus static Coulomb stress is much higher in the far field, where most identified dynamically triggered events have occurred [e.g., Harris, 1998, and references there- in]. In the near field the relative importance of dynamic versus static Coulomb stress changes is poorly understood.
4. Results
The majority of fault elements in our model are those of the southern Santa Clara Valley thrust belt. We were able to ex- amine three major strike-slip zones in the model, the Hayward,
20,190 PARSONS ET AL.: STRESS SENSITIVITY OF FAULT SEISMICITY
San Andreas, and San Gregorio faults. We were unable to use the Calaveras fault because the group of M > 5 earthquakes that has occurred during the past -20 years has made seismic- ity too variable to calculate a background rate [Reasenberg and Simpson, 1997].
As major strike-slip faults, the Hayward, San Andreas, and San Gregorio fault zones have more cumulative slip [e.g., McLaughlin et al., 1996; Hall, 1991] than the less active, oblique faults of the southern Santa Clara Valley thrust belt that are younger [e.g., Aydin and Page, 1984]. We note differences in the way that these faults respond to static stress changes and thus discuss our observations on these two classes of faults
separately.
4.1. Major Faults With Significant Cumulative Slip
4.1.1. The Hayward fault. The Hayward fault has under- gone right-lateral slip of 5-8 mm yr -• along the southern segment during Holocene time [Lienkaemper and Borchardt, 1992; Borchardt et al., 1992]). Cumulative slip is estimated to be 50-70 km during the past 6 m.y. [McLaughlin et al., 1996]. Slip during the Loma Prieta earthquake changed stresses by up to 3 bars at the southern end of the Hayward fault. In Figure 3a the fault is shown with the parts subjected to a left-lateral stress change shaded in blue (denoting the "negative" stress change convention for a right-lateral fault) and the parts subjected to a right-lateral stress change shaded red (denoting a "positive" stress change). Earthquake hypocenters are plotted for 7 years before (blue spheres proportional to magnitude) and after (red spheres) the Loma Prieta earthquake. A significant decline in seismicity rate beginning just after the Loma Prieta earthquake was attributed to the calculated decrease in right-lateral shear stress (-1-2 bars) by Reasenberg and Simpson [1992]. We cal- culate a stressing rate of about 0.14 bar/yr for the southern Hayward fault using the method of Stein et al. [1997]; thus the calculated static shear stress changes on the Hayward fault may apply for -7-14 years after the Loma Prieta earthquake.
In addition, we calculated that the southern end of the Hayward fault was unclamped by -2-3 bars, a larger differ- ence than the shear stress change on most parts of the fault. In Figure 3b the fault is shown with the clamped parts shaded in blue (denoting the "negative" normal stress change convention of frictional failure) and the unclamped parts of the faults shaded in red (denoting a "positive" normal stress change). The ratio of the normal stress change to the right-lateral shear stress change ranges from -1:1 to -1.8:1 in the seismically active parts of the southern Hayward fault. Thus if a frictional failure criterion is applied with intermediate to high friction (/• = 0.6-0.8), the overall effect is neutral or slightly discouraging to seismicity. Achieving a Coulomb failure stress commensu- rate with the seismicity rate change requires a lower coefficient of friction. Discussion and quantification of these associations are presented in section 5.
4.1.2. The San Gregorio fault. The northeast trending San Gregorio fault zone is defined by three to five strands [Jennings, 1994], has had documented Holocene slip [e.g., We- ber et al., 1979; Simpson et al., 1997] and lies west of the San Andreas fault largely offshore (Plate 1). Estimates of cumula- tive Neogene to Holocene right-lateral slip range from 80 to 150 km [e.g., Hall, 1991]. Seismic surveys conducted offshore show a steeply northeast dipping fault zone [e.g., Mullins and Nagel, 1982; Lewis, 1990]. Jachens and Griscom [1999] used aeromagnetic data to model the dip of the San Gregorio fault at 50ø-60 ø northeast. Anderson and Menking [1994] inverted
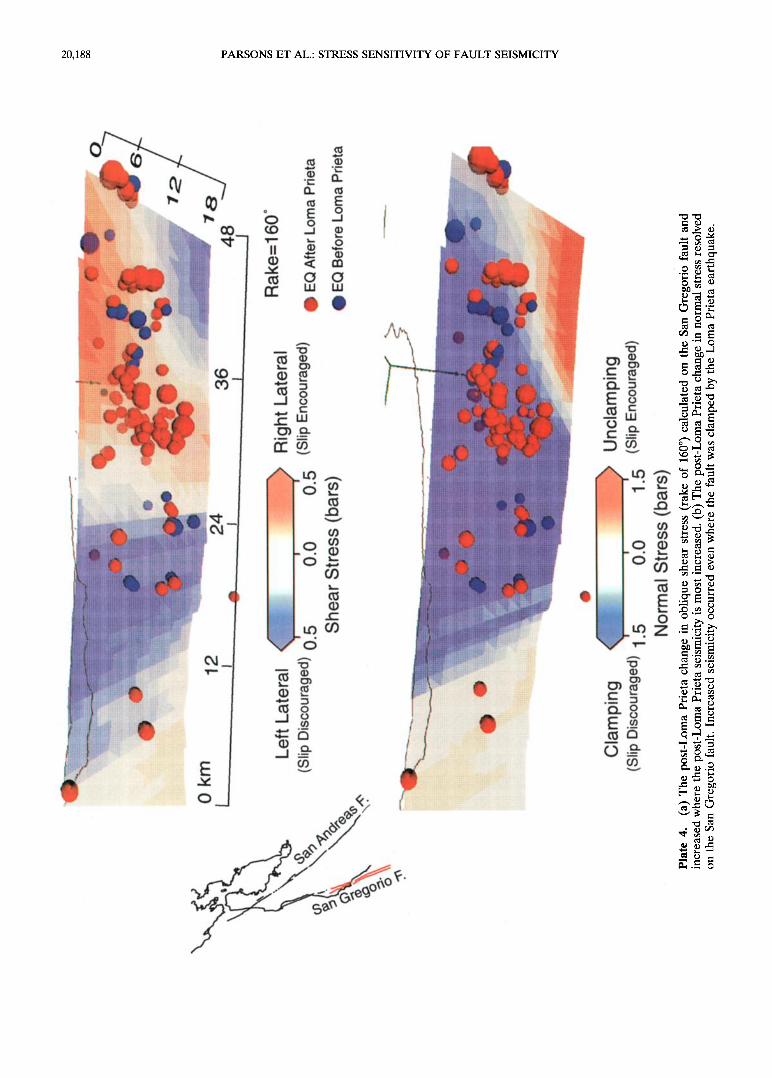
for coastal terrace uplift along Monterey Bay and found that a 70 ø northeast dipping San Gregorio fault plane with a domi- nantly right-lateral rake (3-4% thrust component) best matched the uplift patterns. We thus modeled the San Grego- rio fault strands with a constant 70 ø northeast dip (Plate 4).
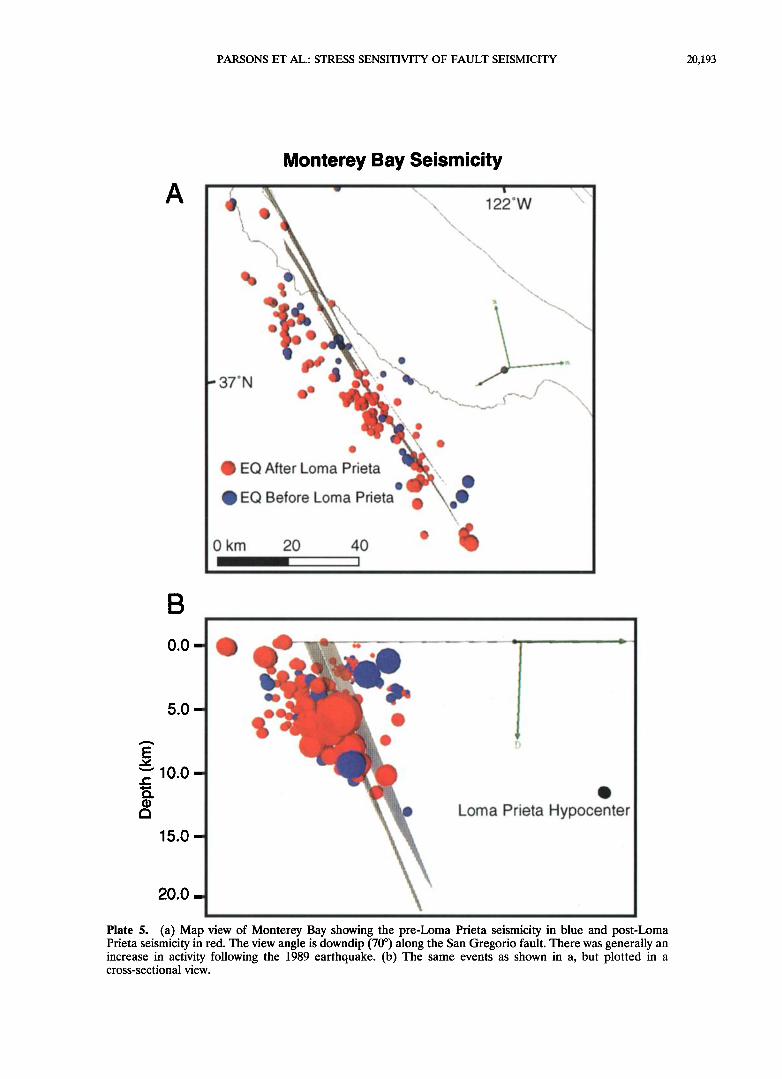
Following the Loma Prieta earthquake, seismicity along the Monterey Bay segment of the San Gregorio fault increased (Plates 4 and 5). To investigate whether the seismicity rate increase resulted from triggering by the Loma Prieta earth- quake, we projected the post-Loma Prieta shear and normal components of stress change onto the San Gregorio plane. The calculated shear stress changes (using the slip model of Wald [1991]) shows good agreement with the seismicity rate change as shown in Plate 4; the best fit to the seismicity pattern is with an oblique rake of 160 ø that matches in a broad sense the oblique focal mechanisms calculated for the San Gregorio fault [Gallardo et al., 1997; S. Ross, written communication, 1998]. We calculate a loading rate of -0.05 bar/yr for the San Gre- gorio fault, which implies that the -0.5 bar shear stress changes might withstand tectonic erosion for -10 years after the Loma Prieta quake. The calculated post-Loma Prieta nor- mal stress change does not appear to have encouraged earth- quakes (Plate 4), with most of the active part of the fault clamped. The ratio of the normal stress change to the right- lateral shear stress change ranges from -3:1 to -6:1 in the seismically active parts of the San Gregorio fault. Thus the San Gregorio fault appears insensitive to normal stress changes despite their relatively greater amplitudes. This result indicates that the San Gregorio fault has low friction if standard failure criteria are applied.
Most of the earthquakes that we have ascribed to the San Gregorio fault occurred beneath Monterey Bay (Plate 5) and were more poorly located than events of similar size onshore because of the lack of network stations offshore. We plotted in map view and in cross section all earthquakes beneath the northern Monterey Bay (Plate 5) to illustrate the potential uncertainties. In our analysis we assumed that the events lo- cated within 2 km of either side of the San Gregorio fault zone occurred on the fault plane. An alternative explanation for the seismicity rate increase in Monterey Bay was suggested by Simpson and Reasenberg [1994], who modeled the San Grego- rio fault as vertically dipping. They modeled an additional west dipping, oblique-slip fault in Monterey Bay adjacent to the San Gregorio fault that was also consistent with triggering by the Loma Prieta earthquake to explain some of the seismicity increase.
4.1.3. The San Andreas fault in southern California. We
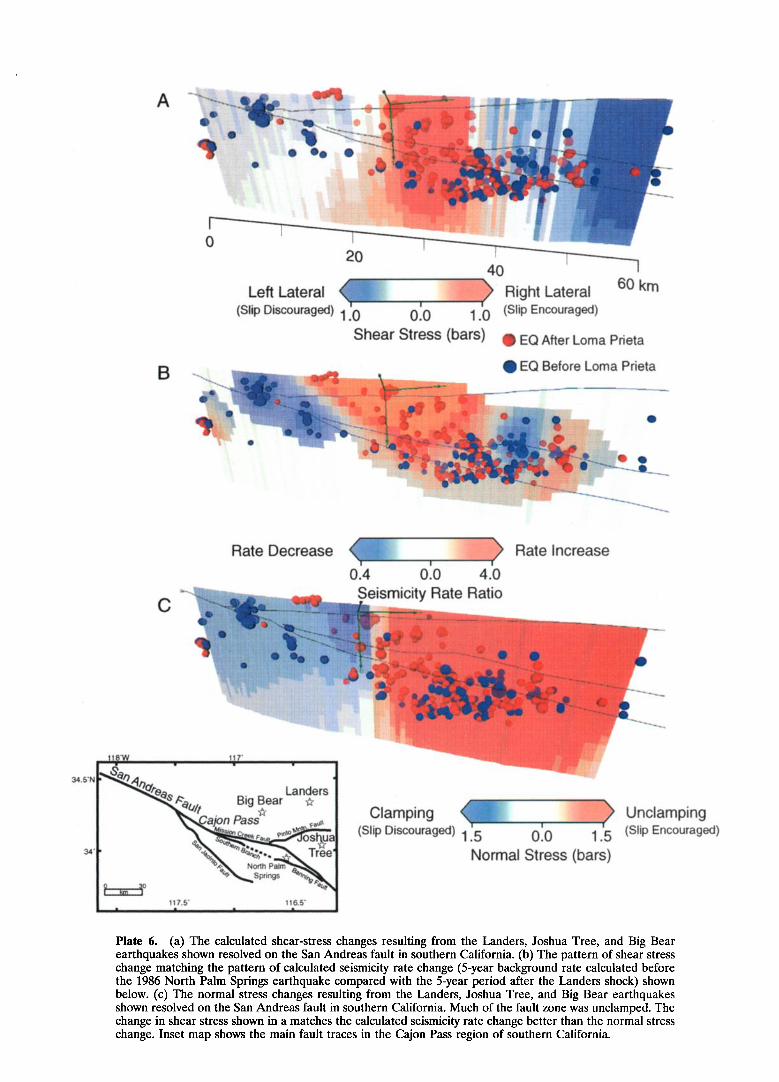
examined the seismicity rate change on the San Andreas fault after the April 23, 1992, M = 6.1 Joshua Tree, and the June 28 M = 7.4 Landers and M = 6.5 Big Bear earthquakes in southern California. We applied the same procedures to cal- culate stress changes and plot a statistical seismicity rate ratio calculation [Matthews and Reasenberg, 1988; Reasenberg and Matthews, 1988] to aid in the visualization of the seismicity rate changes (Plate 6). We compared the seismicity from the 5-year period following the Landers events with a 5-year period pre- ceding the July 8, 1986, M = 6.0 North Palm Springs earth- quake. We made this comparison to eliminate the aftershocks from the North Palm Springs event in the background period. Some aftershocks from the North Palm Springs event persist into the post-Landers period but are spatially limited and are sparse compared with the Landers aftershocks. The seismicity catalog in southern California is complete for M -> 1.8 after
PARSONS ET AL.: STRESS SENSITIVITY OF FAULT SEISMICITY 20,191
1981. We applied the slip models of Wald and Heaton [1994] and King et al. [1994] for the Landers, Big Bear, and Joshua Tree earthquakes.
The parts of the San Andreas fault zone most affected by the Joshua Tree-Landers-Big Bear sequence are located near Ca- jon Pass along the southern branch of the San Andreas, Mis- sion Creek, and Banning faults (Plate 6). We examined the southern segment of the San Andreas fault and its extension into the Banning fault, which is interpreted as the primary zone of right-lateral strain accommodation by Seeher and Armbruster [1995] and which has been recently reactivated as a right- lateral strike-slip fault [Matti and Morton, 1993]. We find that on the southern segment, seismicity correlates visually with shear stress change to a greater extent than with normal stress change (Plate 6), an indication of lower friction. The ratio of the normal stress change to the right-lateral shear stress change ranges from -1:1 where both normal stress and shear stress changes encourage seismicity to -10:1 where shear stress changes appear to have discouraged seismicity. Thus, if a frictional failure criterion were applied, then the best fit to the seismicity rate change appears to be with smaller values of friction coefficients, similar to the results for the southern Hayward and San Gregorio faults in the San Francisco Bay area.
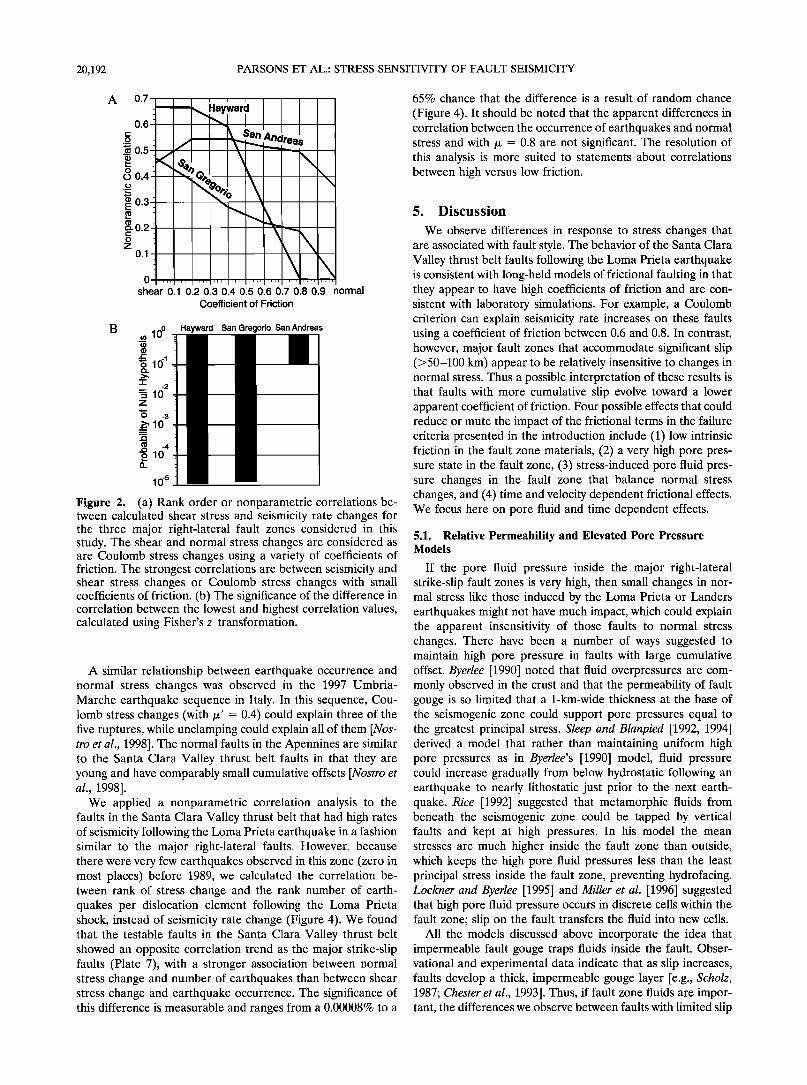
4.1.4. Test of association between stress and seismicity changes. This discussion has so far relied on visual spatial associations between calculated stress changes and seismicity rate changes, which indicate that seismicity rates on major right-lateral strike-slip faults are more sensitive to changes in the shear stress component than in the normal stress compo- nent. Here we attempt to quantify the strength and significance of those associations using a nonparametric or rank order correlation. There are two main advantages to a rank order correlation: (1) correlation is made between two distributions of the rank of data values rather than the amplitude of the values, which prevents outliers from having an undue affect on correlation strength, and (2) the complete distribution of ranks is known, which allows significance tests on measured correla- tions. Because the amplitude values are not directly applied in the rank order correlation, the measured strength of correla- tion may be weaker than in linear correlation; however, if a rank order correlation can be demonstrated, then it is signifi- cant [e.g., Sachs, 1982].
We calculated a nonparametric correlation between rank calculated stress change per fault dislocation element and rank seismicity rate change for the three major strike-slip faults discussed above. We found higher correlation values between shear stress change and seismicity rate change than between normal stress change and seismicity (Figure 2). Additionally, we substituted numerical values for the coefficient of friction
and calculated Coulomb stress changes for the three faults. Correlations were stronger for the lowest values of friction. We calculated that the change in correlation is stronger for the Hayward and San Gregorio faults than for the San Andreas fault• the significance of this difference is also much stronger, with a -0.001% probability of being the result of random chance, whereas there is a -10% chance that the difference is the result of random chance for the San Andreas fault (Figure 2). We suggest that the stronger correlation for low friction of the Hayward and San Gregorio faults as compared with the San Andreas fault may result from the recent reactivation of this segment of the southern San Andreas as a right-lateral strike-slip fault [Matti and Morton, 1993]. We present a discus-
sion of the potential for cumulative slip to cause lower appar- ent friction than faults with less in section 5.
4.2. Secondary Thrust and Strike-Slip Faults
We investigated the Quaternary oblique faults of the south- ern Santa Clara Valley thrust belt for responses to changes in the calculated fault-normal component of stress. Because of the proximity of the faults of the southern Santa Clara Valley thrust belt to the Loma Prieta slip plane at depth, the calcu- lated stress changes are large (approaching 25 bars between 5 and 10 km from the rupture zone) (Plates 7 and 8 and Figure 3). In our analysis we assumed that the strain in the Santa Clara Valley thrust belt involves right-lateral to thrust directed slip. Aftershocks with left-lateral and normal fault plane solu- tions did occur after the Loma Prieta earthquake but com- prised only 14% of the total [e.g., Zoback and Beroza, 1993].
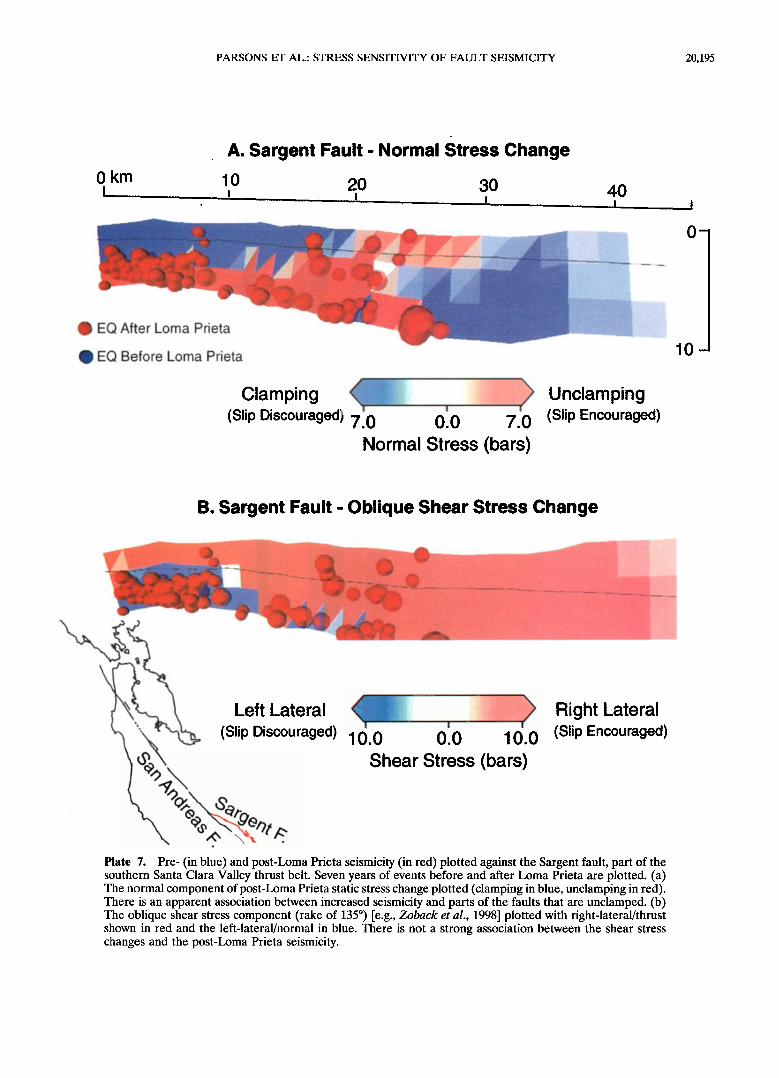
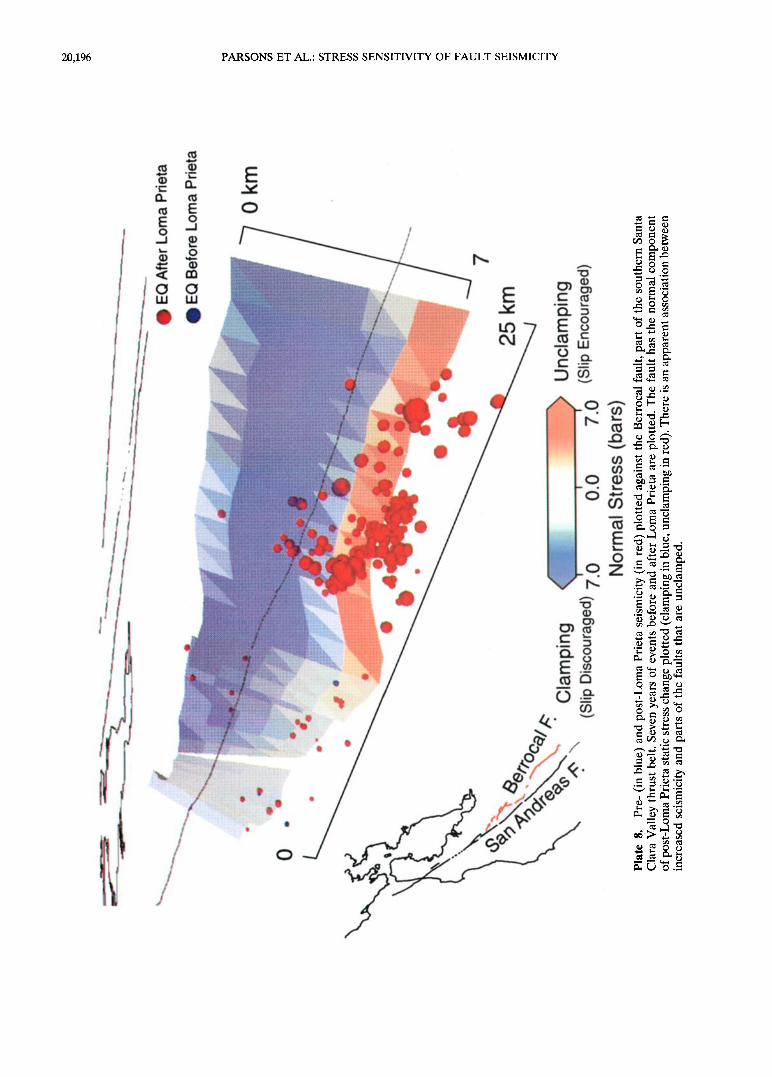
To illustrate the variations in calculated stress changes and seismicity, in Plates 7 and 8 we show two examples of the most important faults from the southern Santa Clara Valley thrust belt, the Sargent and Berrocal faults. The faults are shown with the clamped parts shaded in blue (denoting the "negative" normal stress change convention of frictional failure), and the unclamped parts of the faults shaded in red (denoting a "pos- itive" normal stress change). Earthquake hypocenters are plot- ted for 7 years before (blue spheres proportional to magni- tude) and after (red spheres) the Loma Prieta earthquake. Post-1989 seismicity occurred primarily on parts of the faults that we calculated were unclamped by the Loma Prieta earth- quake and was rare on the parts of the faults that we calculated were clamped. Because the seismicity rate was comparatively low on these faults before the Loma Prieta event, one must examine a number of faults to ensure that the association
between increased seismicity and unclamping is valid. In every case (with a minimum Ao- n of _+0.1 bars and seismically active) we observed similar apparent associations between unclamping and seismicity increase (all the faults shown in red on Plate 1, bottom). These include the Aldercroft, Berrocal, Butano, Lime Kiln, Monte Vista, and Sargent zones (Plate 1). The ratio of calculated normal stress changes to shear stress changes ranges from -1:4 to -5:1 on the active segments of the faults shown.
We calculated that the upper 3-4 km of the southern Santa Clara Valley oblique thrust faults were clamped, whereas the deeper parts were unclamped. Since seismicity rates are lower in the shallowest part of the San Francisco Bay Area crust off the major strike-slip faults [e.g., Hill et al., 1990], the correla- tion between clamping and low post-Loma Prieta earthquake rates at shallow depth (Plates 7 and 8) might be fortuitous. However, in the few cases where the Loma Prieta earthquake was calculated to have unclamped the shallower parts of the faults, the resulting seismicity approaches the surface (i.e., the Sargent fault, Plate 7).
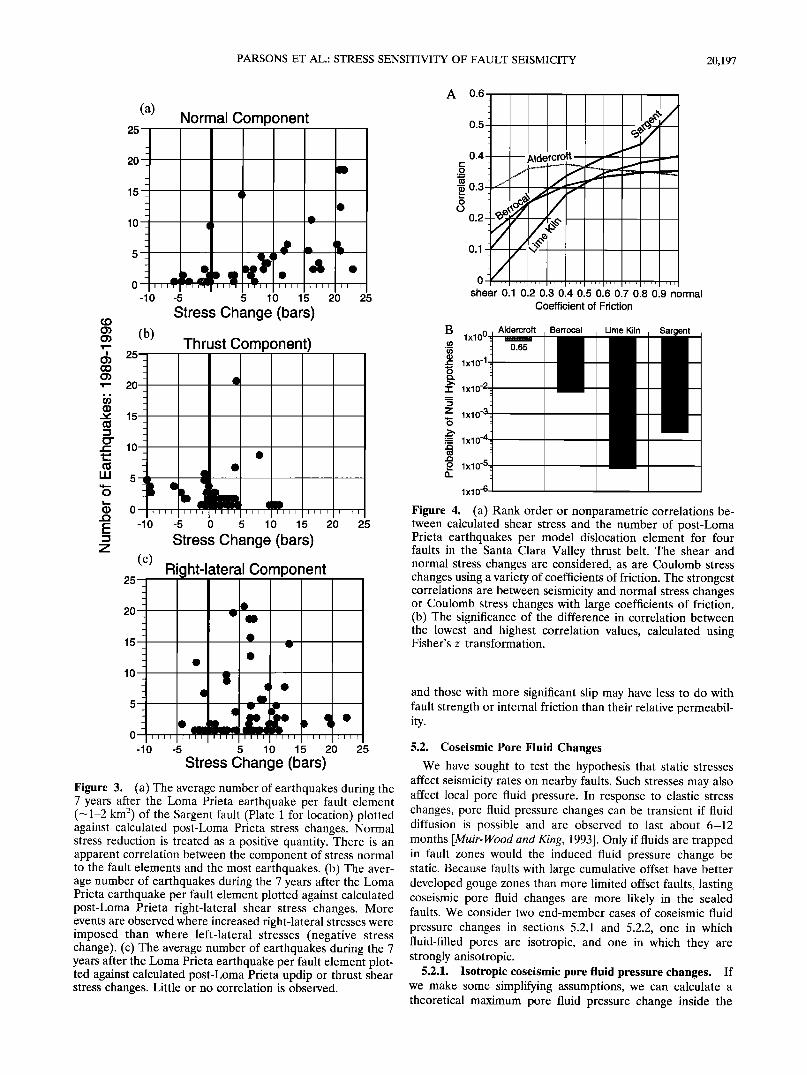
We demonstrate the normal stress dependency for earth- quakes occurring on the Sargent fault in Figure 3, where the number of hypocenters per fault element are plotted against the components of calculated post-Loma Prieta stress. During the 7 years after the Loma Prieta earthquake, there was a relationship between the magnitude of normal stress change and the number of earthquakes occurring on each fault patch. No such dependence was observed for the calculated compo- nents of shear stress in either the thrust or right-lateral direc- tions (Figure 3), although more earthquakes occurred where right-lateral slip was encouraged by the Loma Prieta earth- quake than where updip or thrust slip was encouraged.
20,192 PARSONS ET AL.: STRESS SENSITIVITY OF FAULT SEISMICITY
A 0.7
, ' Andreas
-<%
,,1, ,,,, ,•,, ,,,, ,,,, [,,, ,,t, ........
0.6
0.5
0.4
0.3
0.1
0
shear 0.1 0.2 0.3 0.4 0.5 0.6 0.7 0.8 0.9 normal Coefficient of Friction
lO o
• d 1 ol
-2
--,10 z
o -3
._z- 10
(1:1 4 ol
10 -5
Hayward San Gregorio San Andreas
Figure 2. (a) Rank order or nonparametric correlations be- tween calculated shear stress and seismicity rate changes for the three major right-lateral fault zones considered in this study. The shear and normal stress changes are considered as are Coulomb stress changes using a variety of coefficients of friction. The strongest correlations are between seismicity and shear stress changes or Coulomb stress changes with small coefficients of friction. (b) The significance of the difference in correlation between the lowest and highest correlation values, calculated using Fisher's z transformation.
A similar relationship between earthquake occurrence and normal stress changes was observed in the 1997 Umbria- Marche earthquake sequence in Italy. In this sequence, Cou- lomb stress changes (with/x' = 0.4) could explain three of the five ruptures, while unclamping could explain all of them [Nos- tro et al., 1998]. The normal faults in the Apennines are similar to the Santa Clara Valley thrust belt faults in that they are young and have comparably small cumulative offsets [Nostro et al., 1998].
We applied a nonparametric correlation analysis to the faults in the Santa Clara Valley thrust belt that had high rates of seismicity following the Lama Prieta earthquake in a fashion similar to the major right-lateral faults. However, because there were very few earthquakes observed in this zone (zero in most places) before 1989, we calculated the correlation be- tween rank of stress change and the rank number of earth- quakes per dislocation element following the Lama Prieta shock, instead of seismicity rate change (Figure 4). We found that the testable faults in the Santa Clara Valley thrust belt showed an opposite correlation trend as the major strike-slip faults (Plate 7), with a stronger association between normal stress change and number of earthquakes than between shear stress change and earthquake occurrence. The significance of this difference is measurable and ranges from a 0.00008% to a
65% chance that the difference is a result of random chance
(Figure 4). It should be noted that the apparent differences in correlation between the occurrence of earthquakes and normal stress and with/x - 0.8 are not significant. The resolution of this analysis is more suited to statements about correlations between high versus low friction.
5. Discussion
We observe differences in response to stress changes that are associated with fault style. The behavior of the Santa Clara Valley thrust belt faults following the Lama Prieta earthquake is consistent with long-held models of frictional faulting in that they appear to have high coefficients of friction and are con- sistent with laboratory simulations. For example, a Coulomb criterion can explain seismicity rate increases on these faults using a coefficient of friction between 0.6 and 0.8. In contrast, however, major fault zones that accommodate significant slip (>50-100 km) appear to be relatively insensitive to changes in normal stress. Thus a possible interpretation of these results is that faults with more cumulative slip evolve toward a lower apparent coefficient of friction. Four possible effects that could reduce or mute the impact of the frictional terms in the failure criteria presented in the introduction include (1) low intrinsic friction in the fault zone materials, (2) a very high pore pres- sure state in the fault zone, (3) stress-induced pore fluid pres- sure changes in the fault zone that balance normal stress changes, and (4) time and velocity dependent frictional effects. We focus here on pore fluid and time dependent effects.
5.1. Relative Permeability and Elevated Pore Pressure Models
If the pore fluid pressure inside the major right-lateral strike-slip fault zones is very high, then small changes in nor- mal stress like those induced by the Lama Prieta or Landers earthquakes might not have much impact, which could explain the apparent insensitivity of those faults to normal stress changes. There have been a number of ways suggested to maintain high pore pressure in faults with large cumulative offset. Byerlee [1990] noted that fluid overpressures are com- monly observed in the crust and that the permeability of fault gouge is so limited that a 1-km-wide thickness at the base of the seismagenic zone could support pore pressures equal to the greatest principal stress. Sleep and Blanpied [1992, 1994] derived a model that rather than maintaining uniform high pore pressures as in Byerlee's [1990] model, fluid pressure could increase gradually from below hydrostatic following an earthquake to nearly lithastatic just prior to the next earth- quake. Rice [1992] suggested that metamorphic fluids from beneath the seismagenic zone could be tapped by vertical faults and kept at high pressures. In his model the mean stresses are much higher inside the fault zone than outside, which keeps the high pore fluid pressures less than the least principal stress inside the fault zone, preventing hydrofacing. Locknet and Byeflee [1995] and Miller et al. [1996] suggested that high pore fluid pressure occurs in discrete cells within the fault zone; slip on the fault transfers the fluid into new cells.
All the models discussed above incorporate the idea that impermeable fault gouge traps fluids inside the fault. Obser- vational and experimental data indicate that as slip increases, faults develop a thick, impermeable gouge layer [e.g., Scholz, 1987; Chester et al., 1993]. Thus, if fault zone fluids are impor- tant, the differences we observe between faults with limited slip
PARSONS ET AL.: STRESS SENSITIVITY OF FAULT SEISMICITY 20,193
A
Monterey Bay Seismicity
.. 37ON
22øW
EQ After Loma Prieta
EQ Before Loma Prieta
0 km 20 40
B
0.0
5.0
lO.O
15.o
20.0
Loma Prieta Hypocenter
Plate 5. (a) Map view of Monterey Bay showing the pre-Loma Prieta seismicity in blue and post-Loma Prieta seismicity in red. The view angle is downdip (70 ø) along the San Gregorio fault. There was generally an increase in activity following the 1989 earthquake. (b) The same events as shown in a, but plotted in a cross-sectional view.
A
B
20 'T'"-'-'-'-"-'T"-----• 40 "'1
Left Lateral •'i.11'•i'•'". •. ................ .,• Right Lateral 60 km (Slip Discouraged) 1.0 010 1.0 (slip Encouraged)
Shear Stress (bars) EQ After Loma Prieta EQ Before Loma Prieta
c
Rate Decrease <• ............... ) I ! I
0.4 0.0 4.0
Seismicity Rate Ratio
Rate Increase
118'W 117' ß ß ß
•"•/'e•-, Landers • •',•,.. Big Bear
••Cajon Pass • •S•o• C • •au• • OS U•
-'%• •[•-.. •• T•ee
117.5' 116.5' ' I _, ,L I ,, I ,
Clamping <• : ................ •> Unclamping ! I
'5 (Slip Discouraged) 1. 0.0 1.5 (Slip Encouraged) Normal Stress (bars)
Plate 6. (a) The calculated shear-stress changes resulting from the Landers, Joshua Tree, and Big Bear earthquakes shown resolved on the San Andreas fault in southern California. (b) The pattern of shear stress change matching the pattern of calculated seismicity rate change (5-year background rate calculated before the 1986 North Palm Springs earthquake compared with the 5-year period after the Landers shock) shown below. (c) The normal stress changes resulting from the Landers, Joshua Tree, and Big Bear earthquakes shown resolved on the San Andreas fault in southern California. Much of the fault zone was unclamped. The change in shear stress shown in a matches the calculated seismicity rate change better than the normal stress change. Inset map shows the main fault traces in the Cajon Pass region of southern California.
PARSONS ET AL.: STRESS SENSITIVITY OF FAULT SEISMICITY 20,195
0 km I______
A. Sargent Fault- Normal Stress Change
10 20 30 40
m
EQ After Loma Prieta
EQ Before Loma Prieta
Clamping •i•i ,, ,111-'"' -11--"-i'ir-i• 'i i r iiiii iii•11 ,• Unciamping (Slip Discouraged) 7.0 0.0 7.0 (Slip Encouraged)
Normal Stress (bars)
10-
B. Sargent Fault - Oblique Shear Stress Change
Left Lateral
(Slip Discouraged) 10.0
,
0.0 10.0
Shear Stress (bars)
Right Lateral (Slip Encouraged)
Plate 7. Pre- (in blue) and post-Loma Prieta seismicity (in red) plotted against the Sargent fault, part of the southern Santa Clara Valley thrust belt. Seven years of events before and after Loma Prieta are plotted. (a) The normal component of post-Loma Prieta static stress change plotted (clamping in blue, unclamping in red). There is an apparent association between increased seismicity and parts of the faults that are unclamped. (b) The oblique shear stress component (rake of 135 ø) [e.g., Zoback et al., 1998] plotted with right-lateral/thrust shown in red and the left-lateral/normal in blue. There is not a strong association between the shear stress changes and the post-Loma Prieta seismicity.
20,196 PARSONS ET AL.: STRESS SENSITIVITY OF FAULT SEISMICITY
PARSONS ET AL.' STRESS SENSITIVITY OF FAULT SEISMICITY 20,197
(a) Normal Gomponent
25
2O
15
10
5
0
-10 -5 5 10 15 20 25
Stress Change (bars)
(b) Thrust Component) w-, 25•
..• 1
iii 5 o
G) o
l:: -10 -5 0 5 10 15 20 25 = Stress Change (bars) z
Right-lateral Component 25
2O
15
10
5
0
-10 -5 5 10 15 20 25
Stress Change (bars)
Figure 3. (a) The average number of earthquakes during the 7 years after the Loma Prieta earthquake per fault element (-1-2 km 2) of the Sargent fault (Plate 1 for location) plotted against calculated post-Loma Prieta stress changes. Normal stress reduction is treated as a positive quantity. There is an apparent correlation between the component of stress normal to the fault elements and the most earthquakes. (b) The aver- age number of earthquakes during the 7 years after the Loma Prieta earthquake per fault element plotted against calculated post-Loma Prieta right-lateral shear stress changes. More events are observed where increased right-lateral stresses were imposed than where left-lateral stresses (negative stress change). (c) The average number of earthquakes during the 7 years after the Loma Prieta earthquake per fault element plot- ted against calculated post-Loma Prieta updip or thrust shear stress changes. Little or no correlation is observed.
A 0.6
0.5
0.4
0.3
0.2
0.1
Aldercroft •,,•,.• •.. ---- _
/,½
/ 0 •,, ,,,, ,i,, ,,,, ,,,, ,,,, ,,•1 ,,,, ,,i,
shear 0.1 0.2 0.3 0.4 0.5 0.6 0.7 0.8 0.9 normal Coefficient of Friction
B lxl
ß o_1 .c: lxl o
n- lxl
Z lxl o
m lxl
•o lxl
lx10
Figure 4. (a) Rank order or nonparametric correlations be- tween calculated shear stress and the number of post-Loma Prieta earthquakes per model dislocation element for four faults in the Santa Clara Valley thrust belt. The shear and normal stress changes are considered, as are Coulomb stress changes using a variety of coefficients of friction. The strongest correlations are between seismicity and normal stress changes or Coulomb stress changes with large coefficients of friction. (b) The significance of the difference in correlation between the lowest and highest correlation values, calculated using Fisher's z transformation.
and those with more significant slip may have less to do with fault strength or internal friction than their relative permeabil- ity.
5.2. Coseismic Pore Fluid Changes
We have sought to test the hypothesis that static stresses affect seismicity rates on nearby faults. Such stresses may also affect local pore fluid pressure. In response to elastic stress changes, pore fluid pressure changes can be transient if fluid diffusion is possible and are observed to last about 6-12 months [Muir-Wood and King, 1993]. Only if fluids are trapped in fault zones would the induced fluid pressure change be static. Because faults with large cumulative offset have better developed gouge zones than more limited offset faults, lasting coseismic pore fluid changes are more likely in the sealed faults. We consider two end-member cases of coseismic fluid
pressure changes in sections 5.2.1 and 5.2.2, one in which fluid-filled pores are isotropic, and one in which they are strongly anisotropic.
5.2.1. Isotropic coseismic pore fluid pressure changes. If we make some simplifying assumptions, we can calculate a theoretical maximum pore fluid pressure change inside the
20,198 PARSONS ET AL.: STRESS SENSITIVITY OF FAULT SEISMICITY
10 Northern Sargent Fault (upper 8 km; 20 km length) Clipped (• 1 O0 events)
..
_
_
Loma Prieta
- I ...................... I ......................................... I .... I .... I .... I .........................
9
•4 • _
•3i z 2
1
1970 1975 1980 1985 1990 1995
Year
Southern Hayward Fault (upper 8 km; 20 km length) 10
9
8
'-' 7' . .
0-6
(• 5
e 4
E 3
z 2
0 '"'1 .... I .... I ................................ 1970 1975 1980 1985 1990 1995
Year
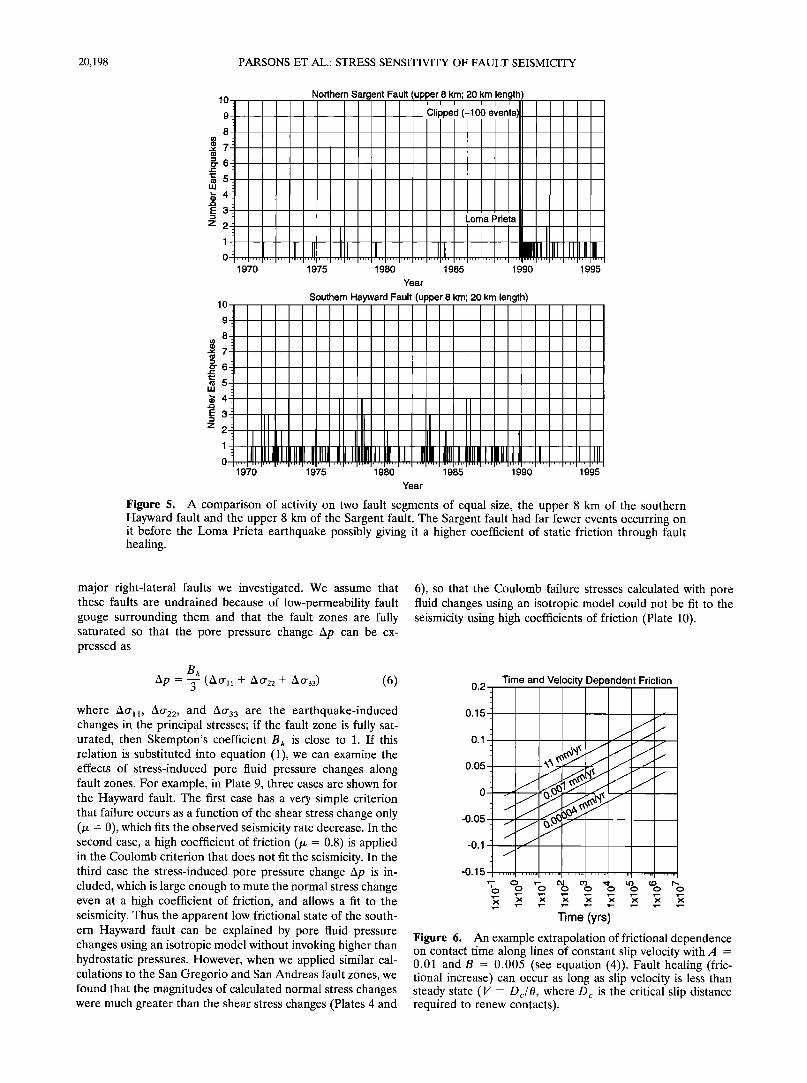
Figure 5. A comparison of activity on two fault segments of equal size, the upper 8 km of the southern Hayward fault and the upper 8 km of the Sargent fault. The Sargent fault had far fewer events occurring on it before the Loma Prieta earthquake possibly giving it a higher coefficient of static friction through fault healing.
major right-lateral faults we investigated. We assume that these faults are undrained because of low-permeability fault gouge surrounding them and that the fault zones are fully saturated so that the pore pressure change Ap can be ex- pressed as
Bk Ap =T (Ao'• + /k0-22--1- /k0-33 ) (6)
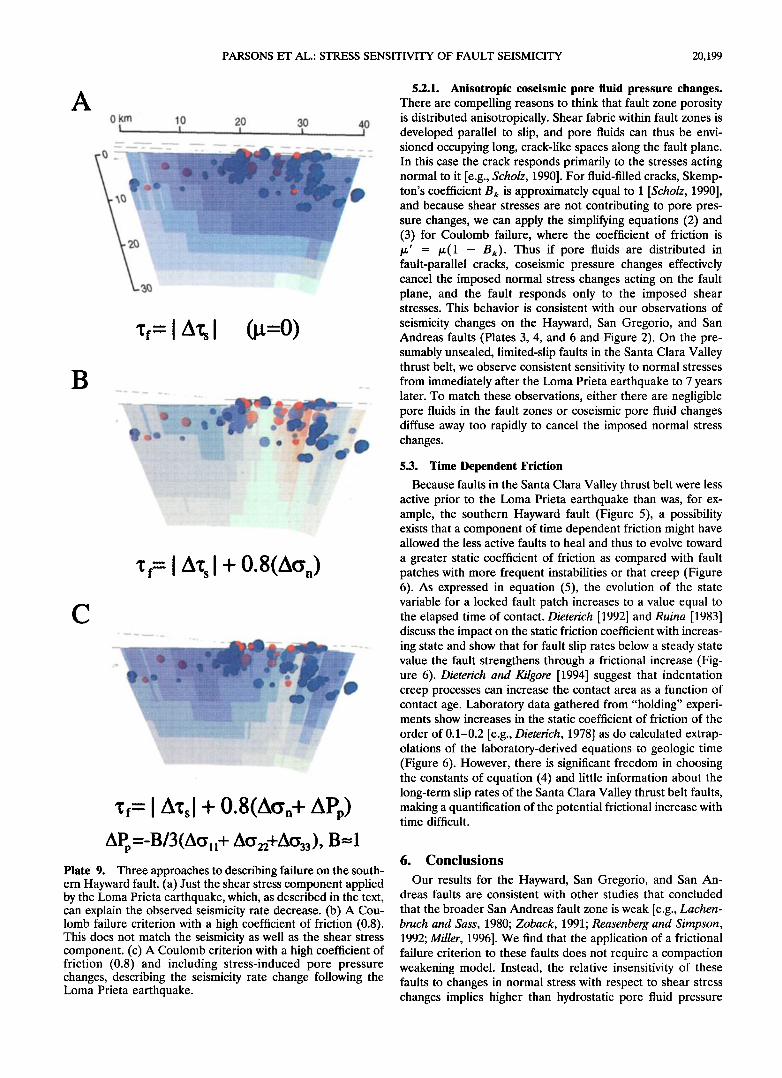
where Aoh• , AO'22 , and AO'33 are the earthquake-induced changes in the principal stresses; if the fault zone is fully sat- urated, then Skempton's coefficient B a is close to 1. If this relation is substituted into equation (1), we can examine the effects of stress-induced pore fluid pressure changes along fault zones. For example, in Plate 9, three cases are shown for the Hayward fault. The first case has a very simple criterion that failure occurs as a function of the shear stress change only (Ix -- 0), which fits the observed seismicity rate decrease. In the second case, a high coefficient of friction (Ix -- 0.8) is applied in the Coulomb criterion that does not fit the seismicity. In the third case the stress-induced pore pressure change Ap is in- cluded, which is large enough to mute the normal stress change even at a high coefficient of friction, and allows a fit to the seismicity. Thus the apparent low frictional state of the south- ern Hayward fault can be explained by pore fluid pressure changes using an isotropic model without invoking higher than hydrostatic pressures. However, when we applied similar cal- culations to the San Gregorio and San Andreas fault zones, we found that the magnitudes of calculated normal stress changes were much greater than the shear stress changes (Plates 4 and
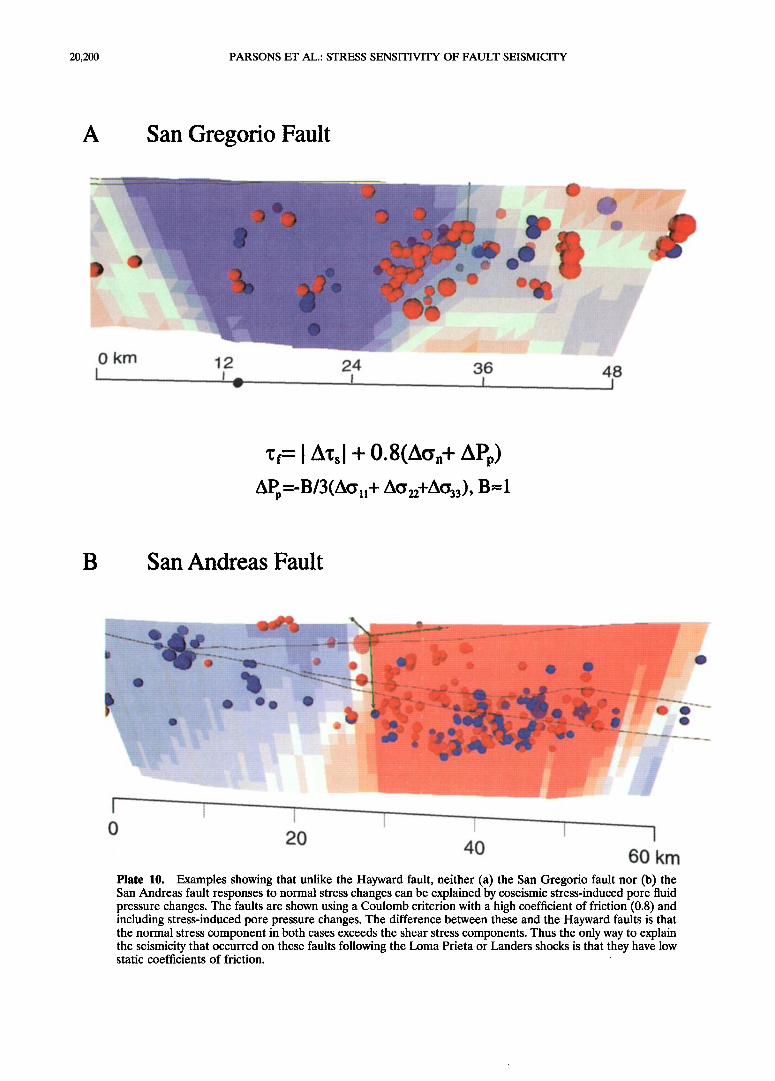
6), so that the Coulomb failure stresses calculated with pore fluid changes using an isotropic model could not be fit to the seismicity using high coefficients of friction (Plate 10).
0.2
0.15
0.1
0.05
-0.05
-0.1
-0.15
Time and Velocity Dependent Friction
, ,,,,., , ,,,., ,,,,,,, ,,,,,,,, , ,,,,., ,,,,,,,, , ,,,[,,, , ,,1,,.
X X X X X X X X X
Time (yrs)
Figure 6. An example extrapolation of frictional dependence on contact time along lines of constant slip velocity with A - 0.01 and B = 0.005 (see equation (4)). Fault healing (fric- tional increase) can occur as long as slip velocity is less than steady state (V = Do/0, where D c is the critical slip distance required to renew contacts).
PARSONS ET AL.: STRESS SENSITIVITY OF FAULT SEISMICITY 20,199
A
B
0 krn 10 20 30 40
I zX,r,I
5.2.1. Anisotropic coseismic pore fluid pressure changes. There are compelling reasons to think that fault zone porosity is distributed anisotropically. Shear fabric within fault zones is developed parallel to slip, and pore fluids can thus be envi- sioned occupying long, crack-like spaces along the fault plane. In this case the crack responds primarily to the stresses acting normal to it [e.g., Scholz, 1990]. For fluid-filled cracks, Skemp- ton's coefficient Bk is approximately equal to 1 [Scholz, 1990], and because shear stresses are not contributing to pore pres- sure changes, we can apply the simplifying equations (2) and (3) for Coulomb failure, where the coefficient of friction is p,' = p,(1 - Bk). Thus if pore fluids are distributed in fault-parallel cracks, coseismic pressure changes effectively cancel the imposed normal stress changes acting on the fault plane, and the fault responds only to the imposed shear stresses. This behavior is consistent with our observations of
seismicity changes on the Hayward, San Gregorio, and San Andreas faults (Plates 3, 4, and 6 and Figure 2). On the pre- sumably unsealed, limited-slip faults in the Santa Clara Valley thrust belt, we observe consistent sensitivity to normal stresses from immediately after the Loma Prieta earthquake to 7 years later. To match these observations, either there are negligible pore fluids in the fault zones or coseismic pore fluid changes diffuse away too rapidly to cancel the imposed normal stress changes.
c
•f= I Axsl q-0.8(Ac,,q- APp) APp=-B/3(Ao,,+ Ao22+Ao3_,), B--1
Plate 9. Three approaches to describing failure on the south- ern Hayward fault. (a) Just the shear stress component applied by the Loma Prieta earthquake, which, as described in the text, can explain the observed seismicity rate decrease. (b) A Cou- lomb failure criterion with a high coefficient of friction (0.8). This does not match the seismicity as well as the shear stress component. (c) A Coulomb criterion with a high coefficient of friction (0.8) and including stress-induced pore pressure changes, describing the seismicity rate change following the Loma Prieta earthquake.
5.3. Time Dependent Friction
Because faults in the Santa Clara Valley thrust belt were less active prior to the Loma Prieta earthquake than was, for ex- ample, the southern Hayward fault (Figure 5), a possibility exists that a component of time dependent friction might have allowed the less active faults to heal and thus to evolve toward
a greater static coefficient of friction as compared with fault patches with more frequent instabilities or that creep (Figure 6). As expressed in equation (5), the evolution of the state variable for a locked fault patch increases to a value equal to the elapsed time of contact. Dieterich [1992] and Ruina [1983] discuss the impact on the static friction coefficient with increas- ing state and show that for fault slip rates below a steady state value the fault strengthens through a frictional increase (Fig- ure 6). Dieterich and Kilgore [1994] suggest that indentation creep processes can increase the contact area as a function of contact age. Laboratory data gathered from "holding" experi- ments show increases in the static coefficient of friction of the
order of 0.1-0.2 [e.g., Dieterich, 1978] as do calculated extrap- olations of the laboratory-derived equations to geologic time (Figure 6). However, there is significant freedom in choosing the constants of equation (4) and little information about the long-term slip rates of the Santa Clara Valley thrust belt faults, making a quantification of the potential frictional increase with time difficult.
6. Conclusions
Our results for the Hayward, San Gregorio, and San An- dreas faults are consistent with other studies that concluded
that the broader San Andreas fault zone is weak [e.g., Lachen- bruch and Sass, 1980; Zoback, 1991; Reasenberg and Simpson, 1992; Miller, 1996]. We find that the application of a frictional failure criterion to these faults does not require a compaction weakening model. Instead, the relative insensitivity of these faults to changes in normal stress with respect to shear stress changes implies higher than hydrostatic pore fluid pressure
20,200 PARSONS ET AL.' STRESS SENSITIVITY OF FAULT SEISMICITY
A San Gregorio Fault
0 km 12 24 36 48
z,= I zx-c,I + 0.8(A(5'n-t- APp) APp=-B/3(Ao•+ A(J22-l-Ao33), B=I
B San Andreas Fault
o
20 40 60 km Plate 10. Examples showing that unlike the Hayward fault, neither (a) the San Gregorio fault nor (b) the San Andreas fault responses to normal stress changes can be explained by coseismic stress-induced pore fluid pressure changes. The faults are shown using a Coulomb criterion with a high coefficient of friction (0.8) and including stress-induced pore pressure changes. The difference between these and the Hayward faults is that the normal stress component in both cases exceeds the shear stress components. Thus the only way to explain the seismicity that occurred on these faults following the Loma Prieta or Landers shocks is that they have low static coefficients of friction.
PARSONS ET AL.: STRESS SENSITIVITY OF FAULT SEISMICITY 20,201
within the fault zones, low intrinsic friction, or pore fluids distributed in fault-parallel cracks such that coseismic fluid pressure changes counteract the inhibition or encouragement of slip expected from normal stress changes. Our results do not allow us to discriminate among the various sealed-fault-zone models but do suggest that fault permeability may be the most important aspect to the apparent strength of a fault, with the weakest being the most impermeable.
In contrast with the major strike-slip fault zones, seismicity on the faults of the Santa Clara Valley thrust belt shows strong dependence on changes in normal stress. The static reduction in normal stress (unclamping) that occurred after Loma Prieta on many of these faults was followed by a closely correlated increase in seismicity. The characteristics of these faults with more limited slip, and most likely with less gouge [e.g., Scholz, 1987], can be described by applying a failure criterion with approximately hydrostatic pore pressure and the higher coef- ficients of friction more consistent with laboratory measure- ments (0.5-0.8). This difference in behavior from the faults with large cumulative slip may result from a lack of a gouge seal that allows coseismic pressurized fluids to escape the fault zones. Additionally, it is possible that the more limited activity on these faults before the Loma Prieta earthquake implies that they may have become stronger, with an "older" population of contacts. While the behavior of these faults is consistent with a
time dependent frictional increase, it can also be adequately described with a Coulomb criterion.
Acknowledgments. This work was carried out under a cooperative research and development agreement between the Pacific Gas and Electric Company and the USGS Earthquake Hazards and Coastal and Marine Programs. The ideas presented here were improved through discussions with Norm Abrahamson, Nick Beeler, Mike Blan- pied, Jim Dieterich, and Shinji Toda. Bob Jachens, Angela Jayko, Bob McLaughlin, and Mary Lou Zoback helped us with building the fault inventory. Internal reviews by Joan Gomberg and Nick Beeler im- proved the manuscript significantly, and we thank Associate Editor Greg Beroza, Chris Scholz, and an anonymous reviewer for genuinely helpful review comments.
References
Anderson, R. S., and K. M. Menking, The Quaternary marine terraces of Santa Cruz, California: Evidence for coseismic uplift on two faults, Geol. Soc. Am. Bull., 106, 649-664, 1994.
Aydin, A., and B. M. Page, Diverse Pliocene-Quaternary tectonics in a transform environment, San Francisco Bay region, California, Geol. Soc. Am. Bull., 95, 1303-1317, 1984.
Beroza, G. C., Near-source modeling of the Loma Prieta earthquake: Evidence for heterogeneous slip and implications for earthquake hazard, Bull. Seismol. Soc. Am., 81, 1603-1621, 1991.
Borchardt, G., J. J. Lienkaemper, and K. E. Budding, Holocene slip of the Hayward fault at Fremont, in Proceeding. s on the Second Confer- cnce on Earthquake Hazards in the Eastern San Francisco Bay Area, edited by G. Borchardt, Calif. Spec. Publ. Div. Mines Geol., 113, 181-188, 1992.
Brabb, E. E., Preliminary geologic map of the onshore part of the Palo Alto 1:100,000 quadrangle, California, U.S. Geol. Sum Open File Rep., 93-271, 1993.
Brabb, E. E., and J. Olson, Map showing faults and earthquake epi- centers in San Mateo County, California, U.S. Geol. Surv. Misc. Invest. Ser. Map, 1-1257-F, 1986.
Byerlee, J. D., Friction, overpressure and fault normal compression, Geophys. Res. Lett., 17, 2109-2112, 1990.
Chester, F. M., J.P. Evans, and R. L. Biegel, Internal structure and weakening mechanisms of the San Andreas fault, J. Geophys. Res., 98, 771-786, 1993.
Clark, J. C., Stratigraphy, paleontology, and geology of the central
Santa Cruz Mountains, California Coast Ranges, U.S. Geol. Surv. Open Prof. Pap., 1168, 1981.
Clark, J. C., E. E. Brabb, and R. J. McLaughlin, Geologic Map and structure sections of the Laurel 7-1/2' quadrangle, Santa Clara and Santa Cruz Counties, California, U.S. GeoL Sum Open File Rep., 89-676, 1989.
Cotton, F., and O. Coutant, Dynamic stress variations due to shear faults in a plane-layered medium, Geophys. J. Int., 128, 676-688, 1997.
De Mets, C., R. G. Gordon, D. F. Argus, and S. Stein, Current plate motions, Geophys. J. Int., 101,425-478, 1990.
Dibblee, T. H., Preliminary geologic map of the Lick Observatory quadrangle, Alameda and Santa Clara Counties, California, U.S. Geol. Sum Open File Rep., 72-90, 1972a.
Dibblee, T. H., Preliminary geologic map of the Milpitas quadrangle, Alameda and Santa Clara Counties, California, U.S. GeoL Surv. Open File Rep., 72-91, 1972b.
Dieterich, J. H., Time-dependent friction and the mechanics of stick- slip, Pure Appl. Geophys., 116, 790-806, 1978.
Dieterich, J. H., Modeling of rock friction, 1, Experimental results and constitutive equations, J. Geophys. Res., 84, 2161-2168, 1979.
Dieterich, J. H., Earthquake nucleation on faults with rate- and state- dependent strength, Tectonophysics, 211, 115-134, 1992.
Dieterich, J. H., and B. D. Kilgore, Direct observation of frictional contacts: New insights for state-dependent properties, Pure Appl. Geophys., 143, 283-302, 1994.
Gallardo, V. A., G. W. Simiia, K. C. McNally, and D. S. Stakes, Continued monitoring of seismicity in the Monterey Bay region and associated San Gregorio fault (abstract), Eos Trans. AGU, 78(46), F454, 1997.
Graymer, R. W., D. L. Jones, and E. E. Brabb, Geologic map of the Hayward fault zone, Contra Costa, Alameda, and Santa Clara Coun- ties, California: A digital database, U.S. Geol. Surv. Open File Rep., 95-597, 1995.
Hall, C. A., Jr., Geology of the Point Sur-Lopez Point region, Coast Ranges, California: A part of the southern California allochthon, Am. Spec. Pap. Geol. Soc., 266, 40 pp., 1991.
Harris, R. A., Introduction to special section: Stress triggers, stress shadows, and implications for seismic hazard, J. Geophys. Res., 103, 24,347-24,358, 1998.
Helley, E. J., and J. R. Wesling, Quaternary geologic map of the Milpitas quadrangle, Alameda and Santa Clara Counties, California, U.S. Geol. Surv. Open File Rep., 90-671, 1990a.
Helley, E. J., and J. R. Wesling, Quaternary geologic map of the San Jose East quadrangle, Santa Clara County, California, U.S. Geol. Surv. Open File Rep., 90-427, 1990b.
Hill, D. P., J.P. Eaton, and L. M. Jones, Seismicity, 1980-86, in The San Andreas Fault System, California, edited by R. E. Wallace, U.S. Geol. Surv. Open Prof. Pap., 1515, 115-152, 1990.
Holbrook, W. S., T. M. Brocher, U.S. ten Brink, and J. A. Hole, Crustal structure beneath the San Francisco Bay block and the central California margin, J. Geophys. Res., 101, 22,311-22,334, 1996.
Jachens, R. C., and A. Griscom, Geologic and geophysical setting of the earthquake: Inferences from magnetic and gravity anomalies, U.S. Geol. Sum Prof. Pap. 1550-E, in press, 1999.
Jaeger, J. C., and N. G. W. Cook, Fundamentals of Rock Mechanics, Chapman and Hall, New York, 1979.
Jayko, A. S., and S. D. Lewis, Toward assessing the seismic risk asso- ciated with blind thrust faults, San Francisco Bay region, California, U.S. Geol. Sum Open File Rep., 96-267, 1996.
Jennings, C. W., Fault activity map of California and adjacent areas, Califi Geol. Data Map Set., 6• Calif. Div. of Mines and Geol., Sac- ramento, 1994.
Jennings, C. W., and J. L. Burnett, Geologic map of California, San Francisco sheet, Calif. Div. of Mines and Geol., Sacramento, 1961.
Kelson, K. I., W. R. Lettis, and M. Lisowski, Distribution of geologic slip and creep along faults in the San Francisco Bay region, in Proceedings on the Second Conference on Earthquake Hazards in the Eastern San Francisco Bay Area, edited by G. Borchardt, Spec. Publ. Calif. Div. Mines Geol., 113, 31-38, 1992.
King, G., C. P., R. S. Stein, and J. Lin, Static stress changes and the triggering of earthquakes, Bull. Seismol. Soc. Am., 84, 935-953, 1994.
Lachenbruch, A. H., and J. H. Sass, Heat flow and energetics of the San Andreas fault zone, J. Geophys. Res., 85, 6185-6222, 1980.
Lewis, S. D., Deformation style of shelf sedimentary basins seaward of
20,202 PARSONS ET AL.: STRESS SENSITIVITY OF FAULT SEISMICITY
the San Gregorio fault, central California, Eos Trans. AGU, 43, 1631, 1990.
Lienkaemper, J. J., Map of recently active traces of the Hayward fault, Alameda and Contra Costa Counties, California, U.S. Geol. Surv. Misc. Field Stud. Map, MF-2196, 1992.
Lienkaemper, J. J., and G. Borchardt, Holocene slip rate of the Hay- ward fault at Union City, in Proceedings on the Second Conference on Earthquake Hazards in the Eastern San Francisco Bay Area, edited by G. Borchardt, Spec. Publ. Calif. Div. Mines Geol., 113, 180, 1992.
Lisowski, M., W. H. Prescott, J. C. Savage, and M. L. Johnston, Geo- detic estimate of coseismic slip during the 1989 Loma Prieta, Cali- fornia, earthquake, Geophys. Res. Lett., 17, 1437-1440, 1990.
Lockner, D. A., and J. D. Byerlee, An earthquake instability model based on faults containing high fluid-pressure compartments, Pure Appl. Geophys., 145, 717-745, 1995.
Marshall, G. A., R. S. Stein, and W. Thatcher, Faulting geometry and slip from co-seismic elevation changes; the 18 October, 1989 Loma Prieta, California, Bull. Seismol. Soc. Am., 81, 1660-1693, 1991.
Matthews, M. V., and P. A. Reasenberg, Statistical methods for inves- tigating quiescence and other temporal seismicity patterns, Pure Appl. Geophys., 126, 357-372, 1988.
Matti, J. C., and D. M. Morton, Paleogeographic evolution of the San Andreas fault in southern California: A reconstruction based on a new cross-fault correlation, Geol. Soc. Am. Mem., 178, 107-159, 1993.
McLaughlin, R. J., T. R. Simoni, E. D. Osbun, and P. G. Bauer, Preliminary geologic map of the Loma Prieta-Mt. Madonna area, Santa Clara and Santa Cruz Counties, California, U.S. Geol. Surv. Open File Rep., 72-242, 1972.
McLaughlin, R. J., J. C. Clark, E. E. Brabb, and E. J. Helley, Geologic Map and structure sections of the Los Gatos 7-1/2' quadrangle, Santa Clara and Santa Cruz Counties, California, U.S. Geol. Surv. Open File Rep., 91-593, 1991.
McLaughlin, R., J., W. V. Sliter, D. H. Sorg, P. C. Russell, and A.M. Sarna-Wojcicki, Large-scale right-slip displacement on the east San Francisco Bay region fault system, California: Implications for loca- tion of late Miocene to Pliocene Pacific plate boundary, Tectonics, 15, 1-18, 1996.
Miller, S. A., Fluid-mediated influence of adjacent thrusting on the seismic cycle at Parkfield, Nature, 382, 799-802, 1996.
Miller, S. A., A. Nur, and D. L. Olgaard, Earthquakes as a coupled shear stress-high pore pressure dynamical system, Geophys. Res. Lett., 23, 197-200, 1996.
Muir-Wood, R., and G. C. P. King, Hydrological signatures of earth- quake strain, J. Geophys. Res., 98, 22,035-22,068, 1993.
Mullins, H. T., and D. K. Nagel, Evidence of shallow hydrocarbons offshore northern Santa Cruz County, California, AAPG Bull., 66, 1130-1139, 1982.
Nostro, C., M. Cocco, and G. Ekstr6m, Static stress changes and fault interaction during the 1997 Umbria-Marche earthquake sequence, paper presented at 23rd General Assembly, Eur. Geophys. Soc., Nice, France, April 20-24, 1998.
Okada, Y., Internal deformation due to shear and tensile faults in a half-space, Bull. Seismol. Soc. Am., 82, 1018-1040, 1992.
Pampeyan, E. H., Geologic map of the Montara Mountain and San Mateo 7-1/2' quadrangles, San Mateo County, California, U.S. Geol. Surv. Misc. Invest. Ser. Map, 1-2390, 1994.
Parsons, T., and M. L. Zoback, Three-dimensional upper-crustal ve- locity structure beneath San Francisco Peninsula, California, J. Geo- phys. Res., 102, 5473-5490, 1997.
Reasenberg, P. A., and M. V. Matthews, Precursory seismic quies- cence: A preliminary assessment in the hypothesis, Pure Appl. Geo- phys., 126, 373-406, 1988.
Reasenberg, P. A., and R. W. Simpson, Response of regional seismic- ity to the static stress change produced by the Loma Prieta earth- quake, Science, 255, 1687-1690, 1992.
Reasenberg, P. A., and R. W. Simpson, Response of regional seismic- ity to the static stress change produced by the Loma Prieta earth- quake, U.S. Geol. Surv. Prof. Pap., 1550-D, 49-71, 1997.
Rice, J. R., Fault stress states, pore pressure distributions, and the
weakness of the San Andreas Fault, in Fault Mechanics and Trans- port Properties of Rocks: A Festschrift in Honor of W. F. Brace, edited by B. Evans and T.-f. Wong, pp. 475-503, Academic, San Diego, Calif., 1992.
Rogers, T. H., Geologic map of California, San Jose sheet, Calif. Div. of Mines and Geol., Sacramento, 1966.
Ruina, A., Slip instability and state variable friction laws, J. Geophys. Res., 88, 10,359-10,370, 1983.
Sachs, L.,Applied Statistics, 707 pp., Springer-Verlag, New York, 1982. Scholz, C. H., Wear and gouge formation in brittle faulting, Geology,
15, 493-495, 1987. Scholz, C. H., The Mechanics of Earthquake Faulting, 439 pp., Cam-
bridge Univ. Press, New York, 1990. Schwartz, D. P., and D. J. Ponti, Field guide to neotectonics of the San
Andreas fault system, Santa Cruz Mountains, in light of the 1989 Loma Prieta Earthquake, U.S. Geol. Surv. Open File Rep., 90-274, 1990.
Seeber, L., and J. G. Armbruster, The San Andreas fault system through the Transverse Ranges as illuminated by earthquakes, J. Geophys. Res., 100, 8285-8310, 1995.
Simpson, G. D., S.C. Thompson, J. S. Noller, and W. R. Lettis, The northern San Gregorio fault zone: Evidence for the timing of late Holocene earthquakes near Seal Cove, California, Bull. Seismol. Soc. Am., 87, 1158-1170, 1997.
Simpson, R. W., and P. A. Reasenberg, Earthquake-induced static- stress changes on central California faults, U.S. Geol. Surv. Prof. Pap., 1550-F, 55-89, 1994.
Sleep, N.H., and M. L. Blanpied, Creep, compaction and the weak rheology of major faults, Nature, 359, 687-692, 1992.
Sleep, N.H., and M. L. Blanpied, Ductile creep and compaction: A mechanism for transiently increasing fluid pressure in mostly sealed fault zones, Pure Appl. Geophys., 143, 9-40, 1994.
Stein, R. S., G. C. P. King, and J. Lin, Stress triggering of the 1994 M = 6.7 Northridge, California, earthquake by its predecessors, Science, 265, 1432-1435, 1994.
Stein, R. S., A. A. Barka, and J. H. Dieterich, Progressive failure on the North Anatolian fault since 1939 by earthquake static stress trigger- ing, Geophys. J. Int., 128, 594-604, 1997.
Wald, D. J., Rupture model of the 1989 Loma Prieta earthquake from the inversion of strong-motion and broadband teleseismic data, Bull. Seismol. Soc. Am., 81, 1540-1572, 1991.
Wald, D., and T. H. Heaton, Spatial and temporal distribution of slip for the 1992 Landers, California, earthquake, Bull. Seismol. Soc. Am., 84, 668-691, 1994.
Wallace, R. E., The San Andreas fault system, California, U.S. Geol. Surv. Open Prof. Pap., 1515, 1990.
Weber, G. E., K. R. Lajoie, and G. B. Griggs, Coastal tectonics and coastal geologic hazards in Santa Cruz and San Mateo Counties, California, field trip guide, 187 pp., Geol. Soc. of Am., Cordilleran Sect., Boulder, Colo., 1979.
Wesling, J. R., and E. J. Helley, Quaternary geologic map of the San Jose West quadrangle, Santa Clara County, California, U.S. Geol. Surv. Open File Rep., 89-672, 1989.
Zoback, M.D., State of stress and crustal deformation along weak transform faults, Philos. Trans. R. Soc. London, Ser. A, 337, 141-150, 1991.
Zoback, M.D., and G. C. Beroza, Evidence for near-frictionless fault- ing in the 1989 (M 6.9) Loma Prieta, California, earthquake and its aftershocks, Geology, 21, 181-185, 1993.
Zoback, M. L., R. C. Jachens, and J. A. Olson, Abrupt along-strike change in tectonic style: San Andreas fault zone, San Francisco Peninsula, J. Geophys. Res., 104, 10,719-10,742, 1999.
T. Parsons, P. A. Reasenberg, R. W. Simpson, and R. S. Stein, U.S. Geological Survey, MS 999, 345 Middlefield Road, Menlo Park, CA 94025. ([email protected])
(Received August 5, 1998; revised January 21, 1999; accepted February 9, 1999.)