strong- eld dissociative ionization as a probe of...
TRANSCRIPT

Strong-field Dissociative Ionization as
a Probe of Molecular Dynamics and
Structure
A Dissertation Presented
by
Marija Kotur
to
The Graduate School
in Partial Fulfillment of the Requirements
for the Degree of
Doctor of Philosophy
in
Physics
Stony Brook University
May 2012

Stony Brook University
The Graduate School
Marija Kotur
We, the dissertation committee for the above candidate for the Doctor ofPhilosophy degree, hereby recommend acceptance of this dissertation.
Thomas C. Weinacht - Dissertation AdvisorAssociate Professor, Department of Physics and Astronomy
Philip Allen - Committee ChairProfessor, Department of Physics and Astronomy
Xu DuAssistant Professor, Department of Physics and Astronomy
Andreas BeckerAssociate Professor, Department of Physics, University od Colorado and
Associate Fellow, JILA
This dissertation is accepted by the Graduate School
Charles TaberInterim Dean of the Graduate School
ii

Abstract of the Dissertation
Strong-field Dissociative Ionization as a Probeof Molecular Dynamics and Structure
by
Marija Kotur
Doctor of Philosophy
in
Physics
Stony Brook University
2012
We present work on strong-field ionization of polyatomic molecules.
Strong-field ionization has been in focus of recent research efforts
in ultrafast atomic, molecular and optical science, due to its role in
the generation of attosecond pulses and as a probe of both nuclear
and electronic dynamics, and in imaging of molecular orbitals.
Ultrafast relaxation of excited state DNA and RNA bases, instru-
mental to their photostability, was tracked using strong-field disso-
ciative ionization. Relaxation through multiple pathways has been
observed and interpreted in terms of the excited state wavepacket
dynamics. The example of cytosine is presented in detail.
The electronic dynamics associated with the strong-field ionization
process were explored, in particular the role of the symmetry of the
neutral orbital from which the electron was removed. For ionization
from the highest lying occupied orbital, the ionization yields are
shown to reflect the symmetry of the orbital. Ionization from a
iii

deeper bound orbital is found to be more complicated. Further,
we find that a detailed treatment of ion-electron interactions that
take place during the ionization process is necessary to achieve a
qualitative agreement between final-state-resolved calculations and
experiments.
iv

Contents
List of Figures vii
List of Tables x
Acknowledgements xi
List of Publications xiii
1 Introduction 1
2 Experimental apparatus 9
2.1 Laser system . . . . . . . . . . . . . . . . . . . . . . . . . . . 9
2.2 Beamlines . . . . . . . . . . . . . . . . . . . . . . . . . . . . . 10
2.3 Time-of-flight mass spectrometer . . . . . . . . . . . . . . . . 11
2.4 Comparison of ionization-based methods . . . . . . . . . . . . 13
2.5 Pulse shaper . . . . . . . . . . . . . . . . . . . . . . . . . . . . 14
2.6 Heated nozzle setup . . . . . . . . . . . . . . . . . . . . . . . . 15
3 Closed-loop learning control of isomerization using shaped
laser pulses 19
3.1 Introduction . . . . . . . . . . . . . . . . . . . . . . . . . . . . 19
3.2 Closed-loop learning control . . . . . . . . . . . . . . . . . . . 23
3.3 Ab initio electronic structure calculations . . . . . . . . . . . . 24
3.4 Results of calculations . . . . . . . . . . . . . . . . . . . . . . 26
3.5 Experimental results . . . . . . . . . . . . . . . . . . . . . . . 27
3.6 Discussion . . . . . . . . . . . . . . . . . . . . . . . . . . . . . 31
3.7 Conclusions . . . . . . . . . . . . . . . . . . . . . . . . . . . . 34
v
4 Ultrafast excited state relaxation dynamics of isolated nucleic
bases 35
4.1 Introduction . . . . . . . . . . . . . . . . . . . . . . . . . . . . 35
4.2 Tautomers of adenine, cytosine and uracil . . . . . . . . . . . 38
4.3 Adenine, cytosine and uracil dynamics . . . . . . . . . . . . . 40
4.4 Distinguishing between pathways in cytosine . . . . . . . . . . 50
4.4.1 Fragmentation from the butterfly minimum . . . . . . 53
4.4.2 Fragmentation from the sofa minimum . . . . . . . . . 55
4.4.3 Other fragments . . . . . . . . . . . . . . . . . . . . . . 56
4.5 Conclusions . . . . . . . . . . . . . . . . . . . . . . . . . . . . 57
5 Strong field molecular ionization from multiple orbitals 59
5.1 Introduction . . . . . . . . . . . . . . . . . . . . . . . . . . . . 59
5.2 Multielectron wavefunctions and Dyson orbitals . . . . . . . . 62
5.3 Alignment through selective excitation and rotational dephasing 63
5.4 Results . . . . . . . . . . . . . . . . . . . . . . . . . . . . . . . 66
5.5 Discussion . . . . . . . . . . . . . . . . . . . . . . . . . . . . . 70
5.6 Conclusions . . . . . . . . . . . . . . . . . . . . . . . . . . . . 76
6 Role of state correlations in strong field molecular ionization 78
6.1 Introduction . . . . . . . . . . . . . . . . . . . . . . . . . . . . 78
6.2 Correlations between molecular states . . . . . . . . . . . . . . 79
6.3 Calculations . . . . . . . . . . . . . . . . . . . . . . . . . . . . 81
6.4 Results and discussion . . . . . . . . . . . . . . . . . . . . . . 82
6.5 Conclusions . . . . . . . . . . . . . . . . . . . . . . . . . . . . 91
7 Conclusions 92
Bibliography 94
A Fitting 113
A.1 Description of the fitting function . . . . . . . . . . . . . . . . 113
A.2 Main body of the fitting code . . . . . . . . . . . . . . . . . . 114
A.3 Subroutines of the fitting code . . . . . . . . . . . . . . . . . . 117
vi

List of Figures
1.1 Binding potential of an atom. . . . . . . . . . . . . . . . . . . 2
2.1 A schematic of our experimental setup . . . . . . . . . . . . . 10
2.2 Schematic of the TOF setup and the sample manifold . . . . . 12
2.3 A typical time-of-flight mass spectrum of uracil . . . . . . . . 12
2.4 Diagram of the pulse shaper. . . . . . . . . . . . . . . . . . . . 14
2.5 A typical pulse at the output of the pulse shaper. . . . . . . . 16
2.6 The vacuum chamber, with the powdered sample manifold at-
tached . . . . . . . . . . . . . . . . . . . . . . . . . . . . . . . 17
2.7 Heated nozzle setup. . . . . . . . . . . . . . . . . . . . . . . . 18
3.1 Cartoon of the experimental approach. . . . . . . . . . . . . . 20
3.2 Potential energy surfaces of CHD and HT relevant to the ring
opening reaction. . . . . . . . . . . . . . . . . . . . . . . . . . 22
3.3 MCQDPT2(8,10) calculation of the lowest 5 energy levels of
CHD+/ HT+ for a relaxed potential energy scan along the C5-
C6 bond length; energies of CHD+ and HT+ at the equilibrium
geometries of the neutral CHD and HT; five lowest energy levels
for the cation at the the geometries corresponding to the AC12
avoided crossing and the CI01 conical intersection in the neutral. 26
3.4 C2H+2 and parent ion yields as a function of pump-probe delay. 28
3.5 Peak integrals with the unshaped and the shaped pulse and
their ratios. . . . . . . . . . . . . . . . . . . . . . . . . . . . . 30
3.6 Spectral phases and corresponding spectral intensities of two
of the optimal pulses found by the GA; Temporal phases and
intensities for the same two pulses. . . . . . . . . . . . . . . . 33
4.1 Low-lying tautomers of adenine, cytosine and uracil . . . . . . 39
vii
4.2 Neutral and ionic energies at some of the important points on
the relaxation pathway on the S1 PES of the neutral molecule
for cytosine . . . . . . . . . . . . . . . . . . . . . . . . . . . . 41
4.3 Neutral and ionic energies at some of the important points on
the relaxation pathway on the S1 PES of the neutral molecule
for adenine . . . . . . . . . . . . . . . . . . . . . . . . . . . . . 42
4.4 Neutral and ionic energies at some of the important points on
the relaxation pathway on the S1 and S2 PES of the neutral
molecule for uracil . . . . . . . . . . . . . . . . . . . . . . . . 43
4.5 Parent and one selected fragment ion yield vs pump probe delay
for cytosine, adenine and uracil. . . . . . . . . . . . . . . . . . 45
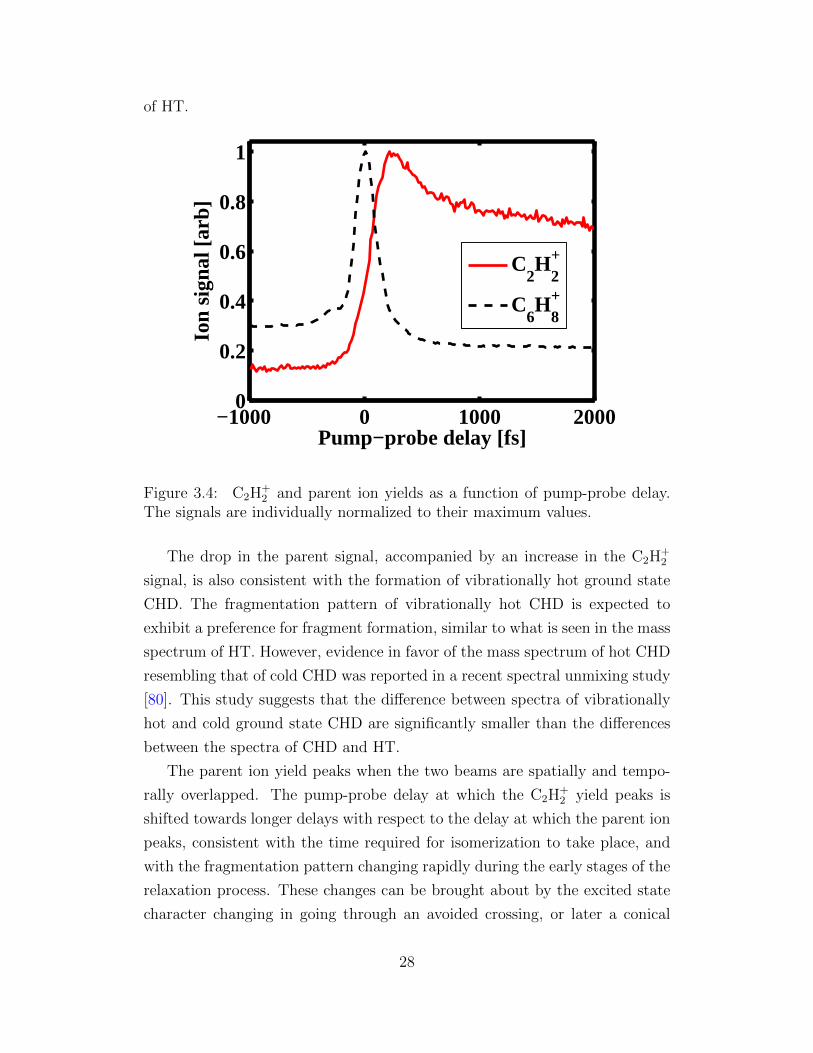
4.6 A cartoon of the excited and ground state of a molecule, with
a single barrier en route to a conical intersection. . . . . . . . 46
4.7 Natural orbitals of uracil. . . . . . . . . . . . . . . . . . . . . . 47
4.8 Histograms showing the spread of excited state lifetimes for
cytosine, adenine and uracil. . . . . . . . . . . . . . . . . . . . 49
4.9 The HOMO/HOMO-1 and LUMO orbitals of cytosine; natural
orbitals describing the hole for D0/D1 calculated at the geome-
tries S0 min, butterfly min, and sofa min. . . . . . . . . . . . . 52
4.10 Probe intensity dependence of fragment signal divided by parent. 53
4.11 Atomic numbering convention for cytosine. . . . . . . . . . . . 53
4.12 Calculated D0 energies along the ionic LLM pathways starting
at the sofa and the twist minimums and ending at the TSion point 54
4.13 Cartoon of S0 and S1 PES showing important points and timescales
extracted from experimental fittings. . . . . . . . . . . . . . . 58
5.1 Geometry of ground state uracil and transition dipole moment
for the S0 →S2 electronic transition. . . . . . . . . . . . . . . . 61
5.2 Population of rotational levels as a function of the rotational
quantum number. . . . . . . . . . . . . . . . . . . . . . . . . . 65
5.3 Rotational dephasing of uracil molecules. . . . . . . . . . . . . 66
5.4 Time of flight mass spectra of uracil for negative and positive
time delays. . . . . . . . . . . . . . . . . . . . . . . . . . . . . 67
5.5 Pump probe signals from 42, 41 and 28 amu fragments; pump-
probe ion yield vs pump polarization at 200 fs pump-probe delay. 68
viii

5.6 Dominant electronic configuration, characters and participating
orbitals for relevant states of the neutral and the ion. . . . . . 69
5.7 Pump-probe ion yield vs pump polarization and pump-probe
delay for the parent ion. . . . . . . . . . . . . . . . . . . . . . 70
5.8 Pump-probe ion yield vs pump polarization and pump-probe
delay for 42 amu. . . . . . . . . . . . . . . . . . . . . . . . . . 71
6.1 Comparison of Dyson-Keldysh, MO-ADK, and TD-RIS calcula-
tions for ionization to the various doublet cation states of uracil
starting from the ground state (S0) and first bright excited state
of the neutral molecule (S2). . . . . . . . . . . . . . . . . . . . 82
6.2 Electronic configurations of the lowest seven ionic states of uracil. 84
6.3 Energies of the first several ionic states along with the dissoci-
ation energies/barriers. . . . . . . . . . . . . . . . . . . . . . . 85
6.4 Predicted 69/112 ratios for positive (S2) and negative (S0) time
delays for the Dyson-Keldysh, MO-ADK and TD-RIS calcula-
tions considering different combinations of ionic states leading
to fragment 69. . . . . . . . . . . . . . . . . . . . . . . . . . . 86
6.5 Dependence of pump probe ion signals on the relative polariza-
tion of the pump and the probe beams. . . . . . . . . . . . . . 88
6.6 Pump-probe ion signals for the parent and 69 amu, and their
ratio . . . . . . . . . . . . . . . . . . . . . . . . . . . . . . . . 89
6.7 The ratio of fragment at 69 amu to the parent ion as a function
of probe pulse intensity. . . . . . . . . . . . . . . . . . . . . . 90
ix

List of Tables
4.1 Decay constants and their amplitudes for the ionic fragments
shown in Figure 4.5. . . . . . . . . . . . . . . . . . . . . . . . 48
4.2 Decay constants and associations. ∗ labels fragments which
come from excited states of the ion. . . . . . . . . . . . . . . . 57
6.1 Predicted 69/112 ratios for positive and negative time delays for
the full calculations and Dyson orbital amplitudes considering
different combinations of ionic states leading to fragment 69. . 87
x

AcknowledgementsI feel very privileged that I have many people to thank, even if that makes
this section read very much like a laundry list. First, I would like to thank my
advisor Tom Weinacht for his support, advice, patience, numerous discussions
and late nights in the lab, and above all for his unfaltering enthusiasm. I very
much enjoyed every aspect of being a part of the ultrafast spectroscopy lab,
from the time-consuming laser repairs to the productive discussions we had at
group meetings and otherwise.
Many thanks to the current and former members of the group. To Brett
Pearson, for showing me the ropes in the lab, to Carlos Trallero, for the en-
couragement and for introducing me to ab initio calculations, to Sarah Nichols,
for her detailed answers to all the questions I ever asked her, to Chien-hung
(Coco) Tseng, for memorable moments in the lab, to Oumarou Njoya for the
time we spent in the lab together, and to Stephen Clow, Uvo Holscher and
Peter Sandor and for the camaraderie. Thanks to Martin Cohen for the helpful
advice, especially with all kinds of laser issues. Special thanks to my officemate
Dominik Geißler, for the help in the lab and with various codes, the endless
discussions, for sharing his “crazy” ideas with me, for the coffee breaks, driv-
ing lessons, trips, and other things too numerous to list here, but above all for
bearing with me all these years.
I have greatly benefited from strong collaborations with theorists. The
results presented in this thesis would not be possible without prof. Spiridoula
Matsika from Temple University and Michael Spanner from the National Re-
search Council of Canada.
I very much appreciated the friendly atmosphere at the Department of
Physics and Astronomy. It was great to be a part of the AMO group here,
and I thank prof. Schneble, prof. Bergeman and prof. Metcalf and their
students for making it such an enjoyable place to work at.
My thanks go to Sara Lutterbie and Pat Peiliker for their help with ad-
xi

ministrative matters. The lab and my exprimetns would have ran as smoothly
as they did without the excellent support of the machine and electronics shop,
and the advanced technology lab personnel. I am indebted to Walter Schemel-
ing, Jeff Slechta, Mark Jablonsky, Jeff Thomas, Paul DiMatteo, Gene Shafto,
Chuck Pancake, and Pete Davies for the designs and the advice. Thanks to
Andrzej Lipski for his help with sample stability tests.
Thanks to the committee members, prof. Phil Allen, prof. Xu Du and
prof. Adreas Becker for their detailed and helpful comments and corrections
to this thesis.
Grad school years wouldn’t be as enjoyable if not for the all great people I
met here. Thanks to Francis Paraan, Cameron Crowe, Manas Kulkarni, Divya
Bhatnagar, Sriram Ganeshan, Chee Sheng Fong, Heli Vora, Pedro Liendo,
Constantinos Constantinou, Nathan Borggren, and many others.
Many thanks to my friends from Serbia, Ana Bankovic, Jelena Grujic,
Visnja Jankov, Natasa Lazic, Ivan Jokic, Luka Nenadovic, Branimir Ackovic,
Branislav Cvetkovic, Jovan Vasiljevic, Milovan Suvakov, Rajna Dimitrijevic,
Ksenija Perisic and Milena Mitic, and to my cousin Dusan Pantelic for all the
fun times on Skype, during my visits to Belgrade and where ever else we met.
Finally, thanks to my parents and to my brother Nikola, for their continuing
support.
xii

List of Publications
This thesis is based on the following publications:
1. Marija Kotur, Congyi Zhou, Spiridoula Matsika, Serguei Patchkovskii,
Michael Spanner, and Thomas C. Weinacht, “Role of electronic state
correlation in strong field molecular ionization”, (submitted).
2. Marija Kotur, Thomas Weinacht, Brett Pearson and Spiridoula Matsika,
“Closed-Loop Learning Control of Isomerization using Shaped Ultrafast
Laser Pulses in the Deep Ultraviolet,” Journal of Physical Chemistry
130, 134311 (2009).
3. Marija Kotur, Thomas Weinacht, Congyi Zhou and Spiridoula Matsika,
“Following Ultrafast Radiationless Relaxation Dynamics with Strong
Field Dissociative Ionization: A Comparison between Adenine, Uracil
and Cytosine,” Journal of Special Topics in Quantum Electronics 99, 1
(2011).
4. Marija Kotur, Thomas Weinacht, Congyi Zhou and Spiridoula Matsika,
“Distinguishing Between Relaxation Pathways by Combining Dissocia-
tive Ionization Pump Probe Spectroscopy and ab initio Calculations: A
Case Study of Cytosine”, Journal of Physical Chemistry 134, 184309
(2011).
5. Marija Kotur, Thomas Weinacht, Congyi Zhou and Spiridoula Matsika,
“Strong Field Molecular Ionization from Multiple Orbitals”, Physical
Review X, 1, 021010 (2011).
xiii

Additional work completed during the author’s PhD career:
1. Pascal Krause, Marija Kotur, and Thomas C. Weinacht, and Spiridoula
Matsika, “Photo-induced fragmentation and excited state topology”, (in
preparation).
2. Michael Spanner, Serguei Patchkovskii, Congyi Zhou, Spiridoula Mat-
sika, Marija Kotur, and Thomas C. Weinacht., “Role of electronic state
correlation in strong field molecular ionization”, (in preparation).
3. Congyi Zhou, Spiridoula Matsika, Marija Kotur and Thomas Weinacht,
“Fragmentation Pathways for Uracil Radical Cations”, (submitted).
4. Spiridoula Matsika, Congyi Zhou, Marija Kotur and Thomas Weinacht,
“Combining dissociative ionization pump–probe spectroscopy and ab ini-
tio calculations to interpret dynamics and control through conical inter-
sections”, Faraday Discussions 153 (1), 247 - 260 (2011).
5. Chien-hung Tseng, Peter Sandor, Marija Kotur, Thomas C. Weinacht,
and Spiridoula Matsika, Two Dimensional Fourier-Transform Spectroscopy
of Adenine and Uracil Using Shaped Ultrafast Laser Pulses in the Deep
UV, The Journal of Physical Chemistry A, 116, 2654 (2012).
xiv

Chapter 1
Introduction
The invention of the laser in 1960 [1], followed several years later by the first
pulsed laser, opened up numerous new avenues for research in physics and
chemistry. Solid-state gain mediums, the most widely used of which is tita-
nium sapphire (Ti:sapphire), enabled the production of pulses with a duration
in the femtosecond range [2]. Chirped pulse amplification (CPA) [3] was a
major advance that allowed the increase of maximum intensity of produced
pulses. Pulses shorter than about 100 fs, that are routinely produced in the
infrared range of wavelengths using CPA, reach a peak intensity that is com-
parable to the atomic unit of electric field (5.14·1011V/m), sufficient to ionize
electrons from atoms and molecules [4]. In addition to the peak intensities
they provide, ultrafast lasers enable time-resolved measurements to be per-
formed on molecular systems, where a pump laser initiates dynamics that can
subsequently be probed by another ultrafast laser pulse. This combination
of field strength and time-resolution makes ultrafast lasers an essential and
unique tool for studying the dynamics and structure of atoms and molecules,
since they can both initiate and probe nuclear and electronic dynamics.
Laser pulses with a duration of several tens of femtoseconds are suitable for
time-resolved measurements of nuclear dynamics of molecules that occur on
timescales of several hundred femtoseconds or slower. The motion of electrons
is faster, occurring at 100 attosecond timescales. The short (attosecond) pulses
needed to access these faster timescales, are at present produced only through
the process of high harmonic generation (HHG). This process was used to
study attosecond electron and nuclear dynamics [5–8]. In HHG, an electron
1

−15 −10 −5 0 5 10 15−1
−0.5
0
0.5
1
r [a.u.]
Ene
rgy
[a.u
.]
Binding potentialBound state energyTunneling caseOver−the−barrier case
Figure 1.1: Binding potential of an atom (blue solid line), valence electronenergy based on a 10 eV ionization potential (red, dashed line), laser-dressedbinding potential in the tunnel ionization case (green solid line), laser-dressedbinding potential in the over-the-barrier case (black solid line).
ionized into the continuum from an atom or a molecule by a strong laser field
recollides with the ion, releasing an energetic photon as the electron deexcites
into one of the bound states. In the case of molecules, HHG is sensitive to the
details of the molecular structure and the interactions between its electrons
[8–11].
The interaction between an atom or a molecule and a weak electromagnetic
field can be described perturbatively, where the unperturbed Hamiltonian is
the atomic or molecular Hamiltonian, while the field is treated as a small
perturbation. However, when the electromagnetic field is very strong, it is not
possible to treat it as a small perturbation.
The two regimes in which laser-driven strong-field ionization (SFI) can
occur that are relevant for the work presented in this thesis, are the quasi-static
tunneling regime and the multiphoton regime. Figure 1.1 illustrates these
regimes for the Coulombic binding potential of an atom. The binding potential
of a molecule is more complicated, with structure reflecting the multiple nuclei
present.
If the frequency of the laser field is sufficiently small, ionization of atoms
2

and molecules can be viewed as tunneling through a barrier arising from the
shape of the laser-dressed binding potential. In the multiphoton regime, the
ionization occurs through the absorption of multiple photons needed for the
bound electron to gain enough energy to reach one of the continuum states.
The two ionization regimes are commonly characterized by the Keldysh adia-
baticity parameter [12]:
γ =
√IP
2UP, UP =
|E0|2
4ω2laser
(1.1)
Here IP is the ionization potential, UP is the ponderomotive energy, or
the average energy of electron oscillations in the laser field, ωlaser is the laser
frequency, and |E0| the electric field amplitude. Quasi-static tunneling corre-
sponds to γ1, while multiphoton ionization corresponds to γ1. It is useful
to define the concept of tunneling time, which is the time it would take the
electron to cross the barrier moving in a uniform electric field, if the process
were classically allowed. For this process (setting electron mass, me=1, and
electron charge, e=1), the velocity of the electron as a function of time is given
by v(t) = vmax − |E0|t. Here vmax =√
2IP , and for tunneling resulting in an
electron produced in the continuum with zero energy, vfinal = 0. This yields
a tunneling time of τtunnel = vmax/|E0| =√
2IP/|E0|. Expressing the Keldysh
parameter in terms of the laser frequency ωlaser, and the tunneling frequency,
defined as ωtunnel = 1/τtunnel leads to the expression:
γ =ωlaserωtunnel
. (1.2)
The quasi-static tunneling regime is characterized by ωlaser/ωtunnel1. So
the shape of the barrier does not change significantly during the tunneling
process [13], giving rise to the name used for this regime. It is an interplay of
laser frequency, ionization potential and and field strength that leads to quasi-
static tunneling being the dominant effect in an ionization process. The field
strength has to be high enough to tilt the potential sufficiently to give rise to a
finite barrier, while the frequency has to be low enough that the condition from
equation 1.2 is satisfied for tunneling to take place on a sub-cycle timescale.
It should be noted that a tunneling component is present in the multiphoton
regime as well. This tunneling differs from the quasi-static one, in that the
3

barrier shape changes during the tunneling process.
The multiphoton nature of ionization by intense, high-frequency laser fields
is particularly clear in the photoelectron spectra taken at intensities high
enough that more photons than required for ionization are absorbed. The
photoelectron spectra show a periodic structure, where the spacing between
features corresponds to the photon energy. This is known as the above thresh-
old ionization [14] (not shown in figure 1.1).
At very high intensities, the electric field of the laser can tilt the Coulomb
potential and suppress the barrier to ionization, making the electron escape
classically allowed. The observed intensities of appearance of several charge
species of noble gases agree well with the prediction of the simple, semi-classical
model [15].
In experiments that are presented in this thesis, γ ranged from 1-3 for ion-
ization of ground state molecules and from 0.5-2 for ionization of excited state
molecules. In the case where γ ≈ 1, the ionization was a mixture of tunnel-
and multiphoton ionization, commonly referred to as strong-field ionization. In
ionization by multicycle ultrafast laser fields the target interacts with several
half-cycles, many of which have an intensity significantly lower than the peak
intensity of the pulse. Furthermore, given the non-uniform, usually Gaussian
spatial profile of a laser beam, the central and the outer portions of any beam
correspond to very different intensities. This effect is known as the focal vol-
ume spatial intensity averaging, and often presents a challenge in comparing
experimental results to theoretical predictions. The multi-cycle character of
our laser pulses, and the focal volume spatial intensity averaging lead to both
the multiphoton and the tunneling contributing to the ion yield measured in
a strong-field ionization experiment.
Theoretical efforts in understanding the tunneling process started with
the invention of quantum mechanics. A common feature of these theories is
that the ionization rates depend strongly (exponentially) on the binding po-
tential. Tunneling theory was first derived by Fowler and Nordheim [16] in
1928, for the case of electron emission from metals. Oppenheimer [17, 18]
applied it to ionization of hydrogen-like atoms in strong external fields. It
was later rederived by Keldysh [12] and by Perelomov, Popov and Terentev
(PPT, 1967) [19], for DC tunneling from hydrogen-like atoms in a field of a
4
strong oscillating electromagnetic field. A treatment of non-hydrogen, poly-
electron atoms was presented by Ammosov, Delone and Krainov in 1986 [20],
and became known as the ADK tunneling theory. A further level of sophis-
tication was added by Faisal and Reiss [12, 21–24], in what is known as the
Keldysh-Faisal-Reiss (KFR) theory. It includes several atomic centers and
shows how interferences between them can lead to a suppression of ioniza-
tion rates from some molecules (compared to atoms with a similar ionization
potential), depending on the shape of their valence orbital. Another simple,
structure-based model that addressed tunneling in multi-center potential, was
the ’bucket’ model offered by Levis [25]. This model was successfully used to
explain the increase in ionization rate with the size of a molecule between sev-
eral polyatomic molecules with similar ionization potentials. The KFR picture
was further improved on by the molecular ADK theory [26], which includes
the structure of the molecular wavefunction in the tunneling region.
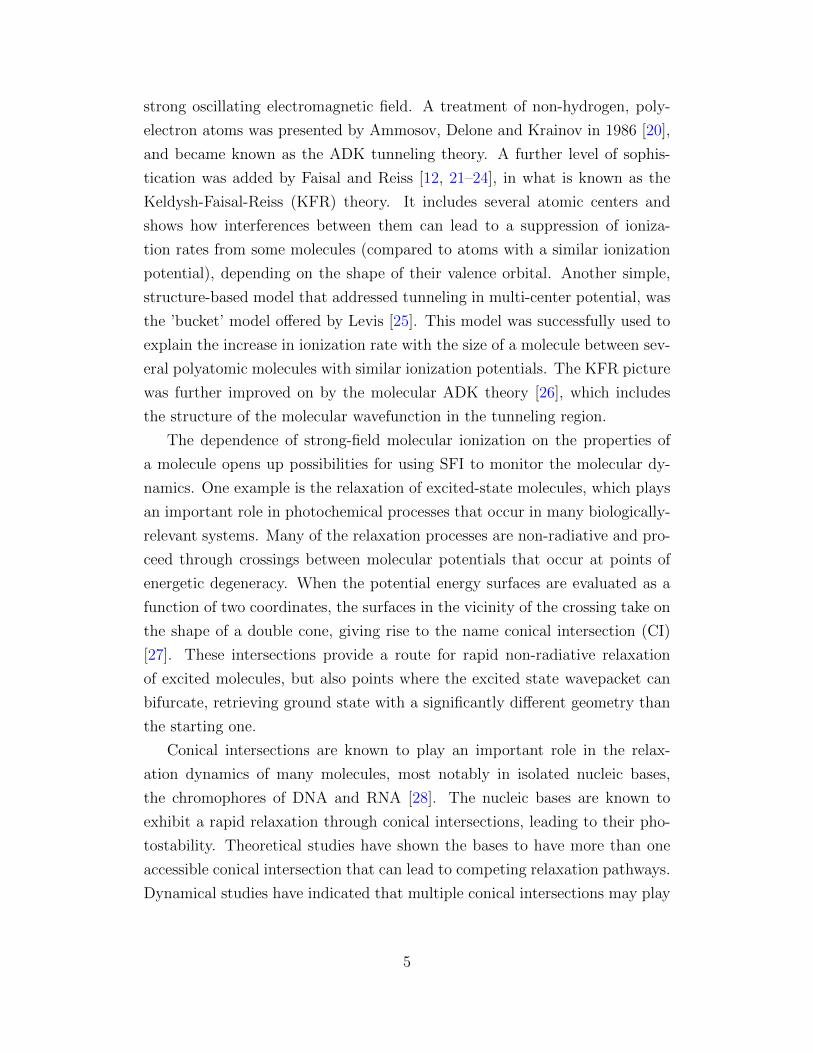
The dependence of strong-field molecular ionization on the properties of
a molecule opens up possibilities for using SFI to monitor the molecular dy-
namics. One example is the relaxation of excited-state molecules, which plays
an important role in photochemical processes that occur in many biologically-
relevant systems. Many of the relaxation processes are non-radiative and pro-
ceed through crossings between molecular potentials that occur at points of
energetic degeneracy. When the potential energy surfaces are evaluated as a
function of two coordinates, the surfaces in the vicinity of the crossing take on
the shape of a double cone, giving rise to the name conical intersection (CI)
[27]. These intersections provide a route for rapid non-radiative relaxation
of excited molecules, but also points where the excited state wavepacket can
bifurcate, retrieving ground state with a significantly different geometry than
the starting one.
Conical intersections are known to play an important role in the relax-
ation dynamics of many molecules, most notably in isolated nucleic bases,
the chromophores of DNA and RNA [28]. The nucleic bases are known to
exhibit a rapid relaxation through conical intersections, leading to their pho-
tostability. Theoretical studies have shown the bases to have more than one
accessible conical intersection that can lead to competing relaxation pathways.
Dynamical studies have indicated that multiple conical intersections may play
5

a role in relaxation, leading to a delocalization of the excited state wavepacket
[29]. However, theory alone cannot determine whether one or more of these
pathways are explored, or predict the relative importance of the pathways.
Ionization potential influences the strong-field molecular ionization to a
great extent, but as is evident from comparisons between the ionization rates of
atoms and molecules with similar ionization potentials, factors such as orbital
structure play a role as well. Molecular ionization can involve removal of an
electron from orbitals below the highest lying one [30], but it is not always
clear which orbital was ionized, or if there are differences between ionization
from a high lying and a low lying orbital.
The distribution of final states in which the molecule is left following strong-
field ionization is currently an open problem in the field. Since excited states
of the ion often have a hole in an orbital below the highest occupied one, the
removal of lower-lying electrons may be a dominant pathway to reaching an
excited ionic state. In addition, the role of multi-electron effects in determining
the final state of an ionization process is currently not fully understood.
In this thesis, we use strong-field ionization to follow the excited state
dynamics, but we explore some of the properties of the ionization process
itself as well. The thesis is composed of seven chapters.
Chapter 2 introduces the experimental apparatus that was used. It starts
with a brief overview of the laser system. It then continues to describe the
pulse shaper and the beamlines used in the UV-pump, IR-probe experiments.
Finally, it gives the details of the vacuum chamber, including the time-of-
flight mass spectrometer and the oven with a heated nozzle used to sublimate
powdered samples.
In chapter 3, we study the photochemical ring opening reaction of cy-
clohexadiene to form 1,4,5-hexatriene. The ring opening occurs during the
relaxation of excited state cyclohexadiene, and involves a conical intersection
between the ground and an excited state. The two isomers, despite having
comparable ionization potentials of 8.25 and 8.32 eV, exhibit very different
strong-field ionization rates and dissociation propensities. We use this fact to
try and control the outcome of the relaxation through the CI. In our control
scheme, excitation by an ultrafast UV pulse initiates the photochemical reac-
tion, and a strong-field IR pulse ionizes the molecule after a variable delay. A
6

learning algorithm is used to find a pulse shape that optimally achieves a goal
formulated in terms of fragment ion yields. This chapter is based on ref. [31].
In chapter 4 we present the results of nucleic base excited state dynamics
studies, which were originally published in references [32] and [33]. Employing
a weak, near-resonant pump and a delayed, strong-field probe we were able
to follow the excited state relaxation of the isolated nucleic bases adenine,
cytosine, and uracil. The details of the relaxation pathways differ between the
three bases. A common feature of the relaxation dynamics of these molecules
is that it is non-local. The excited state wavepacket breaks up into many parts,
and explores multiple relaxation pathways in parallel. We discuss several of
the factors that contribute to the differences in dissociation patterns along
separate relaxation pathways with an emphasis on the shapes of the molecular
orbitals, and the electronic configurations. We present the case of cytosine in
detail.
Chapter 5 is based on ref. [34]. In contrast to the previous two chapters, in
this chapter we study some of the intrinsic properties of strong-field ionization,
rather than using it only as a part of the detection scheme. Here, we first
identify ionic fragments that are formed following the removal of an electron
from a specific orbital of the molecule. Then, we examine how the angle-
resolved distribution of ionization yields depends on the orbital from which an
electron was removed. We find that the angular distribution for the electron
removed from the lowest unoccupied molecular orbital follows the symmetry
of this orbital, while ionization of the molecule by removing electrons from
deeper bound orbitals is more complicated.
In chapter 6 we examine three theoretical methods of calculating final-state
resolved strong-field ionization yields and compare them with our experimen-
tal results. The first method is based upon Dyson orbital amplitudes, which
in the case of strong-field ionization need to be scaled by a tunneling exponent
that is exponentially sensitive to the ionization potential of a given ioniza-
tion channel. This method is closely related to the predictions of some of
the formulations of the strong-field approximation. The second method is the
molecular Ammosov-Delone-Krainov method, which uses asymptotic proper-
ties of wavefunctions to estimate ionization yields. Finally, the third method
is the time-dependent resolution in ionic states method (TD-RIS), that was
7

developed by our collaborators at the National Research Council of Canada.
It solves the time-dependent Schrodinger equation numerically, taking into ac-
count the ion-electron interaction in some more detail. Comparison to our
experimental results shows a better agreement with the latter method, high-
lighting the importance of electron-ion interactions. The results of this chapter
are based on reference [35].
The notation for molecular states used in this thesis is S0, S1,. . . for the
neutral singlet states and D0, D1,. . . for the doublet states of the ion. Here S0
and D0 are the ground states of the neutral and the ion, S1 and D1 are their
first excited states, and so on.
8
Chapter 2
Experimental apparatus
In this chapter, we describe the apparatus used in experiments detailed in sub-
sequent chapters. All the experiments presented here were performed using
the same laser system, beamlines, time-of-flight mass spectrometer and ac-
quisition hardware. However, different vacuum manifolds were used for liquid
and solid phase samples. Experiments on liquid phase samples were conducted
using a sample manifold based on designs from [36]. The experiments on solid
(powdered) samples were done using a heated sample manifold and a heated
nozzle described in subsection 2.6. The experiments described in the following
chapters utilized a pump-probe scheme to study molecular dynamics. Ul-
traviolet (UV) laser pulses at the central wavelength of about 262 nm were
used to pump the molecules. The dynamics was probed by illuminating the
molecule with intense, infrared (IR) laser pulses that ionized and fragmented
the molecules.
2.1 Laser system
We start from a KM Labs Kerr-lens modelocked Ti:sapphire femtosecond os-
cillator, pumped by a continuous wave, 4.3 W Coherent Verdi V5 laser. The
pulses produced are used to seed a KM Labs HAP multipass amplifier [37],
which utilizes Ti:sapphire as a gain medium, and is pumped by an 11 W
Quantronix Nd:YAG nanosecond laser. The amplifier outputs 30 fs pulses
at a central wavelength of 780 nm, with an energy of 1 mJ per pulse and a
repetition rate of 1 kHz. The pulses are characterized by a second harmonic
9

Figure 2.1: A schematic of our experimental setup (figure adapted from [39])
generation (SHG) Frequency Resolved Optical Gating (FROG) [38].
2.2 Beamlines
A schematic of the experimental apparatus is shown in figure 2.1. The ampli-
fier output was split into two parts, each propagating along one of the arms
of a Mach-Zender interferometer. About 80% was directed into a series of
non-linear crystals used to generate the UV pump pulse. The crystals consist
of a 250 µm beta barium borate (BBO) cut for second harmonic generation
from 780 nm light, a calcite used for group velocity dispersion (GVD) com-
pensation, and a 100 µm BBO cut for sum frequency generation (SFG) from
the fundamental (780 nm) and the second harmonic (390 nm) light. In or-
der to optimize the conversion efficiency and mode quality, the tripling setup
was placed in a diverging beam after a focus. The focal region was enclosed in
rough vacuum to avoid breakdown of the air. Given an input of about 800 mW
of the fundamental, the tripling setup can produce up to 25 mW of ultravi-
olet light at ∼ 260 nm. The UV pulses are directed into a 4-f configuration,
acousto-optic modulator based pulse shaper, capable of independently altering
its phase and amplitude [40, 41]. The pulse shaper is described in more detail
10

in section 2.5. After the pulse shaper, the UV pulses have an energy of about
2 µJ. When not shaped, the pulses are close to being transform-limited with
a sub-50 fs duration. The pulses have been characterized by a self-diffraction
FROG [38, 41, 42]. A typical pulse at the output of the pulse shaper is shown
in figure 2.5. A half wave plate was placed in the UV beam in order to control
its polarization in some of the experiments.
Approximately 20 % of the laser output is directed into the probe arm,
which contains a delay stage and a variable neutral density filter used to vary
the delay and energy of the IR probe pulses. The UV and IR pulses are
collinearly combined at the output of the Mach-Zehnder interferometer using
a dichroic mirror and focused by a 150 mm fused silica lens into an effusive
molecular beam. In order to correct for the chromaticity of the common fo-
cusing lens, an additional pair of lenses was placed in the IR beam to produce
a slightly converging beam before the shared lens.
2.3 Time-of-flight mass spectrometer
The core of the experimental setup is the interaction region, where the laser
beams are incident on molecules inside of a weak static electric field. The inter-
action region was placed inside a vacuum chamber, where the pressure was on
the order of 1·10−6 Torr. The molecules were admitted into the vacuum cham-
ber through a small nozzle as an effusive molecular beam. The weak static
electric field was produced by the plates of a time-of-flight mass spectrometer
(TOFMS) with a dual slope extraction configuration and a mass resolution
figure of merit ∆m/m greater than 200. Here m is the mass of an ion and
∆m is the full width at half maximum value of the peak in the mass spectrum
associated with this fragment. A typical time-of-flight mass spectrum of uracil
is shown in figure 2.7. Molecular fragment ions, produced by laser photoion-
ization, are accelerated by the electric field, and pass through a pair of small
holes in the acceleration plates and are injected into a field-free region of the
mass spectrometer that provides a temporal separation of ions differing in their
mass to charge ratios. Since most of the ions observed were only singly ion-
ized species, we effectively had a mass-resolved signal. The ions were collected
by a microchannel plate (MCP) based detector in the Chevron configuration,
11

To ro
ughi
ng
pum
p
Sampleholder
Valve
Valve
MCP
Laser field
850 V
600 V
0 VNozzle
Figure 2.2: Schematic of the TOF setup and the sample manifold
0 20 40 60 80 100 120
0
0.2
0.4
0.6
0.8
1
Mass [amu]
Ion
Yie
ld [
arb.
]
Figure 2.3: A typical time-of-flight mass spectrum of uracil
which provided a gain of about 106. The signal was subsequently amplified
using a 350 MHz pre-amplifier (Stanford Research Systems SIM914), and the
12

time-dependent ion current was digitized by a 500 MHz, 8-bit computer based
oscilloscope (GAGE Compuscope 8500).
The digital oscilloscope was inside the computer that controlled the pulse
shaper. This allowed for the implementation of closed-loop learning control,
where the feedback signal is based on the molecular ionization yield. Details
regarding the learning algorithm we used are given in [43].
2.4 Comparison of ionization-based methods
Experiments presented in this thesis utilize strong-field dissociative ionization
of molecules as a part of the detection scheme. In this type of experiments, a
ground or excited state molecule is ionized by an intense infrared laser pulse.
If the energy of the cation that is produced by ionization exceeds a certain
threshold, the cation can dissociate into several fragments. In the case of
single ionization, only one of the fragments will carry a charge and therefore
be detected. The departing electron was not detected in experiments described
here.
An important complement to the time-resolved strong-field dissociative
ionization is the weak-field photoelectron spectroscopy. The time resolved
variation of this method is known as time-resolved photoelectron spectroscopy
(TRPES) [44]. In this method, the molecules are ionized by a single-photon
probe pulse, typically in the UV region of the spectrum, and an energy spec-
trum of the departing electrons is detected. A major disadvantage of this
TRPES is that the limited photon energy available from conventional UV
laser sources limits the access of this method to lower-lying ionic states.
In addition, high harmonic generation, whereby an energetic photon is
emitted following strong-field ionization of an electron and its recombination
with the ion, has been used to probe molecular structure and dynamics [8].
This method is technically demanding, but it can provide a 100 as time res-
olution when the recollision process itself is used to probe the dynamics [7],
compared to the ∼ 10 fs resolution that can be achieved by TRPES or strong-
field dissociative ionization.
The angle-resolved ion signal of the weak-field and HHG methods can read-
ily be related to the Dyson orbital of the ionization channel [45]. The interpre-
13

tation of angle strong-field ionization yields is more involved. It is the subject
of chapter 5. It is possible to use strong-field ionization to study the ioniza-
tion of excited state molecules using alignment through selective excitation.
The exponential sensitivity of strong-field ionization to the ionization potential
suppresses ionization of ground state molecules that are present in the sample
when using selective excitation. In contrast, TRPES and HHG require the
molecules to be non-adiabatically aligned, which is not easy asymmetric top
molecules, such as uracil, that was studied in this thesis.
2.5 Pulse shaper
PRF
CM1
CM2
FM1
FM2
GT1
GT2
Figure 2.4: Diagram of the pulse shaper. Here GT1 and GT2 are diffractiongratings, CM1 and CM2 are curved mirrors, and FM1 and FM2 are fold mirrors(figure taken from [46]).
The pulse shaper used in the experiments is shown in figure 2.4. The
shaping is done in the Fourier plane, in a scheme first proposed by Weiner [40].
The pulse shaper employs a 4-f configuration, where the beam is first spatially
14

separated into different frequency components using a diffraction grating. The
beam is then collimated by a curved mirror, placed at a focal length, f, distance
from the grating, and subsequently focused another focal length f away from
the curved mirror. The shaping element, in the Fourier plane, is a fused
silica acousto-optic modulator (AOM). Acoustic waves propagating through
the fused silica element are produced by a piezoelectric attached to it and
driven by a 150 MHz radiofrequency (RF) wave of 2 W peak power. The
AOM acts as a transmission grating, with the acoustic wave producing regions
of varying density that are analogous to the grooves of a conventional grating.
Given the length of the fused silica element of 20 mm and compression
wave acoustic velocity of 5960 m/s, it takes 3.360 µs for the acoustic wave to
cross the AOM. Since the sample rate of the RF waveform generator is 1 GHz,
the waveform we write is 3360 pixels long. The bandwidth of the AOM is
50 MHz, corresponding to a rise time of 20 ns, and limiting the total number
of independently controllable points to about 170 across the AOM. The basic
RF waveform written on the AOM has the following form:
f(pixel) = 4095 · 1
2· (A(pixel) · sin(2πω0 · pixel + ϕ(pixel)) + 1) (2.1)
where A is the amplitude (ranging between 0 and 1), ω0 frequency (in GHz)
and ϕ phase of the sine wave. The domain of f(pixel) is [1, 3360] with the
variable pixel given in ns, while its range is [0, 4095], corresponding to a 12-
bit, 1 GHz D/A board (GaGe 11G CompuGen). Functions A and ϕ, defined
in the [1, 3360] domain, allow for independent shaping of the amplitude and
the phase of the laser electric field.
A typical pulse at the output of the pulse shaper is shown in figure 2.5.
2.6 Heated nozzle setup
In order to use powdered DNA and RNA samples, which require temperatures
of about 140-180oC to achieve a high enough vapor pressure through sublima-
tion, a new sample manifold with a heated injection nozzle was designed and
built. The vacuum chamber, with the oven attached is shown in figure 2.6.
The manifold consists of stainless steel conflat vacuum fittings. Heavy insu-
15

257 258 259 260 2610
0.5
1
Inte
nsity
[nor
m.]
257 258 259 260 2610
0.5
1
Pha
se [r
ad.]
Wavelength [nm]
−40 −20 0 20 40 600
0.5
1
Inte
nsity
[nor
m.]
−40 −20 0 20 40 60−0.5
0
0.5
1
1.5
Pha
se [r
ad.]
Time [fs]
Figure 2.5: A typical pulse at the output of the pulse shaper. Top panel: Pulseintensity and phase in the spectral domain, Bottom panel: Pulse intensity andphase in the temporal domain.
lated laboratory heating tapes were used to keep the walls of the sample holder
and the sample manifold at a high temperature. Several K-type thermocouple
junctions were used to monitor the the temperatures of different parts of the
manifold.
In order to insert the sample into the interaction region, which was kept at
ultra-high vacuum pressures through a continuously open nozzle, it was nec-
essary for the nozzle diameter to be relatively small (0.5 mm). The nozzle was
mounted on a 0.25” stainless steel tube that was protruding into the ultra-high
vacuum chamber and pointing towards the interaction region. The nozzle was
heated using high-resistance Nickel-Chromium wire (80% Ni, 20% Cr), with a
diameter of 0.81 mm and resistivity of 0.63 Ω/ft. Ceramic beads were strung
around the wire, providing electrical insulation without compromising its flex-
ibility. An additional K-type thermocouple junction was placed in vacuum
close to the nozzle, in order to monitor its temperature. The heating required
about 50 W of power for parts of the oven that were in air, (wrapped in 50 Ω
heating tapes, with 50 V supplied to each tape by an autotransformer), and
about 16 W for the nozzle that was in vacuum (8 V and 4 Ω). The vapor pres-
16

Figure 2.6: The vacuum chamber, with the powdered sample manifold at-tached
17

0.5mm
Thermocouplejunction
Nozzle
Holder
a)
b)
Set screw
Figure 2.7: Heated nozzle setup. Panel a) Top view of the tube, the heatingwire with ceramic beads, and the thermocouple junction holder; b) front viewof the same (2× maginified compared to panel a))
sures in the oven were on the order of several mTorr [47–50]. The operating
temperatures were 150C, 180C, and 145C, for adenine, cytosine and uracil,
respectively. In the case of cytosine, which also has the lowest vapor pressure
of the three bases studied, there were significant issues with sample damage
that forced us to limit the temperatures to up to 180C, at the expense of low
vapor pressure and poor signal to noise.
18

Chapter 3
Closed-loop learning control of
isomerization using shaped laser
pulses
3.1 Introduction
In this chapter, we present the results of closed-loop learning control of a pho-
tochemical isomerization reaction. The reaction is initiated by an absorption
of a pump pulse in the deep ultraviolet, and takes place during the ultrafast re-
laxation of the molecule. Learning control is effected by shaping the excitation
laser field, and optimal pulse shapes are found by applying a learning-control
scheme based on the genetic algorithm [51, 52].
The isomerization reaction studied in this chapter is the photochemical
ring opening of 1,3-cyclohexadiene (CHD). The opening of this ring molecule
leads to the production of cZc-hexatriene (HT). The reaction is energetically
precluded from taking place on the the ground state of the molecule, by a
high barrier (∼ 2.7 eV) [53]. A similar barrier (∼ 1.5 eV) exists on the ionic
ground state [53]. Instead, the ring opening proceeds on an excited state of
the molecule.
Isomerization is a single-molecule reaction that involves a spatial rearrange-
ment of the atoms that the molecule consists of. It can be accompanied by
breaking of bonds, or by a more complex change in the way the constituent
atoms are bound. Isomerization plays a role in processes such as vision and
19

Figure 3.1: Cartoon of the experimental approach: The experiment startswith a shaped UV pulse interacting with the molecule initially in the CHDconformation (a). Following UV excitation it evolves towards a conical inter-section (b) after which it can become CHD again (c) or undergo ring openingto become HT (e). Subsequent IR ionization leads to pronounced differencesin the TOFMS for the two isomers (d) and (f). The geometries shown werederived by ab initio calculations, and the two TOFMS were measured on rawsamples and presented here on the same vertical scale. Carbon atoms C5 andC6 are labeled in appropriate panels.
20
combustion [54, 55]. Controlling isomerization in molecular switches has drawn
some attention in recent years [56–60]. Learning control of isomerization us-
ing ultrafast laser pulses has recently been demonstrated in the liquid phase
[61–64]. Interpretation of results from liquid-phase experiments is complicated
by solvent interactions and non-linear optical effects [65]. Experiments carried
out in the gas phase are free of these problems and serve as an important com-
plement to liquid phase experiments in trying to understand the underlying
control mechanisms.
Experiments presented in this chapter were carried out in the gas phase,
using a strong-field probe to ionize the molecules and detecting a mass-resolved
signal of the produced ions. We make use of the differences in the ionization
signal for the two molecules studied here, 1,3-cyclohexadiene (CHD) and its
isomer 1,3,5-hexatriene (HT) following strong field ionization with infrared
laser pulses [66]. These differences enable the distinguishing of the two isomers,
and provide a feedback signal for the learning-control experiments.
In the accepted picture of UV-pulse initiated isomerization of CHD, a
wavepacket is launched from the ground 1A state to the first excited 1B state
[66–72]. The wave packet relaxes on the excited state, moving in the direc-
tion of an avoided crossing AC12 between the 1B and the two-electron excited
state 2A, and crosses over to the 2A surface. Its evolution on this surface
drives it towards a conical intersection CI01, between the 2A and the ground
1A state. A sketch of the potentials, based on ref. [53] is shown in figure 3.2.
Solution-phase measurements show that in passing through the CI01, the wave
packet bifurcates. About 40% of it relaxes to the minimum in the ground state
corresponding to HT and the remaining 60% to the minimum corresponding
to CHD [73]. The timescale for the relaxation process is about 200 fs [66].
Figure 3.1 provides a cartoon of our experimental approach. The CHD
molecule is excited by a near-resonant UV pulse, which may or may not be
shaped (a), whereby a wavepacket is created on the excited 1B state. The
geometry of the conical intersection CI01, is shown in (b). Carbon atoms C5
and C6, which form the bond that is broken to form HT, are labeled. The
separation between these two atoms increases from about 1.6A in CHD, to
∼ 2.25A at the CI01 geometry. Bifurcation of the wave packet after the CI01
conical intersection leads to either the retrieval of ground state CHD (c) or the
21

C6H7+ + H
pump
CI01
CHDHT
C6H8+
1A
1B
2A
AC12
Figure 3.2: A sketch of the potential energy surfaces of CHD and HT relevantto the ring opening reaction. The realxation pathway is outlined in red dashedlines (figure based on potentials given in [53]).
22

production of cZc-HT, the HT conformer likely to be reached first in the ring-
opening reaction, with a C5-C6 separation of about 3.5A, shown in (e). Panels
(d) and (f) show the time-of-flight-mass spectra of ground state CHD and HT
upon illumination with intense ultrafast IR radiation. The strong IR pulse
produces very different fragment yields for the two molecules. Specifically, the
mass spectrum of HT shows a pronounced decrease in the parent ion yield,
and an increase in fragment ion yields. We make use of this difference to
distinguish whether the molecule ends up as CHD or HT after going through
the CI01 conical intersection by illuminating the sample with an intense IR
probe pulse approximately 1.8 ps after the UV pump.
While different conformers of hexatriene are accessible from the CI01 conical
intersection, no significant differences between their fragmentation patterns or
ionization yields have been found [66], allowing us to observe and quantify
the ring-opening of 1,3-cyclohexadiene without considering further changes in
conformation that the newly created hexatriene might undergo.
Below, we briefly introduce the control scheme used and the ab initio elec-
tronic structure methods used to optimize the geometries and calculate the
energies of the two isomers. After this, the results of both calculations and
experiments are presented. The experimental results are interpreted using
findings of ab initio calculations.
3.2 Closed-loop learning control
The goal of laser control of quantum systems is to drive the system to a de-
sired final state. In order to achieve this, the laser field is shaped using pulse
shaping techniques similar to those described in chapter 2. Since solving the
Schrodinger equation for most multi-particle systems is not possible analyti-
cally and very time-consuming numerically, the full dynamics of most systems
is not known and it is in general not possible to a priori tailor the field to
achieve a specific final state. One commonly used approach is that of learning
control, one example of which is the genetic algorithm [52], so named for its
similarity with biological evolution. In this scheme, a number of pulse shapes
(i.e. field shapes) are tested for their performance in achieving a specific goal
on a given system. In the case of molecular systems and ion-based detection,
23

the goal is usually quantified in terms of yields of ionic fragments. This allows
for ranking of pulses, where a numerical value is assigned to each of them. In
the next iteration, the poor performers are eliminated from the population,
while the high performers are kept, and allowed to mate and mutate. Details
of the genetic algorithm used in experiments presented in this chapter can be
found in references [74].
Ideally, pulse shapes discovered in a closed-loop learning experiment can be
connected to physical process underlying the control. In order to achive this,
it is helpful to bias the learning algorithm towards finding simpler pulse shapes
[75]. While learning algorithms, provide a time- and resource-efficient way of
finding the optimal pulses for controlling molecular dynamics, the discovered
pulses do not in general lend themselves to a simple explanation of the control
mechanism. In the case of molecules, a detailed knowlegde of the potential
energy surfaces is often necessary, coupled with considerable interpretation
efforts.
3.3 Ab initio electronic structure calculations
Calculations presented in this section have been done in collaboration with
and under the guidance of Prof. Spiridoula Matsika of Temple University. We
used ab initio quantum chemistry methods to calculate the properties of CHD
and HT molecules, which will be detailed below, after a brief introduction to
the computational methods.
Ab initio methods solve the molecular time-independent Schrodiger equa-
tion, HΨ(~R,~r) = EΨ(~R,~r) by approximating the molecular wavefunction
with linear combination of atomic orbitals (LCAO). Each atomic orbital is
approximated by a sum of Gaussians. The use of Gaussians is motivated by
the fact that, as a consequence of the Gaussian product theorem, it allows
for a quicker calculation of overlap integrals, leading to a significant reduction
in the computational resources needed [76]. Each of the individual Gaussians
is known as a Gaussian primitive. The general form of a Cartesian Gaussian
primitive, centered on a given atom is:
24

g(x, y, z) = N ·(x−x0)l ·(y−y0)m ·(z−z0)n ·e−ζ(r−r0)2 , |r|2 = x2+y2+z2, (3.1)
where N is the normalization factor, x, y, and z are the Cartesian coor-
dinates, (x0, y0, z0) are the coordinates of the atom, ζ is the exponent used
to set the spatial extent of the primitive, and l, m and n are positive integer
exponents of the Cartesian coordinates. The sum L=l+m+n can be thought
of as an analogue of the angular momentum. Primitives with the sum L=0
are called s-type, those with L=1 p-type, etc.
A basis function used in molecular calculations to describe an atomic or-
bital is typically a contraction, or weighted sum of several Gaussian primitives.
Split-valence atomic basis sets, such as the one used in calculations presented
here, are generally denoted as X-YZg, where X is the number of primitives
used to describe each core orbital electron, while the valence electrons are de-
scribed by two basis functions (with different values of ζ), one consisting of Y
and the other of Z primitives. The coefficients of a basis set are optimized for
each atom independently, and chosen so that they minimize the energy of a
given atom.
The general form of the molecular wavefunction in the LCAO ansatz is
Ψmolecular =∑ciΨatomic. Coefficients ci are determined so as to minimize the
total energy of the molecule using iterative variational methods. In this work
we use the split-valence basis set with an additional polarization function,
denoted 6-31G(d), which can model different bonding in different directions.
Solving the Schrodinger equation in terms of nuclear coordinates and molec-
ular wavefunctions typically begins with the Hartree-Fock (HF) method. In
this method, an electron is viewed as moving in the mean field of all the other
electrons, and the wavefunction always contains just one electronic configu-
ration. Restricted Hartree-Fock can be used when all molecular orbital are
doubly occupied, and electrons of opposite spins in the same orbitals have
identical energies. If there are unpaired electrons, unrestricted Hartree-Fock
(UHF) method is appropriate, and electrons of opposite spins are treated sepa-
rately. The HF method is variational, so the energy obtained from it is always
an overestimation of the actual energy of a system.
25

3.4 Results of calculations
1.5 2 2.5 3 3.50
1
2
3
4
5
6
C5−C
6 distance [Å]
Ene
rgy
[eV
]
Figure 3.3: Circles and lines: MCQDPT2(8,10) calculation of the lowest 5 en-ergy levels of CHD+/ HT+ for a relaxed potential energy scan along the C5-C6
bond length. Squares: energies of CHD+ and HT+ at the equilibrium geome-tries of the neutral CHD (left side) and HT (right side) respectively. Crosses:five lowest energy levels for the cation at the the geometries corresponding tothe avoided crossing and the conical intersection in the neutral.
The ground states of both cyclohexadiene and cZc-hexatriene were opti-
mized for the neutral and the singly ionized species. The optimizations were
first done using the Hartree-Fock approach and a 6-31G(d) basis, restricted
for the neutral molecules and unrestricted for the ions, and then improved on
using second order Møller-Plesset perturbation theory, while keeping the same
basis set.
Noting that the most significant difference between the equilibrium geome-
tries of CHD and cZc-HT was the stretching and eventual breaking of the C5-C6
bond (see figure 3.1), we carried out constrained optimizations of the geometry
of the neutral molecule along this bond. The optimizations were done at the
UHF/6-31G(d) level. The C5-C6 bond was scanned in steps of 0.2 A. In each
26

step, this bond length was kept constant, while the other coordinates were re-
laxed. Energies of the ground and the first four excited states were calculated
for these intermediate geometries at the multi-configurational self-consistent
field (MCSCF) and second-order multiconfigurational quasi-degenerate per-
turbation (MCQDPT2) levels with the same basis set (shown in figure 3.3).
The active space for these calculations consisted of 8 electrons in 10 orbitals
(denoted (8,10)). The active space included all π and selected σ orbitals which
participate in some excited states of the cation. The constrained minimizations
provide ionic energies along a reaction pathway between HT and CHD.
We also calculated the energies of several excited states of the cation at
selected geometries of the neutral photo-initiated reaction, corresponding to
the avoided crossing AC12 and the CI01 conical intersection that have been
reported before as important intermediates along the reaction path [70, 71]. A
small multireference configuration interaction (MRCI) expansion with a refer-
ence space of 6 electrons in 6 orbitals (6,6) and single excitation configurations
out of this active space was used to calculate the minimum energy point on
the seam the conical intersection 1A/2A. The COLUMBUS software package
was used for the CI optimizations [77, 78], while GAMESS [79] was used for
all other calculations.
3.5 Experimental results
Figure 3.4 shows the C2H+2 (a rough measure of the amount of HT in the
sample) and parent ion yields as a function of time delay between the pump
and the probe pulses. The pulse intensities were ≤10 TW/cm2 for the UV
pump pulse and ∼ 46 TW/cm2 for the IR probe pulse. The pump-probe
results demonstrate the dramatic changes in the fragmentation pattern of the
molecule following irradiation with an ultrafast UV pulse. The parent yield
decreases in going from negative to positive pump-probe delays, while the
C2H+2 yield increases in going from negative to positive pump-probe delays.
These are consistent with formation of HT, whose mass spectrum shows a
smaller parent yield and an increased smaller fragments’ yield. The TOFMS
for positive time delays shows a general trend of enhancing smaller molecular
fragments at the expense of the parent, as one would expect with the formation
27
of HT.
−1000 0 1000 20000
0.2
0.4
0.6
0.8
1
Pump−probe delay [fs]
Ion
sign
al [a
rb]
C2H
2+
C6H
8+
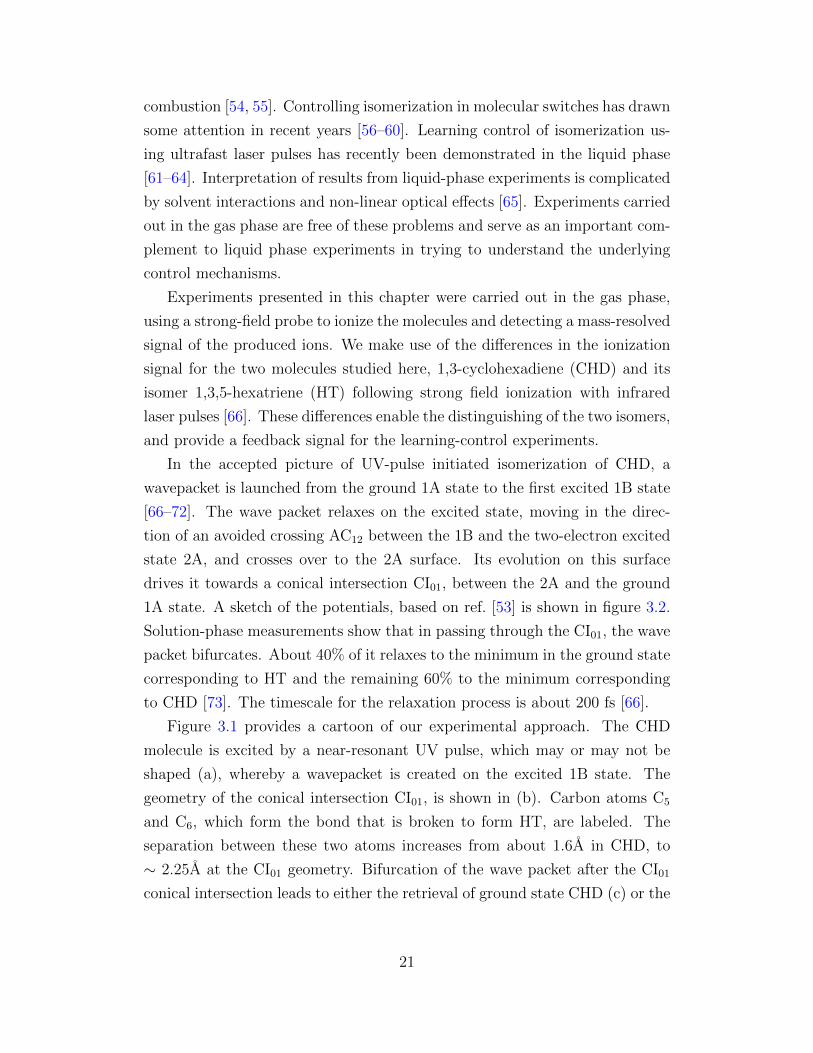
Figure 3.4: C2H+2 and parent ion yields as a function of pump-probe delay.
The signals are individually normalized to their maximum values.
The drop in the parent signal, accompanied by an increase in the C2H+2
signal, is also consistent with the formation of vibrationally hot ground state
CHD. The fragmentation pattern of vibrationally hot CHD is expected to
exhibit a preference for fragment formation, similar to what is seen in the mass
spectrum of HT. However, evidence in favor of the mass spectrum of hot CHD
resembling that of cold CHD was reported in a recent spectral unmixing study
[80]. This study suggests that the difference between spectra of vibrationally
hot and cold ground state CHD are significantly smaller than the differences
between the spectra of CHD and HT.
The parent ion yield peaks when the two beams are spatially and tempo-
rally overlapped. The pump-probe delay at which the C2H+2 yield peaks is
shifted towards longer delays with respect to the delay at which the parent ion
peaks, consistent with the time required for isomerization to take place, and
with the fragmentation pattern changing rapidly during the early stages of the
relaxation process. These changes can be brought about by the excited state
character changing in going through an avoided crossing, or later a conical
28

intersection [66]. Another possible cause of the changes in the fragmentation
pattern is the ionization potential increasing due to a rising ionic ground state
energy (see figure 3.3) [32]. The existence of a single IR photon resonance
in the ion at a geometry along the ring-opening pathway could also signifi-
cantly influence the ratios of fragments produced by ionization. In the latter
case, ionization when the wave packet is at this location can lead to efficient
excitation of the ion and thus additional fragmentation [81].
Based on the pump-probe data, we performed control experiments at a
delay of 1800 fs. This delay was chosen so that the results are not sensitive
to possible optical effects that occur when the pulses are overlapped in time,
or the changes in fragmentation that were observed in the early stages of
the ring-opening reaction. Instead, our measured ion yields at this delay are
an approximate measure of the amount of HT produced. The signal of all
fragment ions increased in going from negative to positive time delays, and also
when comparing the mass spectra of cold CHD and HT molecules. However,
this increase was more pronounced for smaller fragments than for larger ones.
The choice of fragment to feed back on in control experiments, C2H3, was a
compromise between the differences in this fragment’s signal from CHD and
from HT and a favorable signal to noise ratio.
We found that control was sensitive to the intensity of our UV pulses.
We needed to transfer enough population to the excited state to get suffi-
ciently high ionization signal to be able to distinguish between performances
of different shaped pulses. However, at higher UV intensities, the excitation
was accompanied by two-photon ionization, enhanced by the one-photon reso-
nance. It should be noted that ionic signal due to ionization by the pump can
obscure the effects of the control by producing a larger background of small
fragments in the time-of-flight mass spectrum, making the relative increase in
the fragment ion signal due to control appear smaller. The ground state of the
ion can be reached by absorbing two 4.75 eV UV photons, since the ionization
potential of CHD is 8.25 eV. On the other hand, the lowest-lying dissociation
channel (C6H8 →C6H+7 + H) lies more than two UV photons above the CHD
ground state [82], and the absorption of at least three pump photons is needed
to produce fragment ions by the pump alone. In contrast, in the pump-probe
configuration, a molecule that has been ionized to its ground ionic state by the
29

pump would be more likely to fragment after interacting with the probe. This
is because many polyatomic ions absorb strongly in the IR due to their high
density of electronic states. Thus an increase in the production of fragments
compared to the parent ion is expected for molecules that have been ionized
by the pump. Since shaping the pulse leads to a decrease in its intensity, this
change in the parent to fragment ion signal would be more pronounced for an
unshaped pulse. Thus a part of the control effect could escape detection.
We took care to isolate the contributions from both the pump and the
probe pulses to the total ion signal. The vast majority (95%) of the detected
ion signal with the IR probe pulse alone was the CHD parent. After excitation
with the UV pump pulse, the IR probe produces a substantial amount of lighter
fragment ions (35% of the total signal). In order to determine how much of this
increase is due to newly created HT molecules, we subtracted the UV alone
counts, since these ions come from molecules that did not undergo internal
conversion from CHD to HT.
H+
CH
X+
C2H
X+
C3H
X+
C4H
X+
C5H
X+ 0.0
0.5
1.0
Ion
Sign
al [
arb] unshaped
shaped
Ion
Sign
al R
atio
H+ CHX+ C
2H
X+ C
3H
X+ C
4H
X+ C
5H
X+
1.0
1.4
1.8 shaped/unshaped
Figure 3.5: Top panel: peak integrals with the unshaped and the shaped pulse(UV background subtracted), Bottom panel: shaped/unshaped peak integralratios.
30

Figure 3.5 shows results from a typical pump-probe feedback control exper-
iment. The fragments have been grouped according to the number of carbon
atoms they contain, and the UV background has been subtracted. The top
panel shows the pump-probe ion signal for each of the groups of fragments
obtained with the unshaped UV pulse and with the optimal pulse shape ob-
tained in closed-loop learning control experiments. The bottom panel of the
figure shows the ratios of ion signals in the top panel. The error bars in the
bottom panel correspond to the standard deviation of the ratio from three
different GA runs. All the fragment signals show a clear increase with shaped
pump pulse, ranging between 21% and 49% relative to an unshaped pulse.
The average increase relative to the unshaped pulse is 37± 10%.
We note that, while the ionization signal increases by 37% on average in
going from an unshaped pump pulse to an optimally shaped pump pulse, the
ionization signal cannot provide a direct measure of the amount of each isomer
in the sample of molecules that were probed. In other words, it cannot be used
to determine the branching ratio with the unshaped or the shaped pump pulse.
3.6 Discussion
Figure 3.3 shows the energies of the first few ionic states of the molecule as a
function of the length of the bond between atoms C5 and C6, whose lengthening
and breaking is involved in the isomerization. The changes of these energies
along the C5-C6 can be used to explain the different fragmentation patterns of
the two isomers. The gap between the ground and first excited states is about
3 eV, in CHD+, whereas the gap in HT+ is about 2 eV. The calculations agree
with the measured gap from photoelectron spectra in HT (1.97 eV) [83, 84],
and previous calculations [85]. The smaller energy gap between the ground
and first excited states of HT+ leads to the probe pulse populating the excited
ion states, whereas the larger gap in CHD+ leads primarily to populating the
ground ionic state.
As evident from figure 3.3, there are one-probe-photon resonances along
the ring-opening pathway. At the geometry of the CI between the ground and
first excited state, which is where the bifurcation occurs, the gap between the
ground and first excited state of the cation is ∼ 1.5 eV. This resonance may
31

be causing the increase in fragment ion signal observed at short pump-probe
time delays in fig. 3.4
There are several mechanisms by which the shaping of the pump pulse can
influence the outcome of an isomerization reaction on an excited state. Three
different possibilities which we have considered involve manipulation of the
wave packet at three different times during its relaxation - the first during the
wave packet launch, the second as the wave packet nears the CI, and the third
as the portion of the wave packet that did not lead to isomerization reaches
the CHD minimum.
The first mechanism is the control of wavepacket evolution by controlling its
momentum as it is formed on the 1B potential surface with a shaped excitation
pulse. Even though the excitation of CHD is a one-photon process, control
should still in principle be possible since the molecule is not a closed quantum
system [59, 86, 87]. Alternatively, the control could be through pump-dump-
pump scheme. In both cases, control over the momentum of the wave packet
as it crosses the 1B-1A CI, influences the CHD/HT branching ratio at the CI
[63, 88].
A second mechanism would be the dressing of excited state potentials in
the vicinity of the CI by the field of the pump. The new, dressed states
would lead to changes in the evolution of the wavepacket close to the conical
intersection, leading to changes in the branching ratio. The time required for
the wavepacket to reach the second conical intersection is about 130 fs [66].
This is longer than the unshaped pump duration, but shaping can produce
UV pulses that have a non-zero intensity at the time when the CI is reached.
However, the large detuning of the UV pulse from both the 1B-2A and 1A-1B
energy separations near the CI should result in weak dynamic Stark shifts and
thus leads us to suspect that this mechanism is not responsible for the control.
A final mechanism we consider is wavefunction “recycling”. Since it takes
about 200 fs for the wavepacket to reach one of the minima, either the CHD
or HT, after the molecule is excited portions of the wave packet excited by
earlier parts of the pump pulse may have returned to the ground state as later
parts of the pulse arrive. Thus the part of the wavefunction that relaxes back
to the CHD minimum could be re-excited by the same pump pulse and have
another chance of making it to the HT minimum [64]. Such repumping could
32

−0.4 −0.2 0 0.2 0.40
0.5
1
−0.4 −0.2 0 0.2 0.4−10
0
10
Pha
se [r
ad]
−0.4 −0.2 0 0.2 0.40
0.5
1
time [ps]
Inte
nsity
[arb
]
−0.4 −0.2 0 0.2 0.4−10
0
10
259 260 261 262 2630
0.5
1
259 260 261 262 263−10
0
10
Pha
se [r
ad]
259 260 261 262 2630
0.5
1
λ [nm]
Inte
nsity
[arb
]
259 260 261 262 263−10
0
10
Figure 3.6: Top panel: Spectral phases and corresponding spectral intensitiesof two of the optimal pulses found by the GA. Bottom panel: Temporal phasesand intensities for the same two pulses. Dark lines represent the results of aGA run at full intensity, while the light lines represent the results of a run at20% of this intensity. Solid lines are used for intensities while dashed lines areused for the phases.
be repeated several times, transferring most of the population to the HT side
of the barrier. This would suggest an optimal pulse shape with a duration of
several hundred femtoseconds, and possibly a pulse train structure.
The optimal pulse shapes produced in closed-loop learning control experi-
ments display features that are consistent with all three control mechanisms:
they are typically over 100 fs in duration, and many optimal pulses displayed
two or three sub-pulses with a spacing between 80 and 150 fs. Figure 3.6 shows
two of the pulse shapes obtained in closed-loop learning control experiments.
The top panel of this figure shows the pulse intensity and phase in the spectral
domain, while the bottom panel shows the temporal intensity and phase.
The periodic structure of the pulse shapes found in our GA experiments
33

might be related to other published data on the CHD/HT system. For exam-
ple, coherent oscillations with a period of 109 fs were reported on the excitesd
1B state, as well as 66 fs oscillations on the ground state of CHD [89]. Our
80-150 fs features are consistent with the 1B oscillation, or the first overtone
of the ground state period (due to our limited bandwidth). Pulse trains with
a period of about 250 fs have previously been reported in learning-control
experiments in the liquid phase [64].
Work is currenly under way aimed at testing whether the pulse sequences
found by the genetic algorthm and described above correspond to a wavepacket
oscillation on the 1B state. We are also investigating whether the branching
ratio at the conical intersection between the 2A and 1A states can be influenced
by launching multiple wavepackets and allowing them to interfere on one of the
excited states’ surfaces. The planned experiments will include the so called,
“pump-pump-probe” scheme. In this scheme, the molecules are excited from
the ground to the first excited state twice, using two pump pulses, each of
which only lifts a small portion of the total population to the excited state.
The probe pulses follows the two pump pulses, at a fixed delay with respect
to the second pump pulse. This pump-probe delay will be kept at over 1 ps,
following the reasoning for picking this time delay for the control experiments.
Using a pulse shaper, it is possible to vary the time delay and the phase
difference between the pulses independently, and to record the mass spectrum
for each delay. If the ion signal peaks at a certain pump-pump delay, it will
be interesting to see if that delay is consistent with any of the three proposed
control mechanisms.
3.7 Conclusions
Our measurements and calculations demonstrate the use of strong-field dis-
sociative ionization as a diagnostic tool for gas phase closed-loop control ex-
periments when the different final states have identical atomic compositions
but different geometries and fragmentation patterns. Our calculations show
that we can understand the final state detection in terms of the geometry-
dependent electronic structure of the molecular ion. We also demonstrate the
use of shaped laser pulses to control a photochemical ring-opening reaction.
34

Chapter 4
Ultrafast excited state
relaxation dynamics of isolated
nucleic bases
4.1 Introduction
In this chapter, we present results of studies of excited state dynamics of
nucleic bases. The bases included in this study are the building blocks of DNA
and RNA, adenine, cytosine and uracil. They were studied in the gas phase,
using ultrafast pump-probe methods, similar to those described in the previous
chapter. We present data that support the idea that multiple pathways are
being explored in parallel, i.e. that the relaxation is non-local.
Nucleic base monomer molecules absorb strongly in the ultraviolet, and this
absorption leaves the molecule in an electronically excited state. The reactivity
increases in going from the ground state to an excited state of a molecule,
thus so does the likelihood of photo-induced damage. The photostability of
DNA bases points to the existence of one or more highly-efficient relaxation
mechanisms, and very little fluorescence is observed upon absorption of a UV
photon [90–92]. This indicates the existence of one or more non-radiative
relaxation pathways that connect the excited states of neutral bases to their
ground state.
Excited state dynamics of the nucleic acid bases have been studied ex-
tensively experimentally and theoretically [90–92]. Experiments have been
35

carried out in the gas phase, i.e. on isolated bases as well as on solvated
bases. Ultrafast measurements of photoelectron yields [93], pump-probe tran-
sient ionization experiments [94, 95], and transient absorption measurements
in aqueous solution have revealed picosecond and faster time scales [96].
Theoretical ab intio electronic structure calculations have identified mul-
tiple conical intersections (CIs) between electronic states of DNA and RNA
bases [97]. The CIs enable ultrafast radiationless decay pathways for transfer-
ring excited state population back to the ground state. The details of excited
and ground state potentials and the location of the CIs differ between bases.
A common feature however is that there exists more than one pathway that
can lead to a radiationless decay through conical intersections, but it is not
clear whether one or more of them are actually explored during the ultrafast
relaxation. Calculations aimed at finding the crossing point or seam of two
electronic states are sensitive to the level of theory used and the quality of the
wavefunction approximation (i.e. the basis set). The predicted accessibilities
and relative prominences of pathways are sensitive to these parameters making
it unclear which of the calculated pathways plays a central role. In order to
determine which pathways and CIs play an important role in the relaxation,
it is therefore necessary to establish an experimental signature of each of the
relaxation pathways.
Ab initio multiple spawning (AIMS), a time-dependent formulation of quan-
tum chemistry developed with the aim of modeling molecular dynamics involv-
ing multiple electronic states, has recently been applied to a number of organic
molecules, including cytosine [29]. It has shown that a wave packet launched
on the excited state of a molecule by an ultrafast pump pulse breaks up into
multiple components which travel in parallel along different relaxation paths
to the ground state, involving multiple CIs [29]. Recent dynamics calculations
[98] give qualitatively similar results which indicate the importance of multiple
relaxation pathways.
This theoretical picture of nonlocal relaxation along multiple pathways has
not been directly tested in experiments. This is mainly because they either
consisted of a single channel measurement (i.e. transient absorption measure-
ments), or effectively a single channel measurement either by integrating over
different photoelectron energies or ionic fragments in order to achieve a high
36

enough signal to noise ratio for quantitative analysis [99, 100]. Extracting
information regarding multiple competing relaxation pathways from a single
channel time-resolved measurement (i.e. one yield for each pump-probe de-
lay), can prove challenging. For example, in a study by Schultz et al. [99],
data collected in a multichannel measurement, in this case a mass-resolved ion
signal, was integrated and as a result only a single timescale was reported. In
the following, we show how independent treatment of each fragment signal in
the mass- and time-resolved ionization measurement can yield multiple time
constants, indicating a spreading of the excited-state wavepacket. Further,
we study the relaxation dynamics of cytosine from its S1 state in detail, and
demonstrate that both of the theoretically predicted disjoint pathways, each
involving a different CI, are explored in the ultrafast relaxation.
While methods that utilize detection of photons associated with dipole al-
lowed transitions between optically bright states of the neutral molecule are
inherently single-channel measurements, they are well-suited for the study of
relaxation dynamics in biologically relevant environments, i.e. on solvated
molecules. In addition, methods that utilize detection of photons associated
with dipole allowed transitions between optically bright states of the neutral
molecule, such as fluorescence spectroscopy and transient absorption spec-
troscopy, are unable to offer insight into any excited state dynamics of DNA
and RNA bases which involve optically dark states that are known to play an
important role in the photophysics of nucleic base molecules [101, 102].
In order to access information about dynamics that involve optically dark
states, one may turn to methods that include ionization of the molecule as a
part of the detection scheme, such as time-resolved photoelectron spectroscopy
(TRPES) or time-resolved ion yield measurements. In turn, extracting in-
formation from measurements using these methods may require information
about ionic energies and geometries, in addition to neutral ones [103, 104].
In our approach, the dynamics were initiated by exciting gas-phase molecules
from their ground neutral state, S0, to a bright excited state. The S0 → S1
or S2 transition energy was close to the photon energy of our deep UV pump
pulses. The ensuing relaxation was probed by strong-field dissociative ioniza-
tion, effected by near IR probe pulses that interacted with the molecules after
a variable time delay. We find that all three nucleic bases’ ion signal rises
37

sharply when the pump and the probe pulses are overlapped in time (time
zero pump-probe delay), and subsequently decays. The ion signals of all frag-
ments of the three bases decays rapidly, in about 100 fs, shortly after time
zero pump-probe delay, and exhibits at least one longer, picosecond, decay
timescale. The origins of these timescales are discussed in section 4.3.
All of the individual fragment ion yields resulting from dissociative ioniza-
tion by the probe pulse were recorded. Ab initio electronic structure calcula-
tions were used to interpret the fragments’ ion yields vs pump-probe delay. We
make use of the observation that pump-probe ion yield signals differ qualita-
tively between fragments. We discuss how this information can yield separate
timescales for individual pathways, and allow for labeling of different pathways
involved in the neutral relaxation.
4.2 Tautomers of adenine, cytosine and uracil
A number of tautomers, lying low in energy, are present in some of the DNA
and RNA bases that are the subject of this chapter. These tautomers can make
up a significant fraction of sample after the heating and sublimation process
used to obtain gas-phase molecules. Below we offer evidence in favor of the
adenine and uracil samples consisting of a single tautomer at our operating
temperatures. Cytosine sample, on the other hand, contains three tautomers,
but only one of them contributes to the part of the dynamics we focus on in
this chapter.
The lowest-lying tautomer of adenine is 9H-adenine, shown in figure 4.1a.
The second lowest lying form, the 7H-adenine, shown in figure 4.1b, has a
ground state that lies about 0.35 eV above the 9H-adenine ground state [105,
106]. Given this energy difference, and the temperature of the sample in the
beam (kBT = 0.035 eV), our sample consists almost entirely of the 9H-adenine.
Uracil sample also contains only one tautomeric species, shown by core level
photoabsorption spectroscopy experiments [107].
In cytosine, there exist three low energy tautomers: the keto, the enol
and the keto-imino. Microwave spectroscopy measurements [108] predict the
relative abundances of the three tautomers to be 1:1:0.25. The presence of
these three tautomers has been confirmed by core level spectroscopy [107]. It
38

(a) 9H-adenine (b) 7H-adenine
(c) keto cytosine (d) enol cytosine (e) imino cytosine
(f) uracil
Figure 4.1: Low-lying tautomers of adenine, cytosine and uracil
is in agreement with calculated ground state energies of cytosine tautomers,
which show that the lowest lying is the enol cytosine, followed by the keto
lying about 33 meV, and the keto-imino about 55 meV above it [99, 109].
Our pump laser at 260 nm (4.74 eV) is closest in energy to the excitation
energy of the keto tautomer of 4.83 eV, with the enol and the keto-imino
excitation energies being 5.19 and 5.14 eV. Based on a combination of the
abundancies, Franck-Condon factors and oscillator strengths (0.08, 0.006 and
0.14 for the S0-S1 transitions in keto, keto-imino and enol respectively[109]),
39

we expect that the dominant contribution to the fragments in our signal comes
from the keto tautomer but we expect contributions from other tautomers as
well.
The bright S1 state in the keto-imino tautomer is an nπ∗ state, and it is
connected to the ground S0 state of this tautomer by a conical intersection.
The minimum on the S1 state is separated by a 0.7 eV barrier from the CI
[109]. In comparison, the barrier in the keto tautomer is <0.2 eV. Therefore,
a much longer relaxation time is expected in the keto-imino tautomer than in
the keto tautomer.
Calculations for the enol tautomer indicate that its bright state is the S1
state. To date no conical intersections have been found between this state
and the ground state. This prediction of a long-lived excited state population
agrees with resonance enhanced multiphoton ionization (REMPI) measure-
ments of deVries [110], which show a spectrum with many densely packed
sharp lines for the enol tautomer, and few broad lines for the keto. The width
of the broad features in the keto is consistent with a picosecond relaxation
timescale. The lack of an accessible CI in the enol tautomer, together with its
high excitation energy, leads us to discount its contribution to the picosecond
timescales we discuss below.
4.3 Adenine, cytosine and uracil dynamics
In this section, we describe the generic features of ion signals of adenine, cy-
tosine and uracil excited state dynamics. The neutral and ionic energies at
several important geometries of the three molecules studied in this work are
shown in figures 4.2,4.3 and 4.4. The lower portion of the figure shows the
calculated neutral electronic state energies of adenine, cytosine and uracil at
several geometries predicted to play a role in their relaxation dynamics. The
geometries have been taken from previous studies [111–113]. The labeling of
important points was chosen to be consistent with the published work on these
systems. The eight lowest ionic states’ electronic energies at important config-
urations along the relevant excited states of the three molecules are shown in
the upper panels of figures 4.2,4.3 and 4.4. The energy of the lowest ionic state
D0 at the vertical excitation point has been set equal to the vertical ionization
40

potential of cytosine, adenine and uracil (8.80, 8.40 and 9.60 eV) taken from
photoelectron spectra [114–116].
—
—— —
——
— ——
— — — — —
— —— — — —
— —
——
— ——
—— ——
—
—— —
—— ——
—
—— —
—— —
——
— — — — — —— — — — — — — —— — — — —— — —— — — — — — — —
0
1
2
3
4
5
6
8
9
10
11
12
13
14
15
TS 2 S
ofa
TS 1 S
ofa
Sof
a m
in
Butterf
ly m
in
S0 min
TS twist
CI sof
a
CI twist
E
[eV
]E
[eV
]
Figure 4.2: Neutral and ionic energies at some of the important points on therelaxation pathway on the S1 PES of the neutral molecule for cytosine. Lowerpanel: Energies for neutral states taken from [111–113] (black: ground state,red: S1 state). Upper panel: Energies for the eight lowest-lying ionic states.Dotted lines are used to mark predicted connections between the states.
Absorption of a UV photon at a central wavelength of 260 nm excites
cytosine to the bright neutral S1 state. Two energetically accessible CIs, and
an additional one lying higher in energy have been found in theoretical studies
[29, 109, 113, 117–124]. The two accessible CIs have been labeled ’sofa’ and
’twist’ in the original publication [113], to reflect the structure of the molecule
at those points. There are therefore at least two distinct possible pathways
of S1 → S0 relaxation, each involving one of the CIs. There are two broad
minima on the S1 surface ’butterfly min’ and ’sofa min’, that are separated
from the CIs by small barriers of similar sizes. The transition states associated
with the barriers are labeled ’TS twist’, ’TS1 sofa’, and ’TS2 sofa’. It is not
possible to determine which of the pathways is more prevalent than the other
41

based on the theory only. The cytosine dynamics will be discussed in more
detail in section 4.4.
—
—
——
—— — — — — — ——
——
——
——
——
——
——
—
——
——
——
—
——
——
—
——
———
——
——
———
——
——
———
—— —
—
——
— —— —
——
0
1
2
3
4
5
6
E[e
V]
E[e
V]
1 nm
in
1 Lb min
S0 m
in
TS2 TS1
CI32
CI16
8
9
10
11
12
13
14
15
Figure 4.3: Neutral and ionic energies at some of the important points onthe relaxation pathway on the S1 PES of the neutral molecule for adenine.Lower panel: Energies for neutral states taken from [111–113] (black: groundstate, red: excited states). Upper panel: Energies for the eight lowest-lyingionic states. Dotted lines are used to mark predicted connections between thestates.
The case of adenine is more complicated than cytosine due to the existence
of several neutral states that are close in energy at the neutral ground state
equilibrium geometry. Theoretical studies predict that there are three states
within 0.3 eV in the Franck Condon (FC) region, [125–134]. The brightest
of these states is either the second or the third excited state of the neutral,
though predictions vary with the level of theory. The two bright ππ∗ states
are labeled La and Lb, with the Lb initially lower in energy than La in the
FC region, and the order switching as the molecule distorts. There also exists
42

a dark nπ∗ that is close in energy to the ππ∗ states, and depending on the
level of theory it has been predicted to be higher or lower than the two ππ∗
states. Relaxation to the ground state can proceed through one of the two
conical intersections, the CI32, or the CI16 (shown in figure 4.3). The minima
along the pathways leading to these CIs are the nπ∗ min, and the Lb min. An
additional relaxation channel has been suggested here where an NH bond is
stretched significantly after initial absorption to a Rydberg state [125] leading
to a CI between the excited and ground states. This channel is most likely
accessed with shorter wavelengths than that of our pump [135].
Figure 4.4: Neutral and ionic energies at some of the important points on therelaxation pathway on the S1 PES of the neutral molecule for uracil. Lowerpanel: Energies for neutral states taken from [111–113] (black: ground state,red: S1 state, green: S2 state). Upper panel: Energies for the eight lowest-lyingionic states. Dotted lines are used to mark predicted connections between thestates.
In uracil, the absorption of a UV photon at a central wavelength of 260 nm
leads to the second neutral excited state, S2. There are two conical intersec-
tions that can play a role in the non-radiative relaxation, CI21 and CI10. There
are two possible relaxation pathways. The first involves a WP on the excited
43

state PES moving to the S2 minimum first, then passing through the S1/S2
CI. The second one involves the WP moving directly towards the S1/S2 CI.
After the S1/S2 CI, there is a branching leading to either a minimum in the
dark S1 state (’S1 min’), or to another CI between S1 and the ground state S0
(’CI10’) [112, 119, 136–138].
Typical time-resolved ionization signals for the parent molecular ion and
one significant fragment ion of the three nucleic bases are shown in figure
4.5. The measurements highlight similarities and differences between the three
molecules’ dynamics. In all three bases, both the parent and fragment ion
signals show a steep rise of the yield at delays shortly after time zero, followed
by a rapid drop shortly afterwards (∼100 fs), and a slower decays at longer
delays (several ps). The location of time zero delay is determined by looking
at the time-resolved signal of a molecule present in the chamber that lacks
any dynamics. The maximum yield for different fragments occurs at different
delay times, indicating that the peak in ion yield near zero time delay is not
simply an optical artifact due to the combined pump and probe fields.
The steep rise in ion yields can be explained by the molecule being excited
from the ground state to an excited state, whereby the IP is decreased by the
pump photon energy of about 4.7 eV. This makes the molecule much easier
to ionize, and accordingly the ionization yields increase sharply. The rapid
decay at small positive time delays corresponds to the entire excited state
wavepacket leaving the FC region. This is accompanied by an increase in IP,
due to a rise in the ground state energy of the ion, and, to a smaller degree,
the fall in the excited state energy in some of the molecules, as can be seen in
figures 4.2,4.3 and 4.4. The signal near zero time delay decays most rapidly
for uracil and the slowest for adenine, in accordance with the IP change in
moving from the FC point.
The part of the excited state wavepacket that is confined by a barrier
to a vicinity of a minimum on an excited state can lead to an exponential
decay of the observed ion signal. Barriers separating a minimum on a PES
and a CI often occur, and have been predicted by theory for nucleic bases
studied here. A part of the wavepacket can pass the barrier and the conical
intersection and cross over to a lower-lying electronic state with a high IP
and stop contributing to the ionization signal. The total ionization signal is
44

0 1000 2000 3000 4000 5000
0.2
0.4
0.6
0.8
1
Pump Probe Delay [fs]
Ion
Sign
al [
arb.
]
a) Cytosine
Cytosine fit95 amu95 amu fit
0 1000 2000 3000 4000
0.4
0.6
0.8
1
Pump Probe Delay [fs]
Ion
Sign
al [
arb.
]
b) Adenine
Adenine fit28 amu28 amu fit
0 1000 2000 3000 4000 5000 6000 7000
0.2
0.4
0.6
0.8
1
Pump Probe Delay [fs]
Ion
Sign
al [
arb.
]
c) Uracil
Uracil fit69 amu69 amu fit
Figure 4.5: Parent and one selected fragment ion yield vs pump probe delayfor cytosine, adenine and uracil.
45
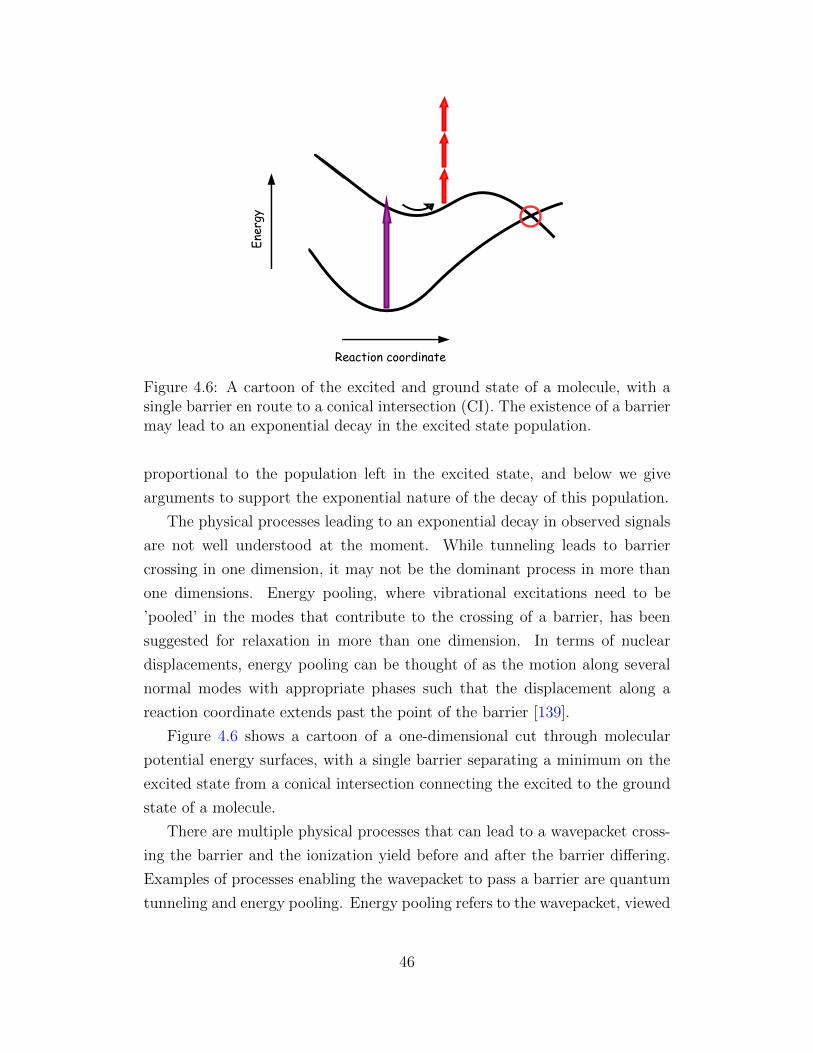
Reaction coordinate
Ener
gy
Figure 4.6: A cartoon of the excited and ground state of a molecule, with asingle barrier en route to a conical intersection (CI). The existence of a barriermay lead to an exponential decay in the excited state population.
proportional to the population left in the excited state, and below we give
arguments to support the exponential nature of the decay of this population.
The physical processes leading to an exponential decay in observed signals
are not well understood at the moment. While tunneling leads to barrier
crossing in one dimension, it may not be the dominant process in more than
one dimensions. Energy pooling, where vibrational excitations need to be
’pooled’ in the modes that contribute to the crossing of a barrier, has been
suggested for relaxation in more than one dimension. In terms of nuclear
displacements, energy pooling can be thought of as the motion along several
normal modes with appropriate phases such that the displacement along a
reaction coordinate extends past the point of the barrier [139].
Figure 4.6 shows a cartoon of a one-dimensional cut through molecular
potential energy surfaces, with a single barrier separating a minimum on the
excited state from a conical intersection connecting the excited to the ground
state of a molecule.
There are multiple physical processes that can lead to a wavepacket cross-
ing the barrier and the ionization yield before and after the barrier differing.
Examples of processes enabling the wavepacket to pass a barrier are quantum
tunneling and energy pooling. Energy pooling refers to the wavepacket, viewed
46

S0 min Butterfly min Sofa min
D0 : π1
D0
S2: π1(π*)1
S1: n1(π*)1
π π*
π*nD1 : n1
(a)
(b)Figure 4.7: Natural orbitals of uracil, representing the excitation of the neutralstates S1 and S2, and the natural orbitals representing the hole on D0 are shownfor one geometry (the S0 minimum).
as excitations spread across several vibrational states, having a small but non-
zero probability of enough vibrational excitation quanta being found in the
mode that corresponds to movement in the direction across the barrier on the
excited state. Both energy pooling and tuneling are exponentially sensitive to
the height and the width of the barrier.
In addition to the changes caused by change in the ionization potential, the
ionization rate depends on the shape of electronic wavefunctions of both the
neutral molecule and the ion and especially on the degree of overlap between
them. This dependence, and the concept of a Dyson orbital and its magnitude
that is used to quantify the overlap, will be discussed in more detail in chapter
5. Passing through a CI between neutral states is usually accompanied by
a change in the neutral wavefunction character, while the ionic wavefunction
character may remain unchanged. A change in state character can lead to
a change in the Dyson orbital magnitude and thus to a change in ionization
yields.
In this picture, for example, removing an electron from an nπ∗ state in
uracil can lead to an n state. Natural orbitals, or one-electron wavefunctions
associated with each of the orbitals of a molecule, are shown for uracil in
Figure 4.7. The S1 state has an nπ∗ character and correlates with the first
excited ionic state, D1, which has a hole in an n orbital (HOMO-1). As
S2 corresponds to a removal of an electron from the π∗ orbital (HOMO), it
correlates with D0. Based on the overlap of the natural orbitals for uracil,
47

ionization from S1 will lead to significant excited ionic state production, while
ionization from the S2 state will lead largely to D0. This change in ionization
pattern is expected in passing through CI12 between S2 and S1.
In order to quantify the observed differences in the observed pump-probe
signals, we fitted the data to a convolution of a Gaussian with a sum of several
exponentially decaying functions. The details of the fitting function and pro-
cedure are given in appendix A. We were able to describe the data for uracil
and adenine well with bi-exponential decay although the cytosine measure-
ments required a sum of three exponential decays for a good fit. These decay
lifetimes are shown in table 4.1 and correspond to a fast signal decrease at
short pump-probe delays, an exponential decay on the order of picoseconds
associated with the wavepacket leaving one of the excited state minima, and
a ledge at very long delays, that describes the part of the wavepacket that
stays trapped in the excited state much longer than the longest pump-probe
delay. The uncertainties were calculated as the standard deviation of the fit
values from repeated pump probe measurements on different days. They were
typically about 15%, but ranged from 9% to almost 50% for fragments whose
ion signals had poor signal to noise.
Ion A1 τ1 [fs] A2 τ2 [fs] A3 τ3 [fs]
Cytosine 0.72 50 0.17 240 0.14 236095+ from cytosine 0.59 150 0.14 870 0.25 4680
Adenine 0.77 100 - - 0.73 114028+ from adenine 1.46 50 - - 0.53 480
Uracil 1.70 70 - - 0.16 215069+ from uracil 1.28 90 - - 0.21 3210
Table 4.1: Decay constants and their amplitudes for the ionic fragments shownin Figure 4.5.
Both the short and the long decay times differ significantly between the
three molecules, as well as between the parent and fragment of the same
molecule. The spread in picosecond decay times are shown in figure 4.8. Each
of the panels of this figure shows a histogram of picosecond decay times of
different fragments for all three molecules.
In uracil, the IP changes in going to the S2 and S1 minima by 1.5 and 2.5 eV,
respectively, as can be seen in figure 4.4. Accordingly, the ion yields decrease
48

1000 2000 3000 40000
5
a) Cytosine
1000 2000 3000 40000
5
τ1Num
ber
of F
ragm
ents
b) Adenine
1000 2000 3000 40000
2
Decay Lifetime [fs]
c) Uracil
Figure 4.8: Histograms showing the spread of excited state lifetimes for cyto-sine, adenine and uracil.
steeply in moving away from the FC region, as evidenced by a sharp drop in
both the parent and the fragment at 69 amu signals just after time zero. Uracil
starts by a movement of the wavepacket from the FC region to either the S2
minimum or directly to the S1/S2 CI. In the latter case, the switching from S2
to S1 leads to a change in the ionization pattern, as discussed in more detail
in chapter 6. While S2 is ionized primarily to D0, S1 ionizes mostly to D1.
The switching is consistent with the early delay at which the parent signal is
maximum and a sharp drop (∼70 fs) of this ion signal. The pump-probe signal
of mass 69 has a pronounced long (>10 ps) component, consistent with some
of the excited state population being trapped S1 minimum. The distribution
of picosecond decay times is bimodal, with peaks at about 2 ps and about
3100 fs, as seen in 4.8c, offering support to a bifurcation on the initial excited
state, and both CIs playing a role in the deexcitation.
As shown in figure 4.3, the calculated IP change in adenine, between the
FC region and the Lb minimum is very small (∼ 0.1 eV). The change between
the FC and the nπ∗ minimum is 0.5 eV. Both are much smaller than the
change in IP in the initial stages of relaxation in uracil, and this difference is
borne out in the fact that the time zero peak is less prominent in the adenine
parent or many of its fragments, compared to uracil. However, there are
49

fragments that exhibit a somewhat sharper time zero, for example CH2N+
(28 amu). This may indicate that the parent and some of the fragments are
formed by ionization and subsequent fragmentation from the Lb minimum,
while CH2N+ originates from the nπ∗ minimum. In terms of the decay times
for the picosecond component of decay, fitting resulted in a range of lifetimes.
The lifetimes allow the rough grouping of fragments into two categories - one
with lifetimes around 700 fs, and one with lifetimes around 1250 fs, as seen in
Figure 4.8.
The relaxation of cytosine along two separate deexcitation pathways will
be discussed in detail in the following section.
4.4 Distinguishing between pathways in cyto-
sine
In this section, we follow the excited state dynamics of cytosine pumped to its
first excited state. We focus on the picosecond timescale dynamics, which is
associated with the excited state wavepacket being confined to a region close
to a minimum on the excited state by a barrier that separates the minimum
from a CI with the ground state. As we have argued in section 4.2, only keto
cystosine, the tautomer most commonly found in DNA and RNA, contributes
to the picosecond ion signal we measure. Here we first present the theoretical
results on cytosine relaxation pathways, and then turn to measured pump-
probe ionization signal to try and determine the relative importance of the
two accessible pathways. We conclude with a picture of cytosine relaxation
through multiple conical intersections.
Figure 4.2 shows the geometries that play a role in the excited state dy-
namics. The bright S1 state is connected to the ground S0 state through two
energetically accessible CIs, labeled ’sofa’ and ’twist’ [113]. A third CI between
S1 and S0 has also been found [29, 117] but studies that use correlated methods
find this CI to be higher in energy [113, 118, 121], so it is not expected to play
a role in the relaxation. Three-state CIs have also been identified in cytosine
but their energies are higher than the two-state intersections mentioned above
[123, 124]. It should be noted that the CIs discussed here are the minimum
energy points on the seams of CIs. In a molecule with N degrees of freedom,
50

these seams are N-2 dimensional hypersurfaces.
As shown in figure 4.2, initial absorption of a pump photon leads to the
FC region of the excited state, which lies about 0.8 eV above the S1 minimum,
called the ‘butterfly’ minimum here. This minimum is separated from each of
the CIs by at least one barrier. Only one barrier is separating this minimum
from the twist CI, but there are two barriers towards the sofa CI, with the
minimum closer to the sofa CI labeled as the sofa minimum. The size of
barriers separating the sofa and the twist CIs from their respective minima
are comparable and it is not easy to determine their relative importance in
the radiationless decay based only on energetics.
In order to test whether both relaxation pathways are explored in the
ultrafast relaxation of cytosine, we set out to identify fragments that can label
the S1 pathways predicted by theory. To begin with, we examine the overlaps
between S1 and low-lying ionic states. We base our analysis on the sensitivity
of ionization to the IP, the dependence of the ionization rate on the position on
the excited state PES from which the molecule is ionized, and the electronic
configurations and orbitals of the neutral state.
Figure 4.9 shows the dominant orbitals describing the S1 state at the three
geometries of primary interest in our analysis: the initial FC geometry, the
butterfly minimum, and the sofa minimum. At the S0 minimum, as well as
at the sofa minimum geometry, the S1 configuration of cytosine corresponds
to a HOMO → LUMO excitation, with a contribution of about 75%. At
the butterfly minimum, the HOMO→LUMO contribution is about 50%, with
the second highest contribution from HOMO-1→LUMO. The natural orbitals
of D0 and/or D1, describing the hole left in the cation, are shown for these
geometries in the rightmost column of figure 4.9.
The removal of the LUMO electron, leaving a hole in HOMO, would pro-
duce an ion in its ground D0 state. Calculations show that the S1 state signifi-
cantly overlaps with D0 at all geometries relevant for ultrafast relaxation. We
therefore restrict our analysis to fragments that are produced from the ground
D0 state of the ion. This overlap can be visually checked by comparing the
S1 and D0 the orbital shapes from the rightmost and the leftmost columns of
figure 4.9. It can be quantified using the concept of the Dyson orbital defined
in chapter 5.
51
Figure 4.9: The HOMO/HOMO-1 (left column) and LUMO (middle column)orbitals of cytosine describing the S1 state, as well as, natural orbitals describ-ing the hole for D0/D1 (right column) calculated at the geometries S0 min,butterfly min, and sofa min.
Considering that the parent ion originates from D0, any other fragment
that originates from the same state should have the same probe intensity
dependence as the parent ion. Our analysis presented below reveals that the
parent ion is produced predominantly at the butterfly minimum, making the
parent a label for the butterfly pathway. The fragment C4N2H3O+ at 95 amu
is found to have the same intensity dependence as the parent, but also to be
produced mainly from the sofa minimum, making this fragment a label of the
sofa minimum. The parent and mass 95 pump-probe signal show significantly
different decay time constants of about 2200 fs for the parent and about 4300 fs
for the 95 amu. The fitted decay times for pump-probe signals of all fragments
of cytosine, presented in figure 4.8a and table 4.1 show a spread of picosecond
decay times, confirming the delocalized relaxation picture.
Figure 4.10 shows the ratio of fragment to parent ion signals for fragments
43 and 95 at pump-probe delays of about 500 fs. This delay is long enough
to exclude the cross-correlation between the pump and the probe pulses, but
short enough that the wavepacket is still largely on S1. Fragment at 43 amu,
52

whose ratio to parent ion depends strongly on the probe intensity is shown to
contrast the weak dependence of the 95 amu ratio to the parent ion.
30 40 50 600.5
1
1.5
2
2.5
3
3.5
Probe Energy [mW]
frag
men
t / p
aren
t
mass 43mass 95
Figure 4.10: Probe intensity dependence of fragment signal divided by parent.Black line and diamonds represent the peak at 43 amu, and red line and circlesthe peak at 95 amu. Data shown for a pump probe delay of 500 fs
4.4.1 Fragmentation from the butterfly minimum
(95,16)
(68,43)
(70,41) (70,41)
(83,28)
(83,28)
Figure 4.11: Picture of cytosine showing the atomic numbering conventionused in the text along with bonds which are broken to form fragments discussedin the text.
In this subsection we discuss the choice of the parent ion as the label of the
butterfly minimum n the S1 surface in some detail. We first turn to a study
53

of fragmentation patterns in the cytosine cation [140]. It was found that the
first step towards producing fragments at 68 amu and at 83 amu, dominant
in the mass spectrum, involve a common transition state TSion, and breaking
of the N1-C2 bond (see figure 4.11). This transition state lies about 0.34 eV
above the minimum of the ground ionic state in energy. Upon reaching TSion,
additional steps can lead to the production of either 68+ or 83+. The lowest
energy barrier on the ground state of the molecule, of 1.85 eV, is that to the
production of 68+, after breaking of an additional bond and accompanied by
proton transfer. Therefore, a molecule with at least 1.85 eV of energy above
the D0 minimum will dissociate, while one with less than this minimum energy
would not.
Figure 4.12: Calculated D0 energies along the ionic LLM pathways starting atthe sofa and the twist minimums and ending at the TSion point
Figure 4.12 shows ten-intermediate-step linear least motion (LLM) D0 en-
ergy scans starting at the sofa minimum and the twist minimum and ending
at the TSion geometry. The LLM scans are done by linearly interpolating
the coordinates of a molecule between the start and the end point in a given
number of steps. Since they include no geometry optimizations, they give the
upper bound on the possible barriers existing between the start and the end
point. In this case, no significant additional barriers were found on either of
54

the pathways towards TSion. Importantly, the barriers that can be seen in
figure 4.12 are not higher in energy than the initial point on each pathway.
The barrier LLM calculation shows that the energy the molecule has upon
reaching TSion is very different when ionized out of the sofa minimum than
when ionized from the twist minimum. The D0 energy at sofa minimum ge-
ometry is about 2.5 eV above TSion, while at the butterfly minimum the D0
energy is only about 0.5 eV higher than TSion. Thus, the molecule does not
have enough energy to dissociate from the sofa minimum, making the parent
ion a marker of the butterfly pathway.
4.4.2 Fragmentation from the sofa minimum
In this subsection, we present arguments in favor of the 95+ being a label
of the sofa minimum. In order to produce this fragment, the C4-N7 bond
need to be broken, corresponding to a loss of an NH2 radical. Factors that
lead to a weakening of this bond include pirimidalization, or placement of
C4 away from the plane of the molecule, because the amino group tends to π-
overlap with C4 when that carbon is planar, which strengthens the C4-N7 bond.
Pyrimidalization of C4 is very pronounced at the sofa minimum geometry, and
the weakest in twist geometry. The orbitals shown in Figure 4.9 confirm that
along the sofa direction, the density is localized on N3 and there is no density
along C4-N7.
These arguments have been confirmed by ab initio calculations. The cal-
culated D0 energies as a function of C4-N7 bond length, show that 3.9 eV of
energy is needed for the cleavage of this bond from the sofa geometry compared
to 5.6 eV for the butterfly minimum. These calculations did not include relax-
ation at intermediate geometries, and therefore overestimate the dissociation
energy. They do provide a rough comparison of the energetic requirements
between the two pathways. The C4-N7 cleavage energy from the D0 minimum,
obtained from a relaxed scan, is 2.6 eV. Finally, the D0 energy is higher at the
sofa minimum geometry than at the twist minimum geometry. Thus, energetic
arguments indicate that 95+ is indeed produced from the sofa minimum.
Additional support for the association of the 95+ fragment with the sofa
minimum comes from low energy electron impact ionization [141] and low en-
ergy photoionization with synchrotron radiation between 8.8 and 10.2 eV [142],
55

which ionized ground state cytosine molecules to D0 and D1 (see figure 4.2),
with a possible minor contribution from D2), but produced a negligible signal
at 95 amu, consistent with differences in orbital shapes that likely lead to dif-
ferences in fragmentation patterns. As shown in figure 4.9, the natural orbitals
for D0 and D1 (not shown) at the butterfly and S0 minimum are very similar.
This indicates that ionization to D0 and D1 from these two locations produces
a similar fragmentation pattern, featuring the parent ion but not including
95+.
4.4.3 Other fragments
The parent and 95 amu can be associated with ionization to the ground D0
state of the ion, and with dissociation from a particular minimum on the
excited state surface. However, they are rather an exception among the frag-
ments in the mass spectrum of cytosine. In fact, many of the fragments we
observe are either only produced from an excited state of the ion, or can
be produced at several geometries. In addition, some of the fragments with
the same mass are produced through breakage of different bonds, and there-
fore cannot be used to track a particular relaxation pathway. For example,
the 43 amu fragment is predominantly produced from an excited state of the
ion, as confirmed by figure 4.10. An example of a fragment that is produced
from the D0 state, but not exclusively at a given geometry, is the fragment at
68 amu. The presence of a peak at 68 amu in the low energy electron impact
ionization spectrum [141] indicates that this fragment can be produced at the
S0 minimum and therefore likely at the butterfly minimum as well, given the
similarity of the molecular orbitals at the two geometries. This fragment is
expected to be produced from the sofa minimum as well, since breaking the
N1-C2 bond (with barriers and energies shown in figure 4.12) constitutes the
first step towards the production of 68 amu.
Below we examine the time dependence of the ion signal of several fragemtns
of cytosine, despite the difficulties in isolating locations on S1 which contribute
uniquely to their production. The decay times and pathway association for
several prominent fragments in the mass spectrum is given in table 4.2. The
uncertainties listed are the standard deviation in fit values from repeated pump
probe measurements on different days. Some fragments we associate with the
56
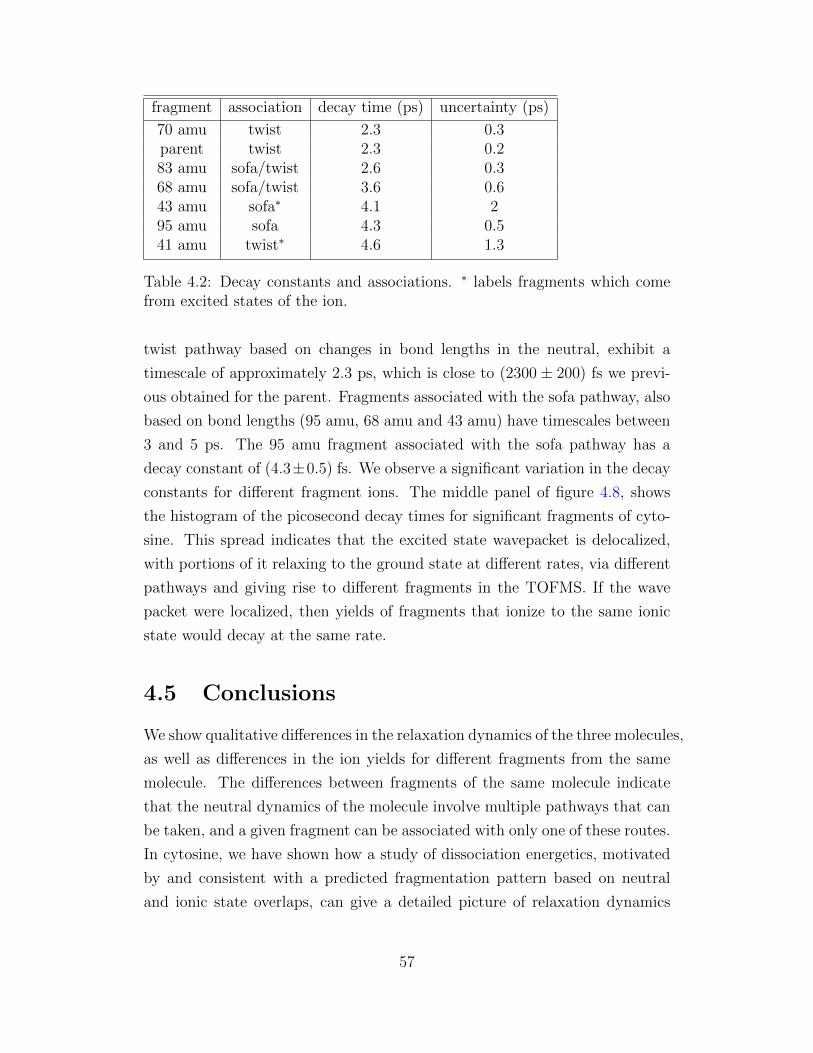
fragment association decay time (ps) uncertainty (ps)
70 amu twist 2.3 0.3parent twist 2.3 0.283 amu sofa/twist 2.6 0.368 amu sofa/twist 3.6 0.643 amu sofa∗ 4.1 295 amu sofa 4.3 0.541 amu twist∗ 4.6 1.3
Table 4.2: Decay constants and associations. ∗ labels fragments which comefrom excited states of the ion.
twist pathway based on changes in bond lengths in the neutral, exhibit a
timescale of approximately 2.3 ps, which is close to (2300± 200) fs we previ-
ous obtained for the parent. Fragments associated with the sofa pathway, also
based on bond lengths (95 amu, 68 amu and 43 amu) have timescales between
3 and 5 ps. The 95 amu fragment associated with the sofa pathway has a
decay constant of (4.3±0.5) fs. We observe a significant variation in the decay
constants for different fragment ions. The middle panel of figure 4.8, shows
the histogram of the picosecond decay times for significant fragments of cyto-
sine. This spread indicates that the excited state wavepacket is delocalized,
with portions of it relaxing to the ground state at different rates, via different
pathways and giving rise to different fragments in the TOFMS. If the wave
packet were localized, then yields of fragments that ionize to the same ionic
state would decay at the same rate.
4.5 Conclusions
We show qualitative differences in the relaxation dynamics of the three molecules,
as well as differences in the ion yields for different fragments from the same
molecule. The differences between fragments of the same molecule indicate
that the neutral dynamics of the molecule involve multiple pathways that can
be taken, and a given fragment can be associated with only one of these routes.
In cytosine, we have shown how a study of dissociation energetics, motivated
by and consistent with a predicted fragmentation pattern based on neutral
and ionic state overlaps, can give a detailed picture of relaxation dynamics
57

that involves more than one pathway (shown in figure 4.13). In this picture,
the molecule is excited from the S0 minimum to the FC point on S1, where it
begins to evolve towards a local minimum on S1. The wave packet becomes
delocalized and explores many pathways on the S1 surface. Its de-excitation
back to the ground state proceeds through at least two pathways that are tra-
versed in parallel. The timescales shown in the figure reflect the fitted decay
times for the fast (∼100 fs) and the picosecond component of the pump-probe
signal.
CICI
h =4.74eV
S0
S1
Butterflymin
Sofamin
~0.2 eV
~0.7 eV
~0.2 eV
3500-4500 fs2000-3000 fs 50-100 fs<150 fs
Figure 4.13: Cartoon of S0 and S1 PES showing important points andtimescales extracted from experimental fittings.
58

Chapter 5
Strong field molecular ionization
from multiple orbitals
5.1 Introduction
In this chapter, we study the properties of strong-field ionization from multiple
orbitals of a polyatomic molecule. We examine the dependence of strong-field
ionization yields on the orientation of excited state with respect to the ioniz-
ing laser field. We chose to use excited state uracil, because it has a bright
state whose excitation energy is close to the energy of our UV pulses. Fur-
thermore, theoretical results, previously obtained by our collaborators, enable
the identification of the orbital from which an electron has been removed in
the ionization process for a given final product of dissociation from an ionic
state. The non-trivial electronic configuration, along with their being partially
aligned using a simple procedure, makes excited state uracil molecules a suit-
able system for studying the ionization from multiple orbitals and its angular
dependence.
The molecules are excited to the first bright (S2) excited state of the neu-
tral by a near-resonant pump. The ensemble of excited state molecules is
partially aligned by the pump pulse in a process of selective excitation (which
will be described in section 5.3) and subsequently ionized and dissociated by a
strong-field IR probe. The time delay between the pump and the probe pulses
is varied, as well as their relative polarization. We measure the ion yields of the
resulting fragments as a function of the time delay and relative polarization
59

angle. The results are interpreted using ab initio electronic structure calcula-
tions, performed by Congyi Zhou and Spiridoula Matsika at Temple University.
We find that a prediction, based on the orbital nodal structure, for the angle-
dependent distribution of ion yields matches our observation for the ionization
of a LUMO (lowest unoccupied molecular orbital) electron, whereas ionization
from deeper bound orbitals is more complicated.
In this chapter, we first give a brief description of our experimental ap-
proach, followed by a presentation of the experimental and theoretical results,
and a discussion of the interpretion of the data. A separate section deals with
multielectron wavefunctions and concept of the Dyson orbitals. Another sec-
tion provides some details about the rotational dephasing of a partially aligned
sample of molecules, a process that can obscure the temporal dynamics we ob-
serve. We then present and discuss our results, and end with a few concluding
remarks.
The dependence of strong field ionization yields on the orientation of the
laser field with respect to the molecule is still an open question. In the case of
ionization of small, ground state molecules, it has been shown that the yields
reflect the shape of the molecular orbital from which the electron had been
removed [143–146]. In the case of a single photon ionization, or recombination
leading to harmonic emission, it has been shown that the angular dependence
reflects the structure of the Dyson orbital (see section 5.2) associated with the
ionization [45]. It has been predicted [147] that the ionization yields will be
suppressed if the laser polarization vector lies in a nodal plane of an orbital,
since the contributions to the outgoing electron wave from electron density
lobes of opposite phases will interfere destructively. Thus the angular depen-
dence of the ionization yields reflects the nodal structure of the orbital, which is
in turn intimately related to the symmetry of that orbital. This idea has been
used to follow dissociation dynamics in a diatomic molecule [148]. In addition
to orbital symmetries, Bucksbaum et al. [149] considered the spatial extents
of orbitals in N2, to identify contributions to the harmonic spectrum from
electrons expunged from both HOMO and HOMO-1 orbitals of this molecule.
In our experiments, the molecules are first pumped by a near-resonant
pulse in the deep ultraviolet at about 262 nm. The pumping enables the angle-
resolved measurements to be performed in the lab frame by partially aligning
60

Figure 5.1: Geometry of ground state uracil and transition dipole moment forthe S0 →S2 electronic transition.
them. After a variable delay, the molecules are ionized by strong-field, near-IR
pulses at about 780 nm. The molecules may undergo dissociation following
ionization, depending on what final state the molecules is left in following
ionization. A half-waveplate placed in the pump beam allows us to change
this beam’s polarization, and we detect mass-resolved ion yields as a function
of the delay between the pump and the probe and the angle between their
polarization vectors.
We interpret the data with the aid of ab initio electronic structure calcula-
tions. They are used to obtain energies and electronic configurations of the the
neutral S0 and S2 states involved in the excitation and initial relaxation from
the Frank-Condon region of the excited state as well as configurations, energies
and energetic requirements for dissociation from accessible ionic states. Our
calculations allow us to associate fragments in the TOFMS with final states
of the cation, and to establish relations between neutral and ionic electron
configurations.
61
5.2 Multielectron wavefunctions and Dyson or-
bitals
In order to describe a multi-electron molecular wavefunction, it is convenient
to start from one-electron states or orbitals. The orbitals are filled with elec-
trons in order of increasing energy, in accordance with the aufbau principle.
A ground state of a neutral molecule with an even number of N electrons cor-
responds to the N/2 energetically lowest one-electron states (orbitals) doubly
occupied by two electrons of opposite spin projections, and all the higher ly-
ing orbitals unoccupied. Acronyms HOMO and LUMO are commonly used
for the highest occupied molecular orbital and lowest unoccupied molecular
orbital, as well as their extensions HOMO-1, HOMO-2 etc. A wavefunction
correctly accounting for exchange interaction between electrons and describing
an N-electron state is a Slater determinant, obtained by fully antisymmetriz-
ing a product of N one-electron functions. Only occupied orbitals are included
in the product, and this distribution of electrons over orbitals is referred to
as the electronic configuration. An eigenstate of the molecular Hamiltonian
is in many cases a linear combination of several configurations. In the case
of low-lying singlet (neutral) excited states, the dominant configuration often
corresponds to moving an electron from the HOMO to the LUMO orbital.
In the case of ionic states, the lowest ones are dominated by configurations
including only one singly occupied orbital, usually HOMO, HOMO-1, etc. In
this chapter, we use the HOMO/LUMO notation rather than symmetry as-
signments as it offers an unambiguous way of referring to different orbitals and
states.
Projecting a final (N-1 electron) ionic state onto the initial (N electron)
state of the neutral yields a Dyson orbital of the ionization channel: ψDyson =√N〈ψNm(r1, r2, ..., rN)|ψN−1
n (r1, ..., rN−1)〉, where ψNm and ψN−1n are the eigen-
functions of the neutral and the ionic Hamiltonians. The magnitude of a
Dyson orbital is formally related to the ionization yield to a specific state in
the case of single photon, or more generally, ionization that can be described
perturbatively [150]. In the case of strong-field ionization, the situation is
more complicated, and this will be the subject of chapter 6.
62

5.3 Alignment through selective excitation and
rotational dephasing
Prior to their interacting with the pump pulse, the uracil molecules in the
interaction region of the vacuum chamber are randomly oriented. They are in
the ground electronic state, S0, though thermal excitations may place them in
a higher vibrational or rotational state. If the pump pulse is nearly resonant
with a transition (e.g. S0 → S2 in uracil), it preferentially excites this transition
in molecules whose transition dipole moment (TDM) is aligned along the laser
polarization vector. In general, the probability of a molecule being excited is
proportional to the cosine square of the angle θ between the TDM associated
with the excitation and the laser polarization vector. This leads to a degree
of alignment of ensemble of the excited state molecules. The figure of merit
describing the degree of alignment is commonly given as the expectation value
of square of the cosine of the angle θ between the molecular axis and the
polarization vector of the laser.
〈cos2(θ)〉 =
ˆ 2π
0
dφ
ˆ π
0
cos2(θ)f(θ)dθ, (5.1)
where f(θ) is the distribution of alignments of individual molecules. For
comparison, for a perfectly aligned sample, 〈cos2(θ)〉 = 1, while for a com-
pletely dephased sample in three dimensions f(θ) = 1/(4π) making 〈cos2(θ)〉equal to 0.33. For molecules that have been aligned by selective excitation, the
sample has a cosine square alignment distribution f(θ) = (3/(4π))cos2(θ) and
the measure of the alignment quality factor 〈cos2(θ)〉 is 0.6. Factors of 1/(4π)
and 3/(4π) ensure the proper normalization of each distribution function. An
analogous alignment measure can be defined for samples constrained to one
degree of freedom, where perfect alignment again corresponds to 〈cos2(θ)〉 = 1,
but the alignment factor becomes 0.5 for a completely random sample, and
0.75 for a sample with a cosine square alignment distribution around an axis.
The selective excitation scheme does not lead to a three-dimensional align-
ment of the molecules, since they are not constrained along one of their de-
grees of freedom. Instead, the partially aligned sample consists of molecules
free to rotate around their TDM vector. The partially aligned sample contains
molecules of two opposite orientations of the TDM with respect to the laser
63
polarization vector at a given moment. The TDM for the S0→ S2 transition in
uracil is shown in Figure 5.1. Others have used this simple partial alignment
scheme [148]. It should be noted that this alignment scheme is only effective
for pump pulse intensities that do not saturate the relevant transition, and for
this reason care has been taken to run the experiments at sufficiently low UV
intensities.
Another commonly used alignment scheme is the dynamical alignment us-
ing a strong non-resonant laser pulse to transiently align a molecule. In ro-
tationally cold molecules, an ultrafast laser pulse can prepare a coherent su-
perposition of rotational states that are aligned a short time after the pulse.
The system dephases with a rate proportional to the square of the width of
the rotational wavepacket in the J space [151]. Since the rotational frequen-
cies scale as J(J+1), the system can rephase, and subsequently dephases are
rephases with a period proportional to the difference in energies between the
J=0 and J=1 or J=2 states, depending on symmetry. The non-resonant dy-
namical alignment scheme is more difficult to implement experimentally than
alignment through selective excitation. It requires the molecular sample to
be rotationally cold, typically to 10 K or less. In the simplest implementa-
tion of this scheme, the laser field is linearly polarized, and the molecules are
free to rotate around the polarization vector of the field. The field-free align-
ment quality factors achieved for polyatomic molecules typically reach about
0.55-0.6 in one-pulse experiments [152] and up to 0.7 in more sophisticated
experiments utilizing two laser pulses [153]. The highest degree of alignment
reported in any experiment to date is 0.92, achieved for iodobenzene cooled to
about 1 K [154], in an adiabatic (non-field-free) alignment scheme.
In order to determine the dephasing time, or the approximate time during
which a sample of molecules remains aligned to some degree after its interaction
with the pump pulse, we calculate the beat period between to eigenstates of the
rotational Hamiltonian. It should be noted that the dephasing corresponds to
rotations around one of the axes perpendicular to the TDM of the molecules,
since our sample is free to rotate around the TDM itself. We calculate the
rotational energies of a molecule as those corresponding to a quantized rigid
rotor. The distribution of population across rotational states, is given by the
thermal Boltzman distribution. Population in excited vibrational states is
64

neglected here, even though the low-frequency vibrational states of uracil were
likely populated at the operational temperatures of about 130oC.
The energies of rotational states of a molecule, Erot is given by:
Erot(J) =J(J + 1)~2
2I(5.2)
where the rotational quantum number J takes on non-negative integer val-
ues, J=0,1,2,..., I is the moment of inertia of the molecule, and ~ is the reduced
Planck’s constant. The degeneracy of each of the rotational states is given by
2J+1. For a sample of molecules at a finite temperature, the population in
each of the rotational states is:
p(J) =(2J + 1)eErot(J)/kBT∑J(2J + 1)eErot(J)/kBT
(5.3)
0 50 100 1500
0.005
0.01
0.015
0.02
J
Pop
ulat
ion
frac
tion
300 K450 K
Figure 5.2: Population of rotational levels as a function of the rotational quan-tum number, for uracil molecules at 300 K and at 450 K
The distribution of rotational population over rotational states is shown
in figure 5.2, for uracil molecules rotating around the axis perpendicular to
TDM for the S0 →S2 transition with a smaller associated moment of inertia
(or for a linear molecule with the moment of inertia equal to the smallest one
for uracil), at room temperature (300 K) and at the temperature close to those
at which our experiments have been conducted (450 K). Both temperatures
were included to emphasize the weak dependence of rotational dephasing on
the sample temperature, in the range of temperatures that were relevant to
our experiment. Therefore, a possible cooling of the molecular beam during
65
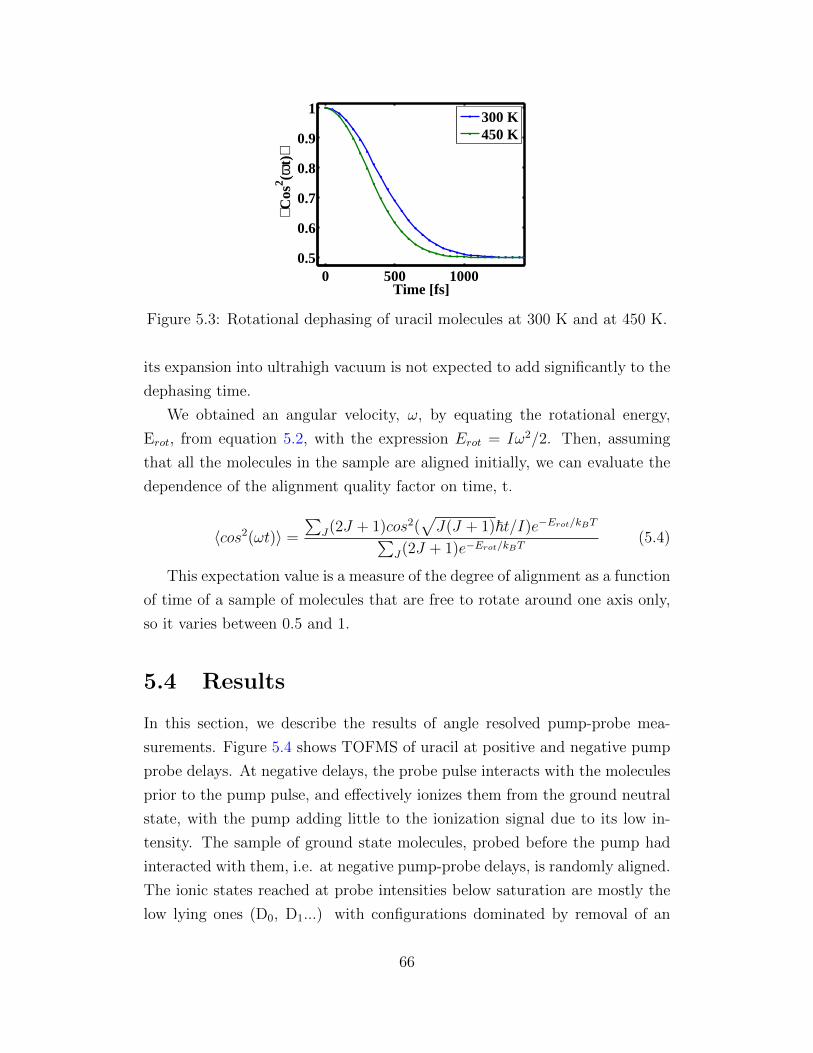
0 500 10000.5
0.6
0.7
0.8
0.9
1
Time [fs]⟨ C
os2 (ω
t)⟩
300 K450 K
Figure 5.3: Rotational dephasing of uracil molecules at 300 K and at 450 K.
its expansion into ultrahigh vacuum is not expected to add significantly to the
dephasing time.
We obtained an angular velocity, ω, by equating the rotational energy,
Erot, from equation 5.2, with the expression Erot = Iω2/2. Then, assuming
that all the molecules in the sample are aligned initially, we can evaluate the
dependence of the alignment quality factor on time, t.
〈cos2(ωt)〉 =
∑J(2J + 1)cos2(
√J(J + 1)~t/I)e−Erot/kBT∑
J(2J + 1)e−Erot/kBT(5.4)
This expectation value is a measure of the degree of alignment as a function
of time of a sample of molecules that are free to rotate around one axis only,
so it varies between 0.5 and 1.
5.4 Results
In this section, we describe the results of angle resolved pump-probe mea-
surements. Figure 5.4 shows TOFMS of uracil at positive and negative pump
probe delays. At negative delays, the probe pulse interacts with the molecules
prior to the pump pulse, and effectively ionizes them from the ground neutral
state, with the pump adding little to the ionization signal due to its low in-
tensity. The sample of ground state molecules, probed before the pump had
interacted with them, i.e. at negative pump-probe delays, is randomly aligned.
The ionic states reached at probe intensities below saturation are mostly the
low lying ones (D0, D1...) with configurations dominated by removal of an
66
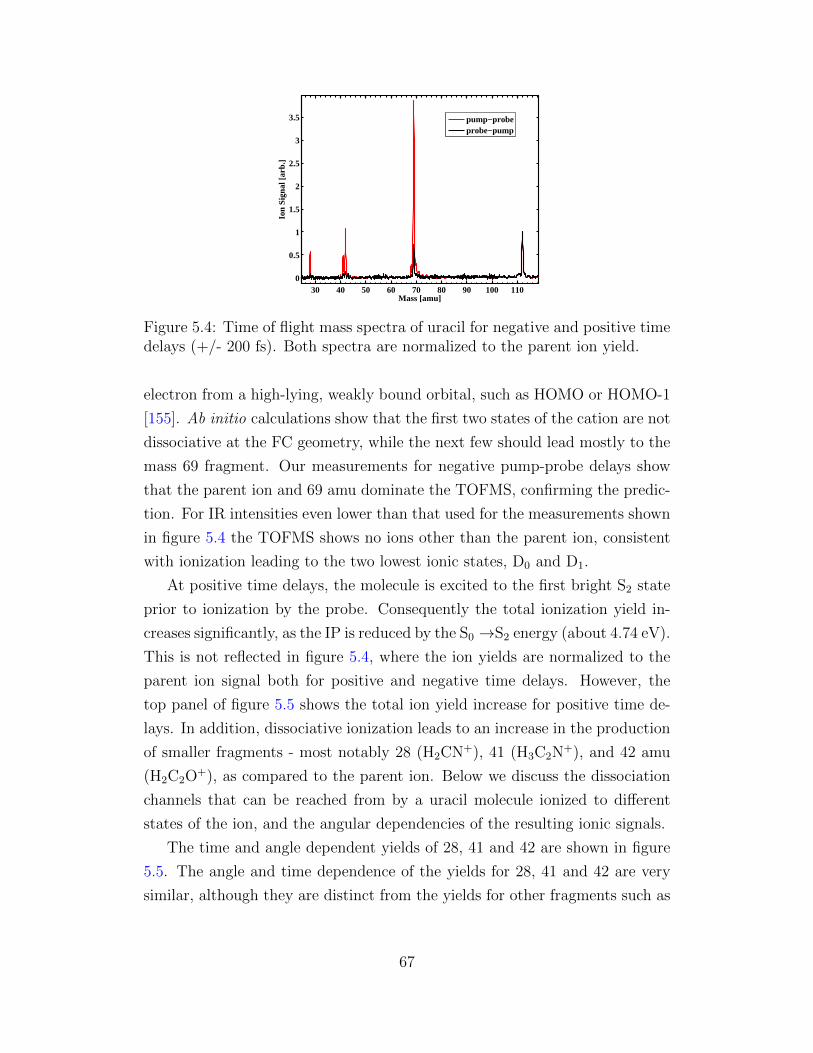
30 40 50 60 70 80 90 100 1100
0.5
1
1.5
2
2.5
3
3.5
Mass [amu]
Ion
Sig
nal [
arb.
]
pump−probeprobe−pump
Figure 5.4: Time of flight mass spectra of uracil for negative and positive timedelays (+/- 200 fs). Both spectra are normalized to the parent ion yield.
electron from a high-lying, weakly bound orbital, such as HOMO or HOMO-1
[155]. Ab initio calculations show that the first two states of the cation are not
dissociative at the FC geometry, while the next few should lead mostly to the
mass 69 fragment. Our measurements for negative pump-probe delays show
that the parent ion and 69 amu dominate the TOFMS, confirming the predic-
tion. For IR intensities even lower than that used for the measurements shown
in figure 5.4 the TOFMS shows no ions other than the parent ion, consistent
with ionization leading to the two lowest ionic states, D0 and D1.
At positive time delays, the molecule is excited to the first bright S2 state
prior to ionization by the probe. Consequently the total ionization yield in-
creases significantly, as the IP is reduced by the S0 →S2 energy (about 4.74 eV).
This is not reflected in figure 5.4, where the ion yields are normalized to the
parent ion signal both for positive and negative time delays. However, the
top panel of figure 5.5 shows the total ion yield increase for positive time de-
lays. In addition, dissociative ionization leads to an increase in the production
of smaller fragments - most notably 28 (H2CN+), 41 (H3C2N+), and 42 amu
(H2C2O+), as compared to the parent ion. Below we discuss the dissociation
channels that can be reached from by a uracil molecule ionized to different
states of the ion, and the angular dependencies of the resulting ionic signals.
The time and angle dependent yields of 28, 41 and 42 are shown in figure
5.5. The angle and time dependence of the yields for 28, 41 and 42 are very
similar, although they are distinct from the yields for other fragments such as
67
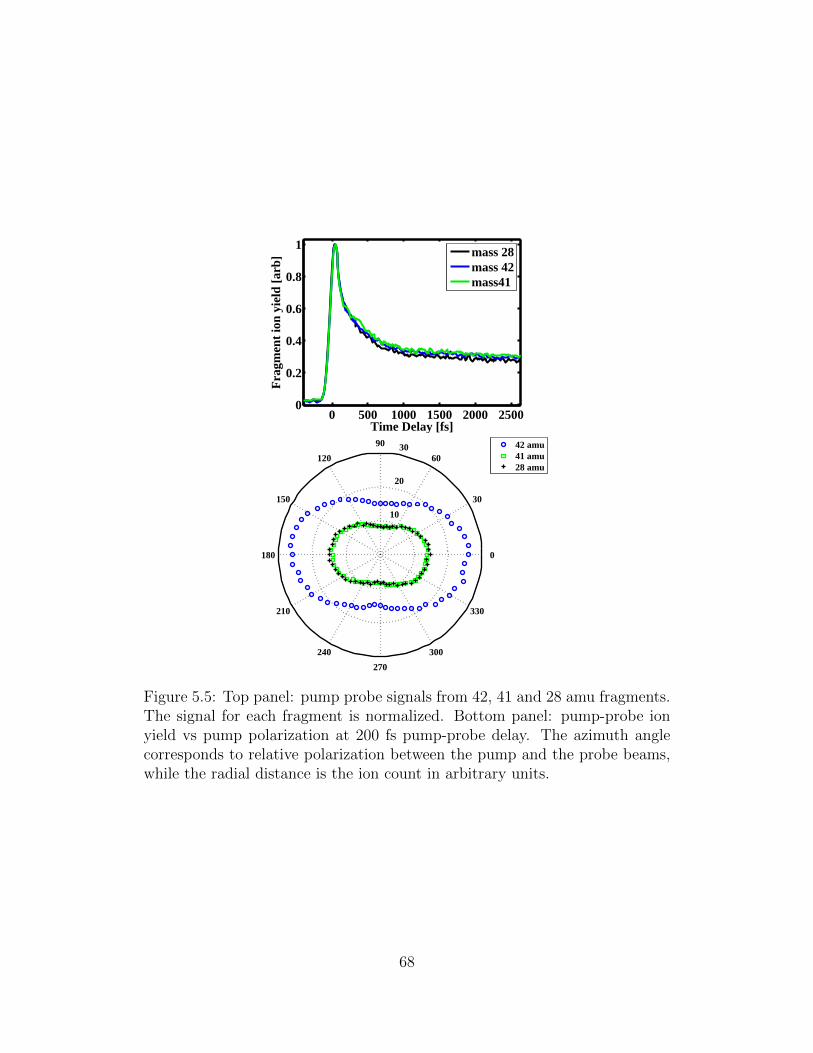
0 500 1000 1500 2000 25000
0.2
0.4
0.6
0.8
1
Time Delay [fs]
Fra
gmen
t io
n yi
eld
[arb
]
mass 28mass 42mass41
10
20
30
30
210
60
240
90
270
120
300
150
330
180 0
42 amu41 amu28 amu
Figure 5.5: Top panel: pump probe signals from 42, 41 and 28 amu fragments.The signal for each fragment is normalized. Bottom panel: pump-probe ionyield vs pump polarization at 200 fs pump-probe delay. The azimuth anglecorresponds to relative polarization between the pump and the probe beams,while the radial distance is the ion count in arbitrary units.
68

S1
D0 D1 D5 D6S2
(a) LUMO [π]
(b) HOMO [n]
(c) HOMO-1 [π]
(d) HOMO-2 [π]
(a) (b)
(c) (d)
Figure 5.6: Dominant electronic configuration and characters for relevantstates of the neutral and the ion. The participating orbitals are shown aswell: (a) LUMO, (b) HOMO, (c) HOMO-1 and (d) HOMO-2. The orbitalsare shown for the molecule in the same orientation as shown in figure 5.1.
the parent and 69. This leads us to conclude that these three fragments are
produced from the same ionic state or states.
The top panel of figure 6.2 shows the configurations for the electronic states
relevant to the discussion in this chapter. The bottom panel of figure 6.2 shows
the shapes of the orbitals that participate in the configurations of the relevant
electronic states. Dominant cofigurations are shown for each one of the states.
For the ground neutral state, the dominant configuration is the one with all the
electrons paired and the orbitals filled in order of increasing energy. Excitation
to S2 can be described as a HOMO-1 → LUMO excitation.
Figures 5.7 and 5.8 show the angle- and time- resolved ion yields for the
parent ion and fragment at 42 amu at several pump-probe delays. Angles
of 0o and 180o correspond to parallel relative polarization between the pump
and the probe beams, while 90o and 270o correspond to perpendicular relative
polarization between the two beams. Experiments carried out with the probe
polarization along the TOFMS axis and perpendicular to it yielded the same
dependence on the relative polarization between the pump and probe. About
20 polarization scans were taken in succession and averaged in order to improve
the signal to noise ratio. The ion yield at each angle in the 0o-360o range was
69

20
40
60
80
30
210
60
240
90
270
120
300
150
330
180 0
0 fs100 fs200 fs400 fs600 fs1000 fs
(a)
(b)
Figure 5.7: Panel (a): Pump-probe ion yield vs pump polarization and pump-probe delay for parent ion. The azimuth angle corresponds to relative polar-ization between the pump and the probe beams (0o corresponds to parallelpolarization). The radial distance is proportional to the ion yield in arbitraryunits. Panel (b): LUMO orbital shape.
measured independently.
5.5 Discussion
We use calculated dissociation energies and barriers to dissociation on the
ground cationic state to determine which cationic state(s) of the molecule are
dissociative and can lead to which fragments. The use of ground state disso-
ciation barrier is justified by a reasoning based on Kasha’s rule. This rule was
proposed for neutral molecules and states that even if highly excited states are
accessed, fluorescence will often originate from the first excited state after a
fast radiationless relaxation to it [156]. Such behavior is expected, since the
70

10
20
30
40
50
30
210
60
240
90
270
120
300
150
330
180 0
0 fs100 fs200 fs400 fs600 fs1000 fs
(a)S1
D0 D1 D5 D6S2
(a) LUMO [π]
(b) HOMO [n]
(c) HOMO-1 [π]
(d) HOMO-2 [π]
(a) (b)
(c) (d)
(b)
S1
D0 D1 D5 D6S2
(a) LUMO [π]
(b) HOMO [n]
(c) HOMO-1 [π]
(d) HOMO-2 [π]
(a) (b)
(c) (d)
(c)
Figure 5.8: Panel (a): Pump-probe ion yield vs pump polarization and pump-probe delay for 42 amu. The azimuth angle corresponds to relative polarizationbetween the pump and the probe beams (0o corresponds to parallel polariza-tion). The radial distance is proportional to the ion yield in arbitrary units.Panel (b): HOMO orbital shape. Panel (c): HOMO-2 orbital shape.
density of states generally increases with their energy, and so do the chances
for the existence of an easily accessible non-radiative relaxation pathway, i.e.
a conical intersection. This rule can be extended to ionic states, whose den-
sity increases with energy as well. In uracil, the calculated D0 dissociation
energies are comparable with the difference in energy between the ground and
the excited ionic states, making a dissociation from the excited state energeti-
cally unfavorable. Thus a molecule ionized to a higher ionic state will tend to
undergo a rapid radiationless decay to D0. The decay will convert electronic
energy to vibrational energy on D0 and dissociation will proceed from the vi-
brationally hot D0 potential energy surface. Furthermore, parallel experiments
that have been carried out on other molecules with a velocity map imaging
71
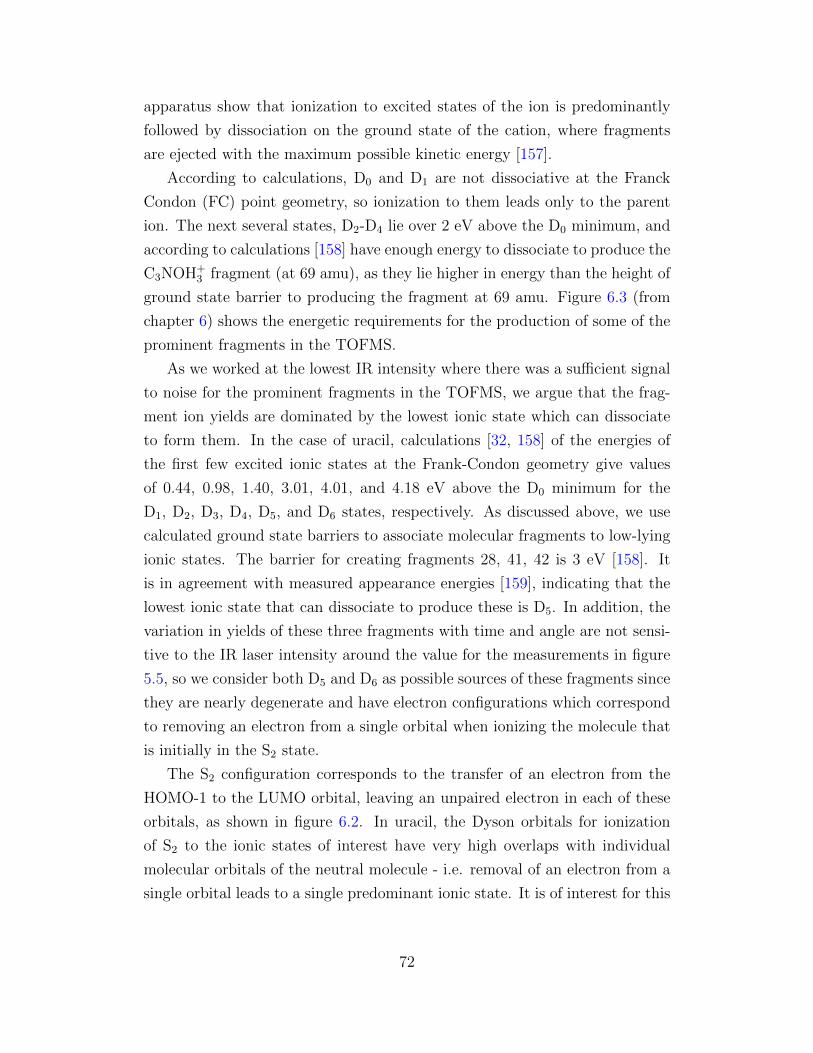
apparatus show that ionization to excited states of the ion is predominantly
followed by dissociation on the ground state of the cation, where fragments
are ejected with the maximum possible kinetic energy [157].
According to calculations, D0 and D1 are not dissociative at the Franck
Condon (FC) point geometry, so ionization to them leads only to the parent
ion. The next several states, D2-D4 lie over 2 eV above the D0 minimum, and
according to calculations [158] have enough energy to dissociate to produce the
C3NOH+3 fragment (at 69 amu), as they lie higher in energy than the height of
ground state barrier to producing the fragment at 69 amu. Figure 6.3 (from
chapter 6) shows the energetic requirements for the production of some of the
prominent fragments in the TOFMS.
As we worked at the lowest IR intensity where there was a sufficient signal
to noise for the prominent fragments in the TOFMS, we argue that the frag-
ment ion yields are dominated by the lowest ionic state which can dissociate
to form them. In the case of uracil, calculations [32, 158] of the energies of
the first few excited ionic states at the Frank-Condon geometry give values
of 0.44, 0.98, 1.40, 3.01, 4.01, and 4.18 eV above the D0 minimum for the
D1, D2, D3, D4, D5, and D6 states, respectively. As discussed above, we use
calculated ground state barriers to associate molecular fragments to low-lying
ionic states. The barrier for creating fragments 28, 41, 42 is 3 eV [158]. It
is in agreement with measured appearance energies [159], indicating that the
lowest ionic state that can dissociate to produce these is D5. In addition, the
variation in yields of these three fragments with time and angle are not sensi-
tive to the IR laser intensity around the value for the measurements in figure
5.5, so we consider both D5 and D6 as possible sources of these fragments since
they are nearly degenerate and have electron configurations which correspond
to removing an electron from a single orbital when ionizing the molecule that
is initially in the S2 state.
The S2 configuration corresponds to the transfer of an electron from the
HOMO-1 to the LUMO orbital, leaving an unpaired electron in each of these
orbitals, as shown in figure 6.2. In uracil, the Dyson orbitals for ionization
of S2 to the ionic states of interest have very high overlaps with individual
molecular orbitals of the neutral molecule - i.e. removal of an electron from a
single orbital leads to a single predominant ionic state. It is of interest for this
72

discussion that this is in particular true for D0, D5, and D6, the three orbitals
we focus on here. A removal of the LUMO electron from S2 leads to a state
with a hole in HOMO-1, which correlates well with the ground state of the ion,
D0. A removal of a HOMO or HOMO-2 electrons from the S2 configuration
leads to ionic states, D5 or D6, respectively, each with unpaired electrons in
three different orbitals. This allows the association of an ionization channel
with the removal of a single electron.
Dyson orbital magnitude is a good measure of an individual final state
ionization yield only in the case of a weak-field excitation. In the case of strong-
field excitation, it is in principle possible that there are contributions to the
total ionization signal from other ionic states. For example, ionization could
project S2 to D1 even though the magnitude of the Dyson orbital corresponding
to this ionization channel is small. However, the largest contribution to the
the parent signal will come from D0.
The ionization angular dependence is expected to be influenced by the
shape of the orbital from which an electron is removed to make a product
observed in the mass spectrum. Since the largest contribution to the parent
signal will come from D0, based on configurations we expect that any angular
dependence of the ionization yields will be given by the weakly bound LUMO
orbital, given the low probe intensities we used and the lack of intensity depen-
dence for the angle resolved parent ion yields. In the case of lighter fragments
at 28, 41 and 42 amu, their ionization is predicted to be predominantly from
the more deeply bound HOMO and HOMO-2 orbitals.
Figure 5.7a shows the dependence of the parent ion signal on the relative
polarization between the pump and the probe beams. Since the uracil LUMO
orbital, shown in figure 5.7b, is π-like, its major nodal plane is in the plane
of the molecule. The orbital has contributions from electron density on either
side of the molecular plane. Measurements of ionization of the most weakly
bound electron in diatomic and linear triatomic molecules [143–145] has shown
a suppression of ionization in the nodal plane.
The expected suppression of ionization in the nodal plane, translates to
an prediction in terms of relative polarizations of the pump and the probe
beams by noting that the TDM for the S0 →S2 transition lies in the plane of
the molecules, which is also the π nodal plane of the LUMO orbital. When
73

the pump and the probe beams’ polarization vectors are parallel, ionization
of LUMO is suppressed since the probe polarization vector lies in the nodal
plane of this orbital. When the pump and the probe polarization vectors are
perpendicular to each other, we have to take the fact that the alignment is
only constrained to one degree of freedom into account. The molecules are
free to rotate around the S0 →S2 TDM, and, in the molecular frame, the
polarization vector can lie anywhere in the plane perpendicular to it. Since
the plane perpendicular to the TDM intersects the nodal plane on the LUMO
orbital, the ionization yield is suppressed for a part of the molecules that
interact with the probe. However, some of the molecules will be aligned with
the probe polarization perpendicular to their nodal plane, and their ionization
will not be suppressed. Since ionization of the LUMO will be suppressed
for all molecular orientations when the pump and the probe are parallel, we
expect a net more suppression for this configuration. Our measurements (see
figure 5.7a)agree with the prediction that ionization of the LUMO, producing
the parent ion, is suppressed along the plane of the molecule (0o and 180o)
relative to the direction perpendicular to the plane of the molecule (90o and
270o).
In the case of 28, 41 and 42 amu, there are two orbitals whose ionization
leads to the production of these fragments the HOMO and the HOMO-2. this
is because these fragments are expected when ionization leads to the higher
ionic states D5 and D6, whose configuration in turn correspond a removal of an
electron the HOMO or the HOMO-2 orbital, starting from the S2 configuration.
In the case that these fragments arise from removal of a HOMO electron,
associated with the D6 ionic state, the nodal plane of the main lobe of this
orbital contains the S0-S2 TDM. In this case one would expect suppression of
the ionization parallel to the TDM, for reasons similar those outlined for the
LUMO orbital above. In the case of ionization of an electron from HOMO-2,
associated with the D5 state, the principal nodal plane is clearly parallel to
the TDM. There is a second nodal plane for HOMO-2, which is perpendicular
to the TDM. Suppression in this second nodal plane could contribute to the
favoring of ionization parallel to the TDM, although it is not clear why the
suppression in the second nodal plane should be stronger than in the primary
one parallel to the TDM. Thus, it seems that the observed ionization from
74

HOMO or HOMO-2 does not lend itself to a simple explanation in terms of
the symmetry of the orbitals.
The limited contrast between the ionization yields for perpendicular and
parallel polarizations, and the lack of detailed structure are a result of sev-
eral limitations in our measurements. These include the fact that while the
molecules are preferentially excited with their TDMs along the pump polar-
ization vector, this only constrains the molecule along one angle, and does not
result in three dimensional alignment [160]. Furthermore, the measurement
is proportional to a convolution of the actual ionization probability vs angle
with the distribution of molecules vs angle [143]. Finally, there is rotational
dephasing leading to random molecular alignment on a timescale of about 1 ps
for our molecular ensemble at ∼ 130C. This is consistent with the dephasing
time for uracil derived in 5.3, and shown in figure 5.3.
A ’net’ ionization of a particular orbital can be interpreted in several ways.
For example, the ionization of an electron in a HOMO orbital can be accom-
plished through the direct removal of a HOMO electron, or indirectly, through
the removal of a lower lying electron followed by a relaxation of a HOMO
electron to take its place. Another way to describe this in a multi-electron
picture is in terms of relaxation from a higher lying ionic state to lower ones.
This relaxation, or coupling between ionic states can be due to field free terms
of the molecular Hamiltonian (e.g. via a conical intersection between ionic
states, or through interaction with the ionized electron, see chapter VI), or it
may be driven by the laser field during ionization, particularly if the spacing
between states is close to the laser frequency - i.e. near resonant interaction
[161]. We argue that fragment ions, which can be produced by ionization of
an electron from a given molecular orbital with multiple contributions should
not necessarily have angular distributions reflecting the shape or symmetry of
the orbital in which a new hole had been created at the end of the interac-
tion, since there can be multiple contributions to the production of a given
molecular orbital hole. However, the parent ion should still have the angular
distribution dictated by the LUMO orbital, since the removal of a LUMO elec-
tron from the S2 configuration is not only the most probable process, but also
one that can occur without any configuration changes. Ionization of a LUMO
electron from S2 leading to D0 is not expected to have contributions from sev-
75

eral configurations which can complicate the angular distribution, because the
final cationic state is D0, from which no relaxation in the ion is possible as it is
the lowest energy state. Furthermore, any laser driven coupling between ionic
states would result in the molecule being left in a dissociative excited ionic
state, and therefore not lead to parent ion production which is associated with
the LUMO orbital.
In terms of timescales, it should be noted that it follows from the uncer-
tainty principle that the movement of the hole between orbitals separated by
up to 1 eV, (e.g. HOMO and HOMO-1 in uracil) takes 4 fs or more. Given
the sensitivity of tunnel ionization to the laser field strength, ionization is con-
fined to a very short ( ∼ 100 as) interval in the vicinity of the sub-cycle field
maxima. Since the uncertainty principle precludes the hole movement from
occurring during a single cycle of the pulse, if hole motion is responsible for
the anomalous angle dependent yield, then we must be able to see it by virtue
of the ionization taking place over multiple cycles of the pulse. For the hole
movement, i.e. evolution to occur following ionization by a few-cycle pulse
the ionic state that is prepared would have to be a superposition of different
electronic states, i.e. an electronic wavepacket.
5.6 Conclusions
Our measurements confirm that the ionization of the most weakly bound elec-
tron in a molecule to produce the parent ion is dictated by the shape of the or-
bital from which that electron is removed, but the ionization of electrons from
more deeply bound electrons can be complicated by configuration changes dur-
ing ionization, which can involve multiple orbitals in the ionization process.
Configuration changes accompanying the ionization of the most weakly bound
electron are not energetically allowed, whereas such changes are energetically
favorable in the case of ionizing more deeply bound electrons. Therefore we
expect that electronic correlation plays a more significant role in the removal
of a HOMO or deeper bound electron then it does in a removal of an electron
from LUMO or above. This is consistent with our measurement of the par-
ent ion angular distribution following the symmetry of the LUMO, whereas
fragments resulting from the removal of more deeply bound electrons do not
76

simply follow the symmetry of the associated orbital.
77

Chapter 6
Role of state correlations in
strong field molecular ionization
6.1 Introduction
In this chapter, we study of the role of correlations between the neutral and the
ionic states in predicting the final state distribution in strong-field molecular
ionization. The final-state resolved ionization yields presented here were calcu-
lated by Michael Spanner and Serguei Patchovskii of the Steacie Institute for
Molecular Sciences at the National Research Council of Canada. The ab initio
electronic structure calculations used as input for the strong-field ionization
calculations were performed by Congyi Zhou and prof. Spiridoula Matsika of
Temple University.
Strong-field molecular ionization is known to depend on the structure and
electron density of a molecule [144, 148]. It is also sensitive to, and can there-
fore serve as a probe of, electron correlation [162, 163]. Introducing multi-
electron effects has been shown to be necessary in describing features of the
ionization of small molecules [164]. These effects are expected to be even
more important in larger molecules, where the density of ionic states is higher,
making ionization from deeper lying orbitals easier [145].
In this chapter, we focus on the distribution of final states in the process
of strong-field ionization from a particular neutral state and on the role of
correlations between the initial neutral and the final ionic states. Excited
states of the ion generally have configurations that include a hole in an orbital
78

below the highest occupied one (HOMO). This suggests that the removal of an
electron from an orbital lying below the HOMO can be a dominant pathway to
reaching an excited ionic state. Indeed, removing electrons from orbitals below
the highest one in energy has been observed in strong-field ionization [30, 149,
165] and attributed to differences in the spatial electron density distribution
between the orbitals. However, there has to date been no general way of
predicting which states of the ion are populated by strong-field ionization,
and with which probability.
Here we compare three methods for predicting final state ionization yields.
The first method utilizes Dyson orbital amplitudes weighted by tunneling ex-
ponents [12], and can formally be derived from the strong field approximation.
It is referred to as the Dyson-Keldysh method here. The second method is
the molecular ADK (MO-ADK) theory [26]. The third method is the numer-
ical calculations based on a time-dependent mixed orbital/grid-based method
described in Ref. [164] and briefly in section 6.3. We find that accounting
for multielectron effects, specifically the interaction of the departing electron
with the core leading to rearrangement of core electrons during the ionization
process, is necessary in order to achieve a qualitative agreement between the
predictions and the measured ionization yields.
Ultrafast relaxation pathways of uracil are taken from previous studies
[32, 112]. Briefly, a near-resonant sub-50 fs UV pulse launches a wave packet
on the S2 state, subsequent relaxation takes the wavepacket to the S1 excited
state in several tens of femtoseconds, and back down to the ground S0 on a
timescale of several picoseconds.
6.2 Correlations between molecular states
Koopmans’ correlations, used in several recent studies [148, 166, 167], are a
simple way of predicting the final state of an ionization process. A ground
state is correlated with a cationic state corresponding to a single ionization
in the Koopmans sense if the configuration resulting from the removal of a
single electron from the neutral is identical to the configuration of the ion.
Koopmans’ correlations are based on the Hartree-Fock theory, where only one
electronic configuration is considered for each of the neutral or ionic states
79

involved. The validity of the frozen orbital approximation is assumed as well,
where ionic one-electron orbitals do not differ from their neutral counterparts,
so that ionization is viewed as a removal of an electron from its orbital, with-
out any changes to the rest of the molecule. Koopmans correlations neces-
sarily break down when the frozen orbital approximation is not valid, which
is frequently true, even for weak-field ionization. In addition, the Koopmans
correlations fail if ionization is accompanied by a rearrangement of electrons
between orbitals.
Another approximate method of calculating ionization yields is by eval-
uating the magnitudes of the Dyson orbitals associated with the accessible
ionization channels. Dyson orbitals, introduced in chapter 5 are one-electron
wavefunctions obtained by projecting a final ionic (N-1 electron) state, ψn
(the nth ionic state), onto the known initial (N electron) state, ψm: ψDyson =√N〈ψNm(r1, r2, ..., rN)|ψN−1
n (r1, ..., rN−1)〉. Since ψNm and ψN−1n are multi-electron
eigenstates of the neutral and the ionic Hamiltonians, both contributions from
multiple configurations and orbital relaxation effects are taken into account.
In the limit of weak field ionization, it can be shown that the distribution
of ionic state yields between ionization channels is proportional to the Dyson
orbital amplitudes [150]. If the magnitude of the Dyson orbital associated with
an ionization channel is significant, we consider the neutral and the ionic state
correlated in the Dyson sense. In the case of strong-field ionization, the strong-
field approximation also yields a probability of ionizing to a particular ionic
state given by the product of the Dyson orbital magnitude and the tunneling
exponent associated with the ionization channel. The tunneling exponent, or
Keldysh rate [12], is given by:
K(Ip, F0) = exp
[−2
3
(2Ip)3/2
|F0|
](6.1)
where Ip is the ionization potential associated with the ionization channel
and |F0| is the peak electric field strength.
In order to account for electron rearrangement that may happen during
the ionization process, we turn to calculations of strong-field ionization yields
that go beyond the standard strong field approximation. The calculations,
described below, utilize a more detailed description of the outgoing electron’s
interaction with the remaining cation.
80

6.3 Calculations
The strong field ionization calculations presented in this chapter have been per-
formed by Michael Spanner of the Steacie Institute for Molecular Sciences at
the National Research Council of Canada. The method used (Time-Dependent
Resolution in Ionic States - TD-RIS) has been introduced and described in Ref.
[164]. In this method, the bound states are described as field-free multielectron
states, and obtained by ab initio electronic structure calculations, described
below. These bound state are coupled to one-electron continuum states rep-
resented by numerical grids. This method goes beyond some commonly used
methods for calculating strong-field ionization (e.g. the strong-field approxi-
mation [23], and molecular ADK method [26]) in that it can account for some
electron-ion interactions that are typically neglected. These include the dis-
tortion of the outgoing electron’s wavefunction due to the multi-center nature
of the molecular potential, and the rearrangement of core electrons due to the
outgoing electron [168]. The calculations were performed by Michael Spanner
of the National Research Council of Canada, for the ionization for a half-cycle
of 800 nm radiation with a peak intensity of 30 TW/cm2.
Using a half-cycle pulse to calculate quasi-static ionization rates is justi-
fied by the fact that the quasi-static approximation doesn’t remember the past
history of the pulse, so averaging over many cycles or just a half-cycle should
give the same result. Other accepted analytical approximations used to cal-
culate strong field ionization yields, such as the Keldysh [12] or the MO-ADK
theory [26], are also based on quasi-static tunneling theory, and average over
one period at the peak intensity. The TD-RIS method uses averages only over
half a period due to restrictions in computational resources. The sensitivity of
the this method to averaging over only half a period as opposed to averaging
over a full period has been explicitly checked for the N2O4 molecule at sev-
eral geometries [169]. It did not yield any differences in the relative yields of
different ionic states. Furthermore, due to an approximately Gaussian spatial
intensity profile of a laser beam, any experimental ionization measurement will
have contributions from parts of the laser mode with different intensities. This
focal volume spatial intensity averaging complicates any comparison between
data and theoretical predictions that were confined to one intensity.
The ab initio calculations used as inputs to the strong field TD-RIS cal-
81

culations have been performed by prof. Spiridoula Matsika and Congyi Zhou
of Temple university. They consisted of state averaged complete active space
self-consistent field (CASSCF) calculations and the Dunning aug-cc-pVDZ ba-
sis set. The active space for the neutral calculations included 14 electrons in
10 orbitals and 4 states were averaged in the CASSCF, while the ionic calcu-
lations used an active space of 13 electrons in 10 orbitals and averaged over 8
ionic states.
6.4 Results and discussion
0 1 2 3 4 5 6 70
0.2
0.4
0.6
0.8
1
D state
Ion
iza
tio
n Y
ield
(n
orm
.)
S0
0 1 2 3 4 5 6 7
D state
S1
0 1 2 3 4 5 6 7
D state
S2
Dyson−Keldysh
MO−ADK
TD−RIS
Figure 6.1: Comparison of Dyson-Keldysh, MO-ADK, and TD-RIS calcula-tions for ionization to the various doublet cation states of uracil starting fromthe ground state (S0) and first bright excited state of the neutral molecule(S2).
Figure 6.1 shows strong field ionization yields of uracil, calculated using
the three methods we compare here: the Dyson-Keldysh method, the MO-
ADK method and the TD-RIS method. The eight lowest-lying states of the
cation, D0-D7, have been included. The electronic configurations of these
states are shown in figure 6.2, while their energies are shown in figure 6.3. The
yields were evaluated for ionization starting out of the ground state, S0, the
bright state in our experiments, S2, and the first excited state S1, which is
potentially populated via non-adiabatic transitions. Calculations for all three
neutral states were carried out for the ground state (S0) equilibrium geometry,
with the yields averaged over all angles. Comparison of the angle averaged
calculations with angle resolved calculations show only small differences. Note
that neither of the methods can provide absolute ionization yields, but they
82

can be used to compare the yields between either initial (neutral) or final
(ionic) states within the same method. The results of each calculation shown
in figure 6.1 have been normalized to the S2 →D0 yield.
The S1 state is dark, and is populated only through S2. Simulations show
that at short time delays (shorter than about 70 fs) most of the population
is in S2, so any 69 amu signal would have to have some from S2, and not
from S1. Simulations show an offset between time delays where the S1 and S2
populations peak. Given time for the wavepacket to relax to this state and
to pick up enough kinetic energy for the D1 state to become dissociative, this
state would be dominantly producing the 69 amu fragment. For this reason
we concentrate on short time delays. Pump probe data give a lower limit
for the relaxation away from the FC point of about 70 fs. This is the fitted
exponential decay to the parent pump-probe signal, and corresponds to the
wavepacket motion away from the FC region on S2, and its reaching a part
of the PES, on either the S1 or S2, that is about 1 eV lower than the FC
region. In addition, this motion of the wavepacket is accompanied by the D0
energy rising by about 1 eV. This additional energy allows the molecular ion
to dissociate, resulting in the reduction of the parent ion signal. At shorter
pump-probe delays, any portion of the wave packet on S1 does not have enough
kinetic energy to dissociate from D1 (see table 6.1).
The low lying states of both the neutral and the cation of uracil have a
single dominant configuration. This allows us to describe the ionic states in
terms of orbitals that are singly occupied. The configuration of the ground
neutral state, S0, is one in which all the orbitals up to HOMO are doubly
occupied, and all the higher lying orbitals unoccupied. Due to the large (4-
5 eV) HOMO-LUMO gap, and a much smaller HOMO-1–HOMO gap (both
typical of polyatomic molecules) the lowest few states of the cation are ’single
hole’ state, i.e. they correspond to the removal of an electron from a single
orbital that is doubly occupied in the neutral, i.e. in HOMO or lower, but
without populating the LUMO (see figure 6.2). Ionic states with energies
above the ground ionic D0 state close to or larger than the HOMO-LUMO gap
have configurations that include an electron in the LUMO. The lowest five
ionic states (D0-D4), shown in figure 6.2, each have only one singly occupied
orbital (’single hole’ states). This makes the Dyson amplitude for ionization
83

HOMO-4D0 D5D4D3D2D1 D6
HOMO-3HOMO-2HOMO-1HOMOLUMO
Figure 6.2: Electronic configurations of the lowest seven ionic states of uracil.
from the ground state of the neutral (S0) to one of these states large, it is
correlated with the single-hole states D0-D4.
In contrast to S0, the configurations of excited states S1 and S2, which
are accessible in our experiments, correspond to singly occupied HOMO or
HOMO-1 and LUMO orbital. The one-electron orbitals that are used there
have been named (HOMO, HOMO-1, LUMO, etc.) according to their ordering
in the neutral molecule. When the Scrodinger equation is solved for the cation,
the ordering of the orbitals can switch, and this happens in uracil. The ionic
orbitals are not the ’same’ as those of the neutral, and the naming is carried
over from the neutral based on the one-electron orbitals’ similarities in shape
between the two species. This is how it is possible to have a HOMO-1 hole in
the ground ionic state.
Both S1 and S2 are only correlated with a single ionic state that has one
singly occupied orbital. In S2, which corresponds to a HOMO→LUMO exci-
tation, removing the LUMO electron would leave the molecule in the ground
state of the ion, which has a single hole in the HOMO orbital. Removing any
other electron leaves the molecule either in a state with three unpaired elec-
trons or a highly excited state with a double hole in the HOMO. The lowest
lying states that are correlated (in the Dyson sense) with S2 are D5 and D6,
each with three unpaired electrons (see figure 6.2).
Removing the LUMO electron from S1, which corresponds to HOMO-
1→LUMO excitation, leaves the molecule in the first excited state of the
cation, which has a hole in the HOMO orbital. Thus both S1 and S2 are
only Dyson-correlated with with one of the lowest five ionic states (D1 in the
case of S1, and D0 in the case of S2). Any observation of ionization of either the
S1 to D1 - D4 or of the S2 leading to cationic states D1 - D4 would thus consti-
84
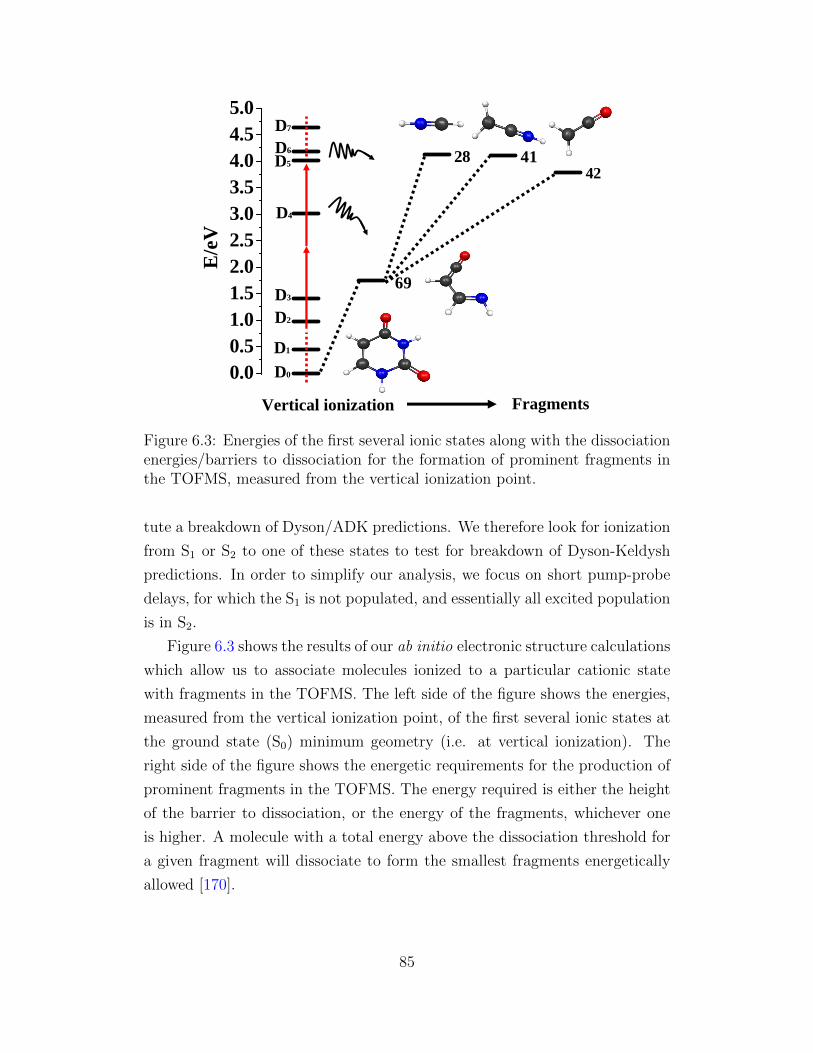
0.00.51.01.52.02.53.03.54.04.55.0
D7
D6
D5
D4
D3
D1
D0
D2
E/e
V
4142
28
Vertical ionization Fragments
69
Figure 6.3: Energies of the first several ionic states along with the dissociationenergies/barriers to dissociation for the formation of prominent fragments inthe TOFMS, measured from the vertical ionization point.
tute a breakdown of Dyson/ADK predictions. We therefore look for ionization
from S1 or S2 to one of these states to test for breakdown of Dyson-Keldysh
predictions. In order to simplify our analysis, we focus on short pump-probe
delays, for which the S1 is not populated, and essentially all excited population
is in S2.
Figure 6.3 shows the results of our ab initio electronic structure calculations
which allow us to associate molecules ionized to a particular cationic state
with fragments in the TOFMS. The left side of the figure shows the energies,
measured from the vertical ionization point, of the first several ionic states at
the ground state (S0) minimum geometry (i.e. at vertical ionization). The
right side of the figure shows the energetic requirements for the production of
prominent fragments in the TOFMS. The energy required is either the height
of the barrier to dissociation, or the energy of the fragments, whichever one
is higher. A molecule with a total energy above the dissociation threshold for
a given fragment will dissociate to form the smallest fragments energetically
allowed [170].
85

D3−D4 D2−D4 D1−D40
0.4
0.8
1.2
69 a
mu / p
are
nt
Dyson−Keldysh
S0
S2
D3−D4 D2−D4 D1−D4
MO−ADK
D3−D4 D2−D4 D1−D4
TD−RIS
Figure 6.4: Predicted 69/112 ratios for positive (S2) and negative (S0) timedelays for the Dyson-Keldysh, MO-ADK and TD-RIS calculations consideringdifferent combinations of ionic states leading to fragment 69.
Figure 6.3 also shows that the production of fragment at mass 69 amu indi-
cates ionization to D4, which lies about 2 eV above D0, and is one of the states
that are Dyson forbidden from S2. However, a molecule with some vibrational
kinetic energy can dissociate to produce this fragment even when ionized to
some of the states lying below the fragment 69 dissociation threshold. The
molecule can acquire the kinetic energy in moving away from the Franck Con-
don (FC) region on S2, or the molecule can have some energy stored in other
degrees of freedom (being at finite temperature). In order to determine which
of the ionic states below D4 can produce the 69 amu fragment, we look at
the energy the molecule can acquire through relaxation on the S2 potential
and the thermal energy stored in the molecules at temperatures used in our
experiments. Relaxation from the Franck-Condon region to the S2 minimum
leads to a gain of up to 0.5 eV in vibrational kinetic energy [112, 171]. As
for the thermal energy that can be stored in vibrations of the molecule, we
based our estimates on the results of Baer at al. [170]. They find that the
energy required for dissociative ionization of room temperature halogenated
methanes is about 0.15 eV below the dissociation limit. Based on the larger
number of degrees of freedom of uracil (30 as opposed to 9), and the higher
86
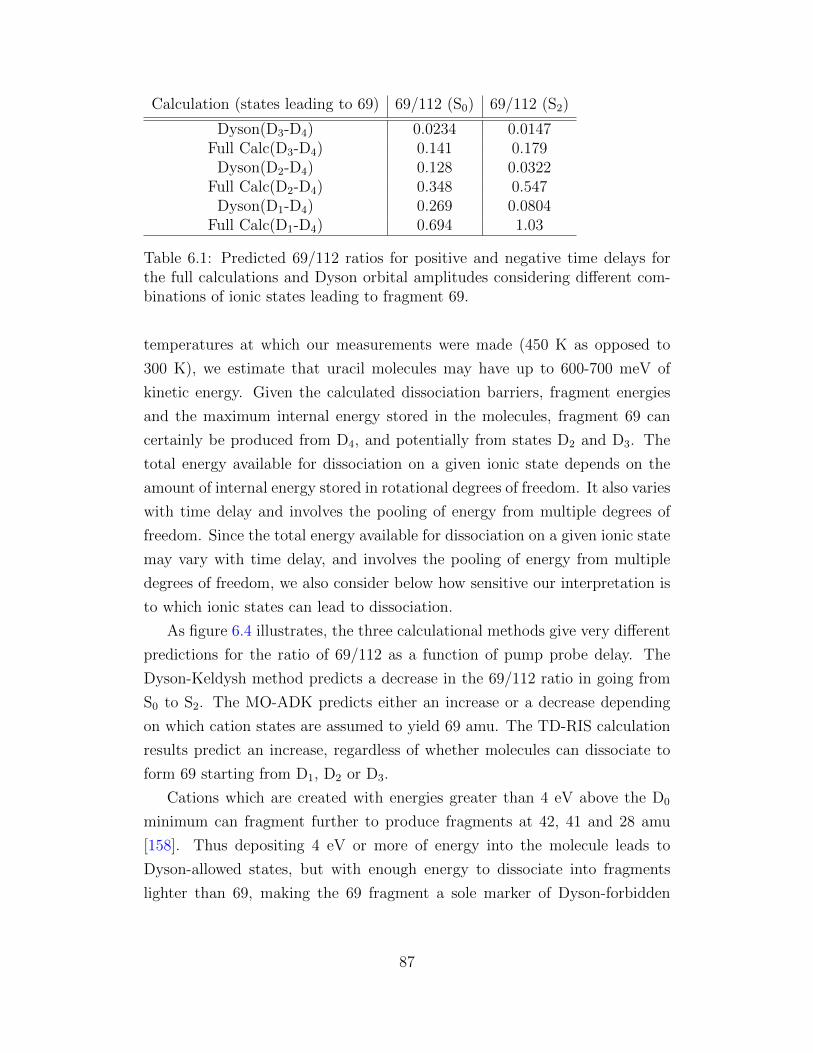
Calculation (states leading to 69) 69/112 (S0) 69/112 (S2)
Dyson(D3-D4) 0.0234 0.0147Full Calc(D3-D4) 0.141 0.179
Dyson(D2-D4) 0.128 0.0322Full Calc(D2-D4) 0.348 0.547
Dyson(D1-D4) 0.269 0.0804Full Calc(D1-D4) 0.694 1.03
Table 6.1: Predicted 69/112 ratios for positive and negative time delays forthe full calculations and Dyson orbital amplitudes considering different com-binations of ionic states leading to fragment 69.
temperatures at which our measurements were made (450 K as opposed to
300 K), we estimate that uracil molecules may have up to 600-700 meV of
kinetic energy. Given the calculated dissociation barriers, fragment energies
and the maximum internal energy stored in the molecules, fragment 69 can
certainly be produced from D4, and potentially from states D2 and D3. The
total energy available for dissociation on a given ionic state depends on the
amount of internal energy stored in rotational degrees of freedom. It also varies
with time delay and involves the pooling of energy from multiple degrees of
freedom. Since the total energy available for dissociation on a given ionic state
may vary with time delay, and involves the pooling of energy from multiple
degrees of freedom, we also consider below how sensitive our interpretation is
to which ionic states can lead to dissociation.
As figure 6.4 illustrates, the three calculational methods give very different
predictions for the ratio of 69/112 as a function of pump probe delay. The
Dyson-Keldysh method predicts a decrease in the 69/112 ratio in going from
S0 to S2. The MO-ADK predicts either an increase or a decrease depending
on which cation states are assumed to yield 69 amu. The TD-RIS calculation
results predict an increase, regardless of whether molecules can dissociate to
form 69 starting from D1, D2 or D3.
Cations which are created with energies greater than 4 eV above the D0
minimum can fragment further to produce fragments at 42, 41 and 28 amu
[158]. Thus depositing 4 eV or more of energy into the molecule leads to
Dyson-allowed states, but with enough energy to dissociate into fragments
lighter than 69, making the 69 fragment a sole marker of Dyson-forbidden
87

0.2
0.4
0.6
0.8
1
30
210
60
240
90
270
120
300
150
330
180 0
69 amu112 amu42 amu41 amu28 amu
Figure 6.5: Dependence of pump probe ion signals on the relative polarizationof the pump and the probe beams. Fragments originating from the same ionicstate show the same angular dependence.
transitions. As the calculations only provide relative yields, the most sensitive
probe of the calculations at our disposal is the change in 69/112 in going from
S0 to S2. Thus by looking at how the ratio of the 69 to parent ion yield changes
with time delay (i.e. ionizing from S0 for negative delays and S2 for positive
delays) we can test the Dyson orbital amplitudes for ionization from S2.
As a check of our interpretation of the ab initio electronic structure calcu-
lations, we measured the fragment ion yields as a function of the angle between
the pump and probe polarization vectors. We expect that any fragments which
originate from ionization to the same ionic state should show the same angle
dependent yields, whereas fragments originating from ionization to a differ-
ent ionic state should show different angle dependent yields. Therefore, we
expected that fragments 28, 41 and 42 should have the same angle depen-
dent yields if they are generated by ionizing to D5 or D6, but they should be
different from 69 and the parent ion if these fragments originate from D2-D4
and D0-D1 respectively. As figure 6.5 shows, these expectations are borne out,
corroborating our interpretation outlined above. These observations are con-
sistent with the time dependent yields, which are the same for 28,41 and 42
88

but different from 69 and 112.
Figure 6.7, shows the measured ratio 69 amu/parent for ionization by the
IR pulse alone, corresponding to ionization of S0, and for ionization by the IR
pulse preceded by the UV pulse, corresponding to ionization of S2. Both are
shown as a function of probe power. For ionization from S2, the ratio of 69
to parent increases with increasing IR intensity, as the ionization of orbitals
below the HOMO becomes easier, and rolls over as the ionization of HOMO
becomes saturated. Ionization from S0 starts to exhibit a similar rise in the
fragment to parent ratio at much higher probe intensities. At lower probe
intensities, where the ionization process is not in the tunneling regime and
the ADK picture breaks down, this ratio remains constant. This is consistent
with calculated ionization yields reported in [172]. At the lowest pump probe
intensities, the signal to noise ratio becomes too low to measure any ion signal.
−200 0 200 400 600 8000
0.5
1
Delay [fs]
Ion
Sig
nal [
arb.
]
−200 0 200 400 600 800
1
2
3
Mas
s 69
/ pa
rent
sig
nal
Parent69 amu
parent /69 amu
Figure 6.6: Pump-probe ion signals for the parent (blue solid line) and 69 amu(green solid line), and their ratio (red dashed line)
The dashed horizontal lines in figure 6.7, show the TD-RIS calculation
results for the 69/parent ratio. The dash-dotted horizontal lines show the the
69/parent ratio obtained by evaluating the Dyson orbital overlaps weighted
by the tunneling exponent. Both calculation were performed at fixed probe
intensity of 30 TW/cm2. The Dyson-Keldysh and the TD-RIS calculations give
opposite predictions for how the the 69/112 ratio changes in going from S0 to S2
89
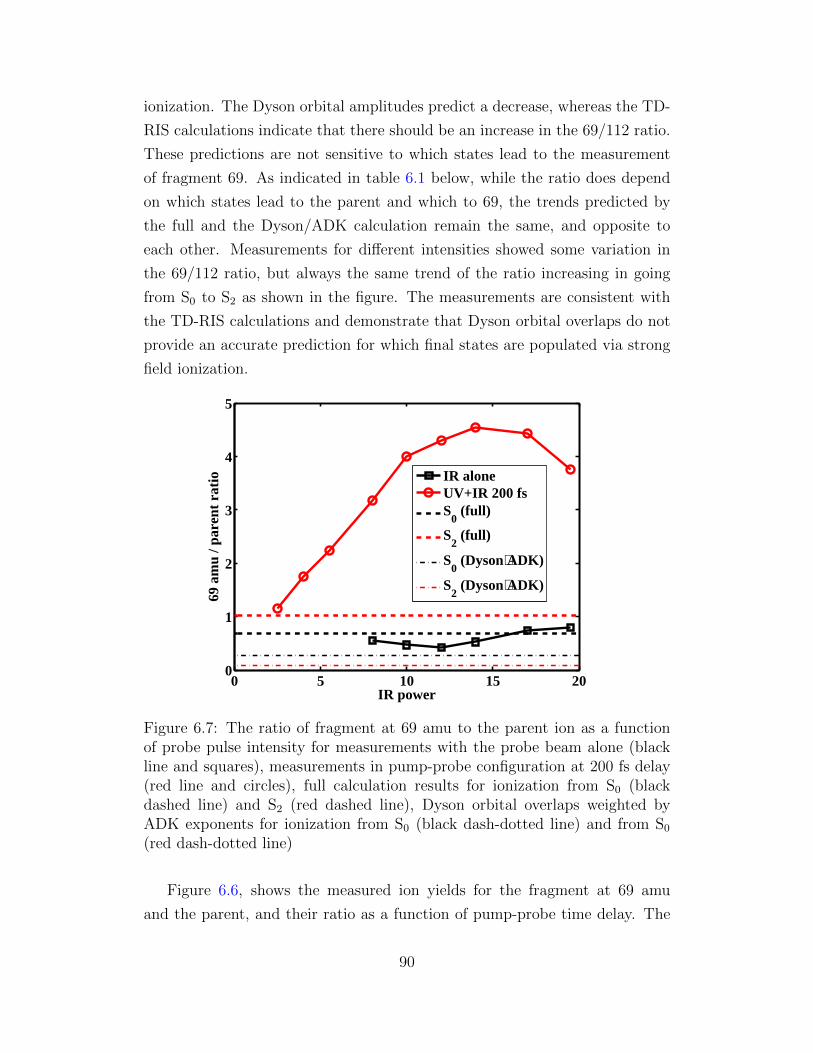
ionization. The Dyson orbital amplitudes predict a decrease, whereas the TD-
RIS calculations indicate that there should be an increase in the 69/112 ratio.
These predictions are not sensitive to which states lead to the measurement
of fragment 69. As indicated in table 6.1 below, while the ratio does depend
on which states lead to the parent and which to 69, the trends predicted by
the full and the Dyson/ADK calculation remain the same, and opposite to
each other. Measurements for different intensities showed some variation in
the 69/112 ratio, but always the same trend of the ratio increasing in going
from S0 to S2 as shown in the figure. The measurements are consistent with
the TD-RIS calculations and demonstrate that Dyson orbital overlaps do not
provide an accurate prediction for which final states are populated via strong
field ionization.
0 5 10 15 200
1
2
3
4
5
IR power
69 a
mu
/ par
ent
rati
o
IR aloneUV+IR 200 fsS
0 (full)
S2 (full)
S0 (Dyson⋅ADK)
S2 (Dyson⋅ADK)
Figure 6.7: The ratio of fragment at 69 amu to the parent ion as a functionof probe pulse intensity for measurements with the probe beam alone (blackline and squares), measurements in pump-probe configuration at 200 fs delay(red line and circles), full calculation results for ionization from S0 (blackdashed line) and S2 (red dashed line), Dyson orbital overlaps weighted byADK exponents for ionization from S0 (black dash-dotted line) and from S0
(red dash-dotted line)
Figure 6.6, shows the measured ion yields for the fragment at 69 amu
and the parent, and their ratio as a function of pump-probe time delay. The
90

measurements were performed with a probe intensity comparable to the one
used for calculations. We note that the ratio of 69 to parent starts increasing
as soon as the pumping field is turned on, and rises sharply on a timescale
of about 100 fs. As the molecule relaxes and its electronic energy is being
converted to vibrational energy, additional ionization channels start to lead to
fragmentation to 69 amu. The S1 state starts to get populated, too. Both of
these effects lead to a slow increase in the 69 to parent ratio on timescales of
hundreds of femtoseconds to a few picoseconds.
While the calculations agree with the measurements in predicting an in-
crease in the 69/112 ratio as a function of time delay, the calculations generally
predict a smaller ratio for both positive and negative delays than measured.
One factor that may be contributing to this discrepancy is that the calcula-
tions do not include laser driven coupling between different ionic states. These
can play a role in uracil, since there is a resonance between D0 and D3, which
is about 1.6 eV above D0) [173].
6.5 Conclusions
We demonstrate the breakdown of Dyson orbital amplitudes in predicting final
state distributions for strong field ionization of uracil. Fragment 69 becomes
the dominant fragment in mass spectrum, despite being produced from the
Dyson “forbidden” ionic states D2-D4. Multielectron calculations which utilize
a more detailed treatment of the electron-ion interaction give the ionization
yield to different electronic states of the cation that is qualitative agreement
with our strong-field ionization measurements.
91

Chapter 7
Conclusions
In this thesis, we explored several aspects of molecular strong-field ionization.
We began by describing the apparatus that that was used to produce, shape
and characterize the UV and IR pulses needed to implement the UV-pump,
IR-probe pulse sequence that was used in all the experiments. The vacuum
equipment used to enable the interaction of the molecules and the pulses was
described as well.
The sensitivity of strong-field to molecular conformation was utilized in ex-
periments presented in chapter 3. It provided the basis for a learning control
scheme that was devised with an aim of studying the photochemical isomer-
ization reaction of cyclohexadiene. We were able to control the branching of
an excited state wavepacket at a point of intersection of two potential energy
surfaces. Controlling this branching ratio effected the control over which final
product of the reaction was created.
Extending the approach to studying the molecular dynamics by monitoring
the change in strong-field ionization yields with the change in molecular confor-
mation, we turned to the excited state relaxation of nucleic bases in chapter 4.
The change in the orbital shape that accompanies the relaxation proved instru-
mental in interpreting the data presented in this chapter. While it was known
that the nucleic bases relax rapidly, it was not clear whether one or more of
the accessible pathways are utilized. Our time- and mass-resolved ion yields
revealed multiple timescales, and the association of molecular fragments with
geometries enabled us to reveal the non-local nature of the relaxation process.
Turning to exploring the intrinsic properties of strong-field ionization, in
92

chapter 5 we explored how this process depends on the molecular orbital from
which an electron was removed. Our angle-resolved pump-probe ionization
yield measurements show that this process occurs without a rearrangement of
the other electrons in the molecule. In contrast, ionization through removal of
a deeper-lying electron, which generally leads to an excited state of the ion,
was observed to be accompanied by a relaxation of the electrons.
In chapter 6, we looked into the possibilities of predicting the final state(s)
of the ionization process from a known initial molecular state. Our system
of choice was uracil, and we looked at the way the predicted ionization yields
change as the molecules is excited from its ground state to a bright excited
state. These methods were the Dyson-Keldysh method, based on the strong-
field approximation, the molecular ADK method, and the time-dependent,
resolution-in-ionic-states (TD-RIS) method developed by our collaborators.
The three methods are compared to our strong-field ionization measurements.
The best agreement was found between the TD-RIS method and the experi-
mental data.
The work presented in this thesis is currently being extended on several
fronts. Theoretical work, performed by our collaborators at Temple University,
aimed at expanding our understanding of the physical processes leading to
the delocalization of an excited state wavepacket is currently underway. In
addition, the influence of the shape of the molecular wavefunction on the angle
resolved ionization yields is currently being used to track the dissociation of
CH2IBr. The dissociation of this molecule is accompanied by a rotation of
one of its fragments in the lab frame. Consequently the position of the nodes
of the molecular orbital also shifts in a fixed frame, leading to an observable
effect.
93

Bibliography
[1] T.H. Maiman. Stimulated optical radiation in ruby. Nature, 1960.
[2] DE Spence, P.N. Kean, and W. Sibbett. 60-fsec pulse generation from
a self-mode-locked ti: sapphire laser. Optics letters, 16(1):42–44, 1991.
[3] D. Strickland and G. Mourou. Compression of amplified chirped optical
pulses. Optics Communications, 55(6):447–449, 1985.
[4] P.H. Bucksbaum. The future of attosecond spectroscopy. Science,
317(5839):766–769, 2007.
[5] E. Goulielmakis, Z. H. Loh, A. Wirth, R. Santra, N. Rohringer,
V. S. Yakovlev, S. Zherebtsov, T. Pfeifer, A. M. Azzeer, M. F. Kling,
et al. Real-time observation of valence electron motion. Nature,
466(7307):739–743, 2010.
[6] M. F. Kling and M. J. J. Vrakking. Attosecond Electron Dynamics.
Annu. Rev. Phys. Chem., 59:463–492, 2008.
[7] S. Baker, J. S. Robinson, C. A. Haworth, H. Teng, R. A. Smith, C. C.
Chirila, M. Lein, J. W. G. Tisch, and J. P. Marangos. Probing proton dy-
namics in molecules on an attosecond time scale. Science, 312(5772):424,
2006.
[8] S. Haessler, J. Caillat, W. Boutu, C. Giovanetti-Teixeira, T. Ruchon,
T. Auguste, Z. Diveki, P. Breger, A. Maquet, B. Carre, R Taıeb, and
P. Salieres. Attosecond imaging of molecular electronic wavepackets.
Nat. Phys, 6(3):200–206, 2010.
94

[9] J. Itatani, J. Levesque, D. Zeidler, Hiromichi Niikura, H. Pepin, J. C.
Kieffer, P. B. Corkum, and D. M. Villeneuve. Tomographic imaging of
molecular orbitals. Nature, 432(7019):867–871, 2004.
[10] Manfred Lein. Molecular imaging using recolliding electrons. Journal of
Physics B: Atomic, Molecular and Optical Physics, 40(16):R135, 2007.
[11] O. Smirnova, Y. Mairesse, S. Patchkovskii, N. Dudovich, D. Villeneuve,
P. Corkum, and M.Y. Ivanov. High harmonic interferometry of multi-
electron dynamics in molecules. Nature, 460(7258):972–977, 2009.
[12] L. V. Keldysh. Ionization in the field of a strong electromagnetic wave.
Sov. Phys. JETP, 20:1307, 1965.
[13] M.Y. Ivanov, M. Spanner, and O. Smirnova. Anatomy of strong field
ionization. Journal of Modern Optics, 52(2-3):165–184, 2005.
[14] P. Agostini, F. Fabre, G. Mainfray, G. Petite, and NK Rahman. Free-
free transitions following six-photon ionization of xenon atoms. Physical
Review Letters, 42(17):1127–1130, 1979.
[15] S. Augst, D. Strickland, DD Meyerhofer, SL Chin, and JH Eberly. Tun-
neling ionization of noble gases in a high-intensity laser field. Physical
review letters, 63(20):2212–2215, 1989.
[16] R.H. Fowler and L. Nordheim. Electron emission in intense electric fields.
Proceedings of the Royal Society of London., 119(781):173–181, 1928.
[17] J. R. Oppenheimer. Three notes on the quantum theory of aperiodic
effects. Phys. Rev., 31:66–81, Jan 1928.
[18] JR Oppenheimer. On the quantum theory of the autoelectric field cur-
rents. Proceedings of the National Academy of Sciences of the United
States of America, 14(5):363, 1928.
[19] AM Perelomov, VS Popov, and MV Terent’ev. Ionization of atoms in an
alternating electric field. Soviet Journal of Experimental and Theoretical
Physics, 23:924, 1966.
95

[20] M. V. Ammosov, N. B. Delone, and V. P. Krainov. Tunnel ionization
of complex atoms and of atomic ions in an alternating electromagnetic
field. Sov. Phys. JETP, 64:1191, 1986.
[21] F. H. M. Faisal. Multiple absorption of laser photons by atoms. J. Phys.
B., 6:L89, 1973.
[22] H. R. Reiss. Effect of an intense electromagnetic-field on a weakly bound
system. Phys. Rev. A, 22:1786, 1980.
[23] J. Muth-Bohm, A. Becker, and F. H. M. Faisal. Suppressed molecular
ionization for a class of diatomics in intense femtosecond laser fields.
Phys. Rev. Lett., 85:2280–2283, Sep 2000.
[24] A. Becker and F.H.M. Faisal. Intense-field many-body s-matrix theory.
Journal of Physics B: Atomic, Molecular and Optical Physics, 38:R1,
2005.
[25] M.J. DeWitt and R.J. Levis. Concerning the ionization of large
polyatomic molecules with intense ultrafast lasers. J. Chem. Phys.,
110:11368, 1999.
[26] X. M. Tong, Z. X. Zhao, and C. D. Lin. Theory of molecular tunneling
ionization. Phys. Rev. A, 66:033402, Sep 2002.
[27] M. Baer. Beyond Born-Oppenheimer: electronic nonadiabatic coupling
terms and conical intersections. Wiley-Interscience, 2006.
[28] Bruce Alberts, Alexander Johnson, Julian Lewis, Martin Raff, Keith
Roberts, and Peter Walter. Molecular Biology of the Cell. Garland
Science, 2002.
[29] H. R. Hudock and T. J. Martinez. Excited-State Dynamics of Cytosine
Reveal Multiple Intrinsic Subpicosecond Pathways. Chem.Phys.Chem.,
9:2486–2490, 2008.
[30] G. N. Gibson, R. R. Freeman, and T. J. McIlrath. Dynamics of the high-
intensity multiphoton ionization of N2. Phys. Rev. Lett., 67(10):1230–
1233, 1991.
96

[31] M. Kotur, T. Weinacht, B.J. Pearson, and S. Matsika. Closed-loop learn-
ing control of isomerization using shaped ultrafast laser pulses in the deep
ultraviolet. The Journal of chemical physics, 130:134311, 2009.
[32] M. Kotur, T.C. Weinacht, C. Zhou, and S. Matsika. Following Ultrafast
Radiationless Relaxation Dynamics With Strong Field Dissociative Ion-
ization: A Comparison Between Adenine, Uracil, and Cytosine. IEEE
J. Sel. Top. Quantum Electron, (99):1–8, 2011.
[33] M. Kotur, T.C. Weinacht, C. Zhou, K.A. Kistler, and S. Matsika. Distin-
guishing between relaxation pathways by combining dissociative ioniza-
tion pump probe spectroscopy and ab initio calculations: A case study
of cytosine. J. Chem. Phys., 134:184309, 2011.
[34] Marija Kotur, Thomas C. Weinacht, Congyi Zhou, and Spiridoula Mat-
sika. Strong-field molecular ionization from multiple orbitals. Phys. Rev.
X, 1:021010, 2011.
[35] Marija Kotur, Thomas C. Weinacht, Congyi Zhou, Spiridoula Matsika,
Serguei Patchkovskii, and Michael Spanner. Role of electronic state
correlation in strong field molecular ionization. (submitted), 2012.
[36] P.H. Nuernberger. Design and construction of an apparatus for the neu-
tral dissociation and ionization of molecules in an intense laser field.
Master’s thesis, Stony Brook University, 2003.
[37] Sterling Backus, Charles G. Durfee, III, Margaret M. Murnane, and
Henry C. Kapteyn. High power ultrafast lasers. Rev. Sci. Inst.,
69(3):1207–1223, 1998.
[38] Rick Trebino, Kenneth W. DeLong, David N. Fittinghoff, John N.
Sweetser, Marco A. Krumbugel, Bruce A. Richman, and Daniel J. Kane.
Measuring ultrashort laser pulses in the time-frequency domain using
frequency-resolved optical gating. Rev. Sci. Inst., 68(9):3277–3295, 1997.
[39] D. P. M. Geissler. Concerted elimination of Cl+2 from CCl4 and of I+2
from CH2I2 driven by intense ultrafast laser pulses. Master’s thesis,
Stony Brook University, 2007.
97
[40] A. M. Weiner. Femtosecond optical pulse shaping and processing.
Progress in Quantum Electronics, 19(3):161–237, 1995.
[41] Brett J. Pearson and Thomas C. Weinacht. Shaped ultrafast laser pulses
in the deep ultraviolet. Opt. Express, 15(7):4385–4388, 2007.
[42] R. Trebino and D.J. Kane. Using phase retrieval to measure the intensity
and phase of ultrashort pulses: frequency-resolved optical gating. JOSA
A, 10(5):1101–1111, 1993.
[43] Florian Langhojer, David Cardoza, Mark Baertschy, and Thomas
Weinacht. Gaining mechanistic insight from closed loop learning con-
trol: The importance of basis in searching the phase space. J. Chem.
Phys., 122:014102, 2005.
[44] D.M. Neumark. Time-resolved photoelectron spectroscopy of molecules
and clusters. Annual Review of Physical Chemistry, 52(1):255–277, 2001.
[45] S. Patchkovskii, Z. Zhao, T. Brabec, and D.M. Villeneuve. High har-
monic generation and molecular orbital tomography in multielectron sys-
tems: Beyond the single active electron approximation. Phys. Rev. Lett.,
97(12):123003, 2006.
[46] C.-H. Tseng. Ultrafast Coherent Control Spectroscopy. PhD thesis, Stony
Brook University, 2012.
[47] W. Zielenkiewicz. Enthalpies of sublimation and vapor pressures of
adenine, 1-methyladenine, 2-methyladenine, 3-methyladenine, and 8-
methyladenine. Journal of Chemical & Engineering Data, 45(4):626–629,
2000.
[48] L.B. Clark, G.G. Peschel, and I. Tinoco Jr. Vapor spectra and heats
of vaporization of some purine and pyrimidine bases1. The Journal of
Physical Chemistry, 69(10):3615–3618, 1965.
[49] D. Ferro, L. Bencivenni, R. Teghil, and R. Mastromarino. Vapour pres-
sures and sublimation enthalpies of thymine and cytosine. Thermochim-
ica Acta, 42(1):75–83, 1980.
98

[50] G. Bardi, L. Bencivenni, D. Ferro, B. Martini, S. Nunziante Cesaro, and
R. Teghil. Thermodynamic study of the vaporization of uracil. Ther-
mochimica Acta, 40(2):275–282, 1980.
[51] Richard S. Judson and Herschel Rabitz. Teaching lasers to control
molecules. Phys. Rev. Lett., 68(10):1500–1503, 1992.
[52] L. Davis and M. Mitchell. Handbook of genetic algorithms. Van Nostrand
Reinhold, 1991.
[53] S. A. Trushin, W. Fuß, T. Schikarski, W. E. Schmid, and K. L. Kompa.
Femtosecond photochemical ring opening of 1,3-cyclohexadiene studied
by time-resolved intense-field ionization. J. Chem. Phys., 106(22):9386–
9389, 1997.
[54] R. W. Schoenlein, L. A. Peteanu, R. A. Mathies, and C. V. Shank. The
first step in vision: femtosecond isomerization of rhodopsin. Science,
254:412, 1991.
[55] M. J. Pilling and S. Robertson. Master equation models for chemical
reactions of importance in combustion. Ann. Rev. Phys. Chem., 54:245–
275, 2003.
[56] B. G. Levine and T. J. Martinez. Isomerization through conical inter-
sections. Ann. Rev. Phys. Chem., 58:613, 2007.
[57] Wing Tsang. Progress in the development of combustion kinetics
databases for liquid fuels. Data Science Journal, 3:1, 2004.
[58] Suhail P. Shah and Stuart A. Rice. Controlling quantum wavepacket
motion in reduced-dimensional spaces: reaction path analysis in optimal
control of hcn isomerization. Faraday Discuss., 113:319–331, 1999.
[59] Valentyn I. Prokhorenko, Andrea M. Nagy, Stephen A. Waschuk,
Leonid S. Brown, Robert R. Birge, and R. J. Dwayne Miller. Coherent
control of retinal isomerization in bacteriorhodopsin. Science, 313:1257,
2006.
99

[60] Hiroyuki Tamura, Shinkoh Nanbu, Toshimasa Ishida, and Hiroki Naka-
mura. Laser control of reactions of photoswitching functional molecules.
J. Chem. Phys., 125(3):034307, 2006.
[61] G. Vogt, G. Krampert, P. Niklaus, P. Nuernberger, and G. Gerber. Op-
timal control of photoisomerization. Phys. Rev. Lett., 94:068305, 2005.
[62] Benjamin Dietzek, Ben Bruggemann, Torbjorn Pascher, and Arkady
Yartsev. Mechanisms of molecular response in the optimal control of
photoisomerization. Phys. Rev. Lett., 97(25):258301, 2006.
[63] Elizabeth C. Carroll, James L. White, Andrei C. Florean, Philip H.
Bucksbaum, and Roseanne J. Sension. Multiphoton control of the 1,3-
cyclohexadiene ring-opening reaction in the presence of competing sol-
vent reactions. J. Phys. Chem. A, 112(30):6811–6822, 2008.
[64] E. C. Carroll, B. J. Pearson, A. C. Florean, P. H. Bucksbaum, and
Roseanne J. Sension. Spectral phase effects on nonlinear resonant
photochemistry of 1,3-cyclohexadiene in solution. J. Chem. Phys.,
124(11):114506, 2006.
[65] Kunihito Hoki and Paul Brumer. Mechanisms in adaptive feedback con-
trol: Photoisomerization in a liquid. Phys. Rev. Lett., 95:168305, 2005.
[66] W. Fuß, W. E. Schmid, and S. A. Trushin. Time-resolved dissocia-
tive intense-laser field ionization for probing dynamics: Femtosecond
photochemical ring opening of 1,3-cyclohexadiene. J. Chem. Phys.,
112(19):8347–8362, 2000.
[67] P. Celani, F. Bernardi, M.A. Robb, and M. Olivucci. Do photochem-
ical ring-openings occur in the spectroscopic state? 1B2 pathways for
the cyclohexadiene/hexatriene photochemical interconversion. J. Phys.
Chem., 100(50):19364–19366, 1996.
[68] Suart H. Pullen, Neil A. Anderson, Larry A. Walker, II, and Roseanne J.
Sension. The ultrafast photochemical ring-opening reaction of 1,3-
cyclohexadiene in cyclohexane. J. Chem. Phys., 108:556–563, 1998.
100

[69] Angelika Hofmann and Regina de Vivie-Riedle. Quantum dynamics of
photoexcited cyclohexadiene introducing reactive coordinates. J. Chem.
Phys., 112(11):5054–5059, 2000.
[70] M. Garavelli, C. S. Page, P. Celani, M. Olivucci, W. E. Schmid, S. A.
Trushin, and W. Fuß. Reaction path of a sub-200 fs photochemical
electrocyclic reaction. J. Phys. Chem. A, 105:4458–4469, 2001.
[71] Hiroyuki Tamura, Shinkoh Nanbu, Toshimasa Ishida, and Hiroki
Nakamura. Ab initio nonadiabatic quantum dynamics of cyclo-
hexadiene/hexatriene ultrafast photoisomerization. J. Chem. Phys.,
124(8):084313, 2006.
[72] Narayanan Kuthirummal, Fedor M. Rudakov, Conor L. Evans, and Pe-
ter M. Weber. Spectroscopy and femtosecond dynamics of the ring
opening reaction of 1,3-cyclohexadiene. J. Chem. Phys., 125(13):133307,
2006.
[73] H. J. C. Jacobs and E. Havinga. Photochemistry of vitamin d and its
isomers and of simple trienes. Advan. Photochem., 11:305–373, 1979.
[74] D. C. Cardoza. Understanding and Applying Learning Control to Molec-
ular Fragmentation. PhD thesis, Stony Brook University, 2006.
[75] JM Geremia, W. Zhu, and H. Rabitz. Incorporating physical imple-
mentation concerns into closed loop quantum control experiments. The
Journal of Chemical Physics, 113:10841, 2000.
[76] A. Szabo and N. S. Ostlund. Modern quantum chemistry: introduction
to advanced electronic structure theory. Dover Pubns, 1996.
[77] H. Lischka, R. Shepard, R. M. Pitzer, I. Shavitt, M. Dallos, Th. Muller,
P. G. Szalay, M. Seth, G. S. Kedziora, S. Yabushita, and Z. Zhang.
High-level multireference methods in the quantum-chemistry program
system COLUMBUS: Analytic MR-CISD and MR-AQCC gradients and
MR-AQCC-LRT for excited states, GUGA spin-orbit CI and parallel CI
density. Phys. Chem. Chem. Phys., 3:664, 2001.
101

[78] H. Lischka, R. Shepard, I. Shavitt, R. M. Pitzer, M. Dallos, Th. Muller,
P. G. Szalay, F. B. Brown, R. Ahlrichs, H. J. Bohm, A. Chang, D. C.
Comeau, R. Gdanitz, H. Dachsel, C. Ehrhardt, M. Ernzerhof, P. Hchtl,
S. Irle, G. Kedziora, T. Kovar, V. Parasuk, M. J. M. Pepper, P. Scharf,
H. Schiffer, M. Schindler, M. Schler, M. Seth, E. A. Stahlberg, J.-G.
Zhao, S. Yabushita, Z. Zhang, M. Barbatti, S. Matsika, M. Schuur-
mann, D. R. Yarkony, S. R. Brozell, E. V. Beck, , and J.-P. Blaudeau.
Columbus, an ab initio electronic structure program, release 5.9.1. 2006.
[79] M. W. Schmidt, K. K. Baldridge, J. A. Boatz, S. T. Elbert, M. S. Gordon,
J. H. Jensen, S. Koseki, N. Matsunaga, K. A. Nguyen, S. Su, T. L.
Windus, M. Dupuis, and J.. A. Montgomery. Computation of Conical
Intersections by Using Perturbation Techniques. J. Comput. Chem.,
14:1347, 1993.
[80] JL White, J. Kim, VS Petrovic, and PH Bucksbaum. Ultrafast ring
opening in 1, 3-cyclohexadiene investigated by simplex-based spectral
unmixing. Journal of Chemical Physics, 136(5):54303, 2012.
[81] Brett J. Pearson, Sarah R. Nichols, and Thomas Weinacht. Molecular
fragmentation driven by ultrafast dynamic ionic resonances. J. Chem.
Phys., 127(13):131101, 2007.
[82] S. Lochbrunner, W. Fuß, W.E. Schmid, and K. L. Kompa. Electronic
relaxation and ground-state dynamics of 1,3-cyclohexadiene and cis-
hexatriene in ethanol. J. Phys. Chem. A, 102(47):9334–9344, 1998.
[83] Robert C. Dunbar and Harry Ho-I Teng. Photodissociation spectroscopy
of hexatriene cations. J. Am. Chem. Soc., 100(8):2279–2283, 1978.
[84] M. Allan, J. Dannacher, and J. P. Maier. Radiative and fragmentation
decay of the cations of trans- and cis-1,3,5-hexatriene and of all trans-
1,3,5-heptatriene in the a-tilde(pi [sup - 1]) states, studied by emission
and photoelectron–photoion coincidence spectroscopy. J. Chem. Phys.,
73(7):3114–3122, 1980.
[85] M. P. Fulscher, S. Matzinger, and T. Bally. Excited states in polyene rad-
102

ical cations. an ab initio theoretical study. Chem. Phys. Lett., 236:167–
176, 1995.
[86] Manuel Joffre. Comment on ”Coherent control of retinal isomerization
in bacteriorhodopsin”. Science, 317(5837):453, 2007.
[87] Valentyn I. Prokhorenko, Andrea M. Nagy, Stephen A. Waschuk,
Leonid S. Brown, Robert R. Birge, and R. J. Dwayne Miller. Response
to comment on ”Coherent control of retinal isomerization in bacteri-
orhodopsin”. Science, 317(5837):453, 2007.
[88] Dorothee Geppert and Regina de Vivie-Riedle. Reaction velocity control
by manipulating the momentum of a nuclear wavepacket with phase-
sensitive optimal control theory. Chem. Phys. Lett., 404:289–295, 2005.
[89] K. Kosma, SA Trushin, W. Fuss, and WE Schmid. Cyclohexadiene ring
opening observed with 13 fs resolution: coherent oscillations confirm the
reaction path. Phys. Chem. Chem. Phys., 11(1):172–181, 2008.
[90] P. R. Callis. Electronic States and Luminescence of Nucleic Acid Sys-
tems. Ann. Rev. Phys. Chem., 34:329, 1983.
[91] Carlos E. Crespo-Hernndez, Boiko Cohen, Patrick M. Hare, and Bern
Kohler. Ultrafast excited-state dynamics in nucleic acids. Chem. Rev.,
104(4):1977–2020, 2004.
[92] C. T. Middleton, K. de La Harpe, C. Su, Y. K. Law, C. E. Crespo-
Hernandez, and B. Kohler. DNA Excited-State Dynamics: From Single
Bases to the Double Helix. Annu. Rev. Phys. Chem., 60:217–239, 2009.
[93] S. Ullrich, T. Schultz, M. Z. Zgierski, and A. Stolow. Electronic Re-
laxation Dynamics in DNA and RNA Bases Studied by Time-resolved
Photoelectron Spectroscopy. Phys. Chem. Chem. Phys., 6:2796, 2004.
[94] H. Kang, K. T. Lee, B. Jung, Y. J. Ko, and S. K. Kim. intrinsic Lifetimes
of the Excited State of DNA and RNA Bases. J. Am. Chem. Soc.,
124:12958, 2002.
103

[95] C. Canuel, M. Mons, F. Piuzzi, B. Tardinel, I. Dimicoli, and M. Elha-
nine. Excited states dynamics of DNA and RNA bases: Characterization
of a stepwise deactivation pathway in the gas phase. J. Chem. Phys.,
122:074316, 2005.
[96] J.-M. L. Pecourt, J. Peon, and B. Kohler. Ultrafast Internal Conversion
of Electronically Excited RNA and DNA Nucleosides in Water. J. Am.
Chem. Soc., 122:9348, 2000.
[97] K. A. Kistler and S. Matsika. Quantum Mechanical Studies of the Pho-
tophysics of DNA and RNA Bases, volume 7, pages 285–339. Springer
Verlag, Netherlands, 2009.
[98] J. Gonzalez-Vazquez and L. Gonzalez. A Time-Dependent Picture of the
Ultrafast Deactivation of keto-Cytosine Including Three-State Conical
Intersections. ChemPhysChem, 11(17):3617–3624, 2010.
[99] Kyriaki Kosma, Christian Schrter, Elena Samoylova, Ingolf Volker Her-
tel, and Thomas Schultz. Excited-State Dynamics of Cytosine Tau-
tomers. J. Am. Chem. Soc., 131(46):16939–16943, 2009.
[100] Hyuk Kang, Kang Taek Lee, Boyong Jung, Yeon Jae Ko, and
Seong Keun Kim. Intrinsic lifetimes of the excited state of DNA and
RNA bases. J. Am. Chem. Soc., 124(44):12958–12959, 2002.
[101] Y. He, C. Wu, and W. Kong. Decay Pathways of Thymine and Methyl-
substituted Uracil and Thymine in the gas Phase. J. Phys. Chem. A,
107:5145, 2003.
[102] P. M. Hare, C. E. Crespo-Hernandez, and B. Kohler. Internal Conver-
sion to the Electronic Ground State Occurs via Two Distinct Pathways
for the Pyrimidine Bases in Aqueous Solution. Proc. Natl. Acad. Sci.
U.S.A., 104:435–440, 2007.
[103] Albert Stolow. Femtosecond time-resolved photoelectron spectroscopy
of polyatomic molecules. Annu. Rev. Phys. Chem., 54(1):89–119, 2003.
[104] Daniel M Neumark. Time-resolved photoelectron spectroscopy of
molecules and clusters. Annu. Rev. Phys. Chem., 52(1):255–277, 2001.
104

[105] C.F. Guerra, F.M. Bickelhaupt, S. Saha, and F. Wang. Adenine tau-
tomers: relative stabilities, ionization energies, and mismatch with cy-
tosine. The Journal of Physical Chemistry A, 110(11):4012–4020, 2006.
[106] C. Plutzer and K. Kleinermanns. Tautomers and electronic states of
jet-cooled adenine investigated by double resonance spectroscopy. Phys.
Chem. Chem. Phys., 4(20):4877–4882, 2002.
[107] Vitaliy Feyer, Oksana Plekan, Robert Richter, Marcello Coreno, Gemma
Vall-llosera, Kevin C. Prince, Alexander B. Trofimov, Irina L. Zaytseva,
Tatyana E. Moskovskaya, Evgeniy V. Gromov, and Jochen Schirmer.
Tautomerism in cytosine and uracil: An experimental and theoretical
core level spectroscopic study. J. Phys. Chem. A, 113(19):5736–5742,
2009.
[108] Ronald D. Brown, Peter D. Godfrey, Donald McNaughton, and An-
thony P. Pierlot. A study of the major gas-phase tautomer of adenine
by microwave spectroscopy. Chem. Phys. Lett., 156(1):61–63, 1989.
[109] K. Tomic, T. Jorg, and C. M. Marian. Quantum chemical investigation
of the electronic spectra of the keto, enol, and keto-imine tautomers of
cytosine. J. Phys. Chem. A, 109:8410–8418, 2005.
[110] E. Nir, M. Muller, LI Grace, and MS De Vries. REMPI spectroscopy of
cytosine. Chem. Phys. Lett., 355(1-2):59–64, 2002.
[111] S. Perun, A. L. Sobolewski, and W. Domcke. Ab Initio Studies on the
Radiationless Decay Mechanisms of the Lowest Excited Singlet States of
9H-Adenine. J. Am. Chem. Soc., 127:6257–6265, 2005.
[112] S. Matsika. Radiationless Decay of Excited States of Uracil Through
Conical Intersections. J. Phys. Chem. A, 108:7584, 2004.
[113] K. A. Kistler and S. Matsika. Radiationless Decay Mechanism of Cyto-
sine: An Ab Initio Study with Comparisons to the Fluorescent Analogue
5-Methyl-2-pyrimidinone. J. Phys. Chem. A, 111:2650–2661, 2007.
105

[114] D. Dougherty, K. Wittel, J. Meeks, and S. P. McGlynn. Photoelectron
spectroscopy of carbonyls. ureas, uracils, and thymine. J. Am. Chem.
Soc., 98(13):3815–3820, 1976.
[115] D. Dougherty, E. S. Younathan, R. Voll, S. Abdulnur, and S. P. McG-
lynn. Photoelectron spectroscopy of some biological molecules. J. Elec-
tron. Spectrosc. Relat. Phenom., 13(3):379 – 393, 1978.
[116] Shigeyuki Urano, Xu Yang, and Pierre R. LeBreton. UV photo-
electron and quantum mechanical characterization of DNA and RNA
bases: valence electronic structures of adenine, 1,9-dimethyl-guanine,
1-methylcytosine, thymine and uracil. J. Mol. Struct., 214:315 – 328,
1989.
[117] N. Ismail, L. Blancafort, M. Olivucci, B. Kohler, and M. A. Robb. Ultra-
fast Decay of Electronically Excited Singlet Cytosine via π, π∗ to n, π∗
State Switch. J. Am. Chem. Soc., 124:6818, 2002.
[118] M. Merchan and L. Serrano-Andres. Ultrafast Internal Conversion of
Excited Cytosine via the Lowest ππ∗ Electronic Singlet State. J. Am.
Chem. Soc., 125:8108, 2003.
[119] M. Merchan, R. Gonzalez-Luque, T. Climent, L. Serrano-Andres, E. Ro-
driuguez, M. Reguero, and D. Pelaez. Unified Model for the Ultrafast
Decay of Pyrimidine Nucleobases. J. Phys. Chem. B, 110:26471–26476,
2006.
[120] M. Z. Zgierski, S. Patchkovskii, and E. C. Lim. Ab initio study of
a biradical radiationless decay channel of the lowest excited electronic
state of cytosine and its derivatives. J. Chem. Phys., 123:081101, 2005.
[121] L. Blancafort. Energetics of cytosine singlet excited-state decay paths
- A difficult case for CASSCF and CASPT2 . Photochem. Photobiol.,
83:603–610, 2007.
[122] Z. Lan, E. Fabiano, and W. Thiel. Photoinduced Nonadiabatic Dynam-
ics of Pyrimidine Nucleobases: On-the-Fly Surface-Hopping Study with
Semiempirical Methods. J. Phys. Chem. B, 113(11):3548–3555, 2009.
106

[123] L. Blancafort and M. A. Robb. Key Role of a Threefold State Crossing in
the Ultrafast Decay of Electronically Excited Cytosine. J. Phys. Chem.
A, 108:10609, 2004.
[124] K. A. Kistler and S. Matsika. Three-state Conical Intersections in Cy-
tosine and Pyrimidinone Bases. J. Chem. Phys., 128:215102, 2008.
[125] A. L. Sobolewski, W. Domcke, C. Dedonder-Lardeux, and C. Jouvet.
Excited-state hydrogen detachment and hydrogen transfer driven by re-
pulsive (1)pi sigma* states: A new paradigm for nonradiative decay in
aromatic biomolecules. Phys. Chem. Chem. Phys., 4:1093–1100, 2002.
[126] S. Perun, A. L. Sobolewski, and W. Domcke. Photostability of 9h-
adenine: mechanisms of the radiationless deactivation of the lowest ex-
cited singlet states. Chem. Phys., 313:107–112, 2005.
[127] H. Chen and S. H. Li. Theoretical Study toward Understanding Ul-
trafast Internal Conversion of Excited 9H-Adenine. J. Phys. Chem. A,
109:8443–8446, 2005.
[128] C. M. Marian. A New Pathway for the Rapid Decay of Electronically
Excited Adenine. J. Chem. Phys., 122:104314, 2005.
[129] L. Blancafort. Excited-State Potential Energy Surface for the Photo-
physics of Adenine. J. Am. Chem. Soc., 128:210–219, 2006.
[130] L. Serrano-Andres, M. Merchan, and A. C. Borin. Adenine and 2-
Aminopurine: Paradigms of Modern Theoretical Photochemistry. Proc.
Natl. Acad. Sci. U.S.A., 103:8691–8696, 2006.
[131] W. C. Chung, Z. Lan, Y. Ohtsuki, N. Shimakura, W. Domcke, and
Y. Fujimura. Conical Intersections Involving the Dissociative 1πσ∗ State
in H-Adenine: a Quantum Chemical Ab Initio Study. Phys. Chem.
Chem. Phys., 9:2075–2084, 2007.
[132] M. Z. Zgierski, S.Patchkovskii, and E. C. Lim. Biradical radiationless
decay channel in adenine and its derivatives. Can. J. Chem., 85:124,
2007.
107

[133] Mario Barbatti and Hans Lischka. Nonadiabatic deactivation of 9H-
adenine: A comprehensive picture based on mixed quantum-classical
dynamics. J. Am. Chem. Soc., 130(21):6831–6839, 2008.
[134] Walid Mohamed Ibrahim Hassan, Wilfredo Credo Chung, Noriyuki Shi-
makura, Shiro Koseki, Hirohiko Kono, and Yuichi Fujimura. Ultrafast
radiationless transition pathways through conical intersections in photo-
excited 9H-adenine. Phys. Chem. Chem. Phys., 12(20):5317–5328, 2010.
[135] and A. Stolow. Excited-State Dynamics of Isolated DNA Bases: A Case
Study of Adenine. Chem. Phys. Chem, 10:101–110, 2009.
[136] M. Z. Zgierski, S. Patchkovskii, T. Fujiwara, and E. C. Lim. On the Ori-
gin of the Ultrafast Internal Conversion of Electronically Excited Pyrim-
idine Bases. J. Phys. Chem. A, 109:9384–9387, 2005.
[137] T. Gustavsson, A. Banyasz, E. Lazzarotto, D. Markovitsi, G. Scalmani,
M. J. Frisch, V. Barone, and R. Improta. Singlet excited-state behavior
of uracil and thymine in aqueous solution: A combined experimental
and computational study of 11 uracil derivatives. J. Am. Chem. Soc.,
128:607–619, 2006.
[138] H. R. Hudock, B. G. Levine, A. L. Thompson, H. Satzger, D. Townsend,
N. Gador, S. Ullrich, A. Stolow, and T. J. Martinez. Ab Initio Molecular
Dynamics and Time-Resolved Photoelectron Spectroscopy of Electron-
ically Excited Uracil and Thymine. J. Phys. Chem. A, 111:8500–8508,
2007.
[139] N.B. Slater. Theory of unimolecular reactions. Cornell University Press
Ithaca, New York, 1959.
[140] Jill K. Wolken, Chunxiang Yao, Frantisek Turecek, Michael J. Polce, and
Chrys Wesdemiotis. Cytosine neutral molecules and cation-radicals in
the gas-phase: Structures, energetics, ion chemistry, and neutralization-
reionization mass spectrometry. Int. J. Mass. Spectrom., 267(1-3):30 –
42, 2007.
108

[141] Jerry M. Rice, Gerald O. Dudek, and Michael Barber. Mass spectra of
nucleic acid derivatives. pyrimidines. J. Am. Chem. Soc., 87(20):4569–
4576, 1965.
[142] Leonid Belau, Kevin R. Wilson, Stephen R. Leone, and Musahid Ahmed.
Vacuum-ultraviolet photoionization studies of the microhydration of dna
bases (guanine, cytosine, adenine, and thymine). J. Phys. Chem. A,
111(31):7562–7568, 2007.
[143] D. Pavicic, K. F. Lee, D. M. Rayner, P. B. Corkum, and D. M. Vil-
leneuve. Direct measurement of the angular dependence of ionization for
N2, O2, and CO2 in intense laser fields. Phys. Rev. Lett., 98(24):243001,
2007.
[144] A.S. Alnaser, S. Voss, X.M. Tong, C.M. Maharjan, P. Ranitovic, B. Ul-
rich, T. Osipov, B. Shan, Z. Chang, and C.L. Cocke. Effects Of Molecular
Structure on Ion Disintegration Patterns In Ionization of O2 and N2 by
Short Laser Pulses. Phys. Rev. Lett., 93(11):113003, 2004.
[145] O. Smirnova, S. Patchkovskii, Y. Mairesse, N. Dudovich, and M. Y.
Ivanov. Strong-field control and spectroscopy of attosecond electron-
hole dynamics in molecules. Proc. Natl. Acad. Sci. USA, 106(39):16556,
2009.
[146] Z. X. Zhao, X. M. Tong, and C. D. Lin. Alignment-dependent ionization
probability of molecules in a double-pulse laser field. Phys. Rev. A,
67(4):043404, Apr 2003.
[147] A. Jaron-Becker, A. Becker, and F. H. M. Faisal. Ionization of n2, o2, and
linear carbon clusters in a strong laser pulse. Phys. Rev. A, 69(2):023410,
Feb 2004.
[148] W. Li, A. A. Jaron-Becker, C. W. Hogle, V. Sharma, X. Zhou, A. Becker,
H. C. Kapteyn, and M. M. Murnane. Visualizing electron rearrangement
in space and time during the transition from a molecule to atoms. Proc.
Natl. Acad. Sci. USA, 107(47):20219, 2010.
109

[149] B. K. McFarland, J. P. Farrell, P. H. Bucksbaum, and M. Guhr. High har-
monic generation from multiple orbitals in N2. Science, 322(5905):1232,
2008.
[150] B.T. Pickup. Theory of fast ionization processes. Chemical Physics,
19(2):193–208, 1977.
[151] H. Stapelfeldt and T. Seideman. Colloquium: Aligning molecules with
strong laser pulses. Rev. Mod. Phys., 75(2):543, 2003.
[152] C. Z. Bisgaard, O. J. Clarkin, G. Wu, A. Lee, O. Geßner, C. C. Hayden,
and A. Stolow. Time-resolved molecular frame dynamics of fixed-in-
space cs2 molecules. Science, 323(5920):1464, 2009.
[153] C.Z. Bisgaard, M.D. Poulsen, E. Peronne, S.S. Viftrup, and
H. Stapelfeldt. Observation of enhanced field-free molecular alignment
by two laser pulses. Physical review letters, 92(17):173004, 2004.
[154] V. Kumarappan, C.Z. Bisgaard, S.S. Viftrup, L. Holmegaard, and
H. Stapelfeldt. Role of rotational temperature in adiabatic molecular
alignment. The Journal of chemical physics, 125:194309, 2006.
[155] I. V. Litvinyuk, Kevin F. Lee, P. W. Dooley, D. M. Rayner, D. M. Vil-
leneuve, and P. B. Corkum. Alignment-dependent strong field ionization
of molecules. Phys. Rev. Lett., 90:233003, 2003.
[156] M. Kasha. Characterization of electronic transitions in complex
molecules. Discuss. Faraday Soc., 9:14–19, 1950.
[157] D. Geißler, T. Rozgonyi, J. Gonzalez-Vazquez, L. Gonzalez, P. Mar-
quetand, and T.C. Weinacht. Pulse-Shape-Dependent Strong-Field
Ionization Viewed with Velocity Map Imaging. Physical Review A,
84(5):053422, 2011.
[158] C. Zhou, S Matsika, M. Kotur, and T. C. Weinacht. Fragmentation
Pathways in Uracil Radical Cations. (submitted), 2011.
[159] H. W. Jochims, M. Schwell, H. Baumgartel, and S. Leach. Photoion
mass spectrometry of adenine, thymine and uracil in the 6-22 eV photon
energy range. Chem. Phys., 314(1-3):263–282, 2005.
110

[160] Jonathan G. Underwood, Benjamin J. Sussman, and Albert Stolow.
Field-Free Three Dimensional Molecular Axis Alignment. Phys. Rev.
Lett., 94(14):143002, Apr 2005.
[161] Hideo Harada, Seiji Shimizu, Tomoyuki Yatsuhashi, Shuji Sakabe, Ya-
sukazu Izawa, and Nobuaki Nakashima. A key factor in parent and
fragment ion formation on irradiation with an intense femtosecond laser
pulse. Chem. Phys. Lett., 342(5-6):563 – 570, 2001.
[162] C. Figueira de Morisson Faria and X. Liu. Electron-electron correlation
in strong laser fields. Journal of Modern Optics, 58(13, SI):1076–1131,
2011.
[163] J. Breidbach and L. S. Cederbaum. Universal attosecond response to
the removal of an electron. Phys. Rev. Lett., 94:033901, Jan 2005.
[164] Michael Spanner and Serguei Patchkovskii. One-electron ionization of
multielectron systems in strong nonresonant laser fields. Phys. Rev. A,
80(6):063411, Dec 2009.
[165] H. Akagi et al. Laser tunnel ionization from multiple orbitals in hcl.
Science, 325(5946):1364–1367, 2009.
[166] T. Koopmans. Uber die Zuordnung von Wellenfunktionen und Eigen-
werten zu den Einzelnen Elektronen Eines Atoms. Physica, 1(1-6):104 –
113, 1934.
[167] V. Blanchet, M.Z. Zgierski, T. Seideman, and A. Stolow. Discerning
vibronic molecular dynamics using time-resolved photoelectron spec-
troscopy. Nature, 401(6748):52–54, 1999.
[168] Z.B. Walters and O. Smirnova. Attosecond correlation dynamics during
electron tunnelling from molecules. J. Phys. B, 43:161002, 2010.
[169] M Spanner. (private communication).
[170] A. F. Lago, James P. Kercher, Andrs Bdi, Blint Sztray, B. Miller,
D. Wurzelmann, and Tomas Baer. Dissociative photoionization and ther-
mochemistry of dihalomethane compounds studied by threshold photo-
111

electron photoion coincidence spectroscopy. The Journal of Physical
Chemistry A, 109(9):1802–1809, 2005.
[171] Hanneli R. Hudock, Benjamin G. Levine, Alexis L. Thompson, Helmut
Satzger, D. Townsend, N. Gador, S. Ullrich, Albert Stolow, and Todd J.
Martinez. Ab initio molecular dynamics and time-resolved photoelectron
spectroscopy of electronically excited uracil and thymine. J. Phys. Chem
A, 111(34):8500–8508, 2007.
[172] Michael Spanner and Serguei Patchkovskii. Molecular strong field ion-
ization and highharmonic generation: A selection of computational il-
lustrations. Chem. Phys., (0):–, 2012.
[173] David Cardoza, Brett J. Pearson, and Thomas Weinacht. Dissociative
wave packets and dynamic resonances. J. Chem. Phys., 126:084308,
2007.
[174] J.A. Nelder and R. Mead. A simplex method for function minimization.
The computer journal, 7(4):308, 1965.
112

Appendix A
Fitting
A.1 Description of the fitting function
In order to quantify the observation that pump-probe ion signals differ between
fragments of a molecule, we fitted a model function, f(t), to the experimental
data. This approach was used previously [93, 99]. Pump-probe signal for each
of the fragments was independently fitted. The model function was a convo-
lution of a Gaussian with a sum of two or three exponentials and constant.
f(t) = G(σ)⊗ [θ(t− t0) · (2,3∑i=1
Ai · e−t−(t0)/τi +B)] (A.1)
where G is a gaussian that corresponds to the width of the cross-correlation
between the pump and the probe pulses. It is characterized by its variance σ2,
and given by
G(σ) = e−t2/2·σ2
(A.2)
so that its full width at half maximum FWHM = 2√
2 ln 2σ = 2.355 · σ.
Here θ is the Heaviside step function (ensuring that the decay only begins after
the excited state has been populated), t0 accounts for different delay where a
fragments pump-probe signal is maximum, τi are the decay constants and Ai
are the amplitudes associated with each of the decays. The constant B can
be thought of as an exponential that is too long to be captured in our pump
probe scans. This can be due to population trapped in a long-living state,
113

or due to changes in fragmentation patterns between the initial ground state
sample and the final hot ground state one.
The fitting function was later modified to:
f(t) = A0 ·G(σ)⊗ [θ(t− t0) · (3∑i=1
Ai · e−(t−t0)/τi + 1−A1 −A2 −A3)]. (A.3)
Here the Ai constants were rearranged an attempt to decouple the ampli-
tudes from the time constants.
The data was fitted to this function using the Nelder-Mead algorithm [174]
for multivariate unconstrained nonlinear optimization implemented in mat-
lab.
The code used to perform the fitting is given below.
A.2 Main body of the fitting code
The fitting code fit_gauss_biexp_conv_new_CHD, written in matlab 7.1.
%fitting routine for a double exponential convolved with a Gaussian
close all
clear all
molecule_switch = 5;
date_switch = 55;
set_mass_peak_bins6
tz=0;
peaks = [8 9 10 13 14 18 19 20 22:26 28 29 31];%
tz=200;
x=load(’xaxis.txt’)’-tz;
x1 = aux_x_axis(x); % extended symmetric x axis
%initial guess, make a matrix if it differs
114

%from fragment to fragment
start_point = [0.77 35.2 0.11 213.07 ...
mean(y2fit(end-10:end)) 248 64.8];
for ii = 1:length(peaks)
%load data
fname = char([peaknamematrixpeaks(ii) ...
’_boxcar_lineout_smooth_3.txt’])
y=load(fname)’;
y=y(end,:);
y=y/max(y);
%restrict fitting interval, if necessary
fit_start_pt = 1;
fit_end_pt = length(x)-1;
x2fit = x(fit_start_pt:fit_end_pt);
y2fit = y(fit_start_pt:fit_end_pt);
x2fit = flipud(x2fit);
%linear transform so that lhs ranges between 0 and 1
k = 1/(max(y2fit)-mean(y2fit(1:15)));
n = - mean(y2fit(1:15)) / (max(y2fit)-mean(y2fit(1:15)));
y2fit = y2fit * k + n;
%define the gaussian cross-correlation
g1 = exp(-x2fit.^2/(2*start_point(7)^2));
g1=g1/sum(g1);
tic
fit = fitcurvedemo_gauss_biexp_conv_with_sigma2(x2fit, ...
y2fit,start_point);
toc
115

parameters(:,ii) = fit;
%redefine Gaussian, since FWHM was a fitting parameter
g1 = exp(-x2fit.^2/(2*fit(7)^2));
g1=g1/sum(g1);
%fitted function
fitted= fit(1)*convn(g1,stepexp(x1,fit(6),1,fit(2))...
/max(convn(g1,stepexp(x1,fit(6),1,fit(2)))),’same’)+ ...
fit(3)*convn(g1,stepexp(x1,fit(6),1,fit(4))...
/max(convn(g1,stepexp(x1,fit(6),1,fit(4)))),’same’) + ...
fit(5)*convn(g1,stepexp(x1,fit(6),1,inf)...
/max(convn(g1,stepexp(x1,fit(6),1,inf))),’same’);
%individual components
stepexp1 = fit(1)*convn(g1,stepexp(x1,fit(6),1,fit(2))...
/max(convn(g1,stepexp(x1,fit(6),1,fit(2)))),’same’);
stepexp2 = fit(3)*convn(g1,stepexp(x1,fit(6),1,fit(4))...
/max(convn(g1,stepexp(x1,fit(6),1,fit(4)))),’same’);
stepexp3 = fit(5)*convn(g1,stepexp(x1,fit(6),1,inf)...
/max(convn(g1,stepexp(x1,fit(6),1,inf))),’same’);
% evaluate goodness of fit
tau = [parameters(2,ii) parameters(4,ii)];
tau = sort(tau);
goodness =sum((y2fit-fitted).^2) /length(y2fit);
%plot the final fit
hfig = figure;
hold on
plot(x2fit,fitted,’r’,’linewidth’,2);
plot(x2fit,y2fit,’k’,’linewidth’,1);
plot(x2fit,stepexp1,’g’,’linewidth’,2);
plot(x2fit,stepexp2,’g--’,’linewidth’,2);
116

plot(x2fit,stepexp3,’g-.’,’linewidth’,2);
axis tight;
v = axis(gca);
text((v(1)+2*v(2))/3,(v(3)+3*v(4))/4,...
strvcat([num2str(tau(2),’%.0f’) ’fs’], ...
[num2str(tau(1),’%.0f’) ’fs’]),’color’,’r’);
title(strcat(’fit for ’, peaknamematrix(peaks(ii)),...
’, \chi=’, num2str(goodness,’%.5f’),...
’, \sigma=’, num2str(fit(7),’%.1f’)))
%save files
fname = char(strcat(’biexp conv fit’,...
peaknamematrix(peaks(ii)),’initial2’));
print(’-dpng’,strcat(fname,’.png’));
hgsave(hfig,strcat(fname,’.fig’));
save(strcat(fname,’.txt’),’fit’,’-ascii’);
end
A.3 Subroutines of the fitting code
Subroutine that performs fitting using Matlab’s built in FMINSEARCH function.
function [estimates, model] = fitcurvedemo(xdata,ydata,...
start_param_vector,sigma)
start_point = start_param_vector;
model = @expfun;
options=optimset(’MaxFunEvals’,50000,’MaxIter’,50000,...
’FunValCheck’,’on’,’TolFun’,1E-7,’TolX’,1E-7);
[estimates,fval,exitflag] = fminsearch(model, start_point,options);
disp(’exiflag =’)
exitflag
117

function [sse, FittedCurve] = expfun(params)
A1 = params(1);
tau1 = params(2);
A2 = params(3);
tau2 = params(4);
B = params(5);
offset = params(6);
sigma = params(7);
g=exp(-xdata.^2/(2*sigma^2));
g=g/sum(g);
x1 = aux_x_axis(xdata); % extended symmetric x axis
step = 0.5*(sign(x1)+1);
c1 = convn(g,stepexp(x1,params(6),1,params(2)),’same’);
c2 = convn(g,stepexp(x1,params(6),1,params(4)),’same’);
c3 = convn(g,stepexp(x1,params(6),1,inf),’same’);
FittedCurve= params(1) * c1/max(c1) + ...
params(3) * c2/max(c2)+ ...
params(5) * c3/max(c3);
ErrorVector = FittedCurve - ydata;
sse = sum(ErrorVector .^ 2);
end
end
Subroutine STEPEXP.
%calc step.*exp(-x/tau)
%does not evaluate exp where step = 0
%by marija feb 2010
function[se] = aux(xaxis,offset,A,tau)
118

xl = length(xaxis);
for ii=1:xl
if xaxis(ii)<-offset se(ii) = 0;
else se(ii) = A*exp(-(xaxis(ii)+offset)/tau);
end
end
Subroutine AUX_X_AXIS.
%create auxiliary x axis for convolutions
%if old x axis is (-a,b)
%new x axis has to be
%(-max(abs(a),abs(b))-extra,-max(abs(a),abs(b))+extra)
%the new axis has to symmetric and extend outside of the old one
% assumes x values are equidistant from each other
%by marija jan 2010
function[xx] = aux(xaxis)
xl = length(xaxis);
%extends the x axis on the positive side by 20%
xx=[xaxis xaxis(end)+(1:round(0.2*xl))*max(diff(xaxis))];
xnew = min(xx);
while xnew > -max(xx)
xnew = min(xx) - max(diff(xaxis));
xx = [xnew xx];
end
119