strong interest inventory ® manual supplement
TRANSCRIPT

S U P P L E M E N T
Strong. . . . . . . . . . . . . . . . . . . . . . . . . . . . . . . . . . . . . . . . . . . . . . . . . . . . . . . . . . . . . . .
I N T E R E S T I N V E N T O R Y® M A N UA L
Occupational Scales Update 2012
Nicole A. HerkRichard C. Thompson
StrongI N T E R E S T I N V E N T O R Y®
M A N U A L S U P P L E M E N T
Mountain View, California
. . . . . . . . . . . . . . . . . . . . . . . . . . . . . . . . . . . . . . . . . . . . . . . . . . . . . . . . . . . . . . . . . . . . . . . . . . . . . . . . . . .
. . .
CPP, Inc.1055 Joaquin Road, 2nd FloorMountain View, CA 94043800-624-1765www.cpp.com
Strong Interest Inventory® Manual Supplement Copyright 2012 by CPP, Inc. All rights reserved. No portion of this publi-cation may be reproduced, stored in a retrieval system, or transmitted in any form or media or by any means, electronic,mechanical, photocopying, recording, or otherwise, without the prior written permission of CPP, Inc.
Reference to the Strong indicates the Strong Interest Inventory® assessment, Copyright 1933, 1938, 1945, 1946, 1966,1968, 1974, 1981, 1985, 1994, 2004, 2012 by CPP, Inc. All rights reserved.
Strong Interest Inventory, SkillsOne, and the Strong and CPP logos are trademarks or registered trademarks of CPP,Inc., in the United States and other countries. O*NET is a trademark of the U.S. Department of Labor, Employmentand Training Administration.
Printed in the United States of America.20 19 18 17 16 15 14 13 12 20 19 18 17 16 15 14 13 12 11 10 9 8 7 6 5 4 3 2 1
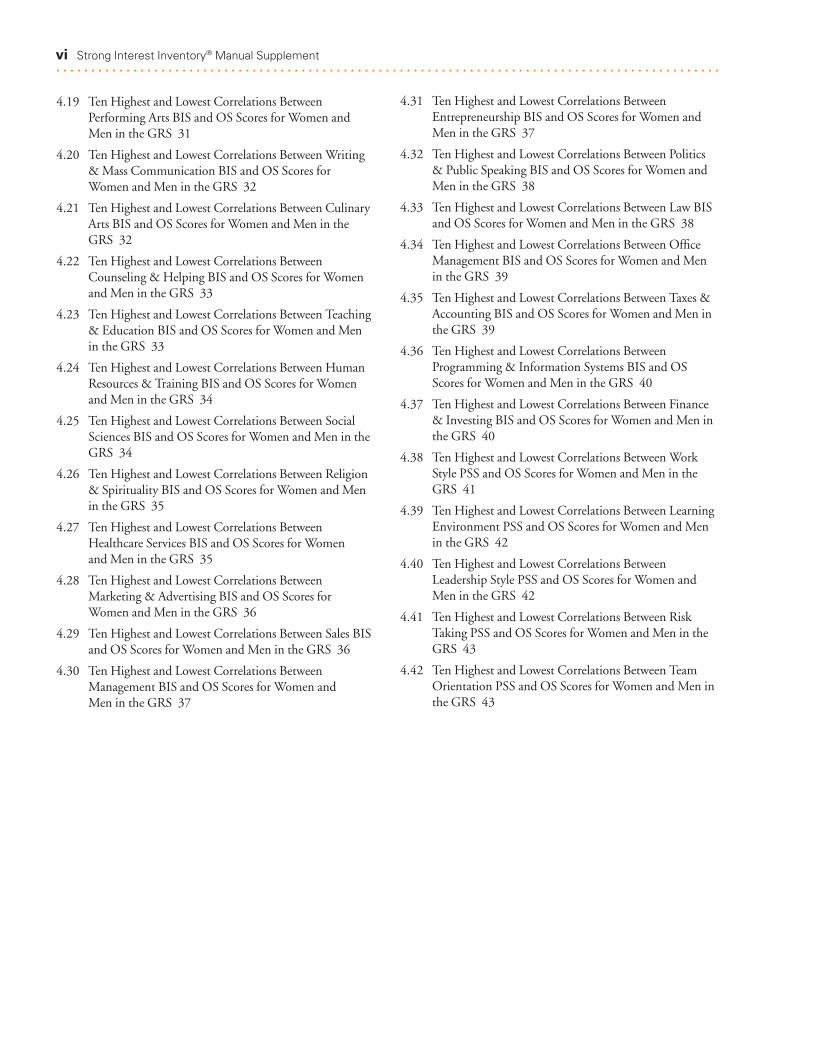
List of Tables v
CHAP T E R 1
Updating the Strong Occupational Scales 1Data Collection Process 1
Occupational Scale Construction 2
Updates to the Strong Profiles and Reports 4
CHAP T E R 2
Characteristics of the OccupationalScales 5
CHAP T E R 3
Reliability of the Occupational Scales 15
CHAP T E R 4
Validity of the Occupational Scales 21Correlations Among the Occupational Scales 21
Correlations Between the GOTs and the OSs 22
Correlations Between the BISs and the OSs 25
Correlations Between the PSSs and the OSs 41
Conclusion 45
APP END I X
Occupational Scale Samples, O*NET™
Codes, and Related Job Titles 47
References 121
Contents
. . . . . . . . . . . . . . . . . . . . . . . . . . . . . . . . . . . . . . . . . . . . . . . . . . . . . . . . . . . . . . . . . . . . . . . . . . . . . . . . . . . . . . . . . . . . . . . . . . . . . . . . . . . . . . . . . . . .
. . . . . . . . . . . . . . . . . . . . . . . . . . . . . . . . . . . . . . . . . . . . . . . . . . . . . . . . . . . . . . . . . . . . . . . . . . . . . . . . . . . . . . . . . . . . . . . . . . . . . . . . . . . . . . . . . . . .
. . . . . . . . . . . . . . . . . . . . . . . . . . . . . . . . . . . . . . . . . . . . . . . . . . . . . . . . . . . . . . . . . . . . . . . . . . . . . . . . . . . . . . . . . . . . . . . . . . . . . . . . . . . . . . . . . . . .

1.1 New Occupational Scales Added 3
1.2 Occupational Scales Updated 3
1.3 Occupational Scales Revised 4
1.4 Occupational Scales Removed 4
2.1 Scale Characteristics, Concurrent Validities (PercentOverlap), and Minimum and Maximum Possible Standard Scores for the Occupational Scales 6
2.2 Comparison of the Occupational Scales by Gender 11
3.1 OS Test-Retest Reliability Statistics 16
4.1 OS Correlations Overall and Within Theme forWomen and Men in the GRS 21
4.2 Ten Highest and Lowest Correlations Between Realistic Theme and OS Scores for Women and Men in the GRS 22
4.3 Ten Highest and Lowest Correlations Between Investigative Theme and OS Scores for Women andMen in the GRS 23
4.4 Ten Highest and Lowest Correlations Between ArtisticTheme and OS Scores for Women and Men in the GRS 23
4.5 Ten Highest and Lowest Correlations Between SocialTheme and OS Scores for Women and Men in the GRS 24
4.6 Ten Highest and Lowest Correlations Between Enterprising Theme and OS Scores for Women andMen in the GRS 24
4.7 Ten Highest and Lowest Correlations Between Conventional Theme and OS Scores for Women andMen in the GRS 25
4.8 Ten Highest and Lowest Correlations Between Mechanics & Construction BIS and OS Scores forWomen and Men in the GRS 26
4.9 Ten Highest and Lowest Correlations Between Computer Hardware & Electronics BIS and OS Scoresfor Women and Men in the GRS 26
4.10 Ten Highest and Lowest Correlations Between Military BIS and OS Scores for Women and Men in the GRS 27
4.11 Ten Highest and Lowest Correlations Between Protective Services BIS and OS Scores for Women and Men in the GRS 27
4.12 Ten Highest and Lowest Correlations Between Nature & Agriculture BIS and OS Scores for Womenand Men in the GRS 28
4.13 Ten Highest and Lowest Correlations Between Athletics BIS and OS Scores for Women and Men inthe GRS 28
4.14 Ten Highest and Lowest Correlations Between Science BIS and OS Scores for Women and Men in the GRS 29
4.15 Ten Highest and Lowest Correlations Between Research BIS and OS Scores for Women and Men inthe GRS 29
4.16 Ten Highest and Lowest Correlations Between Medical Science BIS and OS Scores for Women andMen in the GRS 30
4.17 Ten Highest and Lowest Correlations Between Mathematics BIS and OS Scores for Women and Men in the GRS 30
4.18 Ten Highest and Lowest Correlations Between VisualArts & Design BIS and OS Scores for Women and Men in the GRS 31
List of Tables
v
. . . . . . . . . . . . . . . . . . . . . . . . . . . . . . . . . . . . . . . . . . . . . . . . . . . . . . . . . . . . . . . . . . . . . . . . . . . . . . . . . . . . . . . . . . . . . . . . . . . . . . . . . . . . . . . . . . . .
. . . . . . . . . . . . . . . . . . . . . . . . . . . . . . . . . . . . . . . . . . . . . . . . . . . . . . . . . . . . . . . . . . . . . . . . . . . . . . . . . . . . . . . . . . . . . . . . . . . . . . . . . . . . . . . . . . . .
4.19 Ten Highest and Lowest Correlations Between Performing Arts BIS and OS Scores for Women andMen in the GRS 31
4.20 Ten Highest and Lowest Correlations Between Writing& Mass Communication BIS and OS Scores forWomen and Men in the GRS 32
4.21 Ten Highest and Lowest Correlations Between CulinaryArts BIS and OS Scores for Women and Men in theGRS 32
4.22 Ten Highest and Lowest Correlations Between Counseling & Helping BIS and OS Scores for Womenand Men in the GRS 33
4.23 Ten Highest and Lowest Correlations Between Teaching& Education BIS and OS Scores for Women and Menin the GRS 33
4.24 Ten Highest and Lowest Correlations Between HumanResources & Training BIS and OS Scores for Womenand Men in the GRS 34
4.25 Ten Highest and Lowest Correlations Between SocialSciences BIS and OS Scores for Women and Men in theGRS 34
4.26 Ten Highest and Lowest Correlations Between Religion& Spirituality BIS and OS Scores for Women and Menin the GRS 35
4.27 Ten Highest and Lowest Correlations Between Healthcare Services BIS and OS Scores for Women and Men in the GRS 35
4.28 Ten Highest and Lowest Correlations Between Marketing & Advertising BIS and OS Scores forWomen and Men in the GRS 36
4.29 Ten Highest and Lowest Correlations Between Sales BISand OS Scores for Women and Men in the GRS 36
4.30 Ten Highest and Lowest Correlations Between Management BIS and OS Scores for Women and Men in the GRS 37
vi Strong Interest Inventory® Manual Supplement. . . . . . . . . . . . . . . . . . . . . . . . . . . . . . . . . . . . . . . . . . . . . . . . . . . . . . . . . . . . . . . . . . . . . . . . . . . . . . . . . . . . . . . . . . . . . . .
4.31 Ten Highest and Lowest Correlations Between Entrepreneurship BIS and OS Scores for Women andMen in the GRS 37
4.32 Ten Highest and Lowest Correlations Between Politics& Public Speaking BIS and OS Scores for Women andMen in the GRS 38
4.33 Ten Highest and Lowest Correlations Between Law BISand OS Scores for Women and Men in the GRS 38
4.34 Ten Highest and Lowest Correlations Between OfficeManagement BIS and OS Scores for Women and Menin the GRS 39
4.35 Ten Highest and Lowest Correlations Between Taxes &Accounting BIS and OS Scores for Women and Men inthe GRS 39
4.36 Ten Highest and Lowest Correlations Between Programming & Information Systems BIS and OSScores for Women and Men in the GRS 40
4.37 Ten Highest and Lowest Correlations Between Finance& Investing BIS and OS Scores for Women and Men inthe GRS 40
4.38 Ten Highest and Lowest Correlations Between WorkStyle PSS and OS Scores for Women and Men in theGRS 41
4.39 Ten Highest and Lowest Correlations Between LearningEnvironment PSS and OS Scores for Women and Menin the GRS 42
4.40 Ten Highest and Lowest Correlations Between Leadership Style PSS and OS Scores for Women andMen in the GRS 42
4.41 Ten Highest and Lowest Correlations Between RiskTaking PSS and OS Scores for Women and Men in theGRS 43
4.42 Ten Highest and Lowest Correlations Between TeamOrientation PSS and OS Scores for Women and Men inthe GRS 43
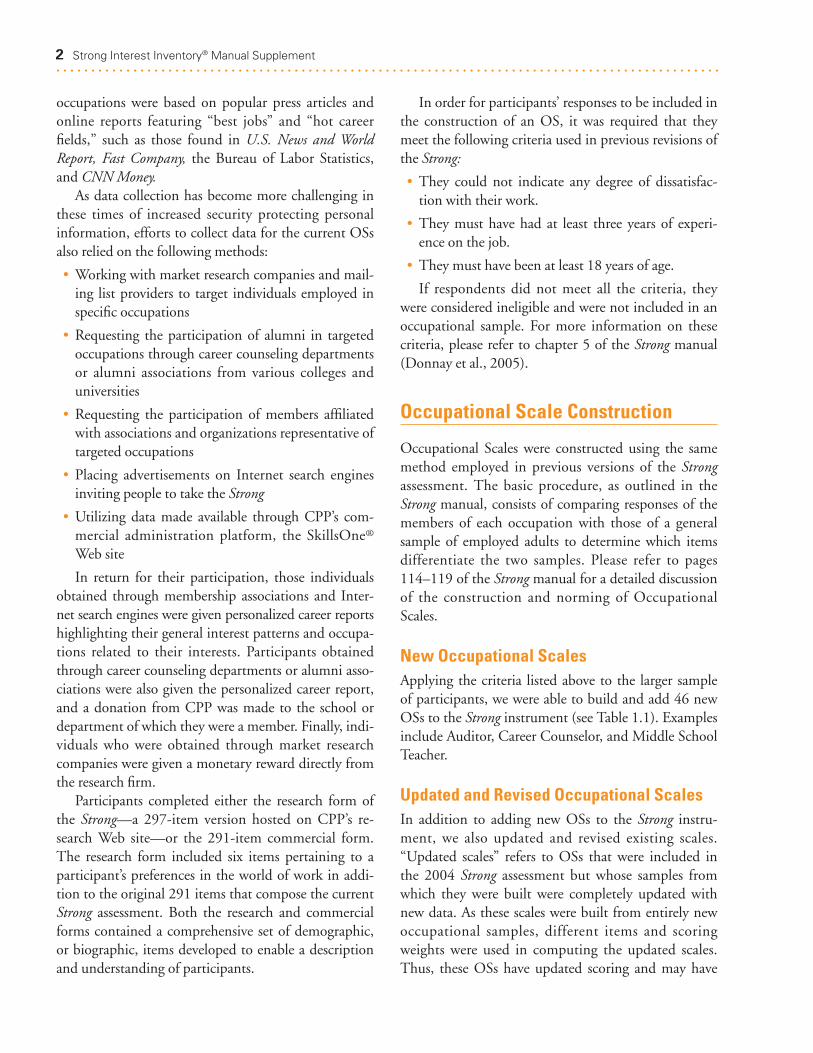
In order to maintain the relevance and utility of theStrong Interest Inventory® (Strong) assessment, the
instrument is periodically revised to reflect changes in
the occupational world and in society. While the Strong
has been in use since 1927, the scores received by indi-
viduals taking the assessment compare their interests
with those of people who are working in occupations
relevant to today’s workforce. As such, the Strong
remains steadfast in measuring contemporary career
interests.
In 2004, the content of the Strong assessment wasrevised, which resulted in changes to all four types ofStrong scales—General Occupational Themes, BasicInterest Scales, Occupational Scales, and Personal StyleScales—as well as to the administrative indexes, gener-ated from the instrument. Chapters 1–7 of the StrongInterest Inventory® Manual (Donnay, Morris, Schaub-hut, & Thompson, 2005) discuss the 2004 revisionprocess and the resulting changes in the Strong mea-sures. Soon after the publication of the 2004 Strong,efforts began on the next update to the assessment.This update focused solely on the Occupational Scales(OSs); the goal was to update the OSs to keep them ascurrent as possible. New scales were added, a numberof older scales were removed, various scales wereupdated by developing an OS from a new sample, and
in other cases samples were bolstered with additionalmembers of the occupation. This supplement describesthe overall update of the Occupational Scales and pro-vides information surrounding the new set of 260 OSs(130 female scales and 130 male scales) that are nowintegrated into the Strong family of reports. The datacollection process and construction, characteristics,reliability, and validity of the scales are also discussed.Career professionals may refer to both the manual andthis supplement as they use the Strong Interest Inventoryassessment with clients. It should be noted that no changes were made to
the instrument itself with this update, including theitem content, response options, and interpretation of results. Additionally, the General OccupationalThemes, Basic Interest Scales, Personal Style Scales,and administrative indexes all remain the same. Onlythe Occupational Scales have been affected by thisupdate.
Data Collection Process
As in prior versions of the Strong, data for the cur-rent OS update were collected from the population ofemployed adults in the United States. Within this pop-ulation, a number of OSs were initially targeted (e.g.,OSs with samples obtained for the 1994 revision orearlier). New occupations that were not included in the2004 OS list were targeted as well. Several of these
1
C H A P T E R
Updating the StrongOccupational Scales
1
. . . . . . . . . . . . . . . . . . . . . . . . . . . . . . . . . . . . . . . . . . . . . . . . . . . . . . . . . . . . . . . . . . . . . . . . . . . . . . . . . . . . . . . . . . . . . . . . . . . . . . . . . . . . . . . . . . . .
. . . . . . . . . . . . . . . . . . . . . . . . . . . . . . . . . . . . . . . . . . . . . . . . . . . . . . . . . . . . . . . . . . . . . . . . . . . . . . . . . . . . . . . . . . . . . . . . . . . . . . . . . . . . . . . . . . . .
occupations were based on popular press articles andonline reports featuring “best jobs” and “hot careerfields,” such as those found in U.S. News and WorldReport, Fast Company, the Bureau of Labor Statistics,and CNN Money. As data collection has become more challenging in
these times of increased security protecting personalinformation, efforts to collect data for the current OSsalso relied on the following methods:
• Working with market research companies and mail-ing list providers to target individuals employed inspecific occupations
• Requesting the participation of alumni in targetedoccupations through career counseling departmentsor alumni associations from various colleges anduniversities
• Requesting the participation of members affiliatedwith associations and organizations representative oftargeted occupations
• Placing advertisements on Internet search enginesinviting people to take the Strong
• Utilizing data made available through CPP’s com-mercial administration platform, the SkillsOne®
Web site
In return for their participation, those individualsobtained through membership associations and Inter-net search engines were given personalized career reportshighlighting their general interest patterns and occupa-tions related to their interests. Participants obtainedthrough career counseling departments or alumni asso-ciations were also given the personalized career report,and a donation from CPP was made to the school ordepartment of which they were a member. Finally, indi-viduals who were obtained through market researchcompanies were given a monetary reward directly fromthe research firm.Participants completed either the research form of
the Strong—a 297-item version hosted on CPP’s re-search Web site—or the 291-item commercial form.The research form included six items pertaining to aparticipant’s preferences in the world of work in addi-tion to the original 291 items that compose the currentStrong assessment. Both the research and commercialforms contained a comprehensive set of demographic,or biographic, items developed to enable a descriptionand understanding of participants.
2 Strong Interest Inventory® Manual Supplement. . . . . . . . . . . . . . . . . . . . . . . . . . . . . . . . . . . . . . . . . . . . . . . . . . . . . . . . . . . . . . . . . . . . . . . . . . . . . . . . . . . . . . . . . . . . . . .
In order for participants’ responses to be included inthe construction of an OS, it was required that theymeet the following criteria used in previous revisions ofthe Strong:
• They could not indicate any degree of dissatisfac-tion with their work.
• They must have had at least three years of experi-ence on the job.
• They must have been at least 18 years of age.
If respondents did not meet all the criteria, theywere considered ineligible and were not included in anoccupational sample. For more information on thesecriteria, please refer to chapter 5 of the Strong manual(Donnay et al., 2005).
Occupational Scale Construction
Occupational Scales were constructed using the samemethod employed in previous versions of the Strongassessment. The basic procedure, as outlined in theStrong manual, consists of comparing responses of themembers of each occupation with those of a generalsample of employed adults to determine which itemsdifferentiate the two samples. Please refer to pages114–119 of the Strong manual for a detailed discussionof the construction and norming of OccupationalScales.
New Occupational ScalesApplying the criteria listed above to the larger sample of participants, we were able to build and add 46 newOSs to the Strong instrument (see Table 1.1). Examplesinclude Auditor, Career Counselor, and Middle SchoolTeacher.
Updated and Revised Occupational ScalesIn addition to adding new OSs to the Strong instru-ment, we also updated and revised existing scales.“Updated scales” refers to OSs that were included inthe 2004 Strong assessment but whose samples fromwhich they were built were completely updated withnew data. As these scales were built from entirely newoccupational samples, different items and scoringweights were used in computing the updated scales.Thus, these OSs have updated scoring and may have
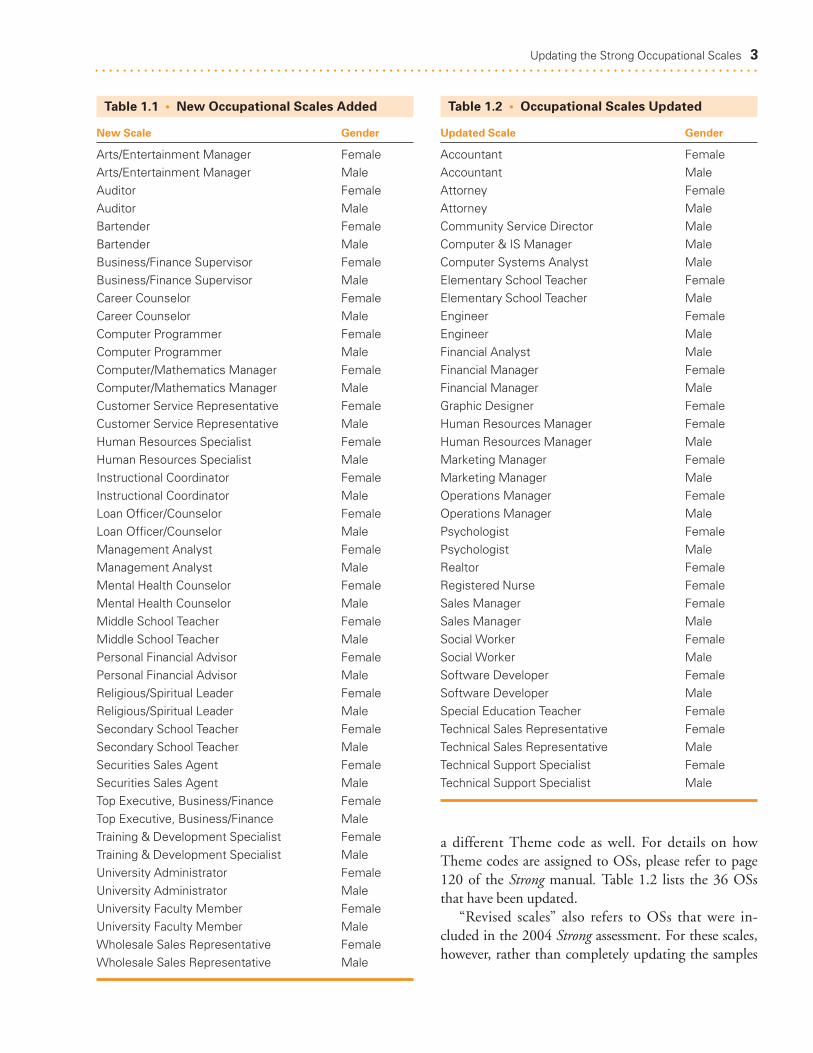
a different Theme code as well. For details on howTheme codes are assigned to OSs, please refer to page120 of the Strong manual. Table 1.2 lists the 36 OSsthat have been updated. “Revised scales” also refers to OSs that were in-
cluded in the 2004 Strong assessment. For these scales,however, rather than completely updating the samples
Updating the Strong Occupational Scales 3. . . . . . . . . . . . . . . . . . . . . . . . . . . . . . . . . . . . . . . . . . . . . . . . . . . . . . . . . . . . . . . . . . . . . . . . . . . . . . . . . . . . . . . . . . . . . . .
Table 1.1 • New Occupational Scales Added
New Scale Gender
Arts/Entertainment Manager Female
Arts/Entertainment Manager Male
Auditor Female
Auditor Male
Bartender Female
Bartender Male
Business/Finance Supervisor Female
Business/Finance Supervisor Male
Career Counselor Female
Career Counselor Male
Computer Programmer Female
Computer Programmer Male
Computer/Mathematics Manager Female
Computer/Mathematics Manager Male
Customer Service Representative Female
Customer Service Representative Male
Human Resources Specialist Female
Human Resources Specialist Male
Instructional Coordinator Female
Instructional Coordinator Male
Loan Officer/Counselor Female
Loan Officer/Counselor Male
Management Analyst Female
Management Analyst Male
Mental Health Counselor Female
Mental Health Counselor Male
Middle School Teacher Female
Middle School Teacher Male
Personal Financial Advisor Female
Personal Financial Advisor Male
Religious/Spiritual Leader Female
Religious/Spiritual Leader Male
Secondary School Teacher Female
Secondary School Teacher Male
Securities Sales Agent Female
Securities Sales Agent Male
Top Executive, Business/Finance Female
Top Executive, Business/Finance Male
Training & Development Specialist Female
Training & Development Specialist Male
University Administrator Female
University Administrator Male
University Faculty Member Female
University Faculty Member Male
Wholesale Sales Representative Female
Wholesale Sales Representative Male
Table 1.2 • Occupational Scales Updated
Updated Scale Gender
Accountant Female
Accountant Male
Attorney Female
Attorney Male
Community Service Director Male
Computer & IS Manager Male
Computer Systems Analyst Male
Elementary School Teacher Female
Elementary School Teacher Male
Engineer Female
Engineer Male
Financial Analyst Male
Financial Manager Female
Financial Manager Male
Graphic Designer Female
Human Resources Manager Female
Human Resources Manager Male
Marketing Manager Female
Marketing Manager Male
Operations Manager Female
Operations Manager Male
Psychologist Female
Psychologist Male
Realtor Female
Registered Nurse Female
Sales Manager Female
Sales Manager Male
Social Worker Female
Social Worker Male
Software Developer Female
Software Developer Male
Special Education Teacher Female
Technical Sales Representative Female
Technical Sales Representative Male
Technical Support Specialist Female
Technical Support Specialist Male
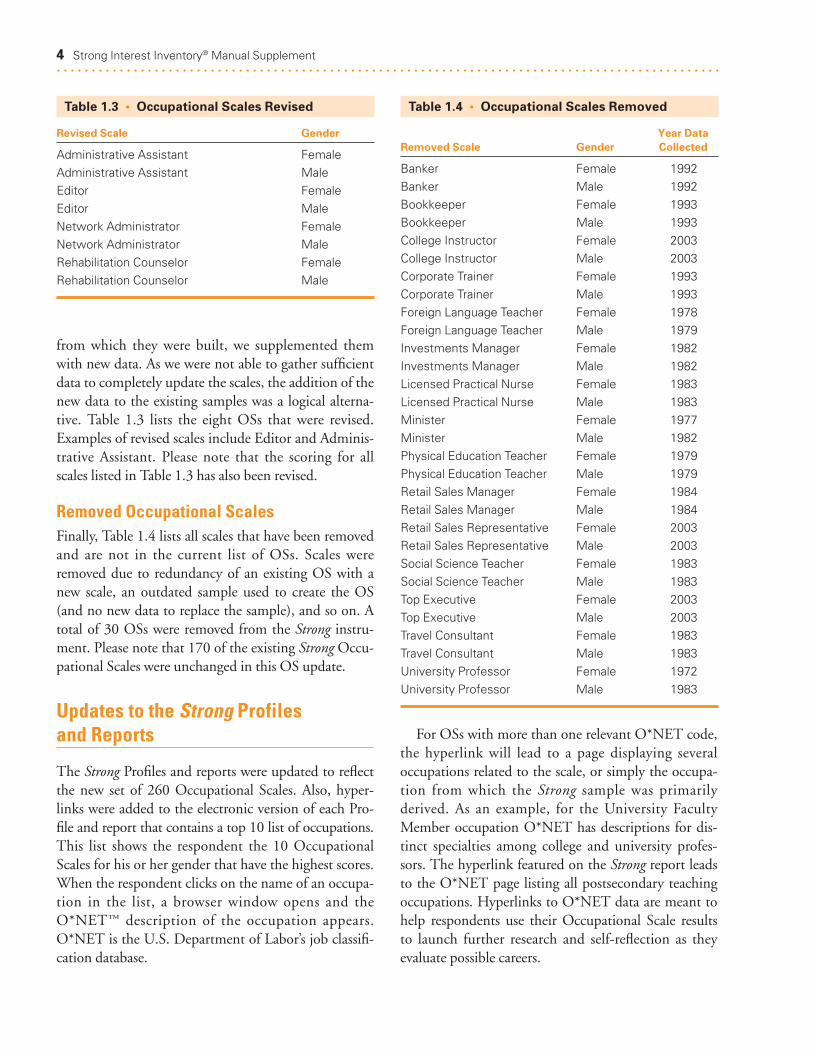
from which they were built, we supplemented themwith new data. As we were not able to gather sufficientdata to completely update the scales, the addition of thenew data to the existing samples was a logical alterna-tive. Table 1.3 lists the eight OSs that were revised.Examples of revised scales include Editor and Adminis-trative Assistant. Please note that the scoring for allscales listed in Table 1.3 has also been revised.
Removed Occupational ScalesFinally, Table 1.4 lists all scales that have been removedand are not in the current list of OSs. Scales wereremoved due to redundancy of an existing OS with anew scale, an outdated sample used to create the OS(and no new data to replace the sample), and so on. Atotal of 30 OSs were removed from the Strong instru-ment. Please note that 170 of the existing StrongOccu-pational Scales were unchanged in this OS update.
Updates to the Strong Profiles and Reports
The Strong Profiles and reports were updated to reflectthe new set of 260 Occupational Scales. Also, hyper-links were added to the electronic version of each Pro-file and report that contains a top 10 list of occupations.This list shows the respondent the 10 OccupationalScales for his or her gender that have the highest scores.When the respondent clicks on the name of an occupa-tion in the list, a browser window opens and theO*NET™ description of the occupation appears.O*NET is the U.S. Department of Labor’s job classifi-cation database.
For OSs with more than one relevant O*NET code,the hyperlink will lead to a page displaying severaloccupations related to the scale, or simply the occupa-tion from which the Strong sample was primarilyderived. As an example, for the University FacultyMember occupation O*NET has descriptions for dis-tinct specialties among college and university profes-sors. The hyperlink featured on the Strong report leadsto the O*NET page listing all postsecondary teachingoccupations. Hyperlinks to O*NET data are meant tohelp respondents use their Occupational Scale resultsto launch further research and self-reflection as theyevaluate possible careers.
4 Strong Interest Inventory® Manual Supplement. . . . . . . . . . . . . . . . . . . . . . . . . . . . . . . . . . . . . . . . . . . . . . . . . . . . . . . . . . . . . . . . . . . . . . . . . . . . . . . . . . . . . . . . . . . . . . .
Table 1.3 • Occupational Scales Revised
Revised Scale Gender
Administrative Assistant Female
Administrative Assistant Male
Editor Female
Editor Male
Network Administrator Female
Network Administrator Male
Rehabilitation Counselor Female
Rehabilitation Counselor Male
Table 1.4 • Occupational Scales Removed
Year DataRemoved Scale Gender Collected
Banker Female 1992
Banker Male 1992
Bookkeeper Female 1993
Bookkeeper Male 1993
College Instructor Female 2003
College Instructor Male 2003
Corporate Trainer Female 1993
Corporate Trainer Male 1993
Foreign Language Teacher Female 1978
Foreign Language Teacher Male 1979
Investments Manager Female 1982
Investments Manager Male 1982
Licensed Practical Nurse Female 1983
Licensed Practical Nurse Male 1983
Minister Female 1977
Minister Male 1982
Physical Education Teacher Female 1979
Physical Education Teacher Male 1979
Retail Sales Manager Female 1984
Retail Sales Manager Male 1984
Retail Sales Representative Female 2003
Retail Sales Representative Male 2003
Social Science Teacher Female 1983
Social Science Teacher Male 1983
Top Executive Female 2003
Top Executive Male 2003
Travel Consultant Female 1983
Travel Consultant Male 1983
University Professor Female 1972
University Professor Male 1983
In interpreting a client’s results on the OccupationalScales, a standard score of 40 or higher on a scale
indicates that the client has some degree of similarity to
people employed in the occupation and that the occu-
pation is thus worth noting as an area to explore. A
score of 50 on an OS is average for respondents em-
ployed in a given occupation; therefore a score of 50
or higher should command considerable attention.
Clients who score low on an OS may still want to
research the occupation, however. See chapter 5 of the
Strong manual (pp. 103–105) for details on explaining
OS results.
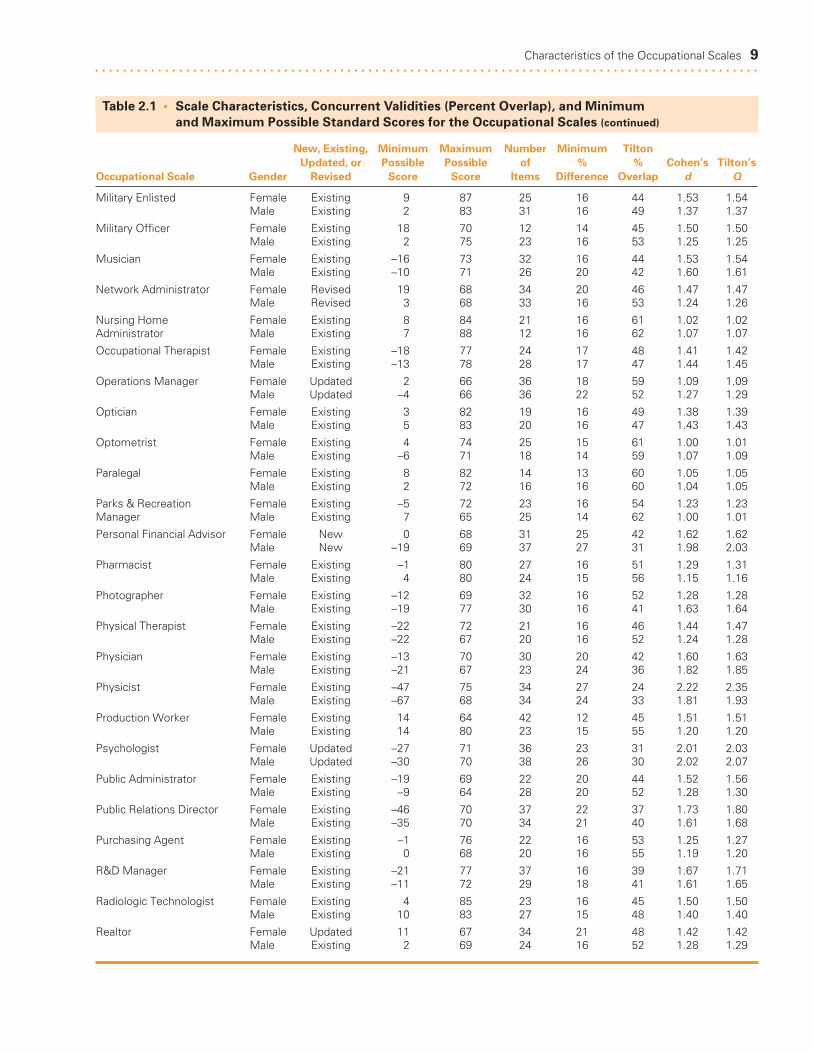
Table 2.1 shows the minimum and maximum pos-sible scores on the 260 OSs. Please note that Table 2.1is a replacement for Table 5.1 in the Strong manual.The minimum and maximum scores were computedfor the 2004 General Representative Sample (GRS).This sample includes 1,125 women and 1,125 menselected to reflect the racial and ethnic diversity of theU.S. workforce. For a demographic profile of this sam-ple, please refer to pages 6–8 of the Strong manual.
C H A P T E R
Characteristics of theOccupational Scales
5
2
. . . . . . . . . . . . . . . . . . . . . . . . . . . . . . . . . . . . . . . . . . . . . . . . . . . . . . . . . . . . . . . . . . . . . . . . . . . . . . . . . . . . . . . . . . . . . . . . . . . . . . . . . . . . . . . . . . . .
. . . . . . . . . . . . . . . . . . . . . . . . . . . . . . . . . . . . . . . . . . . . . . . . . . . . . . . . . . . . . . . . . . . . . . . . . . . . . . . . . . . . . . . . . . . . . . . . . . . . . . . . . . . . . . . . . . . .
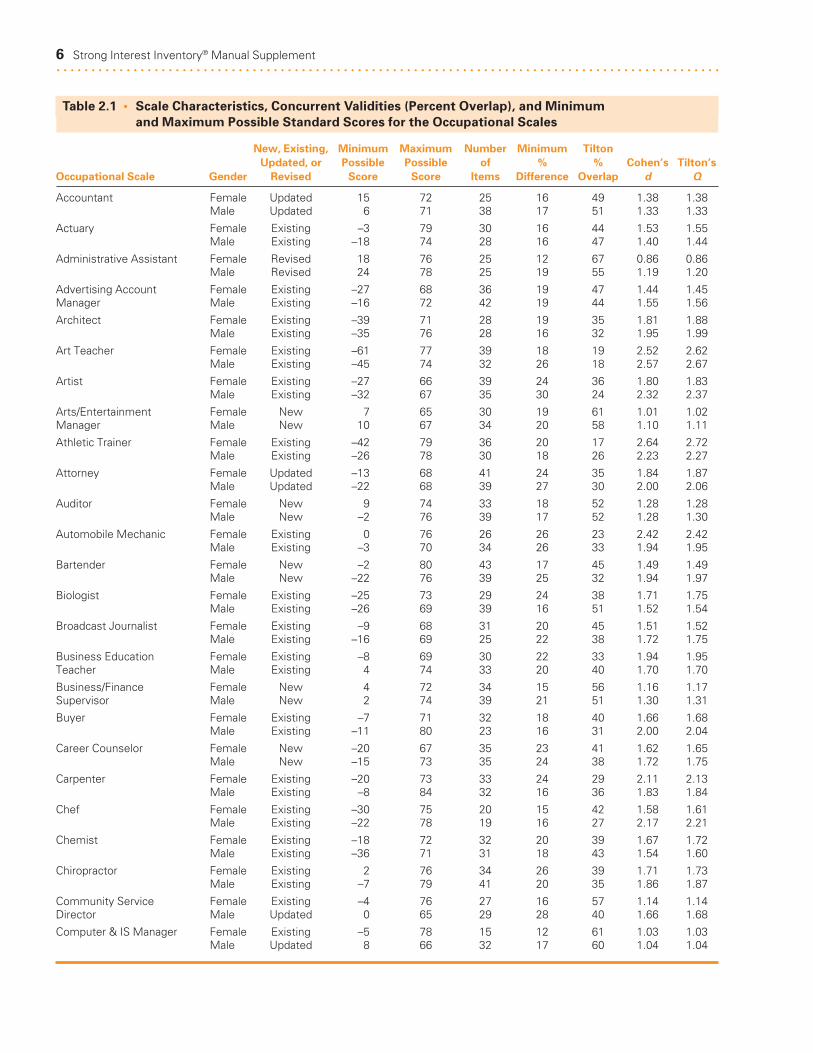
Table 2.1 • Scale Characteristics, Concurrent Validities (Percent Overlap), and Minimum and Maximum Possible Standard Scores for the Occupational Scales
New, Existing, Minimum Maximum Number Minimum TiltonUpdated, or Possible Possible of % % Cohen’s Tilton’s
Occupational Scale Gender Revised Score Score Items Difference Overlap d Q
Accountant Female Updated 15 72 25 16 49 1.38 1.38Male Updated 6 71 38 17 51 1.33 1.33
Actuary Female Existing –3 79 30 16 44 1.53 1.55Male Existing –18 74 28 16 47 1.40 1.44
Administrative Assistant Female Revised 18 76 25 12 67 0.86 0.86Male Revised 24 78 25 19 55 1.19 1.20
Advertising Account Female Existing –27 68 36 19 47 1.44 1.45Manager Male Existing –16 72 42 19 44 1.55 1.56
Architect Female Existing –39 71 28 19 35 1.81 1.88Male Existing –35 76 28 16 32 1.95 1.99
Art Teacher Female Existing –61 77 39 18 19 2.52 2.62Male Existing –45 74 32 26 18 2.57 2.67
Artist Female Existing –27 66 39 24 36 1.80 1.83Male Existing –32 67 35 30 24 2.32 2.37
Arts/Entertainment Female New 7 65 30 19 61 1.01 1.02Manager Male New 10 67 34 20 58 1.10 1.11
Athletic Trainer Female Existing –42 79 36 20 17 2.64 2.72Male Existing –26 78 30 18 26 2.23 2.27
Attorney Female Updated –13 68 41 24 35 1.84 1.87Male Updated –22 68 39 27 30 2.00 2.06
Auditor Female New 9 74 33 18 52 1.28 1.28Male New –2 76 39 17 52 1.28 1.30
Automobile Mechanic Female Existing 0 76 26 26 23 2.42 2.42Male Existing –3 70 34 26 33 1.94 1.95
Bartender Female New –2 80 43 17 45 1.49 1.49Male New –22 76 39 25 32 1.94 1.97
Biologist Female Existing –25 73 29 24 38 1.71 1.75Male Existing –26 69 39 16 51 1.52 1.54
Broadcast Journalist Female Existing –9 68 31 20 45 1.51 1.52Male Existing –16 69 25 22 38 1.72 1.75
Business Education Female Existing –8 69 30 22 33 1.94 1.95Teacher Male Existing 4 74 33 20 40 1.70 1.70
Business/Finance Female New 4 72 34 15 56 1.16 1.17Supervisor Male New 2 74 39 21 51 1.30 1.31
Buyer Female Existing –7 71 32 18 40 1.66 1.68Male Existing –11 80 23 16 31 2.00 2.04
Career Counselor Female New –20 67 35 23 41 1.62 1.65Male New –15 73 35 24 38 1.72 1.75
Carpenter Female Existing –20 73 33 24 29 2.11 2.13Male Existing –8 84 32 16 36 1.83 1.84
Chef Female Existing –30 75 20 15 42 1.58 1.61Male Existing –22 78 19 16 27 2.17 2.21
Chemist Female Existing –18 72 32 20 39 1.67 1.72Male Existing –36 71 31 18 43 1.54 1.60
Chiropractor Female Existing 2 76 34 26 39 1.71 1.73Male Existing –7 79 41 20 35 1.86 1.87
Community Service Female Existing –4 76 27 16 57 1.14 1.14Director Male Updated 0 65 29 28 40 1.66 1.68
Computer & IS Manager Female Existing –5 78 15 12 61 1.03 1.03Male Updated 8 66 32 17 60 1.04 1.04
6 Strong Interest Inventory® Manual Supplement. . . . . . . . . . . . . . . . . . . . . . . . . . . . . . . . . . . . . . . . . . . . . . . . . . . . . . . . . . . . . . . . . . . . . . . . . . . . . . . . . . . . . . . . . . . . . . .
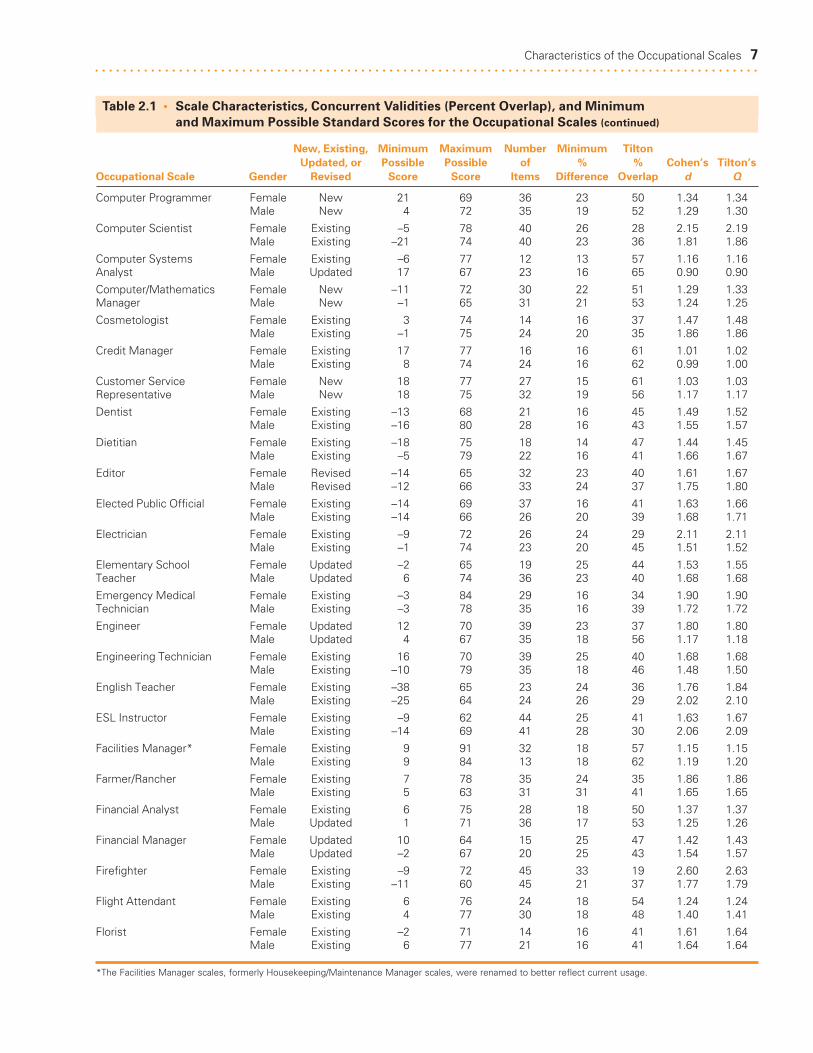
Characteristics of the Occupational Scales 7. . . . . . . . . . . . . . . . . . . . . . . . . . . . . . . . . . . . . . . . . . . . . . . . . . . . . . . . . . . . . . . . . . . . . . . . . . . . . . . . . . . . . . . . . . . . . . .
Table 2.1 • Scale Characteristics, Concurrent Validities (Percent Overlap), and Minimum and Maximum Possible Standard Scores for the Occupational Scales (continued)
New, Existing, Minimum Maximum Number Minimum TiltonUpdated, or Possible Possible of % % Cohen’s Tilton’s
Occupational Scale Gender Revised Score Score Items Difference Overlap d Q
Computer Programmer Female New 21 69 36 23 50 1.34 1.34Male New 4 72 35 19 52 1.29 1.30
Computer Scientist Female Existing –5 78 40 26 28 2.15 2.19Male Existing –21 74 40 23 36 1.81 1.86
Computer Systems Female Existing –6 77 12 13 57 1.16 1.16Analyst Male Updated 17 67 23 16 65 0.90 0.90
Computer/Mathematics Female New –11 72 30 22 51 1.29 1.33Manager Male New –1 65 31 21 53 1.24 1.25
Cosmetologist Female Existing 3 74 14 16 37 1.47 1.48Male Existing –1 75 24 20 35 1.86 1.86
Credit Manager Female Existing 17 77 16 16 61 1.01 1.02Male Existing 8 74 24 16 62 0.99 1.00
Customer Service Female New 18 77 27 15 61 1.03 1.03Representative Male New 18 75 32 19 56 1.17 1.17
Dentist Female Existing –13 68 21 16 45 1.49 1.52Male Existing –16 80 28 16 43 1.55 1.57
Dietitian Female Existing –18 75 18 14 47 1.44 1.45Male Existing –5 79 22 16 41 1.66 1.67
Editor Female Revised –14 65 32 23 40 1.61 1.67Male Revised –12 66 33 24 37 1.75 1.80
Elected Public Official Female Existing –14 69 37 16 41 1.63 1.66Male Existing –14 66 26 20 39 1.68 1.71
Electrician Female Existing –9 72 26 24 29 2.11 2.11Male Existing –1 74 23 20 45 1.51 1.52
Elementary School Female Updated –2 65 19 25 44 1.53 1.55Teacher Male Updated 6 74 36 23 40 1.68 1.68
Emergency Medical Female Existing –3 84 29 16 34 1.90 1.90Technician Male Existing –3 78 35 16 39 1.72 1.72
Engineer Female Updated 12 70 39 23 37 1.80 1.80Male Updated 4 67 35 18 56 1.17 1.18
Engineering Technician Female Existing 16 70 39 25 40 1.68 1.68Male Existing –10 79 35 18 46 1.48 1.50
English Teacher Female Existing –38 65 23 24 36 1.76 1.84Male Existing –25 64 24 26 29 2.02 2.10
ESL Instructor Female Existing –9 62 44 25 41 1.63 1.67Male Existing –14 69 41 28 30 2.06 2.09
Facilities Manager* Female Existing 9 91 32 18 57 1.15 1.15Male Existing 9 84 13 18 62 1.19 1.20
Farmer/Rancher Female Existing 7 78 35 24 35 1.86 1.86Male Existing 5 63 31 31 41 1.65 1.65
Financial Analyst Female Existing 6 75 28 18 50 1.37 1.37Male Updated 1 71 36 17 53 1.25 1.26
Financial Manager Female Updated 10 64 15 25 47 1.42 1.43Male Updated –2 67 20 25 43 1.54 1.57
Firefighter Female Existing –9 72 45 33 19 2.60 2.63Male Existing –11 60 45 21 37 1.77 1.79
Flight Attendant Female Existing 6 76 24 18 54 1.24 1.24Male Existing 4 77 30 18 48 1.40 1.41
Florist Female Existing –2 71 14 16 41 1.61 1.64Male Existing 6 77 21 16 41 1.64 1.64
*The Facilities Manager scales, formerly Housekeeping/Maintenance Manager scales, were renamed to better reflect current usage.

8 Strong Interest Inventory® Manual Supplement. . . . . . . . . . . . . . . . . . . . . . . . . . . . . . . . . . . . . . . . . . . . . . . . . . . . . . . . . . . . . . . . . . . . . . . . . . . . . . . . . . . . . . . . . . . . . . .
Table 2.1 • Scale Characteristics, Concurrent Validities (Percent Overlap), and Minimum and Maximum Possible Standard Scores for the Occupational Scales (continued)
New, Existing, Minimum Maximum Number Minimum TiltonUpdated, or Possible Possible of % % Cohen’s Tilton’s
Occupational Scale Gender Revised Score Score Items Difference Overlap d Q
Food Service Manager Female Existing 8 75 23 16 50 1.35 1.35Male Existing 4 67 17 16 46 1.46 1.47
Forester Female Existing –4 77 20 19 50 1.35 1.37Male Existing –10 75 20 16 48 1.39 1.41
Geographer Female Existing –31 73 42 29 21 2.45 2.51Male Existing –29 74 40 28 27 2.20 2.24
Geologist Female Existing –19 72 30 24 35 1.81 1.86Male Existing –14 70 27 24 36 1.79 1.82
Graphic Designer Female Updated –8 72 29 19 43 1.55 1.58Male Existing –19 66 26 26 30 2.07 2.09
Health Information Female Existing 8 82 22 15 56 1.18 1.18Specialist Male Existing 10 80 18 13 61 1.02 1.02
Horticulturist Female Existing –11 74 20 16 43 1.56 1.57Male Existing –8 80 26 16 47 1.42 1.43
Human Resources Female Updated –14 64 36 22 46 1.46 1.48Manager Male Updated –10 67 39 25 40 1.66 1.68
Human Resources Female New 4 67 30 16 60 1.04 1.05Specialist Male New –5 69 34 21 46 1.46 1.48
Instructional Coordinator Female New 2 67 31 18 60 1.05 1.06Male New 15 65 33 23 55 1.19 1.19
Interior Designer Female Existing –45 71 25 24 31 1.97 2.02Male Existing –14 65 26 30 26 2.24 2.25
Landscape/Grounds Female Existing 4 85 20 13 54 1.22 1.22Manager Male Existing –1 80 19 16 54 1.21 1.22
Law Enforcement Female Existing 3 77 28 18 41 1.66 1.66Officer Male Existing –5 81 28 17 42 1.59 1.60
Librarian Female Existing –10 72 22 15 60 1.04 1.05Male Existing –3 76 26 18 50 1.33 1.34
Life Insurance Agent Female Existing –7 77 22 19 47 1.43 1.44Male Existing –9 76 17 20 45 1.51 1.52
Loan Officer/Counselor Female New –1 76 32 17 52 1.28 1.28Male New –4 70 35 24 42 1.58 1.60
Management Analyst Female New 1 70 27 19 56 1.18 1.18Male New –1 70 31 18 56 1.18 1.19
Marketing Manager Female Updated –17 69 35 21 44 1.54 1.56Male Updated –8 70 40 20 48 1.40 1.42
Mathematician Female Existing –33 77 37 24 25 2.23 2.32Male Existing –36 70 37 26 22 2.41 2.46
Mathematics Teacher Female Existing –10 77 38 16 31 2.03 2.05Male Existing –15 77 35 16 29 2.12 2.13
Medical Illustrator Female Existing –56 76 37 24 24 2.25 2.34Male Existing –51 71 28 26 17 2.63 2.74
Medical Technician Female Existing –5 77 28 20 39 1.73 1.74Male Existing –14 79 28 16 38 1.75 1.77
Medical Technologist Female Existing –5 76 27 18 43 1.56 1.59Male Existing –4 73 33 16 43 1.56 1.58
Mental Health Counselor Female New –37 65 37 22 35 1.82 1.88Male New –20 68 39 29 25 2.26 2.28
Middle School Teacher Female New –9 69 25 21 42 1.60 1.62Male New 1 69 30 22 42 1.59 1.61
Characteristics of the Occupational Scales 9. . . . . . . . . . . . . . . . . . . . . . . . . . . . . . . . . . . . . . . . . . . . . . . . . . . . . . . . . . . . . . . . . . . . . . . . . . . . . . . . . . . . . . . . . . . . . . .
Table 2.1 • Scale Characteristics, Concurrent Validities (Percent Overlap), and Minimum and Maximum Possible Standard Scores for the Occupational Scales (continued)
New, Existing, Minimum Maximum Number Minimum TiltonUpdated, or Possible Possible of % % Cohen’s Tilton’s
Occupational Scale Gender Revised Score Score Items Difference Overlap d Q
Military Enlisted Female Existing 9 87 25 16 44 1.53 1.54Male Existing 2 83 31 16 49 1.37 1.37
Military Officer Female Existing 18 70 12 14 45 1.50 1.50Male Existing 2 75 23 16 53 1.25 1.25
Musician Female Existing –16 73 32 16 44 1.53 1.54Male Existing –10 71 26 20 42 1.60 1.61
Network Administrator Female Revised 19 68 34 20 46 1.47 1.47Male Revised 3 68 33 16 53 1.24 1.26
Nursing Home Female Existing 8 84 21 16 61 1.02 1.02Administrator Male Existing 7 88 12 16 62 1.07 1.07
Occupational Therapist Female Existing –18 77 24 17 48 1.41 1.42Male Existing –13 78 28 17 47 1.44 1.45
Operations Manager Female Updated 2 66 36 18 59 1.09 1.09Male Updated –4 66 36 22 52 1.27 1.29
Optician Female Existing 3 82 19 16 49 1.38 1.39Male Existing 5 83 20 16 47 1.43 1.43
Optometrist Female Existing 4 74 25 15 61 1.00 1.01Male Existing –6 71 18 14 59 1.07 1.09
Paralegal Female Existing 8 82 14 13 60 1.05 1.05Male Existing 2 72 16 16 60 1.04 1.05
Parks & Recreation Female Existing –5 72 23 16 54 1.23 1.23Manager Male Existing 7 65 25 14 62 1.00 1.01
Personal Financial Advisor Female New 0 68 31 25 42 1.62 1.62Male New –19 69 37 27 31 1.98 2.03
Pharmacist Female Existing –1 80 27 16 51 1.29 1.31Male Existing 4 80 24 15 56 1.15 1.16
Photographer Female Existing –12 69 32 16 52 1.28 1.28Male Existing –19 77 30 16 41 1.63 1.64
Physical Therapist Female Existing –22 72 21 16 46 1.44 1.47Male Existing –22 67 20 16 52 1.24 1.28
Physician Female Existing –13 70 30 20 42 1.60 1.63Male Existing –21 67 23 24 36 1.82 1.85
Physicist Female Existing –47 75 34 27 24 2.22 2.35Male Existing –67 68 34 24 33 1.81 1.93
Production Worker Female Existing 14 64 42 12 45 1.51 1.51Male Existing 14 80 23 15 55 1.20 1.20
Psychologist Female Updated –27 71 36 23 31 2.01 2.03Male Updated –30 70 38 26 30 2.02 2.07
Public Administrator Female Existing –19 69 22 20 44 1.52 1.56Male Existing –9 64 28 20 52 1.28 1.30
Public Relations Director Female Existing –46 70 37 22 37 1.73 1.80Male Existing –35 70 34 21 40 1.61 1.68
Purchasing Agent Female Existing –1 76 22 16 53 1.25 1.27Male Existing 0 68 20 16 55 1.19 1.20
R&D Manager Female Existing –21 77 37 16 39 1.67 1.71Male Existing –11 72 29 18 41 1.61 1.65
Radiologic Technologist Female Existing 4 85 23 16 45 1.50 1.50Male Existing 10 83 27 15 48 1.40 1.40
Realtor Female Updated 11 67 34 21 48 1.42 1.42Male Existing 2 69 24 16 52 1.28 1.29

10 Strong Interest Inventory® Manual Supplement. . . . . . . . . . . . . . . . . . . . . . . . . . . . . . . . . . . . . . . . . . . . . . . . . . . . . . . . . . . . . . . . . . . . . . . . . . . . . . . . . . . . . . . . . . . . . . .
Table 2.1 • Scale Characteristics, Concurrent Validities (Percent Overlap), and Minimum and Maximum Possible Standard Scores for the Occupational Scales (continued)
New, Existing, Minimum Maximum Number Minimum TiltonUpdated, or Possible Possible of % % Cohen’s Tilton’s
Occupational Scale Gender Revised Score Score Items Difference Overlap d Q
Recreation Therapist Female Existing 4 70 39 21 44 1.53 1.53Male Existing –14 69 42 23 30 2.07 2.09
Registered Nurse Female Updated –3 69 30 20 42 1.59 1.61Male Existing –11 74 17 16 50 1.33 1.35
Rehabilitation Counselor Female Revised –11 66 31 21 45 1.48 1.50Male Revised –4 70 35 20 42 1.59 1.61
Religious/Spiritual Leader Female New –53 66 35 27 21 2.36 2.53Male New –28 65 37 26 28 2.07 2.17
Reporter Female Existing –28 69 26 20 37 1.73 1.79Male Existing –31 71 22 24 31 1.95 2.04
Respiratory Therapist Female Existing –5 78 17 16 45 1.48 1.50Male Existing –6 75 24 16 50 1.34 1.35
Restaurant Manager Female Existing –3 77 22 16 56 1.15 1.17Male Existing –14 85 36 16 41 1.64 1.65
Sales Manager Female Updated –5 68 39 24 39 1.70 1.72Male Updated –14 65 38 28 35 1.83 1.88
School Administrator Female Existing –11 68 32 18 51 1.32 1.34Male Existing –20 75 43 17 47 1.41 1.43
School Counselor Female Existing –5 69 36 16 48 1.40 1.41Male Existing –3 69 35 16 45 1.50 1.51
Science Teacher Female Existing –11 69 33 16 39 1.69 1.72Male Existing –14 73 36 16 38 1.74 1.77
Secondary School Teacher Female New –11 68 34 20 44 1.53 1.55Male New –1 68 38 22 42 1.57 1.60
Securities Sales Agent Female New –4 64 36 29 33 1.94 1.95Male New –26 65 33 28 30 1.97 2.07
Social Worker Female Updated –12 66 31 23 43 1.55 1.57Male Updated –12 74 39 25 28 2.15 2.16
Sociologist Female Existing –39 72 26 24 29 2.07 2.13Male Existing –25 72 23 24 33 1.91 1.96
Software Developer Female Updated 17 68 36 26 43 1.56 1.56Male Updated 3 66 36 18 53 1.24 1.25
Special Education Teacher Female Updated –11 71 36 20 35 1.86 1.88Male Existing –7 78 21 16 52 1.28 1.29
Speech Pathologist Female Existing –14 76 22 15 55 1.19 1.19Male Existing –8 79 25 18 49 1.37 1.37
Technical Sales Female Updated 8 71 38 21 46 1.49 1.49Representative Male Updated 1 68 36 20 47 1.44 1.45
Technical Support Female Updated 18 75 37 17 53 1.27 1.27Specialist Male Updated 5 69 26 16 53 1.25 1.26
Technical Writer Female Existing –21 66 27 16 54 1.21 1.24Male Existing –27 83 44 16 45 1.50 1.53
Top Executive, Female New –1 68 41 23 44 1.53 1.53Business/Finance Male New –19 64 34 26 43 1.53 1.59
Training & Development Female New –9 64 31 22 47 1.41 1.43Specialist Male New –6 67 32 23 46 1.46 1.48
Translator Female Existing –18 74 23 17 52 1.28 1.30Male Existing –1 77 32 18 46 1.47 1.47
University Administrator Female New –10 67 35 23 45 1.49 1.52Male New –8 69 37 24 38 1.72 1.74
Characteristics of the Occupational Scales 11. . . . . . . . . . . . . . . . . . . . . . . . . . . . . . . . . . . . . . . . . . . . . . . . . . . . . . . . . . . . . . . . . . . . . . . . . . . . . . . . . . . . . . . . . . . . . . .
Table 2.1 • Scale Characteristics, Concurrent Validities (Percent Overlap), and Minimum and Maximum Possible Standard Scores for the Occupational Scales (continued)
New, Existing, Minimum Maximum Number Minimum TiltonUpdated, or Possible Possible of % % Cohen’s Tilton’s
Occupational Scale Gender Revised Score Score Items Difference Overlap d Q
University Faculty Member Female New –3 68 34 24 36 1.84 1.84Male New –24 72 37 27 29 2.08 2.11
Urban & Regional Planner Female Existing –11 62 45 23 39 1.70 1.74Male Existing –7 62 41 22 47 1.46 1.46
Veterinarian Female Existing –26 83 38 17 37 1.75 1.80Male Existing –28 82 26 16 42 1.56 1.61
Vocational Agriculture Female Existing –21 76 21 16 34 1.89 1.91Teacher Male Existing –9 70 29 20 38 1.77 1.77
Wholesale Sales Female New 0 67 27 23 42 1.60 1.61Representative Male New 2 67 34 21 46 1.48 1.50
Note: The size of each occupational sample can be found in the appendix.
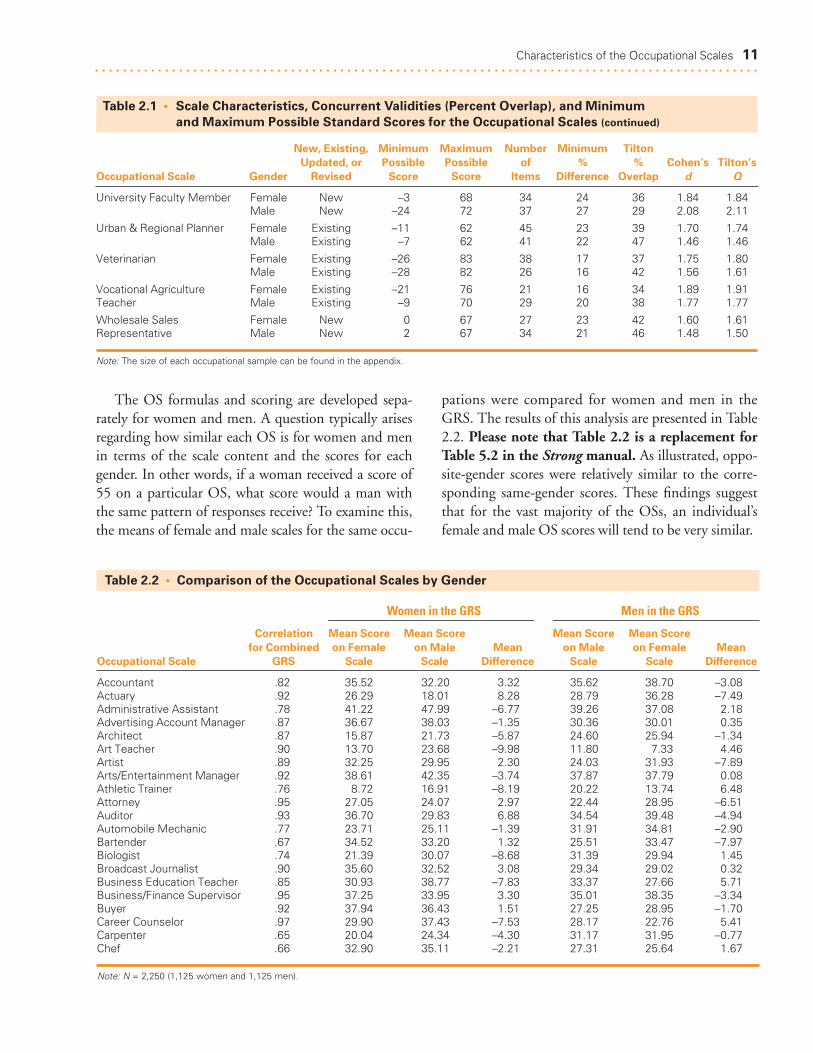
The OS formulas and scoring are developed sepa-rately for women and men. A question typically arisesregarding how similar each OS is for women and menin terms of the scale content and the scores for eachgender. In other words, if a woman received a score of55 on a particular OS, what score would a man withthe same pattern of responses receive? To examine this,the means of female and male scales for the same occu-
pations were compared for women and men in theGRS. The results of this analysis are presented in Table2.2. Please note that Table 2.2 is a replacement forTable 5.2 in the Strong manual. As illustrated, oppo-site-gender scores were relatively similar to the corre-sponding same-gender scores. These findings suggestthat for the vast majority of the OSs, an individual’sfemale and male OS scores will tend to be very similar.
Table 2.2 • Comparison of the Occupational Scales by Gender
Women in the GRS Men in the GRS
Correlation Mean Score Mean Score Mean Score Mean Score for Combined on Female on Male Mean on Male on Female Mean
Occupational Scale GRS Scale Scale Difference Scale Scale Difference
Accountant .82 35.52 32.20 3.32 35.62 38.70 –3.08Actuary .92 26.29 18.01 8.28 28.79 36.28 –7.49Administrative Assistant .78 41.22 47.99 –6.77 39.26 37.08 2.18Advertising Account Manager .87 36.67 38.03 –1.35 30.36 30.01 0.35Architect .87 15.87 21.73 –5.87 24.60 25.94 –1.34Art Teacher .90 13.70 23.68 –9.98 11.80 7.33 4.46Artist .89 32.25 29.95 2.30 24.03 31.93 –7.89Arts/Entertainment Manager .92 38.61 42.35 –3.74 37.87 37.79 0.08Athletic Trainer .76 8.72 16.91 –8.19 20.22 13.74 6.48Attorney .95 27.05 24.07 2.97 22.44 28.95 –6.51Auditor .93 36.70 29.83 6.88 34.54 39.48 –4.94Automobile Mechanic .77 23.71 25.11 –1.39 31.91 34.81 –2.90Bartender .67 34.52 33.20 1.32 25.51 33.47 –7.97Biologist .74 21.39 30.07 –8.68 31.39 29.94 1.45Broadcast Journalist .90 35.60 32.52 3.08 29.34 29.02 0.32Business Education Teacher .85 30.93 38.77 –7.83 33.37 27.66 5.71Business/Finance Supervisor .95 37.25 33.95 3.30 35.01 38.35 –3.34Buyer .92 37.94 36.43 1.51 27.25 28.95 –1.70Career Counselor .97 29.90 37.43 –7.53 28.17 22.76 5.41Carpenter .65 20.04 24.34 –4.30 31.17 31.95 –0.77Chef .66 32.90 35.11 –2.21 27.31 25.64 1.67
Note: N = 2,250 (1,125 women and 1,125 men).
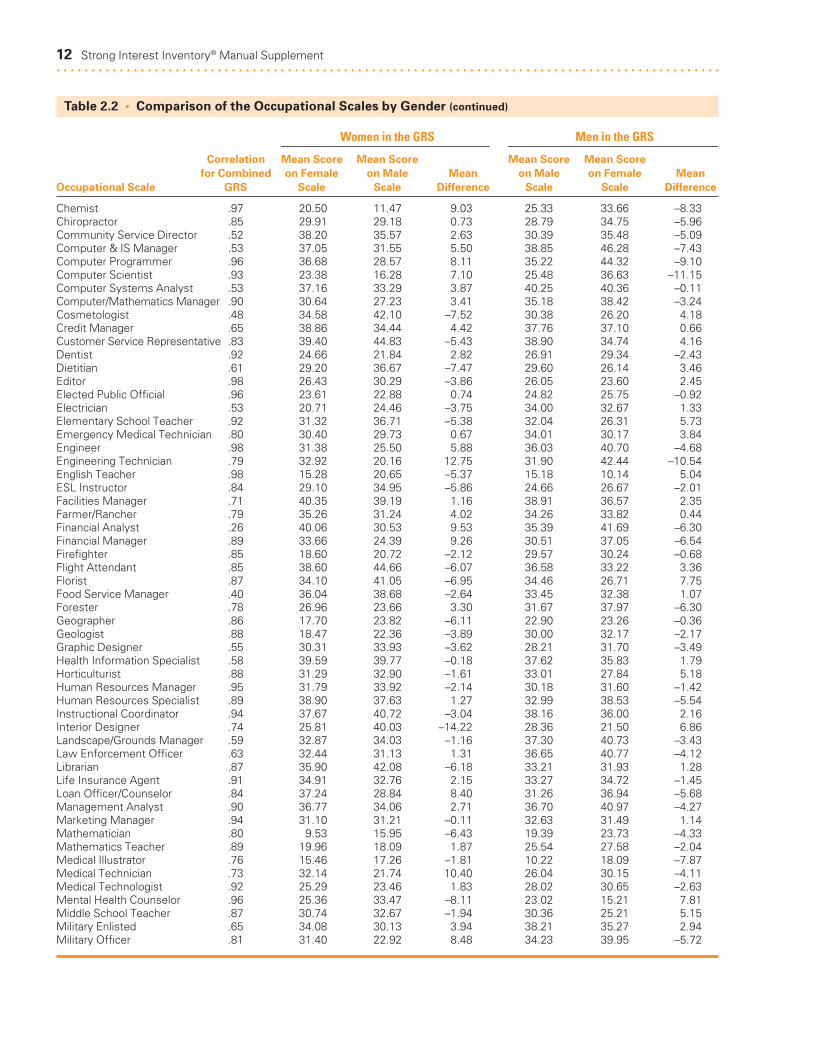
12 Strong Interest Inventory® Manual Supplement. . . . . . . . . . . . . . . . . . . . . . . . . . . . . . . . . . . . . . . . . . . . . . . . . . . . . . . . . . . . . . . . . . . . . . . . . . . . . . . . . . . . . . . . . . . . . . .
Table 2.2 • Comparison of the Occupational Scales by Gender (continued)
Women in the GRS Men in the GRS
Correlation Mean Score Mean Score Mean Score Mean Score for Combined on Female on Male Mean on Male on Female Mean
Occupational Scale GRS Scale Scale Difference Scale Scale Difference
Chemist .97 20.50 11.47 9.03 25.33 33.66 –8.33Chiropractor .85 29.91 29.18 0.73 28.79 34.75 –5.96Community Service Director .52 38.20 35.57 2.63 30.39 35.48 –5.09Computer & IS Manager .53 37.05 31.55 5.50 38.85 46.28 –7.43Computer Programmer .96 36.68 28.57 8.11 35.22 44.32 –9.10Computer Scientist .93 23.38 16.28 7.10 25.48 36.63 –11.15Computer Systems Analyst .53 37.16 33.29 3.87 40.25 40.36 –0.11Computer/Mathematics Manager .90 30.64 27.23 3.41 35.18 38.42 –3.24Cosmetologist .48 34.58 42.10 –7.52 30.38 26.20 4.18Credit Manager .65 38.86 34.44 4.42 37.76 37.10 0.66Customer Service Representative .83 39.40 44.83 –5.43 38.90 34.74 4.16Dentist .92 24.66 21.84 2.82 26.91 29.34 –2.43Dietitian .61 29.20 36.67 –7.47 29.60 26.14 3.46Editor .98 26.43 30.29 –3.86 26.05 23.60 2.45Elected Public Official .96 23.61 22.88 0.74 24.82 25.75 –0.92Electrician .53 20.71 24.46 –3.75 34.00 32.67 1.33Elementary School Teacher .92 31.32 36.71 –5.38 32.04 26.31 5.73Emergency Medical Technician .80 30.40 29.73 0.67 34.01 30.17 3.84Engineer .98 31.38 25.50 5.88 36.03 40.70 –4.68Engineering Technician .79 32.92 20.16 12.75 31.90 42.44 –10.54English Teacher .98 15.28 20.65 –5.37 15.18 10.14 5.04ESL Instructor .84 29.10 34.95 –5.86 24.66 26.67 –2.01Facilities Manager .71 40.35 39.19 1.16 38.91 36.57 2.35Farmer/Rancher .79 35.26 31.24 4.02 34.26 33.82 0.44Financial Analyst .26 40.06 30.53 9.53 35.39 41.69 –6.30Financial Manager .89 33.66 24.39 9.26 30.51 37.05 –6.54Firefighter .85 18.60 20.72 –2.12 29.57 30.24 –0.68Flight Attendant .85 38.60 44.66 –6.07 36.58 33.22 3.36Florist .87 34.10 41.05 –6.95 34.46 26.71 7.75Food Service Manager .40 36.04 38.68 –2.64 33.45 32.38 1.07Forester .78 26.96 23.66 3.30 31.67 37.97 –6.30Geographer .86 17.70 23.82 –6.11 22.90 23.26 –0.36Geologist .88 18.47 22.36 –3.89 30.00 32.17 –2.17Graphic Designer .55 30.31 33.93 –3.62 28.21 31.70 –3.49Health Information Specialist .58 39.59 39.77 –0.18 37.62 35.83 1.79Horticulturist .88 31.29 32.90 –1.61 33.01 27.84 5.18Human Resources Manager .95 31.79 33.92 –2.14 30.18 31.60 –1.42Human Resources Specialist .89 38.90 37.63 1.27 32.99 38.53 –5.54Instructional Coordinator .94 37.67 40.72 –3.04 38.16 36.00 2.16Interior Designer .74 25.81 40.03 –14.22 28.36 21.50 6.86Landscape/Grounds Manager .59 32.87 34.03 –1.16 37.30 40.73 –3.43Law Enforcement Officer .63 32.44 31.13 1.31 36.65 40.77 –4.12Librarian .87 35.90 42.08 –6.18 33.21 31.93 1.28Life Insurance Agent .91 34.91 32.76 2.15 33.27 34.72 –1.45Loan Officer/Counselor .84 37.24 28.84 8.40 31.26 36.94 –5.68Management Analyst .90 36.77 34.06 2.71 36.70 40.97 –4.27Marketing Manager .94 31.10 31.21 –0.11 32.63 31.49 1.14Mathematician .80 9.53 15.95 –6.43 19.39 23.73 –4.33Mathematics Teacher .89 19.96 18.09 1.87 25.54 27.58 –2.04Medical Illustrator .76 15.46 17.26 –1.81 10.22 18.09 –7.87Medical Technician .73 32.14 21.74 10.40 26.04 30.15 –4.11Medical Technologist .92 25.29 23.46 1.83 28.02 30.65 –2.63Mental Health Counselor .96 25.36 33.47 –8.11 23.02 15.21 7.81Middle School Teacher .87 30.74 32.67 –1.94 30.36 25.21 5.15Military Enlisted .65 34.08 30.13 3.94 38.21 35.27 2.94Military Officer .81 31.40 22.92 8.48 34.23 39.95 –5.72
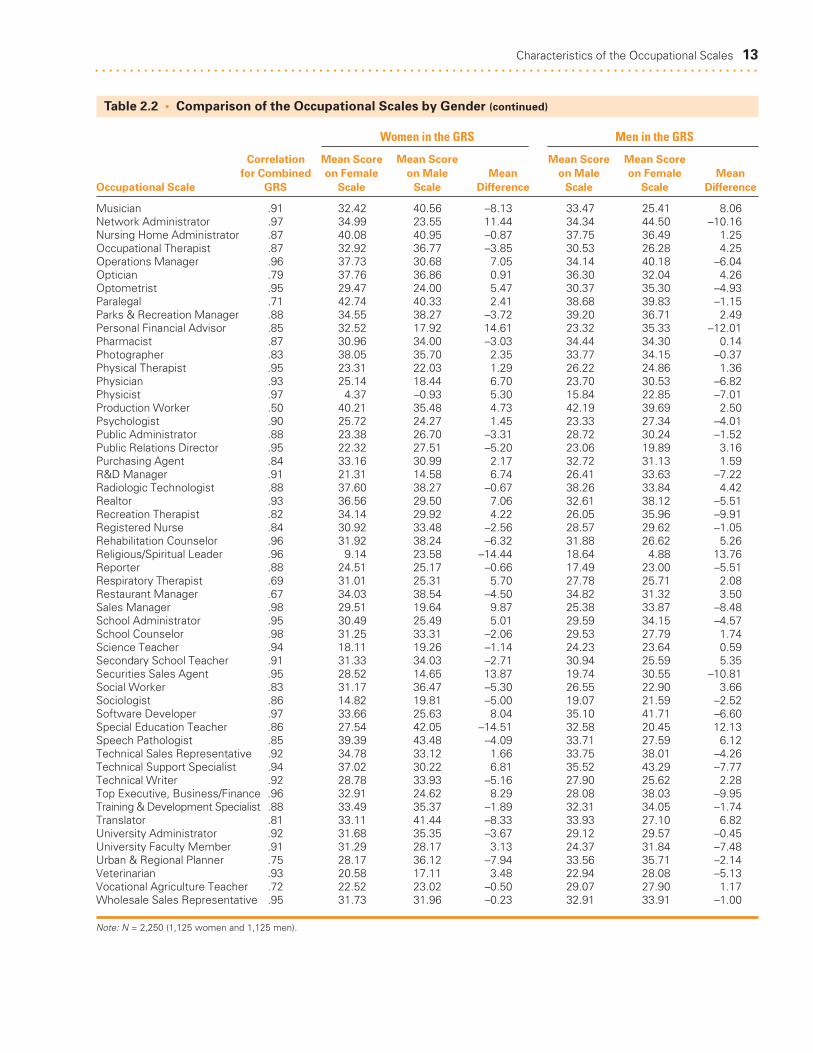
Characteristics of the Occupational Scales 13. . . . . . . . . . . . . . . . . . . . . . . . . . . . . . . . . . . . . . . . . . . . . . . . . . . . . . . . . . . . . . . . . . . . . . . . . . . . . . . . . . . . . . . . . . . . . . .
Table 2.2 • Comparison of the Occupational Scales by Gender (continued)
Women in the GRS Men in the GRS
Correlation Mean Score Mean Score Mean Score Mean Score for Combined on Female on Male Mean on Male on Female Mean
Occupational Scale GRS Scale Scale Difference Scale Scale Difference
Musician .91 32.42 40.56 –8.13 33.47 25.41 8.06Network Administrator .97 34.99 23.55 11.44 34.34 44.50 –10.16Nursing Home Administrator .87 40.08 40.95 –0.87 37.75 36.49 1.25Occupational Therapist .87 32.92 36.77 –3.85 30.53 26.28 4.25Operations Manager .96 37.73 30.68 7.05 34.14 40.18 –6.04Optician .79 37.76 36.86 0.91 36.30 32.04 4.26Optometrist .95 29.47 24.00 5.47 30.37 35.30 –4.93Paralegal .71 42.74 40.33 2.41 38.68 39.83 –1.15Parks & Recreation Manager .88 34.55 38.27 –3.72 39.20 36.71 2.49Personal Financial Advisor .85 32.52 17.92 14.61 23.32 35.33 –12.01Pharmacist .87 30.96 34.00 –3.03 34.44 34.30 0.14Photographer .83 38.05 35.70 2.35 33.77 34.15 –0.37Physical Therapist .95 23.31 22.03 1.29 26.22 24.86 1.36Physician .93 25.14 18.44 6.70 23.70 30.53 –6.82Physicist .97 4.37 –0.93 5.30 15.84 22.85 –7.01Production Worker .50 40.21 35.48 4.73 42.19 39.69 2.50Psychologist .90 25.72 24.27 1.45 23.33 27.34 –4.01Public Administrator .88 23.38 26.70 –3.31 28.72 30.24 –1.52Public Relations Director .95 22.32 27.51 –5.20 23.06 19.89 3.16Purchasing Agent .84 33.16 30.99 2.17 32.72 31.13 1.59R&D Manager .91 21.31 14.58 6.74 26.41 33.63 –7.22Radiologic Technologist .88 37.60 38.27 –0.67 38.26 33.84 4.42Realtor .93 36.56 29.50 7.06 32.61 38.12 –5.51Recreation Therapist .82 34.14 29.92 4.22 26.05 35.96 –9.91Registered Nurse .84 30.92 33.48 –2.56 28.57 29.62 –1.05Rehabilitation Counselor .96 31.92 38.24 –6.32 31.88 26.62 5.26Religious/Spiritual Leader .96 9.14 23.58 –14.44 18.64 4.88 13.76Reporter .88 24.51 25.17 –0.66 17.49 23.00 –5.51Respiratory Therapist .69 31.01 25.31 5.70 27.78 25.71 2.08Restaurant Manager .67 34.03 38.54 –4.50 34.82 31.32 3.50Sales Manager .98 29.51 19.64 9.87 25.38 33.87 –8.48School Administrator .95 30.49 25.49 5.01 29.59 34.15 –4.57School Counselor .98 31.25 33.31 –2.06 29.53 27.79 1.74Science Teacher .94 18.11 19.26 –1.14 24.23 23.64 0.59Secondary School Teacher .91 31.33 34.03 –2.71 30.94 25.59 5.35Securities Sales Agent .95 28.52 14.65 13.87 19.74 30.55 –10.81Social Worker .83 31.17 36.47 –5.30 26.55 22.90 3.66Sociologist .86 14.82 19.81 –5.00 19.07 21.59 –2.52Software Developer .97 33.66 25.63 8.04 35.10 41.71 –6.60Special Education Teacher .86 27.54 42.05 –14.51 32.58 20.45 12.13Speech Pathologist .85 39.39 43.48 –4.09 33.71 27.59 6.12Technical Sales Representative .92 34.78 33.12 1.66 33.75 38.01 –4.26Technical Support Specialist .94 37.02 30.22 6.81 35.52 43.29 –7.77Technical Writer .92 28.78 33.93 –5.16 27.90 25.62 2.28Top Executive, Business/Finance .96 32.91 24.62 8.29 28.08 38.03 –9.95Training & Development Specialist .88 33.49 35.37 –1.89 32.31 34.05 –1.74Translator .81 33.11 41.44 –8.33 33.93 27.10 6.82University Administrator .92 31.68 35.35 –3.67 29.12 29.57 –0.45University Faculty Member .91 31.29 28.17 3.13 24.37 31.84 –7.48Urban & Regional Planner .75 28.17 36.12 –7.94 33.56 35.71 –2.14Veterinarian .93 20.58 17.11 3.48 22.94 28.08 –5.13Vocational Agriculture Teacher .72 22.52 23.02 –0.50 29.07 27.90 1.17Wholesale Sales Representative .95 31.73 31.96 –0.23 32.91 33.91 –1.00
Note: N = 2,250 (1,125 women and 1,125 men).

Test-retest reliability statistics were computed for
each of the OSs and are reported in Table 3.1. As
new, updated, and revised OSs were computed from
existing Strong items, the test-retest sample from 2004
(Donnay et al., 2005) could be used for the current reli-
ability analysis.
The length of time between administrations for thissample ranged from 2 to 23 months. The median test-
retest reliability for the updated OSs was .86, which isregarded as a moderate to high level of reliability (Mur-phy & Davidshofer, 2005). This was also the medianreliability reported for the 2004 OSs (Donnay et al.,2005). Similarly, the range for the updated OSs was.71 to .93; this is the same range reported for the 2004OSs (Donnay et al., 2005) as well. Please note thatTable 3.1 is a replacement for Table 5.4 in theStrong manual.
C H A P T E R
Reliability of the Occupational Scales
15
3
. . . . . . . . . . . . . . . . . . . . . . . . . . . . . . . . . . . . . . . . . . . . . . . . . . . . . . . . . . . . . . . . . . . . . . . . . . . . . . . . . . . . . . . . . . . . . . . . . . . . . . . . . . . . . . . . . . . .
. . . . . . . . . . . . . . . . . . . . . . . . . . . . . . . . . . . . . . . . . . . . . . . . . . . . . . . . . . . . . . . . . . . . . . . . . . . . . . . . . . . . . . . . . . . . . . . . . . . . . . . . . . . . . . . . . . . .

16 Strong Interest Inventory® Manual Supplement. . . . . . . . . . . . . . . . . . . . . . . . . . . . . . . . . . . . . . . . . . . . . . . . . . . . . . . . . . . . . . . . . . . . . . . . . . . . . . . . . . . . . . . . . . . . . . .
Table 3.1 • OS Test-Retest Reliability Statistics
Test Retest
Occupational Scale Gender Mean SD Mean SD
Accountant Female .85 37.11 10.82 37.76 11.17Male .83 34.61 10.93 34.97 10.87
Actuary Female .89 31.57 14.48 32.08 14.58Male .88 26.47 16.27 25.91 16.72
Administrative Assistant Female .78 38.92 10.34 40.63 9.99Male .87 42.12 7.91 42.01 8.12
Advertising Account Manager Female .88 32.32 14.17 31.87 13.56Male .91 36.24 14.21 36.68 14.19
Architect Female .84 24.34 17.88 25.63 18.22Male .83 26.41 16.09 28.05 15.97
Art Teacher Female .83 13.33 18.63 14.50 19.09Male .85 22.32 19.05 23.56 19.68
Artist Female .82 33.32 12.50 32.76 12.59Male .86 30.40 14.16 29.58 14.87
Arts/Entertainment Manager Female .85 40.77 12.00 42.64 11.20Male .84 42.87 11.38 41.75 11.34
Athletic Trainer Female .85 8.41 15.43 10.15 15.53Male .91 14.49 14.67 15.17 15.09
Attorney Female .91 31.32 14.76 32.17 14.70Male .87 27.27 14.94 27.08 14.77
Auditor Female .80 37.90 10.08 39.11 10.34Male .85 34.08 12.73 34.20 13.05
Automobile Mechanic Female .90 24.98 12.85 26.15 13.70Male .91 23.26 12.07 23.28 12.98
Bartender Female .85 32.55 10.92 32.79 11.14Male .79 27.19 13.15 27.45 12.89
Biologist Female .89 30.46 17.33 29.79 17.27Male .88 33.94 14.75 33.42 14.78
Broadcast Journalist Female .92 33.71 13.21 33.75 13.37Male .93 34.50 14.29 34.40 14.57
Business Education Teacher Female .84 28.16 10.35 28.47 10.64Male .84 35.07 10.51 35.91 10.45
Business/Finance Supervisor Female .79 35.85 11.45 36.87 11.91Male .86 33.48 12.65 33.81 12.89
Buyer Female .90 30.81 14.10 30.26 14.00Male .87 27.68 16.30 27.43 16.51
Career Counselor Female .85 30.81 14.16 31.68 14.93Male .86 33.15 14.67 32.09 13.65
Carpenter Female .89 25.16 13.26 25.52 13.70Male .85 25.56 11.35 26.68 12.16
Chef Female .81 29.93 14.42 30.70 14.17Male .77 29.22 13.86 29.83 13.76
Chemist Female .92 29.66 18.36 29.48 17.57Male .91 22.49 20.47 21.79 19.88
Chiropractor Female .85 33.30 12.64 34.81 12.89Male .84 28.41 12.36 30.16 12.84
Community Service Director Female .86 34.17 13.67 34.55 13.28Male .78 36.10 11.63 34.65 11.49
Computer & IS Manager Female .80 40.25 13.65 39.88 14.11Male .87 41.01 10.74 40.30 11.09
Computer Programmer Female .87 39.57 10.59 40.79 10.70Male .91 38.80 11.87 37.37 11.43
Test-RetestCorrelation

Reliability of the Occupational Scales 17. . . . . . . . . . . . . . . . . . . . . . . . . . . . . . . . . . . . . . . . . . . . . . . . . . . . . . . . . . . . . . . . . . . . . . . . . . . . . . . . . . . . . . . . . . . . . . .
Table 3.1 • OS Test-Retest Reliability Statistics (continued)
Test Retest
Occupational Scale Gender Mean SD Mean SD
Computer Scientist Female .90 32.13 16.29 32.48 15.75Male .92 24.11 17.14 23.99 16.68
Computer Systems Analyst Female .71 39.27 13.63 37.47 13.55Male .85 42.95 10.90 41.63 11.52
Computer/Mathematics Manager Female .77 30.45 14.49 31.67 14.45Male .83 36.72 11.60 36.11 11.89
Cosmetologist Female .76 26.98 12.01 28.05 11.97Male .84 35.65 12.49 36.92 12.50
Credit Manager Female .81 37.06 9.91 37.69 10.12Male .84 33.46 11.72 34.38 12.01
Customer Service Representative Female .81 36.92 10.25 38.80 10.03Male .87 40.75 8.27 40.73 8.63
Dentist Female .80 27.29 15.59 29.52 16.08Male .82 25.76 15.25 27.32 16.21
Dietitian Female .79 28.43 11.72 29.33 11.85Male .78 34.17 10.94 35.05 11.57
Editor Female .88 33.19 17.68 35.71 17.22Male .92 34.72 16.90 33.28 17.47
Elected Public Official Female .89 26.46 14.63 26.23 14.31Male .88 25.56 15.52 25.35 15.03
Electrician Female .87 25.47 12.49 26.66 13.25Male .91 23.52 13.21 24.38 13.37
Elementary School Teacher Female .83 30.27 14.23 32.00 14.05Male .88 35.27 11.31 34.54 10.15
Emergency Medical Technician Female .87 25.85 12.16 27.40 12.41Male .92 27.34 12.22 27.84 12.62
Engineer Female .85 34.71 11.59 36.16 11.67Male .90 38.29 13.10 37.40 12.86
Engineering Technician Female .90 37.87 11.97 39.11 12.03Male .90 24.21 14.22 25.36 14.29
English Teacher Female .89 20.58 22.17 21.82 21.84Male .90 25.95 20.05 26.89 19.90
ESL Instructor Female .87 34.80 14.21 35.43 13.96Male .92 37.82 14.29 38.11 14.39
Facilities Manager Female .81 35.83 10.47 37.02 10.93Male .84 34.97 12.33 36.09 12.85
Farmer/Rancher Female .88 31.34 9.25 30.90 8.69Male .91 27.60 11.64 27.07 11.33
Financial Analyst Female .85 38.88 9.98 38.11 10.17Male .89 33.88 12.97 33.50 13.69
Financial Manager Female .83 34.45 11.85 34.89 12.31Male .87 27.62 14.91 27.91 15.28
Firefighter Female .90 22.31 15.58 23.61 15.93Male .92 21.68 13.31 22.54 13.75
Flight Attendant Female .83 33.19 11.99 33.99 11.76Male .85 40.29 11.72 41.05 11.78
Florist Female .79 25.65 13.73 26.80 14.12Male .80 35.00 11.45 35.54 11.44
Food Service Manager Female .79 33.19 8.95 33.83 9.18Male .82 35.48 11.65 36.59 11.51
Forester Female .89 32.92 15.36 33.06 14.85Male .87 25.35 14.23 25.80 13.03
Test-RetestCorrelation

18 Strong Interest Inventory® Manual Supplement. . . . . . . . . . . . . . . . . . . . . . . . . . . . . . . . . . . . . . . . . . . . . . . . . . . . . . . . . . . . . . . . . . . . . . . . . . . . . . . . . . . . . . . . . . . . . . .
Table 3.1 • OS Test-Retest Reliability Statistics (continued)
Test Retest
Occupational Scale Gender Mean SD Mean SD
Geographer Female .89 28.06 16.55 27.80 16.79Male .91 31.83 14.79 31.53 15.11
Geologist Female .93 27.51 17.50 27.05 16.72Male .89 27.80 15.40 27.02 14.73
Graphic Designer Female .84 31.86 14.83 35.06 13.97Male .85 33.75 12.69 33.31 13.22
Health Information Specialist Female .83 37.18 10.18 37.68 10.26Male .72 39.19 10.38 40.41 10.55
Horticulturist Female .78 27.33 12.05 27.62 11.42Male .80 28.87 11.83 29.91 11.48
Human Resources Manager Female .84 31.17 14.57 32.81 14.43Male .84 33.19 13.05 32.25 11.81
Human Resources Specialist Female .76 37.99 10.97 39.36 11.19Male .86 35.60 12.63 34.92 11.79
Instructional Coordinator Female .82 39.20 12.57 41.17 12.48Male .80 42.09 9.39 41.09 8.78
Interior Designer Female .77 23.43 15.13 23.64 15.57Male .89 35.53 12.57 35.86 12.94
Landscape/Grounds Manager Female .87 33.73 12.95 34.34 12.99Male .81 29.56 12.20 30.57 12.27
Law Enforcement Officer Female .89 33.19 11.39 33.70 11.60Male .90 27.86 12.88 28.33 12.91
Librarian Female .91 40.77 14.76 40.53 14.83Male .93 44.94 14.00 44.00 14.81
Life Insurance Agent Female .85 31.67 14.33 31.36 13.24Male .81 29.00 14.21 28.94 13.34
Loan Officer/Counselor Female .80 36.42 10.17 36.96 10.79Male .92 28.32 14.29 28.42 13.75
Management Analyst Female .75 38.46 10.89 39.77 12.30Male .83 38.38 11.69 37.91 11.63
Marketing Manager Female .83 29.06 14.49 30.33 14.60Male .89 33.74 14.25 33.61 13.95
Mathematician Female .91 20.82 19.71 20.76 18.76Male .92 24.23 17.48 23.25 16.96
Mathematics Teacher Female .86 24.78 12.68 25.25 12.58Male .87 21.99 12.49 22.61 12.91
Medical Illustrator Female .83 18.14 16.68 19.26 17.12Male .82 17.63 18.16 19.22 18.64
Medical Technician Female .88 28.30 12.99 28.40 13.08Male .86 21.02 14.24 21.89 15.46
Medical Technologist Female .87 29.20 14.36 30.35 14.24Male .85 27.08 12.78 27.81 13.24
Mental Health Counselor Female .90 26.61 16.74 26.74 17.24Male .91 26.27 14.17 25.80 13.28
Middle School Teacher Female .82 30.96 14.70 31.96 14.22Male .84 33.36 13.69 32.53 11.83
Military Enlisted Female .84 30.89 10.30 31.99 10.70Male .93 28.51 12.98 28.36 13.18
Military Officer Female .83 34.36 10.13 35.02 10.76Male .90 27.26 12.34 28.05 12.33
Musician Female .89 34.26 13.95 34.01 13.99Male .89 41.51 12.45 40.95 12.62
Test-RetestCorrelation
Reliability of the Occupational Scales 19. . . . . . . . . . . . . . . . . . . . . . . . . . . . . . . . . . . . . . . . . . . . . . . . . . . . . . . . . . . . . . . . . . . . . . . . . . . . . . . . . . . . . . . . . . . . . . .
Table 3.1 • OS Test-Retest Reliability Statistics (continued)
Test Retest
Occupational Scale Gender Mean SD Mean SD
Network Administrator Female .88 37.98 10.99 39.48 11.25Male .88 36.91 13.51 35.52 13.76
Nursing Home Administrator Female .79 36.93 11.21 37.81 11.24Male .78 37.56 12.41 38.65 12.35
Occupational Therapist Female .83 30.22 14.26 31.49 14.03Male .79 35.23 13.39 36.54 13.31
Operations Manager Female .81 35.66 12.33 36.87 12.59Male .90 32.79 14.71 32.67 14.47
Optician Female .77 31.09 11.72 31.76 11.21Male .83 32.27 11.21 32.31 11.27
Optometrist Female .87 34.21 12.48 35.28 12.40Male .85 28.91 15.52 29.83 15.63
Paralegal Female .76 41.43 10.05 41.19 10.87Male .84 40.81 11.93 40.55 12.68
Parks & Recreation Manager Female .82 33.12 12.51 33.33 12.45Male .87 36.10 10.94 36.24 11.11
Personal Financial Advisor Female .79 31.05 11.42 31.32 11.65Male .92 20.33 16.46 20.22 15.92
Pharmacist Female .83 32.46 13.68 33.89 14.54Male .78 32.74 12.56 34.87 12.76
Photographer Female .90 38.19 11.72 38.23 12.10Male .85 36.73 11.62 37.46 12.46
Physical Therapist Female .82 22.65 18.04 25.11 18.50Male .83 22.39 19.02 24.13 19.07
Physician Female .88 29.99 14.64 29.90 14.61Male .86 24.29 16.04 24.35 15.98
Physicist Female .91 18.24 23.56 17.83 23.04Male .90 13.12 25.75 12.98 24.72
Production Worker Female .89 35.58 10.06 35.20 9.84Male .86 32.79 11.66 33.87 11.92
Psychologist Female .89 33.07 13.58 34.36 13.59Male .86 31.86 15.81 29.54 16.04
Public Administrator Female .88 30.98 15.92 30.30 15.57Male .89 32.40 15.17 32.58 14.74
Public Relations Director Female .89 23.95 18.93 24.35 18.31Male .89 29.01 18.21 29.34 17.75
Purchasing Agent Female .88 29.30 15.15 29.98 15.26Male .85 30.39 13.34 31.20 13.85
R&D Manager Female .90 29.89 16.61 29.76 16.30Male .90 23.12 16.63 23.04 16.04
Radiologic Technologist Female .85 32.01 11.60 32.90 12.17Male .89 34.53 11.35 35.08 11.26
Realtor Female .83 32.94 11.09 33.82 10.81Male .87 28.58 13.69 29.09 12.76
Recreation Therapist Female .84 34.64 11.14 35.53 10.80Male .85 28.59 13.35 29.45 13.04
Registered Nurse Female .83 31.74 13.24 34.39 13.08Male .81 33.31 15.66 35.01 16.70
Rehabilitation Counselor Female .81 33.44 13.63 34.80 14.12Male .85 36.87 12.48 35.65 12.01
Religious/Spiritual Leader Female .85 11.42 20.45 14.15 21.05Male .84 25.50 16.47 22.79 15.52
Test-RetestCorrelation

Table 3.1 • OS Test-Retest Reliability Statistics (continued)
Test Retest
Occupational Scale Gender Mean SD Mean SD
Reporter Female .91 28.41 16.71 28.80 17.87Male .91 30.34 19.79 30.84 20.08
Respiratory Therapist Female .85 28.21 14.14 29.03 14.81Male .82 27.88 13.66 30.01 14.39
Restaurant Manager Female .88 30.41 14.89 30.70 14.44Male .90 31.75 14.11 31.51 13.81
Sales Manager Female .81 27.52 14.24 28.60 13.83Male .92 23.08 17.30 22.81 16.65
School Administrator Female .86 33.16 14.45 34.07 13.30Male .83 27.87 13.97 28.56 13.57
School Counselor Female .86 31.51 13.10 31.53 13.20Male .86 34.41 12.80 34.41 13.43
Science Teacher Female .83 24.06 14.12 24.82 14.32Male .82 24.12 13.77 25.01 13.54
Secondary School Teacher Female .85 32.10 14.20 33.37 14.66Male .84 36.72 12.92 35.12 12.58
Securities Sales Agent Female .80 26.25 12.14 27.09 12.30Male .92 17.62 20.69 16.82 19.97
Social Worker Female .84 31.31 13.83 32.79 13.97Male .90 30.76 12.43 29.81 11.92
Sociologist Female .86 26.16 17.56 26.01 17.21Male .87 30.06 17.95 30.39 18.01
Software Developer Female .88 37.00 11.50 38.19 11.79Male .88 38.31 12.78 37.05 12.76
Special Education Teacher Female .85 27.21 14.13 28.60 13.89Male .83 38.44 15.36 39.30 15.19
Speech Pathologist Female .83 34.74 13.01 35.22 13.43Male .86 40.76 12.09 41.12 12.21
Technical Sales Representative Female .78 33.58 10.40 34.85 10.54Male .93 32.60 12.44 32.39 11.99
Technical Support Specialist Female .86 38.16 10.99 40.03 10.50Male .85 39.21 11.01 38.16 11.72
Technical Writer Female .88 34.90 17.19 35.57 16.66Male .91 38.94 16.29 39.09 15.89
Top Executive, Business/Finance Female .83 31.81 12.14 33.15 12.11Male .88 27.59 17.36 27.24 16.99
Training & Development Specialist Female .81 33.13 12.64 34.02 12.32Male .87 37.32 12.98 35.77 12.60
Translator Female .89 37.31 14.36 37.37 14.84Male .92 43.80 11.63 43.31 12.11
University Administrator Female .84 33.43 13.68 34.67 13.71Male .85 34.88 12.41 33.57 12.07
University Faculty Member Female .86 37.04 11.04 38.47 10.56Male .89 33.06 14.41 31.01 14.08
Urban & Regional Planner Female .88 25.57 16.89 27.26 16.93Male .84 19.58 17.81 21.24 18.60
Veterinarian Female .82 22.66 12.78 23.79 12.62Male .90 21.80 10.91 22.37 11.44
Vocational Agriculture Teacher Female .87 35.90 14.10 36.87 13.81Male .89 40.68 11.20 41.18 11.59
Wholesale Sales Representative Female .82 28.96 13.31 30.28 13.10Male .91 31.03 13.15 30.92 12.80
Test-RetestCorrelation
Note: Results are from the overall test-retest sample, N = 174 (109 women and 65 men). A description of this sample is provided on page 10 of the Strong manual.
20 Strong Interest Inventory® Manual Supplement. . . . . . . . . . . . . . . . . . . . . . . . . . . . . . . . . . . . . . . . . . . . . . . . . . . . . . . . . . . . . . . . . . . . . . . . . . . . . . . . . . . . . . . . . . . . . . .
Anumber of analyses were computed to examine
the validity of the OSs. Concurrent validity was
examined using the correlations among the OSs—
specifically, correlations determine whether OSs with
the same Theme code are more similar to each other
than to OSs in general. Correlations between the OSs
and the General Occupational Themes (GOTs), Basic
Interest Scales (BISs), and Personal Style Scales (PSSs)
were also computed. By comparing the scores of people
who are currently employed in different occupations,
correlations between the OSs and other Strong instru-
ment scales can speak to the validity of each scale. If
the scales are working as they should, people will score
high on scales relevant to their own occupation.
Correlations Among the Occupational Scales
Discriminant validity can be evaluated by examiningthe correlations among the OSs, where OSs withinThemes are expected to be more strongly related thanOSs overall. As shown in Table 4.1, the median corre-lations within Theme for women ranged from .34 forConventional to .61 for Investigative. The median cor-relations for men ranged from .45 for Realistic to .57for Artistic. These results show that the OSs that sharethe same Theme tend to be related to a greater extent
than OSs overall. In addition, the low overall mediancorrelation shows that in general the OSs are measur-ing the unique interests of people in these occupa-tions; that is, each OS provides a measure of uniquequalities. These findings provide support for the dis-criminant validity of the OSs. Please note that Table4.1 is a replacement for Table 5.6 in the Strongmanual.It should be noted that the correlational patterns
here are somewhat different from those reported in theStrong manual, as the median correlations for womenranged from .39 for Conventional, Realistic, andSocial to .57 for Artistic, while the median correlationsreported for men ranged from .27 for Conventional to.58 for Investigative. Nevertheless, the overall findingsremain the same; OSs within each Theme are moresimilar than are OSs across all Themes.
C H A P T E R
Validity of the Occupational Scales
21
4
Table 4.1 • OS Correlations Overall and WithinTheme for Women and Men in the GRS
OS Correlation
Theme Women r Men r
Realistic .39 .45
Investigative .61 .55
Artistic .54 .57
Social .50 .52
Enterprising .46 .51
Conventional .34 .51
Overall .15 .16
Note: N = 2,250 (1,125 women and 1,125 men).
. . . . . . . . . . . . . . . . . . . . . . . . . . . . . . . . . . . . . . . . . . . . . . . . . . . . . . . . . . . . . . . . . . . . . . . . . . . . . . . . . . . . . . . . . . . . . . . . . . . . . . . . . . . . . . . . . . . .
. . . . . . . . . . . . . . . . . . . . . . . . . . . . . . . . . . . . . . . . . . . . . . . . . . . . . . . . . . . . . . . . . . . . . . . . . . . . . . . . . . . . . . . . . . . . . . . . . . . . . . . . . . . . . . . . . . . .
These correlations can help provide a better under-standing of each of the GOTs and can help confirm theconstructs underlying each Theme. For example, strongpositive relationships exist between the Artistic GOTand OSs such as Arts/Entertainment Manager and Edi-tor. These relationships provide a powerful demonstra-tion of the validity of the GOTs. Please refer to theStrong manual (Figures 3.2–3.7) for correlations withexisting OSs.
22 Strong Interest Inventory® Manual Supplement. . . . . . . . . . . . . . . . . . . . . . . . . . . . . . . . . . . . . . . . . . . . . . . . . . . . . . . . . . . . . . . . . . . . . . . . . . . . . . . . . . . . . . . . . . . . . . .
Table 4.2 • Ten Highest and Lowest Correlations Between Realistic Theme and OS Scores for Women and Men in the GRS
Female Occupational Scale Women r Male Occupational Scale Men r
Engineer .70 Engineer .69
Network Administrator .68 Computer & IS Manager .65
Technical Support Specialist .67 Network Administrator .64
Computer Programmer .64 Software Developer .62
Software Developer .61 Technical Support Specialist .59
Graphic Designer .51 Computer/Mathematics Manager .58
Registered Nurse .49 Computer Systems Analyst .57
Computer/Mathematics Manager .45 Computer Programmer .54
Technical Sales Representative .43 Accountant .37
Management Analyst .38 Auditor .36
Training & Development Specialist .13 Human Resources Manager .08
Bartender .11 Attorney .08
Secondary School Teacher .09 Training & Development Specialist .07
Loan Officer/Counselor .08 Editor .07
Elementary School Teacher .07 University Faculty Member .07
Middle School Teacher .06 Human Resources Specialist .04
Social Worker .01 University Administrator –.03
Special Education Teacher –.01 Career Counselor –.04
Career Counselor –.03 Social Worker –.20
Mental Health Counselor –.23 Mental Health Counselor –.26
Note: N = 2,250 (1,125 women and 1,125 men). Ten highest correlations are shaded; 10 lowest correlations are not shaded.
Correlations Between the GOTs andthe OSs
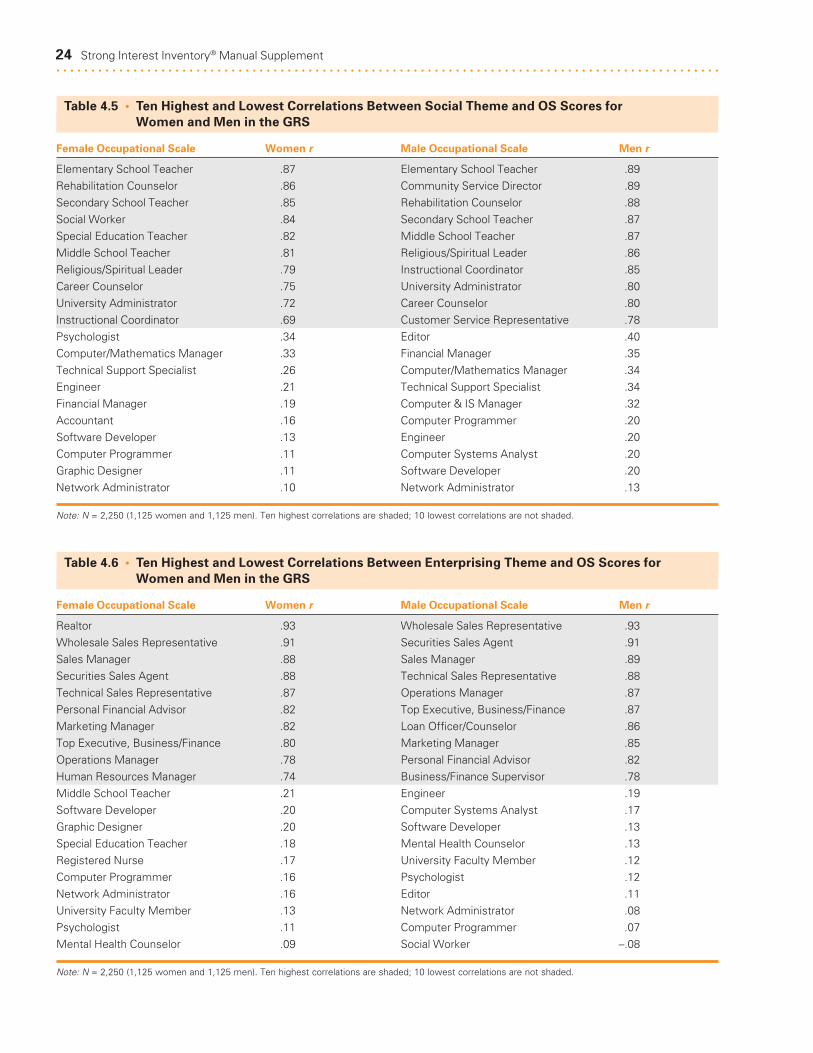
Tables 4.2–4.7 illustrate the relationship between eachof the six General Occupational Themes (GOTs) andthe new, updated, and revised OSs. The tables showthe 10 highest-correlating and 10 lowest-correlatingOSs—separately for women and men—for each GOT.

Validity of the Occupational Scales 23. . . . . . . . . . . . . . . . . . . . . . . . . . . . . . . . . . . . . . . . . . . . . . . . . . . . . . . . . . . . . . . . . . . . . . . . . . . . . . . . . . . . . . . . . . . . . . .
Table 4.4 • Ten Highest and Lowest Correlations Between Artistic Theme and OS Scores for Women and Men in the GRS
Female Occupational Scale Women r Male Occupational Scale Men r
Editor .92 Arts/Entertainment Manager .93
Arts/Entertainment Manager .88 Editor .90
Graphic Designer .79 Instructional Coordinator .66
Instructional Coordinator .68 Bartender .64
Attorney .65 Secondary School Teacher .64
Psychologist .61 Attorney .62
Religious/Spiritual Leader .59 University Faculty Member .61
University Faculty Member .57 Psychologist .59
University Administrator .53 Community Service Director .59
Rehabilitation Counselor .51 Rehabilitation Counselor .58
Technical Support Specialist .22 Accountant .18
Computer Programmer .21 Engineer .17
Bartender .20 Computer/Mathematics Manager .17
Loan Officer/Counselor .18 Operations Manager .17
Auditor .12 Financial Analyst .17
Business/Finance Supervisor .08 Computer Programmer .16
Administrative Assistant .01 Business/Finance Supervisor .15
Customer Service Representative .00 Computer Systems Analyst .13
Financial Manager .00 Network Administrator .13
Accountant –.12 Financial Manager .08
Note: N = 2,250 (1,125 women and 1,125 men). Ten highest correlations are shaded; 10 lowest correlations are not shaded.
Table 4.3 • Ten Highest and Lowest Correlations Between Investigative Theme and OS Scores for Women and Men in the GRS
Female Occupational Scale Women r Male Occupational Scale Men r
Engineer .84 Engineer .84
Registered Nurse .76 Software Developer .79
Network Administrator .73 Computer Programmer .76
Software Developer .71 Network Administrator .74
Computer Programmer .70 Psychologist .72
University Faculty Member .68 Computer/Mathematics Manager .66
Psychologist .60 Technical Support Specialist .61
Technical Support Specialist .56 Computer Systems Analyst .60
Management Analyst .44 Computer & IS Manager .59
Computer/Mathematics Manager .42 University Faculty Member .59
Social Worker .12 Marketing Manager .15
Elementary School Teacher .11 Securities Sales Agent .15
Marketing Manager .10 Career Counselor .12
Middle School Teacher .10 Human Resources Specialist .10
Administrative Assistant .09 Wholesale Sales Representative .10
Career Counselor .08 Technical Sales Representative .08
Special Education Teacher .06 Loan Officer/Counselor .04
Loan Officer/Counselor .06 Social Worker –.03
Bartender –.03 Bartender –.06
Mental Health Counselor –.10 Mental Health Counselor –.21
Note: N = 2,250 (1,125 women and 1,125 men). Ten highest correlations are shaded; 10 lowest correlations are not shaded.
24 Strong Interest Inventory® Manual Supplement. . . . . . . . . . . . . . . . . . . . . . . . . . . . . . . . . . . . . . . . . . . . . . . . . . . . . . . . . . . . . . . . . . . . . . . . . . . . . . . . . . . . . . . . . . . . . . .
Table 4.6 • Ten Highest and Lowest Correlations Between Enterprising Theme and OS Scores for Women and Men in the GRS
Female Occupational Scale Women r Male Occupational Scale Men r
Realtor .93 Wholesale Sales Representative .93
Wholesale Sales Representative .91 Securities Sales Agent .91
Sales Manager .88 Sales Manager .89
Securities Sales Agent .88 Technical Sales Representative .88
Technical Sales Representative .87 Operations Manager .87
Personal Financial Advisor .82 Top Executive, Business/Finance .87
Marketing Manager .82 Loan Officer/Counselor .86
Top Executive, Business/Finance .80 Marketing Manager .85
Operations Manager .78 Personal Financial Advisor .82
Human Resources Manager .74 Business/Finance Supervisor .78
Middle School Teacher .21 Engineer .19
Software Developer .20 Computer Systems Analyst .17
Graphic Designer .20 Software Developer .13
Special Education Teacher .18 Mental Health Counselor .13
Registered Nurse .17 University Faculty Member .12
Computer Programmer .16 Psychologist .12
Network Administrator .16 Editor .11
University Faculty Member .13 Network Administrator .08
Psychologist .11 Computer Programmer .07
Mental Health Counselor .09 Social Worker –.08
Note: N = 2,250 (1,125 women and 1,125 men). Ten highest correlations are shaded; 10 lowest correlations are not shaded.
Table 4.5 • Ten Highest and Lowest Correlations Between Social Theme and OS Scores for Women and Men in the GRS
Female Occupational Scale Women r Male Occupational Scale Men r
Elementary School Teacher .87 Elementary School Teacher .89
Rehabilitation Counselor .86 Community Service Director .89
Secondary School Teacher .85 Rehabilitation Counselor .88
Social Worker .84 Secondary School Teacher .87
Special Education Teacher .82 Middle School Teacher .87
Middle School Teacher .81 Religious/Spiritual Leader .86
Religious/Spiritual Leader .79 Instructional Coordinator .85
Career Counselor .75 University Administrator .80
University Administrator .72 Career Counselor .80
Instructional Coordinator .69 Customer Service Representative .78
Psychologist .34 Editor .40
Computer/Mathematics Manager .33 Financial Manager .35
Technical Support Specialist .26 Computer/Mathematics Manager .34
Engineer .21 Technical Support Specialist .34
Financial Manager .19 Computer & IS Manager .32
Accountant .16 Computer Programmer .20
Software Developer .13 Engineer .20
Computer Programmer .11 Computer Systems Analyst .20
Graphic Designer .11 Software Developer .20
Network Administrator .10 Network Administrator .13
Note: N = 2,250 (1,125 women and 1,125 men). Ten highest correlations are shaded; 10 lowest correlations are not shaded.
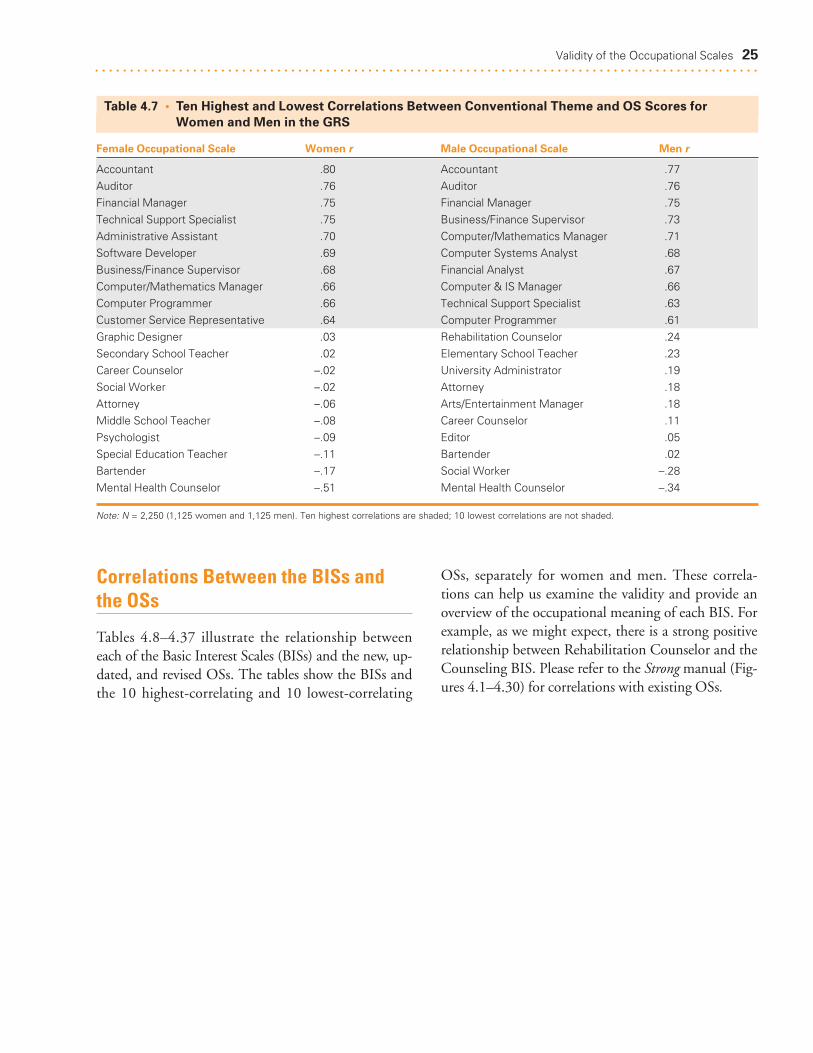
Validity of the Occupational Scales 25. . . . . . . . . . . . . . . . . . . . . . . . . . . . . . . . . . . . . . . . . . . . . . . . . . . . . . . . . . . . . . . . . . . . . . . . . . . . . . . . . . . . . . . . . . . . . . .
Table 4.7 • Ten Highest and Lowest Correlations Between Conventional Theme and OS Scores for Women and Men in the GRS
Female Occupational Scale Women r Male Occupational Scale Men r
Accountant .80 Accountant .77
Auditor .76 Auditor .76
Financial Manager .75 Financial Manager .75
Technical Support Specialist .75 Business/Finance Supervisor .73
Administrative Assistant .70 Computer/Mathematics Manager .71
Software Developer .69 Computer Systems Analyst .68
Business/Finance Supervisor .68 Financial Analyst .67
Computer/Mathematics Manager .66 Computer & IS Manager .66
Computer Programmer .66 Technical Support Specialist .63
Customer Service Representative .64 Computer Programmer .61
Graphic Designer .03 Rehabilitation Counselor .24
Secondary School Teacher .02 Elementary School Teacher .23
Career Counselor –.02 University Administrator .19
Social Worker –.02 Attorney .18
Attorney –.06 Arts/Entertainment Manager .18
Middle School Teacher –.08 Career Counselor .11
Psychologist –.09 Editor .05
Special Education Teacher –.11 Bartender .02
Bartender –.17 Social Worker –.28
Mental Health Counselor –.51 Mental Health Counselor –.34
Note: N = 2,250 (1,125 women and 1,125 men). Ten highest correlations are shaded; 10 lowest correlations are not shaded.
Correlations Between the BISs andthe OSs
Tables 4.8–4.37 illustrate the relationship betweeneach of the Basic Interest Scales (BISs) and the new, up-dated, and revised OSs. The tables show the BISs andthe 10 highest-correlating and 10 lowest-correlating
OSs, separately for women and men. These correla-tions can help us examine the validity and provide anoverview of the occupational meaning of each BIS. Forexample, as we might expect, there is a strong positiverelationship between Rehabilitation Counselor and theCounseling BIS. Please refer to the Strong manual (Fig-ures 4.1–4.30) for correlations with existing OSs.
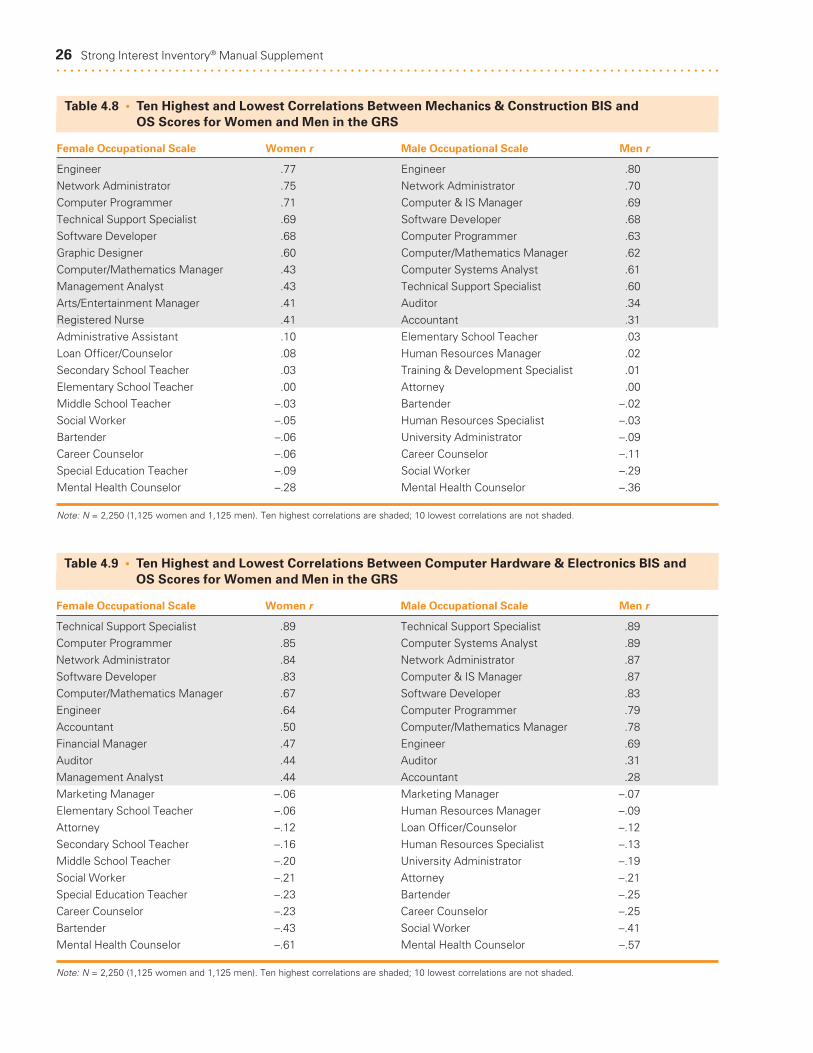
26 Strong Interest Inventory® Manual Supplement. . . . . . . . . . . . . . . . . . . . . . . . . . . . . . . . . . . . . . . . . . . . . . . . . . . . . . . . . . . . . . . . . . . . . . . . . . . . . . . . . . . . . . . . . . . . . . .
Table 4.9 • Ten Highest and Lowest Correlations Between Computer Hardware & Electronics BIS and OS Scores for Women and Men in the GRS
Female Occupational Scale Women r Male Occupational Scale Men r
Technical Support Specialist .89 Technical Support Specialist .89
Computer Programmer .85 Computer Systems Analyst .89
Network Administrator .84 Network Administrator .87
Software Developer .83 Computer & IS Manager .87
Computer/Mathematics Manager .67 Software Developer .83
Engineer .64 Computer Programmer .79
Accountant .50 Computer/Mathematics Manager .78
Financial Manager .47 Engineer .69
Auditor .44 Auditor .31
Management Analyst .44 Accountant .28
Marketing Manager –.06 Marketing Manager –.07
Elementary School Teacher –.06 Human Resources Manager –.09
Attorney –.12 Loan Officer/Counselor –.12
Secondary School Teacher –.16 Human Resources Specialist –.13
Middle School Teacher –.20 University Administrator –.19
Social Worker –.21 Attorney –.21
Special Education Teacher –.23 Bartender –.25
Career Counselor –.23 Career Counselor –.25
Bartender –.43 Social Worker –.41
Mental Health Counselor –.61 Mental Health Counselor –.57
Note: N = 2,250 (1,125 women and 1,125 men). Ten highest correlations are shaded; 10 lowest correlations are not shaded.
Table 4.8 • Ten Highest and Lowest Correlations Between Mechanics & Construction BIS and OS Scores for Women and Men in the GRS
Female Occupational Scale Women r Male Occupational Scale Men r
Engineer .77 Engineer .80
Network Administrator .75 Network Administrator .70
Computer Programmer .71 Computer & IS Manager .69
Technical Support Specialist .69 Software Developer .68
Software Developer .68 Computer Programmer .63
Graphic Designer .60 Computer/Mathematics Manager .62
Computer/Mathematics Manager .43 Computer Systems Analyst .61
Management Analyst .43 Technical Support Specialist .60
Arts/Entertainment Manager .41 Auditor .34
Registered Nurse .41 Accountant .31
Administrative Assistant .10 Elementary School Teacher .03
Loan Officer/Counselor .08 Human Resources Manager .02
Secondary School Teacher .03 Training & Development Specialist .01
Elementary School Teacher .00 Attorney .00
Middle School Teacher –.03 Bartender –.02
Social Worker –.05 Human Resources Specialist –.03
Bartender –.06 University Administrator –.09
Career Counselor –.06 Career Counselor –.11
Special Education Teacher –.09 Social Worker –.29
Mental Health Counselor –.28 Mental Health Counselor –.36
Note: N = 2,250 (1,125 women and 1,125 men). Ten highest correlations are shaded; 10 lowest correlations are not shaded.

Validity of the Occupational Scales 27. . . . . . . . . . . . . . . . . . . . . . . . . . . . . . . . . . . . . . . . . . . . . . . . . . . . . . . . . . . . . . . . . . . . . . . . . . . . . . . . . . . . . . . . . . . . . . .
Table 4.11 • Ten Highest and Lowest Correlations Between Protective Services BIS and OS Scores for Women and Men in the GRS
Female Occupational Scale Women r Male Occupational Scale Men r
Registered Nurse .53 Computer & IS Manager .37
Engineer .39 Engineer .37
Technical Sales Representative .38 Technical Support Specialist .36
Technical Support Specialist .37 Network Administrator .35
Network Administrator .33 Computer/Mathematics Manager .34
Computer Programmer .31 Software Developer .32
Software Developer .29 Customer Service Representative .31
Customer Service Representative .28 Middle School Teacher .31
Realtor .28 Technical Sales Representative .31
Bartender .27 Computer Systems Analyst .30
Editor .15 Arts/Entertainment Manager .19
Social Worker .15 Marketing Manager .18
Religious/Spiritual Leader .14 Training & Development Specialist .17
Accountant .14 Human Resources Specialist .17
Special Education Teacher .14 Career Counselor .14
Training & Development Specialist .13 University Administrator .13
Financial Manager .13 University Faculty Member .06
Loan Officer/Counselor .12 Editor .05
Career Counselor .10 Social Worker .05
Mental Health Counselor –.01 Mental Health Counselor .02
Note: N = 2,250 (1,125 women and 1,125 men). Ten highest correlations are shaded; 10 lowest correlations are not shaded.
Table 4.10 • Ten Highest and Lowest Correlations Between Military BIS and OS Scores for Women and Men in the GRS
Female Occupational Scale Women r Male Occupational Scale Men r
Registered Nurse .39 Engineer .40
Engineer .39 Computer & IS Manager .38
Technical Support Specialist .38 Computer/Mathematics Manager .36
Network Administrator .35 Software Developer .34
Computer Programmer .33 Network Administrator .34
Software Developer .31 Technical Support Specialist .32
Technical Sales Representative .31 Auditor .30
Computer/Mathematics Manager .31 Computer Systems Analyst .30
Sales Manager .27 Operations Manager .29
Top Executive, Business/Finance .27 Business/Finance Supervisor .29
Secondary School Teacher .14 Training & Development Specialist .16
Marketing Manager .13 Human Resources Specialist .16
Graphic Designer .12 Arts/Entertainment Manager .12
Editor .12 Bartender .11
Elementary School Teacher .11 University Administrator .11
Middle School Teacher .11 University Faculty Member .09
Social Worker .09 Career Counselor .08
Special Education Teacher .08 Editor .04
Career Counselor .07 Social Worker –.02
Mental Health Counselor –.08 Mental Health Counselor –.05
Note: N = 2,250 (1,125 women and 1,125 men). Ten highest correlations are shaded; 10 lowest correlations are not shaded.
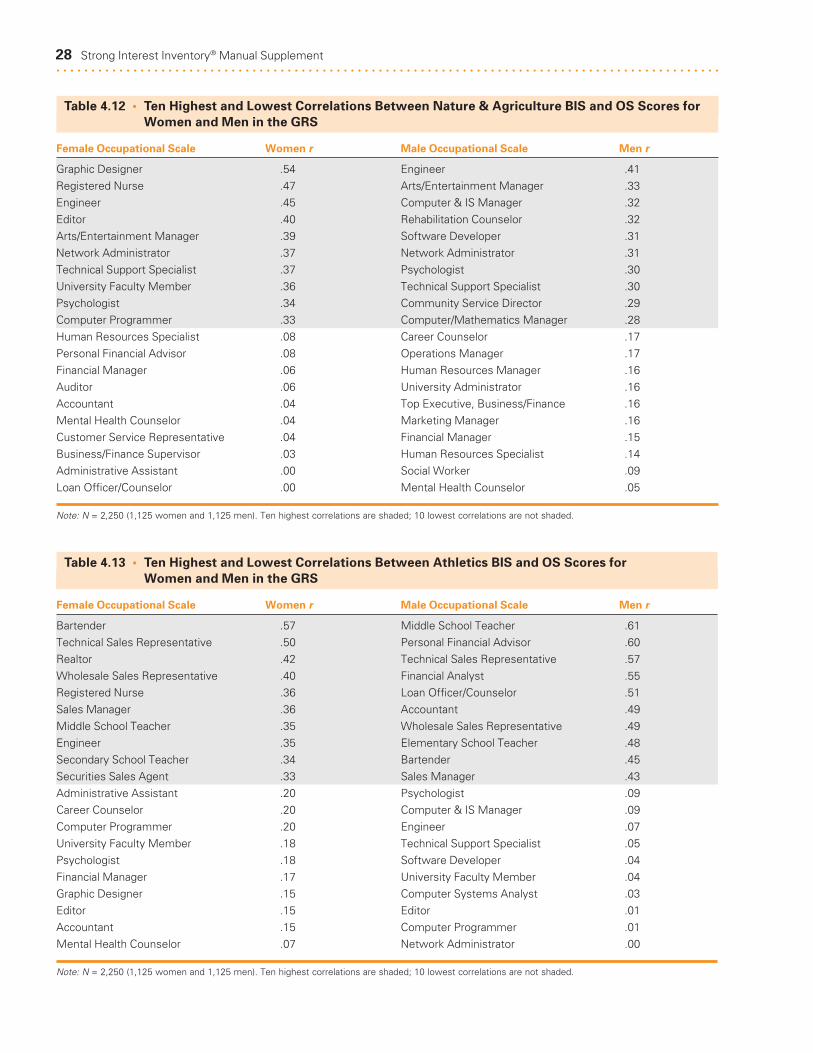
28 Strong Interest Inventory® Manual Supplement. . . . . . . . . . . . . . . . . . . . . . . . . . . . . . . . . . . . . . . . . . . . . . . . . . . . . . . . . . . . . . . . . . . . . . . . . . . . . . . . . . . . . . . . . . . . . . .
Table 4.13 • Ten Highest and Lowest Correlations Between Athletics BIS and OS Scores for Women and Men in the GRS
Female Occupational Scale Women r Male Occupational Scale Men r
Bartender .57 Middle School Teacher .61
Technical Sales Representative .50 Personal Financial Advisor .60
Realtor .42 Technical Sales Representative .57
Wholesale Sales Representative .40 Financial Analyst .55
Registered Nurse .36 Loan Officer/Counselor .51
Sales Manager .36 Accountant .49
Middle School Teacher .35 Wholesale Sales Representative .49
Engineer .35 Elementary School Teacher .48
Secondary School Teacher .34 Bartender .45
Securities Sales Agent .33 Sales Manager .43
Administrative Assistant .20 Psychologist .09
Career Counselor .20 Computer & IS Manager .09
Computer Programmer .20 Engineer .07
University Faculty Member .18 Technical Support Specialist .05
Psychologist .18 Software Developer .04
Financial Manager .17 University Faculty Member .04
Graphic Designer .15 Computer Systems Analyst .03
Editor .15 Editor .01
Accountant .15 Computer Programmer .01
Mental Health Counselor .07 Network Administrator .00
Note: N = 2,250 (1,125 women and 1,125 men). Ten highest correlations are shaded; 10 lowest correlations are not shaded.
Table 4.12 • Ten Highest and Lowest Correlations Between Nature & Agriculture BIS and OS Scores for Women and Men in the GRS
Female Occupational Scale Women r Male Occupational Scale Men r
Graphic Designer .54 Engineer .41
Registered Nurse .47 Arts/Entertainment Manager .33
Engineer .45 Computer & IS Manager .32
Editor .40 Rehabilitation Counselor .32
Arts/Entertainment Manager .39 Software Developer .31
Network Administrator .37 Network Administrator .31
Technical Support Specialist .37 Psychologist .30
University Faculty Member .36 Technical Support Specialist .30
Psychologist .34 Community Service Director .29
Computer Programmer .33 Computer/Mathematics Manager .28
Human Resources Specialist .08 Career Counselor .17
Personal Financial Advisor .08 Operations Manager .17
Financial Manager .06 Human Resources Manager .16
Auditor .06 University Administrator .16
Accountant .04 Top Executive, Business/Finance .16
Mental Health Counselor .04 Marketing Manager .16
Customer Service Representative .04 Financial Manager .15
Business/Finance Supervisor .03 Human Resources Specialist .14
Administrative Assistant .00 Social Worker .09
Loan Officer/Counselor .00 Mental Health Counselor .05
Note: N = 2,250 (1,125 women and 1,125 men). Ten highest correlations are shaded; 10 lowest correlations are not shaded.
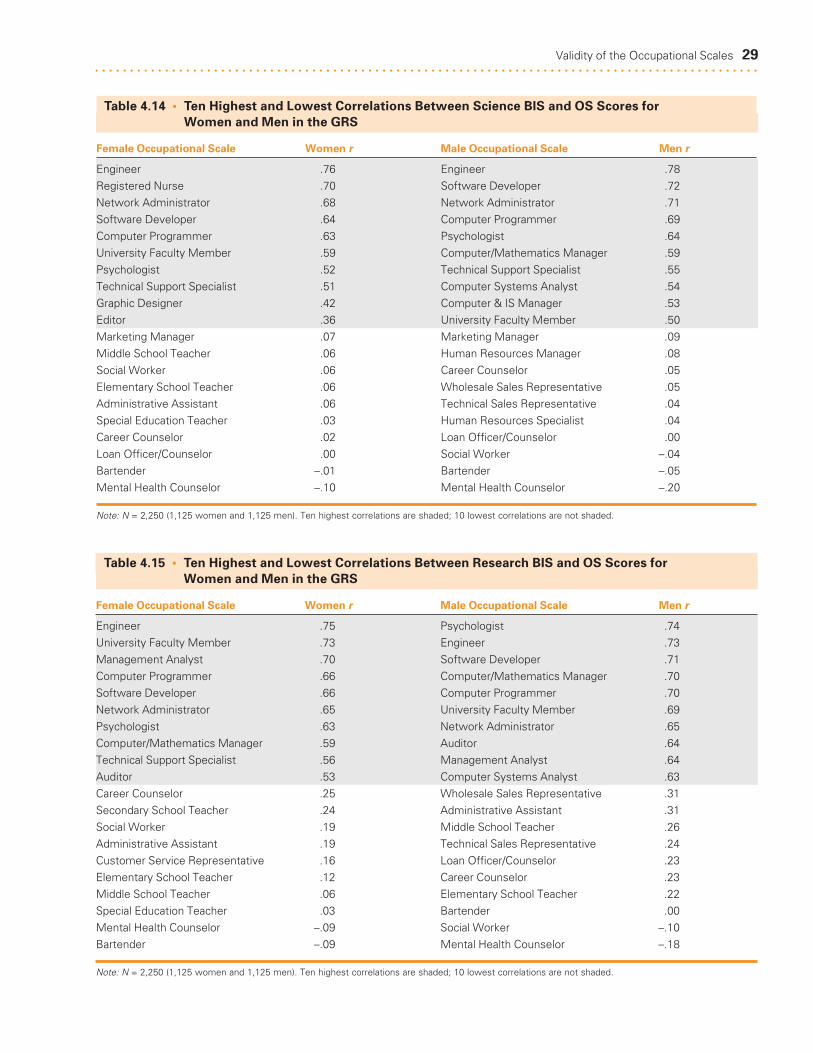
Validity of the Occupational Scales 29. . . . . . . . . . . . . . . . . . . . . . . . . . . . . . . . . . . . . . . . . . . . . . . . . . . . . . . . . . . . . . . . . . . . . . . . . . . . . . . . . . . . . . . . . . . . . . .
Table 4.15 • Ten Highest and Lowest Correlations Between Research BIS and OS Scores for Women and Men in the GRS
Female Occupational Scale Women r Male Occupational Scale Men r
Engineer .75 Psychologist .74
University Faculty Member .73 Engineer .73
Management Analyst .70 Software Developer .71
Computer Programmer .66 Computer/Mathematics Manager .70
Software Developer .66 Computer Programmer .70
Network Administrator .65 University Faculty Member .69
Psychologist .63 Network Administrator .65
Computer/Mathematics Manager .59 Auditor .64
Technical Support Specialist .56 Management Analyst .64
Auditor .53 Computer Systems Analyst .63
Career Counselor .25 Wholesale Sales Representative .31
Secondary School Teacher .24 Administrative Assistant .31
Social Worker .19 Middle School Teacher .26
Administrative Assistant .19 Technical Sales Representative .24
Customer Service Representative .16 Loan Officer/Counselor .23
Elementary School Teacher .12 Career Counselor .23
Middle School Teacher .06 Elementary School Teacher .22
Special Education Teacher .03 Bartender .00
Mental Health Counselor –.09 Social Worker –.10
Bartender –.09 Mental Health Counselor –.18
Note: N = 2,250 (1,125 women and 1,125 men). Ten highest correlations are shaded; 10 lowest correlations are not shaded.
Table 4.14 • Ten Highest and Lowest Correlations Between Science BIS and OS Scores for Women and Men in the GRS
Female Occupational Scale Women r Male Occupational Scale Men r
Engineer .76 Engineer .78
Registered Nurse .70 Software Developer .72
Network Administrator .68 Network Administrator .71
Software Developer .64 Computer Programmer .69
Computer Programmer .63 Psychologist .64
University Faculty Member .59 Computer/Mathematics Manager .59
Psychologist .52 Technical Support Specialist .55
Technical Support Specialist .51 Computer Systems Analyst .54
Graphic Designer .42 Computer & IS Manager .53
Editor .36 University Faculty Member .50
Marketing Manager .07 Marketing Manager .09
Middle School Teacher .06 Human Resources Manager .08
Social Worker .06 Career Counselor .05
Elementary School Teacher .06 Wholesale Sales Representative .05
Administrative Assistant .06 Technical Sales Representative .04
Special Education Teacher .03 Human Resources Specialist .04
Career Counselor .02 Loan Officer/Counselor .00
Loan Officer/Counselor .00 Social Worker –.04
Bartender –.01 Bartender –.05
Mental Health Counselor –.10 Mental Health Counselor –.20
Note: N = 2,250 (1,125 women and 1,125 men). Ten highest correlations are shaded; 10 lowest correlations are not shaded.
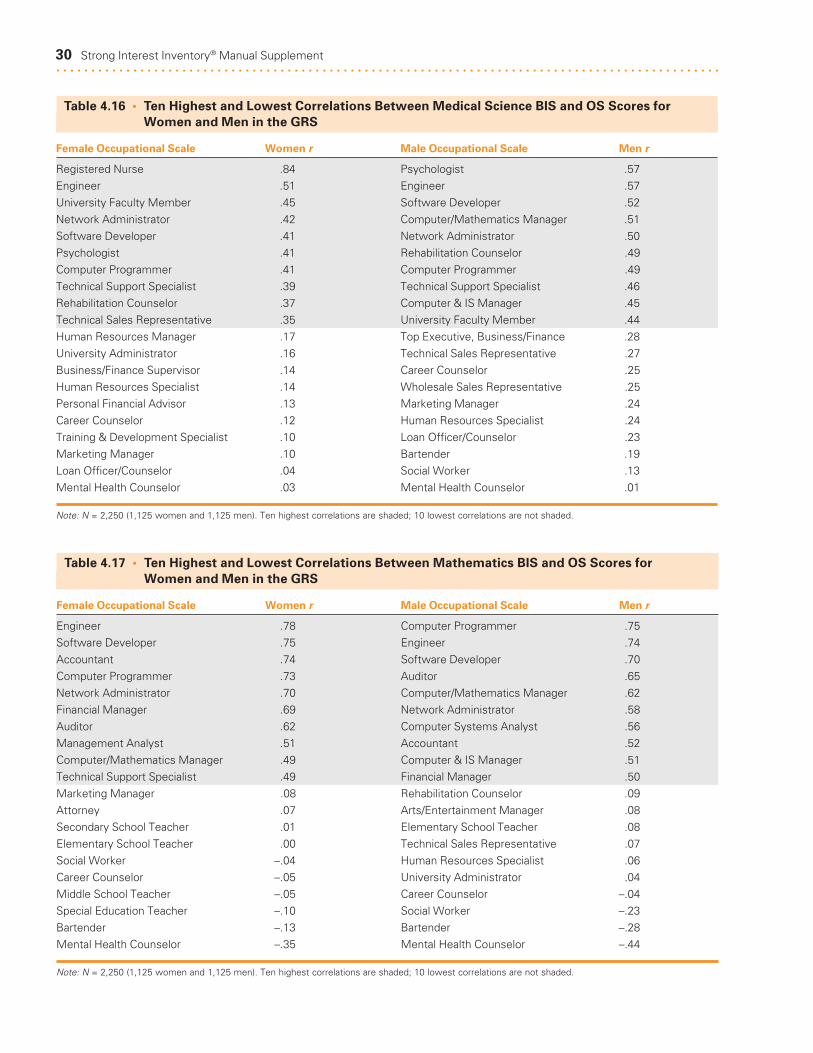
30 Strong Interest Inventory® Manual Supplement. . . . . . . . . . . . . . . . . . . . . . . . . . . . . . . . . . . . . . . . . . . . . . . . . . . . . . . . . . . . . . . . . . . . . . . . . . . . . . . . . . . . . . . . . . . . . . .
Table 4.17 • Ten Highest and Lowest Correlations Between Mathematics BIS and OS Scores for Women and Men in the GRS
Female Occupational Scale Women r Male Occupational Scale Men r
Engineer .78 Computer Programmer .75
Software Developer .75 Engineer .74
Accountant .74 Software Developer .70
Computer Programmer .73 Auditor .65
Network Administrator .70 Computer/Mathematics Manager .62
Financial Manager .69 Network Administrator .58
Auditor .62 Computer Systems Analyst .56
Management Analyst .51 Accountant .52
Computer/Mathematics Manager .49 Computer & IS Manager .51
Technical Support Specialist .49 Financial Manager .50
Marketing Manager .08 Rehabilitation Counselor .09
Attorney .07 Arts/Entertainment Manager .08
Secondary School Teacher .01 Elementary School Teacher .08
Elementary School Teacher .00 Technical Sales Representative .07
Social Worker –.04 Human Resources Specialist .06
Career Counselor –.05 University Administrator .04
Middle School Teacher –.05 Career Counselor –.04
Special Education Teacher –.10 Social Worker –.23
Bartender –.13 Bartender –.28
Mental Health Counselor –.35 Mental Health Counselor –.44
Note: N = 2,250 (1,125 women and 1,125 men). Ten highest correlations are shaded; 10 lowest correlations are not shaded.
Table 4.16 • Ten Highest and Lowest Correlations Between Medical Science BIS and OS Scores for Women and Men in the GRS
Female Occupational Scale Women r Male Occupational Scale Men r
Registered Nurse .84 Psychologist .57
Engineer .51 Engineer .57
University Faculty Member .45 Software Developer .52
Network Administrator .42 Computer/Mathematics Manager .51
Software Developer .41 Network Administrator .50
Psychologist .41 Rehabilitation Counselor .49
Computer Programmer .41 Computer Programmer .49
Technical Support Specialist .39 Technical Support Specialist .46
Rehabilitation Counselor .37 Computer & IS Manager .45
Technical Sales Representative .35 University Faculty Member .44
Human Resources Manager .17 Top Executive, Business/Finance .28
University Administrator .16 Technical Sales Representative .27
Business/Finance Supervisor .14 Career Counselor .25
Human Resources Specialist .14 Wholesale Sales Representative .25
Personal Financial Advisor .13 Marketing Manager .24
Career Counselor .12 Human Resources Specialist .24
Training & Development Specialist .10 Loan Officer/Counselor .23
Marketing Manager .10 Bartender .19
Loan Officer/Counselor .04 Social Worker .13
Mental Health Counselor .03 Mental Health Counselor .01
Note: N = 2,250 (1,125 women and 1,125 men). Ten highest correlations are shaded; 10 lowest correlations are not shaded.
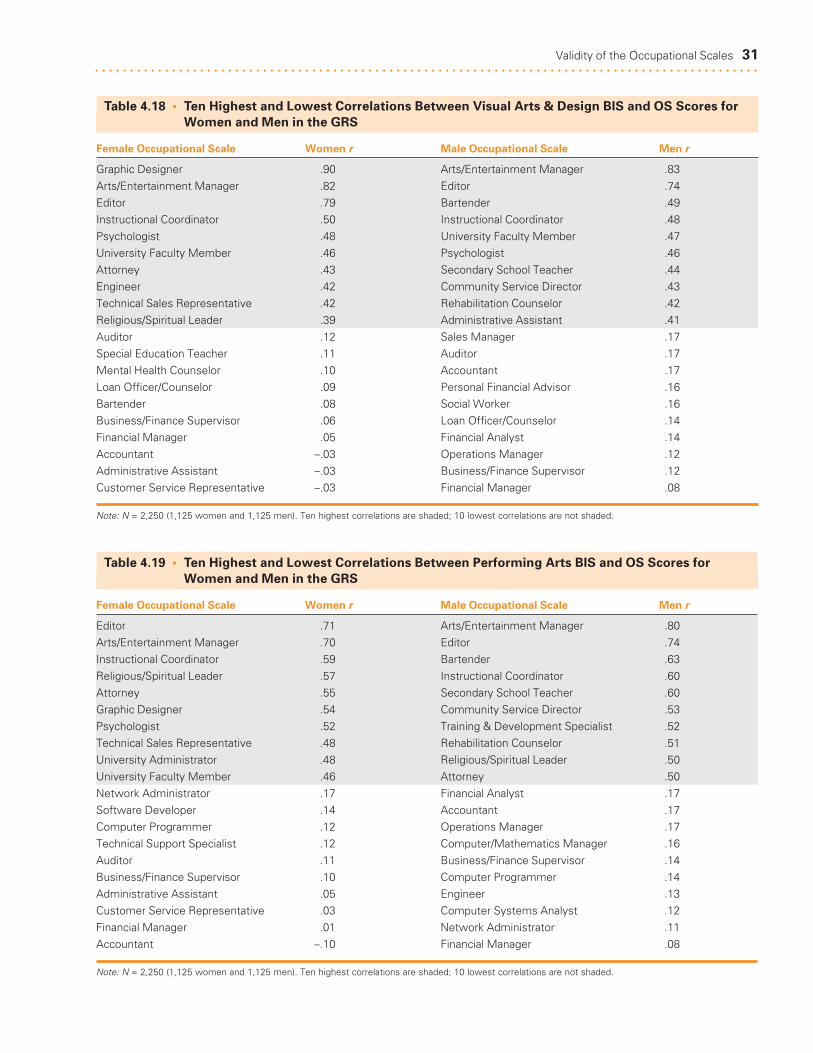
Validity of the Occupational Scales 31. . . . . . . . . . . . . . . . . . . . . . . . . . . . . . . . . . . . . . . . . . . . . . . . . . . . . . . . . . . . . . . . . . . . . . . . . . . . . . . . . . . . . . . . . . . . . . .
Table 4.19 • Ten Highest and Lowest Correlations Between Performing Arts BIS and OS Scores for Women and Men in the GRS
Female Occupational Scale Women r Male Occupational Scale Men r
Editor .71 Arts/Entertainment Manager .80
Arts/Entertainment Manager .70 Editor .74
Instructional Coordinator .59 Bartender .63
Religious/Spiritual Leader .57 Instructional Coordinator .60
Attorney .55 Secondary School Teacher .60
Graphic Designer .54 Community Service Director .53
Psychologist .52 Training & Development Specialist .52
Technical Sales Representative .48 Rehabilitation Counselor .51
University Administrator .48 Religious/Spiritual Leader .50
University Faculty Member .46 Attorney .50
Network Administrator .17 Financial Analyst .17
Software Developer .14 Accountant .17
Computer Programmer .12 Operations Manager .17
Technical Support Specialist .12 Computer/Mathematics Manager .16
Auditor .11 Business/Finance Supervisor .14
Business/Finance Supervisor .10 Computer Programmer .14
Administrative Assistant .05 Engineer .13
Customer Service Representative .03 Computer Systems Analyst .12
Financial Manager .01 Network Administrator .11
Accountant –.10 Financial Manager .08
Note: N = 2,250 (1,125 women and 1,125 men). Ten highest correlations are shaded; 10 lowest correlations are not shaded.
Table 4.18 • Ten Highest and Lowest Correlations Between Visual Arts & Design BIS and OS Scores for Women and Men in the GRS
Female Occupational Scale Women r Male Occupational Scale Men r
Graphic Designer .90 Arts/Entertainment Manager .83
Arts/Entertainment Manager .82 Editor .74
Editor .79 Bartender .49
Instructional Coordinator .50 Instructional Coordinator .48
Psychologist .48 University Faculty Member .47
University Faculty Member .46 Psychologist .46
Attorney .43 Secondary School Teacher .44
Engineer .42 Community Service Director .43
Technical Sales Representative .42 Rehabilitation Counselor .42
Religious/Spiritual Leader .39 Administrative Assistant .41
Auditor .12 Sales Manager .17
Special Education Teacher .11 Auditor .17
Mental Health Counselor .10 Accountant .17
Loan Officer/Counselor .09 Personal Financial Advisor .16
Bartender .08 Social Worker .16
Business/Finance Supervisor .06 Loan Officer/Counselor .14
Financial Manager .05 Financial Analyst .14
Accountant –.03 Operations Manager .12
Administrative Assistant –.03 Business/Finance Supervisor .12
Customer Service Representative –.03 Financial Manager .08
Note: N = 2,250 (1,125 women and 1,125 men). Ten highest correlations are shaded; 10 lowest correlations are not shaded.
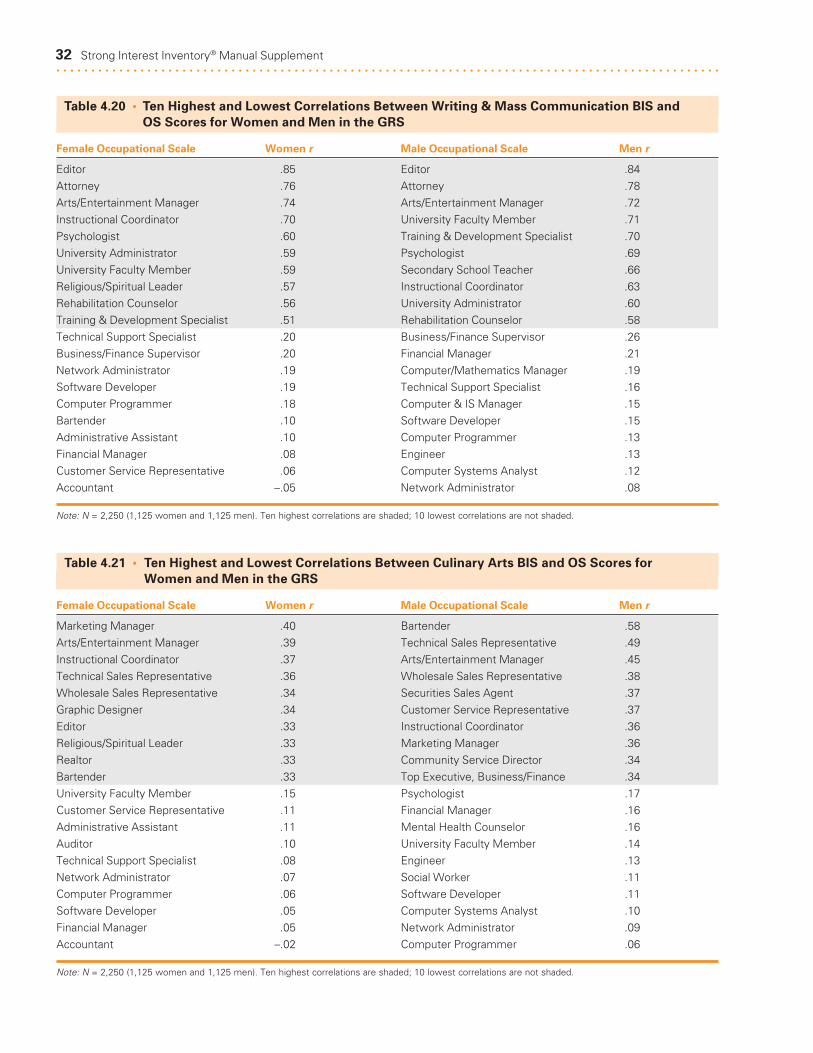
32 Strong Interest Inventory® Manual Supplement. . . . . . . . . . . . . . . . . . . . . . . . . . . . . . . . . . . . . . . . . . . . . . . . . . . . . . . . . . . . . . . . . . . . . . . . . . . . . . . . . . . . . . . . . . . . . . .
Table 4.21 • Ten Highest and Lowest Correlations Between Culinary Arts BIS and OS Scores for Women and Men in the GRS
Female Occupational Scale Women r Male Occupational Scale Men r
Marketing Manager .40 Bartender .58
Arts/Entertainment Manager .39 Technical Sales Representative .49
Instructional Coordinator .37 Arts/Entertainment Manager .45
Technical Sales Representative .36 Wholesale Sales Representative .38
Wholesale Sales Representative .34 Securities Sales Agent .37
Graphic Designer .34 Customer Service Representative .37
Editor .33 Instructional Coordinator .36
Religious/Spiritual Leader .33 Marketing Manager .36
Realtor .33 Community Service Director .34
Bartender .33 Top Executive, Business/Finance .34
University Faculty Member .15 Psychologist .17
Customer Service Representative .11 Financial Manager .16
Administrative Assistant .11 Mental Health Counselor .16
Auditor .10 University Faculty Member .14
Technical Support Specialist .08 Engineer .13
Network Administrator .07 Social Worker .11
Computer Programmer .06 Software Developer .11
Software Developer .05 Computer Systems Analyst .10
Financial Manager .05 Network Administrator .09
Accountant –.02 Computer Programmer .06
Note: N = 2,250 (1,125 women and 1,125 men). Ten highest correlations are shaded; 10 lowest correlations are not shaded.
Table 4.20 • Ten Highest and Lowest Correlations Between Writing & Mass Communication BIS and OS Scores for Women and Men in the GRS
Female Occupational Scale Women r Male Occupational Scale Men r
Editor .85 Editor .84
Attorney .76 Attorney .78
Arts/Entertainment Manager .74 Arts/Entertainment Manager .72
Instructional Coordinator .70 University Faculty Member .71
Psychologist .60 Training & Development Specialist .70
University Administrator .59 Psychologist .69
University Faculty Member .59 Secondary School Teacher .66
Religious/Spiritual Leader .57 Instructional Coordinator .63
Rehabilitation Counselor .56 University Administrator .60
Training & Development Specialist .51 Rehabilitation Counselor .58
Technical Support Specialist .20 Business/Finance Supervisor .26
Business/Finance Supervisor .20 Financial Manager .21
Network Administrator .19 Computer/Mathematics Manager .19
Software Developer .19 Technical Support Specialist .16
Computer Programmer .18 Computer & IS Manager .15
Bartender .10 Software Developer .15
Administrative Assistant .10 Computer Programmer .13
Financial Manager .08 Engineer .13
Customer Service Representative .06 Computer Systems Analyst .12
Accountant –.05 Network Administrator .08
Note: N = 2,250 (1,125 women and 1,125 men). Ten highest correlations are shaded; 10 lowest correlations are not shaded.
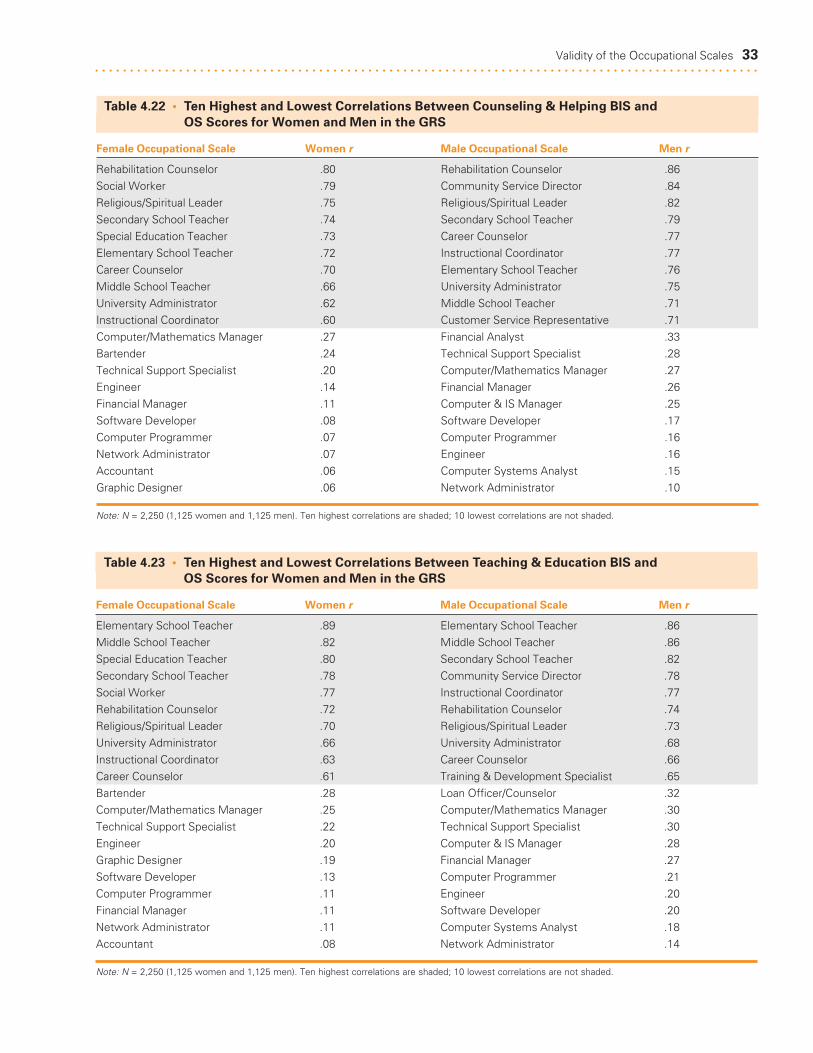
Validity of the Occupational Scales 33. . . . . . . . . . . . . . . . . . . . . . . . . . . . . . . . . . . . . . . . . . . . . . . . . . . . . . . . . . . . . . . . . . . . . . . . . . . . . . . . . . . . . . . . . . . . . . .
Table 4.23 • Ten Highest and Lowest Correlations Between Teaching & Education BIS and OS Scores for Women and Men in the GRS
Female Occupational Scale Women r Male Occupational Scale Men r
Elementary School Teacher .89 Elementary School Teacher .86
Middle School Teacher .82 Middle School Teacher .86
Special Education Teacher .80 Secondary School Teacher .82
Secondary School Teacher .78 Community Service Director .78
Social Worker .77 Instructional Coordinator .77
Rehabilitation Counselor .72 Rehabilitation Counselor .74
Religious/Spiritual Leader .70 Religious/Spiritual Leader .73
University Administrator .66 University Administrator .68
Instructional Coordinator .63 Career Counselor .66
Career Counselor .61 Training & Development Specialist .65
Bartender .28 Loan Officer/Counselor .32
Computer/Mathematics Manager .25 Computer/Mathematics Manager .30
Technical Support Specialist .22 Technical Support Specialist .30
Engineer .20 Computer & IS Manager .28
Graphic Designer .19 Financial Manager .27
Software Developer .13 Computer Programmer .21
Computer Programmer .11 Engineer .20
Financial Manager .11 Software Developer .20
Network Administrator .11 Computer Systems Analyst .18
Accountant .08 Network Administrator .14
Note: N = 2,250 (1,125 women and 1,125 men). Ten highest correlations are shaded; 10 lowest correlations are not shaded.
Table 4.22 • Ten Highest and Lowest Correlations Between Counseling & Helping BIS and OS Scores for Women and Men in the GRS
Female Occupational Scale Women r Male Occupational Scale Men r
Rehabilitation Counselor .80 Rehabilitation Counselor .86
Social Worker .79 Community Service Director .84
Religious/Spiritual Leader .75 Religious/Spiritual Leader .82
Secondary School Teacher .74 Secondary School Teacher .79
Special Education Teacher .73 Career Counselor .77
Elementary School Teacher .72 Instructional Coordinator .77
Career Counselor .70 Elementary School Teacher .76
Middle School Teacher .66 University Administrator .75
University Administrator .62 Middle School Teacher .71
Instructional Coordinator .60 Customer Service Representative .71
Computer/Mathematics Manager .27 Financial Analyst .33
Bartender .24 Technical Support Specialist .28
Technical Support Specialist .20 Computer/Mathematics Manager .27
Engineer .14 Financial Manager .26
Financial Manager .11 Computer & IS Manager .25
Software Developer .08 Software Developer .17
Computer Programmer .07 Computer Programmer .16
Network Administrator .07 Engineer .16
Accountant .06 Computer Systems Analyst .15
Graphic Designer .06 Network Administrator .10
Note: N = 2,250 (1,125 women and 1,125 men). Ten highest correlations are shaded; 10 lowest correlations are not shaded.

34 Strong Interest Inventory® Manual Supplement. . . . . . . . . . . . . . . . . . . . . . . . . . . . . . . . . . . . . . . . . . . . . . . . . . . . . . . . . . . . . . . . . . . . . . . . . . . . . . . . . . . . . . . . . . . . . . .
Table 4.25 • Ten Highest and Lowest Correlations Between Social Sciences BIS and OS Scores for Women and Men in the GRS
Female Occupational Scale Women r Male Occupational Scale Men r
Rehabilitation Counselor .73 University Administrator .77
University Administrator .72 Community Service Director .77
University Faculty Member .70 Secondary School Teacher .75
Instructional Coordinator .69 Rehabilitation Counselor .74
Psychologist .68 Instructional Coordinator .73
Religious/Spiritual Leader .67 Training & Development Specialist .73
Arts/Entertainment Manager .65 Attorney .72
Career Counselor .63 Religious/Spiritual Leader .71
Secondary School Teacher .62 Career Counselor .70
Human Resources Manager .62 Psychologist .70
Business/Finance Supervisor .37 Financial Manager .41
Software Developer .34 Bartender .41
Network Administrator .33 Computer/Mathematics Manager .37
Computer Programmer .32 Computer & IS Manager .32
Technical Support Specialist .32 Technical Support Specialist .31
Financial Manager .29 Engineer .29
Administrative Assistant .21 Software Developer .28
Accountant .20 Computer Programmer .25
Customer Service Representative .20 Computer Systems Analyst .24
Bartender .16 Network Administrator .19
Note: N = 2,250 (1,125 women and 1,125 men). Ten highest correlations are shaded; 10 lowest correlations are not shaded.
Table 4.24 • Ten Highest and Lowest Correlations Between Human Resources & Training BIS and OS Scores for Women and Men in the GRS
Female Occupational Scale Women r Male Occupational Scale Men r
Human Resources Specialist .85 Human Resources Manager .80
Training & Development Specialist .82 Human Resources Specialist .77
Human Resources Manager .82 Training & Development Specialist .75
Operations Manager .79 Operations Manager .73
Personal Financial Advisor .77 Instructional Coordinator .71
University Administrator .76 Community Service Director .71
Instructional Coordinator .75 Top Executive, Business/Finance .71
Business/Finance Supervisor .74 Business/Finance Supervisor .71
Securities Sales Agent .72 Customer Service Representative .71
Career Counselor .71 Religious/Spiritual Leader .69
Editor .26 Mental Health Counselor .33
Bartender .24 Psychologist .32
Technical Support Specialist .23 Technical Support Specialist .27
Registered Nurse .21 Social Worker .25
Psychologist .20 Computer Systems Analyst .20
Engineer .18 Engineer .17
Software Developer .14 Software Developer .17
Computer Programmer .12 Editor .15
Network Administrator .10 Computer Programmer .13
Graphic Designer .00 Network Administrator .11
Note: N = 2,250 (1,125 women and 1,125 men). Ten highest correlations are shaded; 10 lowest correlations are not shaded.

Validity of the Occupational Scales 35. . . . . . . . . . . . . . . . . . . . . . . . . . . . . . . . . . . . . . . . . . . . . . . . . . . . . . . . . . . . . . . . . . . . . . . . . . . . . . . . . . . . . . . . . . . . . . .
Table 4.27 • Ten Highest and Lowest Correlations Between Healthcare Services BIS and OS Scores for Women and Men in the GRS
Female Occupational Scale Women r Male Occupational Scale Men r
Registered Nurse .73 Elementary School Teacher .53
Customer Service Representative .51 Rehabilitation Counselor .53
Administrative Assistant .34 Administrative Assistant .52
Bartender .33 Customer Service Representative .51
Technical Support Specialist .32 Middle School Teacher .50
Middle School Teacher .31 Community Service Director .48
Rehabilitation Counselor .31 Secondary School Teacher .47
Special Education Teacher .31 Instructional Coordinator .42
Elementary School Teacher .30 Technical Support Specialist .41
Engineer .27 Psychologist .39
Human Resources Manager .07 Operations Manager .25
Mental Health Counselor .07 Sales Manager .25
Top Executive, Business/Finance .07 Financial Analyst .25
Financial Manager .07 Securities Sales Agent .24
Loan Officer/Counselor .06 Top Executive, Business/Finance .23
Arts/Entertainment Manager .04 Loan Officer/Counselor .23
Editor .04 Financial Manager .21
Training & Development Specialist .03 Editor .19
Attorney .03 Marketing Manager .19
Marketing Manager .01 Mental Health Counselor .18
Note: N = 2,250 (1,125 women and 1,125 men). Ten highest correlations are shaded; 10 lowest correlations are not shaded.
Table 4.26 • Ten Highest and Lowest Correlations Between Religion & Spirituality BIS and OS Scores for Women and Men in the GRS
Female Occupational Scale Women r Male Occupational Scale Men r
Religious/Spiritual Leader .74 Religious/Spiritual Leader .71
Special Education Teacher .48 Elementary School Teacher .53
Instructional Coordinator .47 Rehabilitation Counselor .49
Social Worker .46 Training & Development Specialist .48
Secondary School Teacher .46 University Administrator .48
Rehabilitation Counselor .45 Secondary School Teacher .47
Elementary School Teacher .44 Administrative Assistant .47
University Administrator .43 Community Service Director .47
Career Counselor .43 Instructional Coordinator .46
Middle School Teacher .41 Career Counselor .44
Computer/Mathematics Manager .20 Loan Officer/Counselor .18
Graphic Designer .14 Computer/Mathematics Manager .17
Technical Support Specialist .14 Computer Programmer .16
Bartender .13 Financial Manager .16
Engineer .13 Computer & IS Manager .15
Network Administrator .08 Technical Support Specialist .15
Software Developer .08 Engineer .12
Computer Programmer .07 Software Developer .12
Financial Manager .06 Computer Systems Analyst .10
Accountant .02 Network Administrator .06
Note: N = 2,250 (1,125 women and 1,125 men). Ten highest correlations are shaded; 10 lowest correlations are not shaded.

36 Strong Interest Inventory® Manual Supplement. . . . . . . . . . . . . . . . . . . . . . . . . . . . . . . . . . . . . . . . . . . . . . . . . . . . . . . . . . . . . . . . . . . . . . . . . . . . . . . . . . . . . . . . . . . . . . .
Table 4.29 • Ten Highest and Lowest Correlations Between Sales BIS and OS Scores for Women and Men in the GRS
Female Occupational Scale Women r Male Occupational Scale Men r
Realtor .78 Wholesale Sales Representative .84
Securities Sales Agent .75 Technical Sales Representative .80
Technical Sales Representative .74 Securities Sales Agent .80
Wholesale Sales Representative .73 Loan Officer/Counselor .79
Sales Manager .70 Sales Manager .76
Personal Financial Advisor .67 Personal Financial Advisor .76
Loan Officer/Counselor .60 Operations Manager .71
Top Executive, Business/Finance .57 Top Executive, Business/Finance .69
Operations Manager .56 Marketing Manager .68
Business/Finance Supervisor .56 Business/Finance Supervisor .66
Computer Programmer .21 Engineer .18
Middle School Teacher .20 Computer Systems Analyst .16
Network Administrator .19 Software Developer .11
Registered Nurse .18 Mental Health Counselor .09
Special Education Teacher .18 Computer Programmer .09
Editor .15 Network Administrator .08
Graphic Designer .11 University Faculty Member .06
University Faculty Member .11 Psychologist .04
Psychologist .02 Editor .02
Mental Health Counselor .00 Social Worker –.09
Note: N = 2,250 (1,125 women and 1,125 men). Ten highest correlations are shaded; 10 lowest correlations are not shaded.
Table 4.28 • Ten Highest and Lowest Correlations Between Marketing & Advertising BIS and OS Scores for Women and Men in the GRS
Female Occupational Scale Women r Male Occupational Scale Men r
Realtor .85 Wholesale Sales Representative .86
Wholesale Sales Representative .84 Technical Sales Representative .82
Sales Manager .80 Securities Sales Agent .82
Technical Sales Representative .79 Marketing Manager .80
Marketing Manager .79 Sales Manager .79
Securities Sales Agent .76 Top Executive, Business/Finance .77
Personal Financial Advisor .71 Loan Officer/Counselor .76
Operations Manager .69 Operations Manager .76
Top Executive, Business/Finance .69 Personal Financial Advisor .71
Training & Development Specialist .66 Human Resources Specialist .71
Technical Support Specialist .20 Technical Support Specialist .17
Software Developer .17 Mental Health Counselor .16
Middle School Teacher .15 University Faculty Member .15
Computer Programmer .15 Computer Systems Analyst .14
Network Administrator .14 Psychologist .13
Special Education Teacher .13 Engineer .12
Registered Nurse .13 Software Developer .09
University Faculty Member .12 Network Administrator .05
Psychologist .11 Computer Programmer .04
Mental Health Counselor .07 Social Worker –.06
Note: N = 2,250 (1,125 women and 1,125 men). Ten highest correlations are shaded; 10 lowest correlations are not shaded.
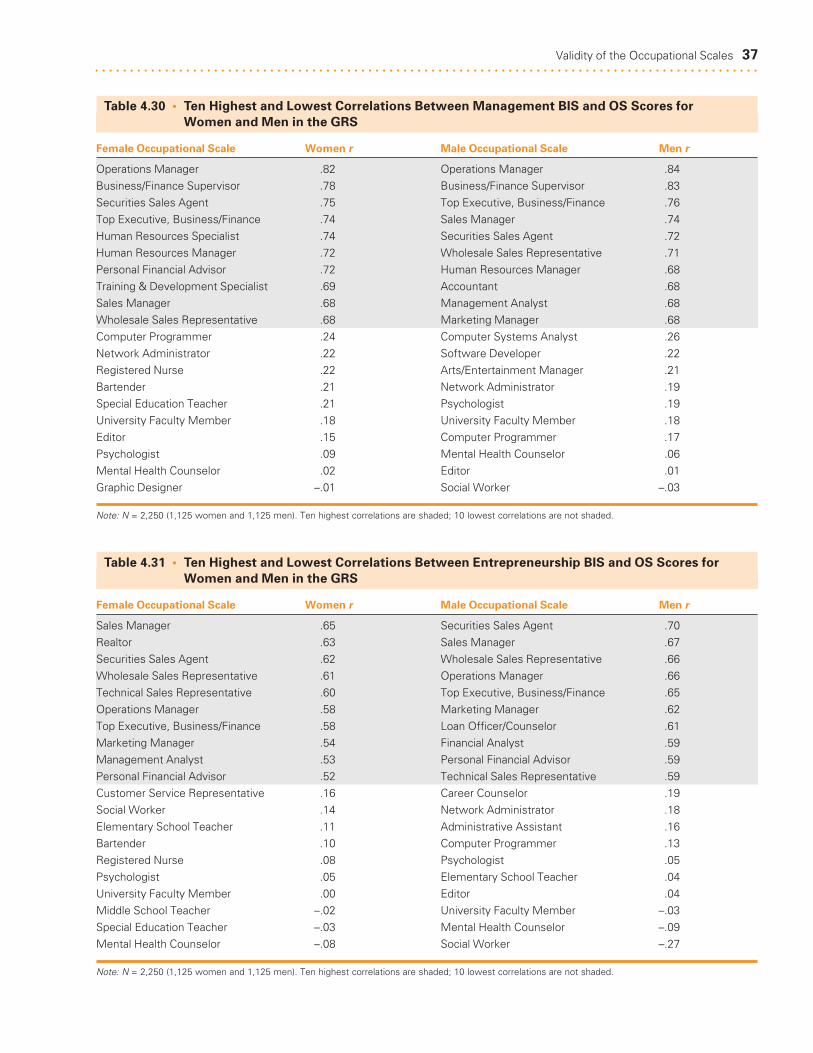
Validity of the Occupational Scales 37. . . . . . . . . . . . . . . . . . . . . . . . . . . . . . . . . . . . . . . . . . . . . . . . . . . . . . . . . . . . . . . . . . . . . . . . . . . . . . . . . . . . . . . . . . . . . . .
Table 4.31 • Ten Highest and Lowest Correlations Between Entrepreneurship BIS and OS Scores for Women and Men in the GRS
Female Occupational Scale Women r Male Occupational Scale Men r
Sales Manager .65 Securities Sales Agent .70
Realtor .63 Sales Manager .67
Securities Sales Agent .62 Wholesale Sales Representative .66
Wholesale Sales Representative .61 Operations Manager .66
Technical Sales Representative .60 Top Executive, Business/Finance .65
Operations Manager .58 Marketing Manager .62
Top Executive, Business/Finance .58 Loan Officer/Counselor .61
Marketing Manager .54 Financial Analyst .59
Management Analyst .53 Personal Financial Advisor .59
Personal Financial Advisor .52 Technical Sales Representative .59
Customer Service Representative .16 Career Counselor .19
Social Worker .14 Network Administrator .18
Elementary School Teacher .11 Administrative Assistant .16
Bartender .10 Computer Programmer .13
Registered Nurse .08 Psychologist .05
Psychologist .05 Elementary School Teacher .04
University Faculty Member .00 Editor .04
Middle School Teacher –.02 University Faculty Member –.03
Special Education Teacher –.03 Mental Health Counselor –.09
Mental Health Counselor –.08 Social Worker –.27
Note: N = 2,250 (1,125 women and 1,125 men). Ten highest correlations are shaded; 10 lowest correlations are not shaded.
Table 4.30 • Ten Highest and Lowest Correlations Between Management BIS and OS Scores for Women and Men in the GRS
Female Occupational Scale Women r Male Occupational Scale Men r
Operations Manager .82 Operations Manager .84
Business/Finance Supervisor .78 Business/Finance Supervisor .83
Securities Sales Agent .75 Top Executive, Business/Finance .76
Top Executive, Business/Finance .74 Sales Manager .74
Human Resources Specialist .74 Securities Sales Agent .72
Human Resources Manager .72 Wholesale Sales Representative .71
Personal Financial Advisor .72 Human Resources Manager .68
Training & Development Specialist .69 Accountant .68
Sales Manager .68 Management Analyst .68
Wholesale Sales Representative .68 Marketing Manager .68
Computer Programmer .24 Computer Systems Analyst .26
Network Administrator .22 Software Developer .22
Registered Nurse .22 Arts/Entertainment Manager .21
Bartender .21 Network Administrator .19
Special Education Teacher .21 Psychologist .19
University Faculty Member .18 University Faculty Member .18
Editor .15 Computer Programmer .17
Psychologist .09 Mental Health Counselor .06
Mental Health Counselor .02 Editor .01
Graphic Designer –.01 Social Worker –.03
Note: N = 2,250 (1,125 women and 1,125 men). Ten highest correlations are shaded; 10 lowest correlations are not shaded.
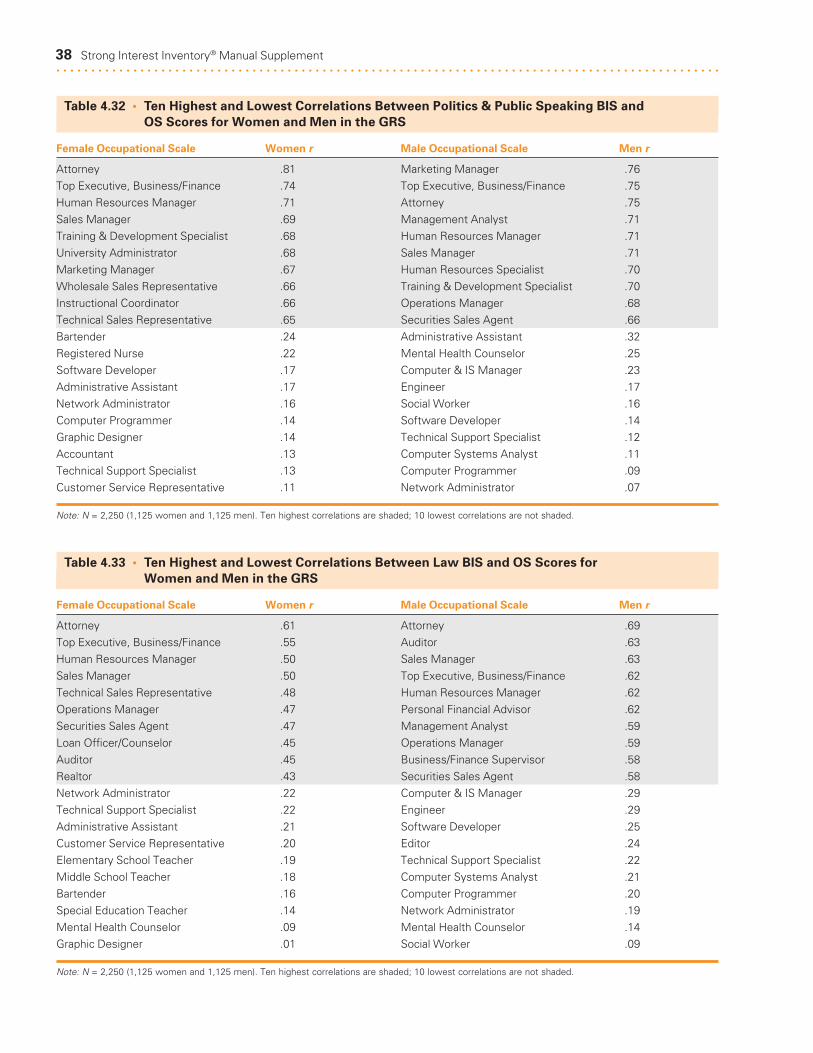
38 Strong Interest Inventory® Manual Supplement. . . . . . . . . . . . . . . . . . . . . . . . . . . . . . . . . . . . . . . . . . . . . . . . . . . . . . . . . . . . . . . . . . . . . . . . . . . . . . . . . . . . . . . . . . . . . . .
Table 4.33 • Ten Highest and Lowest Correlations Between Law BIS and OS Scores for Women and Men in the GRS
Female Occupational Scale Women r Male Occupational Scale Men r
Attorney .61 Attorney .69
Top Executive, Business/Finance .55 Auditor .63
Human Resources Manager .50 Sales Manager .63
Sales Manager .50 Top Executive, Business/Finance .62
Technical Sales Representative .48 Human Resources Manager .62
Operations Manager .47 Personal Financial Advisor .62
Securities Sales Agent .47 Management Analyst .59
Loan Officer/Counselor .45 Operations Manager .59
Auditor .45 Business/Finance Supervisor .58
Realtor .43 Securities Sales Agent .58
Network Administrator .22 Computer & IS Manager .29
Technical Support Specialist .22 Engineer .29
Administrative Assistant .21 Software Developer .25
Customer Service Representative .20 Editor .24
Elementary School Teacher .19 Technical Support Specialist .22
Middle School Teacher .18 Computer Systems Analyst .21
Bartender .16 Computer Programmer .20
Special Education Teacher .14 Network Administrator .19
Mental Health Counselor .09 Mental Health Counselor .14
Graphic Designer .01 Social Worker .09
Note: N = 2,250 (1,125 women and 1,125 men). Ten highest correlations are shaded; 10 lowest correlations are not shaded.
Table 4.32 • Ten Highest and Lowest Correlations Between Politics & Public Speaking BIS and OS Scores for Women and Men in the GRS
Female Occupational Scale Women r Male Occupational Scale Men r
Attorney .81 Marketing Manager .76
Top Executive, Business/Finance .74 Top Executive, Business/Finance .75
Human Resources Manager .71 Attorney .75
Sales Manager .69 Management Analyst .71
Training & Development Specialist .68 Human Resources Manager .71
University Administrator .68 Sales Manager .71
Marketing Manager .67 Human Resources Specialist .70
Wholesale Sales Representative .66 Training & Development Specialist .70
Instructional Coordinator .66 Operations Manager .68
Technical Sales Representative .65 Securities Sales Agent .66
Bartender .24 Administrative Assistant .32
Registered Nurse .22 Mental Health Counselor .25
Software Developer .17 Computer & IS Manager .23
Administrative Assistant .17 Engineer .17
Network Administrator .16 Social Worker .16
Computer Programmer .14 Software Developer .14
Graphic Designer .14 Technical Support Specialist .12
Accountant .13 Computer Systems Analyst .11
Technical Support Specialist .13 Computer Programmer .09
Customer Service Representative .11 Network Administrator .07
Note: N = 2,250 (1,125 women and 1,125 men). Ten highest correlations are shaded; 10 lowest correlations are not shaded.

Validity of the Occupational Scales 39. . . . . . . . . . . . . . . . . . . . . . . . . . . . . . . . . . . . . . . . . . . . . . . . . . . . . . . . . . . . . . . . . . . . . . . . . . . . . . . . . . . . . . . . . . . . . . .
Table 4.35 • Ten Highest and Lowest Correlations Between Taxes & Accounting BIS and OS Scores for Women and Men in the GRS
Female Occupational Scale Women r Male Occupational Scale Men r
Accountant .89 Auditor .79
Financial Manager .88 Financial Manager .76
Auditor .76 Accountant .74
Software Developer .66 Financial Analyst .66
Computer Programmer .62 Computer Programmer .61
Engineer .61 Business/Finance Supervisor .61
Network Administrator .57 Computer/Mathematics Manager .60
Business/Finance Supervisor .56 Engineer .58
Management Analyst .52 Management Analyst .57
Computer/Mathematics Manager .52 Software Developer .55
Secondary School Teacher –.04 Rehabilitation Counselor .12
Attorney –.05 Secondary School Teacher .11
Elementary School Teacher –.05 Elementary School Teacher .10
Graphic Designer –.05 University Administrator .10
Career Counselor –.07 Arts/Entertainment Manager .03
Social Worker –.07 Career Counselor .03
Middle School Teacher –.13 Editor –.03
Bartender –.14 Bartender –.18
Special Education Teacher –.16 Social Worker –.29
Mental Health Counselor –.46 Mental Health Counselor –.40
Note: N = 2,250 (1,125 women and 1,125 men). Ten highest correlations are shaded; 10 lowest correlations are not shaded.
Table 4.34 • Ten Highest and Lowest Correlations Between Office Management BIS and OS Scores for Women and Men in the GRS
Female Occupational Scale Women r Male Occupational Scale Men r
Administrative Assistant .83 Customer Service Representative .69
Customer Service Representative .77 Administrative Assistant .67
Business/Finance Supervisor .59 Business/Finance Supervisor .61
Accountant .57 Accountant .59
Auditor .55 Auditor .53
Technical Support Specialist .51 Financial Manager .51
Financial Manager .51 Wholesale Sales Representative .48
Computer/Mathematics Manager .43 Management Analyst .48
Securities Sales Agent .40 Operations Manager .47
Operations Manager .39 Financial Analyst .47
Registered Nurse .06 University Administrator .26
Special Education Teacher .05 Career Counselor .26
Bartender –.01 University Faculty Member .25
Arts/Entertainment Manager –.02 Psychologist .21
University Faculty Member –.02 Arts/Entertainment Manager .20
Editor –.04 Attorney .18
Graphic Designer –.11 Bartender .13
Attorney –.13 Editor .06
Psychologist –.26 Social Worker –.02
Mental Health Counselor –.32 Mental Health Counselor –.06
Note: N = 2,250 (1,125 women and 1,125 men). Ten highest correlations are shaded; 10 lowest correlations are not shaded.

40 Strong Interest Inventory® Manual Supplement. . . . . . . . . . . . . . . . . . . . . . . . . . . . . . . . . . . . . . . . . . . . . . . . . . . . . . . . . . . . . . . . . . . . . . . . . . . . . . . . . . . . . . . . . . . . . . .
Table 4.37 • Ten Highest and Lowest Correlations Between Finance & Investing BIS and OS Scores for Women and Men in the GRS
Female Occupational Scale Women r Male Occupational Scale Men r
Financial Manager .73 Financial Manager .86
Sales Manager .72 Financial Analyst .83
Auditor .71 Auditor .78
Securities Sales Agent .69 Accountant .78
Management Analyst .68 Personal Financial Advisor .77
Top Executive, Business/Finance .66 Sales Manager .77
Realtor .64 Securities Sales Agent .76
Accountant .64 Business/Finance Supervisor .75
Business/Finance Supervisor .63 Operations Manager .73
Operations Manager .63 Loan Officer/Counselor .73
Registered Nurse .17 Bartender .16
Career Counselor .14 Psychologist .15
Secondary School Teacher .12 Career Counselor .15
Graphic Designer .12 Administrative Assistant .14
Social Worker .05 Arts/Entertainment Manager .12
Bartender .03 University Faculty Member .10
Elementary School Teacher –.02 Elementary School Teacher .06
Middle School Teacher –.11 Editor –.04
Special Education Teacher –.14 Mental Health Counselor –.23
Mental Health Counselor –.27 Social Worker –.33
Note: N = 2,250 (1,125 women and 1,125 men). Ten highest correlations are shaded; 10 lowest correlations are not shaded.
Table 4.36 • Ten Highest and Lowest Correlations Between Programming & Information Systems BIS and OS Scores for Women and Men in the GRS
Female Occupational Scale Women r Male Occupational Scale Men r
Technical Support Specialist .84 Computer Systems Analyst .87
Software Developer .79 Computer & IS Manager .82
Computer Programmer .79 Technical Support Specialist .82
Network Administrator .77 Computer/Mathematics Manager .80
Computer/Mathematics Manager .71 Network Administrator .79
Engineer .55 Software Developer .79
Management Analyst .49 Computer Programmer .78
Accountant .48 Engineer .59
Financial Manager .48 Auditor .41
Auditor .47 Accountant .37
Loan Officer/Counselor .03 Elementary School Teacher .05
Elementary School Teacher –.03 Human Resources Manager .04
Attorney –.03 Human Resources Specialist .02
Secondary School Teacher –.10 Loan Officer/Counselor –.02
Career Counselor –.14 Attorney –.02
Social Worker –.15 University Administrator –.03
Middle School Teacher –.18 Career Counselor –.14
Special Education Teacher –.23 Bartender –.14
Bartender –.48 Social Worker –.41
Mental Health Counselor –.58 Mental Health Counselor –.54
Note: N = 2,250 (1,125 women and 1,125 men). Ten highest correlations are shaded; 10 lowest correlations are not shaded.

Validity of the Occupational Scales 41. . . . . . . . . . . . . . . . . . . . . . . . . . . . . . . . . . . . . . . . . . . . . . . . . . . . . . . . . . . . . . . . . . . . . . . . . . . . . . . . . . . . . . . . . . . . . . .
Table 4.38 • Ten Highest and Lowest Correlations Between Work Style PSS and OS Scores for Women and Men in the GRS
Work Style PSS Female Occupational Scale Women r Male Occupational Scale Men r
Elementary School Teacher .72 Career Counselor .70
Special Education Teacher .69 Middle School Teacher .70
Social Worker .68 Human Resources Specialist .68
Secondary School Teacher .68 Elementary School Teacher .68
Middle School Teacher .67 Human Resources Manager .65
Career Counselor .66 University Administrator .64
Rehabilitation Counselor .56 Mental Health Counselor .63
Human Resources Specialist .55 Religious/Spiritual Leader .60
University Administrator .54 Customer Service Representative .60
Training & Development Specialist .54 Secondary School Teacher .60
Registered Nurse –.02 University Faculty Member .11
Accountant –.06 Psychologist .02
University Faculty Member –.06 Computer/Mathematics Manager –.16
Psychologist –.10 Technical Support Specialist –.18
Graphic Designer –.19 Computer & IS Manager –.18
Technical Support Specialist –.19 Computer Systems Analyst –.29
Engineer –.33 Computer Programmer –.38
Software Developer –.36 Software Developer –.40
Computer Programmer –.38 Engineer –.42
Network Administrator –.42 Network Administrator –.45
Note: N = 2,250 (1,125 women and 1,125 men). Ten highest correlations are shaded; 10 lowest correlations are not shaded.
“Works withideas/data/things”pole
“Works withpeople” pole
Correlations Between the PSSs andthe OSs
Tables 4.38–4.42 illustrate the relationship betweeneach of the Personal Style Scales (PSSs) and the new, up-dated, and revised OSs. The tables show the PSSs andthe 10 highest-correlating and 10 lowest-correlatingOSs, separately for women and men, and provide sup-port for the validity of the OSs. For example, the TopExecutive, Business/Finance scales are positively corre-
lated with the Leadership Style PSS, suggesting that topexecutives score toward the “Directs others” pole. Incontrast, the Network Administrator scales are nega-tively correlated with the Work Style PSS, suggestingthat network administrators score toward the “Workswith ideas/data/things” pole of the PSS. These tworesults suit what is known about work characteristics oftop executives and network administrators. Please referto the Strong manual (Figures 6.1–6.5) for correlationswith existing OSs.
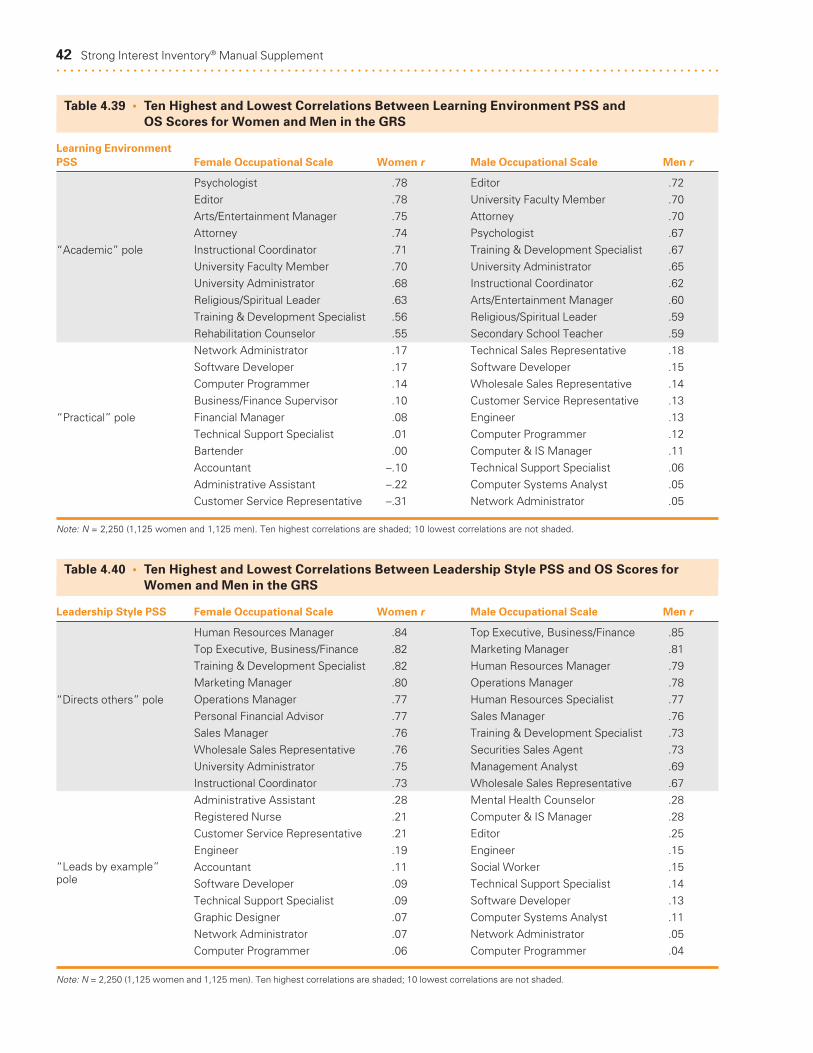
42 Strong Interest Inventory® Manual Supplement. . . . . . . . . . . . . . . . . . . . . . . . . . . . . . . . . . . . . . . . . . . . . . . . . . . . . . . . . . . . . . . . . . . . . . . . . . . . . . . . . . . . . . . . . . . . . . .
Table 4.39 • Ten Highest and Lowest Correlations Between Learning Environment PSS and OS Scores for Women and Men in the GRS
Learning Environment PSS Female Occupational Scale Women r Male Occupational Scale Men r
Psychologist .78 Editor .72
Editor .78 University Faculty Member .70
Arts/Entertainment Manager .75 Attorney .70
Attorney .74 Psychologist .67
Instructional Coordinator .71 Training & Development Specialist .67
University Faculty Member .70 University Administrator .65
University Administrator .68 Instructional Coordinator .62
Religious/Spiritual Leader .63 Arts/Entertainment Manager .60
Training & Development Specialist .56 Religious/Spiritual Leader .59
Rehabilitation Counselor .55 Secondary School Teacher .59
Network Administrator .17 Technical Sales Representative .18
Software Developer .17 Software Developer .15
Computer Programmer .14 Wholesale Sales Representative .14
Business/Finance Supervisor .10 Customer Service Representative .13
Financial Manager .08 Engineer .13
Technical Support Specialist .01 Computer Programmer .12
Bartender .00 Computer & IS Manager .11
Accountant –.10 Technical Support Specialist .06
Administrative Assistant –.22 Computer Systems Analyst .05
Customer Service Representative –.31 Network Administrator .05
Note: N = 2,250 (1,125 women and 1,125 men). Ten highest correlations are shaded; 10 lowest correlations are not shaded.
“Practical” pole
“Academic” pole
Table 4.40 • Ten Highest and Lowest Correlations Between Leadership Style PSS and OS Scores for Women and Men in the GRS
Leadership Style PSS Female Occupational Scale Women r Male Occupational Scale Men r
Human Resources Manager .84 Top Executive, Business/Finance .85
Top Executive, Business/Finance .82 Marketing Manager .81
Training & Development Specialist .82 Human Resources Manager .79
Marketing Manager .80 Operations Manager .78
Operations Manager .77 Human Resources Specialist .77
Personal Financial Advisor .77 Sales Manager .76
Sales Manager .76 Training & Development Specialist .73
Wholesale Sales Representative .76 Securities Sales Agent .73
University Administrator .75 Management Analyst .69
Instructional Coordinator .73 Wholesale Sales Representative .67
Administrative Assistant .28 Mental Health Counselor .28
Registered Nurse .21 Computer & IS Manager .28
Customer Service Representative .21 Editor .25
Engineer .19 Engineer .15
Accountant .11 Social Worker .15
Software Developer .09 Technical Support Specialist .14
Technical Support Specialist .09 Software Developer .13
Graphic Designer .07 Computer Systems Analyst .11
Network Administrator .07 Network Administrator .05
Computer Programmer .06 Computer Programmer .04
Note: N = 2,250 (1,125 women and 1,125 men). Ten highest correlations are shaded; 10 lowest correlations are not shaded.
“Leads by example”pole
“Directs others” pole

Validity of the Occupational Scales 43. . . . . . . . . . . . . . . . . . . . . . . . . . . . . . . . . . . . . . . . . . . . . . . . . . . . . . . . . . . . . . . . . . . . . . . . . . . . . . . . . . . . . . . . . . . . . . .
Table 4.41 • Ten Highest and Lowest Correlations Between Risk Taking PSS and OS Scores for Women and Men in the GRS
Risk Taking PSS Female Occupational Scale Women r Male Occupational Scale Men r
Technical Sales Representative .58 Personal Financial Advisor .58
Sales Manager .52 Sales Manager .55
Engineer .51 Securities Sales Agent .55
Realtor .50 Loan Officer/Counselor .54
Top Executive, Business/Finance .49 Financial Analyst .52
Wholesale Sales Representative .46 Wholesale Sales Representative .51
Computer/Mathematics Manager .44 Technical Sales Representative .51
Network Administrator .43 Operations Manager .49
Securities Sales Agent .43 Accountant .49
Management Analyst .41 Top Executive, Business/Finance .47
Religious/Spiritual Leader .19 Religious/Spiritual Leader .15
Secondary School Teacher .19 Elementary School Teacher .14
Career Counselor .13 University Administrator .13
Customer Service Representative .13 Psychologist .13
Social Worker .11 Career Counselor .11
Administrative Assistant .11 Administrative Assistant .11
Elementary School Teacher .08 Editor .02
Middle School Teacher .06 University Faculty Member –.05
Special Education Teacher .00 Mental Health Counselor –.08
Mental Health Counselor –.06 Social Worker –.17
Note: N = 2,250 (1,125 women and 1,125 men). Ten highest correlations are shaded; 10 lowest correlations are not shaded.
“Plays it safe”pole
“Takes chances” pole
Table 4.42 • Ten Highest and Lowest Correlations Between Team Orientation PSS and OS Scores for Women and Men in the GRS
Team Orientation PSS Female Occupational Scale Women r Male Occupational Scale Men r
Human Resources Specialist .70 Operations Manager .56
Business/Finance Supervisor .64 Human Resources Manager .56
Operations Manager .64 Top Executive, Business/Finance .55
Human Resources Manager .60 Business/Finance Supervisor .54
Training & Development Specialist .59 Human Resources Specialist .53
Personal Financial Advisor .58 Management Analyst .53
Top Executive, Business/Finance .56 Wholesale Sales Representative .49
University Administrator .55 Marketing Manager .48
Management Analyst .54 Training & Development Specialist .48
Computer/Mathematics Manager .53 Sales Manager .48
University Faculty Member .20 Psychologist .23
Technical Support Specialist .20 Software Developer .23
Accountant .19 Arts/Entertainment Manager .22
Psychologist .18 University Faculty Member .21
Editor .16 Computer Systems Analyst .20
Mental Health Counselor .15 Network Administrator .18
Software Developer .14 Computer Programmer .18
Computer Programmer .13 Mental Health Counselor .13
Network Administrator .13 Social Worker .12
Graphic Designer .03 Editor .06
Note: N = 2,250 (1,125 women and 1,125 men). Ten highest correlations are shaded; 10 lowest correlations are not shaded.
“Accomplishes tasksindependently”pole
“Accomplishes tasksas a team” pole


The current update of the Strong Interest Inventory
assessment’s Occupational Scales was conducted
to ensure that the instrument best reflects changes in
the occupational world and in our society, thus main-
taining the scientific soundness of the tool. This
update resulted in the addition of 46 new scales, 36
updated scales, and 8 revised scales. Thirty of the 2004
Strong instrument scales were removed.
The updated Strong assessment now includes a totalof 260 scales—the 90 new, updated, or revised scalesalong with 170 scales remaining from the 2004 OSs.This list of OSs meets the rigorous standards upheld bythe instrument for both reliability and validity. The260 existing, new, updated, and revised OSs provideclients and career professionals alike with a wide varietyof career options to consider and can help users makeinformed decisions about their future.
Conclusion
45
. . . . . . . . . . . . . . . . . . . . . . . . . . . . . . . . . . . . . . . . . . . . . . . . . . . . . . . . . . . . . . . . . . . . . . . . . . . . . . . . . . . . . . . . . . . . . . . . . . . . . . . . . . . . . . . . . . . .
. . . . . . . . . . . . . . . . . . . . . . . . . . . . . . . . . . . . . . . . . . . . . . . . . . . . . . . . . . . . . . . . . . . . . . . . . . . . . . . . . . . . . . . . . . . . . . . . . . . . . . . . . . . . . . . . . . . .


The samples described in this appendix are those
used to develop the current Strong Interest Inven-
tory® Occupational Scales (OSs). This appendix serves
as a replacement for the appendix in the 2005 Strong
manual (Donnay et al., 2005).
For each sample, the column headed “N ” indicatesthe number of people in the occupational group usedto construct the scale. “Year Data Collected” indicatesthe year in which the occupational sample was com-pleted. “Mean Age” provides the average age of thepeople in the sample. And “Mean Years Experience”provides the average number of years the people in thesample have worked in the occupation. The column labeled “Composition” indicates the
sources for the people who make up each occupationalsample. This column also provides selected demo-graphic data about the occupations. Among these dataare educational background, typical work activities,areas of specialization, and types of businesses or insti-tutions in which participants are employed.The column labeled “O*NET Code(s)” offers, for
each occupation, the O*NET code or codes mostappropriate for that sample. These codes will help youand your client locate related occupations on theO*NET Web site, www.onetonline.org. The first twodigits indicate which of the 23 very broad categories theoccupation fits:
11 Management13 Business and Financial Operations15 Computer and Mathematical
17 Architecture and Engineering19 Life, Physical, and Social Sciences21 Community and Social Services23 Legal25 Education, Training, and Library27 Arts, Design, Entertainment, Sports, and Media29 Healthcare Practitioners and Technical31 Healthcare Support33 Protective Service35 Food Preparation and Serving Related37 Building and Grounds Cleaning and Maintenance39 Personal Care and Service41 Sales and Related43 Office and Administrative Support45 Farming, Fishing, and Forestry47 Construction and Extraction49 Installation, Maintenance, and Repair51 Production 53 Transportation and Material Moving55 Military Specific
The next four digits indicate a more specific divisionof work within the 23 broad categories. The last two dig-its, after the decimal point, locate a particular occupationwithin that division. The “Description” column will helpyou assist your clients in identifying the responsibilities,job tasks, work environments, and skills entailed in eachof the occupations listed on the Strong Profile.The last column, “Related Occupations,” is a list of
jobs related to each of the Occupational Scale samples.This list will help you broaden your clients’ careerexploration beyond the Strong Profile to find otheroccupations appropriate for their consideration.
47
Occupational Scale Samples,O*NET™
Codes, and Related Job Titles
A P P E N D I X
. . . . . . . . . . . . . . . . . . . . . . . . . . . . . . . . . . . . . . . . . . . . . . . . . . . . . . . . . . . . . . . . . . . . . . . . . . . . . . . . . . . . . . . . . . . . . . . . . . . . . . . . . . . . . . . . . . . .
. . . . . . . . . . . . . . . . . . . . . . . . . . . . . . . . . . . . . . . . . . . . . . . . . . . . . . . . . . . . . . . . . . . . . . . . . . . . . . . . . . . . . . . . . . . . . . . . . . . . . . . . . . . . . . . . . . . .
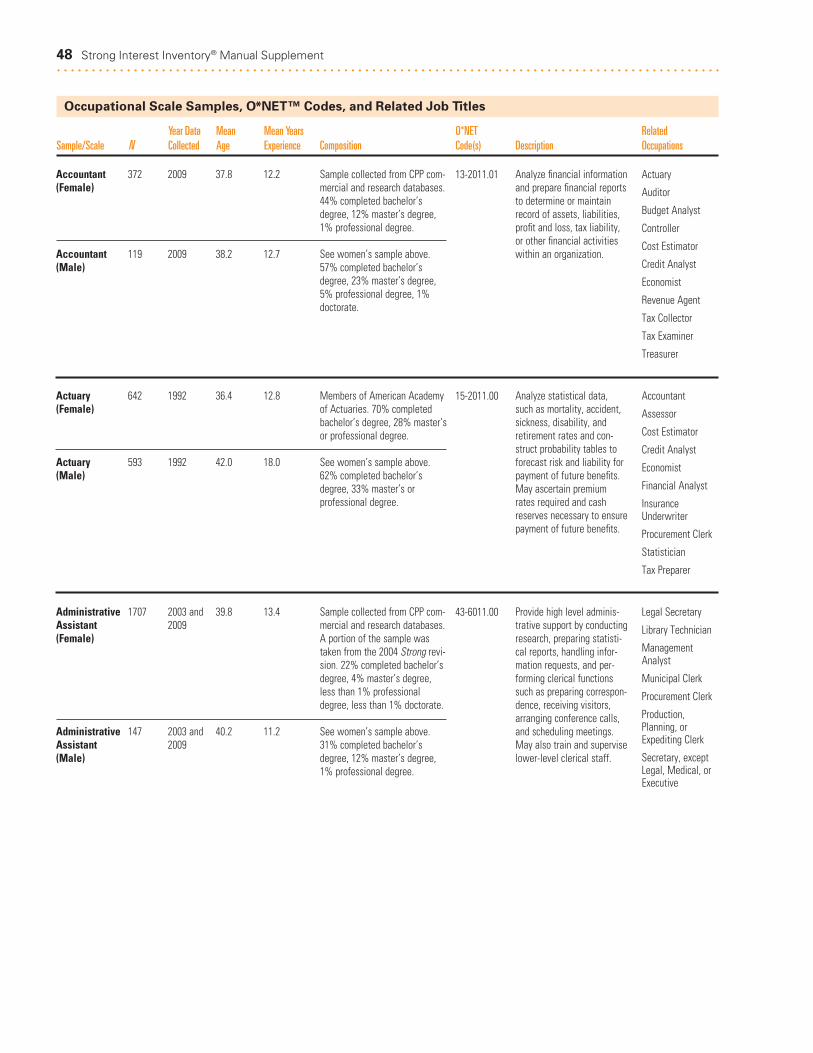
48 Strong Interest Inventory® Manual Supplement. . . . . . . . . . . . . . . . . . . . . . . . . . . . . . . . . . . . . . . . . . . . . . . . . . . . . . . . . . . . . . . . . . . . . . . . . . . . . . . . . . . . . . . . . . . . . . .
Occupational Scale Samples, O*NET™ Codes, and Related Job Titles
Year Data Mean Mean Years O*NET RelatedSample/Scale N Collected Age Experience Composition Code(s) Description Occupations
Accountant 372 2009 37.8 12.2(Female)
Accountant 119 2009 38.2 12.7(Male)
Actuary 642 1992 36.4 12.8(Female)
Actuary 593 1992 42.0 18.0(Male)
Administrative 1707 2003 and 39.8 13.4Assistant 2009(Female)
Administrative 147 2003 and 40.2 11.2Assistant 2009(Male)
Sample collected from CPP com-mercial and research databases.44% completed bachelor’sdegree, 12% master’s degree,1% professional degree.
See women’s sample above.57% completed bachelor’sdegree, 23% master’s degree,5% professional degree, 1%doctorate.
Members of American Academyof Actuaries. 70% completedbachelor’s degree, 28% master’sor professional degree.
See women’s sample above.62% completed bachelor’sdegree, 33% master’s or professional degree.
Sample collected from CPP com-mercial and research databases.A portion of the sample wastaken from the 2004 Strong revi-sion. 22% completed bachelor’sdegree, 4% master’s degree,less than 1% professionaldegree, less than 1% doctorate.
See women’s sample above.31% completed bachelor’sdegree, 12% master’s degree,1% professional degree.
Analyze financial informationand prepare financial reportsto determine or maintainrecord of assets, liabilities,profit and loss, tax liability,or other financial activitieswithin an organization.
Analyze statistical data,such as mortality, accident,sickness, disability, andretirement rates and con-struct probability tables toforecast risk and liability forpayment of future benefits.May ascertain premiumrates required and cashreserves necessary to ensurepayment of future benefits.
Provide high level adminis-trative support by conductingresearch, preparing statisti-cal reports, handling infor-mation requests, and per-forming clerical functionssuch as preparing correspon-dence, receiving visitors,arranging conference calls,and scheduling meetings.May also train and superviselower-level clerical staff.
13-2011.01
15-2011.00
43-6011.00
Actuary
Auditor
Budget Analyst
Controller
Cost Estimator
Credit Analyst
Economist
Revenue Agent
Tax Collector
Tax Examiner
Treasurer
Accountant
Assessor
Cost Estimator
Credit Analyst
Economist
Financial Analyst
InsuranceUnderwriter
Procurement Clerk
Statistician
Tax Preparer
Legal Secretary
Library Technician
ManagementAnalyst
Municipal Clerk
Procurement Clerk
Production,Planning, orExpediting Clerk
Secretary, exceptLegal, Medical, orExecutive

Appendix 49. . . . . . . . . . . . . . . . . . . . . . . . . . . . . . . . . . . . . . . . . . . . . . . . . . . . . . . . . . . . . . . . . . . . . . . . . . . . . . . . . . . . . . . . . . . . . . .
Occupational Scale Samples, O*NET™ Codes, and Related Job Titles
Year Data Mean Mean Years O*NET RelatedSample/Scale N Collected Age Experience Composition Code(s) Description Occupations
Advertising 205 1992 36.3 12.1 AccountManager (Female)
Advertising 348 1992 47.0 21.7 Account Manager (Male)
Architect 603 1993 39.3 14.4(Female)
Architect 560 1993 47.2 22.8(Male)
Art Teacher 360 1981 39.0 11.2(Female)
Art Teacher 303 1978 40.2 14.9(Male)
From commercially compilednational listing. 70% completedbachelor’s degree, 14% master’sor professional degree. 84%worked for full-service advertis-ing agency; 7% for small, spe-cialized agency; 2% for directmarketing agency; 9% wereself-employed.
See women’s sample above.63% completed bachelor’sdegree, 14% master’s or profes-sional degree. 75% worked forfull-service advertising agency;11% for small, specializedagency; 2% for direct marketing;9% were self-employed.
Members of American Instituteof Architects. 40% completedbachelor’s degree, 56% master’sor professional degree. Areas ofspecialization included public/institutional (34%), commercial(29%), residential (24%), indus-trial (2%).
See women’s sample above.48% completed bachelor’sdegree, 43% master’s or pro-fessional degree. Areas of spe-cialization included public/institutional (41%), commercial(34%), residential (12%), indus-trial (4%).
Members of National ArtAssociation, secondary division.All were secondary school teach-ers. 41% completed bachelor’sdegree, 58% master’s degree.79% of sample spent minimum of50% of time teaching; otheractivities included lesson prepa-ration, grading, and administra-tive functions. Main areas of artincluded general, painting anddrawing, sculpture, ceramics,print making, and weaving.
See women’s sample above. Allwere secondary school teachers.15% completed bachelor’sdegree, 64% master’s degree,19% doctorate.
Plan and direct advertisingpolicies and programs or produce collateral materials,such as posters, contests,coupons, or giveaways, tocreate extra interest in thepurchase of a product or service for a department, foran entire organization, or on an account basis.
Plan and design structuressuch as private residences,office buildings, theaters,factories, and other struc-tural property.
Teach courses in drama,music, and the arts, includingfine and applied art, such aspainting and sculpture, ordesign and crafts.
11-2011.00
17-1011.00
25-1121.00
Art Director
EducationAdministrator,Elementary orSecondary School
EducationAdministrator,Postsecondary
Health Educator
MarketingManager
Public RelationsSpecialist
Purchasing Agentor Buyer
Sales Manager
Wholesale orRetail Buyer
Civil Engineer
Civil EngineeringTechnician
Electrical Drafter
Industrial Safety orHealth Engineer
LandscapeArchitect
Marine Architect
MechanicalEngineer
Mining orGeographicalEngineer
Set or ExhibitDesigner
Choreographer
Commercial orIndustrial Designer
Fashion Designer
Film or Video Editor
Floral Designer
KindergartenTeacher
Musician,Instrumental
Set or ExhibitDesigner
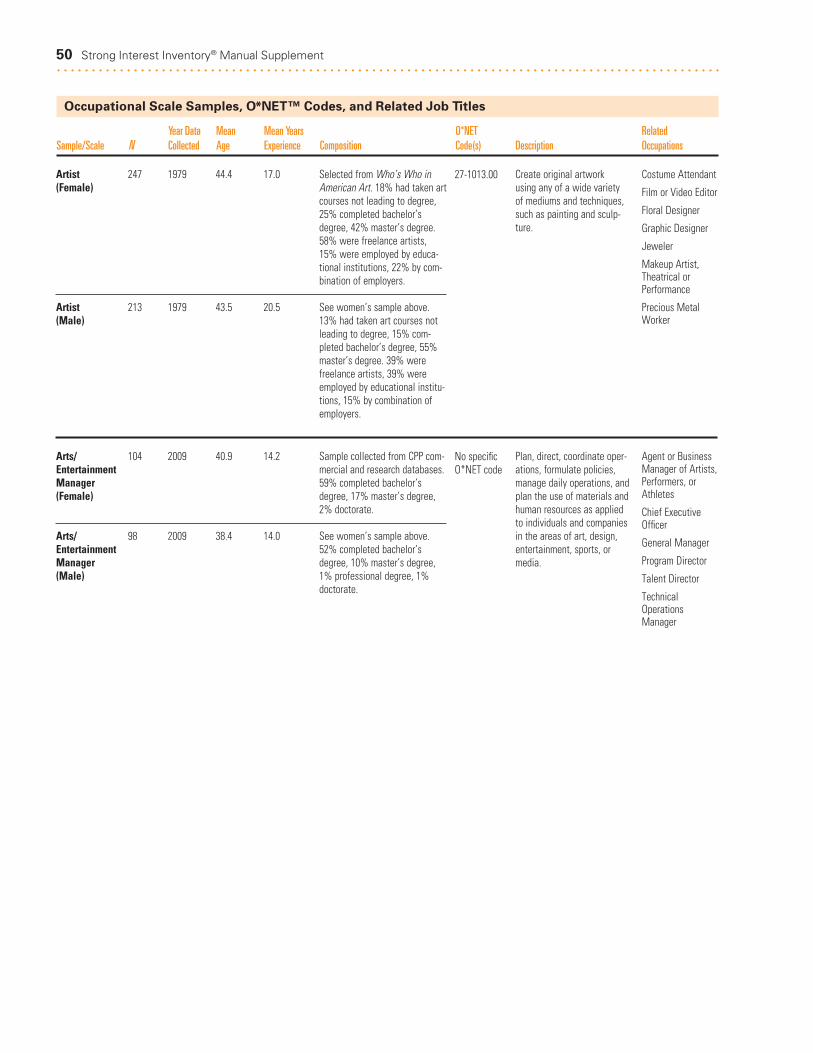
50 Strong Interest Inventory® Manual Supplement. . . . . . . . . . . . . . . . . . . . . . . . . . . . . . . . . . . . . . . . . . . . . . . . . . . . . . . . . . . . . . . . . . . . . . . . . . . . . . . . . . . . . . . . . . . . . . .
Occupational Scale Samples, O*NET™ Codes, and Related Job Titles
Year Data Mean Mean Years O*NET RelatedSample/Scale N Collected Age Experience Composition Code(s) Description Occupations
Artist 247 1979 44.4 17.0(Female)
Artist 213 1979 43.5 20.5(Male)
Arts/ 104 2009 40.9 14.2EntertainmentManager(Female)
Arts/ 98 2009 38.4 14.0EntertainmentManager(Male)
Selected from Who’s Who inAmerican Art. 18% had taken artcourses not leading to degree,25% completed bachelor’sdegree, 42% master’s degree.58% were freelance artists,15% were employed by educa-tional institutions, 22% by com-bination of employers.
See women’s sample above.13% had taken art courses notleading to degree, 15% com-pleted bachelor’s degree, 55%master’s degree. 39% werefreelance artists, 39% wereemployed by educational institu-tions, 15% by combination ofemployers.
Sample collected from CPP com-mercial and research databases.59% completed bachelor’sdegree, 17% master’s degree,2% doctorate.
See women’s sample above.52% completed bachelor’sdegree, 10% master’s degree,1% professional degree, 1%doctorate.
Create original artwork using any of a wide varietyof mediums and techniques,such as painting and sculp-ture.
Plan, direct, coordinate oper-ations, formulate policies,manage daily operations, andplan the use of materials andhuman resources as appliedto individuals and companiesin the areas of art, design,entertainment, sports, ormedia.
27-1013.00
No specificO*NET code
Costume Attendant
Film or Video Editor
Floral Designer
Graphic Designer
Jeweler
Makeup Artist,Theatrical orPerformance
Precious MetalWorker
Agent or BusinessManager of Artists,Performers, orAthletes
Chief ExecutiveOfficer
General Manager
Program Director
Talent Director
TechnicalOperationsManager
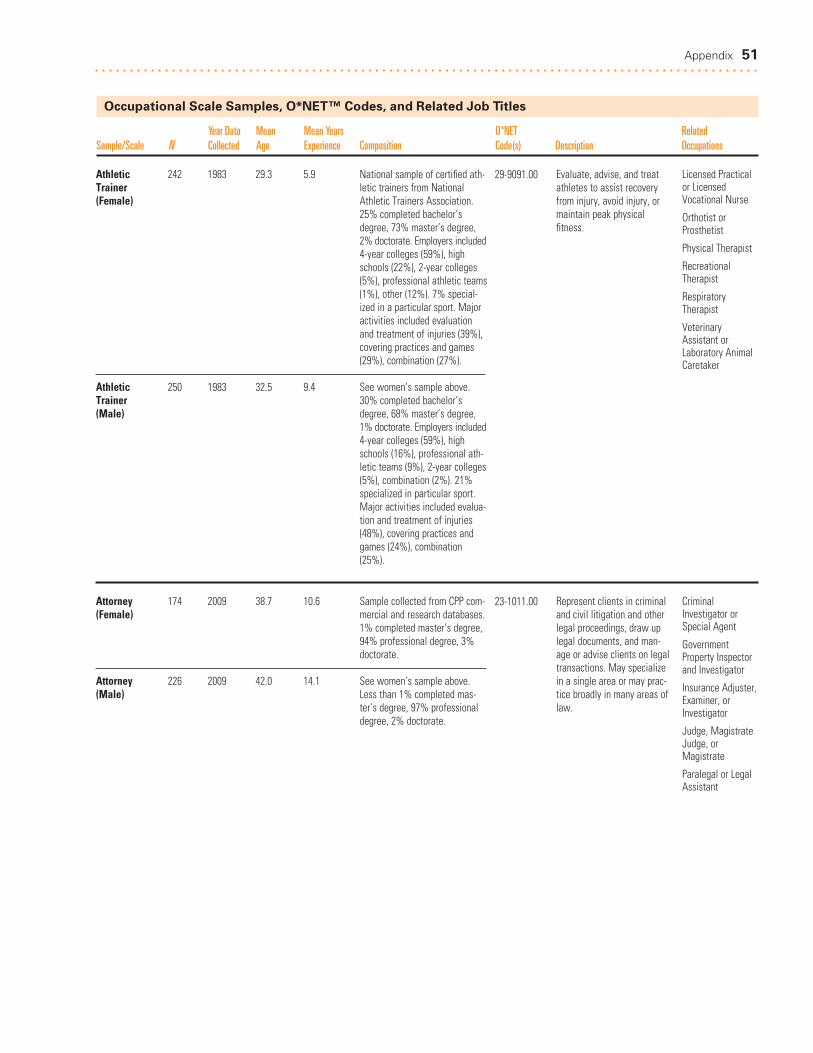
Athletic 242 1983 29.3 5.9Trainer(Female)
Athletic 250 1983 32.5 9.4Trainer(Male)
Attorney 174 2009 38.7 10.6(Female)
Attorney 226 2009 42.0 14.1(Male)
National sample of certified ath-letic trainers from NationalAthletic Trainers Association.25% completed bachelor’sdegree, 73% master’s degree,2% doctorate. Employers included4-year colleges (59%), highschools (22%), 2-year colleges(5%), professional athletic teams(1%), other (12%). 7% special-ized in a particular sport. Majoractivities included evaluationand treatment of injuries (39%),covering practices and games(29%), combination (27%).
See women’s sample above.30% completed bachelor’sdegree, 68% master’s degree,1% doctorate. Employers included4-year colleges (59%), highschools (16%), professional ath-letic teams (9%), 2-year colleges(5%), combination (2%). 21%specialized in particular sport.Major activities included evalua-tion and treatment of injuries(48%), covering practices andgames (24%), combination(25%).
Sample collected from CPP com-mercial and research databases.1% completed master’s degree,94% professional degree, 3%doctorate.
See women’s sample above.Less than 1% completed mas-ter’s degree, 97% professionaldegree, 2% doctorate.
Evaluate, advise, and treatathletes to assist recoveryfrom injury, avoid injury, ormaintain peak physical fitness.
Represent clients in criminaland civil litigation and otherlegal proceedings, draw uplegal documents, and man-age or advise clients on legaltransactions. May specializein a single area or may prac-tice broadly in many areas oflaw.
29-9091.00
23-1011.00
Licensed Practicalor LicensedVocational Nurse
Orthotist orProsthetist
Physical Therapist
RecreationalTherapist
RespiratoryTherapist
VeterinaryAssistant orLaboratory AnimalCaretaker
CriminalInvestigator orSpecial Agent
GovernmentProperty Inspectorand Investigator
Insurance Adjuster,Examiner, orInvestigator
Judge, MagistrateJudge, orMagistrate
Paralegal or LegalAssistant
Appendix 51. . . . . . . . . . . . . . . . . . . . . . . . . . . . . . . . . . . . . . . . . . . . . . . . . . . . . . . . . . . . . . . . . . . . . . . . . . . . . . . . . . . . . . . . . . . . . . .
Occupational Scale Samples, O*NET™ Codes, and Related Job Titles
Year Data Mean Mean Years O*NET RelatedSample/Scale N Collected Age Experience Composition Code(s) Description Occupations
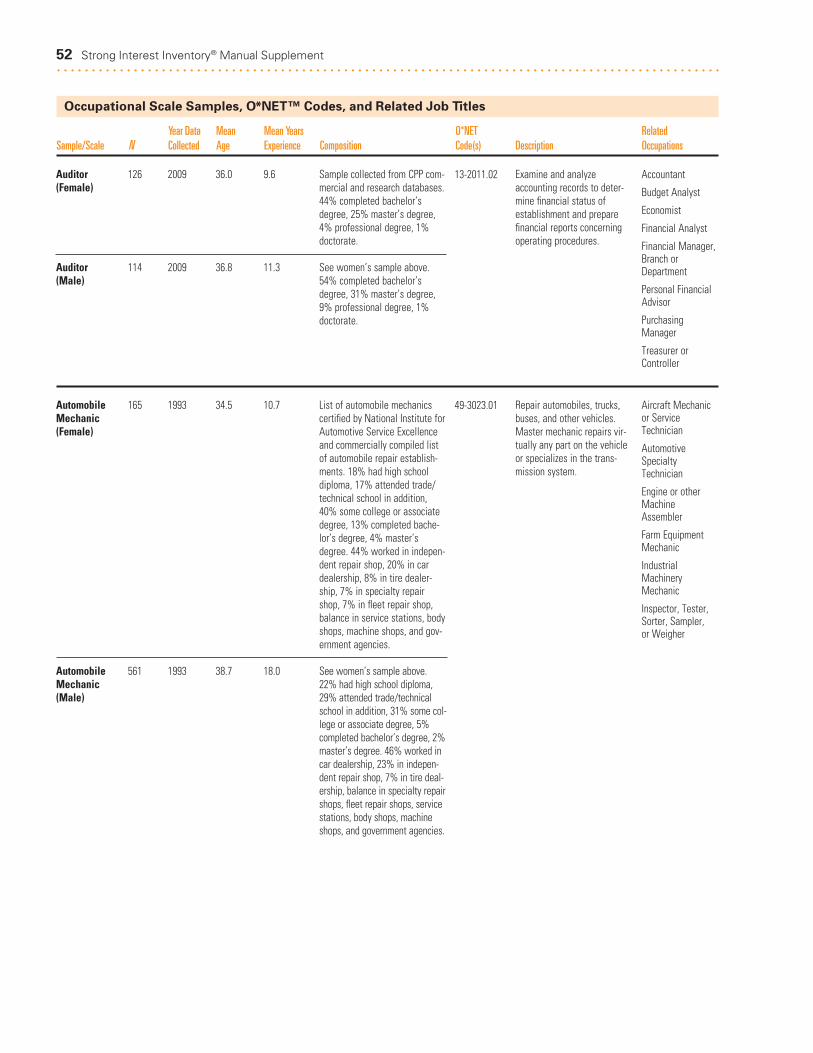
52 Strong Interest Inventory® Manual Supplement. . . . . . . . . . . . . . . . . . . . . . . . . . . . . . . . . . . . . . . . . . . . . . . . . . . . . . . . . . . . . . . . . . . . . . . . . . . . . . . . . . . . . . . . . . . . . . .
Occupational Scale Samples, O*NET™ Codes, and Related Job Titles
Year Data Mean Mean Years O*NET RelatedSample/Scale N Collected Age Experience Composition Code(s) Description Occupations
Auditor 126 2009 36.0 9.6(Female)
Auditor 114 2009 36.8 11.3(Male)
Automobile 165 1993 34.5 10.7Mechanic(Female)
Automobile 561 1993 38.7 18.0Mechanic(Male)
Sample collected from CPP com-mercial and research databases.44% completed bachelor’sdegree, 25% master’s degree,4% professional degree, 1%doctorate.
See women’s sample above.54% completed bachelor’sdegree, 31% master’s degree,9% professional degree, 1%doctorate.
List of automobile mechanicscertified by National Institute forAutomotive Service Excellenceand commercially compiled listof automobile repair establish-ments. 18% had high schooldiploma, 17% attended trade/technical school in addition,40% some college or associatedegree, 13% completed bache-lor’s degree, 4% master’sdegree. 44% worked in indepen-dent repair shop, 20% in cardealership, 8% in tire dealer-ship, 7% in specialty repairshop, 7% in fleet repair shop,balance in service stations, bodyshops, machine shops, and gov-ernment agencies.
See women’s sample above.22% had high school diploma,29% attended trade/technicalschool in addition, 31% some col-lege or associate degree, 5%completed bachelor’s degree, 2%master’s degree. 46% worked incar dealership, 23% in indepen-dent repair shop, 7% in tire deal-ership, balance in specialty repairshops, fleet repair shops, servicestations, body shops, machineshops, and government agencies.
Examine and analyzeaccounting records to deter-mine financial status ofestablishment and preparefinancial reports concerningoperating procedures.
Repair automobiles, trucks,buses, and other vehicles.Master mechanic repairs vir-tually any part on the vehicleor specializes in the trans-mission system.
13-2011.02
49-3023.01
Accountant
Budget Analyst
Economist
Financial Analyst
Financial Manager,Branch orDepartment
Personal FinancialAdvisor
PurchasingManager
Treasurer orController
Aircraft Mechanicor ServiceTechnician
AutomotiveSpecialtyTechnician
Engine or otherMachineAssembler
Farm EquipmentMechanic
IndustrialMachineryMechanic
Inspector, Tester,Sorter, Sampler, or Weigher
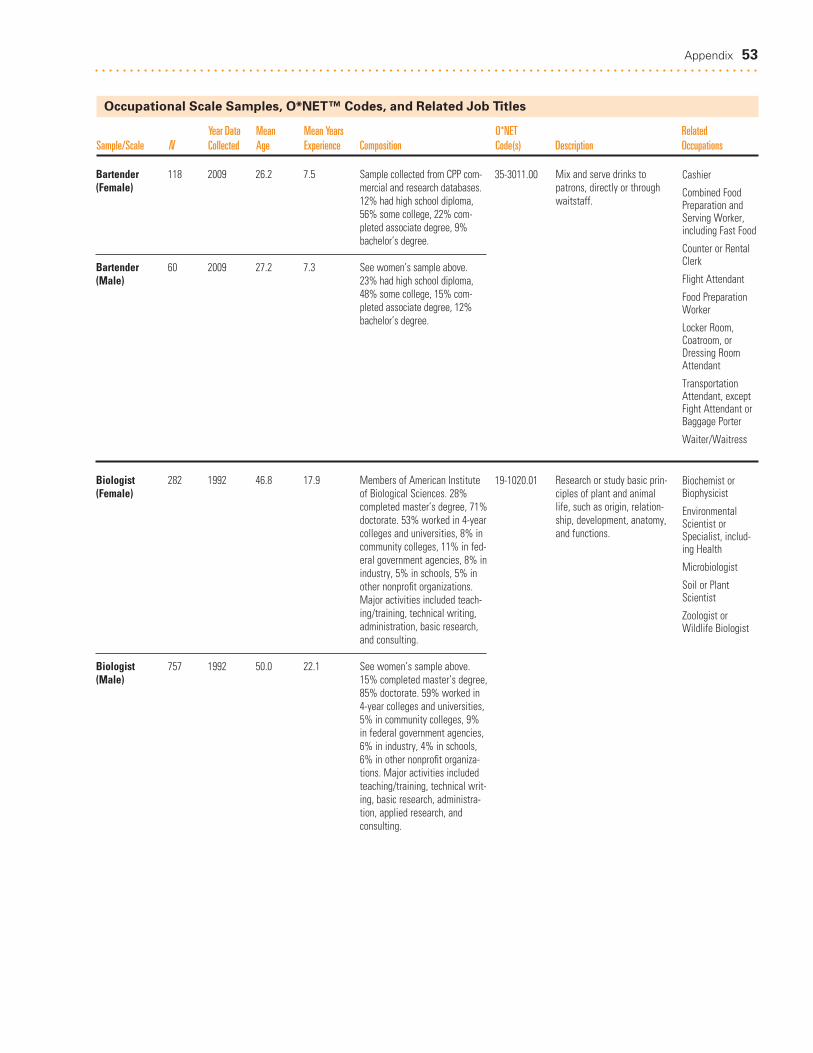
Appendix 53. . . . . . . . . . . . . . . . . . . . . . . . . . . . . . . . . . . . . . . . . . . . . . . . . . . . . . . . . . . . . . . . . . . . . . . . . . . . . . . . . . . . . . . . . . . . . . .
Occupational Scale Samples, O*NET™ Codes, and Related Job Titles
Year Data Mean Mean Years O*NET RelatedSample/Scale N Collected Age Experience Composition Code(s) Description Occupations
Bartender 118 2009 26.2 7.5(Female)
Bartender 60 2009 27.2 7.3(Male)
Biologist 282 1992 46.8 17.9(Female)
Biologist 757 1992 50.0 22.1(Male)
Sample collected from CPP com-mercial and research databases.12% had high school diploma,56% some college, 22% com-pleted associate degree, 9%bachelor’s degree.
See women’s sample above.23% had high school diploma,48% some college, 15% com-pleted associate degree, 12%bachelor’s degree.
Members of American Instituteof Biological Sciences. 28%completed master’s degree, 71%doctorate. 53% worked in 4-yearcolleges and universities, 8% incommunity colleges, 11% in fed-eral government agencies, 8% inindustry, 5% in schools, 5% inother nonprofit organizations.Major activities included teach-ing/training, technical writing,administration, basic research,and consulting.
See women’s sample above.15% completed master’s degree,85% doctorate. 59% worked in4-year colleges and universities,5% in community colleges, 9%in federal government agencies,6% in industry, 4% in schools,6% in other nonprofit organiza-tions. Major activities includedteaching/training, technical writ-ing, basic research, administra-tion, applied research, andconsulting.
Mix and serve drinks topatrons, directly or throughwaitstaff.
Research or study basic prin-ciples of plant and animallife, such as origin, relation-ship, development, anatomy,and functions.
35-3011.00
19-1020.01
Cashier
Combined FoodPreparation andServing Worker,including Fast Food
Counter or RentalClerk
Flight Attendant
Food PreparationWorker
Locker Room,Coatroom, orDressing RoomAttendant
TransportationAttendant, exceptFight Attendant orBaggage Porter
Waiter/Waitress
Biochemist orBiophysicist
EnvironmentalScientist orSpecialist, includ-ing Health
Microbiologist
Soil or PlantScientist
Zoologist orWildlife Biologist

Broadcast 220 1983 32.4 7.8Journalist(Female)
Broadcast 213 1983 34.2 12.8Journalist(Male)
Business 576 1993 45.1 18.1Education Teacher(Female)
Business 545 1993 47.5 21.5Education Teacher(Male)
Sample collected from stationslisted in Broadcasting Yearbookand from responses to ads inInside Radio and Radio andRecords; also members ofAmerican Women in Radio andTelevision, Inc. 23% had highschool diploma, 57% completedbachelor’s degree, 9% master’sdegree. 84% were employed bycommercial station, 15% by pub-lic station. 56% were depart-ment heads. Major activitiesincluded on-the-air broadcasting(28%), programming (13%),sales (9%), research (7%), newsgathering and reporting (6%),combination (26%), other (gen-eral management, production,and copyrighting functions, 9%).
See women’s sample above.26% had high school diploma,53% completed bachelor’sdegree, 7% master’s degree. Allwere broadcasters: 85% wereemployed by commercial station;65% were department heads.Major activities included on-the-air broadcasting (30%), program-ming (21%), management andadministration (8%), news gath-ering and writing (4%), sales (3%),combination (25%), other (3%).
Members of National BusinessEducation Association. 28% com-pleted bachelor’s degree, 64%master’s or professional degree,8% doctorate. 56% were em-ployed in public schools, 30% incolleges or universities, 6% in private or parochial schools.
See women’s sample above. 16%completed bachelor’s degree, 61%master’s or professional degree,22% doctorate. 52% were em-ployed in public schools, 36% incolleges or universities, 7% in pri-vate or parochial schools.
Talk on radio or television.May interview guests, act asmaster of ceremonies, readnews flashes, identify sta-tion by giving call letters, orannounce song title andartist.
Teach courses in businessadministration and manage-ment, such as accounting,finance, human resources,labor relations, marketing,and operations research.
27-3011.00
25-1011.00
Advertising SalesAgent
Broadcast NewsAnalyst
Copy Writer
Poet, Lyricist, orCreative Writer
Reporter orCorrespondent
Talent Director
BusinessAdministrationTeacher
BusinessCommunicationTeacher
Business LawTeacher
BusinessManagementTeacher
Finance Teacher
Marketing Teacher
54 Strong Interest Inventory® Manual Supplement. . . . . . . . . . . . . . . . . . . . . . . . . . . . . . . . . . . . . . . . . . . . . . . . . . . . . . . . . . . . . . . . . . . . . . . . . . . . . . . . . . . . . . . . . . . . . . .
Occupational Scale Samples, O*NET™ Codes, and Related Job Titles
Year Data Mean Mean Years O*NET RelatedSample/Scale N Collected Age Experience Composition Code(s) Description Occupations

Appendix 55. . . . . . . . . . . . . . . . . . . . . . . . . . . . . . . . . . . . . . . . . . . . . . . . . . . . . . . . . . . . . . . . . . . . . . . . . . . . . . . . . . . . . . . . . . . . . . .
Occupational Scale Samples, O*NET™ Codes, and Related Job Titles
Year Data Mean Mean Years O*NET RelatedSample/Scale N Collected Age Experience Composition Code(s) Description Occupations
Business/ 220 2009 38.9 12.6FinanceSupervisor(Female)
Business/ 125 2009 38.8 13.0FinanceSupervisor(Male)
Buyer 214 1983 35.4 8.8(Female)
Buyer 219 1983 36.9 10.8(Male)
Career 426 2009 39.6 9.6Counselor (Female)
Career 104 2009 42.0 11.1Counselor(Male)
Sample collected from CPP com-mercial and research databases.35% completed bachelor’sdegree, 11% master’s degree,1% professional degree.
See women’s sample above.53% completed bachelor’sdegree, 13% master’s degree,2% professional degree, 2%doctorate.
Names from The Salesman’sGuide—Women’s and Children’sWear Buyers and The Sales-man’s Guide—Men’s and Boys’Wear Buyers. 33% had highschool diploma, 11% completedassociate degree, 48% bachelor’sdegree. 46% were employed bydepartment stores, 29% by spe-cialty shops, 10% by chains.81% bought for more than onedepartment.
See women’s sample above.25% had high school diploma,8% completed associate degree,60% bachelor’s degree, 7%master’s degree. 40% wereemployed by department stores,25% by specialty shops, 18% bychains. 96% bought for morethan one department.
Sample collected from theAmerican Counseling Associa-tion and CPP commercial andresearch databases. 25% com-pleted bachelor’s degree, 65%master’s degree, 1% profes-sional degree, 2% doctorate.
See women’s sample above.33% completed bachelor’sdegree, 50% master’s degree,1% professional degree, 5%doctorate.
Plan, direct, coordinate oper-ations, formulate policies,manage daily operations,and plan the use of materi-als and human resources asapplied to individuals andcompanies in the areas ofbusiness and finance.
Buy merchandise or com-modities, other than farmproducts, for resale to con-sumers at the wholesale orretail level, including bothdurable and nondurablegoods. Analyze past buyingtrends, sales records, price,and quality of merchandiseto determine value and yield.Select, order, and authorizepayment for merchandiseaccording to contractualagreements. May conductmeetings with sales person-nel and introduce new products.
Counsel individuals and provide group educationaland vocational guidance services.
No specificO*NET code
13-1022.00
21-1012.00
Branch OperationsManager
Chief ExecutiveOfficer
General Manager
TechnicalOperationsManager
Market ResearchAnalyst
Public RelationsSpecialist
Sales Agent,Securities orCommodities
SalesRepresentative,Wholesale orManufacturing,Technical orScientific Products
SalesRepresentative,Wholesale orManufacturing,except Technical orScientific Products
Child, Family, orSchool SocialWorker
Health Educator
Probation Officer orCorrectionalTreatmentSpecialist

Carpenter 97 1984 31.4 4.7(Female)
Carpenter 199 1983 27.3 4.6(Male)
Members of United Brotherhoodof Carpenters and Joiners ofAmerica, and participants inWomen in Trades Conference.46% had high school diploma,6% completed associate degree,33% bachelor’s degree, 8%master’s degree. 39% werefinal-year apprentices, 34%were at journey level. 26% didmainly rough carpenter work,5% finish, 64% combination.36% of sample specialized in aparticular area of carpentry.91% of sample spent minimumof 50% of time doing manuallabor. Other activities includedreading blueprints, communicat-ing with contractors, problemsolving, and administrative functions.
Members of United Brotherhoodof Carpenters and Joiners ofAmerica. 73% had high schooldiploma, 7% completed associ-ate degree, 8% bachelor’sdegree, 2% other. 82% werefinal-year apprentices, 15%were at journey level. 18% didmainly rough carpentry, 21% fin-ish, 53% combination. 30% ofsample specialized in a particu-lar area of carpentry. 62% ofsample spent minimum of 75%of time doing manual labor.Other activities included readingblueprints, communicating withcontractors, problem solving,and administrative functions.
Construct, erect, install, orrepair structures and fixturesmade of wood, such as con-crete forms; building frame-works, including partitions,joists, studding, and rafters;wood stairways, windowand door frames, and hard-wood floors. May also installcabinets, siding, drywall and batt or roll insulation.Includes brattice builderswho build doors or brattices(ventilation walls or parti-tions) in underground pas-sageways to control theproper circulation of airthrough the passagewaysand to the working places.
47-2031.00 Brickmason orBlockmason
Cabinetmaker orBench Carpenter
Drywall or CeilingTile Installer
Helper—Brickmason,Blockmason,Stonemason, orTile or MarbleSetter
Helper—Carpenter
Helper—Pipelayer,Plumber, Pipefitter,or Steamfitter
Plumber
Reinforcing Iron orRebar Worker
Stonemason
Tile and MarbleSetter
56 Strong Interest Inventory® Manual Supplement. . . . . . . . . . . . . . . . . . . . . . . . . . . . . . . . . . . . . . . . . . . . . . . . . . . . . . . . . . . . . . . . . . . . . . . . . . . . . . . . . . . . . . . . . . . . . . .
Occupational Scale Samples, O*NET™ Codes, and Related Job Titles
Year Data Mean Mean Years O*NET RelatedSample/Scale N Collected Age Experience Composition Code(s) Description Occupations

Appendix 57. . . . . . . . . . . . . . . . . . . . . . . . . . . . . . . . . . . . . . . . . . . . . . . . . . . . . . . . . . . . . . . . . . . . . . . . . . . . . . . . . . . . . . . . . . . . . . .
Occupational Scale Samples, O*NET™ Codes, and Related Job Titles
Year Data Mean Mean Years O*NET RelatedSample/Scale N Collected Age Experience Composition Code(s) Description Occupations
Chef 106 1984 31.8 6.8(Female)
Chef 296 1983 37.4 14.0(Male)
Members of American CulinaryFederation and graduates ofJohnson and Wales College inProvidence, RI, and of the Cu-linary Institute, Hyde Park, NY.6% had high school diploma,14% attended trade or voca-tional school, 58% completedassociate degree, 12% bache-lor’s degree, 1% master’sdegree. 21% were employed byrestaurants, 16% by hotels, 11%by private clubs, 6% by cateringservices, 5% by educationalinstitutions, 25% by combina-tion, remainder by resorts, hos-pitals, or institutional firms.Major activities included foodpreparation (42%), supervisionand training (15%), planningmenus (3%), combination (33%).
Members of American CulinaryFederation. 17% had high schooldiploma, 33% attended trade orvocational school, 22% com-pleted associate degree, 10%bachelor’s degree, 3% master’sdegree. 25% were employed byrestaurants, 21% by privateclubs, 15% by hotels, 18% bycombination, remainder byresorts, hospitals, educationalinstitutions, caterers, industrialfirms, or other. Major activitiesincluded supervision and training(30%), food preparation (22%),ordering food (3%), combination(40%).
Direct the preparation, seasoning, and cooking ofsalads, soups, fish, meats,vegetables, desserts, orother foods. May plan andprice menu items, order sup-plies, and keep records andaccounts. May participate incooking.
35-1011.00 Cook, Fast Food
Dietetic Technician
First-LineSupervisor/Managerof Food Preparationor Serving Workers

Chemist 271 1993 41.2 14.8(Female)
Chemist 304 1993 48.1 20.6(Male)
Chiropractor 113 2003 42.4 12.3(Female)
Chiropractor 100 2003 46.3 18.3(Male)
Members of American ChemicalSociety. 41% completed mas-ter’s or professional degree,59% doctorate. Major activitiesincluded teaching/training, management/supervision,applied research. 47% wereemployed by business/industry,30% by educational institutions,12% by government agencies.
See women’s sample above.26% completed master’s or pro-fessional degree, 74% doctor-ate. Major activities includedteaching/ training, manage-ment/supervision, appliedresearch, and basic research.59% were employed by busi-ness/industry, 22% by educa-tional institutions, 7% bygovernment agencies.
Mailing lists of members ofMinnesota Board of ChiropracticExaminers and Texas Chiroprac-tic Association. 2% completedmaster’s degree, 82% profes-sional degree, 12% doctorate.
See women’s sample above. 1%completed master’s degree, 90%professional degree, 7% doctor-ate, 2% other.
Conduct qualitative andquantitative chemical analy-ses or chemical experimentsin laboratories for quality orprocess control or to developnew products or knowledge.
Adjust spinal column andother articulations of thebody to correct abnormalitiesof the human body believedto be caused by interferencewith the nervous system.Examine patient to determinenature and extent of disorder.Manipulate spine or otherinvolved area. May utilizesupplementary measures,such as exercise, rest, water,light, heat, and nutritionaltherapy.
19-2031.00
29-1011.00
Chemical Plant orSystem Operator
ChemicalTechnician
EnvironmentalScience orProtectionTechnician, including Health
Food ScienceTechnician
Materials Scientist
Soil or PlantScientist
Dentist, General
Emergency MedicalTechnician orParamedic
Licensed Practicalor LicensedVocational Nurse
Optometrist
Orthodontist
Physician Assistant
Podiatrist
RespiratoryTherapist
58 Strong Interest Inventory® Manual Supplement. . . . . . . . . . . . . . . . . . . . . . . . . . . . . . . . . . . . . . . . . . . . . . . . . . . . . . . . . . . . . . . . . . . . . . . . . . . . . . . . . . . . . . . . . . . . . . .
Occupational Scale Samples, O*NET™ Codes, and Related Job Titles
Year Data Mean Mean Years O*NET RelatedSample/Scale N Collected Age Experience Composition Code(s) Description Occupations
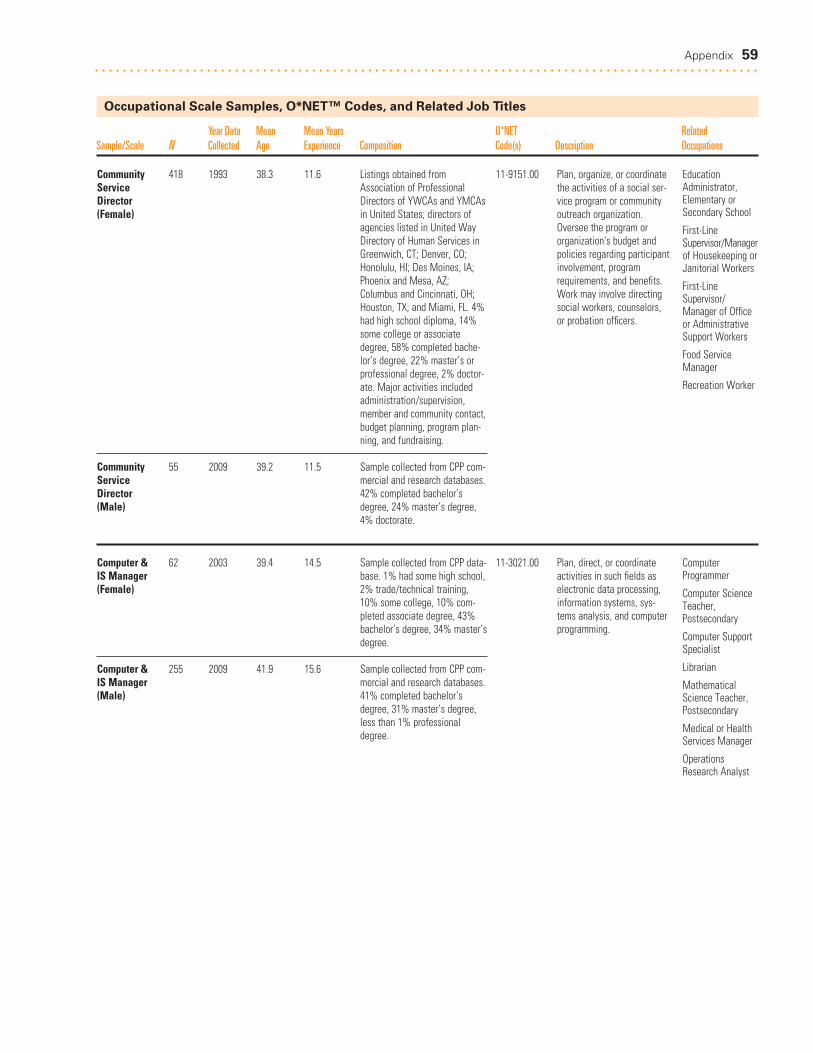
Appendix 59. . . . . . . . . . . . . . . . . . . . . . . . . . . . . . . . . . . . . . . . . . . . . . . . . . . . . . . . . . . . . . . . . . . . . . . . . . . . . . . . . . . . . . . . . . . . . . .
Occupational Scale Samples, O*NET™ Codes, and Related Job Titles
Year Data Mean Mean Years O*NET RelatedSample/Scale N Collected Age Experience Composition Code(s) Description Occupations
Community 418 1993 38.3 11.6ServiceDirector (Female)
Community 55 2009 39.2 11.5ServiceDirector (Male)
Computer & 62 2003 39.4 14.5IS Manager (Female)
Computer & 255 2009 41.9 15.6IS Manager (Male)
Listings obtained fromAssociation of ProfessionalDirectors of YWCAs and YMCAsin United States; directors ofagencies listed in United WayDirectory of Human Services inGreenwich, CT; Denver, CO;Honolulu, HI; Des Moines, IA;Phoenix and Mesa, AZ;Columbus and Cincinnati, OH;Houston, TX; and Miami, FL. 4%had high school diploma, 14%some college or associatedegree, 58% completed bache-lor’s degree, 22% master’s orprofessional degree, 2% doctor-ate. Major activities includedadministration/supervision,member and community contact,budget planning, program plan-ning, and fundraising.
Sample collected from CPP com-mercial and research databases.42% completed bachelor’sdegree, 24% master’s degree,4% doctorate.
Sample collected from CPP data-base. 1% had some high school,2% trade/technical training,10% some college, 10% com-pleted associate degree, 43%bachelor’s degree, 34% master’sdegree.
Sample collected from CPP com-mercial and research databases.41% completed bachelor’sdegree, 31% master’s degree,less than 1% professionaldegree.
Plan, organize, or coordinatethe activities of a social ser-vice program or communityoutreach organization.Oversee the program ororganization's budget andpolicies regarding participantinvolvement, programrequirements, and benefits.Work may involve directingsocial workers, counselors,or probation officers.
Plan, direct, or coordinateactivities in such fields aselectronic data processing,information systems, sys-tems analysis, and computerprogramming.
11-9151.00
11-3021.00
EducationAdministrator,Elementary orSecondary School
First-LineSupervisor/Managerof Housekeeping orJanitorial Workers
First-LineSupervisor/Manager of Officeor AdministrativeSupport Workers
Food ServiceManager
Recreation Worker
ComputerProgrammer
Computer ScienceTeacher,Postsecondary
Computer SupportSpecialist
Librarian
MathematicalScience Teacher,Postsecondary
Medical or HealthServices Manager
OperationsResearch Analyst
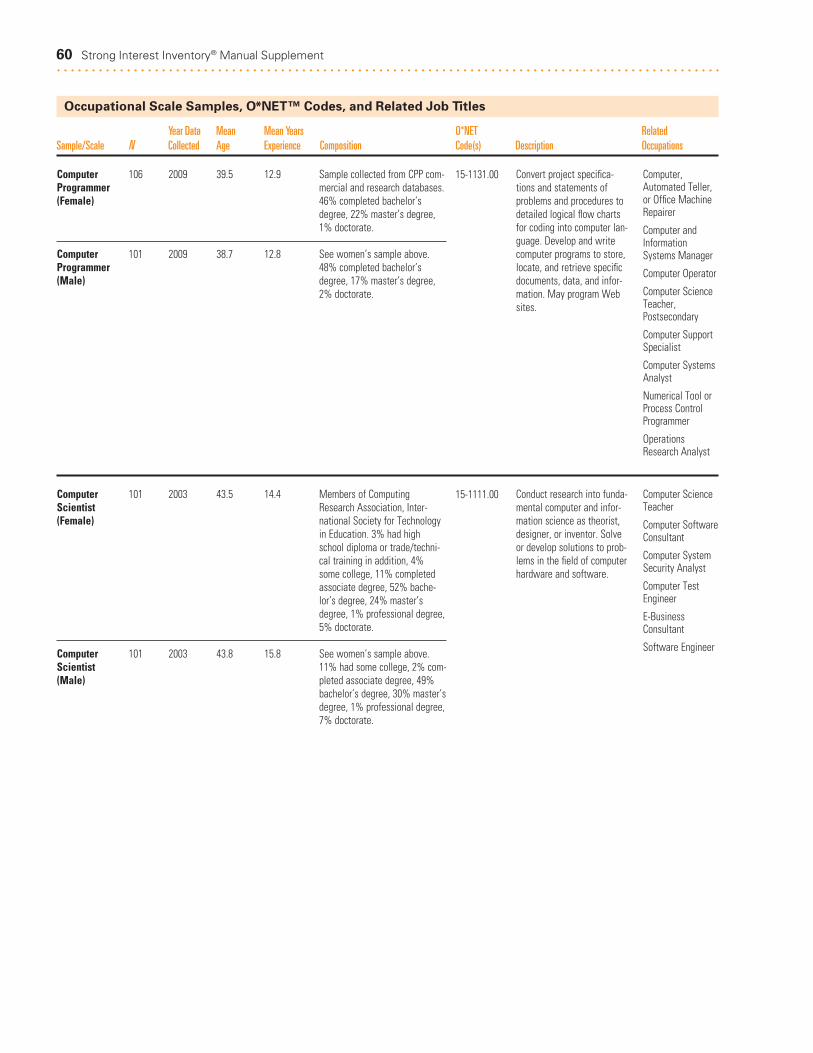
60 Strong Interest Inventory® Manual Supplement. . . . . . . . . . . . . . . . . . . . . . . . . . . . . . . . . . . . . . . . . . . . . . . . . . . . . . . . . . . . . . . . . . . . . . . . . . . . . . . . . . . . . . . . . . . . . . .
Occupational Scale Samples, O*NET™ Codes, and Related Job Titles
Year Data Mean Mean Years O*NET RelatedSample/Scale N Collected Age Experience Composition Code(s) Description Occupations
Computer 106 2009 39.5 12.9Programmer(Female)
Computer 101 2009 38.7 12.8Programmer(Male)
Computer 101 2003 43.5 14.4Scientist (Female)
Computer 101 2003 43.8 15.8Scientist (Male)
Sample collected from CPP com-mercial and research databases.46% completed bachelor’sdegree, 22% master’s degree,1% doctorate.
See women’s sample above.48% completed bachelor’sdegree, 17% master’s degree,2% doctorate.
Members of ComputingResearch Association, Inter-national Society for Technologyin Education. 3% had highschool diploma or trade/techni-cal training in addition, 4%some college, 11% completedassociate degree, 52% bache-lor’s degree, 24% master’sdegree, 1% professional degree,5% doctorate.
See women’s sample above.11% had some college, 2% com-pleted associate degree, 49%bachelor’s degree, 30% master’sdegree, 1% professional degree,7% doctorate.
Convert project specifica-tions and statements ofproblems and procedures todetailed logical flow chartsfor coding into computer lan-guage. Develop and writecomputer programs to store,locate, and retrieve specificdocuments, data, and infor-mation. May program Websites.
Conduct research into funda-mental computer and infor-mation science as theorist,designer, or inventor. Solveor develop solutions to prob-lems in the field of computerhardware and software.
15-1131.00
15-1111.00
Computer,Automated Teller,or Office MachineRepairer
Computer andInformationSystems Manager
Computer Operator
Computer ScienceTeacher,Postsecondary
Computer SupportSpecialist
Computer SystemsAnalyst
Numerical Tool orProcess ControlProgrammer
OperationsResearch Analyst
Computer ScienceTeacher
Computer SoftwareConsultant
Computer SystemSecurity Analyst
Computer TestEngineer
E-BusinessConsultant
Software Engineer

Appendix 61. . . . . . . . . . . . . . . . . . . . . . . . . . . . . . . . . . . . . . . . . . . . . . . . . . . . . . . . . . . . . . . . . . . . . . . . . . . . . . . . . . . . . . . . . . . . . . .
Occupational Scale Samples, O*NET™ Codes, and Related Job Titles
Year Data Mean Mean Years O*NET RelatedSample/Scale N Collected Age Experience Composition Code(s) Description Occupations
Computer 102 2003 36.7 11.3SystemsAnalyst(Female)
Computer 164 2009 40.2 14.4SystemsAnalyst(Male)
Computer/ 90 2009 43.7 17.4MathematicsManager(Female)
Computer/ 216 2009 42.0 16.6MathematicsManager(Male)
Sample collected from CPP data-base. 1% had some high school,2% high school diploma, 2%trade/technical training, 17%some college, 6% completedassociate degree, 54% bache-lor’s degree, 17% master’sdegree, 1% doctorate.
Sample collected from CPP com-mercial and research databases.43% completed bachelor’sdegree, 20% master’s degree,1% professional degree, 1% doctorate.
Sample collected from CPP com-mercial and research databases.50% completed bachelor’sdegree, 28% master’s degree,1% doctorate.
See women’s sample above.45% completed bachelor’sdegree, 31% master’s degree,2% professional degree, 2%doctorate.
Analyze science, engineer-ing, business, and all otherdata processing problems for application to electronicdata processing systems.Analyze user requirements,procedures, and problems toautomate or improve exist-ing systems and review com-puter system capabilities,workflow, and schedulinglimitations. May analyze or recommend commer-cially available software.May supervise computerprogrammers.
Plan, direct, coordinate oper-ations, formulate policies,manage daily operations,and plan the use of materi-als and human resources asapplied to individuals andcompanies in the areas ofcomputers and mathematics.
15-1151.00
No specificO*NET code
Computer,Automated Teller,or Office MachineRepairer
Computer Operator
ComputerProgrammer
Computer ScienceTeacher,Postsecondary
Computer SecuritySpecialist
Computer SupportSpecialist
Electrical orElectronicsRepairer,Commercial orIndustrialEquipment
Network SystemsAnalyst
Chief ExecutiveOfficer
ComputerProgrammer
Computer SystemsAnalyst
General Manager
TechnicalOperationsManager
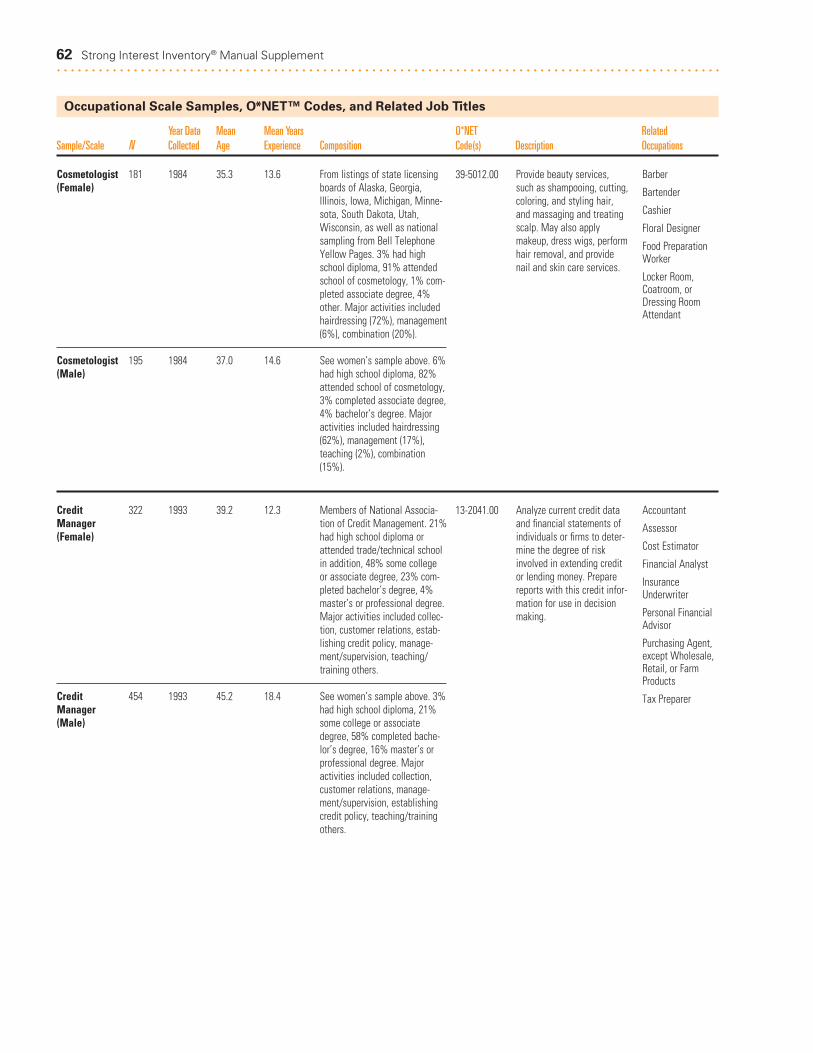
62 Strong Interest Inventory® Manual Supplement. . . . . . . . . . . . . . . . . . . . . . . . . . . . . . . . . . . . . . . . . . . . . . . . . . . . . . . . . . . . . . . . . . . . . . . . . . . . . . . . . . . . . . . . . . . . . . .
Occupational Scale Samples, O*NET™ Codes, and Related Job Titles
Year Data Mean Mean Years O*NET RelatedSample/Scale N Collected Age Experience Composition Code(s) Description Occupations
Cosmetologist 181 1984 35.3 13.6(Female)
Cosmetologist 195 1984 37.0 14.6(Male)
Credit 322 1993 39.2 12.3Manager(Female)
Credit 454 1993 45.2 18.4Manager(Male)
From listings of state licensingboards of Alaska, Georgia,Illinois, Iowa, Michigan, Minne-sota, South Dakota, Utah,Wisconsin, as well as nationalsampling from Bell TelephoneYellow Pages. 3% had highschool diploma, 91% attendedschool of cosmetology, 1% com-pleted associate degree, 4%other. Major activities includedhairdressing (72%), management(6%), combination (20%).
See women’s sample above. 6%had high school diploma, 82%attended school of cosmetology,3% completed associate degree,4% bachelor’s degree. Majoractivities included hairdressing(62%), management (17%),teaching (2%), combination(15%).
Members of National Associa-tion of Credit Management. 21%had high school diploma orattended trade/technical schoolin addition, 48% some college or associate degree, 23% com-pleted bachelor’s degree, 4%master’s or professional degree.Major activities included collec-tion, customer relations, estab-lishing credit policy, manage-ment/supervision, teaching/training others.
See women’s sample above. 3%had high school diploma, 21%some college or associatedegree, 58% completed bache-lor’s degree, 16% master’s orprofessional degree. Major activities included collection,customer relations, manage-ment/supervision, establishingcredit policy, teaching/trainingothers.
Provide beauty services,such as shampooing, cutting,coloring, and styling hair,and massaging and treatingscalp. May also apply makeup, dress wigs, performhair removal, and providenail and skin care services.
Analyze current credit dataand financial statements ofindividuals or firms to deter-mine the degree of riskinvolved in extending creditor lending money. Preparereports with this credit infor-mation for use in decisionmaking.
39-5012.00
13-2041.00
Barber
Bartender
Cashier
Floral Designer
Food PreparationWorker
Locker Room,Coatroom, orDressing RoomAttendant
Accountant
Assessor
Cost Estimator
Financial Analyst
InsuranceUnderwriter
Personal FinancialAdvisor
Purchasing Agent,except Wholesale,Retail, or FarmProducts
Tax Preparer
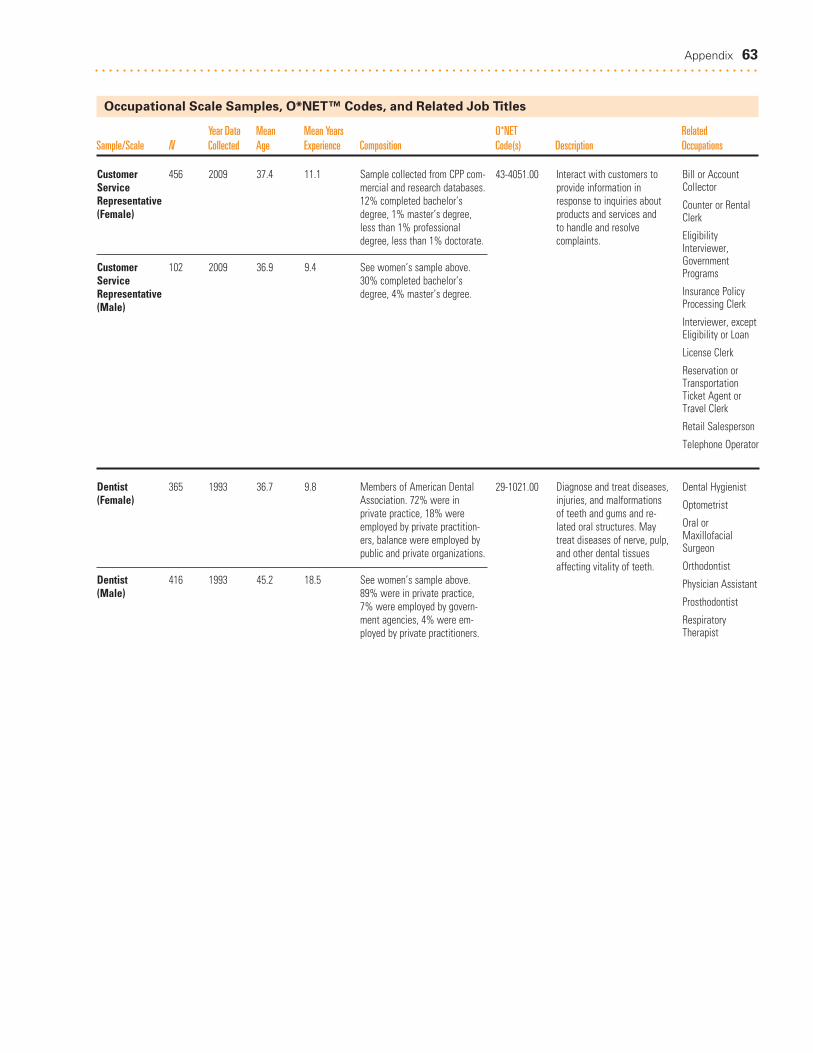
Appendix 63. . . . . . . . . . . . . . . . . . . . . . . . . . . . . . . . . . . . . . . . . . . . . . . . . . . . . . . . . . . . . . . . . . . . . . . . . . . . . . . . . . . . . . . . . . . . . . .
Occupational Scale Samples, O*NET™ Codes, and Related Job Titles
Year Data Mean Mean Years O*NET RelatedSample/Scale N Collected Age Experience Composition Code(s) Description Occupations
Customer 456 2009 37.4 11.1ServiceRepresentative(Female)
Customer 102 2009 36.9 9.4ServiceRepresentative(Male)
Dentist 365 1993 36.7 9.8(Female)
Dentist 416 1993 45.2 18.5(Male)
Sample collected from CPP com-mercial and research databases.12% completed bachelor’sdegree, 1% master’s degree,less than 1% professionaldegree, less than 1% doctorate.
See women’s sample above.30% completed bachelor’sdegree, 4% master’s degree.
Members of American DentalAssociation. 72% were in private practice, 18% wereemployed by private practition-ers, balance were employed bypublic and private organizations.
See women’s sample above.89% were in private practice,7% were employed by govern-ment agencies, 4% were em-ployed by private practitioners.
Interact with customers toprovide information inresponse to inquiries aboutproducts and services and to handle and resolve complaints.
Diagnose and treat diseases,injuries, and malformationsof teeth and gums and re-lated oral structures. Maytreat diseases of nerve, pulp,and other dental tissuesaffecting vitality of teeth.
43-4051.00
29-1021.00
Bill or AccountCollector
Counter or RentalClerk
EligibilityInterviewer,GovernmentPrograms
Insurance PolicyProcessing Clerk
Interviewer, exceptEligibility or Loan
License Clerk
Reservation orTransportationTicket Agent orTravel Clerk
Retail Salesperson
Telephone Operator
Dental Hygienist
Optometrist
Oral orMaxillofacialSurgeon
Orthodontist
Physician Assistant
Prosthodontist
RespiratoryTherapist
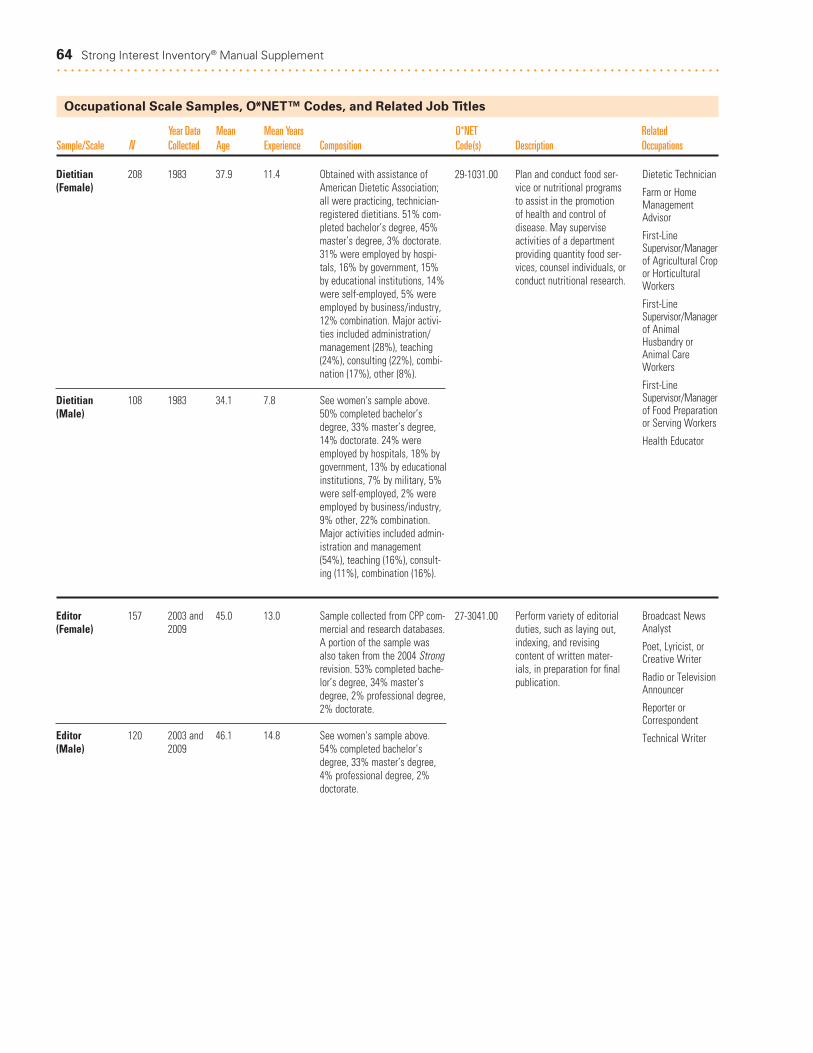
Dietitian 208 1983 37.9 11.4(Female)
Dietitian 108 1983 34.1 7.8(Male)
Editor 157 2003 and 45.0 13.0(Female) 2009
Editor 120 2003 and 46.1 14.8(Male) 2009
Obtained with assistance ofAmerican Dietetic Association;all were practicing, technician-registered dietitians. 51% com-pleted bachelor’s degree, 45%master’s degree, 3% doctorate.31% were employed by hospi-tals, 16% by government, 15%by educational institutions, 14%were self-employed, 5% wereemployed by business/industry,12% combination. Major activi-ties included administration/management (28%), teaching(24%), consulting (22%), combi-nation (17%), other (8%).
See women's sample above.50% completed bachelor’sdegree, 33% master’s degree,14% doctorate. 24% wereemployed by hospitals, 18% bygovernment, 13% by educationalinstitutions, 7% by military, 5%were self-employed, 2% wereemployed by business/industry,9% other, 22% combination.Major activities included admin-istration and management(54%), teaching (16%), consult-ing (11%), combination (16%).
Sample collected from CPP com-mercial and research databases.A portion of the sample wasalso taken from the 2004 Strongrevision. 53% completed bache-lor’s degree, 34% master’sdegree, 2% professional degree,2% doctorate.
See women's sample above.54% completed bachelor’sdegree, 33% master’s degree,4% professional degree, 2%doctorate.
Plan and conduct food ser-vice or nutritional programsto assist in the promotion of health and control of disease. May superviseactivities of a departmentproviding quantity food ser-vices, counsel individuals, orconduct nutritional research.
Perform variety of editorialduties, such as laying out,indexing, and revising content of written mater-ials, in preparation for finalpublication.
29-1031.00
27-3041.00
Dietetic Technician
Farm or HomeManagementAdvisor
First-LineSupervisor/Managerof Agricultural Cropor HorticulturalWorkers
First-LineSupervisor/Managerof AnimalHusbandry orAnimal CareWorkers
First-LineSupervisor/Managerof Food Preparationor Serving Workers
Health Educator
Broadcast NewsAnalyst
Poet, Lyricist, orCreative Writer
Radio or TelevisionAnnouncer
Reporter orCorrespondent
Technical Writer
64 Strong Interest Inventory® Manual Supplement. . . . . . . . . . . . . . . . . . . . . . . . . . . . . . . . . . . . . . . . . . . . . . . . . . . . . . . . . . . . . . . . . . . . . . . . . . . . . . . . . . . . . . . . . . . . . . .
Occupational Scale Samples, O*NET™ Codes, and Related Job Titles
Year Data Mean Mean Years O*NET RelatedSample/Scale N Collected Age Experience Composition Code(s) Description Occupations

Appendix 65. . . . . . . . . . . . . . . . . . . . . . . . . . . . . . . . . . . . . . . . . . . . . . . . . . . . . . . . . . . . . . . . . . . . . . . . . . . . . . . . . . . . . . . . . . . . . . .
Occupational Scale Samples, O*NET™ Codes, and Related Job Titles
Year Data Mean Mean Years O*NET RelatedSample/Scale N Collected Age Experience Composition Code(s) Description Occupations
Elected 224 1978 48.2 6.3PublicOfficial(Female)
Elected 208 1979 46.3 8.6PublicOfficial(Male)
Selected from rosters providedby National Women’s EducationFund, including state legislators,statewide constitutional office-holders, and members of Houseof Representatives; and from listof city and county officials fromWomen in Public Office: ABiographical Directory andStatistical Analysis. 23% hadhigh school diploma, 39% com-pleted bachelor’s degree, 16%master’s degree. 39% wereemployed in other occupationswhile they held office.
Members of 93rd U.S. Congress,collected by R. Willow. Othersselected from State ElectiveOfficials and the Legislatures,published by Council of StateGovernments. 20% had highschool diploma, 30% completedbachelor’s degree, 26% lawdegree, 13% master’s degree,6% doctorate. 67% were em-ployed in other occupationswhile they held office.
Hold elected public office inlegislative bodies such asCongress, state legislatures,county commissions, andcity councils. Involved in leg-islative action of the govern-ment. Listen to lobbyists anddetermine budget for thegovernment.
No specificO*NETcode
Attorney General
City CouncilMember
CountyCommissioner
GovernmentService Director
Governor
Judge
Lawyer
Legislator
Mayor
Representative
Senator
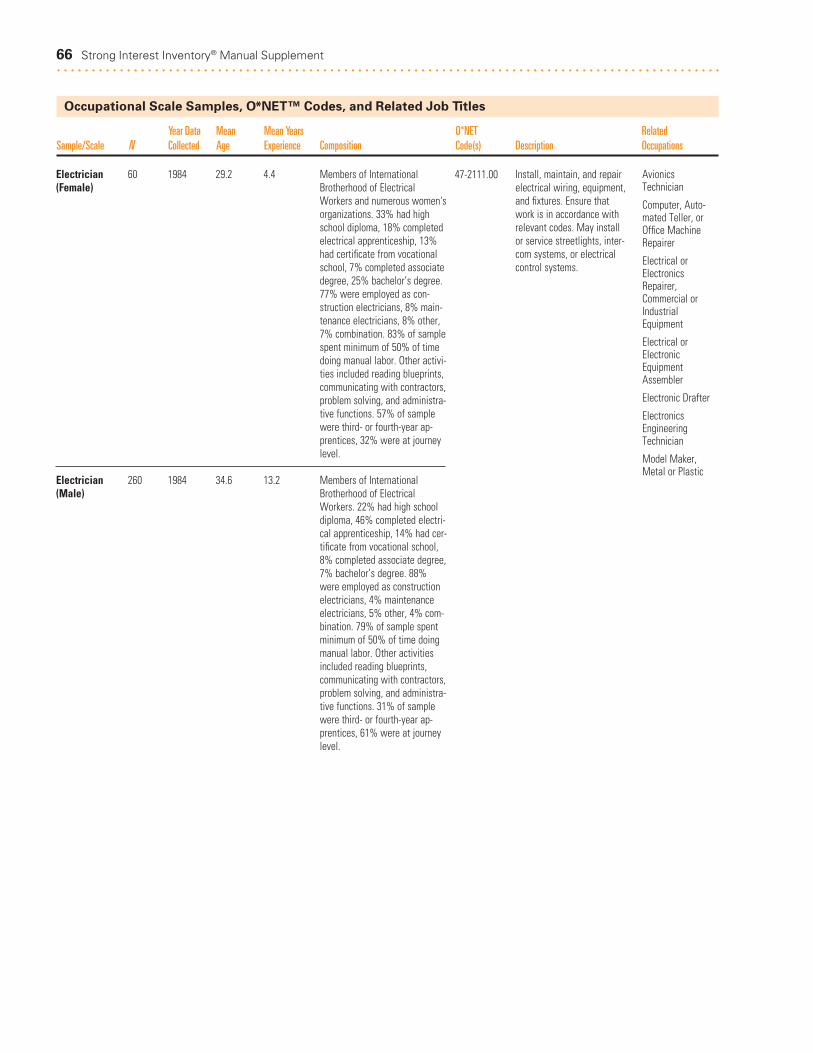
Electrician 60 1984 29.2 4.4(Female)
Electrician 260 1984 34.6 13.2(Male)
Members of InternationalBrotherhood of ElectricalWorkers and numerous women'sorganizations. 33% had highschool diploma, 18% completedelectrical apprenticeship, 13%had certificate from vocationalschool, 7% completed associatedegree, 25% bachelor’s degree.77% were employed as con-struction electricians, 8% main-tenance electricians, 8% other,7% combination. 83% of samplespent minimum of 50% of timedoing manual labor. Other activi-ties included reading blueprints,communicating with contractors,problem solving, and administra-tive functions. 57% of samplewere third- or fourth-year ap-prentices, 32% were at journeylevel.
Members of InternationalBrotherhood of ElectricalWorkers. 22% had high schooldiploma, 46% completed electri-cal apprenticeship, 14% had cer-tificate from vocational school,8% completed associate degree,7% bachelor’s degree. 88%were employed as constructionelectricians, 4% maintenanceelectricians, 5% other, 4% com-bination. 79% of sample spentminimum of 50% of time doingmanual labor. Other activitiesincluded reading blueprints,communicating with contractors,problem solving, and administra-tive functions. 31% of samplewere third- or fourth-year ap-prentices, 61% were at journeylevel.
Install, maintain, and repairelectrical wiring, equipment,and fixtures. Ensure thatwork is in accordance withrelevant codes. May installor service streetlights, inter-com systems, or electricalcontrol systems.
47-2111.00 AvionicsTechnician
Computer, Auto-mated Teller, orOffice MachineRepairer
Electrical orElectronicsRepairer,Commercial orIndustrialEquipment
Electrical orElectronicEquipmentAssembler
Electronic Drafter
ElectronicsEngineeringTechnician
Model Maker,Metal or Plastic
66 Strong Interest Inventory® Manual Supplement. . . . . . . . . . . . . . . . . . . . . . . . . . . . . . . . . . . . . . . . . . . . . . . . . . . . . . . . . . . . . . . . . . . . . . . . . . . . . . . . . . . . . . . . . . . . . . .
Occupational Scale Samples, O*NET™ Codes, and Related Job Titles
Year Data Mean Mean Years O*NET RelatedSample/Scale N Collected Age Experience Composition Code(s) Description Occupations

Appendix 67. . . . . . . . . . . . . . . . . . . . . . . . . . . . . . . . . . . . . . . . . . . . . . . . . . . . . . . . . . . . . . . . . . . . . . . . . . . . . . . . . . . . . . . . . . . . . . .
Occupational Scale Samples, O*NET™ Codes, and Related Job Titles
Year Data Mean Mean Years O*NET RelatedSample/Scale N Collected Age Experience Composition Code(s) Description Occupations
Elementary 358 2009 37.3 10.3SchoolTeacher (Female)
Elementary 67 2009 36.6 10.0SchoolTeacher (Male)
Emergency 207 1983 37.2 5.7MedicalTechnician (Female)
Emergency 241 1983 33.8 7.1MedicalTechnician (Male)
Sample collected from CPP com-mercial and research databases.65% completed bachelor’sdegree, 30% master’s degree,1% professional degree, lessthan 1% doctorate.
See women’s sample above.57% completed bachelor’sdegree, 36% master’s degree,3% professional degree.
Members of National Associa-tion of Emergency MedicalTechnicians. 13% had highschool diploma, 6% attendedvocational school, 36% hadsome college, 8% completedassociate degree, 19% bache-lor’s degree, 2% master’sdegree. Employers included com-munity and municipal services,such as police and fire depart-ments (45%), private ambulancecompanies (24%), hospitals(20%), combination (6%). 74%spent minimum of 50% of timegiving emergency medical care;other activities included drivingambulance, determining natureof injuries, and taking trainingcourses.
See women’s sample above.10% had high school diploma,16% attended vocational school,24% had some college, 15%completed associate degree,22% bachelor’s degree.Employers included communityand municipal services, such aspolice and fire departments(55%), hospitals (18%), privateambulance companies (17%),combination (3%), other (6%).50% spent minimum of 50% oftime giving emergency medicalcare; other activities includeddriving ambulance, determiningnature of injuries, and takingtraining courses.
Teach pupils in public or pri-vate schools at the elemen-tary level basic academic,social, and other formativeskills.
Assess injuries, administeremergency medical care,and extricate trapped indi-viduals. Transport injured or sick persons to medicalfacilities.
25-2021.00
29-2041.00
InstructionalCoordinator
KindergartenTeacher, exceptSpecial Education
Librarian
Preschool Teacher,except SpecialEducation
Recreation Worker
Teacher’s Assistant
Ambulance Driveror Attendant
Chiropractor
Dentist, General
Nursing Aide,Orderly, orAttendant
Radiation Therapist

Engineer 91 2009 35.3 10.4(Female)
Engineer 351 2009 39.3 14.1(Male)
Engineering 126 2003 41.0 13.3Technician (Female)
Engineering 105 2003 46.9 21.6Technician (Male)
Sample collected from CPP com-mercial and research databases.48% completed bachelor’sdegree, 37% master’s degree,10% professional degree.
See women’s sample above.49% completed bachelor’sdegree, 34% master’s degree,4% doctorate.
Sample from e-mail list of mem-bers of National Institute forCertification in EngineeringTechnologies. 8% had highschool diploma, 9% trade/tech-nical training in addition, 33%some college, 24% completedassociate degree, 20% bache-lor’s degree, 5% master’sdegree, 1% professional degree.
See women’s sample above. 9%had high school diploma, 11%trade/technical training in addi-tion, 33% some college, 28%completed associate degree,17% bachelor’s degree, 2%master’s degree.
Perform engineering dutiesof planning, designing,developing, testing,installing, and supervising inareas such as biomedical,chemical, civil, computerhardware, electrical, elec-tronics, environmental,health and safety, industrial,marine, materials, mechani-cal, mining or geological,and nuclear engineering.
Under supervision of engi-neers, apply theory and prin-ciples of engineering tomodify, test, plan, design, or develop electrical equip-ment, industrial manufactur-ing processes, machineryand equipment, or buildingstructures.
Scale builtfrom a combi-nation of thefollowingO*NET codes:
17-2031.0017-2041.0017-2051.0017-2061.0017-2071.0017-2072.0017-2081.00 17-2111.0017-2112.0017-2121.0117-2131.0017-2141.0017-2151.0017-2161.00
Scale builtfrom a combi-nation of thefollowingO*NET codes:
17-3027.0017-3022.0017-3023.0317-3026.00
Civil Drafter
Construction orBuilding Inspector
ElectronicsEngineer, exceptComputer
EngineeringManager
LandscapeArchitect
Marine Architect
MathematicalTechnician
Physicist
Soil or WaterConservationist
AgriculturalEngineeringTechnician
ChemicalEngineeringTechnician
Civil EngineeringTechnician
Electrical Drafter
Electrical orElectronicsRepairer,Commercial orIndustrialEquipment
Electronic Drafter
Machinist
Marine Architect
Marine Engineer
MechanicalEngineer
Model Maker,Metal or Plastic
Petroleum Engineer
SurveyingTechnician
68 Strong Interest Inventory® Manual Supplement. . . . . . . . . . . . . . . . . . . . . . . . . . . . . . . . . . . . . . . . . . . . . . . . . . . . . . . . . . . . . . . . . . . . . . . . . . . . . . . . . . . . . . . . . . . . . . .
Occupational Scale Samples, O*NET™ Codes, and Related Job Titles
Year Data Mean Mean Years O*NET RelatedSample/Scale N Collected Age Experience Composition Code(s) Description Occupations

Appendix 69. . . . . . . . . . . . . . . . . . . . . . . . . . . . . . . . . . . . . . . . . . . . . . . . . . . . . . . . . . . . . . . . . . . . . . . . . . . . . . . . . . . . . . . . . . . . . . .
Occupational Scale Samples, O*NET™ Codes, and Related Job Titles
Year Data Mean Mean Years O*NET RelatedSample/Scale N Collected Age Experience Composition Code(s) Description Occupations
English 303 1982 39.1 11.0Teacher (Female)
English 222 1982 39.1 14.6Teacher(Male)
ESL Instructor 96 2003 45.3 12.6(Female)
ESL Instructor 99 2003 49.2 15.3(Male)
National sample, members ofNational Council of Teachers ofEnglish, Secondary Section. Allsecondary school English teach-ers. 39% completed bachelor'sdegree, 57% master’s degree.48% taught mainly literature,35% writing, 12% grammar.81% spent minimum of 40% oftime teaching; other activitiesincluded lesson preparation,grading, and meetings.
See women’s sample above.29% completed bachelor’sdegree, 68% master’s degree,3% doctorate. 49% taught mainlyliterature, 29% writing, 16%grammar. 87% spent minimumof 40% of time teaching; otheractivities included lesson prepa-ration, grading, and meetings.
Mailing list from Californiachapter of Teachers of English to Speakers of Other Languages,members of Teachers of Englishto Speakers of Other Languages,and National Association forBilingual Education. 13% com-pleted bachelor’s degree, 79%master’s degree, 1% profes-sional degree, 7% doctorate.
See women’s sample above. 1%had some college, 11% com-pleted bachelor’s degree, 68%master’s degree, 4% profes-sional degree, 16% doctorate.
Teach courses in English language and literature,including linguistics andcomparative literature.
Teach or instruct out-of-school youths and adults inremedial education classes,preparatory classes for theGeneral Educational Devel-opment test, literacy, orEnglish as a second language.Teaching may or may nottake place in a traditionaleducational institution.
25-1123.00
25-3011.00
Adult Literacy,RemedialEducation, or GEDTeacher orInstructor
Elementary SchoolTeacher, exceptSpecial Education
InstructionalCoordinator
KindergartenTeacher, exceptSpecial Education
English Languageor LiteratureTeacher,Postsecondary
Foreign Languageor LiteratureTeacher,Postsecondary
Graduate TeachingAssistant
Health Educator
Teacher’s Assistant
VocationalEducation Teacher,Postsecondary

70 Strong Interest Inventory® Manual Supplement. . . . . . . . . . . . . . . . . . . . . . . . . . . . . . . . . . . . . . . . . . . . . . . . . . . . . . . . . . . . . . . . . . . . . . . . . . . . . . . . . . . . . . . . . . . . . . .
Occupational Scale Samples, O*NET™ Codes, and Related Job Titles
Year Data Mean Mean Years O*NET RelatedSample/Scale N Collected Age Experience Composition Code(s) Description Occupations
Facilities 577 1993 45.6 14.3Manager(Female)
Facilities 569 1993 43.2 15.0Manager(Male)
Members of National ExecutiveHousekeepers Association. 27%had high school diploma, 9%attended trade/technical schoolin addition, 41% had some col-lege or associate degree, 10%completed bachelor’s degree,2% master’s degree. 40%worked in hospitals, 25% innursing/convalescent homes,15% in hotels, 6% in education-al institutions. Major activitiesincluded administration/supervi-sion, training, customer contact,staff meetings, policy/procedureplanning, and purchasing.
See women’s sample above. 9%had high school diploma, 6%attended trade/technical schoolin addition, 44% had some col-lege or associate degree, 29%completed bachelor’s degree,6% master’s degree. 51%worked in hospitals, 14% innursing/convalescent homes,6% in hotels, 14% in educa-tional institutions. Major activi-ties included administration/supervision, training, customercontact, staff meetings, policy/procedure planning, and purchasing.
Supervise work activities ofcleaning personnel in hotels,hospitals, offices, and otherestablishments.
37-1011.00 Appraiser, RealEstate
First-LineSupervisor/Managerof ConstructionTrades orExtraction Workers
First-LineSupervisor/Managerof Food Preparationor Serving Workers
First-LineSupervisor/Managerof Landscaping,Lawn Service, orGroundskeepingWorkers
First-LineSupervisor/Managerof Office orAdministrativeSupport Workers
First-LineSupervisor/Managerof Personal ServiceWorkers
Host/Hostess,Restaurant,Lounge, or CoffeeShop
Postmaster or MailSuperintendent
Social orCommunity ServiceManager

Appendix 71. . . . . . . . . . . . . . . . . . . . . . . . . . . . . . . . . . . . . . . . . . . . . . . . . . . . . . . . . . . . . . . . . . . . . . . . . . . . . . . . . . . . . . . . . . . . . . .
Occupational Scale Samples, O*NET™ Codes, and Related Job Titles
Year Data Mean Mean Years O*NET RelatedSample/Scale N Collected Age Experience Composition Code(s) Description Occupations
Farmer/ 92 1992 51.0 26.7Rancher(Female)
Farmer/ 152 1992 51.2 28.4Rancher(Male)
Financial 87 2003 35.8 9.2Analyst(Female)
Financial 177 2009 36.1 9.6Analyst(Male)
Lists provided by Texas FarmBureau, Iowa Farm Bureau,American Agri-women, andresponses to mailings to mem-bers of National Farmers Orga-nization and article in theirnewsletter. 27% had high school diploma, 11% attendedtrade/technical school in addi-tion, 22% had some college orassociate degree, 23% com-pleted bachelor’s degree, 4%master’s or professional degree.Major activities included recordkeeping, business/financial plan-ning, purchasing, marketing/customer contact, supervision,machinery operation.
Lists provided by Texas FarmBureau, Iowa Farm Bureau, andresponses to mailings to mem-bers of National FarmersOrganization and article in theirnewsletter. 28% had high schooldiploma, 11% attended trade/technical school in addition,20% had some college or asso-ciate degree, 24% completedbachelor’s degree, 3% master’sdegree. Major activities includedpurchasing, business/financialplanning, machinery operation,record keeping, marketing/cus-tomer contact, crop planning/scheduling, and supervision.
Sample collected from CPP data-base. 5% had high school di-ploma, 14% some college, 3%completed associate degree,47% bachelor’s degree, 28%master’s degree, 3% profes-sional degree.
Sample collected from CPP com-mercial and research databases.50% completed bachelor’sdegree, 37% master’s degree,l% professional degree, l% doctorate.
On an ownership or rentalbasis, operate farms, ranches, greenhouses, nurs-eries, timber tracts, or otheragricultural productionestablishments that producecrops, horticultural special-ties, livestock, poultry, fin-fish, shellfish, or animalspecialties. May plant, cul-tivate, harvest, performpostharvest activities, andmarket crops and livestock;may hire, train, and super-vise farmworkers or super-vise a farm labor contractor;may prepare cost, produc-tion, and other records. Maymaintain and operate ma-chinery and perform physicalwork.
Conduct quantitative analy-ses of information affectinginvestment programs of pub-lic or private institutions.
11-9013.02
13-2051.00
AgriculturalInspector
AquaculturalManager
Crop and LivestockManager
Farm or HomeManagementAdvisor
Farmworker orLaborer, Crop
Fisher or RelatedFishing Worker
First-LineSupervisor/Managerof Agricultural Cropor HorticulturalWorkers
First-LineSupervisor/Managerof AnimalHusbandry orAnimal CareWorkers
First-LineSupervisor/Managerof AquaculturalWorkers
Accountant
Actuary
Auditor
Credit Analyst
Economist
Personal FinancialAdvisor
Tax Examiner,Collector, orRevenue Agent
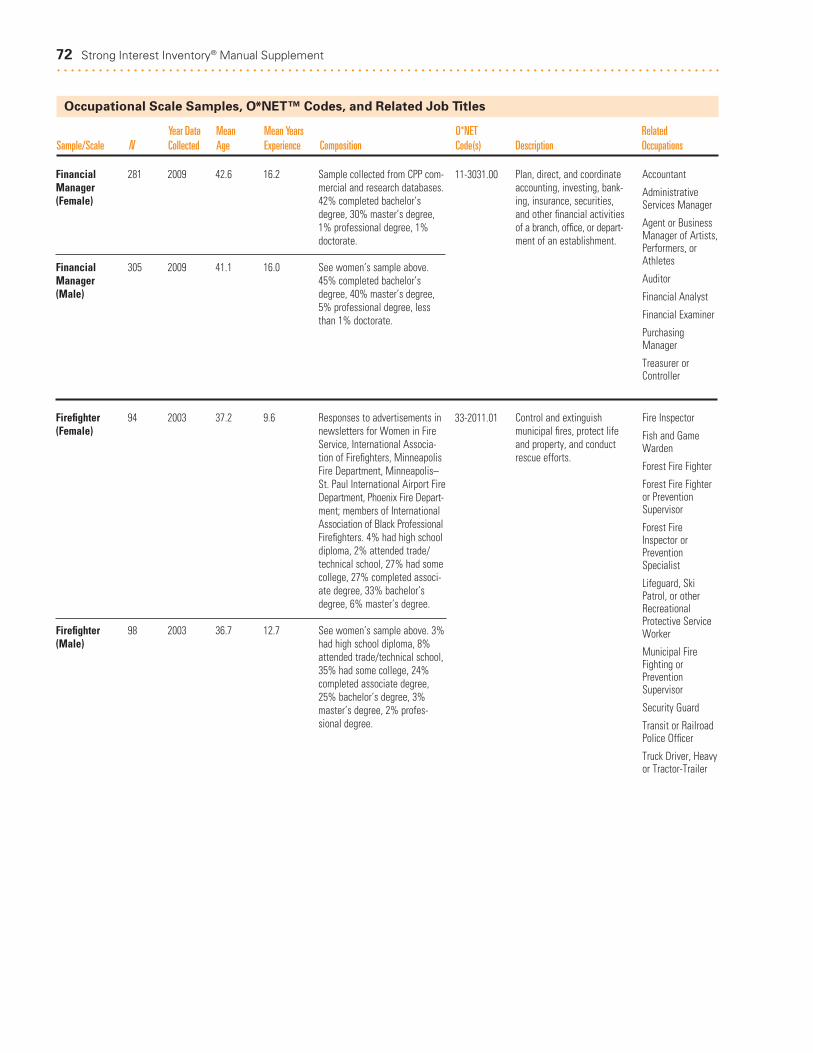
72 Strong Interest Inventory® Manual Supplement. . . . . . . . . . . . . . . . . . . . . . . . . . . . . . . . . . . . . . . . . . . . . . . . . . . . . . . . . . . . . . . . . . . . . . . . . . . . . . . . . . . . . . . . . . . . . . .
Occupational Scale Samples, O*NET™ Codes, and Related Job Titles
Year Data Mean Mean Years O*NET RelatedSample/Scale N Collected Age Experience Composition Code(s) Description Occupations
Financial 281 2009 42.6 16.2Manager(Female)
Financial 305 2009 41.1 16.0Manager(Male)
Firefighter 94 2003 37.2 9.6(Female)
Firefighter 98 2003 36.7 12.7(Male)
Sample collected from CPP com-mercial and research databases.42% completed bachelor’sdegree, 30% master’s degree,1% professional degree, 1%doctorate.
See women’s sample above.45% completed bachelor’sdegree, 40% master’s degree,5% professional degree, lessthan 1% doctorate.
Responses to advertisements innewsletters for Women in FireService, International Associa-tion of Firefighters, MinneapolisFire Department, Minneapolis–St. Paul International Airport FireDepartment, Phoenix Fire Depart-ment; members of InternationalAssociation of Black ProfessionalFirefighters. 4% had high schooldiploma, 2% attended trade/technical school, 27% had somecollege, 27% completed associ-ate degree, 33% bachelor’sdegree, 6% master’s degree.
See women’s sample above. 3%had high school diploma, 8%attended trade/technical school,35% had some college, 24%completed associate degree,25% bachelor’s degree, 3%master’s degree, 2% profes-sional degree.
Plan, direct, and coordinateaccounting, investing, bank-ing, insurance, securities,and other financial activitiesof a branch, office, or depart-ment of an establishment.
Control and extinguishmunicipal fires, protect lifeand property, and conductrescue efforts.
11-3031.00
33-2011.01
Accountant
AdministrativeServices Manager
Agent or BusinessManager of Artists,Performers, orAthletes
Auditor
Financial Analyst
Financial Examiner
PurchasingManager
Treasurer orController
Fire Inspector
Fish and GameWarden
Forest Fire Fighter
Forest Fire Fighteror PreventionSupervisor
Forest FireInspector orPreventionSpecialist
Lifeguard, SkiPatrol, or otherRecreationalProtective ServiceWorker
Municipal FireFighting orPreventionSupervisor
Security Guard
Transit or RailroadPolice Officer
Truck Driver, Heavyor Tractor-Trailer
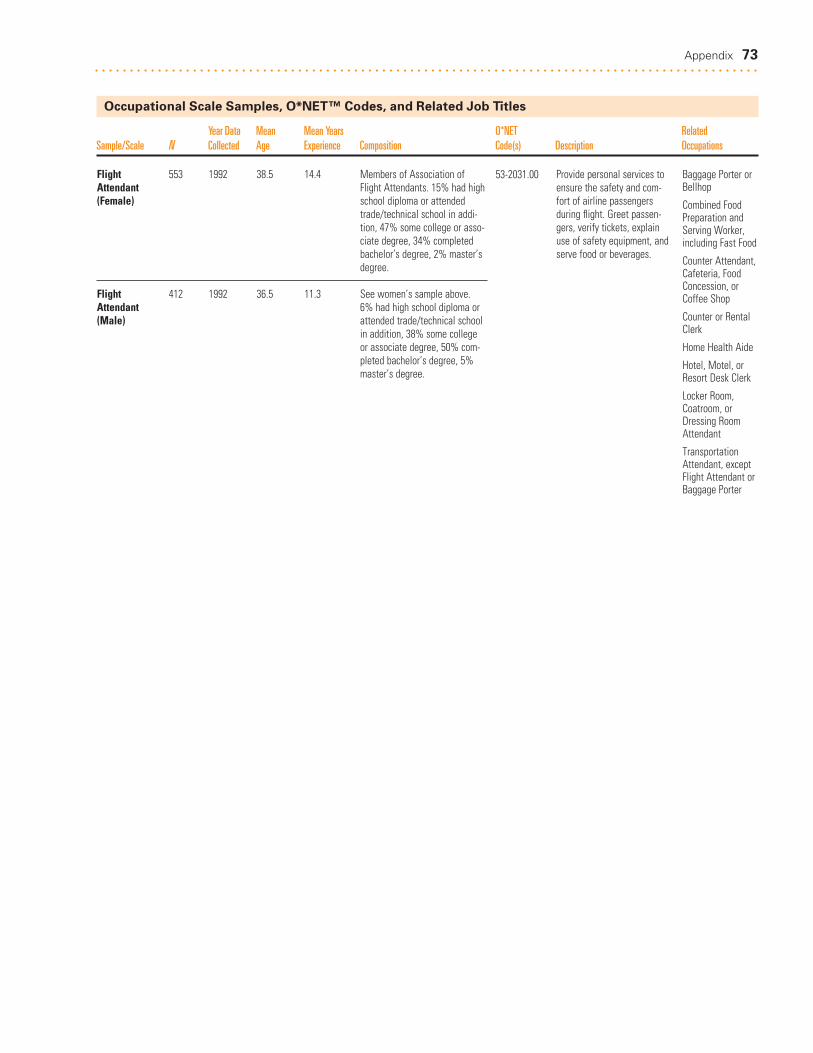
Appendix 73. . . . . . . . . . . . . . . . . . . . . . . . . . . . . . . . . . . . . . . . . . . . . . . . . . . . . . . . . . . . . . . . . . . . . . . . . . . . . . . . . . . . . . . . . . . . . . .
Occupational Scale Samples, O*NET™ Codes, and Related Job Titles
Year Data Mean Mean Years O*NET RelatedSample/Scale N Collected Age Experience Composition Code(s) Description Occupations
Flight 553 1992 38.5 14.4Attendant(Female)
Flight 412 1992 36.5 11.3Attendant(Male)
Members of Association ofFlight Attendants. 15% had highschool diploma or attendedtrade/technical school in addi-tion, 47% some college or asso-ciate degree, 34% completedbachelor’s degree, 2% master’sdegree.
See women’s sample above. 6% had high school diploma orattended trade/technical schoolin addition, 38% some college or associate degree, 50% com-pleted bachelor’s degree, 5%master’s degree.
Provide personal services toensure the safety and com-fort of airline passengersduring flight. Greet passen-gers, verify tickets, explainuse of safety equipment, andserve food or beverages.
53-2031.00 Baggage Porter orBellhop
Combined FoodPreparation andServing Worker,including Fast Food
Counter Attendant,Cafeteria, FoodConcession, orCoffee Shop
Counter or RentalClerk
Home Health Aide
Hotel, Motel, orResort Desk Clerk
Locker Room,Coatroom, orDressing RoomAttendant
TransportationAttendant, exceptFlight Attendant orBaggage Porter

Florist 211 1983 40.4 11.3(Female)
Florist 207 1983 40.2 15.8(Male)
Retail members of Society ofAmerican Florists listed in Who'sWho in Floriculture. 18% hadhigh school diploma, 9% attendedvocational school, 35% hadsome college, 9% completedassociate degree, 21% bache-lor’s degree. 84% worked infamily-owned florist shop; 91%of shops employed less than 10people. 93% were single floristshops, 7% part of chain. 79%bought all inventory from sup-plier, 2% had greenhouse, 18%obtained inventory from combi-nation. Major activities includeddesigning arrangements (25%),taking inventory (17%), customercontact (13%), combination(44%).
See women’s sample above. 6%had high school diploma, 35%some college, 9% completedassociate degree, 36% bache-lor’s degree. 84% worked infamily-owned florist shop; 72%of shops employed less than 10people. 79% were single floristshops, 21% part of chain. 63%bought all inventory from sup-plier; 6% had greenhouse, 31%obtained inventory from combi-nation of two. Major activitiesincluded designing arrange-ments (23%), taking inventory(18%), customer contact (11%),combination (41%).
Design, cut, and arrangelive, dried, or artificial flow-ers and foliage.
27-1023.00 Costume Attendant
Makeup Artist,Theatrical orPerformance
Nursery Worker
Optician,Dispensing
Shoe or LeatherWorker or Repairer
Tailor, Dressmaker,or Custom Sewer
74 Strong Interest Inventory® Manual Supplement. . . . . . . . . . . . . . . . . . . . . . . . . . . . . . . . . . . . . . . . . . . . . . . . . . . . . . . . . . . . . . . . . . . . . . . . . . . . . . . . . . . . . . . . . . . . . . .
Occupational Scale Samples, O*NET™ Codes, and Related Job Titles
Year Data Mean Mean Years O*NET RelatedSample/Scale N Collected Age Experience Composition Code(s) Description Occupations
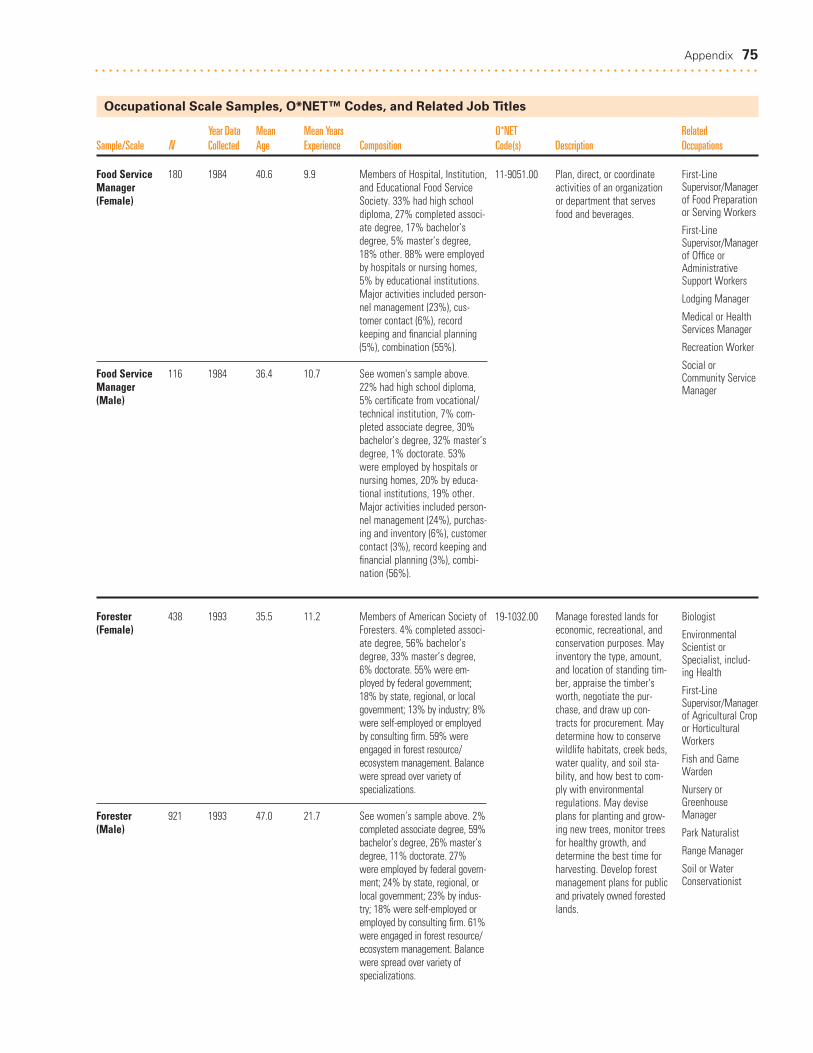
Appendix 75. . . . . . . . . . . . . . . . . . . . . . . . . . . . . . . . . . . . . . . . . . . . . . . . . . . . . . . . . . . . . . . . . . . . . . . . . . . . . . . . . . . . . . . . . . . . . . .
Occupational Scale Samples, O*NET™ Codes, and Related Job Titles
Year Data Mean Mean Years O*NET RelatedSample/Scale N Collected Age Experience Composition Code(s) Description Occupations
Food Service 180 1984 40.6 9.9Manager (Female)
Food Service 116 1984 36.4 10.7Manager (Male)
Forester 438 1993 35.5 11.2(Female)
Forester 921 1993 47.0 21.7(Male)
Members of Hospital, Institution,and Educational Food ServiceSociety. 33% had high schooldiploma, 27% completed associ-ate degree, 17% bachelor’sdegree, 5% master’s degree,18% other. 88% were employedby hospitals or nursing homes,5% by educational institutions.Major activities included person-nel management (23%), cus-tomer contact (6%), recordkeeping and financial planning(5%), combination (55%).
See women's sample above.22% had high school diploma,5% certificate from vocational/technical institution, 7% com-pleted associate degree, 30%bachelor’s degree, 32% master’sdegree, 1% doctorate. 53%were employed by hospitals ornursing homes, 20% by educa-tional institutions, 19% other.Major activities included person-nel management (24%), purchas-ing and inventory (6%), customercontact (3%), record keeping andfinancial planning (3%), combi-nation (56%).
Members of American Society ofForesters. 4% completed associ-ate degree, 56% bachelor’sdegree, 33% master’s degree,6% doctorate. 55% were em-ployed by federal government;18% by state, regional, or localgovernment; 13% by industry; 8%were self-employed or employedby consulting firm. 59% wereengaged in forest resource/ecosystem management. Balancewere spread over variety of specializations.
See women’s sample above. 2%completed associate degree, 59%bachelor’s degree, 26% master’sdegree, 11% doctorate. 27%were employed by federal govern-ment; 24% by state, regional, orlocal government; 23% by indus-try; 18% were self-employed oremployed by consulting firm. 61%were engaged in forest resource/ecosystem management. Balancewere spread over variety of specializations.
Plan, direct, or coordinateactivities of an organizationor department that servesfood and beverages.
Manage forested lands foreconomic, recreational, andconservation purposes. Mayinventory the type, amount,and location of standing tim-ber, appraise the timber'sworth, negotiate the pur-chase, and draw up con-tracts for procurement. Maydetermine how to conservewildlife habitats, creek beds,water quality, and soil sta-bility, and how best to com-ply with environmentalregulations. May deviseplans for planting and grow-ing new trees, monitor treesfor healthy growth, anddetermine the best time forharvesting. Develop forestmanagement plans for publicand privately owned forestedlands.
11-9051.00
19-1032.00
First-LineSupervisor/Managerof Food Preparationor Serving Workers
First-LineSupervisor/Managerof Office orAdministrativeSupport Workers
Lodging Manager
Medical or HealthServices Manager
Recreation Worker
Social orCommunity ServiceManager
Biologist
EnvironmentalScientist orSpecialist, includ-ing Health
First-LineSupervisor/Managerof Agricultural Cropor HorticulturalWorkers
Fish and GameWarden
Nursery orGreenhouseManager
Park Naturalist
Range Manager
Soil or WaterConservationist

Geographer 99 2003 42.0 8.3(Female)
Geographer 100 2003 48.2 16.3(Male)
Geologist 212 1979 35.4 9.9(Female)
Geologist 242 1979 39.4 15.0(Male)
Mailing list from Association ofAmerican Geographers; mem-bers of Society of WomanGeographers. 1% had some col-lege, 6% completed bachelor’sdegree, 44% master’s degree,49% doctorate.
See women’s sample above. 5% completed bachelor’sdegree, 32% master’s degree,2% professional degree, 61%doctorate.
From Geological Society ofAmerica Directory. 23% com-pleted bachelor’s degree, 47%master’s degree, 30% doctorate.36% were employed by govern-ment, 27% by educational insti-tutions, 26% by private industry.Major activities were researchand exploration (59%), teaching(13%), combination (12%).
See women’s sample above.12% completed bachelor’sdegree, 36% master’s degree,52% doctorate. 39% wereemployed by educational institu-tions, 30% by private industry,24% by government. Majoractivities were research andexploration (41%), teaching(22%), administration (12%),combination (18%).
Study nature and use ofareas of earth's surface,relating and interpretinginteractions of physical andcultural phenomena. Conductresearch on physical aspectsof a region, including landforms, climates, soils, plants,and animals, and conductresearch on the spatialimplications of human activi-ties within a given area,including social characteris-tics, economic activities, andpolitical organization, aswell as researching interde-pendence between regionsat scales ranging from localto global.
Study the composition,structure, and history of theearth's crust; examine rocks,minerals, and fossil remainsto identify and determine the sequence of processesaffecting the development of the earth.
19-3092.00
19-2042.00
Atmospheric orSpace Scientist
Cartographer orPhotogrammetrist
City or RegionalPlanning Aide
Fish and GameWarden
Forester
Geoscientist,except Hydrologistor Geographer
Hydrologist
Police, Fire, orAmbulanceDispatcher
Surveyor
Urban or RegionalPlanner
Earth ScienceTeacher
EngineeringGeologist
Forest Geologist
Geological DataTechnician
GeologicalEngineer
Hydrologist
Marine Geologist
Paleontologist
PetroleumGeologist
Seismologist
76 Strong Interest Inventory® Manual Supplement. . . . . . . . . . . . . . . . . . . . . . . . . . . . . . . . . . . . . . . . . . . . . . . . . . . . . . . . . . . . . . . . . . . . . . . . . . . . . . . . . . . . . . . . . . . . . . .
Occupational Scale Samples, O*NET™ Codes, and Related Job Titles
Year Data Mean Mean Years O*NET RelatedSample/Scale N Collected Age Experience Composition Code(s) Description Occupations

Appendix 77. . . . . . . . . . . . . . . . . . . . . . . . . . . . . . . . . . . . . . . . . . . . . . . . . . . . . . . . . . . . . . . . . . . . . . . . . . . . . . . . . . . . . . . . . . . . . . .
Occupational Scale Samples, O*NET™ Codes, and Related Job Titles
Year Data Mean Mean Years O*NET RelatedSample/Scale N Collected Age Experience Composition Code(s) Description Occupations
Graphic 91 2009 36.9 11.4Designer(Female)
Graphic 206 1979 38.8 15.6Designer(Male)
Health 395 1992 40.9 14.3InformationSpecialist (Female)
Health 247 1992 40.3 12.9InformationSpecialist (Male)
Sample collected from CPP com-mercial and research databases.55% completed bachelor’sdegree, 3% master’s degree.
See women’s sample above.27% had taken art courses notleading to degree, 47% com-pleted bachelor’s degree, 6%master’s degree. 39% werefreelance artists, 23% by studio, 10% by advertisingagency, 15% by combination of employers.
Members of American HealthInformation ManagementAssociation. 8% had high schooldiploma or attended trade/tech-nical school in addition, 45%some college or associatedegree, 37% completed bache-lor’s degree, 9% master’sdegree. 71% were employed byhospitals. Most time was de-voted to areas of clinical coding/classification, computerizedhealth data, quality assuranceand case management, andmedicolegal issues.
See women’s sample above. 1%attended trade/technical schoolin addition, 20% had some col-lege or associate degree, 49%completed bachelor’s degree,26% master’s degree, 2% pro-fessional degree, 2% doctorate.66% were employed by hospi-tals. Most time was devoted toareas of computerized healthdata, clinical coding/classifi-cation, medicolegal issues, and quality assurance/case management.
Design or create graphics to meet specific commercialor promotional needs, suchas packaging, displays, orlogos. May use a variety ofmediums to achieve artisticor decorative effects.
Compile, process, and main-tain medical records of hos-pital and clinic patients in amanner consistent withmedical, administrative, ethi-cal, legal, and regulatoryrequirements of the health-care system. Process, main-tain, compile, and reportpatient information forhealth requirements andstandards.
27-1024.00
29-2071.00
Art Director
Camera Operator,Television, Video,or Motion Picture
Commercial orIndustrial Designer
Director—Stage,Motion Pictures,Television, or Radio
Fashion Designer
Fine Artist, includ-ing Painter, Sculptor,or Illustrator
Makeup Artist,Theatrical orPerformance
Set or ExhibitDesigner
CorrespondenceClerk
Insurance ClaimClerk
Insurance PolicyProcessing Clerk
Office Clerk,General
Payroll orTimekeeping Clerk
PharmacyTechnician
Procurement Clerk

Horticulturist 155 1983 31.5 6.7(Female)
Horticulturist 208 1983 32.9 10.4(Male)
Nationwide sample from catalogof American Association ofNurserymen. 28% had highschool diploma, 12% certificatefrom vocational/technical insti-tution, 12% completed associatedegree, 36% bachelor’s degree,4% master’s degree. Employersincluded retailers and landscap-ers combined (28%); whole-salers only (25%); wholesalers,retailers, and landscapers com-bined (19%); retailers only(11%); wholesalers and retailerscombined (6%); landscapers only(5%); other (5%). 44% were inplace of employment specializ-ing in area of horticulture. Majoractivities included customer ser-vice (35%), care of plants (18%),administrative functions (9%),soil preparation (6%), combina-tion (26%).
See women’s sample above.17% had high school diploma,10% certificate from vocational/technical institution, 9% com-pleted associate degree, 55%bachelor’s degree, 5% master’sdegree. Employers includedwholesalers only (29%); retailersand landscapers combined(22%); landscapers only (12%);wholesalers, retailers, and land-scapers combined (12%); retail-ers only (7%); wholesalers andretailers combined (7%); whole-salers and landscapers com-bined (5%); other (6%). 53%were in place of employmentspecializing in area of horticul-ture. Major activities includedcustomer service (20%), admin-istrative functions (17%), care ofplants (16%), soil preparation(10%), combination (30%).
Conduct research in breed-ing, physiology, production,yield, and management ofcrops and agricultural plants,their growth in soils, andcontrol of pests; or study thechemical, physical, biologi-cal, and mineralogical com-position of soils as theyrelate to plant or cropgrowth. May classify andmap soils and investigateeffects of alternative prac-tices on soil and crop productivity.
19-1013.00 AgriculturalInspector
Animal Scientist
Biochemist orBiophysicist
Biologist
Food ScienceTechnician
Soil or WaterConservationist
Zoologist orWildlife Biologist
78 Strong Interest Inventory® Manual Supplement. . . . . . . . . . . . . . . . . . . . . . . . . . . . . . . . . . . . . . . . . . . . . . . . . . . . . . . . . . . . . . . . . . . . . . . . . . . . . . . . . . . . . . . . . . . . . . .
Occupational Scale Samples, O*NET™ Codes, and Related Job Titles
Year Data Mean Mean Years O*NET RelatedSample/Scale N Collected Age Experience Composition Code(s) Description Occupations
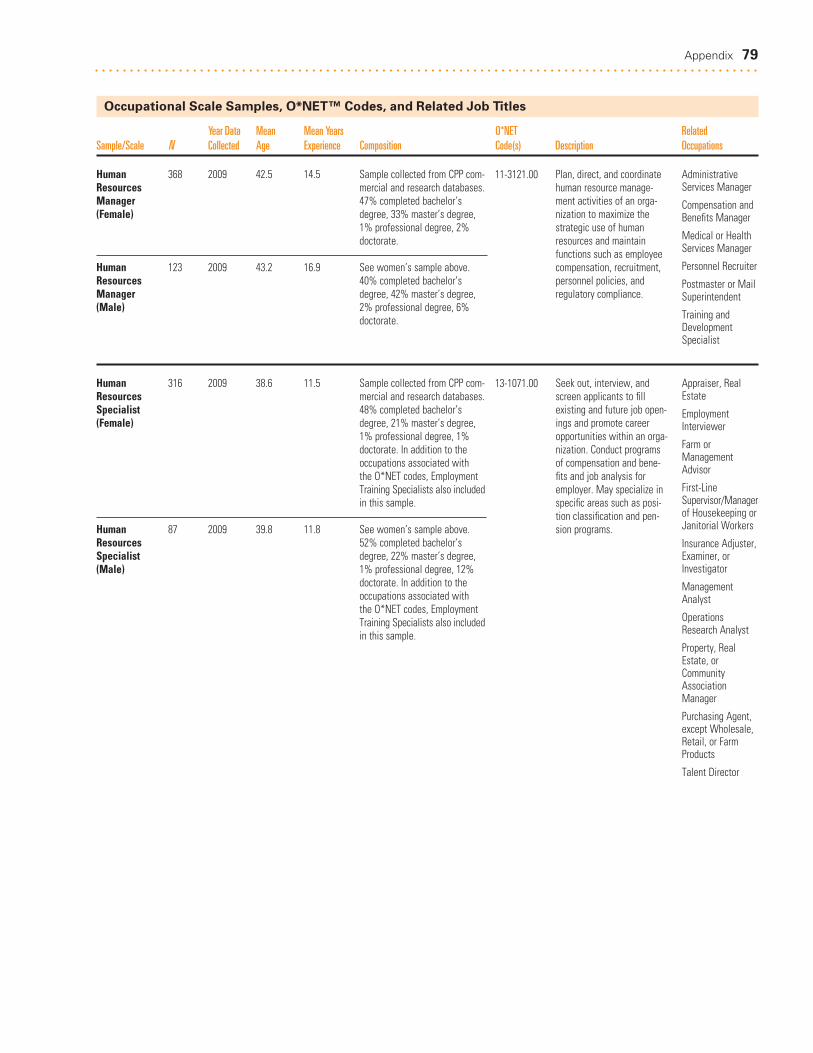
Appendix 79. . . . . . . . . . . . . . . . . . . . . . . . . . . . . . . . . . . . . . . . . . . . . . . . . . . . . . . . . . . . . . . . . . . . . . . . . . . . . . . . . . . . . . . . . . . . . . .
Occupational Scale Samples, O*NET™ Codes, and Related Job Titles
Year Data Mean Mean Years O*NET RelatedSample/Scale N Collected Age Experience Composition Code(s) Description Occupations
Human 368 2009 42.5 14.5ResourcesManager (Female)
Human 123 2009 43.2 16.9ResourcesManager (Male)
Human 316 2009 38.6 11.5ResourcesSpecialist (Female)
Human 87 2009 39.8 11.8ResourcesSpecialist (Male)
Sample collected from CPP com-mercial and research databases.47% completed bachelor’sdegree, 33% master’s degree,1% professional degree, 2%doctorate.
See women’s sample above.40% completed bachelor’sdegree, 42% master’s degree,2% professional degree, 6%doctorate.
Sample collected from CPP com-mercial and research databases.48% completed bachelor’sdegree, 21% master’s degree,1% professional degree, 1%doctorate. In addition to theoccupations associated with the O*NET codes, EmploymentTraining Specialists also includedin this sample.
See women’s sample above.52% completed bachelor’sdegree, 22% master’s degree,1% professional degree, 12%doctorate. In addition to theoccupations associated with the O*NET codes, EmploymentTraining Specialists also includedin this sample.
Plan, direct, and coordinatehuman resource manage-ment activities of an orga-nization to maximize thestrategic use of humanresources and maintain functions such as employeecompensation, recruitment,personnel policies, and regulatory compliance.
Seek out, interview, andscreen applicants to fillexisting and future job open-ings and promote careeropportunities within an orga-nization. Conduct programsof compensation and bene-fits and job analysis foremployer. May specialize inspecific areas such as posi-tion classification and pen-sion programs.
11-3121.00
13-1071.00
AdministrativeServices Manager
Compensation andBenefits Manager
Medical or HealthServices Manager
Personnel Recruiter
Postmaster or MailSuperintendent
Training andDevelopmentSpecialist
Appraiser, RealEstate
EmploymentInterviewer
Farm orManagementAdvisor
First-LineSupervisor/Managerof Housekeeping orJanitorial Workers
Insurance Adjuster,Examiner, orInvestigator
ManagementAnalyst
OperationsResearch Analyst
Property, RealEstate, orCommunityAssociationManager
Purchasing Agent,except Wholesale,Retail, or FarmProducts
Talent Director

Instructional 166 2009 41.1 10.8Coordinator(Female)
Instructional 52 2009 43.0 13.9Coordinator (Male)
Interior 222 1982 40.4 14.9Designer(Female)
Interior 214 1982 41.6 16.5Designer(Male)
Sample collected from CPP com-mercial and research databases.40% completed bachelor’sdegree, 33% master’s degree,1% professional degree, 6%doctorate.
See women’s sample above.35% completed bachelor’sdegree, 42% master’s degree,2% doctorate.
Names supplied by AmericanSociety of Interior Designers.65% completed bachelor’sdegree, 9% master’s degree,13% graduated from profes-sional school of interior design.59% were self-employed or inpartnership, 18% were em-ployed by retail store, 4% byarchitectural firm. 34% special-ized in residential design. Majoractivities included preparation ofpresentations for clients (32%),administrative functions (12%),conferring with clients and con-tractors (5%), combination (45%).
See women’s sample above.58% completed bachelor’sdegree, 11% master’s degree,14% graduated from professionalschool of interior design. 57%were self-employed or in partner-ship, 15% were employed byretail store, 4% by architecturalfirm, 9% worked for more thanone employer. 27% specialized inresidential design, 22% in com-mercial design. Major activitiesincluded preparation of presenta-tions for clients (32%), adminis-trative functions (15%), confer-ring with clients and contractors(6%), combination (36%).
Develop instructional mate-rial, coordinate educationalcontent, and incorporate current technology in spe-cialized fields that provideguidelines to educators andinstructors for developingcurricula and conductingcourses.
Plan, design, and furnishinteriors of residential, com-mercial, or industrial build-ings. Formulate design that is practical, aesthetic,and conducive to intendedpurposes such as raisingproductivity, selling mer-chandise, or improving life-style. May specialize in aparticular field, style, orphase of interior design.
25-9031.00
27-1025.00
EducationAdministrator,Elementary orSecondary School
Health Educator
ManagementAnalyst
Training andDevelopmentManager
Training andDevelopmentSpecialist
VocationalEducationalTeacher,Postsecondary
Art Director
Civil Drafter
Commercial orIndustrial Designer
Costume Attendant
LandscapeArchitect
Set or ExhibitDesigner
Tailor, Dressmaker,or Custom Sewer
80 Strong Interest Inventory® Manual Supplement. . . . . . . . . . . . . . . . . . . . . . . . . . . . . . . . . . . . . . . . . . . . . . . . . . . . . . . . . . . . . . . . . . . . . . . . . . . . . . . . . . . . . . . . . . . . . . .
Occupational Scale Samples, O*NET™ Codes, and Related Job Titles
Year Data Mean Mean Years O*NET RelatedSample/Scale N Collected Age Experience Composition Code(s) Description Occupations

Appendix 81. . . . . . . . . . . . . . . . . . . . . . . . . . . . . . . . . . . . . . . . . . . . . . . . . . . . . . . . . . . . . . . . . . . . . . . . . . . . . . . . . . . . . . . . . . . . . . .
Occupational Scale Samples, O*NET™ Codes, and Related Job Titles
Year Data Mean Mean Years O*NET RelatedSample/Scale N Collected Age Experience Composition Code(s) Description Occupations
Landscape/ 94 1992 39.8 11.3GroundsManager (Female)
Landscape/ 362 1992 40.1 16.7GroundsManager (Male)
Law 116 1993 37.4 11.6EnforcementOfficer (Female)
Law 484 1993 40.7 15.3EnforcementOfficer (Male)
Members of ProfessionalGrounds Management Societyand from commercially compilednational listing of gardeningfirms. 20% had high schooldiploma or attended trade/tech-nical school in addition, 34%some college or associatedegree, 31% completed bache-lor’s degree, 10% master’sdegree, 1% professional degree.
See women’s sample above.13% had high school diploma orattended trade/technical schoolin addition, 35% some college or associate degree, 42% com-pleted bachelor’s degree, 8%master’s degree.
Attendees at meeting of Inter-national Association of WomenPolice, members of UnitedFederation of Police Officers,Texas Police Association, andCal Cops. 8% had high schooldiploma, 47% some college orassociate degree, 29% com-pleted bachelor’s degree, 15%master’s degree.
Members of United Federationof Police Officers, Texas PoliceAssociation, and Cal Cops. 10%had high school diploma, 48%some college or associatedegree, 28% completed bache-lor’s degree, 8% master’sdegree.
Plan, organize, direct, orcoordinate activities ofworkers engaged in land-scaping or groundskeepingactivities, such as plantingand maintaining ornamentaltrees, shrubs, flowers, andlawns, and applying fertiliz-ers, pesticides, and otherchemicals, according to con-tract specifications.
Patrol assigned area toenforce laws and ordinances,regulate traffic, controlcrowds, prevent crime, andarrest violators.
37-1012.00
33-3051.01
First-LineSupervisor/Managerof Agricultural Cropor HorticulturalWorkers
First-LineSupervisor/Managerof AnimalHusbandry orAnimal CareWorkers
First-LineSupervisor/Managerof ConstructionTrades orExtraction Workers
First-LineSupervisor/Managerof Housekeeping orJanitorial Workers
First-LineSupervisor/Managerof Logging Workers
Forest ConservationWorker
GreenhouseWorker
HorticulturalWorker
Lodging Manager
Correctional Officeror Jailer
CriminalInvestigator orSpecial Agent
Fire Inspector
Fish and GameWarden
Forest FireInspector orPreventionSpecialist
Municipal FireFighting orPreventionSupervisor
Private Detective or Investigator
Security Guard
Sheriff or DeputySheriff
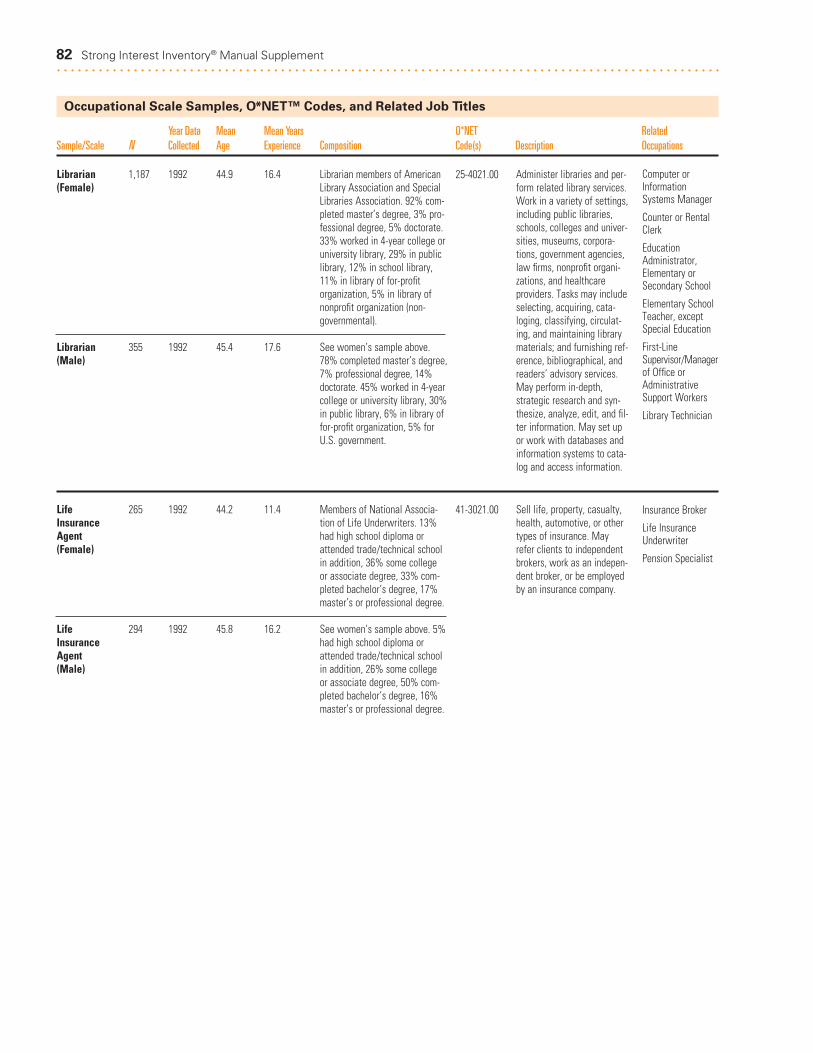
Librarian 1,187 1992 44.9 16.4(Female)
Librarian 355 1992 45.4 17.6(Male)
Life 265 1992 44.2 11.4Insurance Agent(Female)
Life 294 1992 45.8 16.2Insurance Agent(Male)
Librarian members of AmericanLibrary Association and SpecialLibraries Association. 92% com-pleted master’s degree, 3% pro-fessional degree, 5% doctorate.33% worked in 4-year college oruniversity library, 29% in publiclibrary, 12% in school library,11% in library of for-profit organization, 5% in library ofnonprofit organization (non-governmental).
See women’s sample above.78% completed master’s degree,7% professional degree, 14%doctorate. 45% worked in 4-yearcollege or university library, 30%in public library, 6% in library offor-profit organization, 5% forU.S. government.
Members of National Associa-tion of Life Underwriters. 13%had high school diploma orattended trade/technical schoolin addition, 36% some college or associate degree, 33% com-pleted bachelor’s degree, 17%master’s or professional degree.
See women’s sample above. 5%had high school diploma orattended trade/technical schoolin addition, 26% some college or associate degree, 50% com-pleted bachelor’s degree, 16%master’s or professional degree.
Administer libraries and per-form related library services.Work in a variety of settings,including public libraries,schools, colleges and univer-sities, museums, corpora-tions, government agencies,law firms, nonprofit organi-zations, and healthcareproviders. Tasks may includeselecting, acquiring, cata-loging, classifying, circulat-ing, and maintaining librarymaterials; and furnishing ref-erence, bibliographical, andreaders’ advisory services.May perform in-depth,strategic research and syn-thesize, analyze, edit, and fil-ter information. May set upor work with databases andinformation systems to cata-log and access information.
Sell life, property, casualty,health, automotive, or othertypes of insurance. Mayrefer clients to independentbrokers, work as an indepen-dent broker, or be employedby an insurance company.
25-4021.00
41-3021.00
Computer orInformationSystems Manager
Counter or RentalClerk
EducationAdministrator,Elementary orSecondary School
Elementary SchoolTeacher, exceptSpecial Education
First-LineSupervisor/Managerof Office orAdministrativeSupport Workers
Library Technician
Insurance Broker
Life InsuranceUnderwriter
Pension Specialist
82 Strong Interest Inventory® Manual Supplement. . . . . . . . . . . . . . . . . . . . . . . . . . . . . . . . . . . . . . . . . . . . . . . . . . . . . . . . . . . . . . . . . . . . . . . . . . . . . . . . . . . . . . . . . . . . . . .
Occupational Scale Samples, O*NET™ Codes, and Related Job Titles
Year Data Mean Mean Years O*NET RelatedSample/Scale N Collected Age Experience Composition Code(s) Description Occupations

Appendix 83. . . . . . . . . . . . . . . . . . . . . . . . . . . . . . . . . . . . . . . . . . . . . . . . . . . . . . . . . . . . . . . . . . . . . . . . . . . . . . . . . . . . . . . . . . . . . . .
Occupational Scale Samples, O*NET2 Codes, and Related Job Titles
Year Data Mean Mean Years O*NET RelatedSample/Scale N Collected Age Experience Composition Code(s) Description Occupations
Loan Officer/ 93 2009 36.8 10.9Counselor (Female)
Loan Officer/ 71 2009 36.8 10.6Counselor (Male)
Management 131 2009 42.0 14.2Analyst (Female)
Management 89 2009 38.6 12.0Analyst (Male)
Sample collected from CPP com-mercial and research databases.24% completed bachelor’sdegree, 8% master’s degree, 1% professional degree.
See women’s sample above.54% completed bachelor’sdegree, 9% master’s degree, 1% professional degree.
Sample collected from CPP com-mercial and research databases.34% completed bachelor’sdegree, 34% master’s degree,1% professional degree, 1%doctorate.
See women’s sample above.38% completed bachelor’sdegree, 46% master’s degree,2% professional degree, 2%doctorate.
Evaluate, authorize, or rec-ommend approval of com-mercial, real estate, or creditloans. Advise borrowers onfinancial status and methodsof payments. Includes mort-gage loan officers andagents, collection analysts,loan servicing officers, andloan underwriters. Provideguidance to prospective loanapplicants who have prob-lems qualifying for traditionalloans. Guidance may includedetermining the best type ofloan and explaining loanrequirements or restrictions.
Conduct organizational stud-ies and evaluations, designsystems and procedures,conduct work simplificationsand measurement studies,and prepare operations andprocedures manuals toassist management in oper-ating more efficiently andeffectively. Includes programanalysts and managementconsultants.
13-2072.0013-2071.00
13-1111.00
Billing, Costs, orRate Clerk
Brokerage Clerk
Credit Analyst
Financial Analyst
Loan Interviewer orClerk
New AccountsClerk
Personal FinancialAdvisor
Tax Examiner,Collector, orRevenue Agent
Tax Preparer
Teller
AdministrativeServices Manager
First-LineSupervisor/Managerof Office orAdministrativeSupport Workers
Property, RealEstate, orCommunityAssociationManager
PurchasingManager
Training andDevelopmentManager
Training andDevelopmentSpecialist

Marketing 307 2009 38.7 12.2Manager(Female)
Marketing 239 2009 41.1 14.2Manager(Male)
Mathematician 213 1982 41.1 14.9(Female)
Mathematician 270 1982 41.7 16.4(Male)
Sample collected from CPP com-mercial and research databases.52% completed bachelor’sdegree, 32% master’s degree,2% professional degree, 2%doctorate.
See women’s sample above.44% completed bachelor’sdegree, 44% master’s degree,2% professional degree, 1%doctorate.
Names from combined mem-bership list of MathematicalAssociation of America andSociety for Industrial andApplied Mathematics. All com-pleted doctorate. 93% wereemployed by colleges or univer-sities, 3% by business/industry,1% by government. 29% consid-ered themselves theoreticalmathematicians, 22% applied,48% combination. 81% identi-fied primary job function asteacher, 8% researcher, 2% statistician, 2% computer scien-tist. Major activities includedteaching (74%), research (5%),combination (15%).
See women’s sample above. Allcompleted doctorate. 95% wereemployed by colleges or univer-sities, 2% by business/industry,1% by government. 32% consid-ered themselves theoreticalmathematicians, 23% applied,44% combination. 68% identi-fied primary job function asteacher, 14% researcher, 4%computer scientist, 2% statisti-cian. Major activities includedteaching (67%), research (10%),combination (14%).
Determine the demand forproducts and servicesoffered by a firm and itscompetitors and identifypotential customers. Developpricing strategies with thegoal of maximizing the firm'sprofits or share of the mar-ket while ensuring that thefirm's customers are satis-fied. Oversee product devel-opment or monitor trendsthat indicate the need fornew products and services.
Conduct research in funda-mental mathematics or inapplication of mathematicaltechniques to science, man-agement, and other fields.Solve or direct solutions toproblems in various fields bymathematical methods.
11-2021.00
15-2021.00
Advertising orPromotionsManager
Demonstrator orProduct Promoter
Public RelationsSpecialist
Sales Manager
Wholesale orRetail Buyer
Compensation,Benefits, or JobAnalyst Specialist
Cost Estimator
InsuranceUnderwriter
MathematicalTechnician
OperationsResearch Analyst
StatisticalAssistant
Statistician
Traffic Technician
84 Strong Interest Inventory® Manual Supplement. . . . . . . . . . . . . . . . . . . . . . . . . . . . . . . . . . . . . . . . . . . . . . . . . . . . . . . . . . . . . . . . . . . . . . . . . . . . . . . . . . . . . . . . . . . . . . .
Occupational Scale Samples, O*NET™ Codes, and Related Job Titles
Year Data Mean Mean Years O*NET RelatedSample/Scale N Collected Age Experience Composition Code(s) Description Occupations

Appendix 85. . . . . . . . . . . . . . . . . . . . . . . . . . . . . . . . . . . . . . . . . . . . . . . . . . . . . . . . . . . . . . . . . . . . . . . . . . . . . . . . . . . . . . . . . . . . . . .
Occupational Scale Samples, O*NET™ Codes, and Related Job Titles
Year Data Mean Mean Years O*NET RelatedSample/Scale N Collected Age Experience Composition Code(s) Description Occupations
Mathematics 245 1982 37.7 11.9Teacher(Female)
Mathematics 226 1982 39.1 14.0Teacher(Male)
National sample, NationalScience Teachers Association,U.S. Registry. 40% completedbachelor’s degree, 59% master’sdegree. 43% taught mainly alge-bra, 20% geometry, 14% basicmath; other areas includedtrigonometry, calculus, computerscience, and analytical geome-try. All were high school teach-ers; 98% taught more than onegrade. 92% spent minimum of40% of time teaching; otheractivities included lesson prepa-ration, grading, administrativefunctions. 22% also wereinvolved in advising other schoolactivities relating to math, suchas math club.
See women’s sample above.31% completed bachelor’sdegree, 64% master’s degree.42% taught mainly algebra, 19%geometry, 10% basic math, 7%computer science, 4% trigonom-etry, 4% calculus, 10% combina-tion. All were high schoolteachers; 96% taught more thanone grade. 91% spent minimumof 40% of time teaching; otheractivities included lesson prepa-ration, grading, administrativefunctions. 20% also were in-volved in advising other schoolactivities related to math, suchas math club.
Teach courses pertaining tomathematical concepts, sta-tistics, and actuarial scienceand to the application oforiginal and standardizedmathematical techniques insolving specific problemsand situations.
25-1022.00 Compensation,Benefits, or JobAnalyst Specialist
Computer andInformationSystems Manager
ComputerProgrammer
Computer ScienceTeacher,Postsecondary
EducationAdministrator,Elementary andSecondary School
Farm or HomeManagementAdvisor
ManagementAnalyst
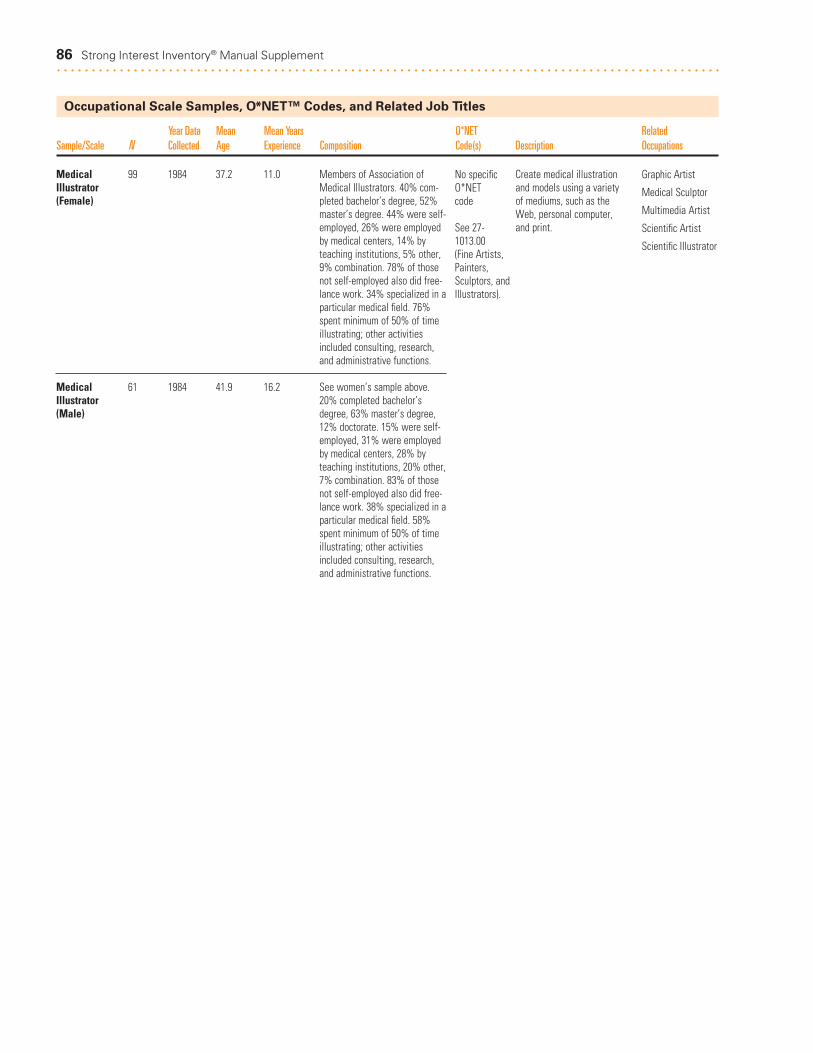
Medical 99 1984 37.2 11.0Illustrator(Female)
Medical 61 1984 41.9 16.2Illustrator(Male)
Members of Association ofMedical Illustrators. 40% com-pleted bachelor’s degree, 52%master’s degree. 44% were self-employed, 26% were employedby medical centers, 14% byteaching institutions, 5% other,9% combination. 78% of thosenot self-employed also did free-lance work. 34% specialized in aparticular medical field. 76%spent minimum of 50% of timeillustrating; other activitiesincluded consulting, research,and administrative functions.
See women’s sample above.20% completed bachelor’sdegree, 63% master’s degree,12% doctorate. 15% were self-employed, 31% were employedby medical centers, 28% byteaching institutions, 20% other,7% combination. 83% of thosenot self-employed also did free-lance work. 38% specialized in aparticular medical field. 58%spent minimum of 50% of timeillustrating; other activitiesincluded consulting, research,and administrative functions.
Create medical illustrationand models using a varietyof mediums, such as theWeb, personal computer,and print.
No specificO*NET code
See 27-1013.00 (Fine Artists,Painters,Sculptors, andIllustrators).
Graphic Artist
Medical Sculptor
Multimedia Artist
Scientific Artist
Scientific Illustrator
86 Strong Interest Inventory® Manual Supplement. . . . . . . . . . . . . . . . . . . . . . . . . . . . . . . . . . . . . . . . . . . . . . . . . . . . . . . . . . . . . . . . . . . . . . . . . . . . . . . . . . . . . . . . . . . . . . .
Occupational Scale Samples, O*NET™ Codes, and Related Job Titles
Year Data Mean Mean Years O*NET RelatedSample/Scale N Collected Age Experience Composition Code(s) Description Occupations

Appendix 87. . . . . . . . . . . . . . . . . . . . . . . . . . . . . . . . . . . . . . . . . . . . . . . . . . . . . . . . . . . . . . . . . . . . . . . . . . . . . . . . . . . . . . . . . . . . . . .
Occupational Scale Samples, O*NET™ Codes, and Related Job Titles
Year Data Mean Mean Years O*NET RelatedSample/Scale N Collected Age Experience Composition Code(s) Description Occupations
Medical 259 1982 43.3 21.2Technician(Female)
Medical 233 1982 44.6 22.1Technician(Male)
Certified members of AmericanAssociation of Medical Techno-logists. 83% had some collegecourses and/or training in med-ical technology, 11% completedbachelor’s degree, 2% master’sdegree. 50% were employed byhospital laboratory, 9% by clinicof 5 physicians or less, 7% byclinic of more than 5, 7% byindependent clinic lab, 6% byhealth agency, 6% by military,14% other. Specialties includedclinical chemistry (8%), hematol-ogy (7%), blood bank (6%), com-bination (38%), no specialty(25%), other (8%). Major activi-ties included conducting labtests (46%), supervisory func-tions (7%), administrative func-tions (7%), specimen preparation(4%), combination (33%).
See women’s sample above.75% had some college coursesand/or training in medical tech-nology, 17% completed bache-lor’s degree, 5% master’sdegree. 54% were employed byhospital laboratory, 13% byindependent clinic lab, 9% bymilitary, 5% by clinic of morethan 5 physicians, 4% by clinicof less than 5, 3% by healthagency, 13% other. Specialtiesincluded clinical chemistry (7%),cystology (5%), hematology(5%), combination (38%), nospecialty (21%), other (15%).Major activities included con-ducting lab tests (30%), supervi-sory functions (16%), adminis-tration (18%), combination(30%).
Perform routine medical lab-oratory tests for the diagno-sis, treatment, and preven-tion of disease. May workunder the supervision of amedical technologist.
29-2012.00 Anesthesiologist
Coroner
Dentist, General
Medical or ClinicalLaboratoryTechnologist
Nuclear MedicineTechnologist
Optometrist
Oral or MaxillofacialSurgeon
Pharmacist

88 Strong Interest Inventory® Manual Supplement. . . . . . . . . . . . . . . . . . . . . . . . . . . . . . . . . . . . . . . . . . . . . . . . . . . . . . . . . . . . . . . . . . . . . . . . . . . . . . . . . . . . . . . . . . . . . . .
Occupational Scale Samples, O*NET™ Codes, and Related Job Titles
Year Data Mean Mean Years O*NET RelatedSample/Scale N Collected Age Experience Composition Code(s) Description Occupations
Medical 266 1984 37.9 13.7Technologist(Female)
Medical 206 1984 37.0 12.4Technologist(Male)
Members of American Societyfor Medical Technology. 88%completed bachelor’s degree,12% master’s degree. 68% wereemployed by hospital laboratory,9% by independent clinic lab,5% by clinic, 3% by government,2% by research institution, 2%by physicians, 10% other, 2%combination. Specializationsincluded clinical chemistry(18%), hematology (17%), bloodbank (10%), microbiology (9%),other (7%), combination (25%),no specialization (13%). Majoractivities included conductinglab tests (44%), administrativefunctions (11%), supervising labworkers (8%), analyzing results(2%), combination (31%).
See women’s sample above.93% completed bachelor’sdegree, 7% master’s degree.68% were employed by hospitallaboratory, 8% by independentclinic lab, 4% by clinic, 8%other, 5% combination. Special-izations included clinical chem-istry (18%), hematology (8%),microbiology (6%), blood bank(3%), other (15%), combination(20%), no specialty (28%). Majoractivities included conductinglab tests (41%), administrativefunctions (22%), supervising labworkers (10%), analyzing results(2%), combination (24%).
Perform complex medicallaboratory tests for diagno-sis, treatment, and preven-tion of disease. May train orsupervise staff.
29-2011.00 Anesthesiologist
BiologicalTechnician
Biologist
Coroner
Medical or ClinicalLaboratoryTechnician
Microbiologist
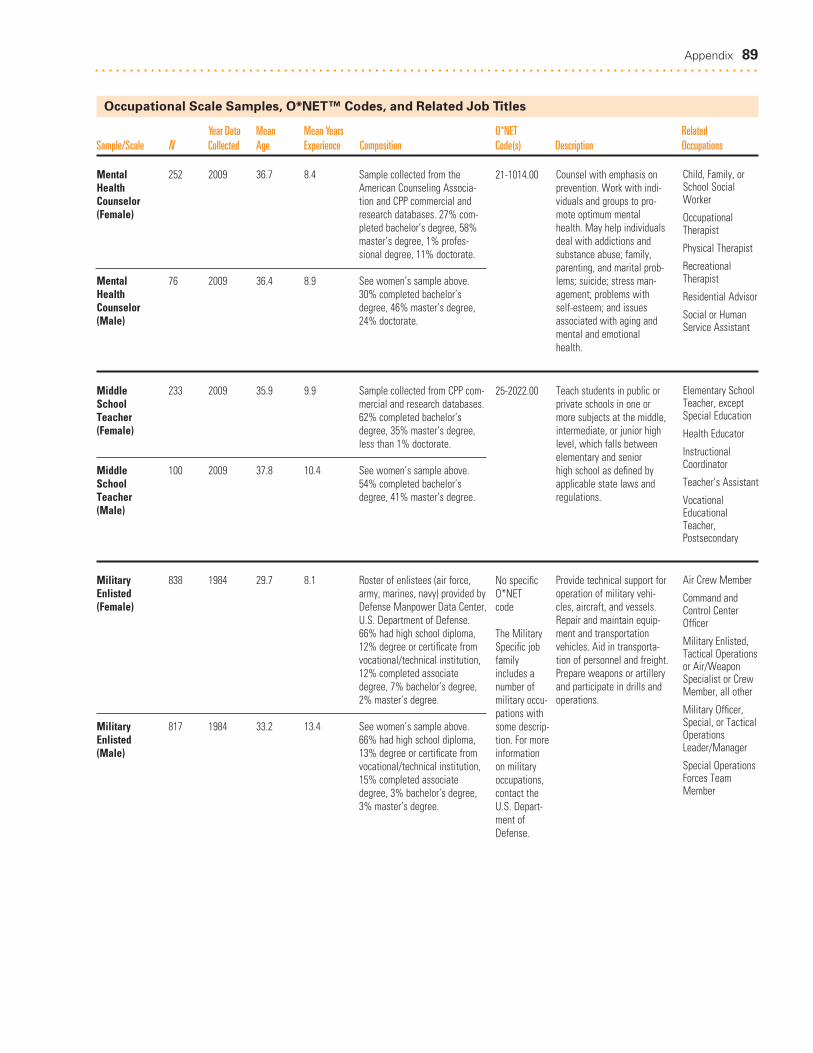
Appendix 89. . . . . . . . . . . . . . . . . . . . . . . . . . . . . . . . . . . . . . . . . . . . . . . . . . . . . . . . . . . . . . . . . . . . . . . . . . . . . . . . . . . . . . . . . . . . . . .
Occupational Scale Samples, O*NET™ Codes, and Related Job Titles
Year Data Mean Mean Years O*NET RelatedSample/Scale N Collected Age Experience Composition Code(s) Description Occupations
Mental 252 2009 36.7 8.4HealthCounselor(Female)
Mental 76 2009 36.4 8.9HealthCounselor(Male)
Middle 233 2009 35.9 9.9SchoolTeacher(Female)
Middle 100 2009 37.8 10.4SchoolTeacher(Male)
Military 838 1984 29.7 8.1Enlisted(Female)
Military 817 1984 33.2 13.4Enlisted(Male)
Sample collected from theAmerican Counseling Associa-tion and CPP commercial andresearch databases. 27% com-pleted bachelor’s degree, 58%master’s degree, 1% profes-sional degree, 11% doctorate.
See women’s sample above.30% completed bachelor’sdegree, 46% master’s degree,24% doctorate.
Sample collected from CPP com-mercial and research databases.62% completed bachelor’sdegree, 35% master’s degree,less than 1% doctorate.
See women’s sample above.54% completed bachelor’sdegree, 41% master’s degree.
Roster of enlistees (air force,army, marines, navy) provided byDefense Manpower Data Center,U.S. Department of Defense.66% had high school diploma,12% degree or certificate fromvocational/technical institution,12% completed associatedegree, 7% bachelor’s degree,2% master’s degree.
See women’s sample above.66% had high school diploma,13% degree or certificate fromvocational/technical institution,15% completed associatedegree, 3% bachelor’s degree,3% master’s degree.
Counsel with emphasis onprevention. Work with indi-viduals and groups to pro-mote optimum mentalhealth. May help individualsdeal with addictions andsubstance abuse; family,parenting, and marital prob-lems; suicide; stress man-agement; problems withself-esteem; and issuesassociated with aging andmental and emotionalhealth.
Teach students in public orprivate schools in one ormore subjects at the middle,intermediate, or junior highlevel, which falls betweenelementary and senior high school as defined byapplicable state laws andregulations.
Provide technical support foroperation of military vehi-cles, aircraft, and vessels.Repair and maintain equip-ment and transportationvehicles. Aid in transporta-tion of personnel and freight.Prepare weapons or artilleryand participate in drills andoperations.
21-1014.00
25-2022.00
No specificO*NET code
The MilitarySpecific jobfamily includes anumber ofmilitary occu-pations withsome descrip-tion. For moreinformationon militaryoccupations,contact theU.S. Depart-ment ofDefense.
Child, Family, orSchool SocialWorker
OccupationalTherapist
Physical Therapist
RecreationalTherapist
Residential Advisor
Social or HumanService Assistant
Elementary SchoolTeacher, exceptSpecial Education
Health Educator
InstructionalCoordinator
Teacher’s Assistant
VocationalEducationalTeacher,Postsecondary
Air Crew Member
Command andControl CenterOfficer
Military Enlisted,Tactical Operationsor Air/WeaponSpecialist or CrewMember, all other
Military Officer,Special, or TacticalOperationsLeader/Manager
Special OperationsForces TeamMember
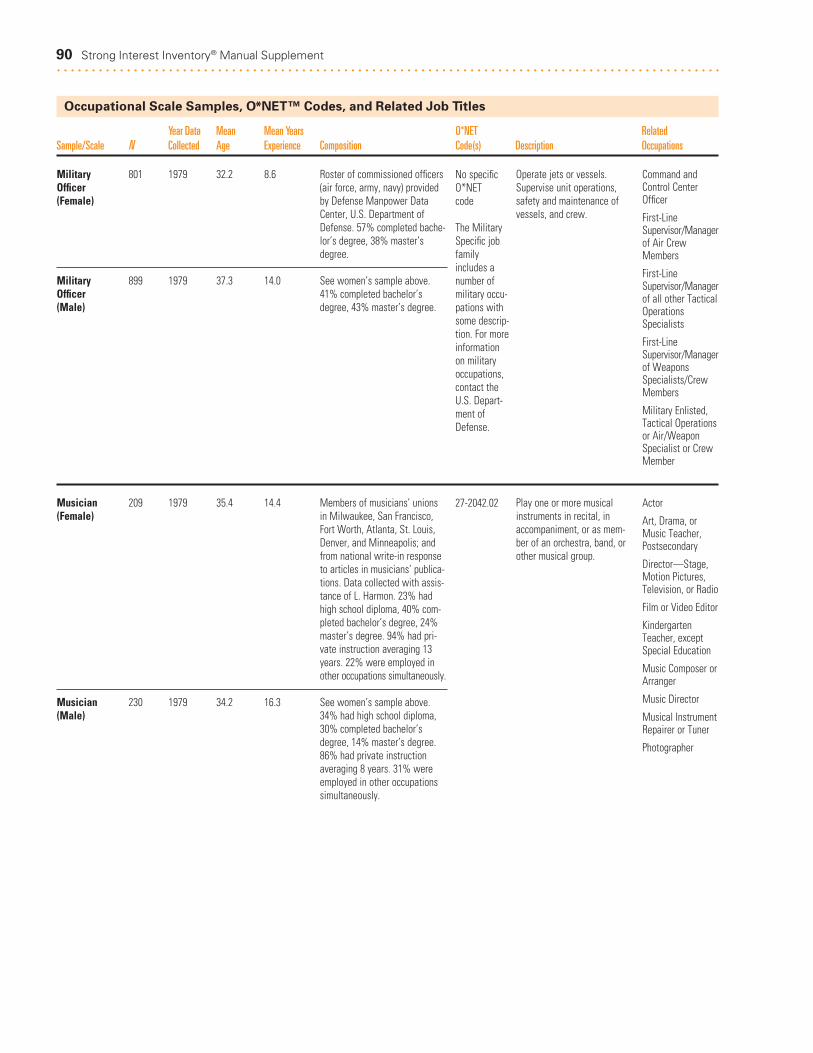
90 Strong Interest Inventory® Manual Supplement. . . . . . . . . . . . . . . . . . . . . . . . . . . . . . . . . . . . . . . . . . . . . . . . . . . . . . . . . . . . . . . . . . . . . . . . . . . . . . . . . . . . . . . . . . . . . . .
Occupational Scale Samples, O*NET™ Codes, and Related Job Titles
Year Data Mean Mean Years O*NET RelatedSample/Scale N Collected Age Experience Composition Code(s) Description Occupations
Military 801 1979 32.2 8.6Officer(Female)
Military 899 1979 37.3 14.0Officer(Male)
Musician 209 1979 35.4 14.4(Female)
Musician 230 1979 34.2 16.3(Male)
Roster of commissioned officers(air force, army, navy) providedby Defense Manpower DataCenter, U.S. Department ofDefense. 57% completed bache-lor’s degree, 38% master’sdegree.
See women’s sample above.41% completed bachelor’sdegree, 43% master’s degree.
Members of musicians’ unionsin Milwaukee, San Francisco,Fort Worth, Atlanta, St. Louis,Denver, and Minneapolis; andfrom national write-in responseto articles in musicians’ publica-tions. Data collected with assis-tance of L. Harmon. 23% hadhigh school diploma, 40% com-pleted bachelor’s degree, 24%master’s degree. 94% had pri-vate instruction averaging 13years. 22% were employed inother occupations simultaneously.
See women’s sample above.34% had high school diploma,30% completed bachelor’sdegree, 14% master’s degree.86% had private instructionaveraging 8 years. 31% wereemployed in other occupationssimultaneously.
Operate jets or vessels.Supervise unit operations,safety and maintenance ofvessels, and crew.
Play one or more musicalinstruments in recital, inaccompaniment, or as mem-ber of an orchestra, band, orother musical group.
No specificO*NET code
The MilitarySpecific jobfamily includes anumber ofmilitary occu-pations withsome descrip-tion. For moreinformationon militaryoccupations,contact theU.S. Depart-ment ofDefense.
27-2042.02
Command andControl CenterOfficer
First-LineSupervisor/Managerof Air CrewMembers
First-LineSupervisor/Managerof all other TacticalOperationsSpecialists
First-LineSupervisor/Managerof WeaponsSpecialists/CrewMembers
Military Enlisted,Tactical Operationsor Air/WeaponSpecialist or CrewMember
Actor
Art, Drama, orMusic Teacher,Postsecondary
Director—Stage,Motion Pictures,Television, or Radio
Film or Video Editor
KindergartenTeacher, exceptSpecial Education
Music Composer orArranger
Music Director
Musical InstrumentRepairer or Tuner
Photographer
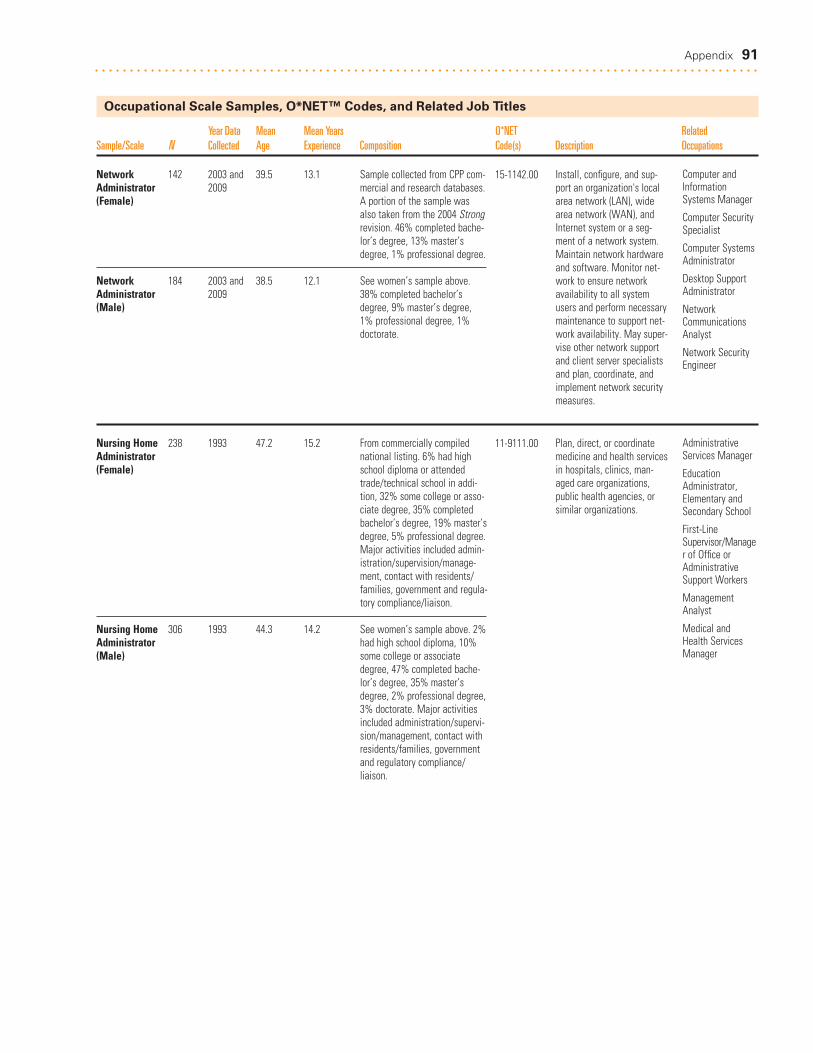
Appendix 91. . . . . . . . . . . . . . . . . . . . . . . . . . . . . . . . . . . . . . . . . . . . . . . . . . . . . . . . . . . . . . . . . . . . . . . . . . . . . . . . . . . . . . . . . . . . . . .
Occupational Scale Samples, O*NET™ Codes, and Related Job Titles
Year Data Mean Mean Years O*NET RelatedSample/Scale N Collected Age Experience Composition Code(s) Description Occupations
Network 142 2003 and 39.5 13.1Administrator 2009(Female)
Network 184 2003 and 38.5 12.1Administrator 2009(Male)
Nursing Home 238 1993 47.2 15.2Administrator(Female)
Nursing Home 306 1993 44.3 14.2Administrator(Male)
Sample collected from CPP com-mercial and research databases.A portion of the sample wasalso taken from the 2004 Strongrevision. 46% completed bache-lor’s degree, 13% master’sdegree, 1% professional degree.
See women’s sample above.38% completed bachelor’sdegree, 9% master’s degree, 1% professional degree, 1%doctorate.
From commercially compilednational listing. 6% had highschool diploma or attendedtrade/technical school in addi-tion, 32% some college or asso-ciate degree, 35% completedbachelor’s degree, 19% master’sdegree, 5% professional degree.Major activities included admin-istration/supervision/manage-ment, contact with residents/families, government and regula-tory compliance/liaison.
See women’s sample above. 2%had high school diploma, 10%some college or associatedegree, 47% completed bache-lor’s degree, 35% master’sdegree, 2% professional degree,3% doctorate. Major activitiesincluded administration/supervi-sion/management, contact withresidents/families, governmentand regulatory compliance/liaison.
Install, configure, and sup-port an organization's localarea network (LAN), widearea network (WAN), andInternet system or a seg-ment of a network system.Maintain network hardwareand software. Monitor net-work to ensure networkavailability to all systemusers and perform necessarymaintenance to support net-work availability. May super-vise other network supportand client server specialistsand plan, coordinate, andimplement network securitymeasures.
Plan, direct, or coordinatemedicine and health servicesin hospitals, clinics, man-aged care organizations,public health agencies, orsimilar organizations.
15-1142.00
11-9111.00
Computer andInformationSystems Manager
Computer SecuritySpecialist
Computer SystemsAdministrator
Desktop SupportAdministrator
NetworkCommunicationsAnalyst
Network SecurityEngineer
AdministrativeServices Manager
EducationAdministrator,Elementary andSecondary School
First-LineSupervisor/Manager of Office orAdministrativeSupport Workers
ManagementAnalyst
Medical andHealth ServicesManager

92 Strong Interest Inventory® Manual Supplement. . . . . . . . . . . . . . . . . . . . . . . . . . . . . . . . . . . . . . . . . . . . . . . . . . . . . . . . . . . . . . . . . . . . . . . . . . . . . . . . . . . . . . . . . . . . . . .
Occupational Scale Samples, O*NET™ Codes, and Related Job Titles
Year Data Mean Mean Years O*NET RelatedSample/Scale N Collected Age Experience Composition Code(s) Description Occupations
Occupational 328 1992 39.5 13.8Therapist (Female)
Occupational 388 1992 40.4 14.1Therapist (Male)
Operations 468 2009 42.4 15.0Manager (Female)
Operations 666 2009 42.7 16.6Manager (Male)
Members of OccupationalTherapy Association. 66% com-pleted bachelor’s degree, 31%master’s or professional degree,1% doctorate. 45% wereemployed by hospitals and clin-ics, 20% by educational institu-tions, 16% were self-employedor in private practice, 9% wereemployed by nursing homes.
See women’s sample above.53% completed bachelor’sdegree, 42% master’s or profes-sional degree, 4% doctorate.46% were employed by hospi-tals and clinics, 17% by educa-tional institutions, 17% wereself-employed or in private practice, 6% were employed by nursing homes.
Sample collected from CPP com-mercial and research databases.40% completed bachelor’sdegree, 25% master’s degree,1% professional degree, 1%doctorate.
See women’s sample above.41% completed bachelor’sdegree, 36% master’s degree,2% professional degree, 2%doctorate.
Assess, plan, organize, andparticipate in rehabilitativeprograms that help restorevocational, homemaking, anddaily living skills, as well asgeneral independence, todisabled persons.
Plan, direct, or coordinatethe operations of companiesor public and private sectororganizations. Duties andresponsibilities include for-mulating policies, managingdaily operations, and plan-ning the use of materialsand human resources but aretoo diverse and general innature to be classified in anyone functional area of man-agement or administration,such as personnel, purchas-ing, or administrative ser-vices. Includes owners andmanagers who head smallbusiness establishmentswhose duties are primarilymanagerial.
29-1122.00
11-1021.00
Director, ReligiousActivities orEducation
Physical Therapist
RecreationalTherapist
Social or HumanService Assistant
Branch OperationsManager
Chief ExecutiveOfficer
General Manager
TechnicalOperationsManager

Appendix 93. . . . . . . . . . . . . . . . . . . . . . . . . . . . . . . . . . . . . . . . . . . . . . . . . . . . . . . . . . . . . . . . . . . . . . . . . . . . . . . . . . . . . . . . . . . . . . .
Occupational Scale Samples, O*NET™ Codes, and Related Job Titles
Year Data Mean Mean Years O*NET RelatedSample/Scale N Collected Age Experience Composition Code(s) Description Occupations
Optician 258 1982 36.0 9.9(Female)
Optician 213 1981 37.8 15.2(Male)
Members of Opticians Associa-tion of America. 25% had highschool diploma, 9% attendedvocational/technical school,43% had some college, 12%completed associate degree, 8%bachelor’s degree, 2% master’sdegree. 55% learned dispensingskills on job, 8% in school, 4%as apprentices, 33% combina-tion. Employers included retailoptical stores (44%), self-ownedoptical stores (36%), ophthal-mologists (10%), departmentstores (7%). Major activitiesincluded combination of deter-mining style and size of lens,adjusting glasses, and writingwork orders. No one who spentmore than 25% of time attend-ing to administrative details wasincluded in sample.
See women’s sample above.19% had high school diploma,7% attended vocational/techni-cal school, 43% had some col-lege, 13% completed associatedegree, 15% bachelor’s degree,1% master’s degree. 52%learned dispensing skills on job,10% in school, 4% as appren-tices, 2% in military, 31% com-bination. Employers includedretail optical stores (38%), self-owned optical stores (35%),ophthalmologists (16%), hospi-tals (2%), department stores(2%). Major activities includedcombination of determining styleand size of lens, fitting andadjusting lens, and analyzingprescriptions. No one who spentmore than 25% of time attend-ing to administrative details wasincluded in sample.
Design, measure, fit, andadapt lenses and frames forclient according to writtenoptical prescription or speci-fication. Assist client withselecting frames. Measurecustomer for size of eye-glasses and coordinateframes with facial and eyemeasurements and opticalprescription. Prepare workorder for optical laboratorycontaining instructions forgrinding and mounting lenses in frames. Verifyexactness of finished lensspectacles. Adjust frame andlens position to fit client.May shape or reshapeframes.
29-2081.00 Counter or RentalClerk
Customer ServiceRepresentative
EligibilityInterviewer,GovernmentPrograms
Host/Hostess,Restaurant, Lounge,or Coffee Shop
Hotel, Motel, orResort Desk Clerk
Insurance SalesAgent
Interviewer, exceptEligibility or Loan
New Account Clerk
OphthalmicLaboratoryTechnician

94 Strong Interest Inventory® Manual Supplement. . . . . . . . . . . . . . . . . . . . . . . . . . . . . . . . . . . . . . . . . . . . . . . . . . . . . . . . . . . . . . . . . . . . . . . . . . . . . . . . . . . . . . . . . . . . . . .
Occupational Scale Samples, O*NET™ Codes, and Related Job Titles
Year Data Mean Mean Years O*NET RelatedSample/Scale N Collected Age Experience Composition Code(s) Description Occupations
Optometrist 191 1979 38.0 11.8(Female)
Optometrist 220 1979 39.7 14.2(Male)
Paralegal 488 1993 37.7 9.9(Female)
Paralegal 120 1993 38.2 8.2(Male)
Members of AmericanOptometric Association. 60%were self-employed or in part-nership, 11% were employed byclinics or hospitals, 13% combi-nation. 75% reported privatepractice as major activity.
See women’s sample above.83% were self-employed or inpartnership. 93% reported pri-vate practice as major activity.
Members of National Federationof Paralegal Associations. 5%had high school diploma or attended trade/technical schoolin addition, 39% some college orassociate degree, 48% completedbachelor’s degree, 6% master’sdegree. 73% were employed inprivate law firm, 19% in corpo-rate law department, 3% in gov-ernment agency, 4% other.
See women’s sample above. 2%attended trade/technical school,34% had some college or asso-ciate degree, 48% completedbachelor’s degree, 13% master’sdegree, 2% professional degree.62% were employed in privatelaw firm, 11% in corporate lawdepartment, 6% in court system,4% in government agency, 17%other.
Diagnose, manage, and treatconditions and diseases ofthe human eye and visualsystem. Examine eyes andvisual system, diagnoseproblems or impairments,prescribe corrective lenses,and provide treatment. May prescribe therapeuticdrugs to treat specific eyeconditions.
Assist lawyers by research-ing legal precedent, investi-gating facts, or preparinglegal documents. Conductresearch to support a legalproceeding, to formulate adefense, or to initiate legalaction.
29-1041.00
23-2011.00
Dental Assistant
OphthalmicLaboratoryTechnician
Orthodontist
Physician Assistant
Prosthodontist
Respiratory Therapist
Court Clerk
Law Clerk
Lawyer
Legal Secretary
Loan Interviewer or Clerk
Municipal Clerk
Tax Preparer
Title Examiner,Abstractor, orSearcher
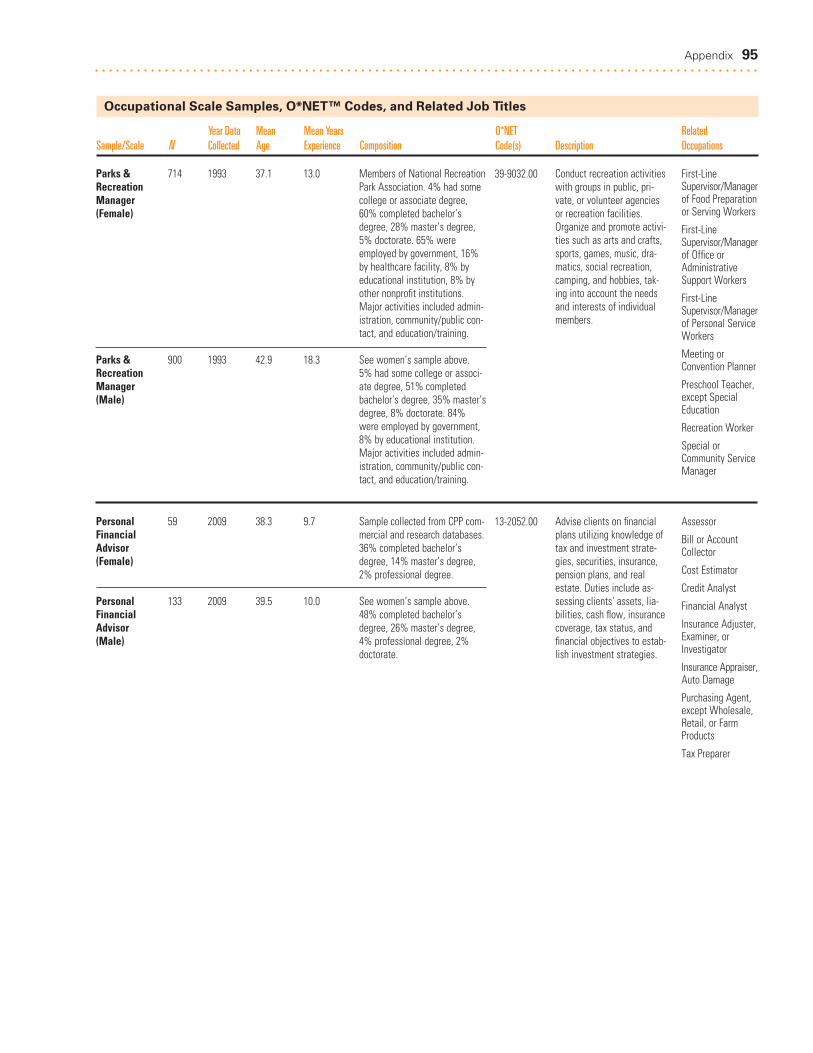
Appendix 95. . . . . . . . . . . . . . . . . . . . . . . . . . . . . . . . . . . . . . . . . . . . . . . . . . . . . . . . . . . . . . . . . . . . . . . . . . . . . . . . . . . . . . . . . . . . . . .
Occupational Scale Samples, O*NET™ Codes, and Related Job Titles
Year Data Mean Mean Years O*NET RelatedSample/Scale N Collected Age Experience Composition Code(s) Description Occupations
Parks & 714 1993 37.1 13.0RecreationManager (Female)
Parks & 900 1993 42.9 18.3RecreationManager (Male)
Personal 59 2009 38.3 9.7FinancialAdvisor(Female)
Personal 133 2009 39.5 10.0FinancialAdvisor(Male)
Members of National RecreationPark Association. 4% had somecollege or associate degree,60% completed bachelor’sdegree, 28% master’s degree,5% doctorate. 65% wereemployed by government, 16%by healthcare facility, 8% byeducational institution, 8% byother nonprofit institutions.Major activities included admin-istration, community/public con-tact, and education/training.
See women’s sample above. 5% had some college or associ-ate degree, 51% completedbachelor’s degree, 35% master’sdegree, 8% doctorate. 84%were employed by government,8% by educational institution.Major activities included admin-istration, community/public con-tact, and education/training.
Sample collected from CPP com-mercial and research databases.36% completed bachelor’sdegree, 14% master’s degree,2% professional degree.
See women’s sample above.48% completed bachelor’sdegree, 26% master’s degree,4% professional degree, 2%doctorate.
Conduct recreation activitieswith groups in public, pri-vate, or volunteer agenciesor recreation facilities.Organize and promote activi-ties such as arts and crafts,sports, games, music, dra-matics, social recreation,camping, and hobbies, tak-ing into account the needsand interests of individualmembers.
Advise clients on financialplans utilizing knowledge oftax and investment strate-gies, securities, insurance,pension plans, and realestate. Duties include as-sessing clients' assets, lia-bilities, cash flow, insurancecoverage, tax status, andfinancial objectives to estab-lish investment strategies.
39-9032.00
13-2052.00
First-LineSupervisor/Managerof Food Preparationor Serving Workers
First-LineSupervisor/Managerof Office orAdministrativeSupport Workers
First-LineSupervisor/Managerof Personal ServiceWorkers
Meeting orConvention Planner
Preschool Teacher,except SpecialEducation
Recreation Worker
Special orCommunity ServiceManager
Assessor
Bill or AccountCollector
Cost Estimator
Credit Analyst
Financial Analyst
Insurance Adjuster,Examiner, orInvestigator
Insurance Appraiser,Auto Damage
Purchasing Agent,except Wholesale,Retail, or FarmProducts
Tax Preparer
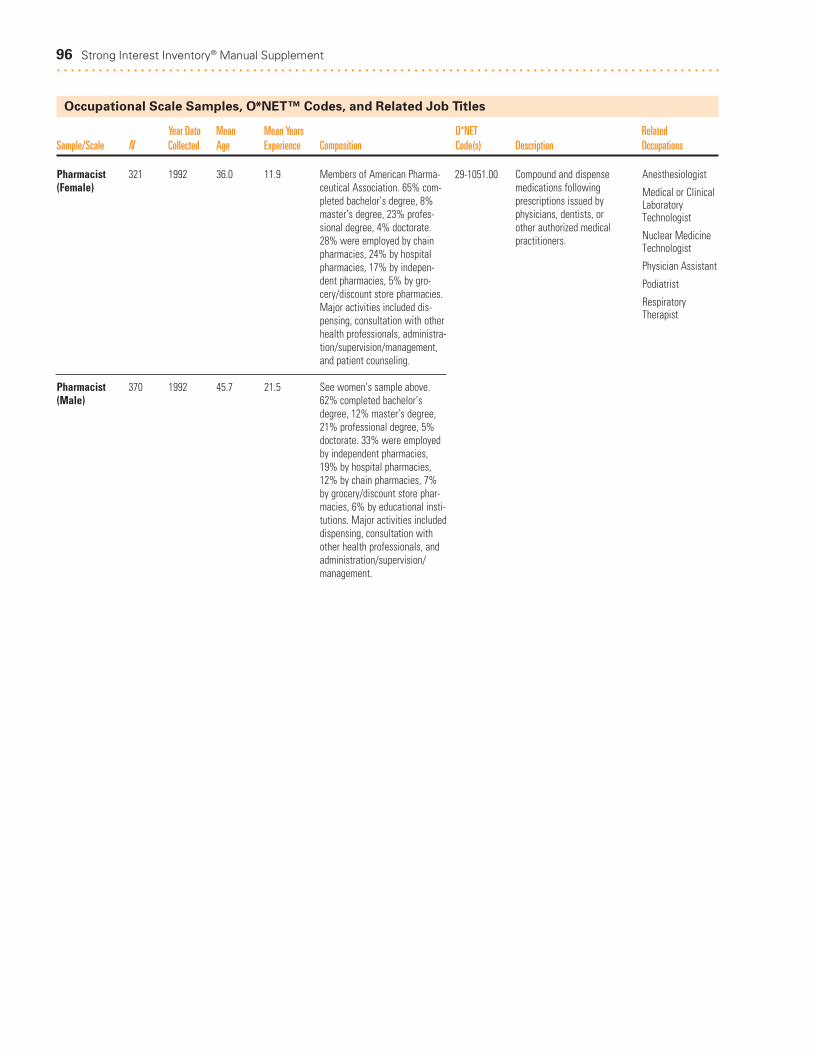
96 Strong Interest Inventory® Manual Supplement. . . . . . . . . . . . . . . . . . . . . . . . . . . . . . . . . . . . . . . . . . . . . . . . . . . . . . . . . . . . . . . . . . . . . . . . . . . . . . . . . . . . . . . . . . . . . . .
Occupational Scale Samples, O*NET™ Codes, and Related Job Titles
Year Data Mean Mean Years O*NET RelatedSample/Scale N Collected Age Experience Composition Code(s) Description Occupations
Pharmacist 321 1992 36.0 11.9(Female)
Pharmacist 370 1992 45.7 21.5(Male)
Members of American Pharma-ceutical Association. 65% com-pleted bachelor’s degree, 8%master’s degree, 23% profes-sional degree, 4% doctorate.28% were employed by chainpharmacies, 24% by hospitalpharmacies, 17% by indepen-dent pharmacies, 5% by gro-cery/discount store pharmacies.Major activities included dis-pensing, consultation with otherhealth professionals, administra-tion/supervision/management,and patient counseling.
See women’s sample above.62% completed bachelor’sdegree, 12% master’s degree,21% professional degree, 5%doctorate. 33% were employedby independent pharmacies,19% by hospital pharmacies,12% by chain pharmacies, 7%by grocery/discount store phar-macies, 6% by educational insti-tutions. Major activities includeddispensing, consultation withother health professionals, andadministration/supervision/management.
Compound and dispensemedications following prescriptions issued byphysicians, dentists, or other authorized medicalpractitioners.
29-1051.00 Anesthesiologist
Medical or ClinicalLaboratoryTechnologist
Nuclear MedicineTechnologist
Physician Assistant
Podiatrist
Respiratory Therapist

Appendix 97. . . . . . . . . . . . . . . . . . . . . . . . . . . . . . . . . . . . . . . . . . . . . . . . . . . . . . . . . . . . . . . . . . . . . . . . . . . . . . . . . . . . . . . . . . . . . . .
Occupational Scale Samples, O*NET™ Codes, and Related Job Titles
Year Data Mean Mean Years O*NET RelatedSample/Scale N Collected Age Experience Composition Code(s) Description Occupations
Photographer 249 1978 36.9 10.9(Female)
Photographer 161 1978 38.9 15.1(Male)
Physical 715 1992 36.5 12.8Therapist (Female)
Physical 543 1992 40.1 15.3Therapist (Male)
Members of ProfessionalPhotographers of America,National Press PhotographersAssociation, and Society ofPhotographers in Communi-cation. 21% had high schooldiploma, 38% completed bache-lor’s degree, 13% master’sdegree. 35% received trainingon job, 23% from photographycourses not leading to degree,14% from degree courses, 28%combination. 51% were self-employed or in partnerships;remainder were employed bystudios, businesses, newspa-pers, magazines, or combination.
See women’s sample above.24% had high school diploma,10% completed associatedegree, 31% bachelor’s degree.44% received training on job,15% from photography coursesnot leading to degree, 20% fromdegree courses, 22% from com-bination. 56% were self-employedor in partnerships; 14% wereemployed by newspapers ormagazines, remainder wereemployed by studios, businesses,or combination.
Members of American PhysicalTherapy Association. 63% com-pleted bachelor’s degree, 32%master’s or professional degree,3% doctorate. 36% worked inhospitals, 23% in private offices,14% in educational institutions,10% in home health agencies,8% in extended care facilities ornursing homes.
See women’s sample above.61% completed bachelor’sdegree, 35% master’s or profes-sional degree, 3% doctorate.45% worked in private offices,28% in hospitals, 7% in extendedcare facilities or nursing homes,6% in home health agencies,6% in educational institutions.
Photograph persons, sub-jects, merchandise, or othercommercial products. Maydevelop negatives and pro-duce finished prints.
Assess, plan, organize, andparticipate in rehabilitativeprograms that improvemobility, relieve pain,increase strength, anddecrease or prevent deform-ity of patients suffering fromdisease or injury.
27-4021.00
29-1123.00
Camera Operator,Television, Video,or Motion Picture
Film or Video Editor
PhotographicProcess Worker
Set or ExhibitDesigner
Sound EngineeringTechnician
Athletic Trainer
Child, Family, orSchool SocialWorker
RespiratoryTherapist

98 Strong Interest Inventory® Manual Supplement. . . . . . . . . . . . . . . . . . . . . . . . . . . . . . . . . . . . . . . . . . . . . . . . . . . . . . . . . . . . . . . . . . . . . . . . . . . . . . . . . . . . . . . . . . . . . . .
Occupational Scale Samples, O*NET™ Codes, and Related Job Titles
Year Data Mean Mean Years O*NET RelatedSample/Scale N Collected Age Experience Composition Code(s) Description Occupations
Physician 211 1982 38.8 9.4(Female)
Physician 272 1982 40.9 10.8(Male)
National sample from mail listcompany, and members ofAmerican College of Physicians.26% practiced medicine in smallprivate clinics (less than 5 physi-cians), 14% in public hospitals,11% in private hospitals, 8% inHMO clinics, 6% for govern-ment, 3% in large private clinics(more than 5 physicians), 19%other, 10% combination.Specialties included general/family practitioner, internist,pediatrician, anesthesiologist,gynecologist/obstetrician, neu-rologist, pathologist, radiologist,dermatologist, allergist, medicalresearcher, and college profes-sor. Major activities includedpatient consultation and exami-nation (33%), diagnosis andtreatment (13%), research (8%),surgery (2%), other (7%), combi-nation (31%).
See women’s sample above.33% practiced medicine in smallprivate clinics (less than 5 physi-cians), 13% in private hospitals,12% in large private clinics(more than 5 physicians), 10% in public hospitals, 8% other,12% combination. Specialtiesincluded general/family practi-tioner, cardiologist, internist,pediatrician, urologist, patholo-gist, radiologist, otolaryngolo-gist, anesthesiologist, gyne-cologist/obstetrician, derma-tologist, surgeon, medicalresearcher, and college profes-sor. Major activities includedpatient consultation and exami-nation (32%), diagnosis andtreatment (19%), research (9%),surgery (5%), combination(26%).
Diagnose, treat, and helpprevent diseases andinjuries that commonly occurin the general population.
29-1062.00 Physician Assistant
Podiatrist
Registered Nurse
Surgeon
Veterinarian
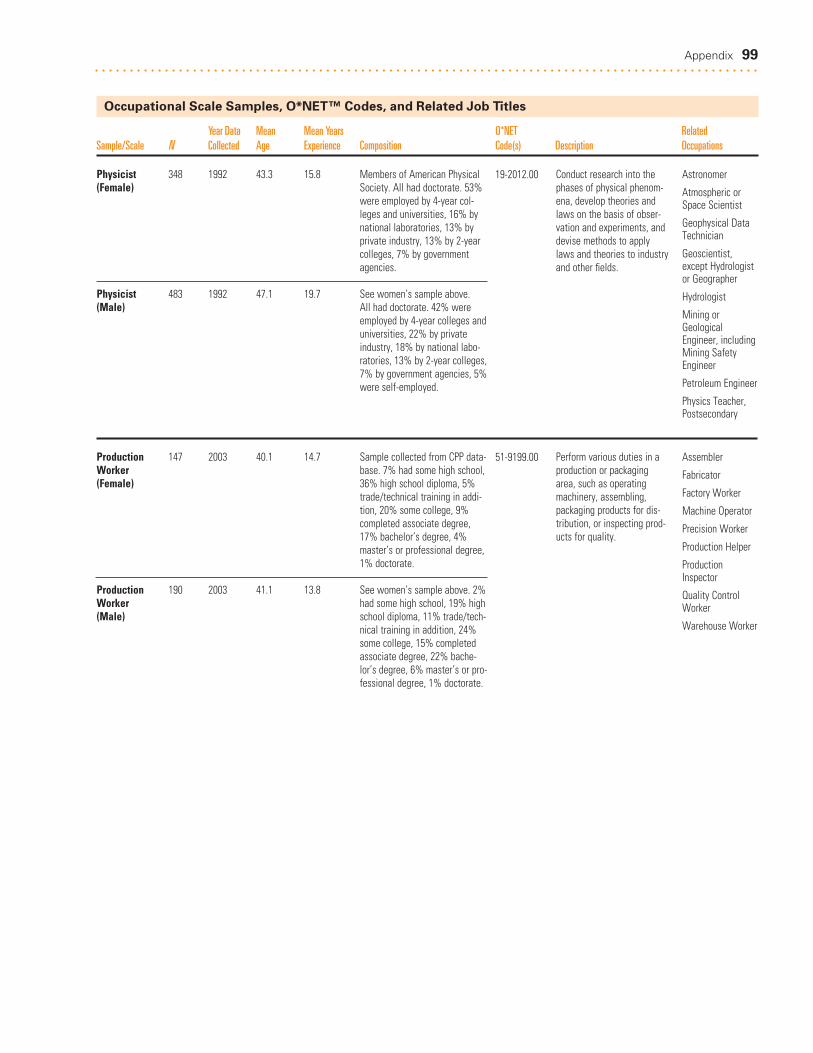
Appendix 99. . . . . . . . . . . . . . . . . . . . . . . . . . . . . . . . . . . . . . . . . . . . . . . . . . . . . . . . . . . . . . . . . . . . . . . . . . . . . . . . . . . . . . . . . . . . . . .
Occupational Scale Samples, O*NET™ Codes, and Related Job Titles
Year Data Mean Mean Years O*NET RelatedSample/Scale N Collected Age Experience Composition Code(s) Description Occupations
Physicist 348 1992 43.3 15.8(Female)
Physicist 483 1992 47.1 19.7(Male)
Production 147 2003 40.1 14.7Worker(Female)
Production 190 2003 41.1 13.8Worker(Male)
Members of American PhysicalSociety. All had doctorate. 53%were employed by 4-year col-leges and universities, 16% bynational laboratories, 13% byprivate industry, 13% by 2-yearcolleges, 7% by governmentagencies.
See women’s sample above. All had doctorate. 42% wereemployed by 4-year colleges anduniversities, 22% by privateindustry, 18% by national labo-ratories, 13% by 2-year colleges,7% by government agencies, 5%were self-employed.
Sample collected from CPP data-base. 7% had some high school,36% high school diploma, 5%trade/technical training in addi-tion, 20% some college, 9%completed associate degree,17% bachelor’s degree, 4%master’s or professional degree,1% doctorate.
See women’s sample above. 2%had some high school, 19% highschool diploma, 11% trade/tech-nical training in addition, 24%some college, 15% completedassociate degree, 22% bache-lor’s degree, 6% master’s or pro-fessional degree, 1% doctorate.
Conduct research into thephases of physical phenom-ena, develop theories andlaws on the basis of obser-vation and experiments, anddevise methods to applylaws and theories to industryand other fields.
Perform various duties in aproduction or packagingarea, such as operatingmachinery, assembling,packaging products for dis-tribution, or inspecting prod-ucts for quality.
19-2012.00
51-9199.00
Astronomer
Atmospheric orSpace Scientist
Geophysical DataTechnician
Geoscientist,except Hydrologistor Geographer
Hydrologist
Mining orGeologicalEngineer, includingMining SafetyEngineer
Petroleum Engineer
Physics Teacher,Postsecondary
Assembler
Fabricator
Factory Worker
Machine Operator
Precision Worker
Production Helper
ProductionInspector
Quality ControlWorker
Warehouse Worker
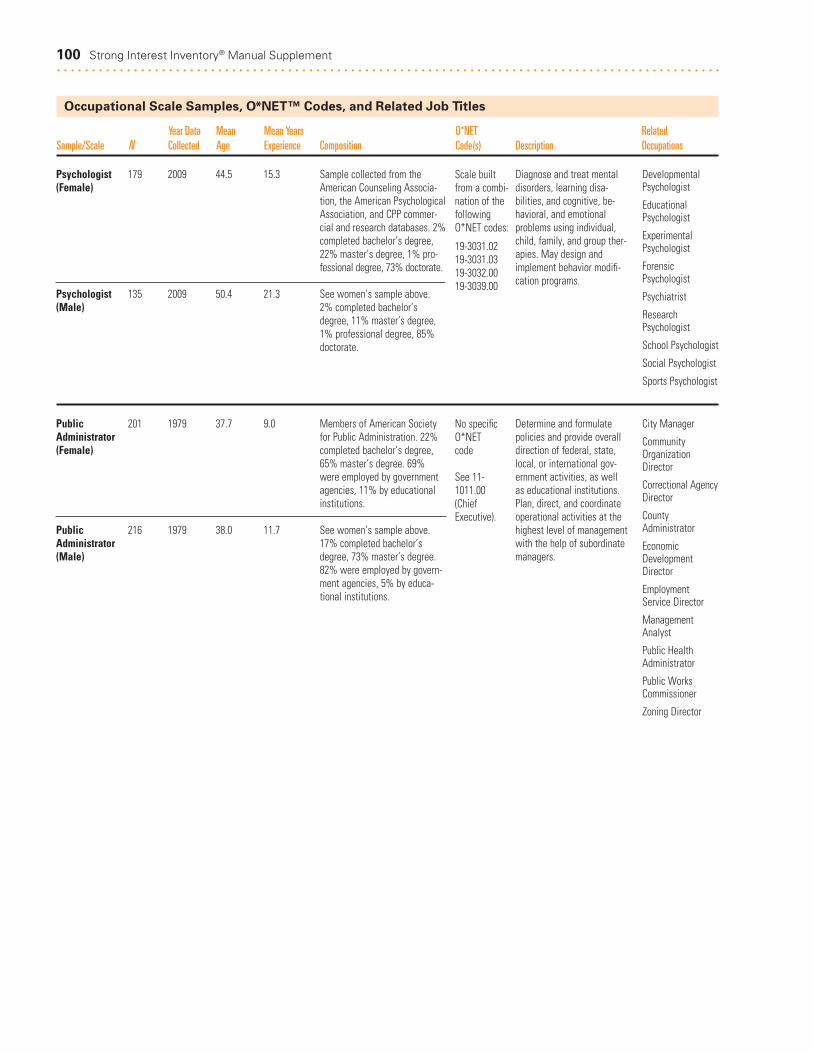
100 Strong Interest Inventory® Manual Supplement. . . . . . . . . . . . . . . . . . . . . . . . . . . . . . . . . . . . . . . . . . . . . . . . . . . . . . . . . . . . . . . . . . . . . . . . . . . . . . . . . . . . . . . . . . . . . . .
Occupational Scale Samples, O*NET™ Codes, and Related Job Titles
Year Data Mean Mean Years O*NET RelatedSample/Scale N Collected Age Experience Composition Code(s) Description Occupations
Psychologist 179 2009 44.5 15.3(Female)
Psychologist 135 2009 50.4 21.3(Male)
Public 201 1979 37.7 9.0Administrator(Female)
Public 216 1979 38.0 11.7Administrator(Male)
Sample collected from theAmerican Counseling Associa-tion, the American PsychologicalAssociation, and CPP commer-cial and research databases. 2%completed bachelor’s degree,22% master’s degree, 1% pro-fessional degree, 73% doctorate.
See women’s sample above. 2% completed bachelor’sdegree, 11% master’s degree,1% professional degree, 85%doctorate.
Members of American Societyfor Public Administration. 22%completed bachelor’s degree,65% master’s degree. 69% were employed by governmentagencies, 11% by educationalinstitutions.
See women’s sample above.17% completed bachelor’sdegree, 73% master’s degree.82% were employed by govern-ment agencies, 5% by educa-tional institutions.
Diagnose and treat mentaldisorders, learning disa-bilities, and cognitive, be-havioral, and emotionalproblems using individual,child, family, and group ther-apies. May design andimplement behavior modifi-cation programs.
Determine and formulatepolicies and provide overalldirection of federal, state,local, or international gov-ernment activities, as wellas educational institutions.Plan, direct, and coordinateoperational activities at thehighest level of managementwith the help of subordinatemanagers.
Scale builtfrom a combi-nation of thefollowingO*NET codes:
19-3031.0219-3031.0319-3032.0019-3039.00
No specificO*NET code
See 11-1011.00(ChiefExecutive).
DevelopmentalPsychologist
EducationalPsychologist
ExperimentalPsychologist
ForensicPsychologist
Psychiatrist
ResearchPsychologist
School Psychologist
Social Psychologist
Sports Psychologist
City Manager
CommunityOrganizationDirector
Correctional AgencyDirector
CountyAdministrator
EconomicDevelopmentDirector
EmploymentService Director
ManagementAnalyst
Public HealthAdministrator
Public WorksCommissioner
Zoning Director

Appendix 101. . . . . . . . . . . . . . . . . . . . . . . . . . . . . . . . . . . . . . . . . . . . . . . . . . . . . . . . . . . . . . . . . . . . . . . . . . . . . . . . . . . . . . . . . . . . . . .
Occupational Scale Samples, O*NET™ Codes, and Related Job Titles
Year Data Mean Mean Years O*NET RelatedSample/Scale N Collected Age Experience Composition Code(s) Description Occupations
Public 403 1992 38.8 12.4RelationsDirector (Female)
Public 291 1992 47.0 20.6RelationsDirector (Male)
Members of Public RelationsSociety of America. 5% hadsome college or associatedegree, 66% completed bache-lor’s degree, 28% master’sdegree, 1% doctorate. 23%were employed in business/industry, 13% in public relationsor consulting firms, 13% wereself-employed, 12% wereemployed in educational institu-tions, 7% in health/medicalinstitutions, 7% in governmentagencies, 16% in other nonprofitorganizations. Major activitiesincluded writing/editing, admin-istration/supervision, internalconsultation, and media relations.
See women’s sample above. 4%had some college or associatedegree, 55% completed bache-lor’s degree, 35% master’sdegree, 2% professional degree,4% doctorate. 27% wereemployed in business/industry,19% in public relations or con-sulting firms, 14% were self-employed, 10% were employedin educational institutions, 9% in government agencies, 16% inother nonprofit organizations.Major activities included writ-ing/editing, administration/supervision, internal consulta-tion, and media relations.
Plan and direct public rela-tions programs designed tocreate and maintain a fa-vorable public image foremployer or client; or, ifengaged in fundraising, planand direct activities to solicitand maintain funds for spe-cial projects and nonprofitorganizations.
11-2031.00 Campaign Manager
CommunicationsSpecialist
CommunityRelations Director
FundraisingDirector
InformationServices Director
Lobbyist
MarketingManager
Media RelationsConsultant
Promoter
Public AffairsManager
Sports InformationDirector
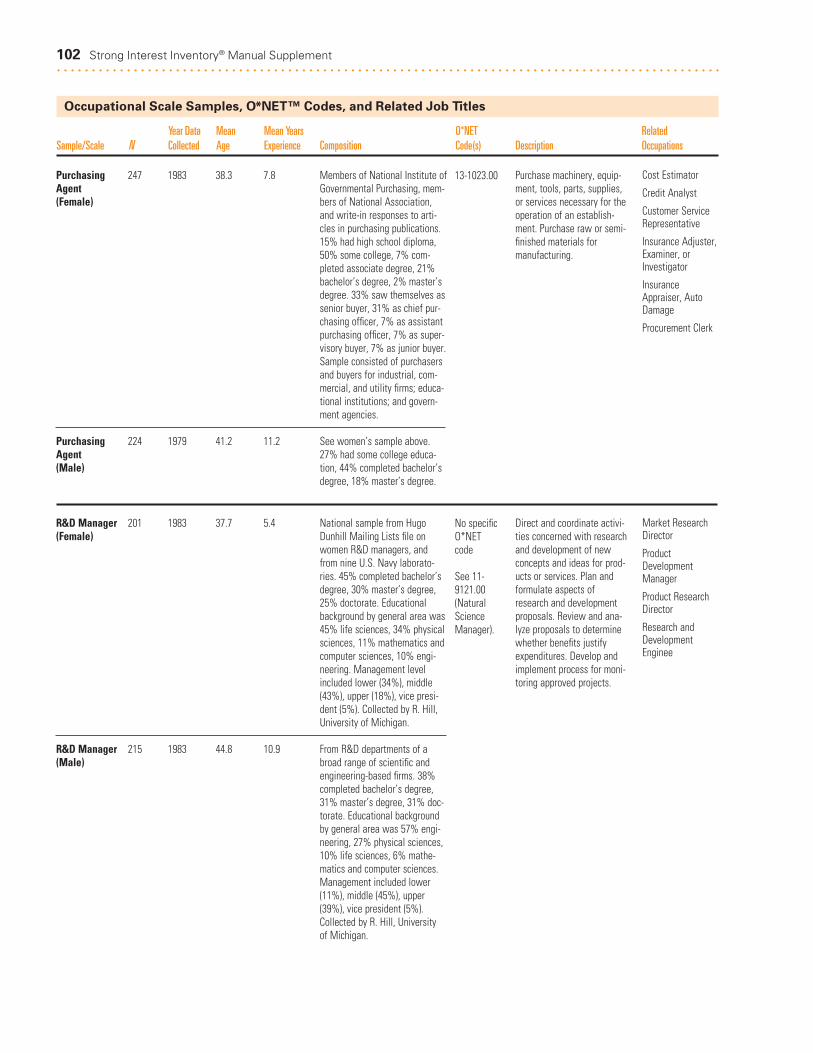
102 Strong Interest Inventory® Manual Supplement. . . . . . . . . . . . . . . . . . . . . . . . . . . . . . . . . . . . . . . . . . . . . . . . . . . . . . . . . . . . . . . . . . . . . . . . . . . . . . . . . . . . . . . . . . . . . . .
Occupational Scale Samples, O*NET™ Codes, and Related Job Titles
Year Data Mean Mean Years O*NET RelatedSample/Scale N Collected Age Experience Composition Code(s) Description Occupations
Purchasing 247 1983 38.3 7.8Agent(Female)
Purchasing 224 1979 41.2 11.2Agent(Male)
R&D Manager 201 1983 37.7 5.4(Female)
R&D Manager 215 1983 44.8 10.9(Male)
Members of National Institute ofGovernmental Purchasing, mem-bers of National Association,and write-in responses to arti-cles in purchasing publications.15% had high school diploma,50% some college, 7% com-pleted associate degree, 21%bachelor’s degree, 2% master’sdegree. 33% saw themselves assenior buyer, 31% as chief pur-chasing officer, 7% as assistantpurchasing officer, 7% as super-visory buyer, 7% as junior buyer.Sample consisted of purchasersand buyers for industrial, com-mercial, and utility firms; educa-tional institutions; and govern-ment agencies.
See women’s sample above.27% had some college educa-tion, 44% completed bachelor’sdegree, 18% master’s degree.
National sample from HugoDunhill Mailing Lists file onwomen R&D managers, andfrom nine U.S. Navy laborato-ries. 45% completed bachelor’sdegree, 30% master’s degree,25% doctorate. Educationalbackground by general area was45% life sciences, 34% physicalsciences, 11% mathematics andcomputer sciences, 10% engi-neering. Management levelincluded lower (34%), middle(43%), upper (18%), vice presi-dent (5%). Collected by R. Hill,University of Michigan.
From R&D departments of abroad range of scientific andengineering-based firms. 38%completed bachelor’s degree,31% master’s degree, 31% doc-torate. Educational backgroundby general area was 57% engi-neering, 27% physical sciences,10% life sciences, 6% mathe-matics and computer sciences.Management included lower(11%), middle (45%), upper(39%), vice president (5%).Collected by R. Hill, University of Michigan.
Purchase machinery, equip-ment, tools, parts, supplies,or services necessary for theoperation of an establish-ment. Purchase raw or semi-finished materials formanufacturing.
Direct and coordinate activi-ties concerned with researchand development of newconcepts and ideas for prod-ucts or services. Plan andformulate aspects ofresearch and developmentproposals. Review and ana-lyze proposals to determinewhether benefits justifyexpenditures. Develop andimplement process for moni-toring approved projects.
13-1023.00
No specificO*NETcode
See 11-9121.00(NaturalScienceManager).
Cost Estimator
Credit Analyst
Customer ServiceRepresentative
Insurance Adjuster,Examiner, orInvestigator
InsuranceAppraiser, AutoDamage
Procurement Clerk
Market ResearchDirector
ProductDevelopmentManager
Product ResearchDirector
Research andDevelopmentEnginee
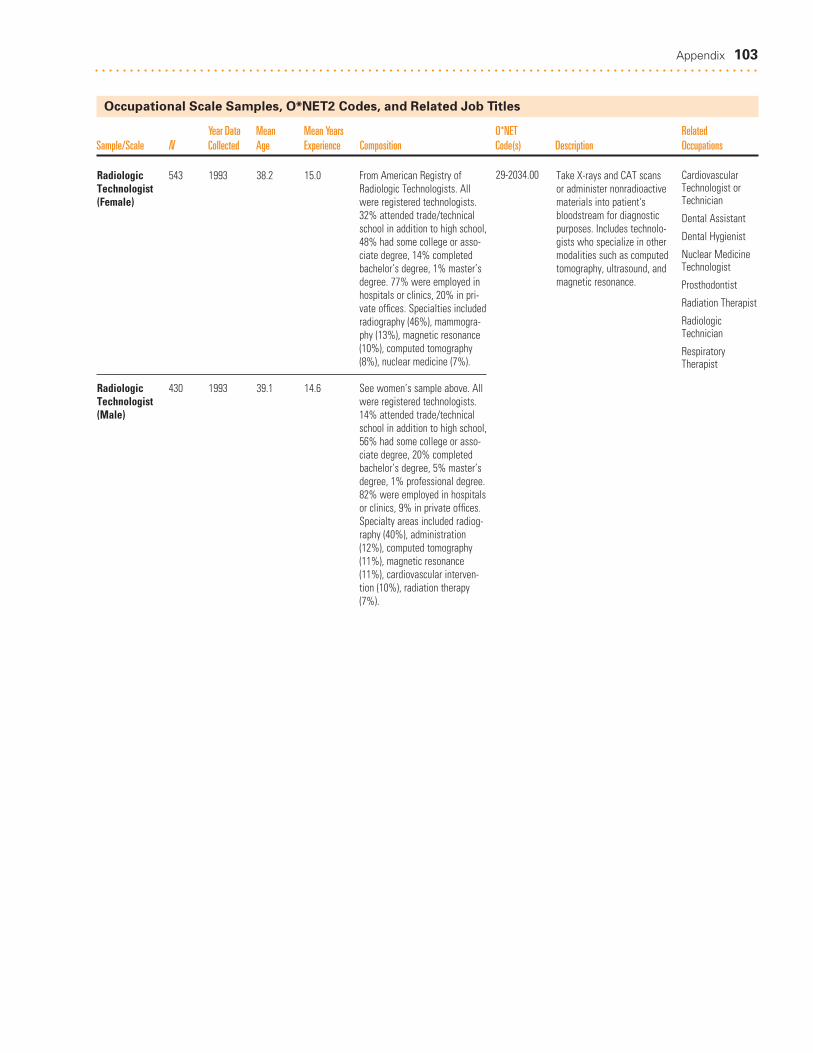
Appendix 103. . . . . . . . . . . . . . . . . . . . . . . . . . . . . . . . . . . . . . . . . . . . . . . . . . . . . . . . . . . . . . . . . . . . . . . . . . . . . . . . . . . . . . . . . . . . . . .
Occupational Scale Samples, O*NET2 Codes, and Related Job Titles
Year Data Mean Mean Years O*NET RelatedSample/Scale N Collected Age Experience Composition Code(s) Description Occupations
Radiologic 543 1993 38.2 15.0Technologist(Female)
Radiologic 430 1993 39.1 14.6Technologist (Male)
From American Registry ofRadiologic Technologists. Allwere registered technologists.32% attended trade/technicalschool in addition to high school,48% had some college or asso-ciate degree, 14% completedbachelor’s degree, 1% master’sdegree. 77% were employed inhospitals or clinics, 20% in pri-vate offices. Specialties includedradiography (46%), mammogra-phy (13%), magnetic resonance(10%), computed tomography(8%), nuclear medicine (7%).
See women’s sample above. Allwere registered technologists.14% attended trade/technicalschool in addition to high school,56% had some college or asso-ciate degree, 20% completedbachelor’s degree, 5% master’sdegree, 1% professional degree.82% were employed in hospitalsor clinics, 9% in private offices.Specialty areas included radiog-raphy (40%), administration(12%), computed tomography(11%), magnetic resonance(11%), cardiovascular interven-tion (10%), radiation therapy(7%).
Take X-rays and CAT scansor administer nonradioactivematerials into patient'sbloodstream for diagnosticpurposes. Includes technolo-gists who specialize in othermodalities such as computedtomography, ultrasound, andmagnetic resonance.
29-2034.00 CardiovascularTechnologist orTechnician
Dental Assistant
Dental Hygienist
Nuclear MedicineTechnologist
Prosthodontist
Radiation Therapist
RadiologicTechnician
RespiratoryTherapist
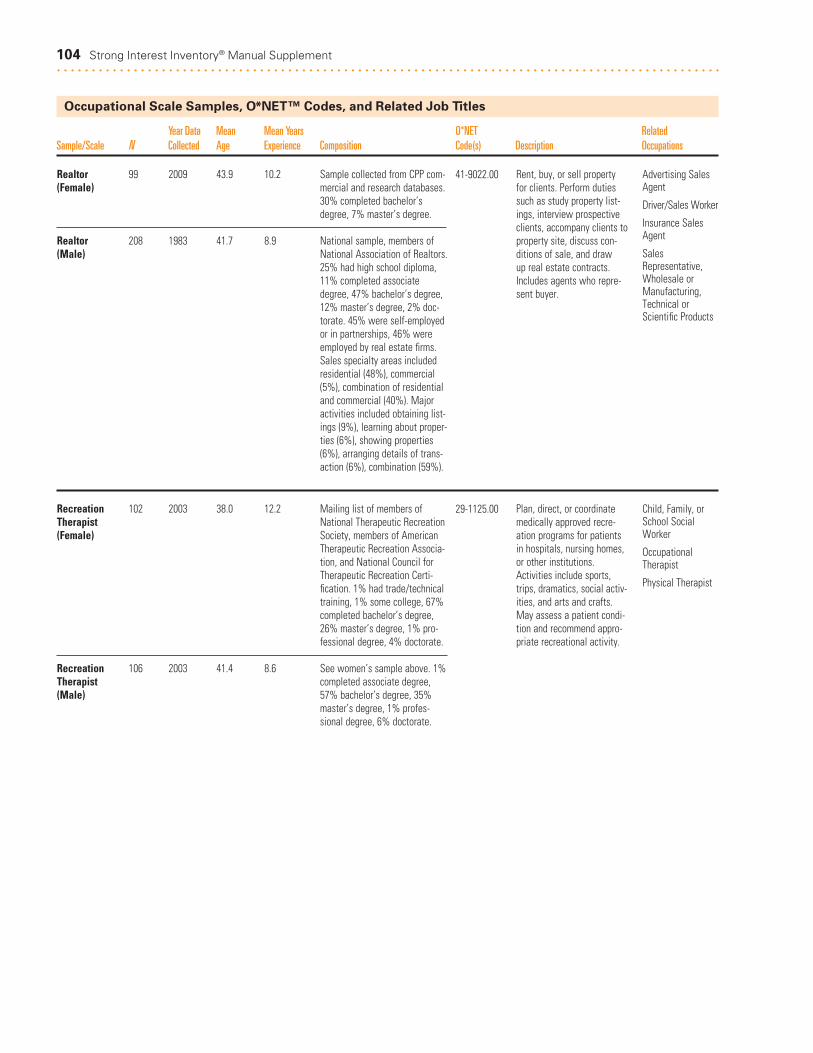
104 Strong Interest Inventory® Manual Supplement. . . . . . . . . . . . . . . . . . . . . . . . . . . . . . . . . . . . . . . . . . . . . . . . . . . . . . . . . . . . . . . . . . . . . . . . . . . . . . . . . . . . . . . . . . . . . . .
Occupational Scale Samples, O*NET™ Codes, and Related Job Titles
Year Data Mean Mean Years O*NET RelatedSample/Scale N Collected Age Experience Composition Code(s) Description Occupations
Realtor 99 2009 43.9 10.2(Female)
Realtor 208 1983 41.7 8.9(Male)
Recreation 102 2003 38.0 12.2Therapist(Female)
Recreation 106 2003 41.4 8.6Therapist(Male)
Sample collected from CPP com-mercial and research databases.30% completed bachelor’sdegree, 7% master’s degree.
National sample, members ofNational Association of Realtors.25% had high school diploma,11% completed associatedegree, 47% bachelor’s degree,12% master’s degree, 2% doc-torate. 45% were self-employedor in partnerships, 46% wereemployed by real estate firms.Sales specialty areas includedresidential (48%), commercial(5%), combination of residentialand commercial (40%). Majoractivities included obtaining list-ings (9%), learning about proper-ties (6%), showing properties(6%), arranging details of trans-action (6%), combination (59%).
Mailing list of members ofNational Therapeutic RecreationSociety, members of AmericanTherapeutic Recreation Associa-tion, and National Council forTherapeutic Recreation Certi-fication. 1% had trade/technicaltraining, 1% some college, 67%completed bachelor’s degree,26% master’s degree, 1% pro-fessional degree, 4% doctorate.
See women’s sample above. 1%completed associate degree,57% bachelor’s degree, 35%master’s degree, 1% profes-sional degree, 6% doctorate.
Rent, buy, or sell propertyfor clients. Perform dutiessuch as study property list-ings, interview prospectiveclients, accompany clients toproperty site, discuss con-ditions of sale, and draw up real estate contracts.Includes agents who repre-sent buyer.
Plan, direct, or coordinatemedically approved recre-ation programs for patientsin hospitals, nursing homes,or other institutions.Activities include sports,trips, dramatics, social activ-ities, and arts and crafts.May assess a patient condi-tion and recommend appro-priate recreational activity.
41-9022.00
29-1125.00
Advertising SalesAgent
Driver/Sales Worker
Insurance SalesAgent
SalesRepresentative,Wholesale orManufacturing,Technical orScientific Products
Child, Family, orSchool SocialWorker
OccupationalTherapist
Physical Therapist

Appendix 105. . . . . . . . . . . . . . . . . . . . . . . . . . . . . . . . . . . . . . . . . . . . . . . . . . . . . . . . . . . . . . . . . . . . . . . . . . . . . . . . . . . . . . . . . . . . . . .
Occupational Scale Samples, O*NET™ Codes, and Related Job Titles
Year Data Mean Mean Years O*NET RelatedSample/Scale N Collected Age Experience Composition Code(s) Description Occupations
Registered 256 2009 45.0 17.8Nurse(Female)
Registered 704 1992 41.2 14.0Nurse(Male)
Rehabilitation 310 2003 and 43.9 12.0Counselor 2009(Female)
Rehabilitation 132 2003 and 47.7 12.6Counselor 2009(Male)
Sample collected from CPP com-mercial and research databases.44% completed bachelor’sdegree, 16% master’s degree,less than 1% professionaldegree, 1% doctorate.
See women’s sample above. 1%had high school diploma, 22%some college or associatedegree, 35% completed bache-lor’s degree, 37% master’sdegree, 2% professional degree,4% doctorate. 73% wereemployed by hospitals, 6% byschools of nursing, 6% by physi-cian’s offices or ambulatory careclinics, 4% by home healthagencies, 3% by military, 3%were self-employed.
Sample collected from theAmerican Counseling Associa-tion and CPP commercial andresearch databases. A portion ofthe sample was also taken fromthe 2004 Strong revision. 14%completed bachelor’s degree,82% master’s degree, less than1% professional degree, 3%doctorate.
See women’s sample above.13% completed bachelor’sdegree, 79% master’s degree,1% professional degree, 5%doctorate.
Assess patient health prob-lems and needs, develop andimplement nursing careplans, and maintain medicalrecords. Administer nursingcare to ill, injured, convales-cent, or disabled patients.May advise patients onhealth maintenance and dis-ease prevention or providecase management. Licensingor registration required.Includes advance practicenurses such as nurse practi-tioners, clinical nurse spe-cialists, certified nursemidwives, and certified reg-istered nurse anesthetists.Advanced practice nursing ispracticed by RNs who havespecialized formal, postbasiceducation and who functionin highly autonomous andspecialized roles.
Counsel individuals to maxi-mize the independence andemployability of personscoping with personal, social,and vocational difficultiesthat result from birth de-fects, illness, disease, acci-dents, or the stress of dailylife. Coordinate activities forresidents of care and treat-ment facilities. Assess clientneeds and design and imple-ment rehabilitation programsthat may include personaland vocational counseling,training, and job placement.
29-1141.00
21-1015.00
Chiropractor
Medical Assistant
Nursing Instructoror Teacher,Postsecondary
Podiatrist
Psychiatric Aide
Surgeon
EmploymentCounselor
OccupationalTherapist
PsychosocialRehabilitationCounselor
School Counselor
VeteransRehabilitationCounselor
Vocational Nurse
VocationalRehabilitationCounselor

106 Strong Interest Inventory® Manual Supplement. . . . . . . . . . . . . . . . . . . . . . . . . . . . . . . . . . . . . . . . . . . . . . . . . . . . . . . . . . . . . . . . . . . . . . . . . . . . . . . . . . . . . . . . . . . . . . .
Occupational Scale Samples, O*NET™ Codes, and Related Job Titles
Year Data Mean Mean Years O*NET RelatedSample/Scale N Collected Age Experience Composition Code(s) Description Occupations
Religious/ 95 2009 41.2 11.2Spiritual Leader(Female)
Religious/ 152 2009 42.7 16.1Spiritual Leader(Male)
Reporter 207 1979 38.0 10.7(Female)
Reporter 208 1979 35.3 11.9(Male)
Sample collected from CPP com-mercial and research databases.34% completed bachelor’sdegree, 46% master’s degree,5% professional degree, 3%doctorate.
See women’s sample above.32% completed bachelor’sdegree, 41% master’s degree,9% professional degree, 7%doctorate.
From Alphabetized Directory ofAmerican Journalists. All thoseselected indicated “reporter” or“writer” as job title. Also mem-bers of National Federation ofPress Women. 15% had highschool diploma, 69% completedbachelor’s degree, 14% master’sdegree.
See women’s sample above. Allthose selected indicated “reporter”or “writer” as job title. 14% hadhigh school diploma, 72% com-pleted bachelor’s degree, 12%master’s degree.
Conduct religious worshipand perform other spiritualfunctions associated withbeliefs and practices of reli-gious faith or denomination.Provide spiritual and moralguidance and assistance tomembers. Direct and coordi-nate activities of a denomi-national group to meetreligious needs of students.Plan, direct, or coordinatechurch school programsdesigned to promote reli-gious education amongchurch membership. Mayprovide counseling and guid-ance on marital, health, finan-cial, and religious problems.
Collect and analyze factsabout newsworthy events byinterview, investigation, orobservation. Report andwrite stories for newspaper,news magazine, radio, ortelevision.
Scale builtfrom a combi-nation of thefollowingO*NET codes:
21-2011.0021-2021.0021-2099.00
27-3022.00
Child, Family, orSchool SocialWorkers
CounselingPsychologists
Curators
Education Adminis-trator, Elementary,or ElementarySchool Teacher,except Special Education
Health Educator
KindergartenTeacher, exceptSpecial Education
OccupationalTherapist
RecreationalTherapist
Sociologist
VocationalEducation Teacher,Postsecondary
Broadcast NewsAnalyst
Editor
Poet, Lyricist, orCreative Writer
Public AddressSystem or otherAnnouncer
Radio or TelevisionAnnouncer
Technical Writer
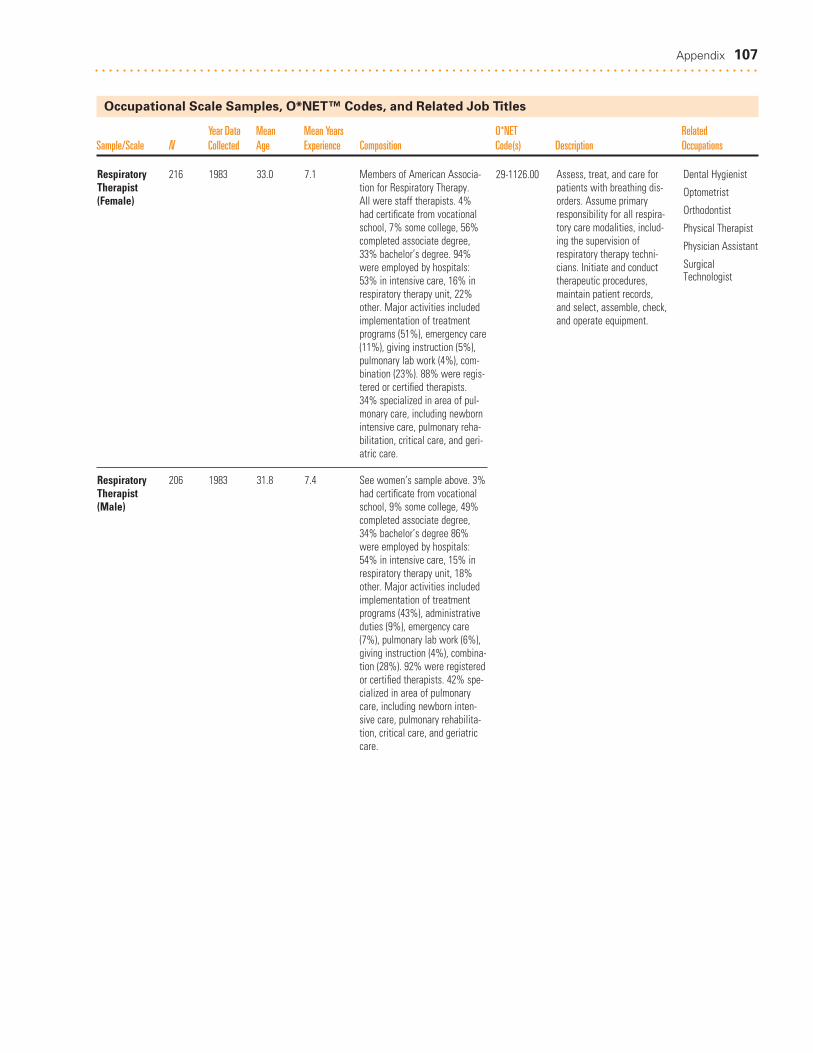
Appendix 107. . . . . . . . . . . . . . . . . . . . . . . . . . . . . . . . . . . . . . . . . . . . . . . . . . . . . . . . . . . . . . . . . . . . . . . . . . . . . . . . . . . . . . . . . . . . . . .
Occupational Scale Samples, O*NET™ Codes, and Related Job Titles
Year Data Mean Mean Years O*NET RelatedSample/Scale N Collected Age Experience Composition Code(s) Description Occupations
Respiratory 216 1983 33.0 7.1Therapist (Female)
Respiratory 206 1983 31.8 7.4Therapist (Male)
Members of American Associa-tion for Respiratory Therapy. All were staff therapists. 4%had certificate from vocationalschool, 7% some college, 56%completed associate degree,33% bachelor’s degree. 94%were employed by hospitals:53% in intensive care, 16% inrespiratory therapy unit, 22%other. Major activities includedimplementation of treatmentprograms (51%), emergency care(11%), giving instruction (5%),pulmonary lab work (4%), com-bination (23%). 88% were regis-tered or certified therapists.34% specialized in area of pul-monary care, including newbornintensive care, pulmonary reha-bilitation, critical care, and geri-atric care.
See women’s sample above. 3%had certificate from vocationalschool, 9% some college, 49%completed associate degree,34% bachelor’s degree 86%were employed by hospitals:54% in intensive care, 15% inrespiratory therapy unit, 18%other. Major activities includedimplementation of treatmentprograms (43%), administrativeduties (9%), emergency care(7%), pulmonary lab work (6%),giving instruction (4%), combina-tion (28%). 92% were registeredor certified therapists. 42% spe-cialized in area of pulmonarycare, including newborn inten-sive care, pulmonary rehabilita-tion, critical care, and geriatriccare.
Assess, treat, and care forpatients with breathing dis-orders. Assume primaryresponsibility for all respira-tory care modalities, includ-ing the supervision ofrespiratory therapy techni-cians. Initiate and conducttherapeutic procedures,maintain patient records,and select, assemble, check,and operate equipment.
29-1126.00 Dental Hygienist
Optometrist
Orthodontist
Physical Therapist
Physician Assistant
SurgicalTechnologist

108 Strong Interest Inventory® Manual Supplement. . . . . . . . . . . . . . . . . . . . . . . . . . . . . . . . . . . . . . . . . . . . . . . . . . . . . . . . . . . . . . . . . . . . . . . . . . . . . . . . . . . . . . . . . . . . . . .
Occupational Scale Samples, O*NET™ Codes, and Related Job Titles
Year Data Mean Mean Years O*NET RelatedSample/Scale N Collected Age Experience Composition Code(s) Description Occupations
Restaurant 152 1984 37.4 10.0Manager (Female)
Restaurant 192 1984 38.8 14.3Manager (Male)
Sales 127 2009 40.5 14.4Manager (Female)
Sales 264 2009 41.5 14.9Manager (Male)
Members of National RestaurantAssociation, and national sam-pling from Bell Yellow Pages.24% had high school diploma,27% some college, 9% com-pleted associate degree, 31%bachelor’s degree, 6% master’sderee. 37% were restaurantowners, 63% held managementpositions. Major activitiesincluded customer contact(26%), personnel management(17%), record keeping and finan-cial planning (9%), combination(41%).
See women’s sample above.18% had high school diploma,26% some college, 10% com-pleted associate degree, 43%bachelor’s degree, 3% master’sdegree. 49% were restaurantowners, 41% held managementpositions. Major activities in-cluded customer contact (25%),personnel management (23%),record keeping and financialplanning (11%), combination(38%).
Sample collected from CPP com-mercial and research databases.47% completed bachelor’sdegree, 21% master’s degree,1% professional degree.
See women’s sample above.53% completed bachelor’sdegree, 20% master’s degree,1% professional degree, 1%doctorate.
Supervise workers engagedin preparing and servingfood.
Direct the actual distributionor movement of a product orservice to the customer.Coordinate sales distributionby establishing sales territo-ries, quotas, and goals andestablish training programsfor sales representatives.Analyze sales statisticsgathered by staff to deter-mine sales potential andinventory requirements andmonitor the preferences ofcustomers.
35-1012.00
11-2022.00
Chef or Head Cook
Dietetic Technician
Dietitian orNutritionist
Farm or HomeManagementAdvisor
First-LineSupervisor/Managerof Housekeeping orJanitorial Workers
First-LineSupervisor/Managerof Landscaping,Lawn Service, orGroundskeepingWorkers
First-LineSupervisor/Managerof Personal ServiceWorkers
Food and ServiceManager
Agent or BusinessManager of Artists,Performers, orAthletes
EducationAdministrator,Elementary orSecondary School
Logging Manager
Marketing Manager
Training andDevelopmentSpecialist
Wholesale or RetailBuyer, except FarmProducts

Appendix 109. . . . . . . . . . . . . . . . . . . . . . . . . . . . . . . . . . . . . . . . . . . . . . . . . . . . . . . . . . . . . . . . . . . . . . . . . . . . . . . . . . . . . . . . . . . . . . .
Occupational Scale Samples, O*NET™ Codes, and Related Job Titles
Year Data Mean Mean Years O*NET RelatedSample/Scale N Collected Age Experience Composition Code(s) Description Occupations
School 347 1992 48.6 22.3Administrator (Female)
School 314 1992 61.2 32.3Administrator (Male)
School 208 1982 42.3 10.3Counselor (Female)
School 266 1982 42.3 12.5Counselor(Male)
Members of American Associa-tion of School Administrators.42% completed master’s degree,8% professional degree, 49%doctorate. 43% worked in publicschools, 36% in public schooldistrict office, 4% in countyoffice of education, 3% in stateoffice of education, 1% in pri-vate or parochial schools.
See women’s sample above.30% completed master’s degree,7% professional degree, 62%doctorate. 43% worked in publicschools, 31% in public schooldistrict office, 4% in countyoffice of education, 3% in stateoffice of education.
High school guidance coun-selors, all members of AmericanAssociation for Counseling andDevelopment. 89% completedmaster’s degree, 1% Ph.D., 1%Ed.D. Average of 49% of work-day was spent counseling stu-dents. Major areas of interestincluded crisis and personalcounseling (27%), class schedul-ing (16%), graduation require-ments (10%), pre-college/vocational school counseling(7%), career counseling (7%),combination (30%).
See women’s sample above. 2%completed bachelor’s degree,79% master’s degree, 6% Ph.D.,5% Ed.D. Average of 48% ofworkday was spent counselingstudents. Major areas of coun-seling included class scheduling(20%), crisis and personal coun-seling (18%), pre-college/voca-tional school counseling (11%),career counseling (10%), gradua-tion requirements (8%), combi-nation (31%).
Plan, direct, or coordinatethe academic, clerical, orauxiliary activities of publicor private elementary or sec-ondary schools.
Counsel individuals and provide group educationaland vocational guidance services.
11-9032.00
21-1012.00
EducationAdministrator,Postsecondary
First-LineSupervisor/Managerof Office orAdministrativeSupport Workers
InstructionalCoordinator
ManagementAnalyst
Social orCommunity ServiceManager
Training andDevelopmentManager
Training andDevelopmentSpecialist
Career Counselor
Child, Family, orSchool SocialWorker
Health Educator
Probation Officer orCorrectionalTreatmentSpecialist
SchoolPsychologist
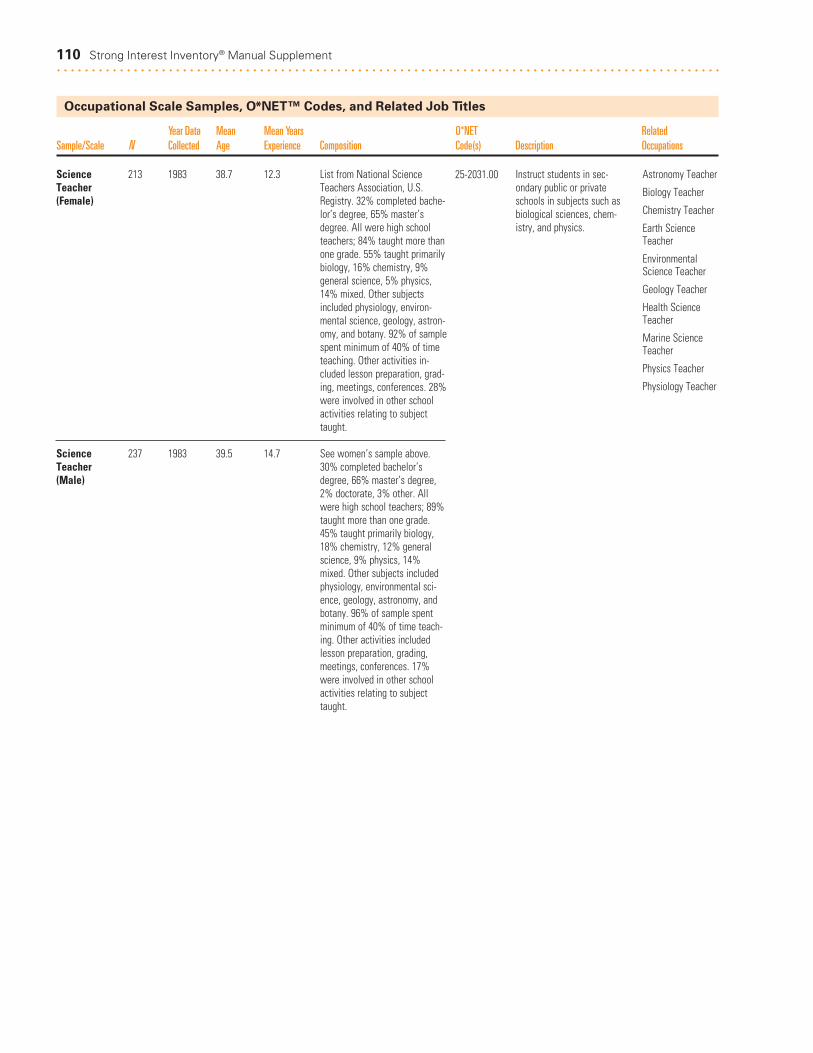
110 Strong Interest Inventory® Manual Supplement. . . . . . . . . . . . . . . . . . . . . . . . . . . . . . . . . . . . . . . . . . . . . . . . . . . . . . . . . . . . . . . . . . . . . . . . . . . . . . . . . . . . . . . . . . . . . . .
Occupational Scale Samples, O*NET™ Codes, and Related Job Titles
Year Data Mean Mean Years O*NET RelatedSample/Scale N Collected Age Experience Composition Code(s) Description Occupations
Science 213 1983 38.7 12.3Teacher(Female)
Science 237 1983 39.5 14.7Teacher(Male)
List from National ScienceTeachers Association, U.S.Registry. 32% completed bache-lor’s degree, 65% master’sdegree. All were high schoolteachers; 84% taught more thanone grade. 55% taught primarilybiology, 16% chemistry, 9%general science, 5% physics,14% mixed. Other subjectsincluded physiology, environ-mental science, geology, astron-omy, and botany. 92% of samplespent minimum of 40% of timeteaching. Other activities in-cluded lesson preparation, grad-ing, meetings, conferences. 28%were involved in other schoolactivities relating to subjecttaught.
See women’s sample above.30% completed bachelor’sdegree, 66% master’s degree,2% doctorate, 3% other. Allwere high school teachers; 89%taught more than one grade.45% taught primarily biology,18% chemistry, 12% generalscience, 9% physics, 14%mixed. Other subjects includedphysiology, environmental sci-ence, geology, astronomy, andbotany. 96% of sample spentminimum of 40% of time teach-ing. Other activities included lesson preparation, grading,meetings, conferences. 17%were involved in other schoolactivities relating to subjecttaught.
Instruct students in sec-ondary public or privateschools in subjects such asbiological sciences, chem-istry, and physics.
25-2031.00 Astronomy Teacher
Biology Teacher
Chemistry Teacher
Earth ScienceTeacher
EnvironmentalScience Teacher
Geology Teacher
Health ScienceTeacher
Marine ScienceTeacher
Physics Teacher
Physiology Teacher
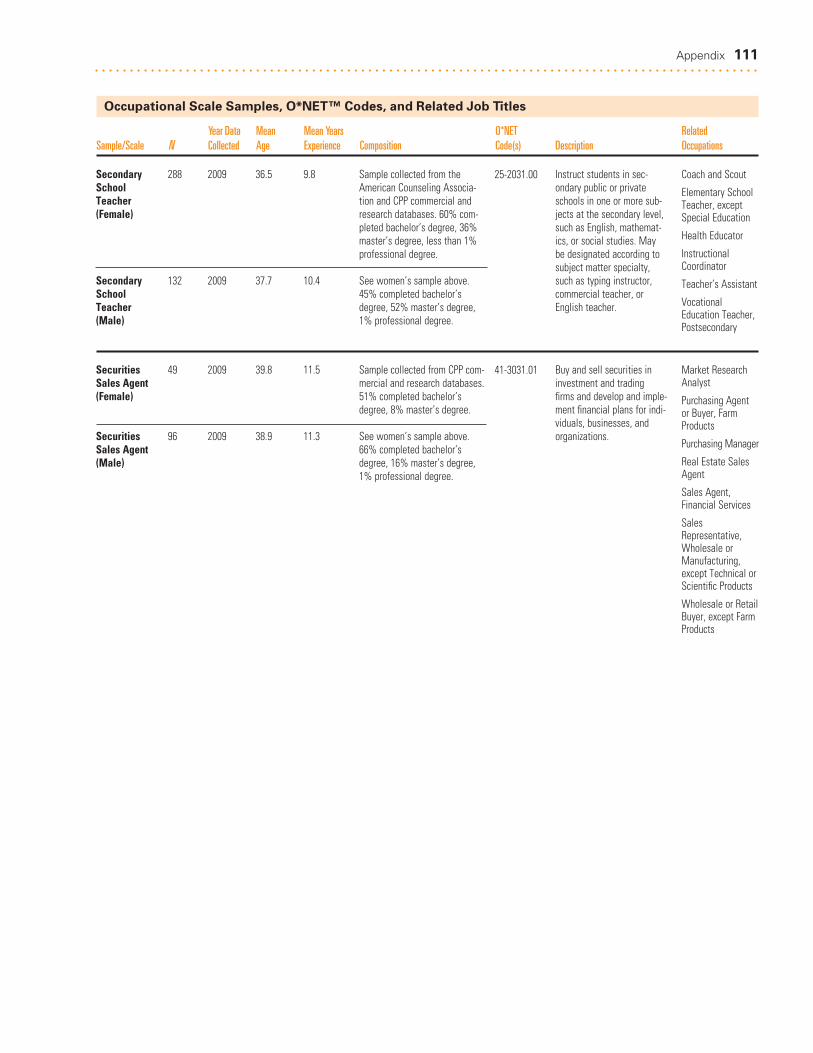
Appendix 111. . . . . . . . . . . . . . . . . . . . . . . . . . . . . . . . . . . . . . . . . . . . . . . . . . . . . . . . . . . . . . . . . . . . . . . . . . . . . . . . . . . . . . . . . . . . . . .
Occupational Scale Samples, O*NET™ Codes, and Related Job Titles
Year Data Mean Mean Years O*NET RelatedSample/Scale N Collected Age Experience Composition Code(s) Description Occupations
Secondary 288 2009 36.5 9.8SchoolTeacher (Female)
Secondary 132 2009 37.7 10.4SchoolTeacher (Male)
Securities 49 2009 39.8 11.5Sales Agent (Female)
Securities 96 2009 38.9 11.3Sales Agent (Male)
Sample collected from theAmerican Counseling Associa-tion and CPP commercial andresearch databases. 60% com-pleted bachelor’s degree, 36%master’s degree, less than 1%professional degree.
See women’s sample above.45% completed bachelor’sdegree, 52% master’s degree,1% professional degree.
Sample collected from CPP com-mercial and research databases.51% completed bachelor’sdegree, 8% master’s degree.
See women’s sample above.66% completed bachelor’sdegree, 16% master’s degree,1% professional degree.
Instruct students in sec-ondary public or privateschools in one or more sub-jects at the secondary level,such as English, mathemat-ics, or social studies. Maybe designated according tosubject matter specialty,such as typing instructor,commercial teacher, orEnglish teacher.
Buy and sell securities ininvestment and trading firms and develop and imple-ment financial plans for indi-viduals, businesses, andorganizations.
25-2031.00
41-3031.01
Coach and Scout
Elementary SchoolTeacher, exceptSpecial Education
Health Educator
InstructionalCoordinator
Teacher’s Assistant
VocationalEducation Teacher,Postsecondary
Market ResearchAnalyst
Purchasing Agent or Buyer, FarmProducts
Purchasing Manager
Real Estate SalesAgent
Sales Agent,Financial Services
SalesRepresentative,Wholesale orManufacturing,except Technical orScientific Products
Wholesale or RetailBuyer, except FarmProducts

112 Strong Interest Inventory® Manual Supplement. . . . . . . . . . . . . . . . . . . . . . . . . . . . . . . . . . . . . . . . . . . . . . . . . . . . . . . . . . . . . . . . . . . . . . . . . . . . . . . . . . . . . . . . . . . . . . .
Occupational Scale Samples, O*NET™ Codes, and Related Job Titles
Year Data Mean Mean Years O*NET RelatedSample/Scale N Collected Age Experience Composition Code(s) Description Occupations
Social 260 2009 35.4 8.5Worker (Female)
Social 58 2009 34.8 8.5Worker (Male)
Sociologist 210 1974 42.2 11.2(Female)
Sociologist 212 1974 40.3 11.4(Male)
Software 82 2009 39.2 13.5Developer (Female)
Software 178 2009 38.6 14.3Developer (Male)
Sample collected from CPP com-mercial and research databases.57% completed bachelor’sdegree, 25% master’s degree,less than 1% professionaldegree, 1% doctorate.
See women’s sample above.55% completed bachelor’sdegree, 24% master’s degree,3% doctorate.
Members of American Sociolog-ical Association; all had doctor-ate. Major activities includedteaching (48%), research (15%),administration (9%), combina-tion (24%).
See women’s sample above.Major activities included teach-ing (45%), research (17%), ad-ministration (15%), combination(21%).
Sample collected from CPP com-mercial and research databases.54% completed bachelor’sdegree, 31% master’s degree.
See women’s sample above.53% completed bachelor’sdegree, 27% master’s degree,1% professional degree, 4%doctorate.
Provide social services andassistance to improve thephysical, mental, emotional,or social functioning of children, adults, or familieswith mental or physical ill-nesses or substance abuseproblems.
Study human society andsocial behavior by examiningthe groups and social institu-tions that people form, aswell as various social, reli-gious, political, and businessorganizations. May study thebehavior and interaction ofgroups, trace their origin andgrowth, and analyze theinfluence of group activitieson individual members.
Develop, create, and modifygeneral computer applica-tions software or specializedutility programs. Analyzeuser needs and develop soft-ware solutions. Design soft-ware or customize softwarefor client use with the aim ofoptimizing operational effi-ciency. May analyze anddesign databases within anapplication area, workingindividually or coordinatingdatabase development aspart of a team.
Scale builtfrom a combi-nation of thefollowingO*NET codes:
21-1021.0021-1022.0021-1023.0021-1029.00
19-3041.00
15-1132.00
Child WelfareCaseworker
Community ServiceWorker
Family Caseworker
Geriatric SocialWorker
Marriage Counselor
Medical SocialWorker
Parole Officer
Anthropologist
EducationAdministrator,Elementary orSecondary School
Elementary SchoolTeacher, exceptSpecial Education
Political Scientist
School Psychologist
Urban or RegionalPlanner
AerospaceEngineering orOperationsTechnician
Computer,Automated Teller, or Office MachineRepairer
Computer ScienceTeacher,Postsecondary
Computer SupportSpecialist
Electrical orElectronic Drafter
Electronics Repairer, Commercial orIndustrial Equipment
MathematicalTechnician
Numerical Tool orProcess ControlProgrammer
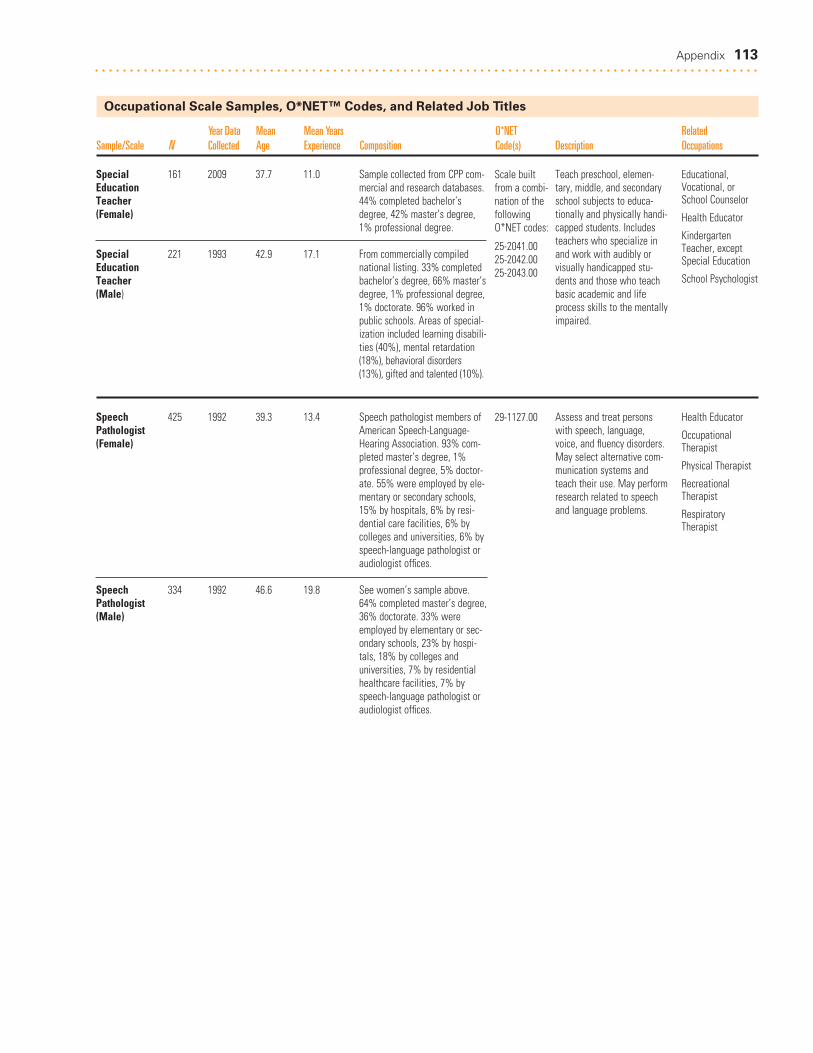
Appendix 113. . . . . . . . . . . . . . . . . . . . . . . . . . . . . . . . . . . . . . . . . . . . . . . . . . . . . . . . . . . . . . . . . . . . . . . . . . . . . . . . . . . . . . . . . . . . . . .
Occupational Scale Samples, O*NET™ Codes, and Related Job Titles
Year Data Mean Mean Years O*NET RelatedSample/Scale N Collected Age Experience Composition Code(s) Description Occupations
Special 161 2009 37.7 11.0EducationTeacher (Female)
Special 221 1993 42.9 17.1EducationTeacher (Male)
Speech 425 1992 39.3 13.4Pathologist(Female)
Speech 334 1992 46.6 19.8Pathologist(Male)
Sample collected from CPP com-mercial and research databases.44% completed bachelor’sdegree, 42% master’s degree,1% professional degree.
From commercially compilednational listing. 33% completedbachelor’s degree, 66% master’sdegree, 1% professional degree,1% doctorate. 96% worked inpublic schools. Areas of special-ization included learning disabili-ties (40%), mental retardation(18%), behavioral disorders(13%), gifted and talented (10%).
Speech pathologist members ofAmerican Speech-Language-Hearing Association. 93% com-pleted master’s degree, 1%professional degree, 5% doctor-ate. 55% were employed by ele-mentary or secondary schools,15% by hospitals, 6% by resi-dential care facilities, 6% by colleges and universities, 6% byspeech-language pathologist oraudiologist offices.
See women’s sample above.64% completed master’s degree,36% doctorate. 33% wereemployed by elementary or sec-ondary schools, 23% by hospi-tals, 18% by colleges anduniversities, 7% by residentialhealthcare facilities, 7% byspeech-language pathologist oraudiologist offices.
Teach preschool, elemen-tary, middle, and secondaryschool subjects to educa-tionally and physically handi-capped students. Includesteachers who specialize inand work with audibly orvisually handicapped stu-dents and those who teachbasic academic and lifeprocess skills to the mentallyimpaired.
Assess and treat personswith speech, language,voice, and fluency disorders.May select alternative com-munication systems andteach their use. May performresearch related to speechand language problems.
Scale builtfrom a combi-nation of thefollowingO*NET codes:
25-2041.0025-2042.0025-2043.00
29-1127.00
Educational,Vocational, orSchool Counselor
Health Educator
KindergartenTeacher, exceptSpecial Education
School Psychologist
Health Educator
OccupationalTherapist
Physical Therapist
RecreationalTherapist
RespiratoryTherapist

114 Strong Interest Inventory® Manual Supplement. . . . . . . . . . . . . . . . . . . . . . . . . . . . . . . . . . . . . . . . . . . . . . . . . . . . . . . . . . . . . . . . . . . . . . . . . . . . . . . . . . . . . . . . . . . . . . .
Occupational Scale Samples, O*NET™ Codes, and Related Job Titles
Year Data Mean Mean Years O*NET RelatedSample/Scale N Collected Age Experience Composition Code(s) Description Occupations
Technical 56 2009 38.8 11.5SalesRepresentative (Female)
Technical 105 2009 38.8 13.2SalesRepresentative (Male)
Technical 132 2009 40.5 12.0SupportSpecialist (Female)
Technical 195 2009 37.8 12.0SupportSpecialist (Male)
Sample collected from CPP com-mercial and research databases.48% completed bachelor’sdegree, 21% master’s degree,2% professional degree.
See women’s sample above.62% completed bachelor’sdegree, 8% master’s degree, 2%professional degree.
Sample collected from CPP com-mercial and research databases.40% completed bachelor’sdegree, 8% master’s degree, 1%professional degree.
See women’s sample above.34% completed bachelor’sdegree, 12% master’s degree,1% doctorate.
Sell goods for wholesalersor manufacturers wheretechnical or scientific knowl-edge is required in suchareas as biology, engineer-ing, chemistry, and electron-ics, normally obtained fromat least 2 years of post-secondary education.
Provide technical assistanceto computer system users.Answer questions or resolvecomputer problems forclients in person, via tele-phone, or from remote loca-tion. May provide assistanceconcerning the use of com-puter hardware and soft-ware, including printing,installation, word process-ing, electronic mail, andoperating systems.
41-4011.00
15-1151.00
Advertising SalesAgent
Demonstrator orProduct Promoter
Insurance SalesAgent
Parts Salesperson
Real Estate SalesAgent
Retail Salesperson
Sales Agent,Financial Services
SalesRepresentative,Wholesale orManufacturing,except Technical orScientific Products
BroadcastTechnician
Computer,Automated Teller,or Office MachineRepairer
Computer Operator
ComputerProgrammer
Computer SecuritySpecialist
Computer SystemsAnalyst
Electrical orElectronicsRepairer,Commercial orIndustrialEquipment
Network Systemsor DataCommunicationsAnalyst
Numerical Tool orProcess ControlProgrammer
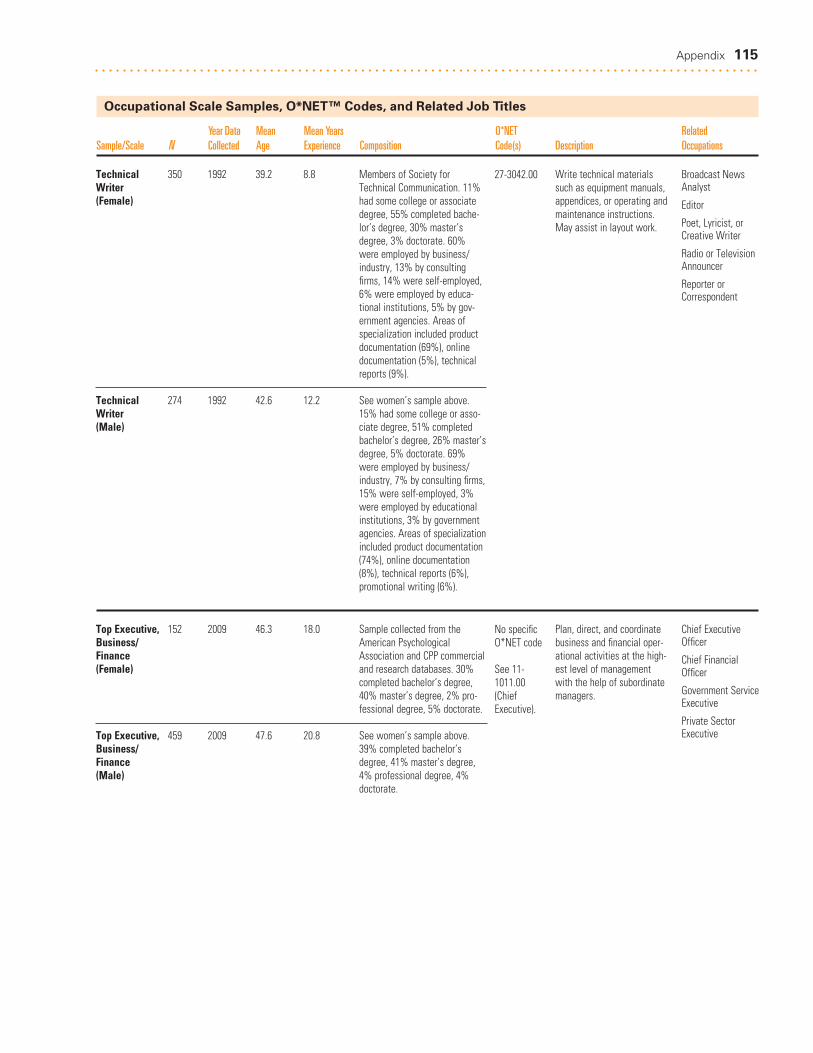
Appendix 115. . . . . . . . . . . . . . . . . . . . . . . . . . . . . . . . . . . . . . . . . . . . . . . . . . . . . . . . . . . . . . . . . . . . . . . . . . . . . . . . . . . . . . . . . . . . . . .
Occupational Scale Samples, O*NET™ Codes, and Related Job Titles
Year Data Mean Mean Years O*NET RelatedSample/Scale N Collected Age Experience Composition Code(s) Description Occupations
Technical 350 1992 39.2 8.8Writer(Female)
Technical 274 1992 42.6 12.2Writer(Male)
Top Executive, 152 2009 46.3 18.0Business/Finance(Female)
Top Executive, 459 2009 47.6 20.8Business/Finance(Male)
Members of Society forTechnical Communication. 11%had some college or associatedegree, 55% completed bache-lor’s degree, 30% master’sdegree, 3% doctorate. 60%were employed by business/industry, 13% by consultingfirms, 14% were self-employed,6% were employed by educa-tional institutions, 5% by gov-ernment agencies. Areas ofspecialization included productdocumentation (69%), onlinedocumentation (5%), technicalreports (9%).
See women’s sample above.15% had some college or asso-ciate degree, 51% completedbachelor’s degree, 26% master’sdegree, 5% doctorate. 69%were employed by business/industry, 7% by consulting firms,15% were self-employed, 3%were employed by educationalinstitutions, 3% by governmentagencies. Areas of specializationincluded product documentation(74%), online documentation(8%), technical reports (6%),promotional writing (6%).
Sample collected from theAmerican PsychologicalAssociation and CPP commercialand research databases. 30%completed bachelor’s degree,40% master’s degree, 2% pro-fessional degree, 5% doctorate.
See women’s sample above.39% completed bachelor’sdegree, 41% master’s degree,4% professional degree, 4%doctorate.
Write technical materialssuch as equipment manuals,appendices, or operating andmaintenance instructions.May assist in layout work.
Plan, direct, and coordinatebusiness and financial oper-ational activities at the high-est level of managementwith the help of subordinatemanagers.
27-3042.00
No specificO*NET code
See 11-1011.00(ChiefExecutive).
Broadcast NewsAnalyst
Editor
Poet, Lyricist, orCreative Writer
Radio or TelevisionAnnouncer
Reporter orCorrespondent
Chief ExecutiveOfficer
Chief FinancialOfficer
Government ServiceExecutive
Private SectorExecutive

116 Strong Interest Inventory® Manual Supplement. . . . . . . . . . . . . . . . . . . . . . . . . . . . . . . . . . . . . . . . . . . . . . . . . . . . . . . . . . . . . . . . . . . . . . . . . . . . . . . . . . . . . . . . . . . . . . .
Occupational Scale Samples, O*NET™ Codes, and Related Job Titles
Year Data Mean Mean Years O*NET RelatedSample/Scale N Collected Age Experience Composition Code(s) Description Occupations
Training & 202 2009 40.4 12.6Development Specialist(Female)
Training & 86 2009 43.9 14.6Development Specialist(Male)
Translator 475 1993 43.1 13.0(Female)
Translator 238 1993 48.2 16.2(Male)
Sample collected from theAmerican PsychologicalAssociation and CPP commercialand research databases. 32%completed bachelor’s degree,34% master’s degree, 1% pro-fessional degree, 5% doctorate.
See women’s sample above.34% completed bachelor’sdegree, 40% master’s degree,1% professional degree, 12%doctorate.
Members of AmericanTranslators Association. 2%attended trade/technical school,11% had some college or asso-ciate degree, 36% completedbachelor’s degree, 38% master’sdegree, 2% professional degree,10% doctorate. 58% were self-employed, 12% worked in busi-ness/industry, 9% in educationalinstitutions, 9% in government,3% in translation firms, 3% ininternational organizations.
See women’s sample above.10% had some college or asso-ciate degree, 27% completedbachelor’s degree, 37% master’sdegree, 7% professional degree,18% doctorate. 59% were self-employed, 12% worked in busi-ness/industry, 10% in educa-tional institutions, 10% in gov-ernment, 3% in translation firms,3% in international organizations.
Conduct training and devel-opment programs foremployees. Plan, direct, orcoordinate the training anddevelopment activities andstaff of an organization.
Translate or interpret writ-ten, oral, or sign languagetext into another languagefor others.
13-1151.00
27-3091.00
First-LineSupervisor/Managerof Office orAdministrativeSupport Workers
Human Resources,Training, and Labor RelationsSpecialists
InstructionalCoordinator
Management Analyst
Recreation Worker
Training andDevelopmentManagers
Court Reporter
Immigration orCustoms Inspector
Music Director
Tour Guide or Escort
Travel Guide
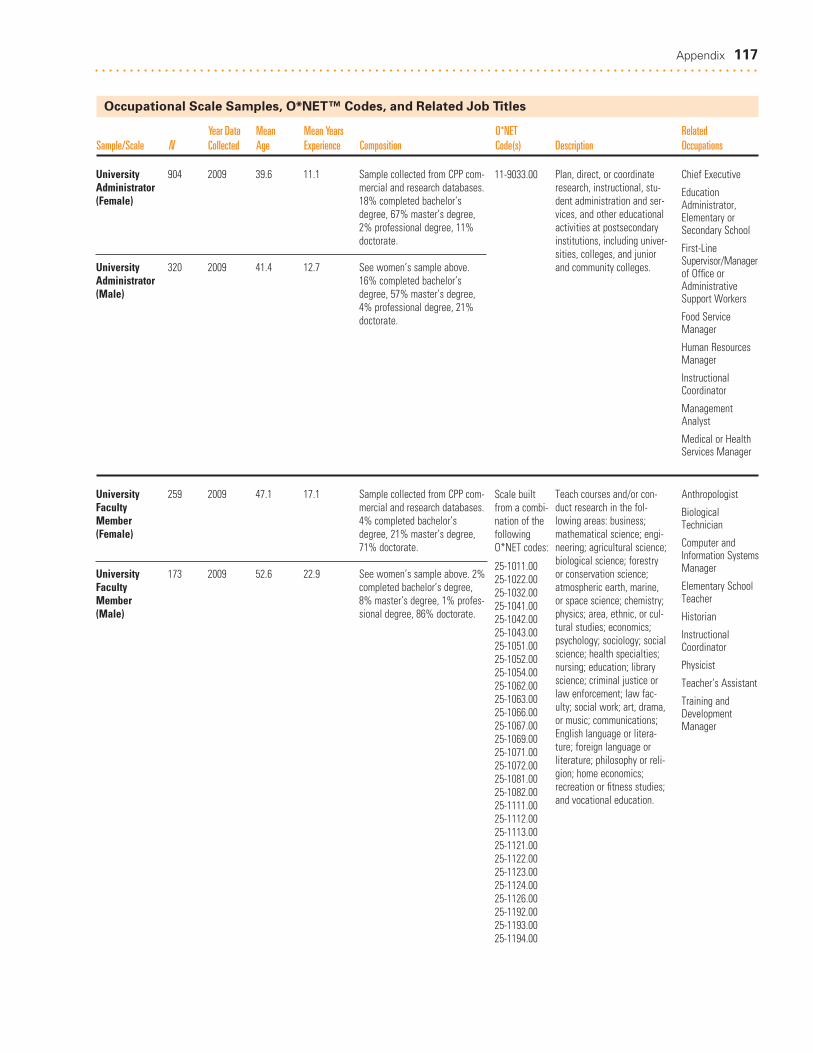
Appendix 117. . . . . . . . . . . . . . . . . . . . . . . . . . . . . . . . . . . . . . . . . . . . . . . . . . . . . . . . . . . . . . . . . . . . . . . . . . . . . . . . . . . . . . . . . . . . . . .
Occupational Scale Samples, O*NET™ Codes, and Related Job Titles
Year Data Mean Mean Years O*NET RelatedSample/Scale N Collected Age Experience Composition Code(s) Description Occupations
University 904 2009 39.6 11.1Administrator(Female)
University 320 2009 41.4 12.7Administrator(Male)
University 259 2009 47.1 17.1FacultyMember(Female)
University 173 2009 52.6 22.9FacultyMember(Male)
Sample collected from CPP com-mercial and research databases.18% completed bachelor’sdegree, 67% master’s degree,2% professional degree, 11%doctorate.
See women’s sample above.16% completed bachelor’sdegree, 57% master’s degree,4% professional degree, 21%doctorate.
Sample collected from CPP com-mercial and research databases.4% completed bachelor’sdegree, 21% master’s degree,71% doctorate.
See women’s sample above. 2%completed bachelor’s degree,8% master’s degree, 1% profes-sional degree, 86% doctorate.
Plan, direct, or coordinateresearch, instructional, stu-dent administration and ser-vices, and other educationalactivities at postsecondaryinstitutions, including univer-sities, colleges, and juniorand community colleges.
Teach courses and/or con-duct research in the fol-lowing areas: business;mathematical science; engi-neering; agricultural science;biological science; forestryor conservation science;atmospheric earth, marine,or space science; chemistry;physics; area, ethnic, or cul-tural studies; economics;psychology; sociology; socialscience; health specialties;nursing; education; libraryscience; criminal justice orlaw enforcement; law fac-ulty; social work; art, drama,or music; communications;English language or litera-ture; foreign language or literature; philosophy or reli-gion; home economics;recreation or fitness studies;and vocational education.
11-9033.00
Scale builtfrom a combi-nation of thefollowingO*NET codes:
25-1011.0025-1022.0025-1032.0025-1041.0025-1042.0025-1043.0025-1051.0025-1052.0025-1054.0025-1062.0025-1063.0025-1066.0025-1067.0025-1069.0025-1071.0025-1072.0025-1081.0025-1082.0025-1111.0025-1112.0025-1113.0025-1121.0025-1122.0025-1123.0025-1124.0025-1126.0025-1192.0025-1193.0025-1194.00
Chief Executive
EducationAdministrator,Elementary orSecondary School
First-LineSupervisor/Managerof Office orAdministrativeSupport Workers
Food ServiceManager
Human ResourcesManager
InstructionalCoordinator
ManagementAnalyst
Medical or HealthServices Manager
Anthropologist
BiologicalTechnician
Computer andInformation SystemsManager
Elementary SchoolTeacher
Historian
InstructionalCoordinator
Physicist
Teacher’s Assistant
Training andDevelopmentManager

118 Strong Interest Inventory® Manual Supplement. . . . . . . . . . . . . . . . . . . . . . . . . . . . . . . . . . . . . . . . . . . . . . . . . . . . . . . . . . . . . . . . . . . . . . . . . . . . . . . . . . . . . . . . . . . . . . .
Occupational Scale Samples, O*NET™ Codes, and Related Job Titles
Year Data Mean Mean Years O*NET RelatedSample/Scale N Collected Age Experience Composition Code(s) Description Occupations
Urban & 101 2003 42.1 12.8RegionalPlanner (Female)
Urban & 108 2003 46.5 16.5RegionalPlanner (Male)
Veterinarian 459 1992 35.5 9.4(Female)
Veterinarian 327 1992 43.6 17.3(Male)
Mailing list of members fromAmerican Planning Association.2% had some high school, 1%high school diploma, 4% trade/technical training or some col-lege, 22% completed bachelor’sdegree, 61% master’s degree,4% professional degree, 6%doctorate.
See women’s sample above.29% completed bachelor’sdegree, 56% master’s degree,5% professional degree, 9%doctorate.
Members of American Veter-inary Association. All had DVMdegree, 4% had additional doc-torate. 45% were employees inprivate practice, 34% were inown private practice, 11%worked in educational institu-tions, 5% in government agen-cies, 3% in industry. 53%specialized in small animals,10% in large animals.
See women’s sample above. Allhad DVM degree, 7% had addi-tional doctorate. 75% had ownprivate practice, 13% wereemployees in private practice,13% worked in educationalinstitutions, 6% in government,2% in industry. 72% specializedin small animals, 9% in largeanimals.
Develop comprehensiveplans and programs for useof land and physical facili-ties of local jurisdictions,such as towns, cities, coun-ties, and metropolitan areas.
Diagnose and treat diseasesand dysfunctions of animals.May engage in a particularfunction, such as researchand development, consulta-tion, administration, techni-cal writing, sale or produc-tion of commercial products,or rendering of technical ser-vices to commercial firms orother organizations. Includesveterinarians who inspectlivestock.
19-3051.00
29-1131.00
Actuary
Fish and GameWarden
Political Scientist
Sociologist
Surveyor
Traffic Technician
Anesthesiologist
BiologicalTechnician
Medical or ClinicalLaboratoryTechnician
Physician Assistant
Podiatrist
VeterinaryAssistant orLaboratory AnimalCaretaker
VeterinaryTechnologist orTechnician
Zoologist orWildlife Biologist
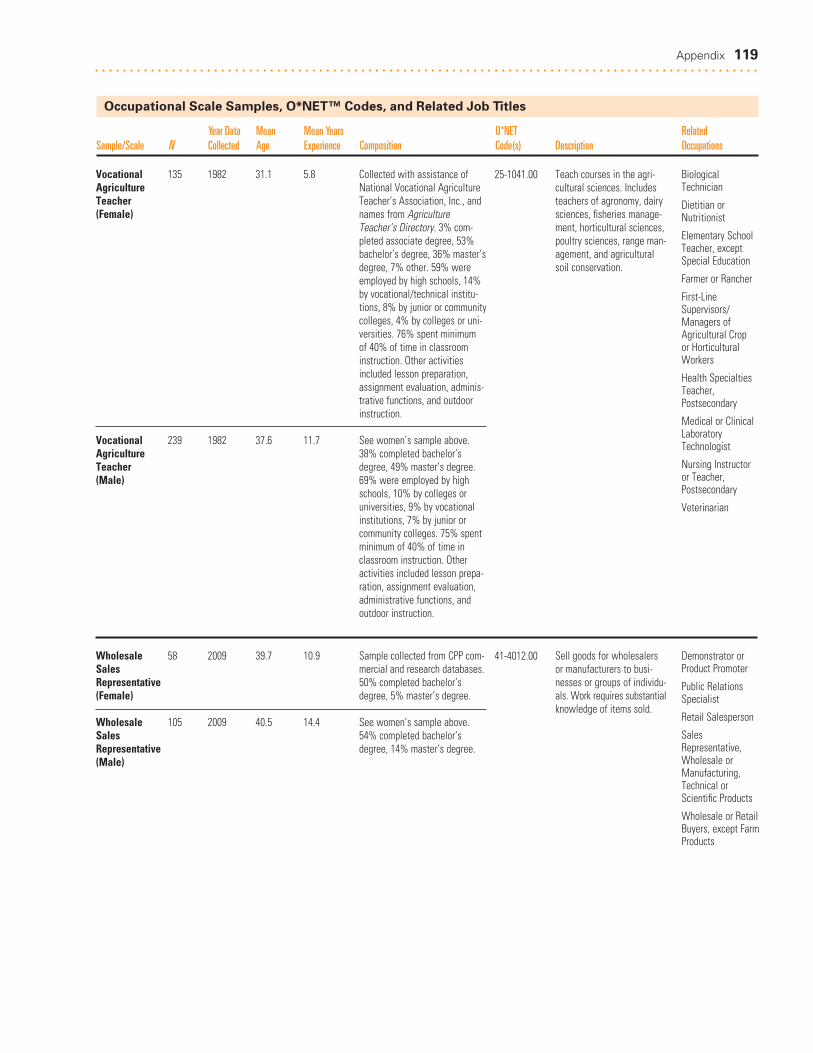
Appendix 119. . . . . . . . . . . . . . . . . . . . . . . . . . . . . . . . . . . . . . . . . . . . . . . . . . . . . . . . . . . . . . . . . . . . . . . . . . . . . . . . . . . . . . . . . . . . . . .
Occupational Scale Samples, O*NET™ Codes, and Related Job Titles
Year Data Mean Mean Years O*NET RelatedSample/Scale N Collected Age Experience Composition Code(s) Description Occupations
Vocational 135 1982 31.1 5.8AgricultureTeacher (Female)
Vocational 239 1982 37.6 11.7AgricultureTeacher (Male)
Wholesale 58 2009 39.7 10.9SalesRepresentative(Female)
Wholesale 105 2009 40.5 14.4SalesRepresentative (Male)
Collected with assistance ofNational Vocational AgricultureTeacher’s Association, Inc., andnames from AgricultureTeacher’s Directory. 3% com-pleted associate degree, 53%bachelor’s degree, 36% master’sdegree, 7% other. 59% wereemployed by high schools, 14%by vocational/technical institu-tions, 8% by junior or communitycolleges, 4% by colleges or uni-versities. 76% spent minimum of 40% of time in classroominstruction. Other activitiesincluded lesson preparation,assignment evaluation, adminis-trative functions, and outdoorinstruction.
See women’s sample above.38% completed bachelor’sdegree, 49% master’s degree.69% were employed by highschools, 10% by colleges or universities, 9% by vocationalinstitutions, 7% by junior orcommunity colleges. 75% spentminimum of 40% of time inclassroom instruction. Otheractivities included lesson prepa-ration, assignment evaluation,administrative functions, andoutdoor instruction.
Sample collected from CPP com-mercial and research databases.50% completed bachelor’sdegree, 5% master’s degree.
See women’s sample above.54% completed bachelor’sdegree, 14% master’s degree.
Teach courses in the agri-cultural sciences. Includesteachers of agronomy, dairysciences, fisheries manage-ment, horticultural sciences,poultry sciences, range man-agement, and agriculturalsoil conservation.
Sell goods for wholesalersor manufacturers to busi-nesses or groups of individu-als. Work requires substantialknowledge of items sold.
25-1041.00
41-4012.00
BiologicalTechnician
Dietitian orNutritionist
Elementary SchoolTeacher, exceptSpecial Education
Farmer or Rancher
First-LineSupervisors/Managers ofAgricultural Crop or HorticulturalWorkers
Health SpecialtiesTeacher,Postsecondary
Medical or ClinicalLaboratoryTechnologist
Nursing Instructor or Teacher,Postsecondary
Veterinarian
Demonstrator orProduct Promoter
Public RelationsSpecialist
Retail Salesperson
SalesRepresentative,Wholesale orManufacturing,Technical orScientific Products
Wholesale or RetailBuyers, except FarmProducts


121
. . . . . . . . . . . . . . . . . . . . . . . . . . . . . . . . . . . . . . . . . . . . . . . . . . . . . . . . . . . . . . . . . . . . . . . . . . . . . . . . . . . . . . . . . . . . . . . . . . . . . . . . . . . . . . . . . . . .
. . . . . . . . . . . . . . . . . . . . . . . . . . . . . . . . . . . . . . . . . . . . . . . . . . . . . . . . . . . . . . . . . . . . . . . . . . . . . . . . . . . . . . . . . . . . . . . . . . . . . . . . . . . . . . . . . . . .
Donnay, D. A. C., Morris, M. L., Schaubhut, N. A., &Thompson, R. C. (2005). Strong Interest Inven-tory® Manual.Mountain View, CA: CPP, Inc.
Murphy, K. R., & Davidshofer, C. O. (2005). Psycholog-ical testing: Principles and applications (6th ed.).Upper Saddle River, NJ: Prentice-Hall.
References
8402-PDF
1055 Joaquin Road, 2nd Floor Mountain View, CA 94043800-624-1765www.cpp.com