strong market positions - britvic/media/files/b/britvic-v3/documents/pdf/... · strong market...
TRANSCRIPT

1

2
STRONG MARKET POSITIONS
•#1 in UK stills •#1 in UK Licensed On-Premise (with the #1 cola)
•#2 in UK carbonates •#2 in UK Take-Home
The Investment CaseBritvic is a leading branded soft drinks
business in the UK and Ireland
Sources: Canadean UK Soft Drinks Report 2008, AC Nielsen Scantrack UK data 52 weeks to 26th September 2009 & Licensed On Trade UK data to September 2009 Total Coverage MAT
A POWERFUL AND RESILIENT BRAND PORTFOLIO
•#1 or #2 brands in the key categories
•Barriers to entry for entrants looking to replicate scale
AN EVER-EXPANDING RELATIONSHIP WITH PEPSICO
A relationship for 22 years so far5 Pepsi bottling contracts:
•provide enormous scale•an outstanding platform for growth in current and future territories
A STRONG TRACK RECORD
• Top Line
• EBIT
• Earnings
• Free Cashflow
1
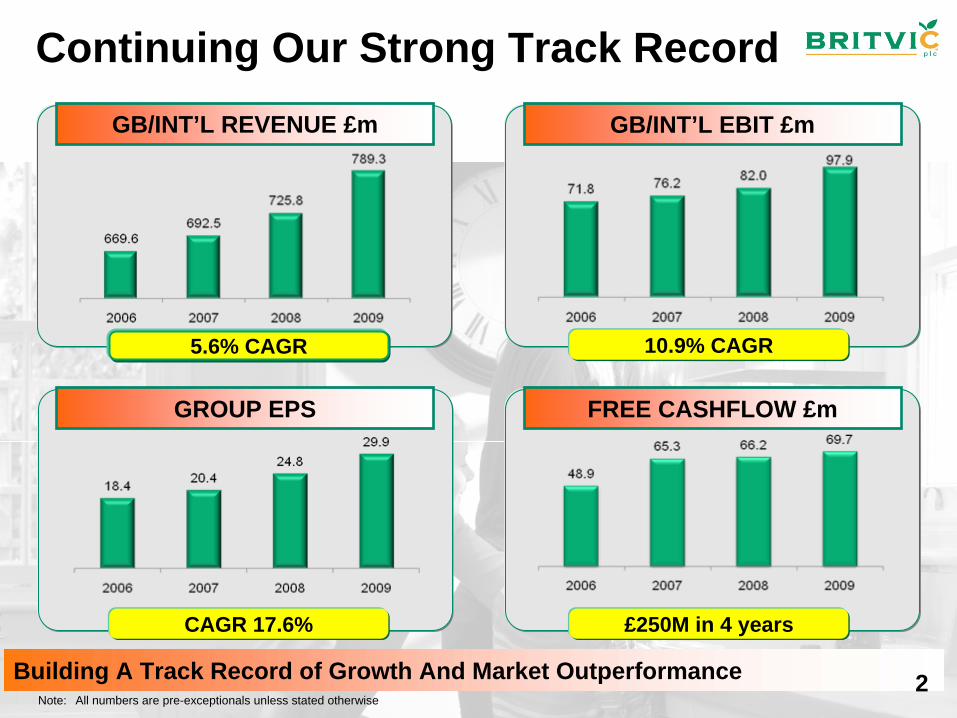
Continuing Our Strong Track Record
Note: All numbers are pre-exceptionals unless stated otherwise
Building A Track Record of Growth And Market Outperformance
GB/INT’L REVENUE £m GB/INT’L EBIT £m
GROUP EPS FREE CASHFLOW £m
5.6% CAGR 10.9% CAGR
CAGR 17.6% £250M in 4 years
2
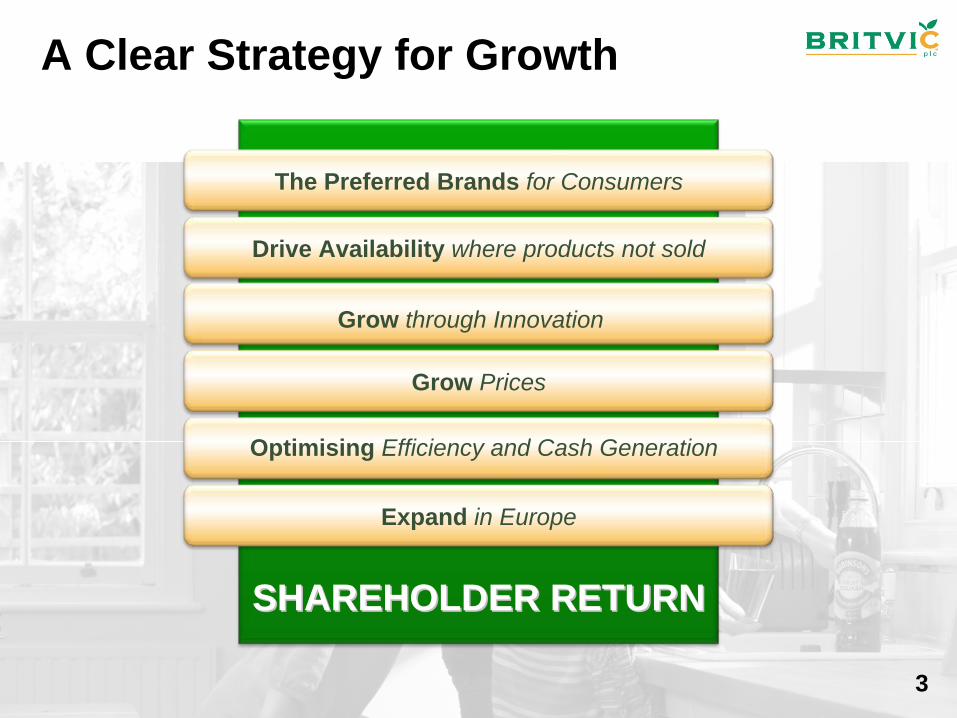
A Clear Strategy for Growth
SHAREHOLDER RETURNSHAREHOLDER RETURN
The Preferred Brands for Consumers
Drive Availability where products not sold
Grow Prices
Expand in Europe
Grow through Innovation
Optimising Efficiency and Cash Generation
3

Competitive Differentiation
Our Breadth of Portfolio A Track Record of Innovation Success
Significant opportunity to grow EBIT margin
A Unique Combination of Owned and Franchised Brands
4

Core GB brands
• # 1 cola in Licensed On-Premise (2)
• # 2 branded cola in take-home (1)
• # 2 global soft drinks brand (3)
• # 2 global lemon/ lime brand (3)
• The fastest growing lemon & lime in the UK (1)
Sources:(1) AC Nielsen Scantrack UK data to September 2009 Total Coverage MAT (2) AC Nielsen Licensed On-Premise UK data to Sept 2009 Total Coverage MAT (3) Canadean UK Soft Drinks Report 2009 (4) AC Nielsen Top 100 Grocery Brands March 2009
• # 5 fruit flavoured carbonate brand by volume in GB take-home (1)
• #1 stills brand in the take-home market (1)
• 10th largest UK grocery brand by value (4)
• # 1 ready-to-drink kids’ stills brand(1)
• Now a £100m retail brand• #1 packaged drink in On-Premise (2)
5
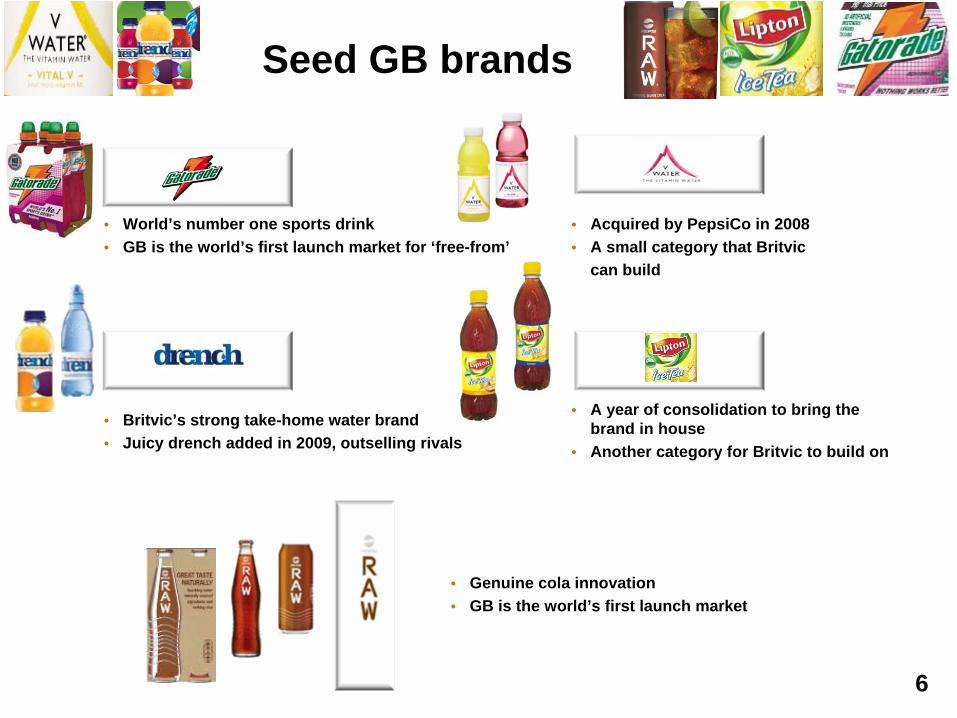
Seed GB brands
• Britvic’s strong take-home water brand• Juicy drench added in 2009, outselling rivals
• World’s number one sports drink• GB is the world’s first launch market for ‘free-from’
• Acquired by PepsiCo in 2008• A small category that Britvic
can build
• Genuine cola innovation• GB is the world’s first launch market
• A year of consolidation to bring the brand in house
• Another category for Britvic to build on
6
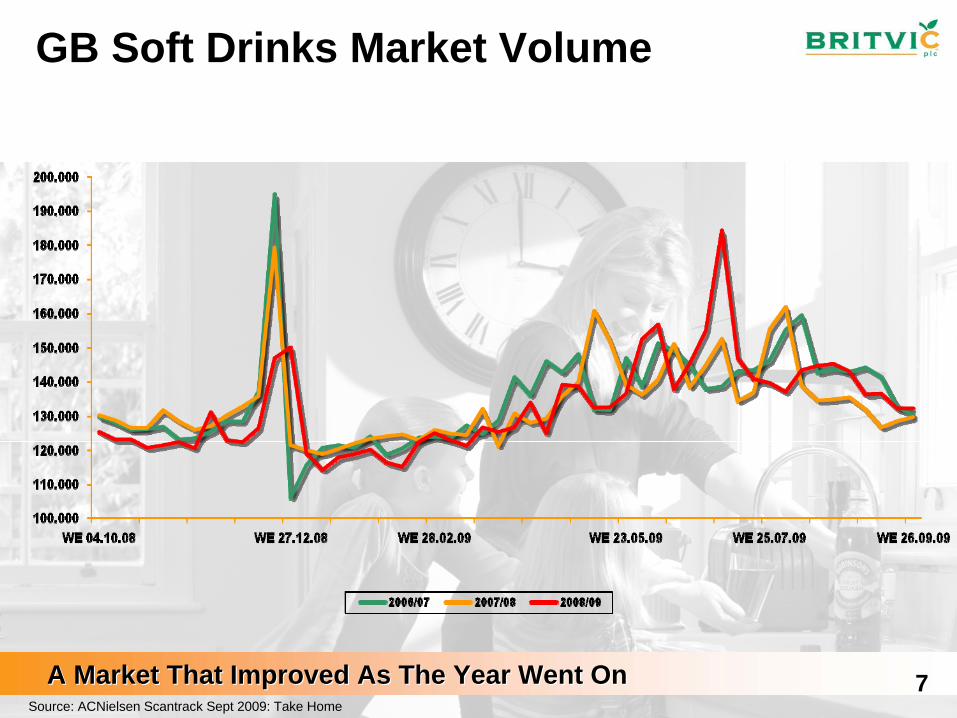
GB Soft Drinks Market Volume
Source: ACNielsen Scantrack Sept 2009: Take Home
A Market That Improved As The Year Went OnA Market That Improved As The Year Went On 7

GB Market Volumes and Growth Rates 52 Weeks
Source: AC Nielsen Scantrack Take Home 52 weeks MAT to 26.09.2009
Big Brands Have Proved Resilient in 2009
3.3%-2.3%
-5.2%5.2%
0.2%-0.6%
-5.2%-1.2%
-3.1%0.5%
4.4%4.9%
1.0%-32.5%
-24.4%
5.4%
0.1%
-3.2%
5.4%
-2.6%
-2.5%
-4.8%
-1.2%
-5.0%3.1%
10.4%
4.1%
1.4%
-7.2%-7.5%
2.6%
7.0%
2.3%
-2.2%-6.9%
-11.9%
8

Group Performance At A Glance
Note: All numbers are pre-exceptionals unless stated otherwise
Another Year Of Strong Top-line Growth And Increased Shareholder Return
Continued revenue growth
+5.6%
EBIT margin
increase
+80bps
EPS continues
to grow
+20.6%
Free cashflow of £70m
+5.3%
Final dividend increase
+23.9%
9

Robust Revenue Growth And A Repeated Focus On Costs
Guidance – 2010
RevenueRevenue•• Innovation Innovation
expected to add expected to add 11--2% to GB 2% to GB revenue in the revenue in the full yearfull year
•• FullFull--year ARP year ARP benefit from Q2 benefit from Q2 2009 price 2009 price increaseincrease
CapexCapex•• GB GB ££4040--££45m45m
•• Operating Operating leases leases ££55--6m6m
•• Ireland Ireland €€8m8mPlus a further Plus a further €€5m for 5m for Business Business TransformationTransformation
CostsCosts•• A&P spend A&P spend
runrun--rate broadly rate broadly similar to 2009similar to 2009
•• Raw material Raw material inflation at 0inflation at 0--1%1%
•• PVO programme PVO programme to deliver another to deliver another ££2m saving2m saving
10

Drivers Of Growth In The Medium Term
Significant Growth Drivers For The Organic BusinessSignificant Growth Drivers For The Organic Business
Market Volume Growth: 2-3%
A Proven Contribution From Innovation
Price & Promotion Drive ARP Up At Least 1%
Significant Distribution Opportunities
11

Group EBIT- Margin Guidance
GB/IntGB/Int’’l l Revenue Revenue
CAGR of 6%CAGR of 6%
New Group New Group EBIT margin EBIT margin
guidanceguidance
Clear topClear top--line line future growth future growth driversdrivers
Average of 50bp Average of 50bp growth p.a. to growth p.a. to 20132013
BritvicBritvic
IrelandIrelandMarket recovery Market recovery in the medium in the medium termterm
12
Summary
A Strong Record Driven by revenue growth
A Resilient MarketShowing Signs of Improvement
Margin GuidanceEnhancement
Clear Drivers of Growth
13
15 14
16
Supplementary Information
15

Strong and Growing Market Positions
Stills (£3.4bn) Carbonates (£2.7bn) Take-Home (£6.1bn)
Carbonates (£1.8bn) Licensed On-Premise (£2.4bn)Stills (£0.6bn)
Source: AC Nielsen Scantrack data to 26 September 2009 & Licensed On-Premise data to September 2009 Total Coverage MAT 16

Flawlessly-Executed Brand Equity
Programmes This Year…
17
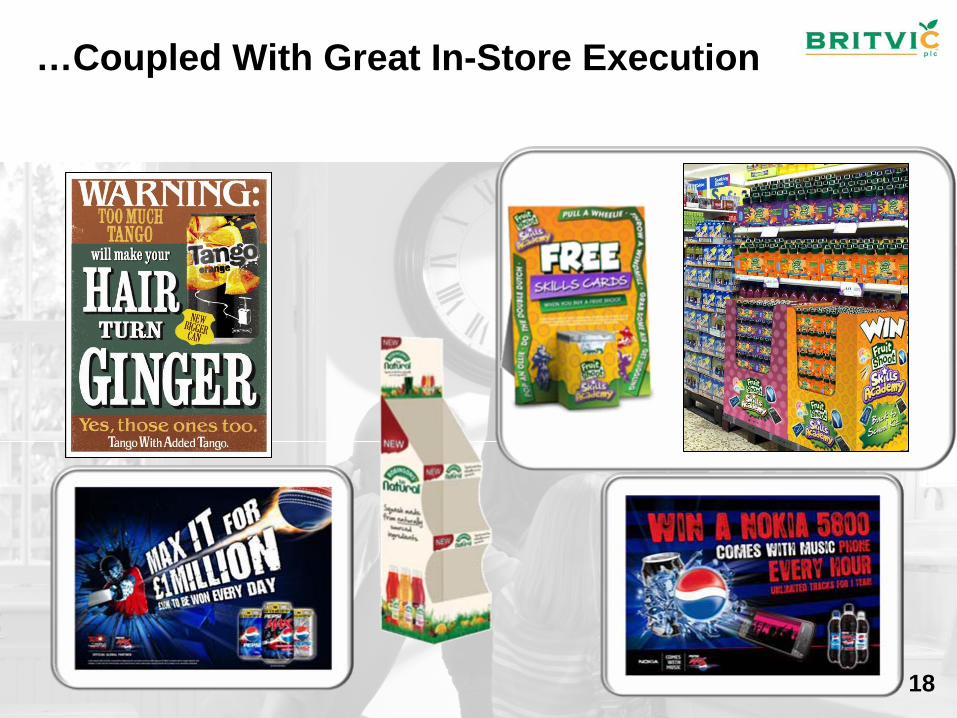
…Coupled With Great In-Store Execution
18
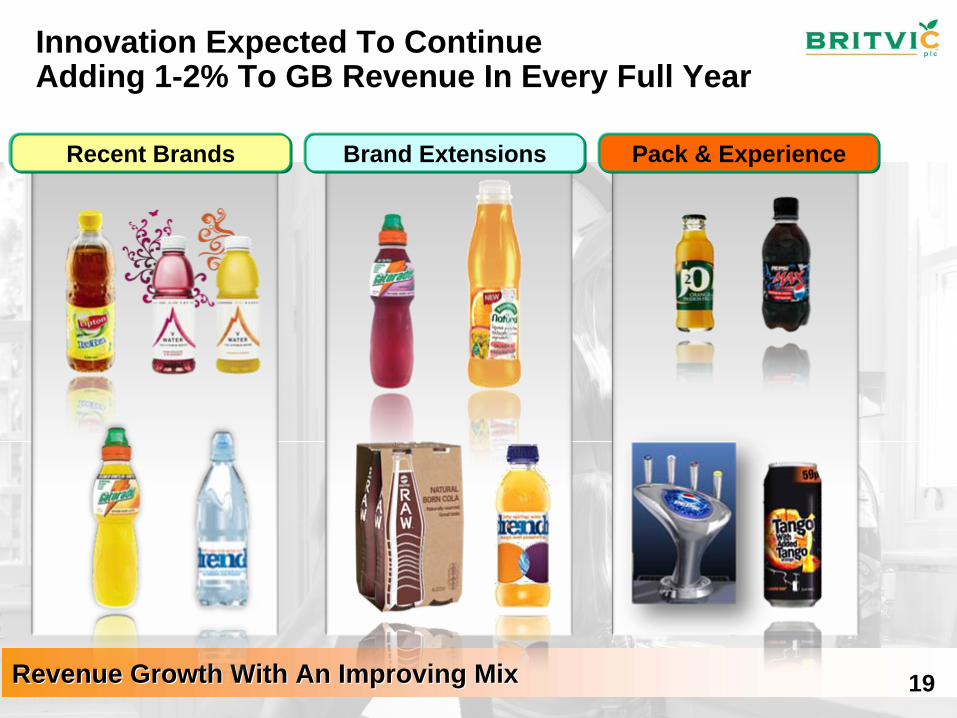
Innovation Expected To Continue Adding 1-2% To GB Revenue In Every Full Year
Revenue Growth With An Improving MixRevenue Growth With An Improving Mix
Recent Brands Brand Extensions Pack & Experience
19

Financial Headlines
FY09£m
FY08£m
%Change
RevenueRevenue 978.8978.8 926.5926.5 5.65.6EBITEBIT 110.1110.1 96.796.7 13.913.9EBIT marginEBIT margin 11.2%11.2% 10.4%10.4% 80bps80bpsProfit after taxProfit after tax 64.264.2 53.053.0 21.121.1
Free cashflowFree cashflow 69.769.7 66.266.2 5.35.3
Adjusted net debtAdjusted net debt (366.4)(366.4) (388.4)(388.4) 5.75.7
Earnings per shareEarnings per share 29.9p29.9p 24.8p24.8p 20.620.6
Dividend per shareDividend per share 15.0p15.0p 12.6p12.6p 19.019.0
Note: All numbers are pre-exceptionals unless stated otherwise EPS and DPS based on the number of issued shares not held by Britvic that are used to satisfy various employee share-based incentive programmes..
Strong Top Line, Improving Margins, Earnings GrowthStrong Top Line, Improving Margins, Earnings Growth20
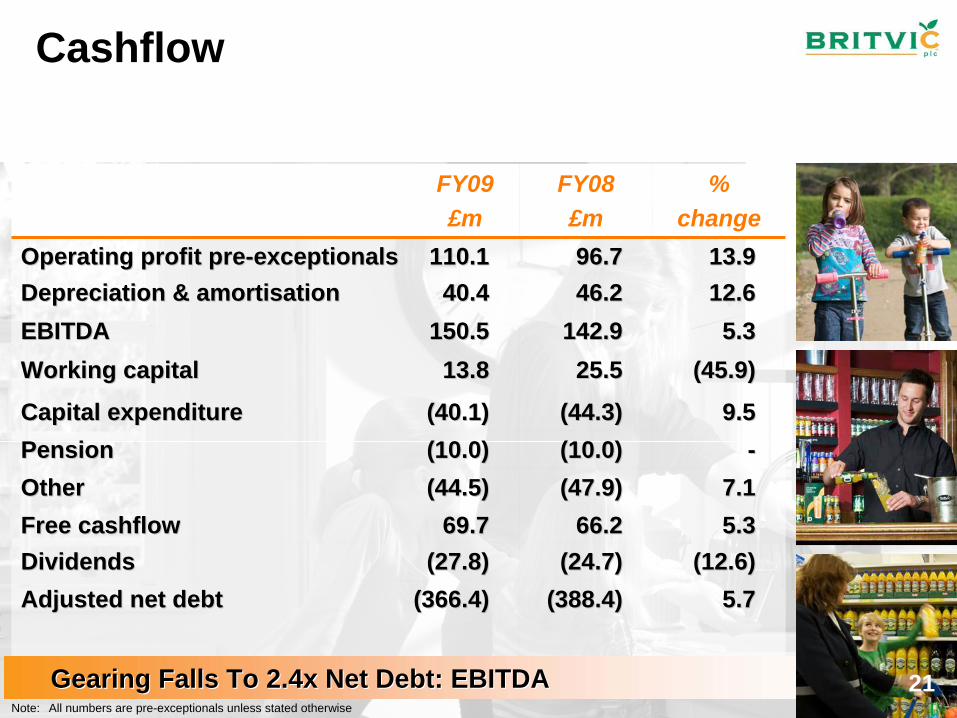
FY09£m
FY08£m
%change
Operating profit preOperating profit pre--exceptionalsexceptionals 110.1110.1 96.796.7 13.913.9Depreciation & amortisationDepreciation & amortisation 40.440.4 46.246.2 12.612.6EBITDAEBITDA 150.5150.5 142.9142.9 5.35.3Working capitalWorking capital 13.813.8 25.525.5 (45.9)(45.9)
Capital expenditureCapital expenditure (40.1)(40.1) (44.3)(44.3) 9.59.5PensionPension (10.0)(10.0) (10.0)(10.0) --OtherOther (44.5)(44.5) (47.9)(47.9) 7.17.1Free cashflowFree cashflow 69.769.7 66.266.2 5.35.3DividendsDividends (27.8)(27.8) (24.7)(24.7) (12.6)(12.6)Adjusted net debtAdjusted net debt (366.4)(366.4) (388.4)(388.4) 5.75.7
Gearing Falls To 2.4x Net Debt: EBITDAGearing Falls To 2.4x Net Debt: EBITDA
Cashflow
Note: All numbers are pre-exceptionals unless stated otherwise
21

Core Brand Review – Carbonates
DoubleDouble--Digit Revenue Growth For Each Of The BrandsDigit Revenue Growth For Each Of The BrandsSources: AC Nielsen Scantrack Take Home 26.09.09 AC Nielsen Brewers data MAT July 09 AC Nielsen total market 05.09.2009 Hall & partners
•The fastest growing cola
•0.7% volume share growth this year
••Now the number 1 Now the number 1 cola in Licensed Oncola in Licensed On-- PremisePremise
•The fastest growing lemon & lime
•1.5% volume share growth this year
••Now the number 1 Now the number 1 lemon & lime in lemon & lime in GroceryGrocery
•Rejuvenation of the brand in 2009
•0.7% volume share growth,
••Consumer Consumer preference up 8%preference up 8%
22

Core Brand Review – Stills
Our Core Stills Brands Have Extended Their Number One PositionsOur Core Stills Brands Have Extended Their Number One Positions
•2.1% volume share growth
•A brand redesign and new pack formats introduced
••The number 1 The number 1 packaged drink in packaged drink in Licensed OnLicensed On--PremisePremise
•0.7% volume share growth
•Relevant innovation with Robinsons Be Natural
••As consumed the As consumed the biggest soft drink in biggest soft drink in the UKthe UK
•0.1% volume share growth
•A brand redesign to engage both mums and kids
••The number 1 kids The number 1 kids consumer brandconsumer brand
Sources: AC Nielsen Scantrack Take Home 26.09.09 AC Nielsen Brewers data MAT July 09 AC Nielsen total market 05.09.2009 Hall & partners
23
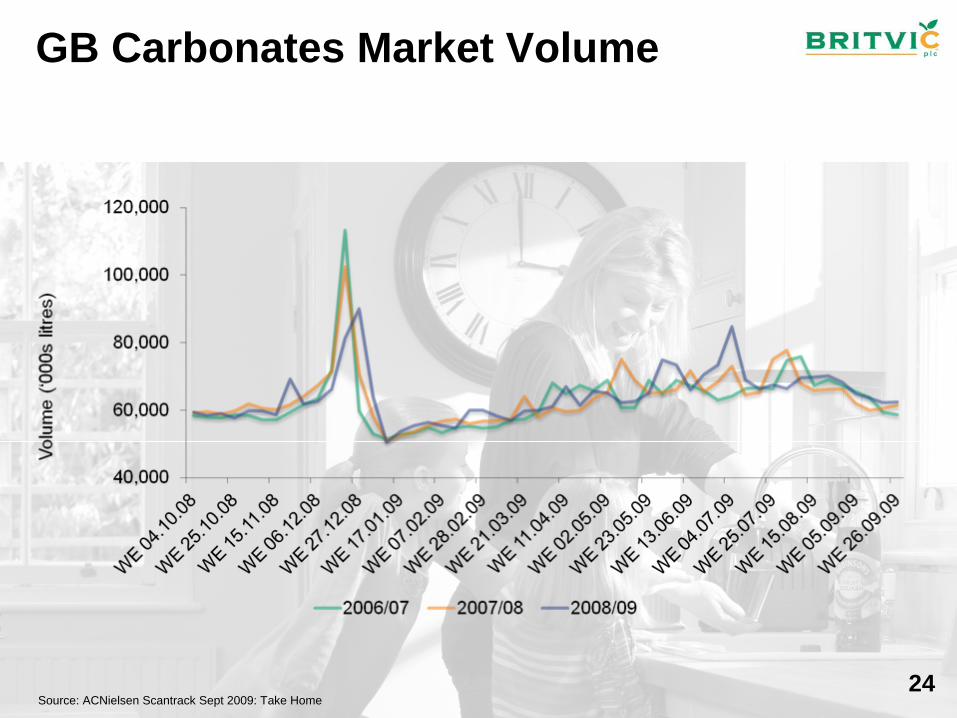
GB Carbonates Market Volume
Source: ACNielsen Scantrack Sept 2009: Take Home24
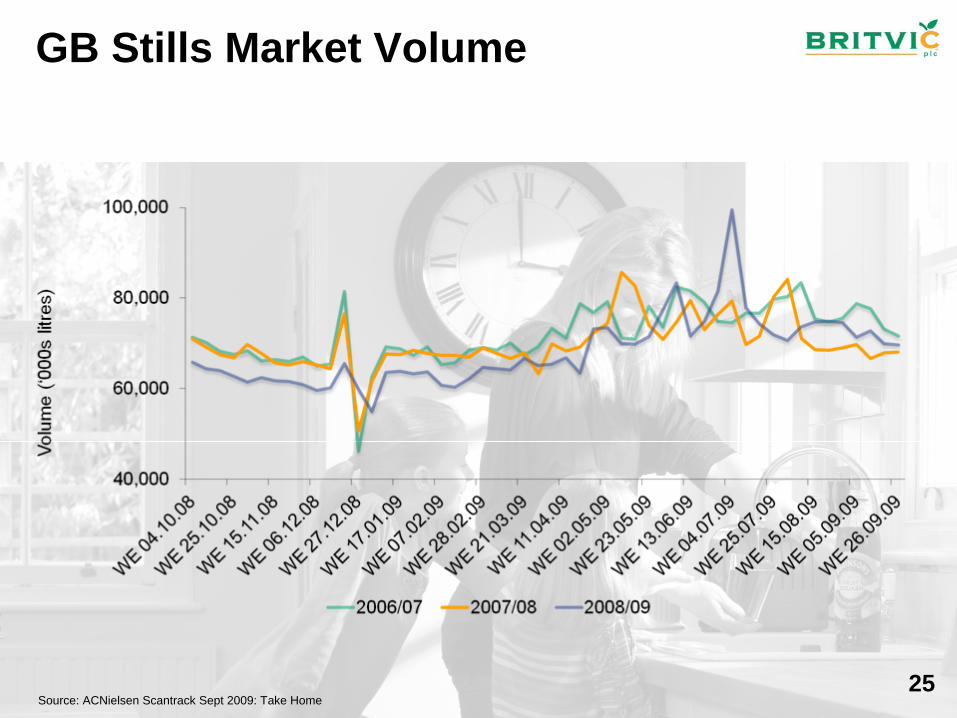
GB Stills Market Volume
Source: ACNielsen Scantrack Sept 2009: Take Home25

Take Home: Stills segment larger but Carbs currently growing faster
1.0 %Fruit Carbs
(5.5)%Plain Water
(1.8)%Stills
(2.1)%Pure Juice
0.7 %Juice Drinks
3.0 %Squash
2.2 %Dairy
(22.2)%Smoothies
(3.2)%Water Plus
4.6 %Sports Drinks
(11.8)%Cold Hot Drinks
1.0 %Total
4.0 %
3.7 %
4.2 %
10.7 %
4.1 %
4.8 %
07-09CAGR
Non Fruit Carbs
Lemonade
Cola
Glucose/Stimulant
Traditional Mixers
Carbonates
1.8 %
(4.5)%
(3.4)%
(5.8)%
0.7 %
5.6 %
3.0 %
(33.1)%
0.7 %
(3.4)%
(14.4)%
(0.3)%
5.7 %
5.1 %
3.5 %
5.3 %
3.7 %
3.8 %
YOY
1.8 %
(4.5)%
(3.4)%
(5.8)%
0.7 %
5.6 %
3.0 %
(33.1)%
0.7 %
(3.4)%
(14.4)%
(0.3)%
5.7 %
5.1 %
3.5 %
5.3 %
3.7 %
3.8 %
YOY
Carbs Stills
Take-Home by Retail Value Sales (£6.1 billion)
Source: AC Nielsen Scantrack data to 26 September 2009 Total Coverage MAT 26
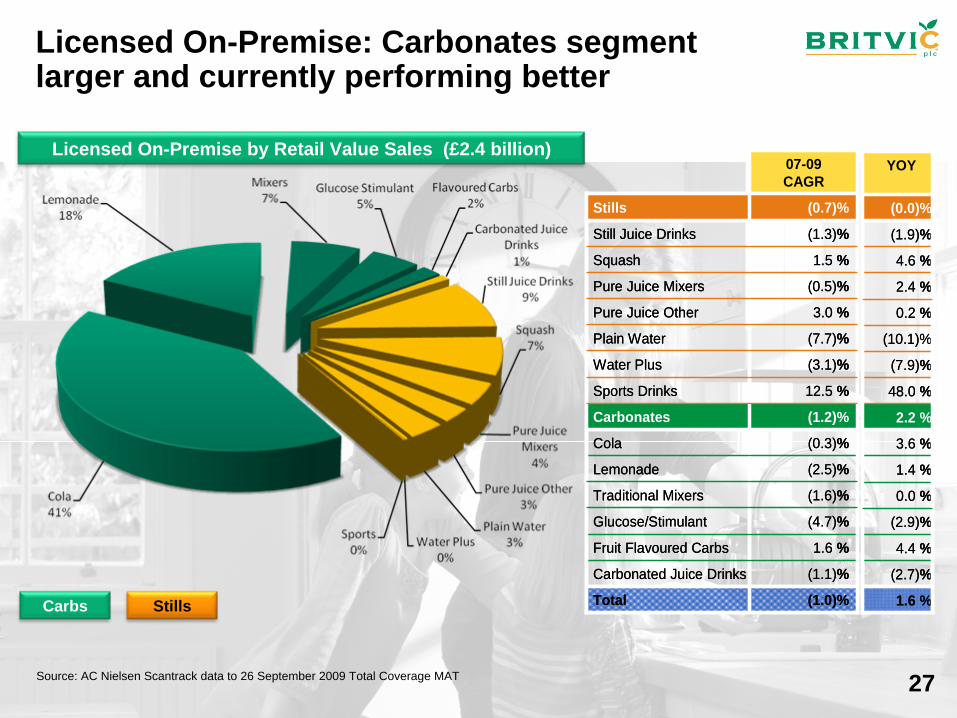
Licensed On-Premise: Carbonates segment larger and currently performing better
(1.6)%Traditional Mixers
(0.5)%Pure Juice Mixers
(0.7)%Stills
(1.3)%Still Juice Drinks
1.5 %Squash
3.0 %Pure Juice Other
(7.7)%Plain Water
(3.1)%Water Plus
12.5 %Sports Drinks
(1.0)%Total
(1.1)%
1.6 %
(4.7)%
(2.5)%
(0.3)%
(1.2)%
07-09CAGR
Glucose/Stimulant
Fruit Flavoured Carbs
Cola
Lemonade
Carbonated Juice Drinks
Carbonates
0.0 %
2.4 %
(0.0)%
(1.9)%
4.6 %
0.2 %
(10.1)%
(7.9)%
48.0 %
1.6 %
(2.9)%
4.4 %
3.6 %
1.4 %
(2.7)%
2.2 %
YOY
0.0 %
2.4 %
(0.0)%
(1.9)%
4.6 %
0.2 %
(10.1)%
(7.9)%
48.0 %
1.6 %
(2.9)%
4.4 %
3.6 %
1.4 %
(2.7)%
2.2 %
YOY
Carbs Stills
Licensed On-Premise by Retail Value Sales (£2.4 billion)
Source: AC Nielsen Scantrack data to 26 September 2009 Total Coverage MAT 27
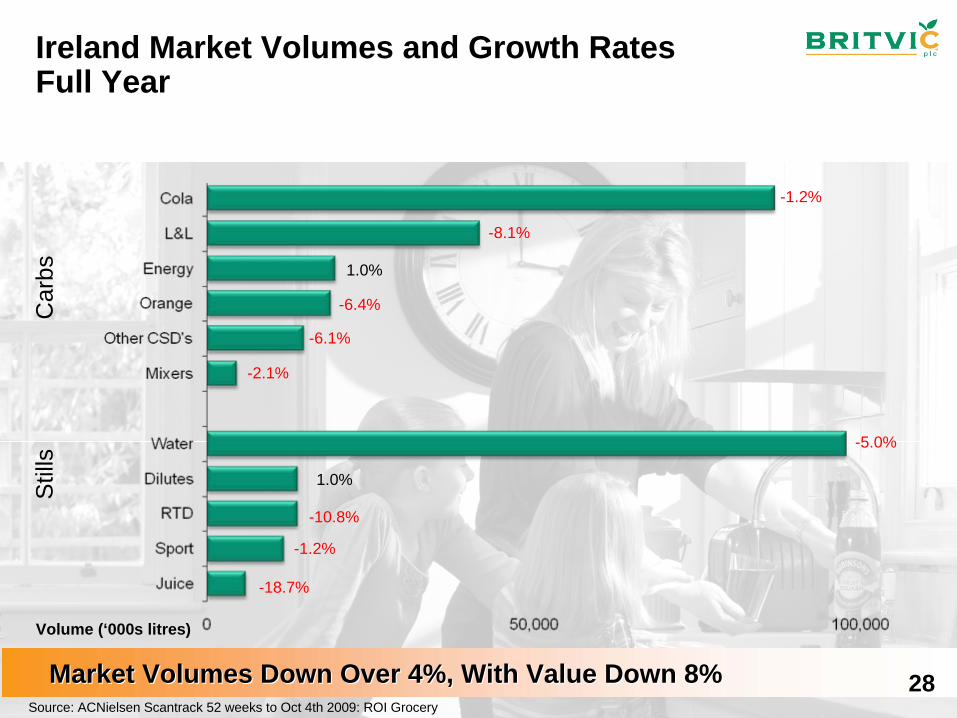
Ireland Market Volumes and Growth Rates Full Year
Market Volumes Down Over 4%, With Value Down 8%Market Volumes Down Over 4%, With Value Down 8%
-1.2%
-8.1%
1.0%
-6.4%
-6.1%
-2.1%
-5.0%
1.0%
-10.8%
-1.2%
-18.7%
Source: ACNielsen Scantrack 52 weeks to Oct 4th 2009: ROI Grocery
Stil
lsC
arbs
Volume (‘000s litres)
28

Irish Market Volume
Source: ACNielsen Scantrack: ROI Grocery
Continuing Caution On The Market OutlookContinuing Caution On The Market Outlook 29
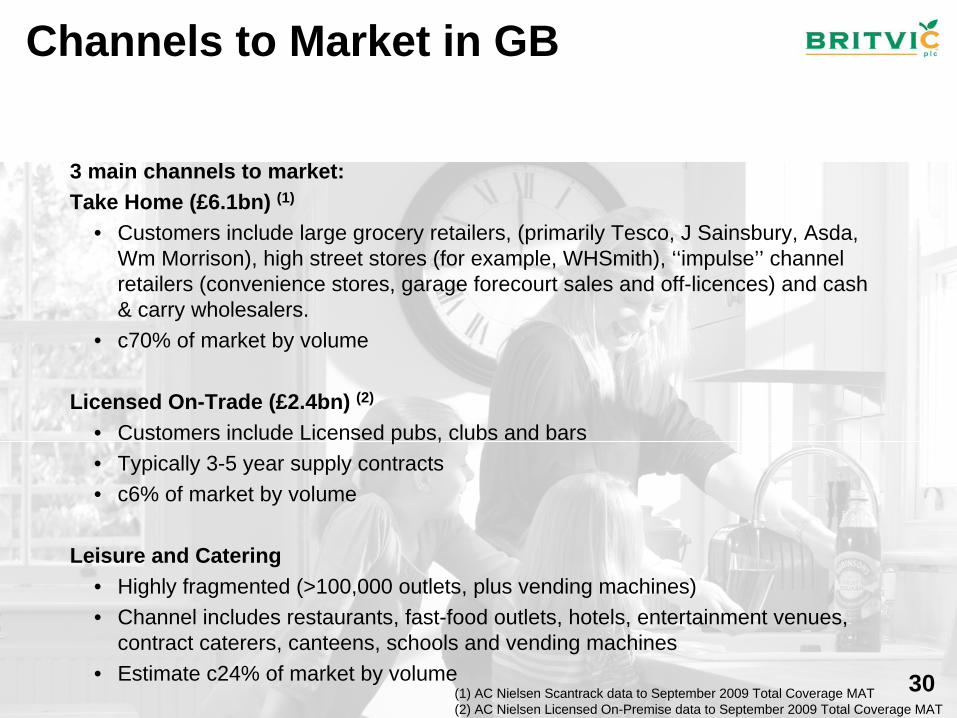
Channels to Market in GB
3 main channels to market:Take Home (£6.1bn) (1)
• Customers include large grocery retailers, (primarily Tesco, J Sainsbury, Asda, Wm Morrison), high street stores (for example, WHSmith), ‘‘impulse’’ channel retailers (convenience stores, garage forecourt sales and off-licences) and cash & carry wholesalers.
• c70% of market by volume
Licensed On-Trade (£2.4bn) (2)
• Customers include Licensed pubs, clubs and bars• Typically 3-5 year supply contracts• c6% of market by volume
Leisure and Catering• Highly fragmented (>100,000 outlets, plus vending machines)• Channel includes restaurants, fast-food outlets, hotels, entertainment venues,
contract caterers, canteens, schools and vending machines• Estimate c24% of market by volume
(1) AC Nielsen Scantrack data to September 2009 Total Coverage MAT(2) AC Nielsen Licensed On-Premise data to September 2009 Total Coverage MAT
30