strong motion estimation and seismic microzoning in...
TRANSCRIPT

Strong Motion Estimation and Seismic Microzoning
in Major Cities in PeruResearch Plan of G1 Group
Japanese members:S. Nakai, T. Sekiguchi, D. Calderon (Chiba Univ.), H. Yamanaka (Titech),H. Arai, S. Koyama (BRI), N Pulido (NIED)
p(Seismic Motion and Geotechnical / SMGT Group)
N. Pulido (NIED)Peruvian members:Z. Aguilar, F. Lazares, D. Luna, L. Chang, P. Peri, R. Piedra (CISMID),H. Tavera, I. Bernal, L. Ocola, J. Gomez (IGP)
1March 15, 2010
Overall Flow Chart of the Project
2

Strong Motion Prediction
3
Fault Model → Deep Soil Structure → Surface Soil Structure
Research Topics of G1 (SMGT) Group
4

Strong Motion Records and Historical Seismicity
1960 01 13 Arequipa, Peru M7.5 1966 10 17 Barranca M8.1 1970 05 31 Chimbote, Peru M7.9 1974 10 03 Lima M8.11974 10 03 Lima M8.1 2001 06 23 Atico M8.4 2007 08 15 Pisco M8.0
2010 02 27 Offshore Maule, Chile M8.8
5
Strong Motion Observation
6

Source Model and Strong Motion Simulation
7
Construction ofSource Model
Strong Motion Simulationby 3D Finite Difference Method
Surface Soil Investigation (1)
New index has to be introduced.
8
Lima, Peru Chiba, Japan

Surface Soil Investigation (2)
Borehole and PS logging will be conducted at several sites to examine the soil profiles and the soil properties of the surface soil.
Borehole PS Logging
Surface Wave Method
In order to estimate the shallow soil profiles, the surface wave method will be conducted, in addition to single point / array microtremor measurements.
Sensor
Surface Waveexcited by Artificial Vibration
S-Wave Velocity Profile
Linear Array
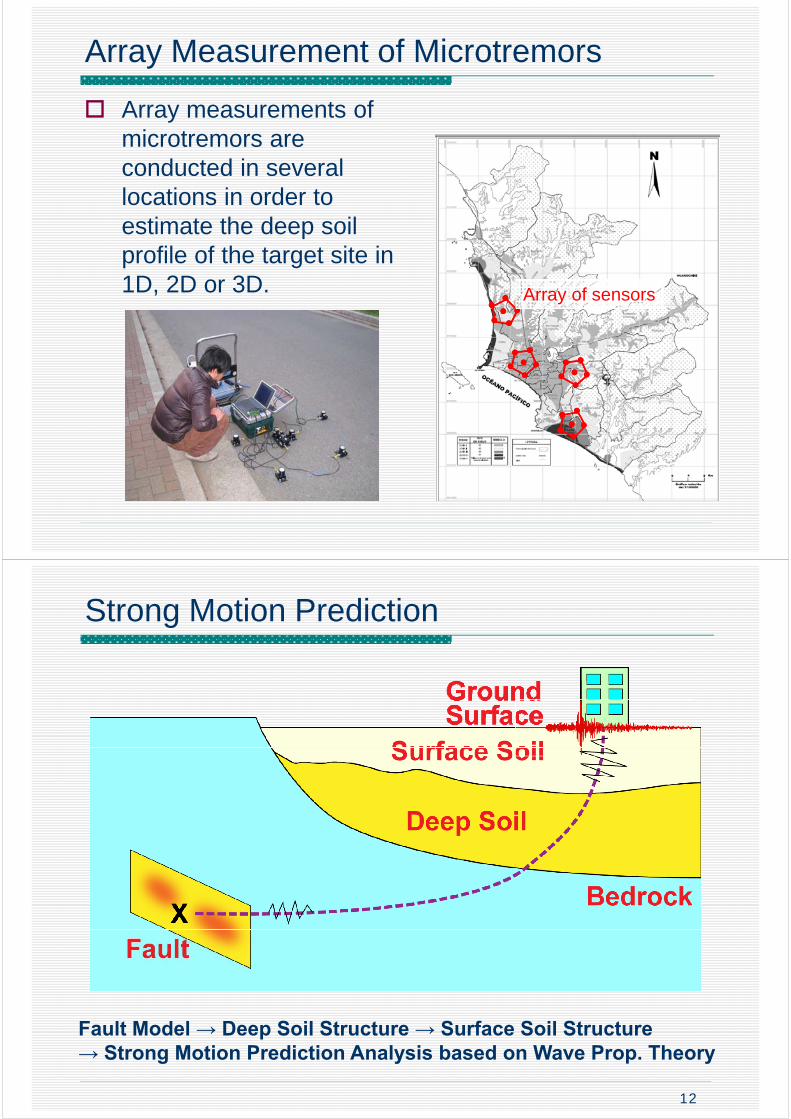
Array Measurement of Microtremors
Array measurements of microtremors are conducted in several l ti i d tlocations in order to estimate the deep soil profile of the target site in 1D, 2D or 3D. Array of sensors
Strong Motion Prediction
12
Fault Model → Deep Soil Structure → Surface Soil Structure→ Strong Motion Prediction Analysis based on Wave Prop. Theory

Prediction of Ground Motions
13
Prediction of Response of Buildings
14

Prediction of Tsunami Run-up
15
Seismic Risk of Slopes
In Lima, there are many steep slopes where houses are densely built.
Ground motion tends to become large due to ground irregularity (slopes),
Densely built houses in Lima
g g y ( p ),which may cause failure or landslide during an earthquake.
Slope failure during EQ

Seismic Microzoning
17
Summary: Research Plans of G1 Group
Construction of fault models for large scenario earthquakes along the subducting plate.
Survey of historical seismic activities.
Strong motion observations by installing seismometers.Strong motion observations by installing seismometers.
Construction of deep and shallow soil models.
Geophysical and geotechnical surveys including borehole and PS loggings.
Surface wave and microtremor measurements.
Analysis of earthquake data from small events.
Construction of microzonation maps.
Strong motion simulation based on fault models and deep/shallow soil models.
Estimation of amplification due to surface soils.
Estimation of slope failure.
18

19
Strong Motion Simulation
Surface layers
surface
Eng. bedrock
Simulation of broadband strong motion on engineering bedrock from different scenario
Seismic bedrockVS3.0km/s
Eng. bedrockVS0.4km/searthquakes in Lima, Pisco and
Arequipa areas using a hybrid approach.
3D FDM in long-period range, and stochastic method using 1D model in short-period range).
20
Short LongCalculation of surface motion considering 1D amplification in surface layers due to input motion on engineering bedrock.

Seismic Observation
Seismic observation is also carried out to examine the effect of surface soils by using the array of sensors in Lima city.
Lima
Mountain
ObservationPoint
Seismometer
10km
Pacific Ocean
S
Ps
Many later phases b b
Use of Converted Wave for Vs-profiling
Station P wave
S waveSurface
V 3 0(k / )
PSp
can be seen between initial P- and S-waves.
Initial P-wave generates P- and S-waves at each i f Th P d S
Interface d
PpPds PpSds Pp Ps
Vp=3.0(km/s)Vs=1.5(km/s)ρ=2.0(g/cm3)H =2.0(km)
Vp=4.6(km/s)Vs=3.0(km/s)ρ=2.5(g/cm3)
interface. The P- and S-waves at surface appear in vertical and radial components. These data are used to obtain deep Vs profile.

Research Plans of SM/GT Group
Fault models for large scenario earthquakes along the subducting plate with cooperation of Tsunami group.Installation of strong motion instruments on ground or BFInstallation of strong motion instruments on ground or BF of buildings (5 locations in Lima at first)Geophysical and geotechnical surveys for shallow and deep S-wave structure including borehole loggingsAnalysis of earthquake data from small events to characterize source, path and site amplificationCalculation of site amplifications for microzonation map
23
Calculation of site amplifications for microzonation map
Estimation of slope failure from geotechnical surveysStrong motion simulation based on hybrid approach of theoretical and empirical methods
Analysis of Small Earthquake Data
Estimation of source characteristics of small events, Q-factor for the crust and mantle, site amplification
Estimation of envelope function of small events for use of stochastic Green’s function
Exploration of deep S-wave velocity profiles using earthquake data, such as receiver function, phase velocity and Rayleigh wave ellipticity
Validation of geological models from geophysical and geotechnical surveys using 1D site amplification or 3D g y g psimulation of moderate events
Examination of applicability of existing attenuation equations

Estimation of Empirical Site Amplification from from Earthquake Data
10
Case for Tokyo areaby Yamanaka (2009)
Site amplification
1
10
TKYH13
Am
plif
ica
tion 103
INVRegression
Qs
0.11 10
TKYH13TKYH12TKY2080TKYH11
Freq (Hz)
102
1 10
Qs=101f0.67
Freq (Hz)Q-value for propagation path in crust and mantle
Inversion of Rayleigh Wave Phase Velocityfor Exploration of Deep Vs Profile
0
1
2
NGT
km
) 2
3
OBSINV
oci
ty (
km/s
)
-2.5
-2
-1.5
-1m)
L7 L6 L5
L4
L3
Find a model that fit observation!Parameterization
2
3
40 1 2 3 4
Dep
th (
Vs (km/s)
0
1
0 1 2 3 4 5
NGT
Ph
ase
velo
Period (s)
-0.5
0
0.5-1-0.500.511.52
NGT
NS
(km
EW (km)
L2
S3
S2
S4
S1(L1)
S7
S6S5
Estimation of amplification with numerical simulation

Joint Inversion of
Phase Velocity and Receiver Function 1
2
Obs.
Inv.
Vel
ocity
(km
/s)
(Kurose and Yamanaka, 2006)
00 2 4 6 8
Pha
se
Period(s)
0 5
1
Obs.Inv.
.
0
2
4
pth
(km
)
-0.5
0
0.5
0 2 4 6 8 10
Ab
s. A
mp
.
Time(s)
6
80 1 2 3 4
De
Vs(km)
Geophysical & Geotechnical surveys
Soil InvestigationBoringLaboratory Test
Surface Wave Method(Short Period Range)
Microtremor measurementSeismic Observation
(Long Period Range)
Soil Structure Model1D, 2D, 3D
Strong motion simulationM d l lid ti ith
Source model
Geological map
28
Seismic Micro ZoningGround MotionLiquefaction
gModel validation with
earthquake data

Seismic Micro Zoning
Seismic Micro Zoning will be improved based on various in-depth surveys.
2 or 3-Dimensional soil structure model will be constructed.
Seismic Hazard Map in Lima(CISMID)
2-Dimensional Soil Structure Model
Seismic Risk of Slopes (2)
It is known that the response due to an earthquake tends to become large at the shoulder of a slope.
-200
0
200
20 30 40 50 60 70
Foot
Acc
. (cm
/s2 )
(s)-200
0
200
20 30 40 50 60 70
Shoulder
Acc
. (c
m/s
2 )
(s)
10
100
er S
pect
rum
0.1
1
0 2 4 6 8 10 12
Ratio = Shoulder / FootShoulderFoot
Fou
ri
(Hz)

Seismic Risk of Slopes (3)
One of the reasons is believed that the surface soil of a slope is “weakened” due to weathering.
The existence of this weakened soil has a negative influence to the seismic risk from various aspects.p
H/V Spectral Ratio
This is another example of the effect of a slope. The results of microtremor measurement are also affected by the slope.
4.2Hz2
Ver
tical
Rat
io
2
Ver
tical
Rat
io
0 3 6 9 12 150
1
Frequency [Hz]
Hor
izon
tal-
to-V
Am
plitu
de R
0 3 6 9 12 150
1
Frequency [Hz]
Hor
izon
tal-
to-V
Am
plitu
de R

Research Plan for Evaluation of Risk of Slopes
The research plan includes:
Select a few target sites in Lima, where houses are densely built.
Collect soil investigation data, if any.Collect soil investigation data, if any.
Conduct soil investigation, if possible.
Conduct a series of microtremor measurements.
Construct soil models and perform finite element analyses.
Evaluate seismic risks of the area with slopesof the area with slopes based on these data along with the results from other groups in this project.