structural acoustics and · pdf filefigure 1: variation of tl with size for single walls size...
TRANSCRIPT

Variation of The Measured Sound Insulation Values ForTest Walls In Two Different Size
S. Kurraa and D. Arditib
a Division of Physical Environment, Fac. of Arch., Istanbul Technical University, 80191 TurkeybDepartment of Civil and Arch.Engineeering, Illinois Institute of Technology, Chicago, IL. 60616 USA
Considering that the size of the test elements is important in the measured TL values by using the two rooms method, the 10 wallsamples composed of various layer configurations with gypsum board, glasswool and airgap, were measured in both small andlarge size openings (11 and 3 m2) in the experimental study. Variation of sound transmission loss with size of the test walls wasinvestigated by comparing the data presented in terms of frequency dependent TLs and the single-number ratings. The statisticalanalysis revealed the significance of size effect, however it depends on the frequency, material type, layer configuration andgapwidth. It was evidenced that the sound insulation values for small-size elements at lower frequencies were higher than that oflarge-size elements while the contrary is valid at mid and high frequencies, for both single and multi-layered walls. This fact isdue to the radiation efficiency which was evidenced by the calculations for the single layered elements, but the effect of thisfactor for the multilayered walls is not welknown theoretically. The RW values vary 1-6 units and max difference was observedfor the double gypsum walls with airgap. The adjustment factors were presented to be applicable for the size-effect on themeasured TLs.
INTRODUCTION
The situational factors influencing the measuredsound transmission levels in laboratory by using ISO140 Part 3, have been evidenced in the previouslitreture [1,2]. Those are mounting conditions of thetest specimens, flanking transmission and penetrationthrough the edges, materials` physical characteristics,niche-depth etc. In this study the effect of the specimensize which is considered to be important especially incomparisons of the measured TLs with those calculatedby neglecting the size of the element (i.e. for infinitesize), was investigated.
Description of the experimental study
The various layer configurations were measured inthe experiment in both large and small size testopenings. The gypsum boards were selected for thispurpose to avoid using the studs and sound bridges. Sound transmission tests are performed according toISO140-3 1995, in three adjacent reverberant chambersin the Riverbank Acoustical Laboratories [3]. Theopening between the first two rooms is 2.74 x 4.27 mand that is where the test specimen is installed, whilethe opening between the other two rooms is 1.22 x 2.43m and is used for smaller test specimens. Between thetest chambers are double walls of dense solid concreteblocks, each 24 cm thick; thus flanking transmission bythe laboratory walls is completely eliminated. Sincecomplete diffusivity was achieved in both rooms, themax.angles of incidence are max 82o for the small-sizeand 87o for the large-size specimens determined fromthe niche-depth. The specimen groups include the
following configurations: 1. Single-layered walls, 2.Double-layered gypsum walls with airgap, 3.Double-layered gypsum walls with fiberglass filling. The differences between the measured TL values ofthe small-size elements (2.96 m2) and the large-size(11.69 m2) samples which will be simply defined assize-effect, were statistically analyzed with respect tothe third-octave bands. The study yielded theadjustment factors applicable to the test results of thesmall-size elements.
Size-effect on the stl values
Size-effect in single gypsum walls: Figure 1 gives themeasured results for the single gypsum board togetherwith the calculated finite size results according toref[4]. Comparison of the sound transmission lossesreveals a large difference at lower frequencies whilethe difference minimizes at higher frequencies. Bothwalls have identical critical frequency (fc) calculated as2550 Hz.The difference in the sound transmissionlosses of the small and large-size specimens can beattributed to the radiation factor, which depends on thewavelength, size of wall, edge effect and wall-type. Asknown from the theories, the radiation factor atfrequencies below the critical frequency is due to thedominant forced transmission and increases with size,hence lowering the transmission loss of the large-sizeelement. For free bending waves which are importantat frequencies higher than fc, radiation efficiency is notdependent on size for homogeneous partitions. Thecalculated TL for single wall in large size conforms thetheory, but the drop at fc is more pronounced.

Figure 1: Variation of TL with size for single walls
Size effect in double layered gypsum walls: Figures 2and 3 give the comparison of TL values for the largeand small-size double-layered gypsum walls with air-gap and glasswool between the layers. As seen, thesmall-size walls yield higher TL values at frequencieslower than 1000 Hz which is almost coincide with thefirst-cross-cavity resonance (fd= 1095) and after thispoint the TLs for large-size walls rise above the small-size TLs up to the critical frequency.
Figure 2. Variation of TL with size for double gypsum wallswith air-cavity
The variation of sound insulation rating (Rw)determined for both test walls are 3 units and 5-6 unitsfor 5 cm and 10cm gap widths respectively, whichimplies that the size-effect is greater with increasinggap width and for double walls. The correctionfunction presented below was obtained as the best-fitcurve after the regression analysis for double wallswith air-cavity (small-large difference):
C (dgypair)= -0.01f + (4e-6) f2– (3.9e-10) f3 + 7.3 (1)
When the airgap is filled with a porous material, thefrequency dependent TL curves reveal similarity to theprevious situation. However the cross-over points
emerge at lower frequencies, i.e., at 300 Hz for wallswith 5 cm gap-width.
Figure 3. TL of double gypsum boards with glasswool in twosize
When regression analysis is performed on themeasured data, the relationship for the best-fit curve isobtained as the following cubic function (small-large):
C(dgyglw)= - 0.01f + (4.8e-6) f2 – (5.5e-10) f3 + 3.5 (2)
On the other hand; a stronger linear relationshipbetween the Rw units were determined for all the smalland large-size specimens:
Rw (small) = 0.95 Rw (large) + 4.65 (r2 =0.9523) (3)
CONCLUSION
� The specimen area is a significant factor onfrequency dependent TL and on Rw units. This fact isrelated to the radiation efficiency which can becalculated by using ref [4] for single walls, but formulti-layered structures, the study is continuing.
� Size-effect is greater for the double and multilayeredwalls rather than the single homogenous walls.
� Size-effect increases with the widening of the airgap.� Size-effect is much pronounced for the double walls
having air in the cavity rather than the glasswoolfilled cavities.
REFERENCES
[1]. ISO 140-3 (1995) Acoustics-Measurement of sound insulation inbuildings and of building elements - Part 3: Laboratorymeasurements of airborne sound insulation of building elements.[2] Guy R.W., and Sauer P., The influence of sills and reveals onsound transmission loss, Applied Acoustics, 17,1984, pp.453-476.[3] S.Kurra and D.Arditi, Computerized Model For CalculatingSound Transmission Loss Through Multi-Layered BuildingElements, Report, IIT/IITRI, 1998[4] Anon., Estimation of acoustical performance of buildings fromthe performance of elements, Part 1, EN 12354-1, April 1999
5
10
15
20
25
30
35
100
125
160
200 250
315
400
500
630
800
1000
1250
1600
2000
2500
3150
4000
5000
frequency, Hz
TL, d
B
large size
small size
calculated as finite
0
10
20
30
40
50
60
125
200
315
500
800
1250
2000
3150
5000
1/3 octav bands,Hz
TL,d
B
5cm aircavity (large)
5cm aircavity (small)
0
10
20
30
40
50
60
125
200
315
500
800
1250
2000
3150
5000
1 /3 octav bands,Hz
TL,d
B
5cm with glasswool(small)5cm with glasswool(large)
The Effect of Vibration of an Absorbent Layer in a Cavity-Backed Structure on Its Acoustic Efficiency
K. Sakagamia, M. Yairib,c, M. Morimotoa, A. Minemurab and K. Andowb
a Environmental Acoustics Laboratory, Faculty of Engineering, Kobe University, 657-8501 Kobe, Japan b Graduate School of Science & Technology, Kobe University, 657-8501 Kobe, Japan
c Kajima Technical Research Institute, 2-19-1 Tobitakyu, 182-0036 Chofu, Japan The bulk vibration of a porous layer in the cavity is known to affect the acoustic performance of multiple-leaf structures. This work presents a simple method to account for the effect. In this method the 'modified' flow resistance (MFR) of the layer is defined as the real part of the parallel impedance in the electro-acoustical equivalent model. The MFR is then used to predict the propagation constant and the characteristic impedance of the material using the appropriate model for sound propagation in rigid-frame porous materials. The method is applied to predict the effect of a porous layer in the cavity of panel absorbers and double-leaf panels on their acoustic properties. The acoustic efficiency of the layer generally decreases at low frequencies. The reduction in the acoustic efficiency is more pronounced in the case of porous materials with high flow resistivity.
INTRODUCTION
Porous absorbent layers are often used in the cavities of multiple-leaf acoustic panels in buildings to improve their acoustic performance, i.e., to enhance the panel absorption, to reduce the sound radiation, etc. The effect of the porous absorbent in the cavity has been studied extensively [1-3]. The bulk vibration of the porous layer can noticeably affect its acoustic performance. Although attempts have been made to consider the bulk vibration using a sophisticated poroelastic model (e.g. [4]), there are still very few case studies available in the literature. The topic, however, is of considerable importance for the acoustic design practice. In addition, such a sophisticated theory might be too complicated to use in practical situations, and a more practical prediction method is required.
In this paper, a simple method is presented to estimate the effect of the bulk vibration of a porous absorbent layer on its acoustic properties. The method is applied to predict acoustic performance of a panel absorber and a double-leaf panel. Some numerical examples are shown to discuss the effect.
THEORETICAL ASSUMPTIONS
The effect of the bulk vibration of a porous layer is
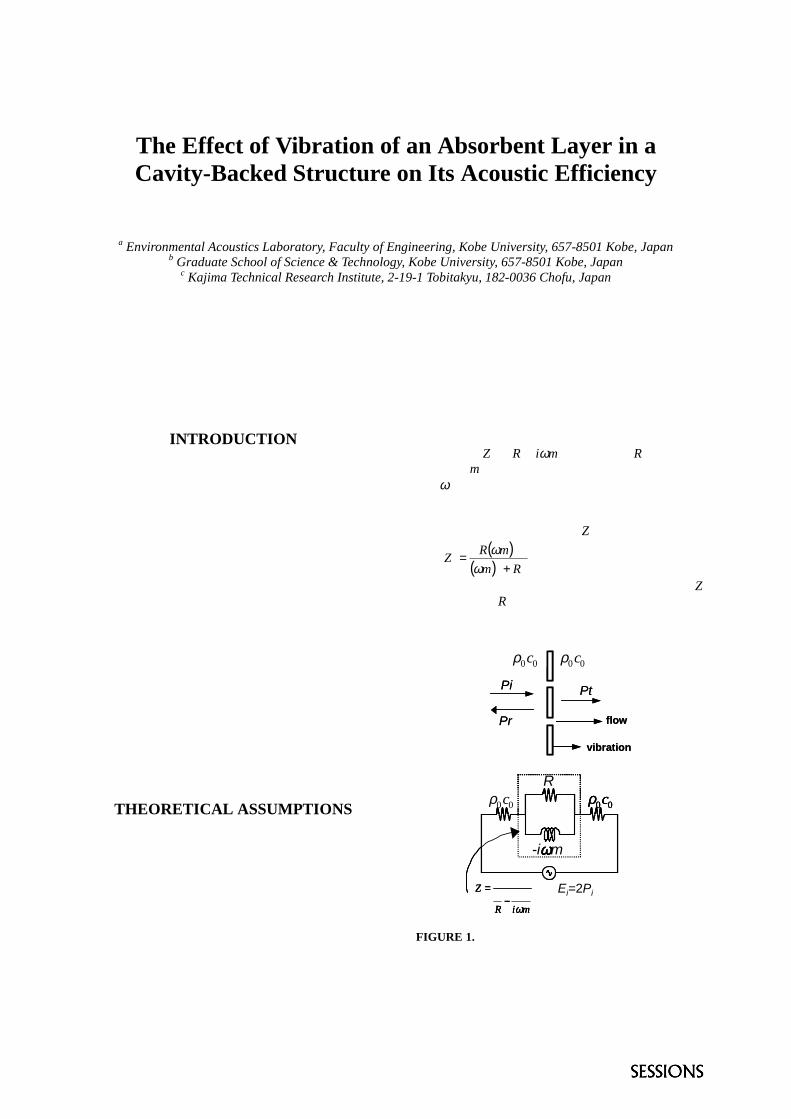
interpreted as an apparent reduction in its flow resistance. Suppose a layer of porous material of infinite extent is vibrating under the incidence of a plane sound wave, as described in Fig. 1 with its electro-acoustical equivalent model. In this model only the mass impedance of the layer is considered.
According to this model, the total impedance of this vibrating porous layer is expressed as a parallel impedance of a resistor (flow resistance in the absence
of the vibration) and an inductor (the mass impedance) of the layer: Z=(1/R-1/iωm)-1 [5], where R is the flow resistance, m is the surface density of the porous layer, with ω being the angular frequency. The model thus relates the impedance to the flow resistance and the density of the porous layer.
The real (resistance) part, Re[Z], is therefore,
( )( ) 22
2
]Re[Rm
mRZ
+=
ωω . (1)
If the layer is of infinite mass (i.e., immobile), Re[Z] corresponds to R. However, it reduces as frequency decreases when the mass is finite. The reduction becomes more pronounced as the layer becomes less
flow
ρ0c0 ρ0c0
vibration
Pt
Pr
Pi
miR
Z
ω11
1
−= Ei=2Pi
ρ0c0
Rρ0c0
-iωωωωm
flow
ρ0c0 ρ0c0
vibration
Pt
Pr
Pi
miR
Z
ω11
1
−= Ei=2Pi
ρ0c0
Rρ0c0
-iωωωωm
miR
Z
ω11
1
−= Ei=2Pi
ρ0c0
Rρ0c0
-iωωωωm
FIGURE 1. The model of a porous absorbent layer under the incidence of a plane sound wave, and its electro-acoustical equivalent model.

1
The Development of New Micro-Perforated Metal Panelwith Wider Absorbing Band
B. Zhang, H. Ding, P. Ge, S. Lang
Beijing Municipal Institute of Labor Protection, Beijing 100054, [email protected]
Micro-perforated panel, as sound absorbing material, has been used for 30 years. However, the use of micro-perforated panel wassometimes not very effective since its absorptive bandwidth is not wide enough yet. The hole diameter of 0.5mm is the smallesthole so far, which is obtained by using usual mechanical method to process a panel of thickness 0.5mm or thicker. Now a newtechnology to produce minor diameter hole has been developed in a metal panel of thickness 0.5mm. The cost to get minordiameter hole using the technology is much lower than laser processing method or electric spark method. A great amount ofmicro-perforated metal panel with hole diameter of 0.3mm has been produced successfully. The measured results in reverberationchamber show that sound absorption coefficient of single layer micro-perforated panel is more than 0.5 in 3~4 octave bands.Micro-perforated panel silencer tests have been made.
INTRODUCTION
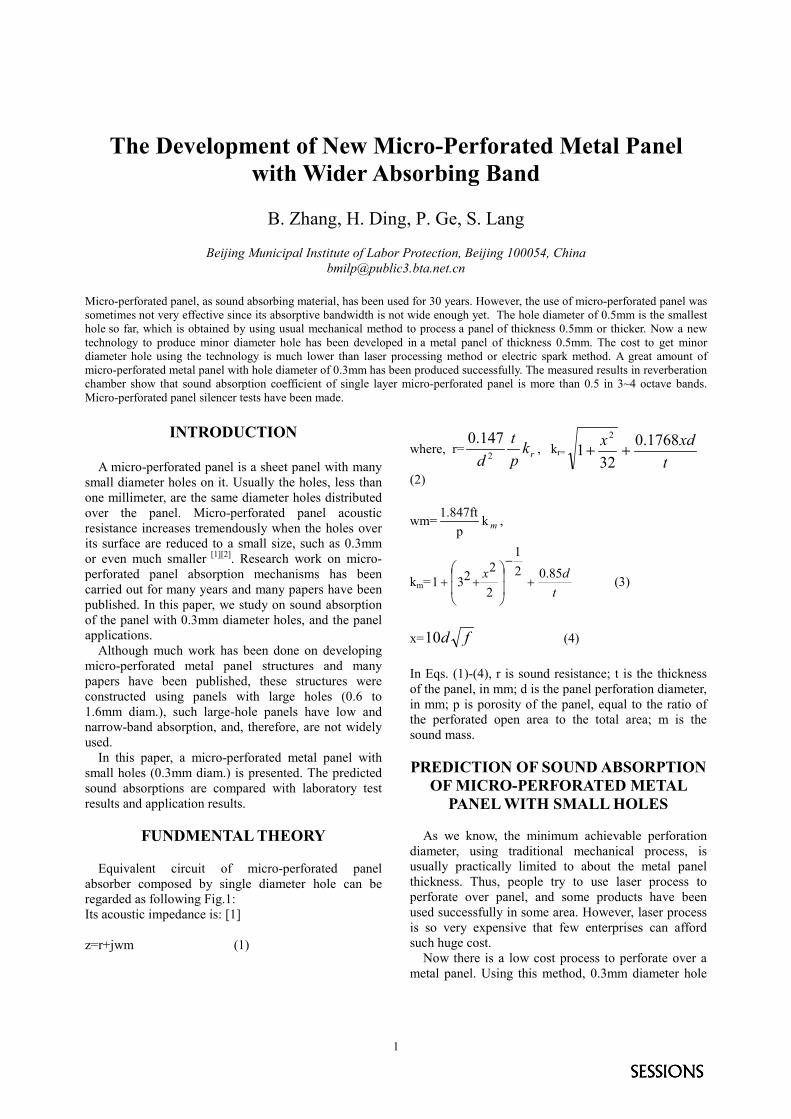
A micro-perforated panel is a sheet panel with manysmall diameter holes on it. Usually the holes, less thanone millimeter, are the same diameter holes distributedover the panel. Micro-perforated panel acousticresistance increases tremendously when the holes overits surface are reduced to a small size, such as 0.3mmor even much smaller [1][2]. Research work on micro-perforated panel absorption mechanisms has beencarried out for many years and many papers have beenpublished. In this paper, we study on sound absorptionof the panel with 0.3mm diameter holes, and the panelapplications.
Although much work has been done on developingmicro-perforated metal panel structures and manypapers have been published, these structures wereconstructed using panels with large holes (0.6 to1.6mm diam.), such large-hole panels have low andnarrow-band absorption, and, therefore, are not widelyused.
In this paper, a micro-perforated metal panel withsmall holes (0.3mm diam.) is presented. The predictedsound absorptions are compared with laboratory testresults and application results.
FUNDMENTAL THEORY
Equivalent circuit of micro-perforated panelabsorber composed by single diameter hole can beregarded as following Fig.1:Its acoustic impedance is: [1]
z=r+jwm (1)
where, r= rkpt
d 2
147.0, kr=
txdx 1768.0
321
2
��
(2)
wm= mkp
1.847ft ,
km=t
dx 85.021
2
2231 �
�
��
�
�
��
�
��� (3)
x= fd10 (4)
In Eqs. (1)-(4), r is sound resistance; t is the thicknessof the panel, in mm; d is the panel perforation diameter,in mm; p is porosity of the panel, equal to the ratio ofthe perforated open area to the total area; m is thesound mass.
PREDICTION OF SOUND ABSORPTIONOF MICRO-PERFORATED METAL
PANEL WITH SMALL HOLES
As we know, the minimum achievable perforationdiameter, using traditional mechanical process, isusually practically limited to about the metal panelthickness. Thus, people try to use laser process toperforate over panel, and some products have beenused successfully in some area. However, laser processis so very expensive that few enterprises can affordsuch huge cost.
Now there is a low cost process to perforate over ametal panel. Using this method, 0.3mm diameter hole
2
can be obtained over 0.5 thickness metal panel.
COMPARISON OF PREDICTED SOUNDABSORPTION TO MEASURED
RESULTS OF MICRO-PERFORATEDMETAL PANEL
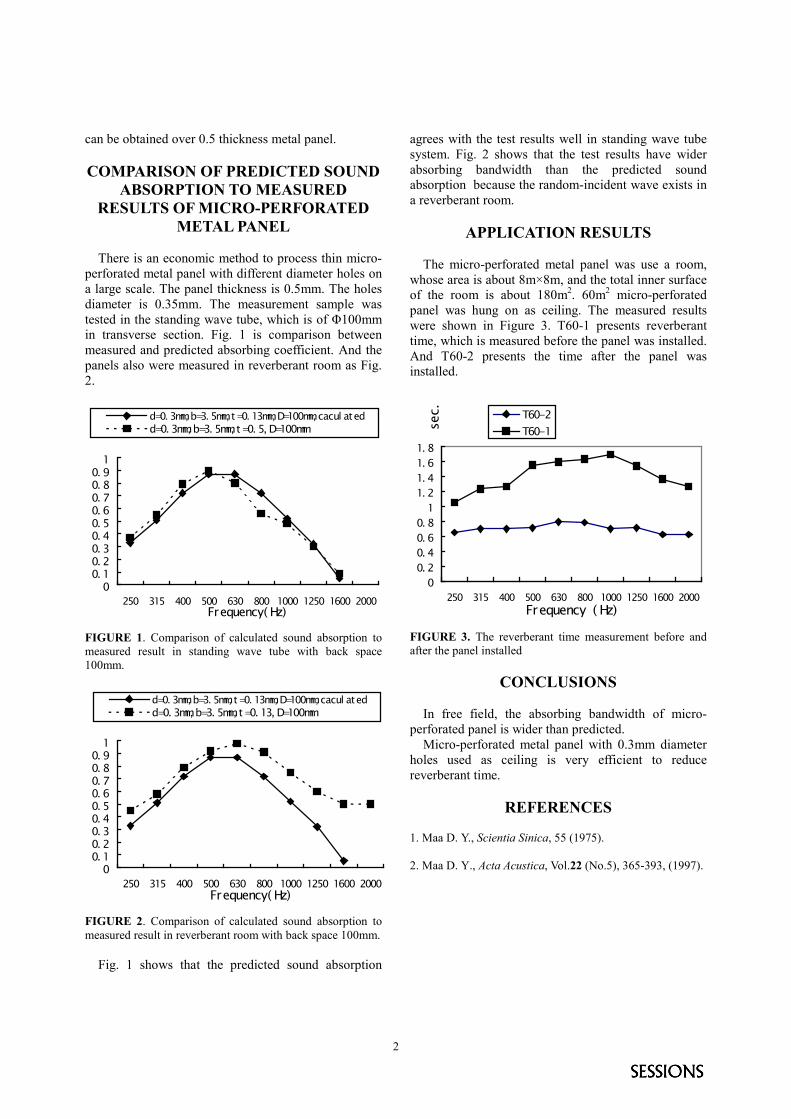
There is an economic method to process thin micro-perforated metal panel with different diameter holes ona large scale. The panel thickness is 0.5mm. The holesdiameter is 0.35mm. The measurement sample wastested in the standing wave tube, which is of Φ100mmin transverse section. Fig. 1 is comparison betweenmeasured and predicted absorbing coefficient. And thepanels also were measured in reverberant room as Fig.2.
00. 10. 20. 30. 40. 50. 60. 70. 80. 9
1
250 315 400 500 630 800 1000 1250 1600 2000Frequency( Hz)
d=0. 3mm, b=3. 5mm, t=0. 13mm, D=100mm, cacul atedd=0. 3mm, b=3. 5mm, t=0. 5, D=100mm
FIGURE 1. Comparison of calculated sound absorption tomeasured result in standing wave tube with back space100mm.
00. 10. 20. 30. 40. 50. 60. 70. 80. 9
1
250 315 400 500 630 800 1000 1250 1600 2000Frequency( Hz)
d=0. 3mm, b=3. 5mm, t=0. 13mm, D=100mm, cacul atedd=0. 3mm, b=3. 5mm, t=0. 13, D=100mm
FIGURE 2. Comparison of calculated sound absorption tomeasured result in reverberant room with back space 100mm.
Fig. 1 shows that the predicted sound absorption
agrees with the test results well in standing wave tubesystem. Fig. 2 shows that the test results have widerabsorbing bandwidth than the predicted soundabsorption because the random-incident wave exists ina reverberant room.
APPLICATION RESULTS
The micro-perforated metal panel was use a room,whose area is about 8m×8m, and the total inner surfaceof the room is about 180m2. 60m2 micro-perforatedpanel was hung on as ceiling. The measured resultswere shown in Figure 3. T60-1 presents reverberanttime, which is measured before the panel was installed.And T60-2 presents the time after the panel wasinstalled.
00. 20. 40. 60. 8
11. 21. 41. 61. 8
250 315 400 500 630 800 1000 1250 1600 2000Frequency ( Hz)
sec. T60-2
T60-1
FIGURE 3. The reverberant time measurement before andafter the panel installed
CONCLUSIONS
In free field, the absorbing bandwidth of micro-perforated panel is wider than predicted.
Micro-perforated metal panel with 0.3mm diameterholes used as ceiling is very efficient to reducereverberant time.
REFERENCES
1. Maa D. Y., Scientia Sinica, 55 (1975).
2. Maa D. Y., Acta Acustica, Vol.22 (No.5), 365-393, (1997).

Non-dissipative Geometric Wide-Band Sound Absorber
F. B. Shenoda
Acoustics Department, National Institute for Standards, Tersa street, El Haram, Giza, Egypt P.O.Box 136, Giza 12211
In this paper, geometric sound absorbers were designed and measured. In these designs, suitable perforated sheets were used together with geometrical arrangements to realize effective sound attenuation in a wide frequency range.
Acoustic Impedance of A Perforated Panel
An orifice was taken early as a short tube. The propagation of sound waves in narrow tubes was treated by Rayleigh [1] and simplified by Crandall [2] for tubes with lengths very short compared to wave-lengths. Assuming that a sound pressure difference ∆p is applied between the ends of the tube and u is the average particle velocity over the tube cross-section, the specific acoustic impedance of the orifice is given by:
( )( )
1
0
12 .1
−
−
−
−−=
∆=
jKJ
jKJtj
u
pZ
JKϖρ
Where: J1 and J0 are the Bessel functions of the first and zero
order. ηωρ 4dK =
For a perforated panel of thickness t, hole diameter d and perforation ratio σ, the specific acoustic impedance Z is given by : jxrZ += , where:
r = specific acoustic resistance = (32 ηt/σρcd2) . Kr x = specific acoustic mass reactance = (ωt/σc). Km
( )[ ] ( )tKdKK r 0442.0321212 ++=
( )[ ] ( )tdKKm 85.05.011212 +++=
−
η = dynamic viscosity constant of air = 1.789 ( 10-5 ) Kg/ms at 20°C ρ = air density = 1.2 Kg/m3 at 20°C c = sound velocity in air = 343 m/s at 20°C
Ordinary Perforated Panel Sound Absorbing Construction
Maa [3] has shown that the sound absorption of a perforated panel depends essentially on the diameter of the perforations. Also he showed that good absorption can only be obtained with micro- perforated panels with sub-millimeter holes. In the present work, the same theory is applied on perforated panels with slightly larger hole diameters 0.5 mm ≤ d ≤ 2 mm. Also, composite construction, in which four perforated panels, separated by air gaps, were connected in series. The four perforated plates have the same d- and t- values, but they have different perforation ratio σ, namely: 0.0014; 0.0049; 0.0105 and 0.0182 for plates A;B;C and D respectively. This construction is theoretically studied and experimentally measured. The studied construction and its equivalent circuit is represented in Figure 1. The computed sound absorption coefficient αn for two constructions are represented in Fig. 2. The comparison between the measured and computed αn for some cases is illustrated in Fig. 3. The comparison shows a fairly agreement.
rD, mD rC, mC rB, mB rA, mA d P t DD DC DB DA ρ0C0
2P
0
0.2
0.4
0.6
0.8
1
0 500 1000 1500 2000
Frequency Hz
Abs
orpt
ion
Coe
ffici
ent
DA=10 cm, DB=4 cm
DC=3 cm, DD=2cm
0
0.2
0.4
0.6
0.8
1
0 500 1000 1500 2000
Frequency Hz
Abs
orpt
ion
Coe
ffici
ent
DA=10 cmDB= 2 cmDC=3 cmDD=4 cm
FIGURE 2. Computed Sound Absorption Coefficient For Different Constructions
RD mD rC mC rB mB rA mA
ZDD
ZDC ZDB ZDA
FIGURE 1. Multiple perforated plate series construction and its equivalent circuit
d = t = 0.5 mm
d = t = 1 mm
d = t = 2 mm
d=t=0.5mm
d=t=2mm
d = t = 0.5 mm
d = t = 1 mm
d = t = 2 mm
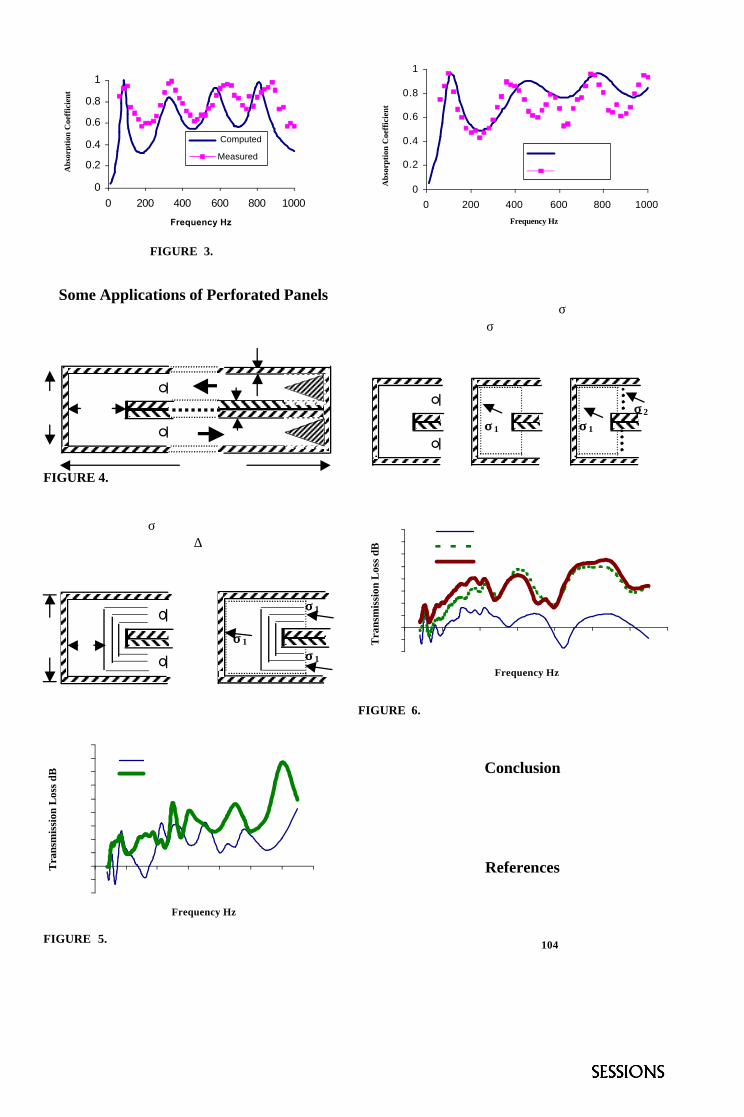
Some Applications of Perforated Panels For this purpose, a rectangular wooden duct was designed, FIG.4. 4 cm L1 33 20 cm cm L2 8 cm 400 cm FIGURE 4. Sketch illustrating the top view of the duct. As a first application, a perforated plate of d1=1 mm, t1=0.75 mm and σ1=0.0034 was used to increase the sound transmission loss ∆L=L1 L2 due to an interference attenuator. The designed and measured cases are shown in FIG.5. σσ 1 33 cm 10 σσ 1 cm σσ 1 Case 1 Case 2
-10-505
1015202530354045
0 200 400 600 800 1000 1200 1400
Frequency Hz
Case 1
Case 2
FIGURE 5. Sound level reduction due to an interference attenuator.
As a second application, two perforated plates were used, namely, d1=1 mm, t1=0.75 mm & σ1=0.0034 and d2=0.47 mm, t2=0.615 mm & σ2=0.006 to increase the sound level reduction of plane sound waves in a right angle rectangular duct. FIG. 6 shows the designed and measured cases. σσ 2 σσ 1 σσ 1 Case 1 Case 2 Case 3
-10-505
10152025303540
0 200 400 600 800 1000 1200 1400
Frequency Hz
Case1
Case 2
Case 3
FIGURE 6. Sound level reduction due to right angle rectangular duct.
Conclusion
It is proved that suitable perforated panels can be applied in different ways to increase the sound attenuation of geometrical sound absorber in a wide frequency range.
References
1. Lord Rayleigh, Theory of Sound, Mc Millan, London, 1894 , pp. 323-487. 2. I.B. Crandall, Theory of Vibrating Systems and Sound, Van Nostrand, New York, 1926, pp. 229. 3. Dah-You Maa, J. of Acoust. Soc. Am. 104, 2861-2866 (1998).
0
0.2
0.4
0.6
0.8
1
0 200 400 600 800 1000
Frequency Hz
Abs
orb
( Computed )
Measured
0
0.2
0.4
0.6
0.8
1
0 200 400 600 800 1000
Frequency Hz
Absorb
Computed
Measured
d=t=1mm
d=t=2mm
FIGURE 3. Comparison between measured and computed sound absorption coefficient DA=10 cm, DB=2 cm, DC=3 cm and DD=4 cm
Abs
orpt
ion
Coe
ffic
ient
Abs
orpt
ion
Coe
ffic
ient
Tra
nsm
issi
on L
oss
dB
Tra
nsm
issi
on L
oss
dB
A Modal Expansion Analysis of Noise Transmission Through Circular Cylindrical Shell Structures With
Blocking Masses
P. Gardonio, N. S. Ferguson and F. J. Fahy
Institute of Sound and Vibration Research, University of Southampton, Highfield, Southampton SO17 1BJ, UK
ABSTRACT
This paper covers the development and application of a Modal Interaction Analysis (MIA) to investigate the plane wave transmission characteristics of a circular cylindrical sandwich shell of the type used in the aerospace industry for satellite launch vehicles. The model has been developed to predict the structural response and transmitted noise when a number of discrete masses are applied to the shell.
The study presented considers a set of cases where blocking masses, having a total weight equal to 8% of the cylinder weight, are attached to the cylinder. The simulations carried out show a substantial reduction of the sound transmission in the frequency range 180 to 353 Hz. The blocking masses act on the shape of the cylinder normal modes and their orientations with respect to the plane of the incident wavenumber vector. In particular, the circumferential re-orientation reduces the coupling between the incident acoustic field and the structural modes of the cylinder. The modification of the structural mode shapes, both in axial and circumferential directions, also reduces the coupling between the cylinder modes and the acoustic modes of the interior.
INTRODUCTION
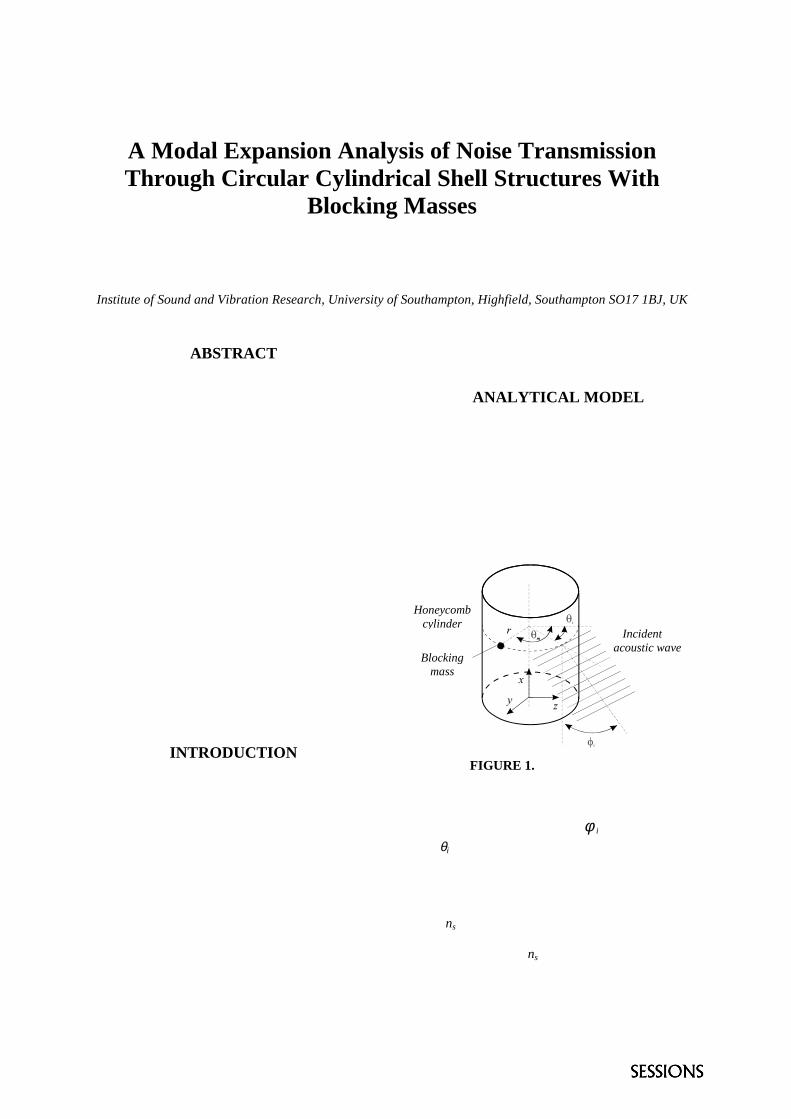
The study presented in this paper considers the acoustic response of a honeycomb cylindrical shell, filled with air, which is externally excited by a plane acoustic wave. In particular, the effects of blocking masses placed on the surface of the cylinder is investigated in order to assess the possibility of reducing the external coupling (acoustic plane wave excitation – cylinder response) and internal coupling (cylinder vibration – cavity response) of the system. The goal is to reduce the sound transmission to the interior of the cylinder. For the purposes of this study a model has been developed which is valid in the low – intermediate frequency range and allows the steady state acoustic response of the cavity to be calculated at
discrete frequencies for harmonic external plane waves of unit amplitude.
ANALYTICAL MODEL
The method used in this study is Modal Interaction Analysis (MIA) [1]. It is based upon a circumferential and axial decomposition of the external noise field, a modal description of the fairing modelled as a honeycomb sandwich cylindrical shell, and a modal description of the interior acoustic cavity. Dissipation and radiation damping of the shell are included and, in addition, one can represent the case when the internal volume is partly filled by a payload.
Incident
HoneycombcylinderFew
apudrofco
acoustic wave
Blockingmass
FIGURE 1. The system studied.
igure 1 shows the idealised model excited by an xternal incident acoustic plane wave having a avenumber vector at an angle φ i to the cylinder axis
nd θi in the azimuthal direction. The blocked ressure field is calculated on the cylinder surface sing a diffraction model. The incident field is ecomposed into a series of cylindrical components elative to each circumferential structural mode of rder ns. Each of these components is a function of requency is termed the ‘scattering coefficient’ for ircumferential order ns. The generalised forces acting n the uncoupled structural modes of the cylinder are

then evaluated. The response of the shell, in terms of the in vacuo structural modes, is calculated and then the response of the interior acoustic cavity, in terms of the uncoupled acoustic modes, is calculated from the shell motion acting at the boundary of the acoustic volume [1].
SIMULATION RESULTS
The noise transmission to the cylindrical cavity has been derived in terms of the noise reduction, which, assuming unit amplitude of the external incident sound field, is given by:
−=tVol
tpLogNR,
210 ),(10)( rω (1)
where ),( tp r is the sound pressure within the
cylinder. The calculations have been performed at discrete frequencies between 0 and 353 Hz. The dimensions and physical properties of the cylinder considered have been selected with reference to a scale model of the payload fairing section of the ARIANE 5 launcher as described in details in reference [1]. The influence on the Noise Reduction has been investigated for an acoustic plane wave incident at an angle of φi=45o to the axis of the cylinder, the results at this angle being indicative of the diffuse field performance.
A detailed analysis of the noise transmission for the cylinder without masses (thin line in figures 2 and 3) has highlighted that poor noise reduction occurs at frequencies where the sound transmission is controlled by both a resonant acoustic cavity mode and a resonant cylinder structural mode that are characterized by a good spatial coupling and an efficient coupling with the external acoustic excitation [1].
For the incident plane wave case analyzed in this study, it has been found that, when a set of blocking masses are aligned on the cylinder surface along the axial direction θm=0o, there is an overall reduction of the coupling effects between the external-internal acoustic fields and the cylinder modes. The solid line of figure 2 shows the noise reduction when a line of 14 equally distributed masses of 1.4 kg each (for a total weight of 20 kg, i.e. 8% of the weight of the cylinder) are attached to the cylinder. Very little effect is achieved below 180 Hz; indeed at very low frequency an increase in the sound transmission, rather than a reduction, is shown. However, above 180 Hz the results are very good and reductions of about 10 dB are found.
This type of reduction is very promising but a question which arises is whether this reduction is due to the modifications of the cylinder mode shapes brought in by the blocking masses or is just due to the increased total mass of the cylinder.
0 50 100 150 200 250 300 350−60
−50
−40
−30
−20
−10
0
10
20
30
40
50
Frequency (Hz)
Noi
se R
educ
tion
(dB
)
FIGURE 2. Noise reduction for the cylinder with 14 masses (solid line) and without masses (faint line).
0 50 100 150 200 250 300 350−60
−50
−40
−30
−20
−10
0
10
20
30
40
50
Frequency (Hz)
Noi
se R
educ
tion
(dB
)
FIGURE 3. Noise reduction for the cylinder with a smeared mass of 20 kg over the cylinder lateral surface (solid line) and without (masses faint line).
The answer to this question is given in figure 3 where the Noise Reduction for the cylinder with a smeared mass over the surface equal to 20 Kg, which is the total weight of the 14 block masses is shown. From this plot it is evident that, by smearing the equivalent total weight of the block masses over the surface of the cylinder, very little benefits are achieved. Therefore the reductions shown in figure 1 are indeed due to the modifications of the cylinder mode shapes which produces less efficient excitation of the structure and a less efficient weak-coupling between the structural and acoustic modes.
REFERENCES
1. P. Gardonio, N. S. Ferguson and F. J. Fahy, J. Sound and Vibration, 244(2), pp 259-297.

Development of Hybrid Type Vibration Power Flow Analysis Method
Young-Ho Park , Suk-Yoon Hong and Ho-won Lee
Department of Naval Architecture and Ocean Engineering, Seoul National University ,Seoul, Korea
This paper propose a hybrid method for vibration analysis in the medium to high frequency ranges using PFA algorithm and SEA coupling concepts. The main part of this method is the application of coupling loss factor(CLF) of SEA for the power transmission, reflection coefficients in boundary condition of PFA. The developed hybrid method shows very promising results compared to the classical PFA for the various damping loss factors and in the wide ranges of frequencies. Furthermore this paper presents the applied results of Power Flow Finite Element Method(PFFEM) by forming the new joint element matrix with CLF to analyze the various plate structures in shape. The analytical results of automobile, complex plate structures show good agreement with those of PFFEM using the PFA coefficients.
INTRODUCTION
Power Flow Analysis(PFA) is understood to be a reliable method at medium to high frequency ranges. Though PFA has remarkable advantages than other methods(FEM, SEA and so on), related information for the various structural elements is insufficient since PFA research is in the beginning stages. This thesis presents the algorithm for the use of coupling loss factor(CLF) in boundary condition of PFA and analyzes numerically with the practical example to evaluate its validity. Formulation using CLF in boundary condition of PFA is developed to cover the flexural, longitudinal and shear waves in plates, and has been proved to be valid by numerically analyzing the coupled plate structures in the same and at an arbitrary angle. In addition, this thesis has developed new joint element matrix using CLF to extend the application area into complex plate structures by Power Flow Finite Element Method(PFFEM), and analyzes numerically the open box-type structures to evaluate its validity. Finally, the energy density and intensity of automotive structures has been successfully predicted by PFFEM.
DERIVATION OF BOUNDARY CONDITION USING SEA
PARAMETERS
If the vibrational response of homogeneous isotropic two-dimensional structural component, such as plate,
is considered to be a linear superposition of plane wave components, then the displacement w at some
position ( )21 xxx= can be expressed as
( ) ( ) )1(.)(2
0�+−=
π ωθ θθ deAxw tixnki
Here, ω is vibration frequency, k is the wavenumber.
( )θA is the complex amplitude of the wave with
heading θ , and ( ) ( )θθθ sincos=n . The kinetic
energy density associated with equation (1) under the conditions such as uncorrelated wave components or local spatial averaging may be written as
( ) ( ) ( ) ( ) ( ) )2(4/2
0
/2
�•−=
π θηω θθρωθ defT xncg
where ρ is the mass of component per unit area, η is
the loss factor and gc is the group velocity. The total
energy density ( )xe will approximately be ( )xT2 in
reverberant wave field. The intensity of an individual
plane wave in the propagation direction is equal to gc
times the energy density; if it is assumed that the various wave components are statistically independent, then the relation of the total intensity and the gradient of the total energy density can be written in the form of below;
( ) )3(./2 ecI g ∇−= ηω

In considering two two-dimensional structural components which are coupled along a common edge, the total energy flow per unit length at some point on the coupling boundary may be expressed in the form
)4(121112 nInIP ⋅=⋅=
where 1n represents the outward pointing normal for
component 1, and 1I and 2I are the wave intensities
in the two components. The energy flow may also be expressed in terms of the wave transmission coefficients of the boundary. For instance, the energy which flows from component 1 to component 2 per unit length of the boundary may be in terms of the
wave transmission coefficient ( )θτ 12 in case 0=η
and ( ) =xe constant as
( ) ( )( )( )� ⋅
×=
θθθθθτ
π
)5(.sincos
2/
112
1112
dn
xecp g
The integral over θ yields twice the diffuse wave
field transmission coefficient 12τ , and thus
equation (5) may be written in the form
( ) ( ) )6(/ 112112 xeLSp ηω=
( ) )7(/ 112112 SLc g πωτη =where 1S is the surface area of component 1, L is the
length of the boundary and 12η is the coupling loss
factor(CLF) known for a wide range of structural
junctions in SEA. The total energy flow 12P is given
by 2112 pp − , where 12p is given by the equivalent
of equations (6),(7). Equations (3),(4) and (6) thus lead to the following boundary conditions :
( )( )
( ) [ ] )8(./
/
/
22121121
1222
2
1112
1
eSeSL
nec
nec
g
g
ηηωηω
ηω
−=
⋅∇−=
⋅∇−
The expanded boundary conditions including in-plane wave as well as flexural wave may be written as by the same algorithm as
( )( ) [ ] )9(/
/
,,22121121
11121
�=
−=
⋅∇−
slfnnnmmmnm
mmmg
eSeSL
nec
ηηω
ηω
( )( ) [ ] )10(/
/
,,22121121
1222
2
�=
−=
⋅∇−
slfnnnmmmnm
mmmg
eSeSL
nec
ηηω
ηω
where the range of an index m is f,l,s(flexural, longitudinal and shear respectively).
For vibrational analysis of complex plate structure using this algorithm, the classical joint element matrix of PFFEM has to be modified matrix that includes SEA parameter(coupling loss factor).
COMPUTATIONAL EXAMPLES
PFA of Plate Structures Coupled at an Arbitrary Angle Using CLF
PFFEM of Open Box-Type Plate Structure
PFFEM of Automotive Model
CONCLUSION
The hybrid formulation using SEA parameter in boundary condition of PFA has been developed to apply the plentiful junction�s information of SEA to PFA. The validity of this new algorithm has been proven by analyzing numerically the plate structures coupled at an arbitrary angle. The computational results show good agreement with those of PFA as damping loss factor decreases. In addition, new joint element matrix using CLF has been developed to extend the application area into complex plate structures by PFFEM. The energy density and intensity of automobile have been successfully predicted by PFFEM using CLF of SEA.
Influence of Hand Dynamics on the VibrationTransmissibility Characteristics of a Suspended Handle
P.-É. Boileaua, T. Loyaub, R. Oddoc and J. Boutina
aInstitut de recherche Robert-Sauvé en santé et en sécurité du travail (IRSST), Montréal, CanadabInstitut national de recherche et de sécurité (INRS), Nancy, France
cGroupe d’acoustique de l’Université de Sherbrooke (GAUS), Sherbrooke, Canada
The influence of the hand-arm system dynamics on the acceleration vibration transmissibility characteristics of a suspendedhandle subjected to a random acceleration excitation in the 10 to 500 Hz frequency range is investigated under different values ofgrip and push forces. Increasing the push force over the range 0 to 80 N is observed to result into increased damping within thesuspended handle acceleration transmissibility response function, while increasing the grip force over a similar range results inboth increased damping and stiffness of the system combining the handle and the hand-arm. By representing the handle with amass-spring system and the hand-arm with a four degree-of-freedom free impedance model as defined in the ISO 10068 standard,the results of the simulation are observed to provide a good agreement with the acceleration transmissibility response functionmeasured while using a 50 N push force and a 50 N grip force.
INTRODUCTION
The hand-arm system dynamics has been thoroughlyinvestigated in terms of the driving-point mechanicalimpedance response function. The response of thehand-arm grasping a handle is known to depend onseveral factors including the direction of application ofthe vibration, the geometry of the handle, the push andgrip forces exerted, the posture and the anthropometriccharacteristics of the subjects holding the handle, etc. The ISO 10068 standard [1] defines the range ofmost probable hand-arm mechanical impedance valuesapplicable when the handle diameter is between 19 and45 mm, the grip force is within the 25 to 50 N range,the push force is below 50 N, the position of the arm isoriented along the axis of the handle and the vibrationacceleration excitation is below 50 m/s2. Furthermore,the Standard defines different configurations of lumpedparameter models to represent the hand-arm system. Although there have been several investigations tostudy the response of the hand-arm system alone, fewstudies have actually set out to investigate thecombined hand-arm – suspended handle responseunder controlled conditions. In this study, the influenceof grip and push forces on the accelerationtransmissibility characteristics of a suspended handle isinvestigated and the applicability of a hand-armimpedance model to account for hand dynamics onsuch a handle is further assessed.
MATERIAL AND METHODS
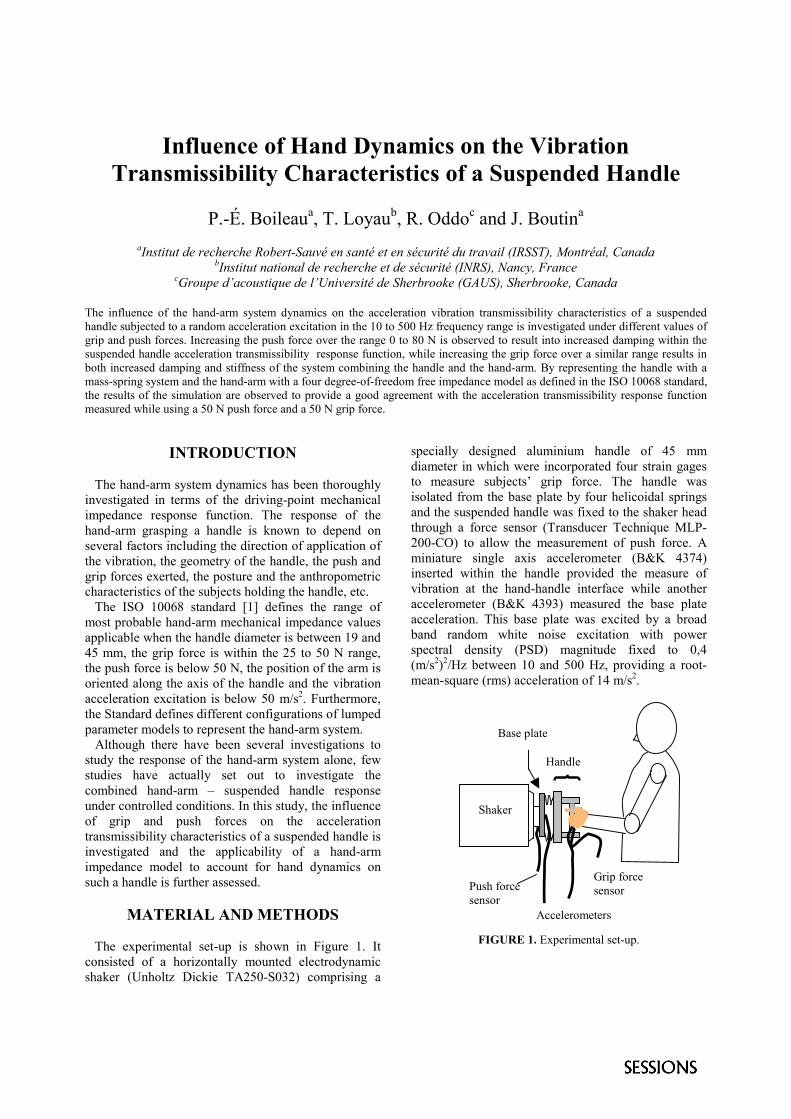
The experimental set-up is shown in Figure 1. Itconsisted of a horizontally mounted electrodynamicshaker (Unholtz Dickie TA250-S032) comprising a
specially designed aluminium handle of 45 mmdiameter in which were incorporated four strain gagesto measure subjects’ grip force. The handle wasisolated from the base plate by four helicoidal springsand the suspended handle was fixed to the shaker headthrough a force sensor (Transducer Technique MLP-200-CO) to allow the measurement of push force. Aminiature single axis accelerometer (B&K 4374)inserted within the handle provided the measure ofvibration at the hand-handle interface while anotheraccelerometer (B&K 4393) measured the base plateacceleration. This base plate was excited by a broadband random white noise excitation with powerspectral density (PSD) magnitude fixed to 0,4(m/s2)2/Hz between 10 and 500 Hz, providing a root-mean-square (rms) acceleration of 14 m/s2.
FIGURE 1. Experimental set-up.
Base plate
Handle
Shaker
Push forcesensor
Accelerometers
Grip forcesensor

RESULTS
Without the influence of the hand, the peakamplitude of the handle vibration transmissibility,representing the acceleration ratio of the frequencyspectrum of the vibration on the handle to that on thebase plate, was found to be equal to 32 at a frequencyof 68 Hz, thus representing the resonant frequency ofthe handle. The effect of grasping the handle with aconstant grip force set to 20 N while varying the pushforce from 0 to 80 N is shown in Figure 2. Clearly, theinfluence of the hand occurs within the resonantfrequency range of the handle, where an increase inpush force results in increased attenuation of thevibration being transmitted to the handle. By varyingthe push force from 20 to 80 N, the peaktransmissibility amplitude can be reduced by half. Thusthe hand-arm system is seen to provide additionaldamping in the handle; the effect being morepronounced as the push force is increased. In comparison, the influence of the grip force isshown in Figure 3 for the case involving a constant 50N push force and grip forces varying from 0 to 100 N.Again the hand-arm system is seen to introduceconsiderable attenuation of the vibration beingtransmitted to the handle where increased grip forceresults in increased attenuation of the peaktransmissibility amplitude and possibly also, in a shifttowards higher resonant frequency. These results thussuggest that with increased push and grip forces, thehand-arm system can introduce additional damping andstiffness in the suspended handle system.
Simulations were further performed to assess thevalidity of the four-degree-of-freedom hand-armimpedance model defined in the ISO 10068 standard toaccount for hand-arm dynamics on the suspendedhandle. For that purpose, the handle was representedby a mass-spring system which was combined with the
4 DOF mass-spring-damper system defined in thatStandard. By assuming a linear single DOF model forthe handle, its stiffness was determined from themeasured transmissibility response of the free handle,for which the mass had been measured to be 1.4 kg.The results of the simulations with and without thehand are shown in Figure 4 for the case involving a50N push force and a 50 N grip force. These resultsindicate that the damping provided by the hand can beadequately accounted for by the hand-arm impedancemodel considered.
CONCLUSION
The extent to which hand dynamics influences thehandle response depends on grip and push forces andthe effect is well accounted for by a 4-DOF hand-armimpedance model defined in the ISO 10068 standard.
REFERENCE
1. ISO 10068 Standard, Mechanical vibration andshock-Free, mechanical impedance of the hand-arm system at the driving point.
FIGURE 2. Influence of push force onhandle transmissibility (grip force = 20 N)
FIGURE 3. Influence of grip force on handletransmissibility (push force = 50 N).
012345678
10 30 50 70 90 110 130 150 170
Frequency (Hz)
Am
plitu
de
0 N push force
20 N push force
50 N push force
80 N push force
0
1
2
3
4
5
6
7
8
10 30 50 70 90 110 130 150 170
Frequency (Hz)
Am
plitu
de
0 N grip
50 N grip
100 N grip
Handle
0,01
0,1
1
10
100
10 60 110 160Frequency
Am
plitu
de
Model without hand
Model with hand
Measured without hand
Measured with hand
FIGURE 4. Validation of combined hand-handle model.
50 N grip andpush forces

Vibration Characteristics of Damped Laminates Having Three-dimensional Shapes in Automotive Body Panels
T. Yamaguchia, Y. Kurosawab , N.Satob and S. Matsumurab
aDepartment of Mechanical System Engineerings, Gunma University, 1-5-1Tenjincho Kiryu, JapanbFuji Heavy Industories Co.ltd. , 10-1Higashihoncho Ota,Japan
Viscoelastic damping materials are laminated on car body panels to reduce structure borne noise. Properties of simple structures(e.g. flat plates,straight beams) with the damping layer have already been clarified by many researchers. However the damped properties of body structureshave not yet been investigated in detail, because panels in the structures have three-dimensional complicated configurations by their beads andcurvatures. Moreover, the panels are complexly connected to the body frames, which affects on the vibration behaviors significantly. Predictionmethods have been studied using large scaled FEM (finite element method) and MSE(modal strain energy method). The calculated dampingproperties of these structures are compared with those of experimental results. Both results are consistent. We also report that modal damping issensitively varied by the geometry of the body panels. We describe the effects on damping concerning geometry(length and height) of thebeads, rise in the curved plates with no constant radius, and rigidity in connection between panels and frames.
CALCULATION METHOD
Element matrix for viscoelastic and elastic materials can bewritten as complex eigenvalue problem :
Where,[KR]e,[M]e,and ��e are element stiffness matrix,element mass matrix, loss factor of the material related toeach element.�� tot is modal loss factor, and �n is eigenfrequency.{�n} is complex eigenvector. emax is number ofelements. Next, small parameter ��=j�max is introduced under�max<<1.��� max is the maximum value among the elements’loss factors ��e. We expand solutions of Equation(1) usingthe small parameter ��.
These are substituted into Equation(1). And the successiveexpression can be rearranged into equations related to sameorder of ��. Further, after mathematical manipulations, nextexpression is obtained.
From Equation(5), modal loss factor��tot can be calculatedusing loss factors ��e of each element and ratios S se of strainenergy in each element to total energy. Strain energy can beobtained using real eigen vector {�n}0, which leads to beapplicable to large scaled FEM model for actual vehicles.This approach here under multiple viscoelastic materials isextended version of Ma’s approach [3] under oneviscoelasticmaterial.Equation(5) has the identical form to MSE [2].
RESULTS AND DISCUSSION
Figure1 shows geometry of bead panel with damped layer.Effects of beads on the modal loss factor �tot for (1,1) modeare also displayed under h1=0.6mm, h2=3mm.Increasingheight h of the bead to 5-7mm under s=20mm, modaldamping �tot diminish. In this condition, portion of the beadbend like elastic beams as depicted in Figure2(a). �tot isgoverned by the rigidity at these portions.There existsinplane deformation with low damping at vertical plates inthe bead. When the height h reaches more than 10mm unders=20mm, loss factors �tot increase conversely. On thiscondition, the portions of the beads move like rigid bodies
with no elastic deformation as shown in Figure2(b). Insteadof the deformation in the beads, flat portions near the ends ofthe beads deform with out-of-plane motions, which yield
{�n} ={�n}0+� {�n}1+� 2{�n}2+,... (2)(� n)2=(� n 0)2+� 2 (� n 2)2+� 4(� n 4)2+,... (3)j � tot =� � n 1 +� 3� n 3+� 5� n 5+� 7� n 7+,... (4)
� tot= �e =1
e max(� e S se), (5)
�e =1
e max([K R]e(1+ j � e )– (� n )2(1+ j� tot )[M ]e){�n }={0} (1)
(a) small h (b) large hFIGURE 2. Modes of Bead Panel with Damper
FIGURE 1. Geometry of bead panel with damped layer

0.01
2
3
4567
0.1
2
3
45
6 81
2 4 6 810
2 4 6 8100
Height of Bead h(mm)
20mm
10mm
50mm
s=100mm
Mode(1,1), Five beads
high damping. If the distance s increases, modal damping increasein Figure 3. This reason can be considered as follows.The flat portions near the edges of the beads areenlarged with long s. Thus, out-of-plane motion withhigh damping at the positions increase. We compare damping from calculation with thatfrom experiment in Figure 4. Both results coincide.
In the previous reports for perfect shells, rises of thepanels diminish modal damping because inplanedeformation with low damping is introduced due tocurvatures. However, in usual, curved panels inautomobiles do not have boundary including completearcs. Thus, we will investigate damping behaviors forthe curved panels having rectangular edges. Thesepanels have no constant radius, as shown in Figure5.The effects of rise on the damping are shown in thefigure. Increasing the rise to 5mm, damping decreases.This is the same reason for the results of the perfectshells. More rises give complicated results. Therectangular boundary inevitably creates flat portions atthe corners in the curved plate with deep rise.Thus,out-of-plane deformations of the flat portions withhigh damping are mixed into the inplane deformationof curved portions with low damping.
In panels for cars, there exist beads and curvatures with complex configurations. Thus, modal loss factorsof the panels with damped layers are influenced bytheir shapes as we explained. In general, the panels areconnected to elastic frames. Next, we will show thatrigidity at the connections affects on the dampingbehaviors of the panels. Figure7 shows responses withvarious rigidity k at the connections. Under k=0.1kgf/mm2, the calculated response agrees with theexperimental result. Not only resonant peaks but alsodamping �tot changes with different rigidity k. These phenomena can be explained as follows. Vibrationmodes change as the rigidity k vary at the connections.This leads that strain energy ratio between inplanedeformation and out-of-plane deformation changes inthe panels. Thus, damping � tot varied with k.
CONCLUSION For automotive bodies, we revealed the sensitiveeffects on damping concerning geometry of bead, inhomogeneous rise in the curved plates, and rigidityin connection between panels and frames.
REFERENCES1. D.Ross, E.E.Ungar and E.Kerwin, Structual Damping,�edited by J.E.Ruzicka, New York, Pargamon Press,19592. C.D.Johnson, and D.A.Kienholz, AIAA Journal, 20-9,1284-1290 (1982).3. B.A.Ma and J.F.He, J Sound Vib. 152-1, 107-123(1992).4. J. Kanazawa, T. Yamaguchi, and K. Akamatsu, Proc. of Acoust. Soc. Am and Acoust.Soc.Japan Third Joint Meeting,Honolulu, Hawaii,5 pages,1996.
FIGURE 7. Damped Response of Floor Panel in a Car.
500400300200100Frequency(Hz)
20dB
Experiment FEM(k=0.1kgf/mm2, �tot=0.129) FEM(k=0.3 , =0.137) FEM(k=1.0 , =0.166) FEM(k=10 , =0.171)
0.01
2
4
68
0.1
2
4
2 3 4 5 6 7 8100
2 3 4 5 6 7
Resonant Frequency(Hz)
rise =0(flat plate)
steel0.6mm+damper3.0mm500*475mm
1.25
2.5
3.7510.05.0 20.0
FIGURE 6. Modal Loss Factor of Curved Panel
FIGURE 5. Geometry of curved panel with damped layer
FIGURE 3. Modal Loss Factor of Bead Panel
0.01
2
46
0.1
2
46
1
Vibration Modes(1,1) (2,1) (3,1)
Flat Panel (FEM+MSE) " (Experiment) Bead Panel(FEM+MSE) " (Experiment)
FIGURE 4. Damping of Bead Panel

Sound radiation from a double-leaf structure: Effect of an interior wall on the structure-borne sound
radiation from walls E. Sakagamia, M. Yairia,b, K. Sakagamia, M. Morimotoa, A. Minemurab and K. Andowb
a Environmental Acoustics Laboratory, Kobe University, Rokko, Nada, Kobe 657-8501, Japan
b Kajima Technical Research Institute,2-19-1 Tobitakyu, Chofu, Tokyo 182-0036 Japan
The sound power radiated from double-leaf structures, consisting of a structural wall and an interior wall, is known to show a significant peak at the mass-air-mass resonance frequency: the interior wall rather amplifies the radiation at low frequencies, though it reduces the radiation at high frequencies. To evaluate the acoustical efficiency of an interior wall, the radiation reduction, RR, is defined as the radiated sound power ratio of the double-leaf to the structural wall alone. In this paper, the effects of parameters of the structure on the amplification effect are investigated through theoretical results of RR. Moreover, RR is examined whether it can be used as a consistent and specific measure for the acoustical efficiency of an interior wall in radiation reduction.
INTRODUCTION
A double-leaf wall, consisting of a structural wall and an interior wall, is widely used in buildings. However, its sound radiation has not extensively been studied, except some experimental studies, e.g. [1], and theoretical studies without considering the acoustical coupling due to the cavity, e.g. [2].
The authors have been studying the sound radiation from a double-leaf wall theoretically, and showed that an amplification effect occurs at low frequencies due to the mass-air-mass resonance [3].
In this paper, the effects of parameters on the amplification effect are explored through theoretical results. In attempt to establish a criterion for evaluating sound reduction performance of an interior panel, the radiation reduction (RR) is defined, and examined whether it can be used as a consistent measure specific to the panel.
THEORY
A double-leaf structure is modeled as two infinite elastic plates, one of which is excited by a point force, with an air-cavity in-between (Fig. 1). For simplicity, the two walls are assumed to be structurally isolated from each other. A far-field solution to the radiated sound pressure in region [A] is:
( ) ( ) ( ) [ ]r
rikF
Kirp
d πω
ωωρθ
4
exp2, 0
01 −= (1)
where
( ) ( ) ( )
( )( )
+−=θ
ωθ
ρ
θω
θρ
ωωω
cossin
1
coscossin
1
cos10
00
10
00
21
zk
c
zk
cRR
iKd
( ) ( ) ( )2440
10
00 sincos2exp1
2
cosωρθ
θω
θρ
ω jpjjj hkDizik
cR −+
−= ,
with ρ0 is air density, k0=ω/c0 the acoustic wave number with ω the angular frequency, c0 the sound speed in air, Dj , hj , and ρpj are the flexural rigidity, the thickness and the density of plate j, respectively.
The sound power radiated from the plate-1 can be obtained by integrating the radial intensity over a hemisphere of radius r.
To evaluate the acoustical efficiency of the interior wall, the radiation reduction, RR, is defined as the radiated sound power ratio of the double-leaf to the structural leaf alone. It indicates the interior wall reduces sound radiation, if the value of RR is positive.
NUMERICAL EXAMPLES
An example of the calculated RR of a typical double-leaf wall is shown in Fig. 2 in comparison with
Receiving Point r
z
Point Force F(ω)
[A] [B] [C]
0 z1 r
x
Pla
te-1
(i
nter
ior-
wal
l)
Pla
te-2
(s
truc
tura
l-w
all)
θ
FIGURE 1. Geometry of a double-leaf elastic plate of infinite extent with a point force excitation.
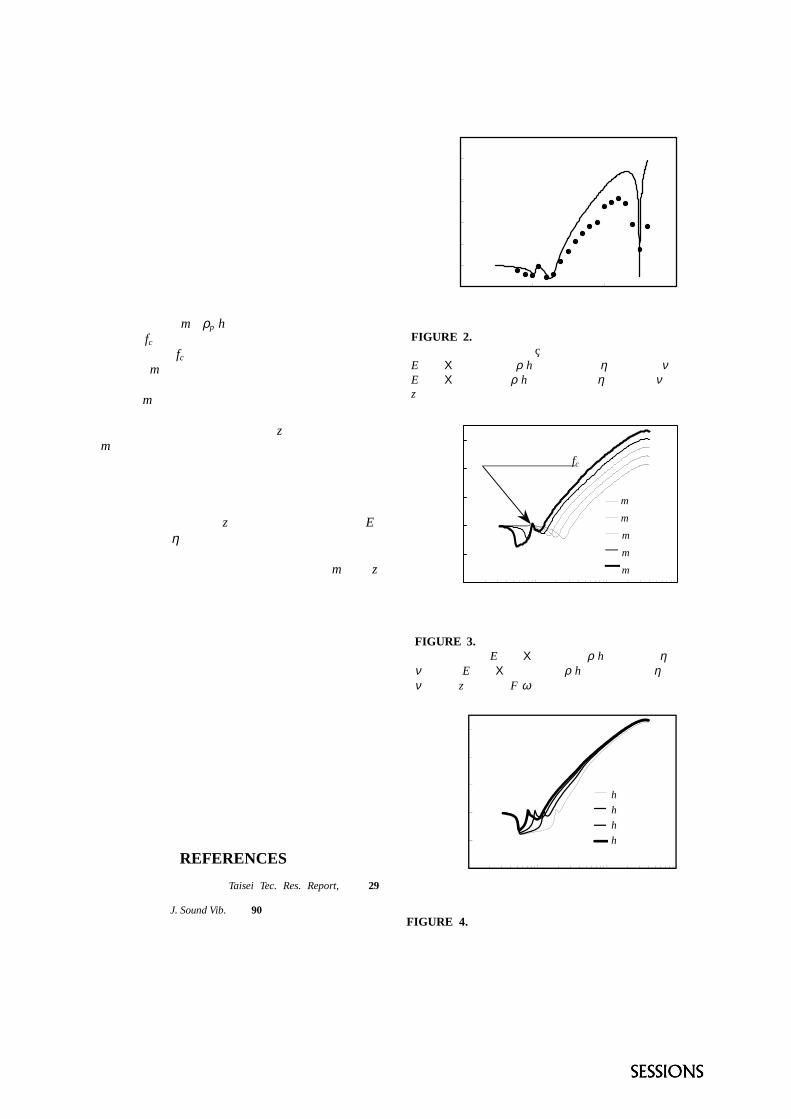
a measured value. The measured value was obtained from a standard reverberation chamber experiment. They are in fairly good agreement especially at low frequencies. A broad dip appears at low frequencies due to the mass-air-mass resonance and the coincidence effect of the structural wall. Above the dip, the theoretical value increases with increasing frequency at ca -16dB/oct. As the coincidence effect of the interior wall is less significant than that of the structural wall at the same frequency, it does not appear in the results.
Figure 3 shows the effect of the surface density of the interior wall, m1=ρp1h1 , on RR. Below the critical frequency, fc, of the structural wall, RR decreases, and the dip above fc shifts to lower frequencies with increasing m1, as the resonance frequency shifts downward. At mid-high frequencies, the increase in RR due to m1 is slightly smaller than expected from the mass-law because of the mass-air-mass resonance. The effect of the air cavity depth, z1, is similar to that of m1 at low frequencies according to the behavior of the mass-air-mass resonance. Sharp dips occur at high frequencies, though they are not shown in these figures: these dips are caused by the resonance of cavity acoustical modes. These resonance frequencies decrease with increasing z1. The young’s modulus, E1, and loss factor, η1, have no significant effect on RR at all frequencies. Thus, at high frequencies, interior walls effectively attenuate the radiated power when m1 and z1 are sufficiently large, whereas it amplifies the power at low frequencies.
In order to examine whether RR can be used as a consistent and specific measure of interior walls’ sound reduction performance, its variation due to changes in structural wall and excitation condition is studied. The effect of the thickness of the structural wall is shown in Fig. 4. The dip in RR shifts to lower frequencies with increasing the thickness of the structural wall. However, when the range of the thickness of actual structural walls, 0.15-0.25m, is concerned, the value of RR can be stated not to change very much. The value of RR little changes even if the excitation force is replaced with various concentrated force. Therefore, RR can be used as a consistent and specific measure of an interior wall under various conditions of excitation forces with different structural walls.
REFERENCES 1. T. Kawaharazuka et. al., Taisei Tec. Res. Report, Vol. 29,
pp315-318, 1996. (in Japanese) 2. D. Takahashi, J. Sound Vib., Vol. 90, pp541-557,1983. 3. M. Yairi et al., Proc. WESTPRAC (Kumamoto, Japan) pp.
1065-1068 (2000)
-10
0
10
20
30
40
50
60
10 100 1000 10000Frequency (Hz)
RR
(dB
)
FIGURE 2. Comparison of calculated (solid curve) andmeasured (dots) RR of a double-leaf wall.E1=1.8X10⁹N/m2, ρ1h1=6kg/m2, η1=0.03, ν1=0.2,E2=2.6X10¹⁰N/m2, ρ2h2=345kg/m2, η2=0.005, ν2=0.17,z1=0.06m.
h 2= 0.10 (m)
h 2= 0.15 (m)
h 2= 0.20 (m)
h 2= 0.25 (m)
-40
-20
0
20
40
60
10 100 1000 10000Frequency(Hz)
RR
(dB
)
FIGURE 4. Effect of the thickness of the structural wall on RR. Other parameters are the same as in Fig. 3.
m1= 3 (kg/m2)
m1= 6 (kg/m2)
m1= 12 (kg/m2)
m1= 24 (kg/m2)
m1= 48 (kg/m2)-40
-20
0
20
40
60
10 100 1000 10000
Frequency(Hz)
RR
(dB
)
FIGURE 3. Effect of the surface density of the interior wall on RR. E1=1.0X10¹⁰N/m2, ρ1h1=6kg/m2, η1=0.01, ν1=0.2, E2=2.6X10¹⁰N/m2, ρ2h2=460kg/m2, η2=0.005, ν2=0.17, z1=0.03m, F(ω)=1N.
Critical frequency f c
Acoustic wave propagation in a membrane-ductSunghoon Choi and Yang-Hann Kim
Department of Mechanical Engineering, Korea Advanced Institute of Science and Technology,Science Town, Taejon, 305-701, KOREA
Theoretical analysis for sound waves in a flexible membrane mounted in an otherwise rigid duct is presented. It has been shownthat supersonic fluid-dominant waves and subsonic membrane-dominant waves exist. The latter provide powerful mechanism oftransmission loss through the membrane damping and destructive reflections at the edges. The effect of mean flow and external fluidis also considered.
INTRODUCTION
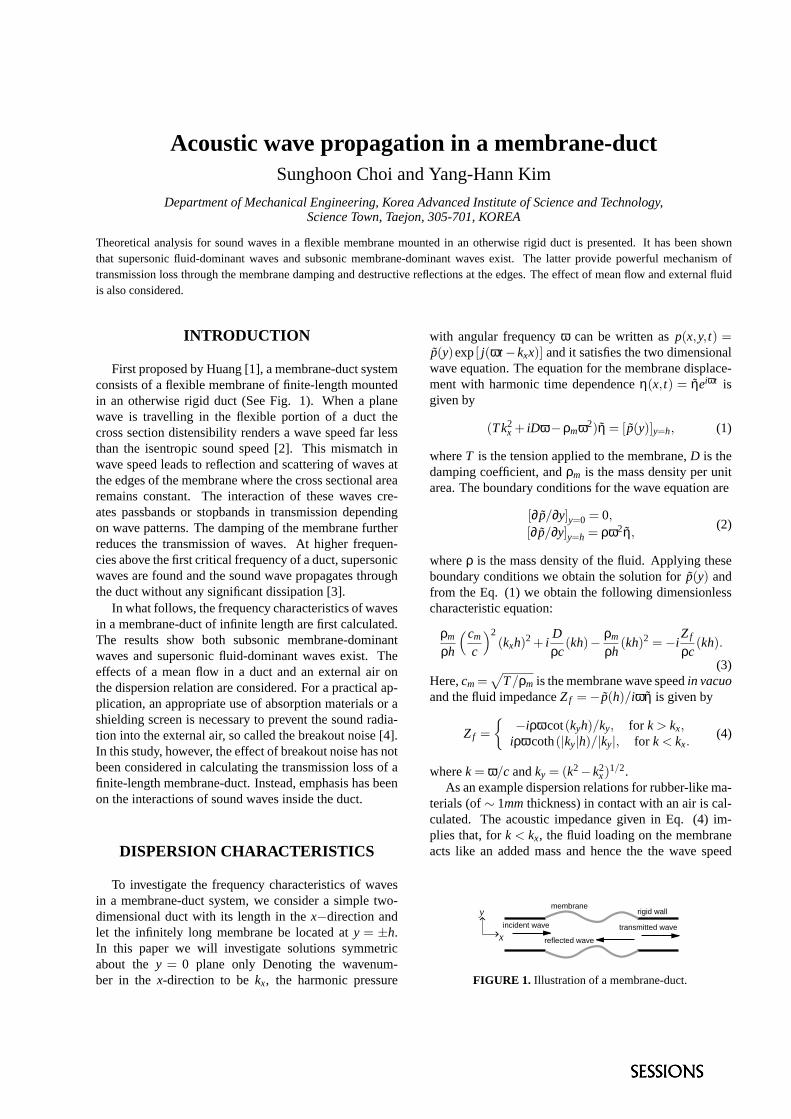
First proposed by Huang [1], a membrane-duct systemconsists of a flexible membrane of finite-length mountedin an otherwise rigid duct (See Fig. 1). When a planewave is travelling in the flexible portion of a duct thecross section distensibility renders a wave speed far lessthan the isentropic sound speed [2]. This mismatch inwave speed leads to reflection and scattering of waves atthe edges of the membrane where the cross sectional arearemains constant. The interaction of these waves cre-ates passbands or stopbands in transmission dependingon wave patterns. The damping of the membrane furtherreduces the transmission of waves. At higher frequen-cies above the first critical frequency of a duct, supersonicwaves are found and the sound wave propagates throughthe duct without any significant dissipation [3].
In what follows, the frequency characteristics of wavesin a membrane-duct of infinite length are first calculated.The results show both subsonic membrane-dominantwaves and supersonic fluid-dominant waves exist. Theeffects of a mean flow in a duct and an external air onthe dispersion relation are considered. For a practical ap-plication, an appropriate use of absorption materials or ashielding screen is necessary to prevent the sound radia-tion into the external air, so called the breakout noise [4].In this study, however, the effect of breakout noise has notbeen considered in calculating the transmission loss of afinite-length membrane-duct. Instead, emphasis has beenon the interactions of sound waves inside the duct.
DISPERSION CHARACTERISTICS
To investigate the frequency characteristics of wavesin a membrane-duct system, we consider a simple two-dimensional duct with its length in thex−direction andlet the infinitely long membrane be located aty = ±h.In this paper we will investigate solutions symmetricabout they = 0 plane only Denoting the wavenum-ber in thex-direction to bekx, the harmonic pressure
with angular frequencyω can be written asp(x,y, t) =p̃(y)exp[ j(ωt−kxx)] and it satisfies the two dimensionalwave equation. The equation for the membrane displace-ment with harmonic time dependenceη(x, t) = η̃eiωt isgiven by
(Tk2x + iDω−ρmω2)η̃ = [p̃(y)]y=h, (1)
whereT is the tension applied to the membrane,D is thedamping coefficient, andρm is the mass density per unitarea. The boundary conditions for the wave equation are
[∂p̃/∂y]y=0 = 0,[∂p̃/∂y]y=h = ρω2η̃,
(2)
whereρ is the mass density of the fluid. Applying theseboundary conditions we obtain the solution forp̃(y) andfrom the Eq. (1) we obtain the following dimensionlesscharacteristic equation:
ρm
ρh
(cm
c
)2(kxh)2 + i
Dρc
(kh)− ρm
ρh(kh)2 =−i
Zf
ρc(kh).
(3)Here,cm =
√
T/ρm is the membrane wave speedin vacuoand the fluid impedanceZf =−p̃(h)/iωη̃ is given by
Zf ={
−iρωcot(kyh)/ky, for k > kx,iρωcoth(|ky|h)/|ky|, for k < kx.
(4)
wherek = ω/c andky = (k2−k2x)
1/2.As an example dispersion relations for rubber-like ma-
terials (of∼ 1mmthickness) in contact with an air is cal-culated. The acoustic impedance given in Eq. (4) im-plies that, fork < kx, the fluid loading on the membraneacts like an added mass and hence the the wave speed
membrane
reflected wave
incident wave transmitted wave
rigid wall
x
y
FIGURE 1. Illustration of a membrane-duct.

decreases. Plotting the pressure profile of this subsonicmode along the cross section, we can observe that thepressure amplitude decays exponentially away from themembrane wall. It means most of its energy is concen-trated near the membrane and hence we will call it amembrane-dominant mode. On the other hand the su-personic branches (given in Fig 2), so called fluid dom-inant modes, are understood as rigid duct modes modi-fied by the vibration of the flexible membrane. The wavespeed increases as shown in Fig. 2. There are certain crit-ical frequencies below which these fluid-dominant modesbecome evanescent and they depend on the mass ratioρm/ρh only.
The effects of the mean flow and the external fluidmedium have also been considered. The mean flow ina duct of low Mach number has been found to have littleeffect on the frequency characteristics of the membrane-dominant wave. The phase speed of the fluid-dominantwave increases as the mean flow speed increases. The ex-ternal fluid provides the propagating waves with radiationdamping and the fluid-dominant modes become evanes-cent.
TRANSMISSION CHARACTERISTICS
In this section we will consider a flexible membraneoccupying−L/2≤ x≤ L/2 in an otherwise rigid duct.Mathematical details will be found in references [1] and[3].
Shown in Fig. 3 are transmission loss spectra for dif-ferent values of damping and membrane tension. Thematerial properties of the membrane are the same as inthe example given in Fig. 2 and the ratio of the mem-brane length to the hight of the channel is10. In Fig. 3(a)
0 1 2 3 40
1
2
3
4
kh
k xh
1st mode
rigid duct modes
2nd mode
real imaginary
FIGURE 2. Supersonic branches of the dispersion relationswith c/cm = 15.2, ρm/ρh = 0.826, andD = 0. Thick linesare for the fluid-dominant waves and the thin lines are for therigid duct modes. Negative part of imaginary wavenumbers areshown with dashed lines.
0 0.5 1 1.50
25
50
kh
TL,
dB
0 0.5 1 1.50
25
50
kh
TL,
dB
(a)
(b)
FIGURE 3. Transmission loss vs frequency (L/h = 10,ρm/ρh = 0.826): (a) Thin solid line,D′ = 0; thick solid line,D′ = 0.1. (b) Thin solid line,c/cm = 15.2; thick solid line,c/cm = 7.6; dashed line,c/cm = 4.8.
the transmission loss curves are plotted for a membrane-duct with and without damping. We notice a substantialamount of loss below the critical frequency (kch = 0.92).For a lossless membrane peaks and dips are found alter-natively and it is due to the match between the wave-length of the membrane-dominant wave and the mem-brane length. Below the critical frequency most of the en-ergy is carried by the membrane-dominant wave. Whenthe integral multiple of the wavelength equals the mem-brane length there will be strong reflection and in conse-quence reduction of wave transmission. The thick curvein Fig. 3(a) is for the membrane with viscous damping.We introduce a modal damping coefficientD′ to repre-sent the rate of oscillation reduction per cycle. In thisexample we assumeD′ = 0.1, which is slightly largerthan that of a typical rubber-like material. The dampedmembrane dissipates membrane-dominant waves signifi-cantly below the critical frequency. Fig. 3(b) shows theeffect of the membrane wave speed on transmission loss.The level of transmission loss increases as the impedancemismatch increases. Peculiar sharp peaks are observed inthese transmission loss spectra and we attribute them tothe higher order mode effect as observed in conventionalducts. We also observed that he level of transmission lossis proportional to the membrane length.
REFERENCES
1. L. Huang, J. Acoust. Soc. Am.106, 1801-1809 (1999).
2. J. Lighthill, Waves in Fluids, Cambridge University Press,1978.
3. S. Choi, and Y.-H. Kim, J. Acoust. Soc. Am.,Submitted.
4. A. Cummings, J. Sound Vib.239, 731-765 (2001).

Acoustic scattering from a rectangular windowor a balcony in a building façade
J. Picaut
Laboratoire Central des Ponts et Chaussées, Centre de Nantes, Division Gestion de l’Entretien des Routes,Section Acoustique Routière et Urbaine, Route de Bouaye, BP 4129, 44341 Bouguenais Cedex, France
In this paper we present a 2D mathematical model for the acoustic scattering from a rectangular window or balcony in a buildingfaçade. The model, inspired by a recent paper [1], is based on the Fourier transform and the mode matching methods. It allows toexpress the scattered and the transmitted field by a window (or a balcony) as series solutions which can be easily computed.Numerical applications are discussed and some examples are given.
INTRODUCTION
Because of the economical cost and theenvironmental impact of noise in cities, a lot ofresearches have been done on sound propagationmodelling in urban areas. Most of the analytical ornumerical models need to simulate the sound reflectionby a building façade. The specular reflection apart,only some statistical reflection laws (like the Lambert'slaw) are used in practice, although their existence havenot been proved for real façades. Moreover, somerecent results also suggest there are considerabledifferences between sound fields in a street resultingfrom different kind of boundaries [2]. At this time, wethink that it is necessary to develop new reflection lawswhich take into account a real architectural façadesdescription, for example, characterised by a windows(or balconies) network.
In a recent paper [3], a qualitative approach was thenproposed to study the sound reflection by a buildingfaçade, by determining, firstly, the architectural objects(windows, balconies, carpentries...), in particular interms of size, which create diffuse scattering, andsecondly, the size of the active scattering region of abuilding façade.
In this paper, a quantitative approach is nowpresented to evaluate the sound reflection by one ofthese elemental architectural objects, a window or abalcony, defined as a rectangular opened or closedcavity in a perfectly hard plane. A 2D numerical modelis then presented to evaluate the sound field which isreflected and transmitted through the cavity (as for anopened window), as well as the sound field inside thecavity. This works is an application of a recent modelpresented by H. H. Park and H. J. Eom [1] to study theacoustic scattering from a rectangular aperture in athick hard screen. The convergence of the solution isdiscussed, and some examples are given for a closedcavity.
Let us consider awidth d, in a perfincident harmonic region (I), the totalreflected pr and scais convenient to use(or plane wave combination of plan
=π
zxps
21),(
with 22 1 ξκ −= . transmitted wave psame procedure:
window
z
x
+a
-d0
pi
pr
ps
pt
(I)
FIGURE 1. Schematby a 2D-window or opened at z=-d, the trbe considered.
θ
M +
RTHEORY
rectangular cavity of length 2a andectly hard plane (Fig. 1), with anplane wave k of frequency F. In field is the sum of the incident pi,ttered ps fields. For the last field, it an angular spectrum representationexpansion) which is a lineare waves
( )�+∞
∞−
+− ξκξξ dzixip s exp)(~ (1)
If the cavity is opened, thet may be expressed following the
-a(II) (III)
ic representation of the sound reflectionbalcony in region (I). If the cavity isansmitted field in region (III) can also
( )�+∞
∞−
+−−= ξκξξπ
ddzixipzxp tt )(exp)(~21),( . (2)
In region (II), the sound field pd is written accordingto the mode matching method:
[ ]( )( ) ( )[ ]dzddzc
xaazxp
mmmm
mm
d
+++×
+=�+∞
=
ξξ sincos
cos),(0 (3)
with 22mm ak −=ξ et amam 2/π= . At this point,
the coefficients cm and dm are calculated by consideringthe continuity condition on the left boundary at z=0and on the right boundary at z=-d, for the acousticpressure and the sound velocity. According to this, wecan show that these coefficients verify an infinite set ofequations whose coefficients are defined from the sizeof the cavity, the projection kx of the wave number inthe direction x, and from a complex integral Imp.Moreover, we also show that the function sp~ and
tp~ can be expressed from the coefficients cm and dm. Ifthe cavity is closed, the coefficients dm are zero. Then,by solving the set of equations and by considering thestationary phase approximation, it allows to calculatethe far-zone scattered and transmitted fields. Moreover,the calculation of the sound field inside the cavity(region (II)) is also possible.
COMPUTATION ANDNUMERICAL RESULTS
The main difficulty of the model is the calculation ofthis last integral Imp, which has no analytical solution,and whose numerical evaluation is not easy. However,using a quadrature method, the calculation can beperformed. Although there are an infinite number ofcoefficients cm and dm, the solution can be calculatedby truncating the summations which are used in thecalculation of the sound fields. In practice, we showthat the convergence of the numerical calculation issatisfied for
[ ]caFN /4E= , (5)
where E[…] expresses the integer part, and where c isthe sound velocity.
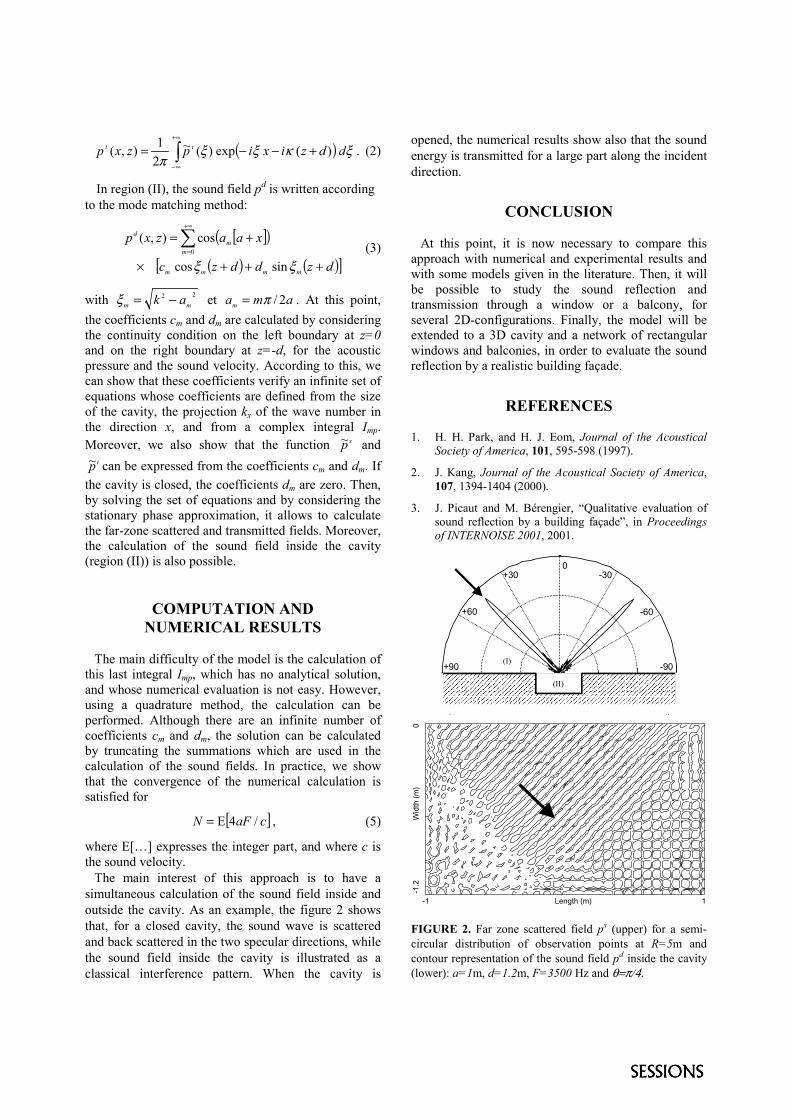
The main interest of this approach is to have asimultaneous calculation of the sound field inside andoutside the cavity. As an example, the figure 2 showsthat, for a closed cavity, the sound wave is scatteredand back scattered in the two specular directions, whilethe sound field inside the cavity is illustrated as aclassical interference pattern. When the cavity is
opened, the numerical results show also that the soundenergy is transmitted for a large part along the incidentdirection.
CONCLUSION
At this point, it is now necessary to compare thisapproach with numerical and experimental results andwith some models given in the literature. Then, it willbe possible to study the sound reflection andtransmission through a window or a balcony, forseveral 2D-configurations. Finally, the model will beextended to a 3D cavity and a network of rectangularwindows and balconies, in order to evaluate the soundreflection by a realistic building façade.
REFERENCES
1. H. H. Park, and H. J. Eom, Journal of the AcousticalSociety of America, 101, 595-598 (1997).
2. J. Kang, Journal of the Acoustical Society of America,107, 1394-1404 (2000).
3. J. Picaut and M. Bérengier, “Qualitative evaluation ofsound reflection by a building façade”, in Proceedingsof INTERNOISE 2001, 2001.
0-30
-60
-90
+30
+60
+90 (II)
(I)
-1 1
-1.2
0
Length (m)
Wid
th (m
)
FIGURE 2. Far zone scattered field ps (upper) for a semi-circular distribution of observation points at R=5m andcontour representation of the sound field pd inside the cavity(lower): a=1m, d=1.2m, F=3500 Hz and θ=π/4.
(II)
(I)

Normal incidence absorption coefficient of rigid perforated screens
L. Tronchin
DIENCA-CIARM, University of Bologna, 40136 Bologna, Italy A sound absorber usually consists of a perforated facing backed with a porous material, and is commonly used as a sound barrier, muffler in a vehicle or any other practical acoustic application. In this paper the normal incidence absorption coefficient determined only by the presence of rigid perforated screens is discussed. Various type of perforated screens with different percentage of perforations and backward with an air layer have been tested in an impedance tube experimental apparatus. Mathematical models for the determination of the superficial acoustical properties have been applied. Theoretical results and experimental data are compared. The paper particularly points out that the calculation of acoustical normal incidence absorption coefficient of the studied screens have a fairly good agreement with measurements at frequency below 2000 Hz.
INTRODUCTION The most conventional noise isolation devices, such as composite panels, vehicle mufflers and industrial silencers, and so on, usually consist of barriers composed of perforated facing backed with some porous material. In earlier studies, involving the determination of the surface impedance of the composite panel, Ingard and Bolt [1] concentrated on the absorption characteristics of acoustical materials with perforated facing. Later, they and other acousticians [2-4], shifted their effort to the study of low frequency resonant absorber design by using a perforated facing. Recently Dah You Maha [5], proposed an approximate formula for the impedance of a single hole and validate it with measurement in an equivalent electrical circuit. In this paper both the calculation and measurement of normal incidence absorption coefficient at frequency below 2000 Hz through a perforated screen of different thicknesses and percentages of perforation are included. The results clearly show that the calculated absorption coefficients of all adopted perforated screens agree well with measurements, and the dependence of the geometrical characteristic of screens.
THEORETICAL MODELS A perforated screen may be considered a lattice of short narrow tube, separated by distances much larger then their diameters, but small compared to the wavelength of impinging sound wave. The equation of aerial motion in a tube short compared to the wavelength is:
t
pu
rr
rruj
∆=
∂∂
∂∂−ηωρ (1)
where ∆p is the sound pressure difference between the ends of the tube, t the length of the tube (thickness of the panel), ρ is the air density, η is air dynamic viscosity, and r is the radius vector of cylindrical coordinates inside the tube. The equation (1) may be solved for the particle velocity u, and the ratio of ∆p to the average value of u over the cross-sectional area of the tube gives the specific acoustic impedance of the tube:
( )( )
1
0
121
−
−−
−−=
∆=
jkJ
jkJ
jktj
u
pZ ωρ (2)
where ηϖρ /0rk = , r0 is the radius of the tube, J1
the Bessel function of the first kind of the first order and J0 same of zeroeth order. It is seen that the quantity k is proportional to the ratio of the radius to the viscous boundary elements inside the tube, and may be termed as the perforate constant. The limiting values of Z for small and large values of K are given by various authors, but the most accurate results are postulated by Maha [5], who proposes the following simplified formula for the impedance of a single hole:
MjRt
d
xp
tj
tdxx
pdtZ
ωωρ
η
+=
+
+
+
+
++=
85.0
29
11
82
32132
2
2
2
(3)
where, p is the percentage of perforation, (ratio between the perforated area and the total area of the screen) d is the holes diameters, x d= / /2 ϖρ η , ω
radian frequency of the air movement, and R and M are the acoustic resistance and mass respectively.
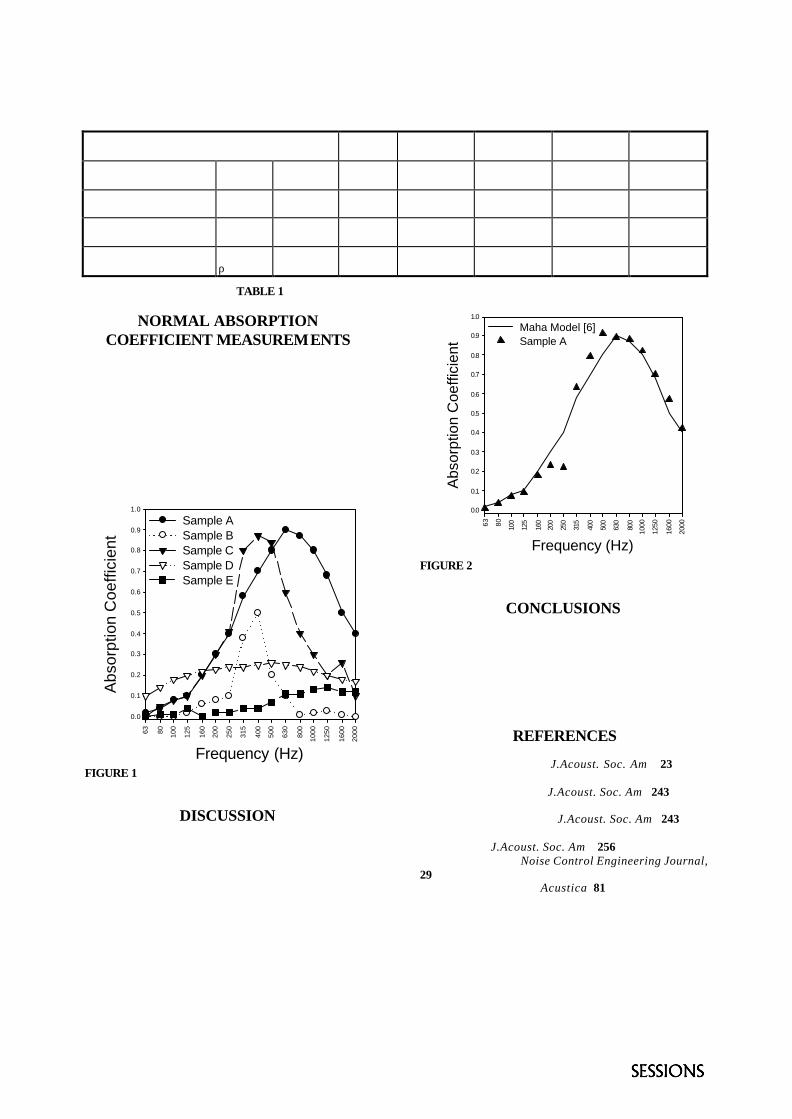
Screen
Type A
Type B
Type C
Type D
Type E
Thickness
t
(mm)
0.2
3
3
3
0.75
Percentage of perforation
p
(%)
78
0.14
0.14
0.13
22
Diameters of holes
d
(mm)
0.2
3
0.45
0.15
1.2
Mass
ρ
(Kg/m2)
2
5
5
5.2
3
TABLE 1: Physical characteristics of the tested perforated screens
NORMAL ABSORPTION COEFFICIENT MEASUREMENTS
In order to validate the considered model, measurements of the normal absorption coefficient were carried out with an Impedance Tube Method in accordance with standard ASTM C 384-95 [7]. Various type of perforated screens with different percentage of perforations and backward with an air layer of 5 cm have been tested. Physical characteristics of the perforated screens are presented in table 1. Experimental values are shown in figure 1.
Frequency (Hz)
63 80 100
125
160
200
250
315
400
500
630
800
1000
1250
1600
2000
Abs
orpt
ion
Coe
ffici
ent
0.0
0.1
0.2
0.3
0.4
0.5
0.6
0.7
0.8
0.9
1.0
Sample ASample BSample CSample DSample E
FIGURE 1- Absorption coefficient of different screens versus frequency
DISCUSSION Experimental data show that the higher values of absorption coefficient are reached by screen type A and C for the frequencies of 630 and 400 Hz, while in sample D and E the effect of the holes as an Helmholtz resonators is less evident. Figure 2 presents a good agreement between the Maha model and experimental values.
Frequency (Hz)
63 80 100
125
160
200
250
315
400
500
630
800
1000
1250
1600
2000
Abs
orpt
ion
Coe
ffici
ent
0.0
0.1
0.2
0.3
0.4
0.5
0.6
0.7
0.8
0.9
1.0
Maha Model [6]Sample A
FIGURE 2- Comparison between Maha Model [5] and perforated screen type A
CONCLUSIONS
Calculation of acoustical normal incidence absorption coefficient of the studied screens have a fairly good agreement with measurements at frequency below 2000 Hz. Further step in the research will be the study of the different thicknesses of the air gap beyond the perforated screen.
REFERENCES
[1]. U. Ingard, R.H. Bolt, J.Acoust. Soc. Am., .23, 2871-2877, (1951). [2]. G. Sacerdote, G.Gigli, J.Acoust. Soc. Am., 243, 349-52, (1952). [3]. D. Gallaway, B. Ramer, J.Acoust. Soc. Am., 243, 309-12, (1952). [4]. U. Ingard, J.Acoust. Soc. Am., .256, 1037-61, (1953). [5]. Maha Dah-You, Noise Control Engineering Journal, 29, 77-84, (1987). [6]. H.V. Fuchs, X. Zha, Acustica, 81, 107- 117, (1995). [7]. Standard ASTM C 384-95, Standard Test Method for Impedance and Absorption of Acoustical Materials by the Impedance Tube Method, ASTM Philadelphia