structural adjustment policies in highly indebted countries · to structural adjustment in the...
TRANSCRIPT

This PDF is a selection from an out-of-print volume from the National Bureauof Economic Research
Volume Title: Developing Country Debt and Economic Performance, Volume1: The International Financial System
Volume Author/Editor: Jeffrey D. Sachs, editor
Volume Publisher: University of Chicago Press
Volume ISBN: 0-226-73332-7
Volume URL: http://www.nber.org/books/sach89-1
Conference Date: September 21-23, 1987
Publication Date: 1989
Chapter Title: Structural Adjustment Policies in Highly Indebted Countries
Chapter Author: Sebastian Edwards
Chapter URL: http://www.nber.org/chapters/c8990
Chapter pages in book: (p. 159 - 208)

4 Structural Adjustment Policies in Highly Indebted Countries Sebastian Edwards
4.1 Introduction
Mexico’s announcement, in August of 1982, that it could no longer meet its international financial obligations took most of the world by surprise, sending shivers down the spines of bankers, politicians, and international bureaucrats. That fateful Friday the 13th of August 1982 marked the beginning of the worst international financial crisis since the Great Depression. What initially was thought to be an isolated case of temporary illiquidity soon spread to most of the developing world, placing the stability of the international financial system in serious jeopardy.
Five years after the eruption of the debt crisis most of the developing world is still struggling to get back on its feet. Although the collapse of the world financial system predicted by some overly pessimistic observers has not materialized, the debt crisis is far from over. In fact, when traditional creditworthiness indicators, such as debt-exports or debt-service ratios are analyzed, the highly indebted countries are now in an even weaker position than in 1982 (see table 4.1). It has now become apparent that a long-term resolution of the debt problems will be a painful and protracted process that will still require major addi- tional adjustment efforts by the indebted countries, as well as extensive
Sebastian Edwards is a professor of economics at the University of California, Los Angeles, and a research associate of the National Bureau of Economic Research.
I have benefited from discussions with Marcel0 Selowsky and am grateful to Alejandra Cox-Edwards, Edgardo Barandiaran, Pari Kasliwal, Miguel Savastano, Jeffrey Sachs and the participants of a meeting held in Cambridge, Mass., in May 1987 for helpful comments. Financial support from UCLA’s Academic Senate and from the National Science Foundation is gratefully acknowledged.
159

Table 4.1 Creditworthiness Indicators for Developing Countries: 1974-88
1979 1980 1981 1982 1983 1984 1985 1986 1987 1988
A . Ratio of Externul Debt to Exports of Goods and Srrvices (%) All developing countries 90.8 81.6 94.6 120.1 133.3 133.7 147.8 167.5 168.6 160.7 15 highly indebted" 182.3 167.1 201.3 269.8 289.6 272.1 284.2 337.9 349.6 324.7 Western Hemisphere 197.7 183.5 210.3 273.8 290.3 277.1 295.5 354.7 367.6 342.2 B. Debt Service Ratios to Exports qf Goods a n d Services (%) All LDCs 14.1 12.9 16.2 19.5 18.9 20.1 20.5 22.4 20.7 20.0 I5 highly indebteda 34.7 29.6 39.0 49.4 42.5 41.1 38.7 43.9 40.7 39.5 Western Hemisphere 39.6 33.4 41.9 51.0 43.9 41.7 38.7 45.6 44.9 40.9
Source: IMF's World Economic Outlook, April, 1987. "Argentina, Bolivia, Brazil, Chile, Colombia, Ivory Coast, Ecuador, Mexico, Morocco, Nigeria, Peru, Philippines, Uruguay, Venezuela, and Yugoslavia.

161 Structural Adjustment Policies in Highly Indebted Countries
negotiations between debtor governments, creditor governments, the multilateral institutions, and the banks.
The adjustment approaches followed until now by most of the highly indebted countries can best be described as emergency stabilization programs geared towards generating very large trade balance surpluses in very short periods of time. Given the new circumstances and the sudden halt in external financing after 1982, these countries had little choice but to use every possible tool at their disposal to achieve the needed turnaround in their current accounts. As a consequence the adjustment process has been quite costly, generating drastic declines in real income and important increases in unemployment. In fact, as is reflected in table 4.2, in a number of Latin American countries in 1986 real per capita GDP was below its 1970 level!
A long-run solution to the debt crisis problem would entail (a) the regaining of creditworthiness by these countries, and thus the re- sumption of voluntary lending by the international financial community; and (b) the resumption of sustained growth.' Much of the recent policy literature on the debt crisis has focused on these issues, with some of the discussion dealing with the type of long-run structural reforms the debt-troubled countries should implement in order to attain the dual objective of improved creditworthiness and growth. Most of this lit- erature has recommended very conventional measures, what econo- mists had been advocating for a long time prior to the debt crisis, including trade liberalization, financial reform, major devaluations, and a reduced role for the government.2 For example, this policy package is the core of the conditionality contemplated by the Baker plan. Sur- prisingly, there have been very few attempts to evaluate whether the design of these traditional policies, and in particular their speed and sequencing, should be altered in the presence of a major debt problem and, in some cases, still significant macroeconomic disequilibria.
Table 4.2 Index of Real Gross Domestic Product Per Capita In Selected Latin American Countries (1970 = 100)
1970 1975 1980 1981 1982 1983 1984 1985 1986
Argentina Bolivia Brazil Colombia Chile Mexico Peru Venezuela
100 100 100 100 100 100 100 100
105.9 117.3 145.1 118.2 81.8
116.8 108.9 106.5
107.5 120.6 179.5 137.9 109.1 139.8 104.7 105.7
99.2 118.3 172.8 138.0 113.4 146.8 105.9 102.3
92.6 107.6 170.4 136.4 95.8
142.3 103.6 100.0
93.9 95.7
161.5 134.7 93.6
131.3 89.9 91.8
94.3 89.7
165.0 136.1 98.1
132.4 91.8 88.3
88.7 85.8
174.7 136.6 98.8
132.6 90.9 83.7
92.2 80.4
184.7 140.7 101.9 124.3 96.2 82.9
Source: CEPAL, Anuario Estadistico de Ame'rica Latina y el Caribe, 1985 and CEPAL, Balance Preliminar de la Economia Latinoamericana, 1986.

162 Sebastian Edwards
The purpose of this chapter is to analyze a number of issues related to structural adjustment in the highly indebted developing countries. The chapter starts with a brief discussion of the main features of the adjustment process followed during 1982-87. I note that in spite of the major involvement of the IMF in this first phase of the adjustment, the actual policy packages implemented by most of the debt troubled coun- tries differed markedly from what we can describe as an orthodox IMF- type stabilization program. I argue that the “unorthodox” elements of the stabilization programs, such as the imposition of exchange controls and trade restrictions, responded to the emergency nature of these programs. I then discuss at a more analytical level some longer-term aspects of structural adjustment reforms, focusing on the relation be- tween outward orientation, export promotion, and trade liberalization. Emphasis is placed on the sequencing and speed of the structural re- forms related to the external sector. Lessons drawn from the recent Southern Cone experiments with trade liberalization are incorporated into the analysis of the possible effects of tariff reforms on employment, income, and growth. I also discuss the role of devaluations in structural adjustment processes in the same section. Since the chapter focuses on the role of the adjustment programs implemented by the countries themselves, relatively little emphasis is given to the role of banks and the international financial community.
4.2 The Nature of the Adjustment, 1982-87
In this section I analyze the main features of the adjustment process followed by the highly indebted countries during 1982-87.3 Given the great diversity of experience of the various countries, it is not possible to make sweeping generalizations; in fact, doing so would grossly over- simplify the discussion. When possible I point out the more important differences across countries.
4.2.1 Origins of the Crisis
During the second half of the 1970s and the early 1980s most of the developing nations embarked on a foreign borrowing binge. Between 1975 and 1982 the developing world’s long-term foreign debt more than tripled, growing from $162.5 billion to $551.2 billion; in 1982 the total foreign debt of the developing world, including short-term debt and use of IMF credit, stood at $738.7 billion. Naturally, this huge increase in indebtedness was made possible by the liberal way in which, after the first oil shock in 1973, the international financial community and in particular the banks, provided funds to these countries. There is no doubt that the pace at which the developing countries were accumu- lating debt in the late 1970s and early 1980s-at a rate exceeding 20 percent per year-was not sustainable in the medium to longer run;

163 Structural Adjustment Policies in Highly Indebted Countries
some type of adjustment was bound to take place. The world, however, was astonished by the severity of the crisis; instead of there being an orderly and slow reduction in the flow of borrowing, there was a major crisis that brought capital flows to a virtual halt.
The causes behind the spectacular growth in borrowing during the 1974-82 period varied from country to country. In Brazil, for example, it responded to a deliberate development strategy adopted after the 1973 oil shock. This policy was based on import substitution supple- mented with a heavy reliance on foreign borrowing to finance major investment projects. In Turkey, the accumulation of foreign indebt- edness responded mainly to the rapid growth of the public sector, which used most of the funds for investment purposes. The situation was greatly aggravated by the existence of the so-called “convertible Turk- ish lira deposits,” which provided a defacto, evergrowing subsidy to foreign borrowing. Contrary to most other countries, Turkey entered into a crisis in 1977, even before the second oil shock. In Mexico, the populist policies of the Echeverria and Lopez Portillo administrations, with spectacular growth in the public sector and in the fiscal deficit, lay behind the crisis. The discovery of additional oil reserves generated a wave of optimism that greatly influenced the magnitude of the ex- penditure binge. It has been argued that approximately one half of the Mexican debt accumulated during the Lopez Portillo administration went to finance capital flight (Buffie and Sangines 1987). In Chile, on the other hand, fiscal policies played no role in the unleashing of the crisis; most of the huge increase in Chile’s foreign debt was contracted by the private sector with no government guarantees. The opening up of the Chilean economy, as part of the overall project of economic liberalization of the Pinochet government, allowed the private sector to finance huge increases in consumption-especially of durables-with borrowing from a b r ~ a d . ~ In spite of their different experiences during the 1970s, by late 1982 all these countries faced a severe cut in foreign financing; they had come to share the harsh reality of the debt crisis. In the years to follow their experiences would again differ, as they tended to follow somewhat different adjustment programs.
The behavior of the world economy during the early 1980s, and in particular the increase of interest rates, the decline in commodity prices, and the sluggish growth of the industrial countries, played an important role in determining the magnitude and timing of the c r i ~ i s . ~ A recent study by CEPAL has estimated that for the Latin American nations, the deterioration of unit prices of non-oil exports and the hike in world interest rates “explain” almost 50 percent of the increase in the region’s current account deficit during 1981 and 1982.6
The magnitude of external shocks can be better understood by ana- lyzing the evolution of the real interest rate “relevant” for these coun- tries, computed as nominal LIBOR (London Interbank offer rate for

164 Sebastian Edwards
dollar deposits) deflated by the rate of inflation of their exports. This concept of real interest rate combines in one indicator the effects of both the higher international nominal interest rates and the lower com- modity export prices, For the case of Latin America, this measure of the real interest rate jumped from an average of -3.4 percent during 1970-80 to 19.9 percent in 1981, 27.5 percent in 1982, and 17.4 percent in 1983. During the early 1980s even those countries with a large per- centage of their debt contracted at fixed concessionary terms experi- enced dramatic increases in their interest bill. For example, as a result of the higher world interest rates, the Ivory Coast’s interest payments increased from 3.1 percent of GDP in 1980 to more than 8 percent of GDP in 1983.
The adoption of inadequate exchange rate policies constitutes one of the most important domestic causes of the crisis; most of the coun- tries that eventually experienced payments difficulties allowed their real exchange rates to become highly overvalued during the late 1970s and early 1980s.’ The case of the countries of the Southern Cone of South America is a primary example of inadequate exchange rate pol- icies. In Chile, for example, after a period with a passive crawling peg, and as a way to bring down a stubborn inflationary process, the cur- rency was fixed to the U.S. dollar in June of 1979, at the 3dme time as wages were indexed to past inflation and capital controls were relaxed. As a result, the real exchange rate appreciated by more than 30 percent between 1979 and mid-1982, provoking a major deprotection of the domestic tradables sector and a gigantic current account deficit that exceeded 14 percent of GDP in 1981.8 Argentina and Uruguay adopted a declining preannounced rate of devaluation, also as a way to reduce inflation. However, contrary to the case of Chile, in Argentina and Uruguay the predetermined rate of devaluation was clearly inconsistent with the magnitude of their fiscal deficit. This resulted not only in a substantial real appreciation, but also in a steady loss of credibility in the sustainability of the stabilization and liberalization programs, and in major capital flight.9
In Mexico, as a result of a highly expansive fiscal policy, which was coupled with a quasi-fixed nominal exchange rate, the effective real exchange rate experienced a real appreciation that exceeded 40 percent between 1976 and February of 1982. In 1976-77 in an effort to put an end to an acute situation of real exchange rate overvaluation, the Mex- ican peso was devalued by almost 80 percent relative to the U.S. dollar. By 1981, however, the real value of the peso was already below its 1976 level; in less than 5 years more than 100 percent of the real effect of the devaluation had fully eroded. This case is particularly interesting since it clearly illustrates the difficulties that developing nations have many times faced when trying to engineer a real devaluation (see Ed- wards 1987).

165 Structural Adjustment Policies in Highly Indebted Countries
The mismanagement of exchange rate policy was by no means a monopoly of the Latin American countries. For example, the Ivory Coast, the Philippines, and Nigeria, among the highly indebted coun- tries, also experienced important degrees of real exchange rate over- valuation during the period preceding the crisis. In both the Ivory Coast and the Philippines real appreciation exceeded 15 percent between 1978 and 1982, while in Nigeria it boardered 10 percent during the same period.
The exchange rate policy was not inadequate in every developing country, however. In Colombia, Indonesia, and Korea, for example, the adoption of an active exchange rate management, including periodic devaluations, was an important component in overall strategies aimed at reducing the effects of world economic fluctuations. In that regard, Indonesia's exchange rate and macro policies were quite successful as a means to combat the Dutch disease effects associated with the oil booms. Also, Colombia's pragmatic approach towards exchange rate management allowed the country to avoid the deprotection effects of the coffee boom of 1975-79 and to maintain a reasonable macroeco- nomic equilibrium.'O
Perhaps one of the most devastating effects of the generalized ten- dency towards overvaluation is that it fueled massive capital flight out of the developing world. In country after country, as it became in- creasingly apparent that the overvaluation was unsustainable in the longer run, the public began to speculate heavily against the central bank by acquiring foreign exchange and moving it abroad. Moreover, in some countries, such as Chile and Argentina, the overvaluation cast doubts on the continuity of an overall development strategy based on liberalization and open markets. In Chile the public began to expect a hike in import tariffs and tried to anticipate it by acquiring imported durables in record quantities (Edwards and Cox-Edwards 1987). Al- though because of its semi-illegal nature it is not easy to find official data on capital flight, most available estimates concur in suggesting that in most of the Latin American countries there was a significant increase in capital flight during the years surrounding the debt crisis. In a recent empirical study Cuddington (1986) found that there is a significant relation between overvaluation and capital flight. Table 4.3 contains estimates on capital flight for six developing countries. There is an interesting contrast between the Latin American and the Asian nations. In particular notice that in Korea, a country that by and large avoided the temptation of real exchange rate overvaluation, between 1979 and 1984 capital flight was, on average, negative.
4.2.2 The Adjustment
In August of 1982, immediately following Mexico's formal announce- ment that it was facing serious financial difficulties, the international

166 Sebastian Edwards
Table 4.3 Estimates of Capital Flight in Selected Developing CountriesP (billions of U.S.$)
1979 1980 1981 1982 1983 1984
Argentina 2.2 3.5 4.5 7.6 I .3 - 3.4 Brazil 1.3 2.0 - 1.4 I .8 0.5 4.0
Mexico - 1 . 1 2.2 2.6 4.7 9.3 2.6
Venezuela 3.0 4.8 5.4 3.2 3.1 4.0
Korea -0.5 -0.7 - 0.8 0.5 -0.7 - 0.6
Philippines 0.0 -0. I I .3 0.0 - 1.5 - 1.8
Source: Cumby and Levich (1987). "These estimates use William Cline's definition of capital flight as computed by Cumby and Levich.
financial community greatly reduced the amount of funds intermediated to the developing world. Even countries such as Colombia-which had not faced payments problems, had no serious macroeconomic dis- equilibria, and had not accumulated debt at a very fast pace-were affected by this reduction in foreign lending. In fact, it is fair to say that the availability of foreign funds was reduced in a brutal way. For the developing world as a whole external financing was reduced by almost 40 percent between 1981 and 1983. Moreover, the major debtors were forced to fully close a current account deficit, which in 1982 exceeded $50 billion, in less than 3 years. By 1985 the aggregate current account had reached virtual equilibrium ( - $0.1 billion). In order to achieve this significant adjustment, these countries had to engineer a major turnaround in their trade balance, which went from an aggregate deficit of almost $7 billion in 1981 to a surplus of more than $40 billion in 1984. Table 4.4 contains data on exports, imports, the trade balance, and the current account, that very vividly capture the magnitude of the adjustment.
As can be seen from table 4.4 after reaching a record level in 1984 (almost $44 billion) the aggregate trade surplus of the major debtors has experienced a steady decline and it is expected that in 1988 it will be just over $22 billion. This rapid deterioration in the aggregate trade balance is to a large part a reflection of the Brazilian and Mexican situations.
Latin America was severely affected by the sudden unavailability of loans. Table 4.5 contains data on the net transfer of resources to the region from 1973 to 1986. As can be seen, starting in 1982 the net transfer of resources became significantly negative; between 1982 and 1986 the annual net transfer averaged -$26.4 billion, compared to a positive yearly average net transfer of more than $12 billion between 1976 and 1971. In real terms the net turnaround of resource transfers

167 Structural Adjustment Policies in Highly Indebted Countries
Table 4.4 Current Account and Trade Balance for 15 Highly Indebted Countries: 1979-88 (billions of U.S.$)
Year Export (FOB) Imports (FOB) Trade Balance Current Account
1979 1980 1981 1982 1983 1984 1985 1986 1987 1988
94.2 127.1 126.1 111.5 111.1 123.4 119.2 98.6
101.5 112.2
96. I 122.7 133.6 108.3 82.8 80.2 78.4 75.7 83.3 90.3
- 1.9 4.4
-7.5 3.2
28.3 43.2 40.8 22.9 18.8 22.3
- 24.6 -29.5 -50.3 -50.6 - 15.2 -0.6 -0.1
-11.8 - 14.0 - 10.5
Source: IMF's World Economic Outlook (April 1987).
Table 4.5 Capital Inflows and Net Transfer of Resources in Latin America: 1976-86 (billions of U.S.$)
Year Net Capital Inflows Net Interest Payments Net Transfer of Resources
15.5 11.5 10.4
1976 17.9 6.8 1977 17.2 8.2 1978 26.2 10.2 1979 29.1 13.6 1980 29.4 17.9 1981 37.5 27. I 1982 20.0 38.7 - 18.7 1983 3.2 34.3 -31.2 1984 9.2 36.2 1985 2.4 35.3 - 32.9 1986 8.6 30.7 - 22.1
Source: CEPAL (1986b, table 14).
exceeded $70 billion in the short period of three years between 1980 and 1983!
These very rapid adjustments in the current account and trade bal- ance were achieved in all cases by reductions in imports and in in- vestment. As can be seen from table 4.4 in the highly indebted countries the nominal dollar value of exports was lower in 1986 than in 1980, with the magnitude of this decline exceeding 15 percent. This drop was basically the result of a decline of almost 25 percent in the export prices of these countries between 1980 and 1986. In Latin America the de- terioration of the terms of trade was so severe (see table 4.6), that in spite of an increase in the quantity of exports of 30 percent between 1980 and 1986, 100 percent of the net adjustment of the trade balance improvement has also been achieved by means of a reduction of imports.

Table 4.6 Terms of Trade in Latin America Between 1981 and 1986 (Index, 1980 = 100)
Cumulative Rate
Index Rate of Change (%) of Change (9
I984 1985 1986 1981-86
Latin America
Oil Exporters Bolivia Ecuador Mexico Peru Venezuela
Oil Importers
Argentina Brazil Colombia Costa Rica Chile El Salvador Guatemala Haiti Honduras Nicaragua Panama Paraguay Dominican Kepublic Uruguay
87 92 sn no 95 97 93 63 97 112 110 86 82 96 85 58 93 86 x4 62 96 94 89 77
104 116 114 62
82 89 83 94
82 99 87 75
94 101 97 114
84 78 72 79
85 88 83 95
93 96 76 95 83 10s 97 119 91 95 97 105 90 134 110 102
99 99 93 96
78 86 83 102
86 90 88 107
83 73 69 87
66 83 8s IW
77 8s 72 83
-9.0
- 10.3 4.0
- 1.3 - 13.9 - 9.5 - 7.9
- 8.3
- 11.7 - 6.0
2.2 - 2.0 - 13.2
2.2 - 5.5
3.6 -5.3 - 10.3 - 12.6 -31.3
3.8
6.9
1.1
5.0 2.7
- 17.7 6.7
19.7 8.9
-0.1
- 4.6 - 2.5
2.8 9.6
3.4 - 10.7
0.9 - 3.3
9.7 -3.9 - 5.5
6.9
8.3
-11 .8
6.5
2.0 16.4 17.0 - 7.2 - 2.8 12.1
9.4
21 .0 10.1 6.9 5.2
- 6.3 ~ 12.0
3.4 26.1
3.2 26.9 4.6
49.8 9.7 0.4
-5.0 -8.7
-3.4 -32.2 -2.2 -21.5
-10.8 -31.9 -2.3 -26.4 -5.1 - 12.8 - 1.9 -45.5
- 6.6 12.8
-12.1 -13.3 -3.4 22.6 - 3.9 17.6 - 2.8 21.2 - 8.0 9.3 - 5.0 26.6 -6.0 14.3
2.7 22.5 - 20.9 24.8 - 7.8 23. I
2.2 8.2 - 17.9 -7.2 - 14.8 15.2 - 5.6 2.6
20.0
- 36.9 - 13.8
- 38. I
- 38.0
-41.9
22.6
~ 6.0
- 24.9 1.6
13.9 6.5
- 21.3 - 12.9 -5.5
4.4 - 5.4 19.4 5.0 2.3
- 16.9 - 4.0
Source: CEPAL (1986b).

169 Structural Adjustment Policies in Highly Indebted Countries
For the major debtors as a group, investment declined from an av- erage of 26 percent of GDP in 1973-77 to an average of 17.2 percent in 1983-86. Table 4.7 contains data on investment ratios for a selected group of countries. As can be seen, with the exception of Chile, which started from an exceedingly weak position, in all of these countries the gross investment ratio declined significantly after the crisis, with the cases of Nigeria, the Philippines, and Venezuela being particularly dramatic. In most cases public investment and investment in the con- struction sector were the components more severely curtailed. In the case of public investment this was a result of restrictive aggregate demand policies implemented immediately after the crisis. Naturally, this decline in investment has serious consequences for the prospects of renewed growth. Not only has the adjustment been costly in terms of current output and employment, but also in terms of future income.
Most countries faced the need to reverse the direction of the net transfers by resorting to a combination of expenditure-reducing and expenditure-switching policies, including devaluation, the imposition of capital controls, and import quotas. The adjustment required both a significant increase in real interest rates as well as major relative price changes or real devaluations. In most cases the selection of policy packages was based on the perceived “effectiveness” of these policies in the short run, rather than on efficiency, income distribution, or welfare considerations. As a result of the efforts made to implement rapidly effective policies, a number of trade-offs between different objectives-including improvement in the current account and infla- tion-emerged during the process.
In most countries the expenditure-reducing policies have been cen- tered on efforts to cut public expenditure. In a number of cases the
Table 4.7 Gross Investment as Percentage of GDP in Selected Debtor Countries
Average 1975-80 1984
Argentina Bolivia Brazil Chile Ivory Coast Mexico Nigeria Peru Philippines Venezuela
25.2 29.5 25.9 13.2 26.5 24.4 25.3 16.6 30.1 34.3
17.8 28.5 17.0“ 13.7 22.1a 20.3“ 14.4 16.0 17.1 16.0
Source: International Monetary Fund.
“1983.

170 Sebastian Edwards
reduction of real public expenditure has been in fact very significant, with most of the cuts concentrating on public investment and govern- ment employees wages. According to CEPAL, in Argentina, Ecuador, Mexico, Uruguay, and Venezuela government expenditure was cut by more than 20 percent in real terms following the crisis.I1 Similarly, in Morocco real expenditure of the central government declined by 18 percent between 1982 and 1984, while in the Philippines this reduction exceeded 25 percent between 1982 and 1985.12
In spite of the effort to reduce overall public expenditures, govern- ment interest payments on the domestic and foreign debt increased quite significantly during the first five years of the adjustment process. This was a result of both the real devaluations engineered as part of the stabilization programs and of the deliberate policy of raising do- mestic interest rates in an effort to further curb aggregate expenditure. The negative effects of the devaluations on the interest bills of different governments are a good illustration of the trade-offs involved in the adjustment process. In the majority of the major debtors most of the foreign debt is owed by the government, either because the public sector originally contracted it, or because it took it over when the local private banking system collapsed, as in Chile. l 3 What real devaluations do is raise the (real) domestic currency cost to the government of raising the required funds to pay the interest bill. This effect has been signif- icant in countries like Argentina, Mexico, and Peru, where interest payments on public-sector foreign debt are a high proportion (i.e., approximately 20 percent) of total government expenditure.14 In a num- ber of countries, most notably in Argentina and Chile, the exchange rate policies followed during this period also became an important source of government expenditures. For example, in Argentina, the need to cover the exchange rate guarantee after the abandonment of the “tablita” generated staggering fiscal outlays. Similarly the adoption of a preferential (lower) exchange rate for foreign currency debtors in Chile resulted in an implicit subsidy that absorbed large amounts of foreign resources. l 5
In spite of the relatively successful efforts to reduce public expen- ditures, fiscal deficits increased in relation to the precrisis period in the major debtors as a group (see table 4.8). This was mainly due to the fact that in many of these countries total tax revenues were negatively affected by the recessions that followed the crisis. The steep increase in interest rates that took place in most countries also impacted neg- atively the fiscal accounts, by means of its effect on the public-sector domestic debt. Moreover, in most cases the sources of fiscal deficit financing were affected by the crisis. Up to 1982 in most instances the public-sector deficits were financed by foreign borrowing. The drying up of this source of funds forced the local governments to turn to the inflationary tax and to issuing additional domestic public debt.

171 Structural Adjustment Policies in Highly Indebted Countries
Table 4.8 Monetary Policy, Fiscal Policy, and Inflation in Highly Indebted Countries
Central Government Annual Percentage Fiscal Deficits as Average Percentage
Year Change of Broad Money Percentage of GDP Change of CPI”
1979 I980 1981 I982 1983 1984 1985 1986 1987 1988
51.8 55.2 64.0 69.3 86.7
117.7 125.4 73.9 n.a. n.a.
0.8 0.8 3.7 5.4 5.2 3. I 2.7 4.5 3.6 n.a.
40.8 47.4 53.2 57.7 90.8
116.4 126.9 76.2 86.3 87.2
Source: International Monetary Fund. AAverage annual inflation for 1969-78 was 28.5 percent.
The need to use inflationary financing placed pressure on the mon- etary and domestic credit policies which became significantly more expansive than the IMF, the World Bank, and the private bank officials felt they should have been. Table 4.8 contains summary data on mon- etary policy, the fiscal deficit, and the average rate of inflation in these countries. These data quite clearly illustrate some of the most inter- esting features of the emergency phase of the adjustment process. As is pointed out in more detail below, contrary to the historical experience with IMF sponsored programs, these have been stabilization programs with acceleration in monetary expansion, persistent high fiscal deficits that largely exceed the levels that prevailed before the crisis, and very high inflation.
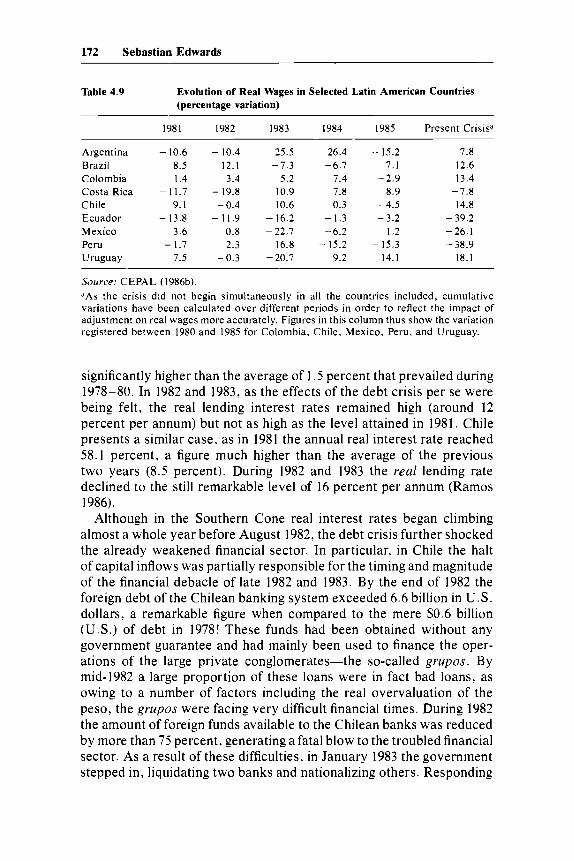
The restraint of wage increases was, in most countries, another major component of the expenditure-reducing package. Table 4.9 contains data on the evolution of real wages in selected Latin American coun- tries. As can be seen, with the exception of Argentina, Brazil, and Colombia, the decline in real wages has been significant.
In most countries the adjustment also relied on higher real interest rates, which helped keep expenditure, and in particular investment, in check. It should be noted, however, that in some cases the rise in real interest rates began some time before the “official” unleashing of the debt crisis in August of 1982. For example, in the countries of the Southern Cone, real interest rates began to climb quickly in mid-1981 as these economies were becoming clearly overheated; higher interest rates were in fact an early sign that in these countries the need for adjustment was quickly approaching. In Argentina the annual real lend- ing rate had already reached 19.3 percent in 1981, a figure that was
172 Sebastian Edwards
Table 4.9 Evolution of Real Wages in Selected Latin American Countries (percentage variation)
1981 1982 1983 1984 1985 Present Crisis"
Argentina Brazil Colombia Costa Rica Chile Ecuador Mexico Peru Uruguay
- 10.6 - 10.4 25.5 26.4 -15.2 8.5 12.1 -7.3 -6.7 7.1
- 11.7 - 19.8 10.9 7.8 8.9 1.4 3.4 5.2 7.4 -2.9
9.1 -0.4 - 10.6 0.3 -4.5 -13.8 -11.9 -16.2 -1.3 -3.2
3.6 0.8 -22.7 -6.2 1.2 -1.7 2.3 16.8 - 15.2 -15.3
7.5 -0.3 -20.7 -9.2 14.1
7.8 12.6 13.4 - 7.8 - 14.8 - 39.2 - 26.1 - 38.9 - 18.1
Source: CEPAL (1986b). "As the crisis did not begin simultaneously in all the countries included, cumulative variations have been calculated over different periods in order to reflect the impact of adjustment on real wages more accurately. Figures in this column thus show the variation registered between 1980 and 1985 for Colombia, Chile, Mexico, Peru, and Uruguay.
significantly higher than the average of 1.5 percent that prevailed during 1978-80. In 1982 and 1983, as the effects of the debt crisis per se were being felt, the real lending interest rates remained high (around 12 percent per annum) but not as high as the level attained in 1981. Chile presents a similar case, as in 1981 the annual real interest rate reached 58.1 percent, a figure much higher than the average of the previous two years (8.5 percent). During 1982 and 1983 the real lending rate declined to the still remarkable level of 16 percent per annum (Ramos 1986).
Although in the Southern Cone real interest rates began climbing almost a whole year before August 1982, the debt crisis further shocked the already weakened financial sector. In particular, in Chile the halt of capital inflows was partially responsible for the timing and magnitude of the financial debacle of late 1982 and 1983. By the end of 1982 the foreign debt of the Chilean banking system exceeded 6.6 billion in U.S. dollars, a remarkable figure when compared to the mere $0.6 billion (U.S.) of debt in 1978! These funds had been obtained without any government guarantee and had mainly been used to finance the oper- ations of the large private conglomerates-the so-called grupos. By mid-1982 a large proportion of these loans were in fact bad loans, as owing to a number of factors including the real overvaluation of the peso, the grupos were facing very difficult financial times. During 1982 the amount of foreign funds available to the Chilean banks was reduced by more than 75 percent, generating a fatal blow to the troubled financial sector. As a result of these difficulties, in January 1983 the government stepped in, liquidating two banks and nationalizing others. Responding

173 Structural Adjustment Policies in Highly Indebted Countries
to pressures by the international banks the Chilean government decided to take over these banks’ foreign debt, guaranteeing its payment. Par- adoxically, at the end of 1983 the Chilean financial sector was in some ways at the same juncture as it had been ten years before, in the midst of the Allende socialist government. It had been nationalized and was tightly controlled by the state (see Diaz-Alejandro 1985 Edwards and Cox-Edwards 1987).
After August of 1982 most countries also relied on expenditure- switching policies. These consisted in most cases of a combination of nominal devaluations and, at least initially, of a major escalation in the degree of trade restrictions.
The extent of the devaluations varied from country to country and were particularly severe in Latin America. In an effort to assure that the effects of the nominal devaluations on the real exchange rate did not erode through inflation, most countries adopted some kind of active exchange rate management where the exchange rate continued to be adjusted after the initial parity change. In fact, as of July 1986, out of the 15 major debtors 12 had some sort of crawling peg regime consisting of periodical adjustments of the nominal rate somewhat related to the differential between internal and external inflation.
Another important feature of the exchange rate policy followed by many countries was the adoption of multiple exchange rates. This ba- sically served three purposes. First, by implementing differential ex- change rates for capital and current account transactions-as in Venezuela-the authorities hoped to separate real transactions from the supposed volatility of capital movements. More important, how- ever, by imposing a free-floating exchange rate on unregistered capital flows the Venezuelan authorities tried to discourage capital flight with- out greatly affecting the current account. Second, multiple rates were also applied as a way to supplement the protective system. Indeed, when different exchange rates are applied to different commercial trans- actions, the resulting outcome is perfectly equivalent to a differentiated tariff schedule. This practice was again used by Venezuela, as well as by Mexico. And third, in some countries, such as Mexico, Chile, and Venezuela, a lower “preferential” exchange rate has applied to the private sector repayment of foreign debt. The rationale for this pref- erential rate was that in this way it would be possible to avoid the general bankruptcy of the private sector, which had borrowed heavily from foreign banks at the previously fixed nominal exchange rate.
Most countries were able to generate important real devaluations, which in some cases more than corrected the overvaluation that pre- ceded the crisis. In Turkey, for example, between 1982 and 1986 there was a 24 percent real effective devaluation, while in the Philippines the real devaluation amounted to more than 8 percent. It was, however,

174 Sebastian Edwards
Table 4.10 Real Effective Exchange Rate Indixes, 1980 = 100 (Trade Weight at 1980)
Argentina Bolivia Brazil Chile Mexico Peru Venezuela
1980 100.00 100.00 100.00 100.00 100.00 100.00 100.00 1981 99.1 I 79.75 84.06 85.52 87.97 85.77 89.00 1982 177.98 58.21 77.60 92.00 112.34 81.15 80.66 1983 188.62 71.15 91.10 115.91 132.97 85.59 75.51 1984 139.35 28.42 102.65 118.12 114.66 87.91 105.67 1985 173.78 9.5 103.85 145.52 106.22 101.91 104.81 1986 203.71 103.93 111.68 162.39 135.61 84.98 100.81
Note: An increase of this index indicates real devaluation, while a decline is a real appreciation. These real effective exchange rate indexes have been computed as the trade-weighted geometric average of the bilateral exchange rates adjusted by the ratio of domestic consumer price index to the corresponding trade partner wholesale price index.
in the Latin American countries that the more important turnarounds of real exchange rate behavior were achieved. As can be seen in table 4.10, in all of these countries the real effective exchange rate index shows that there have been significant real depreciations between 1982 and 1986.
As a result of these large nominal devaluations most countries ex- perienced important increases in their price levels. As noted above, in an effort to avoid the erosive effects of these price increases the Central Bank authorities decided to resort to further devaluations as a means of maintaining a high real exchange rate. Naturally this practice added fuel to the already accelerated rates of inflation (see table 4.11).
Table 4.11 Rate of Devaluation and Rate of Inflation in Selected Debtor Countries
Average Annual Devaluation Average Annual Inflation (%) (%)
Argentina Brazil Chile Ivory Coast Mexico Nigeria Peru Philippines Venezuela
301.2 195.1 39.5
1.3 81.5 18.9
111.4 24.3 17.1
366.5 175.5 24.2 19.9 76.9 21.9”
113.5 19.6 10.3
Source: IMF, lnrernarional Financial Starisrics. “1982-85.

175 Structural Adjustment Policies in Highly Indebted Countries
Immediately following the crisis in many (but not all) of the major debtors the devaluation policies were supplemented by the imposition of trade restrictions. Table 4.12, for example, presents data on some of the policies implemented by four countries.
An important question is whether the use of quantitative restrictions (QRs) instead of tariffs or more substantial devaluations during the initial phases of the adjustment has introduced unduly high costs in terms of growth and efficiency. A well-known proposition in the theory of commercial policy is that, in terms of welfare and income distri- bution, tariffs are generally superior instruments than quotas as a means to restrict trade.16 That type of analysis, however, is static and assumes perfect information on behalf of the authorities; according to this simple setting the relevant elasticities are known and thus it is possible to compute the exact height of the desired tariff. In reality, however, things are quite different, since the magnitudes of elasticities are only known in a very imprecise way. This means that in order to achieve a certain volume of imports with the use of tariffs, it is necessary to go through a trial and error process. This type of procedure may be very ineffective in cases such as the debt crisis where the foreign exchange value of imports has to be reduced very quickly, and where there are high penalties associated with surpassing that (much reduced) level of im- ports. For a small country that faces given foreign currency prices of imports, the use of quotas is an effective way of being sure that the value of imports (in foreign exchange) will not exceed a certain level.
Table 4.12 Examples of Additional Trade Restrictions during the 1982-86 Period
Argentina 1984: Decree 4070. All imports require a permit. All imports competing with local production are subject to authorization (with consultations to domestic producers' associations). Tariff surcharge of 10 percent over imports and 9 percent for exports.
Import surcharges ranging from 4 to 28 percent imposed 'on more than 30 items. Also, two-tier exchange rate established Import tariffs raised from 10 percent to uniform 20 percent. Import tariffs temporarily hiked to 35 percent. The uniform import duty system is stabilized at 20 percent (from the earlier uniform level of 10 percent).
QRs were imposed on all imports (during the 1970-80 decade QRs only affected 60 percent of imports).
Venezuela 1983: Foreign exchange controls and a two-tier official exchange-rate
1985:
Chile 1982:
1983: 1984: 1985:
Mexico 1982:
system. QRs on 70 percent of final consumption goods.
Source: The World Bank. QRs = quantitative restrictions.

176 Sebastian Edwards
As long as countries need to establish credibility regarding their will- ingness to adjust, it is particularly important not to surpass the prees- tablished level of imports.
Although there is some justification for the (very) short-term use of QRs in the very first phase of the adjustment, there are no good reasons for maintaining their use for long periods of time. From an efficiency perspective QRs have well-known undesirable effects. For example, Buffie and Sangines (1987) have argued that the generalized use of QRs in Mexico in 1982-84 resulted in an unnecessary reduction of imports of intermediate inputs, which greatly hurt the Mexican economy.
Some countries have recently relaxed trade restrictions, while others have announced some easing up for the near future. In Chile, for ex- ample, tariffs were reduced to a 20 percent uniform level. Mexico has taken some steps towards reducing the coverage of licenses, while in Bolivia, as part of the stabilization program aimed at stopping hyper- inflation, quotas have been abolished and tariffs reduced. As is dis- cussed in more detail below, in many countries trade liberalization packages are being discussed as a part of conditionality agreements with the multilateral institutions.
In spite of the significant efforts to adjust made by most of these countries-and of the costs incurred in the process-the magnitude of their trade surpluses has systematically fallen short of their interest payments. In Latin America, for example, in 1986 the interest bill amounted to 5.3 percent of GDP while the trade surplus reached 2.3 percent of GDP. In most countries up to now this financing gap has been closed, usually after long and protracted negotiations, by packages of funds provided by the banks and the multilateral institutions. It is important to notice, however, that the banks have been able to signif- icantly reduce their exposure to the major debtors in spite of the fact that they have made some contributions to financing these funds short- falls (see IMF 1987).
Up to now banks have relied on the policing activities of the mul- tilateral institutions, and in particular of the IMF, for determining whether a particular country is making a “sufficient” effort to adjust. A question that is still unresolved is whether the banks will make a serious commitment to providing additional financing to the indebted countries in the next few years.
A number of studies have suggested that for the great majority of the highly indebted countries it would not be possible to generate in the short run trade surpluses of a magnitude sufficient to cover interest payments without further decreasing the level of real consumption. Selowsky and van der Tak (1986), for example, have estimated that a “typical” major debtor would need additional financing for approxi- mately five years in order to experience some recovery in real con-

177 Structural Adjustment Policies in Highly Indebted Countries
sumption (2 percent per year) and in real income (4 percent per year). Under these assumptions, since the rate of growth of income exceeds that of consumption, domestic savings rise continuously. According to this simulation exercise after five years “the typical” major debtor would start to amortize its debt. After six more years the debt would have been reduced to “normal” levels, and the country would again be “creditworthy.” Cline (1987) has recently argued, along similar lines, that banks could and should indeed increase the amount of funds being intermediated to those countries that show progress in their adjustment efforts.
4.2.3 Crisis Adjustment and Traditional Stabilization Programs
The above discussion shows that, in spite of the active involvement of the International Monetary Fund, the programs followed by most of the major debtors between 1982 and 1986 differed in a number of key respects from the typical IMF sponsored program of the pre-1982 era. These differences mainly involve the selection of policy packages, as well as the availability of additional financing. Also, the behavior of the exogenous variables, including the international environment, has tended to differ from the historical experiences.
According to Khan and Knight (1985) we can distinguish a macro- economic and a structural adjustment component in the typical IMF program. The macro or demand management package is mainly based on restrictive monetary, fiscal, and domestic credit policies, aimed at eliminating the disequilibrium between aggregate demand and aggregate supply, improving the current account, and reducing inflation. Special emphasis is usually placed on the control of fiscal deficits. The struc- tural adjustment or resource reallocation package, on the other hand, usually includes three main policy blocks: (1) trade liberalization, (2) financial reform, and (3) major devaluation including exchange rate unification in the case of multiple rates.
The objectives of the structural adjustment component of conven- tional programs are to increase efficiency, raise investment, and en- hance growth opportunities. Historically, for most countries the implementation of IMF sponsored programs has not taken place at the same time that a gigantic foreign debt is being serviced. Quite the contrary, it has usually been assumed that while implementing the structural reforms, these countries can command significant additional net funds from abroad (see Khan and Knight 1985). Although this may have been the case in the past, it is very far from today’s reality, when the highly indebted countries have to generate a significant net transfer of resources to the rest of the world.

178 Sebastian Edwards
In terms of outcome, an historically “successful” IMF program can be described by a reduced fiscal deficit, lower inflation, more liberalized trade, and an improvement in the current account and balance of pay- ments. In many ways the current (1982-86) adjustment looks very different from this IMF blueprint. Generally speaking, and as is cap- tured by tables 4.8 and 4.11, this has been an inflationary adjustment process with high and persistent fiscal deficits. Additionally there has been an escalation in the degree of distortions of the external sectors, with a profusion of QRs and multiple exchange rates.
The behavior of investment has also been very different during the current crisis adjustment period when compared to the historical epi- sodes. In a detailed study of 39 historical episodes of structural ad- justment programs between 1962 and 1982, Edwards (forthcoming) found that for the group as a whole the investment ratio did not ex- perience a significant decline in any of the four years following the implementation of the programs. Moreover, according to this study, on average in these historical episodes it is not possible to detect, as in the current case, significant declines in real output.
To a large extent the “unorthodoxy” of these new stabilization and adjustment programs can be attributed to three main factors: (1) the magnitude of the adjustment required, (2) the urgency with which it had to be implemented, and (3) the global nature of the crisis. In a way, when faced with the trade-offs between current account correc- tions, efficiency of the adjustment, and inflation, these countries opted- or were forced to opt-for the current account improvements placing, at least during the initial phases of the process, little priority on in- flation, efficiency, or costs. Implicitly the IMF endorsed or encouraged these adjustment programs, in spite of the fact that they departed from its traditional view. Now, however, as things are somewhat under control, more emphasis is indeed being placed on efficiency, growth, and other social costs. These issues are discussed in more detail in section 4.3.
4.3 Trade Liberalization and Adjustment with Growth
The emergency packages implemented until now have succeeded in averting what some considered to be an almost sure collapse of the world financial system. This has been achieved, however, at a signif- icant cost for the major debtors in terms of decline in employment, income, and standard of living. The key question now is how to move from the current situation towards what we can call phase 2 of the adjustment process, a phase characterized by adjustment with growth. At a more concrete level, the Baker and the Bradley plans, among other initiatives, clearly reflect the preoccupation of politicians with this issue.

179 Structural Adjustment Policies in Highly Indebted Countries
A number of authors-and indeed the supporters of the Baker plan, as well as the IMF-believe that a rapid trade liberalization, coupled with devaluation, privatization, and financial reform, is the most rea- sonable strategy to achieve these objectives. I 8 For example, Balassa et al. (1986, 88) have recommended that, among other things, the de- veloping nations should eliminate all QRs and reduce, in a period of five years, imports tariffs to a uniform 15 to 20 percent; these tariff reforms should be coupled with significant devaluations in order not to “deprotect” the tradable goods sectors.19 To a large extent these recommendations are very similar to what many economists have been advocating for many years for the developing countries. However, these new proposals are more drastic, in the sense of arguing for a bolder movement towards free trade. The current proposals on signif- icant trade liberalizations have not involved a detailed discussion of the important issues related to strategy, including the appropriate speed and sequencing of reform. Also, there has been little consideration on the possible short-run trade-offs between these liberalization reforms aimed at improving efficiency and other objectives of the overall programs.
Most of the traditional literature on trade liberalization has assumed that these reforms take place in the absence of a foreign debt overhang problem. Moreover, many writers have assumed that during the trade reform process countries will be able to attract substantial voluntary lending. McKinnon (1973, 1982), for example, has forcefully warned us of the dangers related to excessive capital inflows during a trade liberalization episode. However, it is clear that at the present time, in the vast majority of LDCs there is very little danger of trade liberali- zation attracting excessive (or indeed any) voluntary capital inflows. Today, the problem is quite the opposite: Countries have to generate a positive resource transfer to the rest of the world.
The purpose of this section is to analyze some specific issues related to trade reforms. I first discuss the relation between outward orien- tation, trade liberalization, and export promotion. I then analyze issues related to the order and speed of reforms, focusing on the relation between stabilization policies and trade reforms and on the unemploy- ment effects of liberalization. Finally I deal with the role of devaluation and of credibility during a structural adjustment process.
4.3.1 Outward Orientation, Export Promotion, and Trade Liberalization
There is by now an impressive amount of empirical evidence sug- gesting that countries that have adopted outward-oriented development policies, which emphasize export promotion, have outperformed those countries that have followed inward-oriented strategies based on import substitution. Even CEPAL-not exactly known for its endorsement of

180 Sebastian Edwards
outward policies-has recently recognized that the excesses of import substitution have been very costly for Latin America: some of its senior staff members have recommended that in the future export promotion should play a more central role in that region’s development policies.20
There seems to be relatively less agreement, however, on whether “trade liberalization” packages have played an important role in the performance of the outward-oriented economies. For example, in a recent paper Sachs (1987) questioned the idea that trade liberalizations are indeed a required component of successful outward-oriented strat- egies. Making reference to the experiences of the East-Asian coun- tries-Japan, Korea, Singapore, Taiwan, and Hong Kong-Sachs argues that the success of these countries was to a large extent due to an active role of government in promoting exports in an environment where imports had not yet been fully liberalized, and where macro- economic (and especially fiscal) equilibrium was fostered. Whether one agrees with Sachs depends on how outward orientation, export pro- motion, and trade liberalization are defined. Recently some confusion has emerged regarding these concepts, and it is not exactly clear what people mean by them.
In the more traditional policy literature of the 1960s and 1970s trade liberalization was defined in a very general way: What economists usually meant was some relaxation of trade and exchange controls. In fact, in the by now classic NBER study on trade regimes directed by Bhagwati and Krueger, a liberalization episode was defined as a more extensive use of the price mechanism that would reduce the anti-export bias of the trade regime.*’ In her 1986 review article on the problems of liberalization, Krueger went as far as saying that even a (real) de- valuation in the presence of QRs constituted a liberalization episode. These are indeed very mild definitions of liberalization. In fact today very few people will raise an eyebrow about them. Only recently has “trade liberalization” acquired a more drastic connotation, meaning (for many people) an elimination of QRs coupled with a severe reduc- tion of import tariffs to a uniform level of around 10 percent. Moreover, recently trade liberalization has, in many ways, become synonymous with free-market policies involving minimum or no government inter- vention at any level.**
The difference between the old and new definitions of trade liber- alization is, to a large extent, one of degree or intensity. While a de- valuation in the presence of QRs, or the replacement of QRs by (quasi) equivalent tariffs is a mild form of liberalization, the reduction of tariffs (with no QRs) to a uniform 10 percent or, for that matter, the complete elimination of tariffs is a very drastic liberalization. In order to clearly understand the different issues involved in policy discussions it is, crucial to specify the intensity of liberalization we are referring to.

181 Structural Adjustment Policies in Highly Indebted Countries
Unfortunately this is not always done; the policy literature on the subject is plagued with imprecisions and ambiguities.
There is little doubt that a successful export promotion policy re- quires some kind of trade liberalization. In fact, the historical evidence clearly shows that those countries that have successfully embarked on that kind of strategy have had a more ‘‘liberal’’ trade regime than those countries following indiscriminatory import substitution. The success- ful outward-oriented countries have generally had lower coverage of prior license systems, lower average tariffs, less dispersion in their tariffs, and less episodes of real exchange rate o v e r ~ a l u a t i o n . ~ ~
In a recent major multi-country study by the World Bank it was found that there was a clear relation between movements toward more liberal trade systems and a higher performance (Papageorgiou, Mi- chaely, and Choksi 1986). In that regard, the case of Korea-one of, if not the most successful of the export-oriented countries-is very educating. In 1985, for example, 90 percent of Korean imports were subject to automatic approval (Lee, were not subject to any form of QRs) and the average tariff rate was only 26 percent. Moreover, the tariff structure was characterized by higher tariffs concentrated on final goods, with capital equipment and intermediate inputs having relatively low degrees of p r o t e ~ t i o n . ~ ~ This extent of import protection was sig- nificantly below that of most of the developing nations and also below the degree of Korean protection in 1965, before the outward-oriented policy was embraced. The Korean experience of export promotion coupled with trade liberalization can be contrasted with the Chilean case. Between 1975 and 1979 a drastic trade liberalization that elimi- nated all QRs, and reduced tariffs to a uniform 10 percent in four years was implemented in Chile; in addition, as part of a massive move towards free market orientation, this period’s policies almost com- pletely eliminated the government’s role in defining external sector strategies. By allowing the real exchange rate to slip by approximately 30 percent between 1979 and 1982, the Chilean experience of that period became one of ultra trade liberalization without export promotion (see Edwards and Cox-Edwards, 1987).
Within the Latin American context Colombia after 1967 provides another educating example of successful export promotion with some trade liberalization. Until that year the Colombian external sector was highly distorted and had been subject to deep and recurrent crises; coffee exports provided most foreign exchange, and the Colombian economy was subject to the vagaries of the world coffee market. In 1967 three major measures were taken. First, any attempt to fix the exchange rate was abandoned, and a crawling peg system aimed at avoiding real exchange rate overvaluation was adopted. Second, an aggressive export promotion program was enacted. Here a subsidies

182 Sebastian Edwards
scheme-the so-called CATS-and the government export promotion office (Proexpo) played an important role. And third, imports were greatly liberalized; in 1983 the average tariff in Colombia was only 29 percent, while the proportion of imports subject to QRs had greatly declined since 1967. As a consequence of these policies the Colombian noncoffee exports sector has performed in an efficient way, helping Colombia sustain a vigorous growth rate during the last 20 years.25 In fact, today Colombia stands alone among the Latin American nations as a country that escaped the traumatic debt experience of the crisis while being able to maintain a reasonable rate of growth.
Although the evidence supporting the merits of outward orientation is abundant, there is no well-developed theoretical model-or empirical evidence for that matter-linking very low (or zero) import tariffs to higher growth.26 Nor is there evidence suggesting that a completely “hands-off’’ policy on behalf of the government is the most desirable alternative. In fact, the success of the East Asian countries with export- led growth suggests that some selectively determined degree of inter- vention specially aimed at supporting exports, played a key role.*’ In this section no attempt will be made to solve the difficult and very important question of the optimal degree of government intervention, or of the optimal level and structure of import tariffs. This is indeed one of the most difficult question of economic policy, whose answer (even at the purely abstract and theoretical level) will depend on the existence of other distortions, the completeness of markets, and the availability of other policy tools, among other things. Instead we will proceed under the assumption that in most of the highly indebted coun- tries the current structure of import protection is higher than the (un- known) optimal level and that, in the long run, these countries will gain from engaging in sume trade liberalization that is aimed at reducing import tariffs and making them uniform. Under these (very plausible) assumptions, in the rest of this section we will discuss specific issues dealing with the appropriate speed and sequencing of the trade liber- alization component of an outward-oriented strategy.
4.3.2 Trade Liberalization with a Government Budget Constraint
An important policy question is whether the trade liberalization com- ponent of an outward-oriented strategy should be attempted at the same time as a country is embarked on a severe stabilization and anti- inflationary program. Not surprisingly, the answer depends on the in- tensity of the trade reform and of the ongoing inflation.
Historically, there has been a close link between mild trade liberal- izations and stabilization programs.28 Consider the following typical scenario leading to a stabilization program coupled with a mild to me-

183 Structural Adjustment Policies in Highly Indebted Countries
dium trade liberalization effort:29 At some point in time the authorities of a particular country decide to pursue a fiscal policy that is incon- sistent with the chosen nominal exchange rate regime, usually a pegged rate. Given the underdeveloped nature of the domestic capital market, the fiscal expansion is basically financed with domestic credit creation. As a result, there will be a loss of international reserves; domestic inflation will exceed world inflation, and the real exchange rate will become increasingly overvalued. In an effort to stop the drainage of reserves the authorities will usually respond by imposing exchange controls and by increasing the degree of restrictiveness of the existing trade impediments: tariffs will be hiked and QRs will be imposed. Naturally, as long as the ultimate causes of the macroeconomic dis- equilibrium-that is, the inconsistent credit and fiscal policies-are not tackled, all the authorities will gain by imposing new trade restrictions is a delay in the need for corrective macroeconomic measures. The real exchange rate will become more overvalued, international reserves will continue to decline, and a black market for foreign exchange will emerge. At some point this disequilibrium situation will become un- sustainable, and a stabilization program, usually under the aegis of the IMF, will be enacted. This program will usually consist of a significant nominal devaluation geared at correcting the overvaluation developed in the previous period, of a contractionary macroeconomic policy, and of a liberalization of trade restrictions aimed at dismantling those con- trols imposed during the expansionary phase of the process. These types of trade liberalizations have historically been mild and have sel- dom consisted of complete elimination of QRs and major tariff reduc- tions of the kind now recommended for the indebted countries.30
Table 4.13 contains a summary on the evolution of trade exchange and capital controls in the period immediately following the adoption of 14 major Latin American stabilization episodes. In determining the timing of these programs, the implementation of the major nominal devaluation was taken as defining the beginning of the program. As may be seen, in many countries there were mild, and sometimes short- lived liberalizations; out of these 14 episodes we do not find a single major liberalization attempt.
Perhaps Chile during 1975-81 constitutes the most notable case of a major liberalization undertaken in conjunction with a major stabi- lization effort. The trade liberalization that eventually eliminated all QRs and reduced tariffs to a uniform 10 percent level was pursued at the same time as inflation was being reduced from 400 percent to 10 percent.3' The Chilean episode illustrates very vividly one of the most serious trade-offs that emerges when a major liberalization is under- taken at the same time as a major anti-inflation program. As in most successful stabilization programs, in the last phase of the Chilean

184 Sebastian Edwards
Table 4.13 Summary of Evolution of Exchange Controls and Trade Restrictions after Enactment of Stabilization Programs in Selected Latin American Countries
Payments Tariffs, Restrictions
Country Year Current Transactions Related Measures Transactions Restrictions on Duties, and Cost- on Capital
Argentina
Bolivia
Bolivia
Chile
Colombia
Colombia
Colombia
Costa Rica
Ecuador
Ecuador
1970
1972
1979
1982
I962
1965
1967
I974
1961
I970
Decreasing restrictions for one year. Then highly restrictive
No significant changes
No significant changes
No changes for 2 years
Decreasing
Short-lived liberalization
Slow liberalization
Very short run liberalization
No clear pattern
Slight liberalization
Short run liberalization; abrupt increase in tariffs 6 months after devaluation
No change for 1 year. Rapid increase in tariffs I year after
Mild liberalization
Slight increase in tariffs: no advanced deposits.
Liberalization of advanced deposits
Short-lived liberalization of advanced deposits
Slow liberalization
Short run liberalization tariffs were later raised
No change in tariffs: increase in advanced deposits rates
Mild reduction in tariffs: important liberalization of advanced deposits
Increased restrictiveness
No change
Slight liberalization of capital movement ceilings
Slight reduction and then increase in restrictions
No change
After 14 months restrictions greatly hiked
Mild liberalization
Restrictions on capital flows introduced
No change
Mild liberalization of capital movement restrictions

185 Structural Adjustment Policies in Highly Indebted Countries
Table 4.13 (continued)
Payments Tariffs, Restrictions Restrictions on Duties, and Cost- on Capital
Country Year Current Transactions Related Measures Transactions
Nicaragua 1979 Very slight No changes Very sharp liberalization increase in
degree of restrictions
Peru 1967 Increased Tariffs raised Sharp restrictiveness increase in
restrictions
Peru 1975 No significant Increase in tariffs Slight change levels liberalization
Venezuela 1964 Slight increase in No change No change restrictiveness
Source: Constructed from information obtained from various issues of the IMF's Annual Report on Exchange Arrangements and Exchange Restrictions and from various issues of Pick's Yearbook and World Currencies Yearbook.
stabilization effort when inflation was reduced from 40 percent to 9 percent per annum, there was a significant real exchange rate appre- ciation that reduced the degree of competitiveness of the tradables sector at a time when, because of the trade reform among other factors, the equilibrium real exchange rate had significantly depreciated. In the Chilean case this real appreciation was partially the result of the active use of exchange rate management to bring down inflation; in mid-1979 the nominal exchange rate was fixed relative to the dollar. As is well known by now this real appreciation played an important role in the disappointing outcome of the Chilean episode; it seriously deprotected the tradables sector, it generated perverse expectations of devaluation and, ultimately, it conspired with the high real interest rates to provoke the worst financial debacle of Chilean history (Ed- wards and Cox-Edwards 1987).
A crucial objective of any stabilization program and, as pointed out in section 4.2, indeed of those undertaken by the major debtors, is to reduce the magnitude of the fiscal deficit. Many times there will be an important trade-off between a trade liberalization that reduces import tariffs and the achievement of this fiscal objective. Surprisingly, the pol- icy and theoretical literatures on trade liberalization policies have most times tended to ignore the fiscal role of tariffs in the developing nations. Most theoretical and policy discussions on trade liberalization assume, along the lines of traditional trade theory, that tariff proceeds are handed back to the public. In reality, however, things are very different, with governments using tariff proceeds to finance their expenditure. This is

186 Sebastian Edwards
particularly the case in many of the poorer developing countries where for different institutional reasons taxes on international trade represent a high percentage of government revenue. Table 4.14, for example, con- tains data on the fiscal importance of taxes on international trade for eight countries. As may be seen, taxes on trade are as high as one-third of the total revenue of the central government.
As long as tariff rates are below the maximum revenue tariff, there will be a trade-off between trade liberalization and the generation of the government surplus required to finance debt servicing. While the reduction of tariffs will generally reduce distortions, it will also have a negative effect on government finances. What is required, then, is to replace trade restrictions by less distortive taxes that can generate the same (or a higher) amount of revenue. This, of course, means that major reforms of the tax system would be required in most countries. As long as this tax reform effort also focuses on efficiency aspects, it will tend to be concentrated on the imposition of a value-added tax (VAT), among other taxes. This is not easy and takes time, as a number of efforts to implement sweeping tax reforms have recently shown. Tax reforms are not only politically difficult to have approved, but from an administrative perspective it is many times very difficult to get them going. This is particularly the case in the poorer countries where the preexisting tax system is extremely rudimentary. Indeed the recent Indonesian tax reform has very clearly shown the difficulties involved in these types of efforts. (See Conrad and Gillis 1984). However, in middle income countries where there is an operating tax system of some sophistication, a major tax reform can be implemented with some speed. The Chilean tax reform of 1975 is, in that sense, a good example;
Table 4.14 Taxes on International Trade as a Percentage of Government Revenue: Selected Developing Countries, 1984
Argentina Bolivia Chile Indonesia Korea Mexico Peru Philippines
Import Tariffs 1' ( Total Tax Revenue Total Revenue
4.9% 13.3% 25.6 30.0 13.4 10.8 3.5 3.3
16.1 14.0 3.0 2.7
10.2 n.a. 22.1 23.7
Source: Constructed from raw data from the International Monetary Fund's Government Finances Slutistics Yeurbook. "Refers to central government. n.a. = not available.

187 Structural Adjustment Policies in Highly Indebted Countries
in little over a year a major tax overhaul that introduced a VAT, full indexation, and unification of corporate and noncorporate tax rates was successfully implemented (Corbo, de Melo, and Tybout 1986).
Although in most cases the implementation of a major tax reform will take a substantial amount of time, there are some policies con- ducive both towards improved efficiency and higher revenues in the short run. The most obvious one is the replacement of QRs, (i.e., licenses, prohibitions, and so on) by import tariffs. A well-known fea- ture of QRs is that unless they are auctioned, the government misses the revenue associated with the trade restriction. By replacing the QR by a tariff it is possible for the government to recapture this revenue.
The replacement of QRs by tariffs has two other potentially desire- able effects. First, there is a potential for a positive effect on income distribution. This is be cause in most cases large (or even multinational) firms or large established merchants get the import licenses and, thus, the rents. By replacing the QRs by tariffs these rents are passed on to the government, allowing it to reduce other taxes, or even increase expenditures on social programs. Second, the replacement of tariffs by QRs will generally increase the effectiveness of devaluations. The rea- son is that the effects of devaluations are significantly different under quantity rationing (i.e,, import quotas or licenses) than under import tariffs. In the latter case a (real) devaluation will result in a higher price of both importables and exportables relative to nontradables. Under QRs, however, while the domestic price of exportables will still in- crease, that of importables will usually not be affected. All the deval- uation will do is reduce the rents received by the party that got the license.
A potential problem with the replacement of QRs by tariffs is that it is not easy to decide on the tariff level that should be imposed instead of the QR, since under a number of plausible conditions (domestic monopoly being perhaps the most common) tariffs and quotas will not be equivalent. In this case there is no tariff that will exactly replicate both the domestic price and quantity resulting from the QR. One pos- sible alternative policy that has been used with some success in a few countries is to auction the quotas rather than allocate them in an ar- bitrary way.32 Among the attractive features of this option is the fact that it is possible to maintain certainty on the volume imported, while at the same time the government captures back the rent associated with the quota allocation.
To sum up, in many countries, and in particular in the poorer ones with rudimentary tax systems, taxes on trade are a very important source of government revenue. This introduces an important trade-off between trade liberalization reforms and the maintenance (or achieve- ment) of fiscal balance. In terms of the sequencing of reform, then, an

188 Sebastian Edwards
important principle is to make sure that tariff reduction reforms should only be undertaken once the fiscal sector has been reformed and other sources of revenue have been found.33 Replacing QRs by tariffs or devising a QRs-auctioning system are measures that can be imple- mented without producing fiscal costs, while at the same time they improve efficiency. Also, by solving the fiscal imbalance first, the pos- sibility of real exchange rate overvaluation is reduced.
4.3.3 Tariff Reform and Unemployment
The effects of trade reform on employment are a key consideration when evaluating the short-run effects of these policies. This is partic- ularly the case under the current conditions, where countries are al- ready experiencing very high levels of unemployment. Moreover, from a political economy perspective the unemployment effects of any policy are crucial; democratic governments-and even those not so demo- cratic, but in a weakened position-will try not to generate massive unemployment: The costs of unemployment are recognized in the short run, while the benefits of the structural policies that provoked it usually are reaped in the medium run, when a different government is in office.
According to the simplest textbook approach, in a small developing economy with capital-intensive imports, fully mobile factors of pro- duction, and flexible prices, the reduction of import tariffs will have no effect on total employment even in the short run. In this simple setup the only labor market effects of trade liberalization will be a reallocation of labor out of importables and an increase in the real wage rate. However, in reality there are a number of reasons why these textbook conditions do not hold, and why tariff reforms can result in a decline of employment in the short run.
The Ricardo-Viner model with downward real wages inflexibility provides the simplest model for illustrating the possible short-run un- employment effects of a tariff reform. In this model capital is, in the short run, fixed to its sector of origin; only slowly through time (and possibly via investment) can capital be reallocated. Contrary to the more traditional textbook case with full flexibility of price and resource movements, in this more realistic model a tariff reduction can result in a reduction of the equilibrium real wage rate required to maintain full empl0yrnent.3~ However, if for some reason such as government imposed minimum wages, indexation, or staggered contracts there is downward inflexibility of real wages, the required reduction in the wage rate will not take place, and unemployment will result. (See Edwards 1988a for a formal exposition on how this model works in a world with importables, exportables, and nontradables.) This unemployment, however, will only be of a short-run nature. As capital moves out of the importables sector and into the exportables and nontradables sec-

189 Structural Adjustment Policies in Highly Indebted Countries
tors, there will be forces working for the equilibrium real wage to increase, and those workers previously laid off will be rehired. A re- quirement for real wages to increase and for unemployment to disap- pear in the longer run is that capital is indeed reallocated. However, if the reform lacks credibility as has been the case very often with liberalization episodes capital will not be reallocated and unemploy- ment will persist (Edwards 1986).
A shortcoming of the version of the Ricardo-Viner model discussed above is that it assumes economy-wide real wage inflexibility and no initial unemployment. In fact, in most developing countries minimum or inflexible wages do not cover all sectors, and usually apply to the urban sector only. In that regard, a more satisfactory model can be built using a three-goods open economy version of the well known Harris-Todaro model with short-run sector-specific capital. (Through- out we maintain the very realistic assumption that importables are the most capital intensive, while nontradables are the most labor intensive goods.) Assume that while the importables (i.e., manufacturing) sector is subject to a minimum wage (in real terms), in the exportables and nontradables sectors there is wage flexibility. Initial equilibrium will be characterized by a positive amount of unemployment that will generate an equalization between the real wage in the exportables and nontrad- ables sectors and the expected real wage in the importables (manufac- turing) sector covered by the minimum wage. Under our assumptions the post-tariff reform short-run equilibrium (with capital still fixed to its sector of origin) will be characterized by (1) lower employment in the sector covered by the minimum wage (importables); ( 2 ) lower wages in the uncovered sector, expressed in terms of exportables; (3) either higher or lower equilibrium unemployment; (4) either lower or higher employment in nontradables; ( 5 ) higher employment and production of exportables. (see Edwards 1988a for a detailed analysis).
Not surprisingly this case of partial minimum wage coverage gen- erates very different results from the case of an economy-wide mini- mum wage discussed above. First, we now have an increase in production and employment in exportables. Second, it is possible that in our partial-coverage case employment in nontradables will also in- crease, Also, in this case a tariff reduction reform may generate smaller unemployment in the short run, whereas in the case of an economy- wide minimum wage greater unemployment always resulted in the short run as a consequence of a decline in the tariff (see Edwards 1988a for a detailed discussion).
These models suggest that, contrary to the simplistic textbook view, as long as it takes time to reallocate capital from one sector to the other and (real) wages are inflexible, a tariff reduction reform may very well result in unemployment. A first-best solution to this problem is to (fully)

190 Sebastian Edwards
eliminate the sources of real wage rigidity; with complete flexibility wages will, in the short run, go down until all the labor force is ab- sorbed. However, if for political or other reasons real wages cannot fall sufficiently, a second-best solution is to proceed slowly with the trade reform; tariffs should be reduced gradually in a preannounced fashion. In theory, in this way capital owners will have time to reallocate capital, avoiding the unemployment effects of the trade reform (see Edwards 1988a). Once again, for this solution to work, capital allocation should, in fact, respond to the announcement of reform; that is, the reform should be
The NBER multicountry study on trade regimes and employment directed by Anne Krueger (1983) has provided ample evidence sug- gesting that countries that have followed outward-oriented policies have generally had a better employment record, both in terms of employment creation and lower unemployment rates over the long run, than those nations that have adopted import substitution industrialization strate- gies. This study, however, refers to the long-run characteristics and performance of the labor markets and does not say much about the aggregate employment effects during the transition immediately fol- lowing a tariff reform.
The limited existing evidence on the short-run aggregate employment consequences of trade liberalization indicates that in the case of mild reforms there have not been significant aggregate unemployment ef- fects. This, indeed, would seem to be one of the preliminary conclu- sions of the exhaustive cross-country study undertaken at the World Bank and directed by Papageorgiou, Michaely, and Choksi (1986). It is, however, somewhat difficult to interpret the evidence from this massive investigation. For example, the episodes analyzed many times refer to exceedingly mild liberalizations; for example, the 1970 Turkish devaluation, included in the study, would barely qualify as even a very timid liberalization. Also, from these studies, it is not possible to know in a precise way whether specific changes in aggregate employment respond to the trade reform, or if they are the result of other policies. This is the case, for example, of the slight increases in aggregate un- employment observed after a number of trade reforms, including the Turkish liberalization of 1980, the Korean reform of 1979-80, the Phil- ippines’ liberalization of 1981, and the Israeli reform of 1972-77.
Once again the Chilean experience, with its textbook-type policies is educational. As already mentioned, between 1974 and 1979 Chile underwent one of the most, if not the most, ambitious trade liberali- zation of modern times: Quantitative restrictions were fully eliminated, a multiple exchange rate system consisting of up to 15 different ex- change rates was unified, and tariffs were slashed to a uniform 10 percent. During this same period unemployment in Chile was very high,
(See section 4.3.5 below.)

191 Structural Adjustment Policies in Highly Indebted Countries
reaching more than 20 percent in 1975 and never falling below 15 per- cent. A subject extensively debated in Chile’s popular media, as well as in the specialized press, is the extent to which the process of tariff reduction “contributed” to the unemployment problem. There is little doubt that as a result of the tariff reform a number of contracting, and even disappearing manufacturing firms laid off large numbers of work- ers. On the other hand, expanding firms from the exporting sectors increased employment, partially offsetting the negative effect. The net result, however, was an increase in unemployment generated by the trade reform. This negative effect was particularly marked in manu- facturing where firms worked their way out of the difficult situation created by increased foreign competition by trimming their payrolls and increasing productivity (Edwards and Cox-Edwards 1987).
There were two main ways in which the tariff liberalization generated short-run unemployment in Chile. First, there was a natural adjustment period where laid-off workers took time to start searching for work in a different, expanding sector. Second, the fact that in reality-contrary to the simplest textbook case-physical capital is fixed in its sector of origin made the expansion of production in a number of the exporting sectors somewhat sluggish at first. Only as additional investment took place through time was it possible to fully increase production and employment in these expanding sectors. However, the existence of wage rigidity and in particular of a minimum wage in real terms made the absorption of labor by the expanding industries more diffi~ult .~6 It is argued in Edwards (1985) that a slower reform would have resulted in a reduced unemployment effect. The proportion of total unemploy- ment that can be attributed to the tariff reform is, however, relatively small when compared to the magnitude of the overall unemployment problem. Edwards (1985), for example, calculated that an upper bound for the unemployment effects of the trade reform was 3.5 percentage points of the labor force, or 129,000 people, with the bulk of this unemployment located in the food, beverages, tobacco, textiles, and leather products subsectors (57,000 people). More recently, de la Cuadra and Hachette (1986) have calculated that the trade reform generated a reduction of employment in the manufacturing sector of approximately 50,000 workers. Even though these are not negligible numbers, they clearly indicate that an explanation for the bulk of the Chilean unem- ployment should be sought elsewhere.
The above discussion has concentrated on the possible beneficial effects of a gradual trade reform on employment. However, there are other channels, mainly via an intertemporal effect on expenditure, through which a gradual tariff reform can have positive effects on the economy. For example, a slow reduction of tariffs will generally have a positive impact on the savings rate and on the current account. To

192 Sebastian Edwards
the extent that the gradual trade liberalization process is a credible proposition, it will have a nontrivial effect towards reducing the con- sumption rate of interest. As the public expects tariffs, and thus the domestic price of importables, to be lower in the future it will postpone current consumption. Consequently savings will increase and the cur- rent account will improve.
In sum, a gradual lowering of tariffs offers a number of attractive features for economies such as those in the debt-ridden countries. First, this strategy is likely to reduce the short-run unemployment conse- quences of the trade reform. Second, there will likely be positive effects on savings, helping growth prospects. Third, it will tend to improve the current account. And finally, a gradual reduction of tariffs will have positive effects on the government budget. On the negative side a gradual trade reform may lack credibility, in which case it may even induce perverse responses (see section 4.3.5).
4.3.4 Structural Adjustment and Devaluation
Nominal devaluations are an important component of most stabili- zation programs, and as discussed in section 4.2 they have played a central role in the adjustment efforts following the debt crisis. The purpose of these nominal devaluations is to generate a real exchange rate adjustment, that would reverse the real appreciation that most times precedes the balance of payments crisis. In turn, by improving the degree of domestic competitiveness and raising the domestic price of tradables the real devaluations are supposed to improve the external sector accounts of the country in question. Historically, however, when implementing stepwise discrete nominal devaluations, many develop- ing nations have found it difficult to sustain the real devaluations for a long period. In a large number of cases after some time, usually ranging from one to two years, the real exchange rate effect of the nominal discrete devaluation has been fully eroded. In almost every instance this erosion can be traced back to the failure to implement consistent macroeconomic policies alongside the devaluations (see Edwards, forthcoming).
Devaluations have also played a key role in the trade reform com- ponent of structural adjustment programs. It is generally accepted in policy circles that in order for a tariff reform to be successful, it has to be accompanied-if not preceded-by a real devaluation (see, how- ever, Edwards forthcoming for a critical evaluation of this proposition). The argument usually given is based on a partial equilibrium interpre- tation of the elasticities approach to exchange rate determination, and runs along the following lines: A lower tariff will reduce the domestic price of importables, and consequently increase the demand for im- ports. This, in turn, will generate an external imbalance (i.e., a trade

193 Structural Adjustment Policies in Highly Indebted Countries
account deficit), which assuming that the Marshall-Lerner condition holds, will require a (real) devaluation to restore equilibrium. This view is clearly captured by the following quotation from Balassa (1982, 16): “[E]liminating protective measures would necessitate a devaluation in order to offset the resulting deficit in the balance of payments.” It is along these lines, then, that the proponents of major liberalizations by the debt-ridden countries have insisted that these tariff reductions should be accompanied by significant nominal devaluations (Balassa, Kue- zynski, and Simeonsen 1986).
The “required” amount of devaluation will depend on a number of factors, including the initial conditions, the extent of the trade reform, the magnitude of the disequilibrium gap to be closed, and the accom- panying macroeconomic pol i~ies .~’ In addition, and perhaps more im- portantly, the required devaluation will also depend on the speed at which the trade reform is implemented. Since, for a number of reasons including the short-run fixity of capital, short-run supply elasticities are much lower than long-run elasticities, under most circumstances a rapid trade reform will necessitate a higher real devaluation to maintain external e q ~ i l i b r i u m . ~ ~
Until quite recently most traditional structural adjustment programs in the developing nations have contemplated discreet nominal deval- uations where the official nominal exchange rate is abruptly adjusted by a fairly large percentage. More recently, however, more and more countries are opting for the adoption of some sort of crawling peg after the devaluation. In a recent study on 18 devaluation episodes in Latin America, Edwards (1988b) found that those countries that had adopted a crawling peg had been significantly more successful in sustaining a real depreciation than the discrete devaluers. This, of course, is not in itself surprising, since the crawlers maintained their real devaluation targets by “fighting off” the real exchange rate erosion with additional nominal devaluations in the following years. Typically, under this type of regime, after the initial exchange rate adjustment the authorities further devalue the currency in magnitudes approximately equal to the domestic rate of inflation. Of course, a potential problem with this policy is that it can lead to an explosive (nonconvergent) process, where the devaluation generates inflation, which partially erodes the real ef- fect of the devaluation; this leads to a higher devaluation and even higher inflation and so on, ad inJinitum. This possible unstable path could happen in those countries where the structural macroeconomic disequilibrium, and in particular the fiscal deficit, have not been cor- rected to a significant extent. An alternative scenario is one where macroeconomic equilibrium is attained and the process is stabilized at some mild rate of inflation, as in Chile in the recent period and in Colombia since 1967. The cited study by Edwards indicates that among
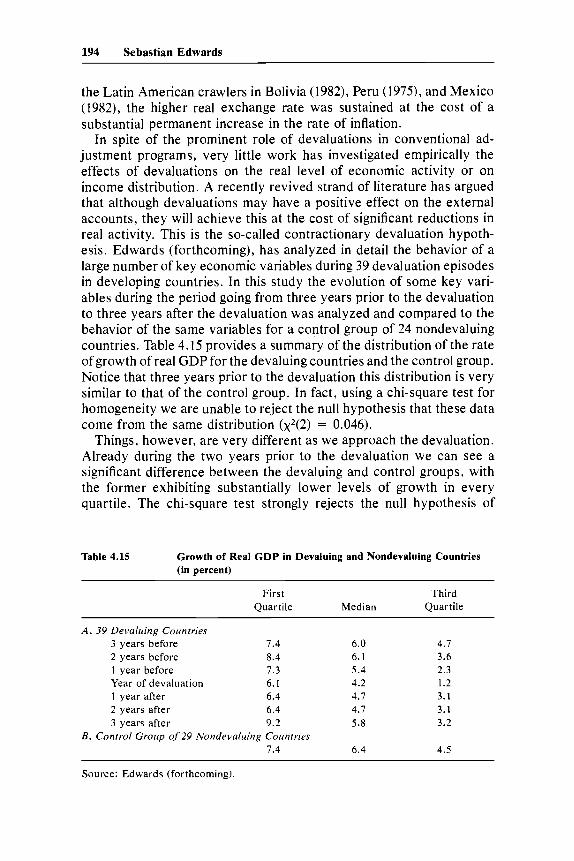
194 Sebastian Edwards
the Latin American crawlers in Bolivia (1982), Peru (1973, and Mexico (1982), the higher real exchange rate was sustained at the cost of a substantial permanent increase in the rate of inflation.
In spite of the prominent role of devaluations in conventional ad- justment programs, very little work has investigated empirically the effects of devaluations on the real level of economic activity or on income distribution. A recently revived strand of literature has argued that although devaluations may have a positive effect on the external accounts, they will achieve this at the cost of significant reductions in real activity. This is the so-called contractionary devaluation hypoth- esis. Edwards (forthcoming), has analyzed in detail the behavior of a large number of key economic variables during 39 devaluation episodes in developing countries. In this study the evolution of some key vari- ables during the period going from three years prior to the devaluation to three years after the devaluation was analyzed and compared to the behavior of the same variables for a control group of 24 nondevaluing countries. Table 4. I5 provides a summary of the distribution of the rate of growth of real GDP for the devaluing countries and the control group. Notice that three years prior to the devaluation this distribution is very similar to that of the control group. In fact, using a chi-square test for homogeneity we are unable to reject the null hypothesis that these data come from the same distribution ( ~ ~ ( 2 ) = 0.046).
Things, however, are very different as we approach the devaluation. Already during the two years prior to the devaluation we can see a significant difference between the devaluing and control groups, with the former exhibiting substantially lower levels of growth in every quartile. The chi-square test strongly rejects the null hypothesis of
Table 4.15 Growth of Real GDP in Devaluing and Nondevaluing Countries (in percent)
First Third Quartile Median Quartile
A . 39 Devaluing Countries 3 years before 7.4 6 . 0 4 .7 2 years before 8.4 6.1 3.6 1 year before 7.3 5.4 2.3 Year of devaluation 6.1 4.2 1.2 1 year after 6.4 4.7 3.1 2 years after 6 . 4 4.7 3. I 3 years after 9.2 5.8 3.2
7.4 6 . 4 4 .5 B. Control Group of 29 Nondevaluing Countries
Source: Edwards (forthcoming).
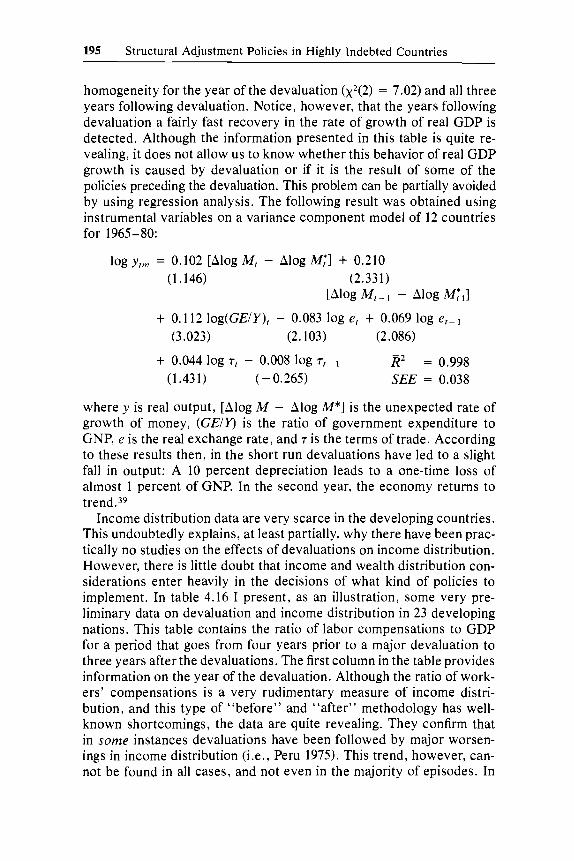
195 Structural Adjustment Policies in Highly Indebted Countries
homogeneity for the year of the devaluation ( ~ ~ ( 2 ) = 7.02) and all three years following devaluation. Notice, however, that the years following devaluation a fairly fast recovery in the rate of growth of real GDP is detected. Although the information presented in this table is quite re- vealing, it does not allow us to know whether this behavior of real GDP growth is caused by devaluation or if it is the result of some of the policies preceding the devaluation. This problem can be partially avoided by using regression analysis. The following result was obtained using instrumental variables on a variance component model of 12 countries for 1965-80:
log yrm = 0.102 [Alog M, - Alog M f ] + 0.210 (1.146) (2.331)
[Alog M,-1 - Alog M;,]
+ 0.1 12 log(GE/Y), - 0.083 log e, + 0.069 log e,- I
(3.023) (2.103) (2.086)
+ 0.044 log 7, - 0.008 log 7,-1 R2 = 0.998 (1.431) ( - 0.265) SEE = 0.038
where y is real output, [Alog M - Alog M*l is the unexpected rate of growth of money, (GEIY) is the ratio of government expenditure to GNP, e is the real exchange rate, and 7 is the terms of trade. According to these results then, in the short run devaluations have led to a slight fall in output: A 10 percent depreciation leads to a one-time loss of almost 1 percent of GNP. In the second year, the economy returns to trend. 39
Income distribution data are very scarce in the developing countries. This undoubtedly explains, at least partially, why there have been prac- tically no studies on the effects of devaluations on income distribution. However, there is little doubt that income and wealth distribution con- siderations enter heavily in the decisions of what kind of policies to implement. In table 4.16 I present, as an illustration, some very pre- liminary data on devaluation and income distribution in 23 developing nations. This table contains the ratio of labor compensations to GDP for a period that goes from four years prior to a major devaluation to three years after the devaluations. The first column in the table provides information on the year of the devaluation. Although the ratio of work- ers’ compensations is a very rudimentary measure of income distri- bution, and this type of “before” and “after” methodology has well- known shortcomings, the data are quite revealing. They confirm that in some instances devaluations have been followed by major worsen- ings in income distribution (i,e,, Peru 1975). This trend, however, can- not be found in all cases, and not even in the majority of episodes. In

Table 4.16 Devaluations and Income Distribution (percentage of compensation to employees with respect to GDP)
Devaluation Year of Year
+ I + 2 + 3 Devaluation -4 -3 -2 - I 0
Argentina Bolivia
Chile Colombia
Costa Rica Cyprus" Ecuador
EfZYPth
Guyana India
1970 1971 I979 I982 1982 I962 I964 1965 I967 I974 I967 1961 I970 I982 1962 1979 I967 1966
40 37 33 35 39
34 36 38 47 87
n.a. 27 28
n.a.
46 47 73
n.a.
41 37 34 36 36
n.a. 36 38 36 48 87
27 28
n.a. 39 47 72
n.a.
40 34 35 36 38 34 38 38 37 48 88
n.a.
32 39 38 48 74
28
40 36 35
n.a. 40 36 38 36 36 45 87 28 28 30 41 37 49 72
41 35 36
n.a. n.a. 38 36 37 37 45 88 29 29 29 42 33 49 74
42 32 36
n.a.
n.a.
38 37 36 36 46 88 29 30
n.a. 42 34 49 77
39 30
n.a. n.a.
n.a. 36 36 37
47 88 29 28
40 n.a. 48 75
38
n.a.
43 33
n.a. n.a.
37 37 36 38 45 88 28 26
41 n.a. 49 74
n.a.
n.a.

Indonesia" Israel
Jamaica
Kenya Korea Malta Mexico
Nicaragua Pakistans
Pe N
Philippines"
Sri Lanka Venezuela
1978 1962 1967 1971 I967 1978 1981 I980 1967 I976 1982 I979 1972 1982 1975 1962 I970 I967 I 964
89 n.a. 44 so 50 54 32 32 49 37 38 54 87 86 36
n.a. 86 45 45
89 ma. 45 46 50 56 34 33 50 36 38 55 81 84 38
n.a. 86 41 45
89 44 48 44 50 57 35 37 49 37 36 54 84 83 39 88 86 43 42
89 44 so 47 46 56 3s 36 47 38 37 56 85 84 37 87 86 42 43
89 44 50 46 47 52
n.a. 37 47 40 36
ma. 85 84 37
84 41 43
87
89 YO 90 44 45 48 46 44 47 43 45 43 48 49 50 51 51 53
n.a. n.a. n.a. 35 38 47 47 50 39 38 38
n.a. n.a. n.a. n.a. n.a. n.a. 86 88 86
n.a. ma. n.a. 37 37 32 86 86 86 83 83 82 41 39 36 43 44 45
Source: United Nations, Yeurbook of Nutionnl Accounts Stutistics.
a(Cornpensation to employees + operating surplus)/GDP. byear beginning July I . n.a. = not available.

198 Sebastian Edwards
fact, in a number of them the ratio of labor compensation increased following the devaluation. More than anything, however, these data indicate that in order to have a full understanding of the income dis- tribution consequences of devaluations, it is necessary to look at more detailed data and at alternative categories, including the effect of de- valuations on the ruraliurban distribution of income.
To sum up then, the discussion in this section reveals once again the existence of important trade-offs associated with the different goals of the adjustment program. While devaluation will generally have a pos- itive effect on the external sector, helping generate the necessary excess supply for tradables, and easing the transition following a trade liber- alization, it will have a negative impact on the cost of foreign exchange to the government and on real GDP growth. In addition, devaluation will usually have important effects on income distribution and on in- flation. Since the magnitude of “required” (real) devaluations will be closely related to the speed at which structural reforms are imple- mented, this discussion points out, once more, the desirability of pro- ceeding gradually both with respect to debt payment and to structural reforms.
4.3.5 Credibility, Sustainability, and Reversibility of Trade Reforms
Credibility is a fundamental ingredient of successful structural re- forms. If the public attaches a nontrivial probability to policy reversal, it will try to anticipate this event, generally introducing strong desta- bilizing forces into the structural adjustment process.
Latin America’s history is replete with frustrated economic reforms that have failed because of their lack of credibility. In that respect, the frustrated Argentine trade reform during the Martinez de Hoz period is very educational. Because of lack of credibility on the future of the preannounced trade reform, firms used foreign funds in order to survive in the short run. As Carlos Rodriguez (1983, 28) has put it in his evaluation of the Argentine experience of 1978-82: “As a consequence of the luck of credibility on the continuity of the economic program, many firms-which would have disappeared due to the tariff reduc- tions-decided to get into debt in order to remain operating while waiting for a change in the economic strategy”[emphasis added].
A fundamental aspect of establishing credibility is related to the perception the public has of the internal consistency of the policies being pursued. In that respect, for example, the inconsistency of the Argentine fiscal policy, which maintained a very large deficit, and the preannounced exchange rate policy severely undermined the degree of credibility of the reform process. In the case of Chile the markedly overvalued currency in 1981 was seen by large segments of the public

199 Structural Adjustment Policies in Highly Indebted Countries
as inconsistent with the long-run viability of the liberalized economy. In general, if the real exchange rate experiences an unprecedented real appreciation, the public will think that exports will not be able to develop and that there is a nontrivial probability of the reform’s being reversed in the future. Under these circumstances it will be optimal for consumers to get into debt today in order to acquire “cheap” importables.
The inability to establish consistency between fiscal and exchange rate policies has many times been at the heart of the trade reform credibility crises in Latin America. For example, in most cases where (mild) trade reforms have been reversed, the public early on perceived that the inflation tax required to finance the fiscal dificit was inconsistent with maintaining a predetermined nominal exchange rate. Under these circumstances expectations of overvaluation, speculative attacks, ex- change controls, and future devaluations developed. In trying to an- ticipate these events the optimizing private sector will usually take steps-such as diversifying its portfolio internationally (i.e., “capital flight”)-that will sometimes move the economy in the opposite di- rection from that intended by the reform. Edwards (1988~) has found that more than 80 percent of reversals of trade liberalizations in Latin America can be traced to inconsistent fiscal policies.
An important question is whether a gradual (i.e., slow) trade reform will be less or more credible than an abrupt one. Theoretical models of credibility of economic policy are only now being developed, and have not yet reached a level that enables us to answer this question with enough precision.40 In principle, it is possible to argue that grad- ualism has characteristics that work in both directions, at the same time enhancing and compromising credibility. On the one hand, by reducing the unemployment effect, and by allowing for a firmer fiscal equilibrium, a gradual trade reform will tend to be more credible; on the other hand a slow reform will allow those groups negatively affected by it (i.e., the import substitution manufacturing sector) to organize and lobby against the policies. At the end, as is so often the case in economics, whether gradualism will enhance credibility will depend on factors specific to each country. What is clear, however, is that poli- cymakers should always pay special attention on the establishment of credibility when persuing important long-term structural changes.
Although at this point, given our knowledge of the policymaking process and its interaction with the private sector, it is not possible to derive a precise theorem, the arguments presented in this section- including unemployment, fiscal, and other considerations-suggest that, in general, it would be more prudent to implement the trade reform component of an outward-orientated policy in a gradual way.

200 Sebastian Edwards
4.4 Concluding Remarks and Summary
The adjustment packages of 1982-87 sought “effectiveness.” On some grounds, and especially in terms of the turnarounds of the current accounts, the results have been quite impressive. The costs, however, have been high. Not only did real income decline, as illustrated in table 4.2, but real wages declined in most countries, and unemployment soared. There is little doubt that this is not a sustainable adjustment path. A successful adjustment means that debtor countries will have to bring down their debt-to-GDP ratios to a level consistent with the reestablishment of creditworthiness, while recovering their growth of output and consumption. The first objective means that the country has to transfer a given discounted value of resources to the rest of the world. The second means that the country has to increase its rate of capital formation and the efficiency of resource use. The problem faced by the highly indebted nations can be posed as follows: how to minimize the present value of the foregone consumption from making a transfer of a specific discounted value. The problem then has two dimensions: how to minimize the cost of the transfer at each moment of time, including its distributive aspect, and what should be the flow of trans- fers over time consistent with a given present value of the flow.
The speed with which the transfer to the rest of the world is made will affect the (discounted value of the) cost of achieving creditwor- thiness. A very fast increase in the trade surplus can only be obtained at a very high cost in terms of nontraded goods and losses in employ- ment, both because it takes time for factors to be retrained and to move, and because of wage inflexibility in the short run. It also takes time to implement efficient fiscal instruments to generate the fiscal surplus, particularly if one wants to eliminate the present reliance of taxes on trade and the inflationary finance of the deficit. Finally, im- proving the allocation of investment and promoting the return of capital flight may involve liberalizing financial markets, which will increase the fiscal cost of servicing internal debt. Thus, improved efficiency and capital accumulation will require important increases in nondistortive taxes and cuts in public expenditures: but this takes time. In sum, there are important trade-offs between effecting the transfer rapidly and min- imizing its cost at one moment of time. Instruments that help generate the trade surplus quickly-like quantitative restrictions-increase the resource cost of achieving the transfer. Instruments that solve the fiscal problem quickly-like using tariffs or QRs instead of a devaluation- also increase that cost.
A slower speed of adjustment can only be achieved if the magnitude of the transfer countries have to make is reduced during the initial years. One way of achieving this is by providing these countries with
201 Structural Adjustment Policies in Highly Indebted Countries
additional lending during the transition. In principle this will allow the implementation of slower expenditure-switching policies and the im- plementation of more efficient fiscal instruments to raise public re- sources. Most importantly, it will allow the investment rates to be kept up without unduly sacrificing consumption. Thus there is a comple- mentarity between extra lending during the transition and the recovery of growth while transferring abroad a given present value of resources.
A longer-run solution of the debt crisis will clearly require the adop- tion of policies that rely more heavily than in the past on export growth. Even ECLALEPAL, the former champion of import substitution de- velopment, has recommended outward-oriented policies. Export pro- motion requires some kind of trade liberalization and tariff reduction, especially of imported inputs and capital goods. Indeed, the historical evidence clearly shows that those countries that have successfully pur- sued export promotion (Lee, the East Asian nations), have had a trade regime substantially more liberal than those countries that have fol- lowed indiscriminate import substitution based on protectionism. A crucial question, however, is how much trade liberalization is needed. It is argued in the chapter that although outward orientation requires some trade liberalization, there are no reasons, either theoretical or empirical, that suggest that the “optimal” degree of liberalization im- plies zero, or even very low, tariffs coupled with no government in- tervention in any sphere of the development process. The successful experiences with export-led growth in the East Asian countries support this view; although in these countries the trade regime has been sig- nificantly liberal, government intervention has been important and tar- iffs have never been anything close to zero or a very low (i.e., 10-15 percent) uniform level.
An important policy question is whether the trade liberalization com- ponent of an outward-oriented strategy should be attempted at the same time that a country is embarked on a severe stabilization program. It is argued in the chapter that, in general, it is not recommended to undertake substantial trade reforms at the same time that a major anti- inflationary program is underway. This is both for fiscal and real ex- change rate reasons. However, there are some measures, such as the replacement of quotas for tariffs, that can help both the anti-inflation drive as well as the quest for improvement of efficiency.
Under the most plausible circumstances a fast trade liberalization will generate short-run unemployment effects. Indeed, the empirical evidence from the Southern Cone tends to confirm this presumption. This suggests that trade liberalization should be a gradual and pre- announced process. This, however, brings up serious credibility issues. Only if the announced gradual trade reform is “credible” will economic agents react as expected by the authorities. The analysis of devaluations

202 Sebastian Edwards
presented in section 4.3 clearly suggests that under many circumstances abrupt devaluations can generate nontrivial short-run costs in the form of output reductions and unemployment. It is argued that gradual lib- eralizations will require smaller devaluations, possibly reducing the associated costs.
A sustained increase in the indebted countries’ exports-which is, of course, a prerequisite for a long-term solution to the crisis-will not only require an efficient tradables sector and a “realistic” real exchange rate but, more important, that the current protectionist trend in the industrial countries and in particular in the United States be reversed. Data presented by Edwards (1 987a) indicate that at this time the extent of nontariff barriers, as a form of protection in the industrial countries, is very significant. Moreover, the data show that these trade impedi- ments are particularly important for goods originating in the developing nations, and that their tariff equivalents are in many cases very sig- nificant. Asking the highly indebted developing countries to pay their debts while impeding their exports from reaching the industrialized markets is not only unfair, but also politically unwise.
Notes
1 . It should be noticed, however, that most experts now agree that in some of the poorer countries it would be highly implausible to reduce the debt-export ratio to the levels required for access to new voluntary financing. In these cases some innovative and less orthodox solutions, including debt forgiveness, may be the most efficient way out.
2 . See, for example, Balassa et. al. (1986) and Krueger (1987). 3 . The IMF’s 15 highly indebted countries are: Argentina, Bolivia, Brazil,
Chile, Colombia, Ivory Coast, Ecuador, Mexico, Morocco, Nigeria, Peru, Phil- ippines, Uruguay, Venezuela, and Yugoslavia.
4. On the Brazilian experience see Cardoso and Fishlow (1987); on Mexico see Buffie and Sangines (1987); Celgsun and Rodrik (1987) deal with Turkey. These papers are published in the country studies volumes of this project. On Chile see Edwards and Cox-Edwards (1987).
5. See Dornbusch (chap. 8 in this volume) for discussion of the role of the developed countries’ macropolicies on the development of the crisis.
6. See Bianchi, Devlin, and Ramos (1987). 7. Notice, however, that it is not completely rigorous to talk about overvalued
real exchange rates without first analyzing the way in which the equilibrium real exchange rate has evolved (see Edwards, forthcoming). In the case of the debtor countries, however, the existing evidence clearly suggests that signifi- cant overvaluations developed.
8 . On the Chilean experience see Edwards (1985) and Edwards and Cox- Edwards (1987).
9 . On Argentina see Calvo (1986a) and Corbo, de Melo, and Tybout (1986). 10. On Colombia see Thomas (1986). See Collins and Park (1987) on Korea
and Woo and Nasution (1987) on Indonesia.
203 Structural Adjustment Policies in Highly Indebted Countries
1 I . The exact time periods are Argentina, 1982-85; Ecuador, 1982-83; Mex-
12. Computed from raw data published in IMF, Government Finance Sta-
13. See Edwards and Cox-Edwards (1987). 14. Although real devaluations will increase the servicing of public debts in
real domestic currency, they can have some other positive effects on the public sector’s budget. This will be the case in those countries where the main ex- porting firms are government owned.
15. On the Argentine exchange rate guarantees scheme, see Calvo (1986a); on Chile see Edwards (1985).
16. For a detailed analysis on the nonequivalence between quotas and tariffs see Bhagwati (1978). See also Hillman, Tower, and Fishelson (1980).
17. Note, however, that in spite of Khan and Knight’s description in the past not every Fund sponsored program included exchange rate actions. It is in fact important to recognize that historically the IMF has exhibited significantly more flexibility than its critics have given it credit for. There has been, to some extent, a case-by-case approach. From the record it seems, however, that the Fund staff considers that the vast majority of the cases are quite similar.
18. Balassa et al. (1986) and Krueger (1987) are good representatives of this view. See also Fischer (1986).
19. The other policies advocated by Balassa et al. (1986) include financial reform, stable real exchange rates, and a much reduced role for the government.
20. On the evidence on the performance of outward- vs. inward-oriented strategies see, for example, the World Book, World Development Report 1987 and the literature cited therein. On CEPAL see, for example, Bianchi, Devlin, and Ramos (1987).
21. See Krueger (1978) and Bhagwati (1978). On earlier discussions on lib- eralization see Little, Scitovsky, and Scott (1971). For a recent treatment of many of these issues see the volume edited by Choksi and Papageorgiou (1986).
22. This was indeed the meaning given by some to the concept during the Southern Cone experiences with market-oriented policies in the late 1970s and early 1980s. In a recent paper Bhagwati (1986) has made an effort to define in a precise way export promotion, import substitution, and ultra trade-promoting trade policies. In the rest of this paper we will stick to trade and commercial policies when referring to trade liberalization.
23. See, for example, Bhagwati’s (1986) splendid paper on outward orien- tation. To date the most impressive accumulation of empirical evidence sup- porting the better performance of outward orientation has been compiled in the 1987 World Development Report. See also Bhagwati and Srinivasan (1978).
ico, 1983-84; Uruguay, 1982-84; and Venezuela, 1982-83.
tistics Yearbook, 1986.
24. See, for example, World Bank (1986). 25. On Colombia see Thomas (1986). 26. Naturally, the welfare effects of trade liberalizations fall within the realm
of second-best economics. Rigorously speaking if there are other distortions, as invariably there are in the real world, it is not possible to know a priori if a partial trade liberalization will be welfare improving. If there are no other distortions, it is possible to establish a positive relation between the level of tariffs and the level of income. Still however, no traditional growth model will link no tariffs to higher growth (see Lucas 1985).
27. Notice, however, that even the Koreans made mistakes when they pushed the government role too far. In that respect, the fiasco of 1974-79 when the government picked the wrong “winners” is well known. See World Bank ( 1986).

204 Sebastian Edwards
28. See, for example, Krueger (1981) and Little (1982). 29. See, for example, Edwards (1988b) for a detailed analysis of 18 stabili-
zation with mild liberalization episodes in Latin America. 30. Naturally, although very common, this is not the only scenario leading
to a stabilization with structural adjustment program. In an alternative scenario that fits some country's experiences during the period leading to the debt crisis, the fiscal expansion is financed with foreign borrowing instead of money cre- ation. In this case the path leading to the need to adjust in not necessarily characterized by a piling up of trade and exchange controls.
31. The recent Bolivian experience is also characterized by a tremendous trade liberalization. However, the fact that this was part of a package to defeat hyperinflation sets the Bolivian case apart.
32. While a number of countries have successfully used foreign exchange auctions-Jamaica, Sierra Leone, Uganda-only a few have implemented gen- eralized auctions for imports of goods. See Krumm (1985) for a discussion on different experiences with exchange auctions.
33. Notice, however, that from a welfare perspective this is by no means a trivial proposition. Indeed, from a purely theoretical point of view it is not clear that reducing tariffs and increasing other taxes will be welfare improving. Moreover, a t least at the theoretical level, it is not clear that welfare will increase if, as liberalization advocates have sometimes proposed, consumption taxes are raised as tariffs are reduced. This, of course, is a simple application of the second-best theorem.
34. Whether this reduction in the equilibrium real wage will actually take place will depend on the weight of exportables in the price level relevant for determining real wages. If, as in a large number of developing countries, ex- portables (i.e., foodstuffs) have a large weight in the consumer price index the equilibrium real wage will indeed decline (see Edwards 1988a).
35. On theoretical models of the labor market effects of trade reforms see Edwards (1986; 1988a) and the references cited therein.
36. See chapter 6 of Edwards and Cox-Edwards (1987) for a detailed dis- cussion of the evolution of wages in Chile.
37. We are referring to the extent of real devaluation. However, since the real exchange rate is not a policy tool, economic authorities face the additional difficulty of deciding by how much to adjust the nominal exchange rate in order to generate a given real devaluation.
38. This statement assumes that a tariff reduction will result in an equilibrium real exchange rate depreciation. Although this is the more plausible case, theoretically it is not the only possible result (see Edwards 1987b).
39. The countries included in this regression are: Brazil, Colombia, El Sal- vador, Greece, India, Israel, Malaysia, Philippines, South Africa, Sri Lanka, Thailand, and Yugoslavia. The equation was estimated using a fixed effect instrumental variables procedure, where country-specific dummy variables were included. The following instruments were used: all the exogenous variables, twice-lagged money surprises, twice-lagged terms of trade, twice-lagged real exchange rates, contemporary, lagged and twice-lagged growth of domestic credit (for details, see Edwards 1986).
40. Guillermo Calvo, however, has recently made important contributions to this key area of the theory of economic policy (see Calvo 1986b; 1987).

205 Structural Adjustment Policies in Highly Indebted Countries
References
Balassa, B. 1982. Development strategies in semi-industrial countries. Oxford: Oxford University Press.
Balassa, B., G. M. Bueno, P. P. Kuczynski, and M. H. Sirneonsen. 1986. To- ward renewed economic growth in Latin America. Washington, D.C.: In- stitute of International Economics.
Bhagwati, J . 1978. Anatomy and consequences of exchange control regimes. Cambridge, Mass.: Ballinger Publishing Co.
. 1986. Export-promoting trade strategies: Issues and evidence. World Bank Discussion Paper UPERS7. Washington, D.C.: World Bank.
Bhagwati, J . , and T. N. Srinivasan, 1978. Trade policy and development. In International economic policy: Theory and evidence, ed. R. Dornbusch and J . Frenkel. Baltimore, Md.: Johns Hopkins University Press.
Bianchi, A., R. Devlin, and J . Ramos. 1987. The adjustment process in Latin America, 1981 - 1986. Paper presented at World Bank-IMF symposium, Growth-Oriented Adjustment Programs in Washington, D.C.
Buffie, E., and A. Sangines. 1987. Economic policy and foreign debt in Mexico. Unpublished NBER ms. In Developing country debt and economic perfor- mance, vol. 2: Country studies, ed. J . Sachs. Chicago: University of Chicago Press, forthcoming.
Calvo, G. 1986a. Fractured liberalism: Argentina under Martinez de Hoz. Economic Development and Cultural Change 34(3): 51 1-34.
. 1986b. Temporary stabilization predetermined exchange rates. Journal of Political Economy 94(6): 1319-29.
. 1987. Reform, distortions and credibility. Working Paper, University of Pennsylvania.
Cardoso, E . , and A. Fishlow. 1987. The macroeconomics of the Brazilian external debt. Unpublished NBER ms. In Developing country debt and economic performance, vol. 2: Country studies, ed. J. Sachs. Chicago: Uni- versity of Chicago Press, forthcoming.
Celasun, M., and D. Rodrik. 1987. Debt, adjustment growth: Turkey 1970-85. Unpublished NBER ms. In Developing country dept and economic perfor- mance, vol. 3: Country studies, ed. J . Sachs. Chicago: University of Chicago Press, forthcoming.
CEPAL. 1985. Anuario Estadistico de AmPrica Latina y el Caribe. Santiago, Chile: CEPAL.
. 1986a. Panorama econbmico de Ame'rica Latina 1986. Santiago, Chile: CEPAL.
. 1986b. Balance preliminar de la economia Latino americana 1986. Santiago, Chile: CEPAL.
Choski, A., and D. Papageorgiou, eds. 1986. Economic liberalization in de- veloping countries. Oxford: Blackwell.
Cline, William. 1987. Mobilizing bank lending to debt countries. Washington, D. C.: Center for International Economics.
Collins, S. and W. A. Park. 1987. External debt and macroeconomic perfor- mance in Korea. Unpublished NBER ms. In Developing country debt and economic performance, vol. 3: Country studies, ed. J. Sachs. Chicago: Uni- versity of Chicago Press, forthcoming.
Conrad, R. , and M. Gillis. 1984. The Indonesian tax reform of 1983. Harvard Institute for International Development, Discussion Paper no. 162. Cam- bridge: Harvard University.

206 Sebastian Edwards
Corbo, V., J. de Melo and J . Tybout. 1986. What went wrong in the southern cone. Economic Development and Cultural Change 34(3): 607-40.
Cuddington, J . 1986. Capitalflight: Estimates, issues and explanations. Prince- ton, N.J.: Princeton Studies in International Finance.
Cumby, R., and R. Levich. 1987. On the definition and magnitude of recent capital flight. NBER Working Paper no. 2275. Cambridge, Mass.: National Bureau of Economic Research.
de la Cuadra, S., and D. Hachette. 1986. The timing and sequencing of trade liberalization policy: The case of Chile. Unpublished ms. Catholic University of Chile.
Diaz-Alejandro, C. 1963. Devaluation in a semi-industrial country. Cambridge: MIT Press.
. 1985. Good-bye financial repression, hello financial crash. Journal of Development Economics l9(Yz): 1-24.
Dornbusch, Rudiger. 1988. Our LDC Debts. In The U.S . in the world economy. ed. M. Feldstein. Chicago: University of Chicago Press.
Edwards, S. 1985. Stabilization with liberalization: An evaluation of the years of Chile’s experience with free market policies, 1973- 1983. Economic De- velopment and Cultural Change 33(2): 223-54.
. 1986. Are devaluations contractionary? Review of Economics and Sta- tistics 68(3): 501 -8.
. 1987a. Exchange rate misalignment in developing countries. UCLA, Department of Economics Working Paper no. 432. Also published by Johns Hopkins Univ. Press, 1988.
. 1987b. Tariffs, terms of trade, and real exchange rate in an intertem- poral model of the current account. NBER Working Paper no. 2481. Cam- bridge, Mass.: National Bureau of Economic Research.
. 1 9 8 7 ~ . The U.S. and foreign competition in Latin America. NBER Working Paper no. 2544. Also The U . S . in the World Economy. ed. M. Feldstein. Chicago: University of Chicago Press. 1988.
.1988a. Terms of trade, exchange rates, and labor market adjustments in developing countries. NBER Working Paper no. 2481, forthcoming in The World Bank Economic Review 2(2): 165-85.
. 1988b. Exchange controls, devaluations, and real exchange rates: The Latin American experience. Economic Development and Cultural Change, forthcoming
. 1 9 8 8 ~ . Real exchange rates, devaluations, and adjustment. Cambridge: MIT Press, forthcoming.
Edwards, S., and A. Cox-Edwards. 1987. Monetarism and liberalization: The Chilean experiment. Cambridge, Mass.: Ballinger Publishing Co.
Fischer, S. 1986. Issues in medium-term macroeconomic adjustment. World Bank Research Observer l(2): 163-82.
Hillman A . , E . Tower, and F. Fishelson. 1980. On water in the quota. Canadian Journal of Economics 13(2):310- 16.
International Monetary Fund. 1986. Government finance statistics yearbook. Washington, D.C.: IMF
. 1987. World Economic Outlook (April).
. Annual report on exchange arrangements and exchange restrictions, various issues. Washington, D.C.: IMF.
. International financial statistics, various issues. Washington, D.C.: IMF.
Khan, M., and M. Knight. 1985. Fund supported adjustment programs and economic growth. IMF Occasional Paper no. 41. Washington, D.C.: IMF.

207 Structural Adjustment Policies in Highly Indebted Countries
Krueger, A. 0. 1978. Foreign trade regimes and economic development: Lib- eralization attempts and consequences. Cambridge, Mass.: Ballinger Pub- lishing Co.
. 1981. Interaction between inflation and trade regime objectives in sta- bilization programs. In Economic Stabilization in Developing countries, ed. W. Cline and S. Weintraub. Washington, D.C.: Brookings Institution.
. 1983. Trade and employment in developing countries: Synthesis and conclusions. Chicago: University of Chicago Press.
. 1986. Problems of liberalization. In Economic liberalization in devel- oping countries, ed. A. Choksi and D. Papageorgiou. Oxford: Blackwell.
. 1987. The problems of LDC debt. Paper presented at the NBER con- ference, The U.S. in the World Economy, at West Palm Beach, Fla.
Krumm, K. 1985. Experiences with foreign exchange rate auctions. CPO Work- ing Paper. Washington D.C.: World Bank.
Little, I . M. D. 1982. Economic development. New York: Basic Books. Little, I . M. D., T. Scitovsky, and M. Scott. 1970. Industry and trade in some
developing countries. Oxford: Oxford University Press. Lucas, R. E. 1985. Economic growth and development. Unpublished ms. Uni-
versity of Chicago. McKinnon, J . 1973. Money and capital in economic development. Washington,
D.C.: The Brookings Institution. . 1982. The order of economic liberalization: Lessons from Chile and
Argentina. In Economic policy in a world of change, ed. K. Brunner and A. Meltzer. Amsterdam: North-Holland.
Neary, P. 1978. Dynamic stability and the theory of factor-market distortions. American Economic Review 68(4): 671 -682.
Papageorgiou, D. , M. Michaely, and A. Choksi. 1986. The phasing of a trade liberalization policy: Preliminary evidence. Paper presented at AEA meeting in New Orleans.
Pick’s Yearbook. Various issues. London. Ramos, J . 1986. Neoconservative economics in the Southern Cone of South
America. Baltimore, Md.: Johns Hopkins University Press. Rodriguez, C. A. 1983. Politicas de estabilizacion en la economia Argentina,
1978-1982. Cuadernos de Economia 20(59): 21 -42. Sachs, J. 1986. Managing the LDC debt crisis. Brookings papers on economic
activity 2: 397-432. -. 1987. Trade and exchange-rate policies in growth-oriented adjustment
programs. NBER Working Paper no. 2226. Cambridge, Mass.: National Bu- reau of Economic Research.
Selowski, M., and H. van der Tak. 1986. The debt problem and growth. World Development 14(9): 1107-24.
Thomas, V. 1986. Linking macroeconomic and agricultural policies for ad- justment with growth. Baltimore, Md.: Johns Hopkins University Press.
United Nations. Yearbook of National Accounts Statistics. Various years. Woo, W. T., and A. Nasution. 1987. Indonesian economic policies and their
World Bank, 1986. Korea: Managing the industrial transition. Washington,
. 1987. World development report f 987. Oxford: Oxford University Press.
relation to external debt management. Unpublished NBER ms.
D.C.: World Bank.
World Currencies Yearbook. Various issues. London.

This Page Intentionally Left Blank