structural analysis of poly(ethylene terephthalate) during uniaxial drawing above the glass...
TRANSCRIPT
ORIGINAL ARTICLE
Structural analysis of poly(ethylene terephthalate)during uniaxial drawing above the glass transitiontemperature
Kazuyuki Okada1, Takuji Higashioji2, Takeshi Nakagawa1, Hirohito Uchida2, Kenta Takahashi2, Rintaro Inoue3,Koji Nishida3 and Toshiji Kanaya3
We performed small-angle and wide-angle X-ray scattering (SAXS and WAXS) measurements on poly(ethylene terephthalate)
(PET) uniaxially drawn from an amorphous state above the glass transition temperature. The measurements were performed at a
new beamline (BL), BL03XU, which is dedicated to the development of advanced soft materials and belongs to the Advanced
Softmaterial Beamline Consortium. The BL03XU BL has a very high intensity, wide-dynamic range and low background. The
characteristics of the BL03XU BL enable us to conduct a very precise and detailed analysis of the data. In this report, we
studied the change in the lamellar structure during uniaxial drawing using detailed analysis of two-dimensional (2D) SAXS
patterns and found that the X-shaped pattern appeared before the so-called 4-spot pattern of PET in the 2D SAXS data. The
X-shaped pattern and the 4-spot pattern were considered to be due to isolated single lamellae and stacked lamellae,
respectively. We performed a calculation to reproduce the observed 2D SAXS patterns, focusing especially on the 4-spot
patterns, using a simple lamellar model that took into account the lamellar size, the lamellar spacing and the orientation
distribution of the lamellar stacking direction. Based on the results of the calculation, we discussed the development of the
lamellar structure during the drawing process.
Polymer Journal (2013) 45, 50–56; doi:10.1038/pj.2012.197; published online 21 November 2012
Keywords: lamellar crystal; poly(ethylene terephthalate); SAXS; uniaxial drawing; WAXS
INTRODUCTION
Biaxially stretched poly(ethylene terephthalate) (PET) films are cur-rently the most widely used polymeric substrate material in the fields ofdisplay technologies, electronic devices, storage media, electronicinsulators, automobiles, molding, packaging, printing and architecture,because the films show high strength, durability, transparency, flex-ibility and good surface properties. In industry, biaxially stretched PETfilms are normally prepared by the sequential drawing of amorphousPET in two directions, instead of by the simultaneous drawing of thePET in both directions. The sequential biaxial drawing leads toorientation and crystallization of the PET molecules in an amorphousregion, resulting in tensilized films. After the biaxial drawing, a heat-setting treatment is performed to generate heat-induced crystallization.The temperature or drawing rate during the drawing has to becontrolled so that the films are uniformly drawn without tearing.Therefore, it is very important to study the relationship between thestructural formation and the conditions during drawing, such as thetemperature and drawing rate. One of the most important structuresthat affect the film tearing is the crystalline lamellar structure and/orthe higher order structure consisting of lamellae.
Because of the importance of PET films in industry, a number ofstudies on the deformation of PET during the drawing process havebeen conducted.1–14 Asano et al.1 studied the structural changesduring isothermal annealing of cold-drawn PET using wide-angleX-ray scattering (WAXS) and small-angle X-ray scattering (SAXS).The results are very revealing. In the WAXS measurements, theyobserved that the initially formed nematic phase (or orientedamorphous phase) transformed into the smectic phase and finallyinto the triclinic crystalline phase during annealing. In the WAXSpatterns of the triclinic phase, some reflections are located at higherand lower q values than the normal layer line positions, indicatingthat the crystals are tilted in the same direction with respect to theunit cell. This type of orientation is known as a ‘tilted orientation’ andwas first studied by Daubeny et al.15 In the SAXS measurements, theyobserved the so-called 4-spot pattern, showing the inclination of thesurface of the lamellar crystals. The inclination of the surface layer wasexplained in terms of the molecular tilt mechanism.1 It is noted thatthe 2-spot pattern in SAXS, which is similar to the so-called longperiod peak in many polymers, is formed in PET during hot drawingat 110 1C,6 suggesting that the PET chains are highly inclined while
1Materials Science Laboratories, Toray Research Center, Inc., Shiga, Japan; 2Films and Film Products Research Laboratories, Toray Industries, Shiga, Japan and 3Institute forChemical Research, Kyoto University, Kyoto, JapanCorrespondence: K Okada, Materials Science Laboratories, Toray Research Center, Inc., 3-3-7, Sonoyama, Otsu, Shiga 520-8567, Japan.E-mail: [email protected]
Received 3 September 2012; revised 25 September 2012; accepted 25 September 2012; published online 21 November 2012
Polymer Journal (2013) 45, 50–56& 2013 The Society of Polymer Science, Japan (SPSJ) All rights reserved 0032-3896/13
www.nature.com/pj
the lamella normal becomes parallel to the drawing direction, but themechanism for this is not fully understood at the moment. Recently,Kawakami et al.2–6 studied a superstructure consisting of lamellarcrystals and microfibrils of PET during uniaxial drawing at 90 and100 1C, which is above the glass transition temperature, using in-situSAXS and WAXS. They found an X-shaped scattering in the SAXSpatterns at the beginning of the drawing, followed by the 4-spotpattern that was observed in Asano’s experiments,1 showing that the4-spot pattern is formed during uniaxial drawing above the glasstransition temperature. Note that Shimizu et al.7 also found theX-shaped scattering before Kawakami’s experiments. Their results arevery helpful in understanding the structural development process ofPET during uniaxial drawing. However, detailed information on thelamellar structure, the orientation and the distribution of orientationis lacking. Therefore, in this study, we focused our attention on thelamellar structure, the orientation and the distribution of orientationduring uniaxial drawing of PET above the glass transitiontemperature. For this purpose, we performed ex-situ SAXS andWAXS measurements using a high-intensity synchrotron radiationX-ray beamline (BL) (BL03XU) at SPring-816 in combination with ahigh sensitivity and large dynamic range detector. The very lowbackground at the BL also enabled us to carry out detailed analysis ofthe SAXS patterns. For detailed and quantitative analyses, weperformed a simple model calculation to reproduce the observedtwo-dimensional (2D) SAXS patterns, taking into consideration thelamellar size, lamellar period, orientation of the lamellar stackingangle and their distributions. Based on the results, we will discuss thestructural development of PET during uniaxial drawing above theglass transition temperature.
EXPERIMENTAL PROCEDURES
SamplesPET samples were prepared by Toray Industries in Japan. The weight-averaged
molecular weight (Mw) of the samples was 30 000 g mol�1, and the molecular
weight distribution was B2 in terms of Mw/Mn, where Mn was the number-
averaged molecular weight. Molten PET was extruded at temperatures between
280 and 300 1C, and the undrawn sheet was obtained after cooling to ambient
temperature on a casting drum. Before drawing, the sample was completely
amorphous, with no detectable crystallinity by WAXS and differential scanning
calorimetry. The sample was uniaxially drawn using a stretching machine at 90
and 100 1C, which is above the glass transition temperature of 80 1C, which was
determined by differential scanning calorimetry at a heating rate of
10 1C min�1. After a given draw ratio was reached at a drawing rate of 10%
per min, the sample was quenched to room temperature in the machine. The
film was B0.3 mm thick.
SAXS and WAXS measurementsSAXS and WAXS measurements were carried out at the new BL BL03XU
(frontier softmaterial BL)16 at the synchrotron radiation X-ray facility SPring-8,
which is dedicated to the development of advanced soft materials and belongs
to the Advanced Softmaterial BL Consortium. The wavelength l was 0.1 nm.
The sample films were mounted in the sample holder in the normal transmission
geometry, that is, the film surface normal was parallel to the X-ray beam.
An R-AXIS VII imaging plate (Rigaku Co., Tokyo, Japan) was used as a detector
system for the SAXS measurements, which has a high sensitivity and a large
dynamic range (B106). The acquisition time for the SAXS measurements was
10 s. For the WAXS measurements, a Flat Panel (Hamamatsu Photonics K. K.,
Hamamatsu, Japan) was used, and the acquisition time was 20 ms. The sample-
to-detector distances were 2204 and 67.4 mm for the SAXS and WAXS,
respectively. The q ranges covered in the SAXS and WAXS measurements were
0.04–3.5 nm�1 and 6–30 nm�1, respectively, where q is the length of a scattering
vector defined by q¼ 4psin(y)/l (2y being the scattering angle). The scattering
angle was calibrated using a CeO2 standard from the National Institute of
Standards and Technology for WAXS and a silver behenate (AgBe) standard
and a chicken collagen standard for SAXS. The SAXS data were corrected for
the absorption of the sample and the background scattering from the air and
the windows of vacuum passes, and the data were normalized to account for
the sample thickness. In the figures of the 2D SAXS and WAXS patterns, we
provided scale bars in q to show the rough ranges of q. Speaking accurately,
they are not precise in linearity but are very convenient for the reader. Note
that the data reductions were performed using precise q values.
RESULTS AND DISCUSSION
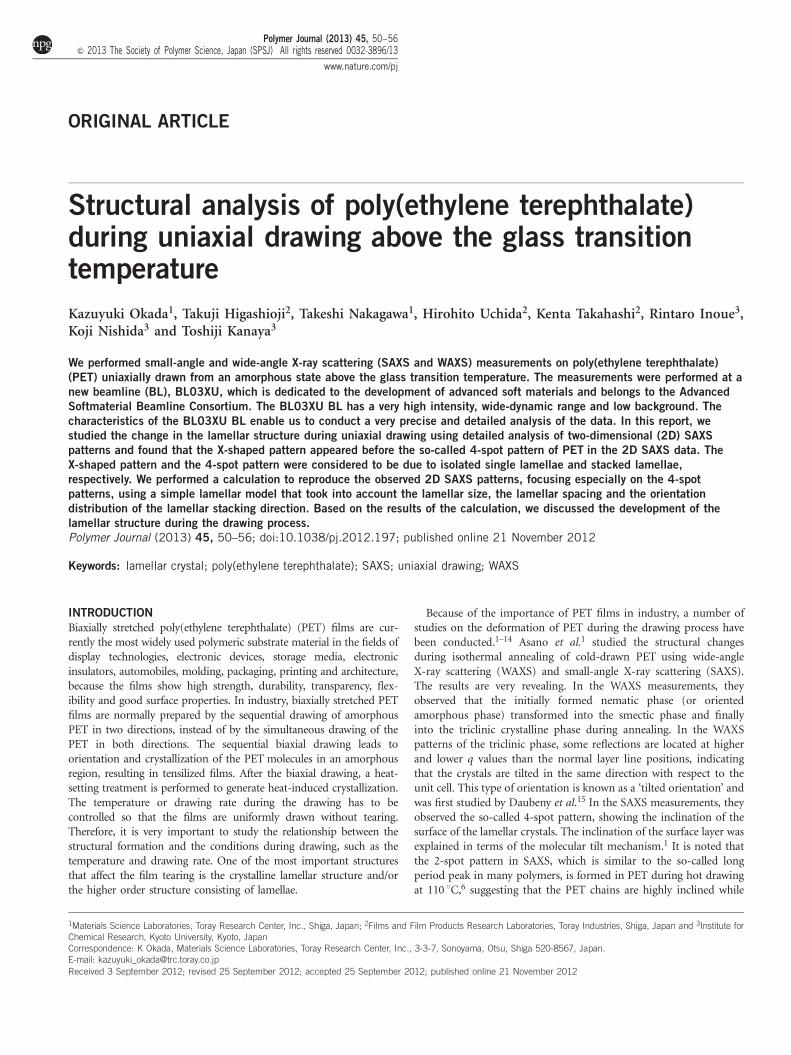
SAXS and WAXS patternsThe observed 2D SAXS and WAXS patterns of the PET films atseveral draw ratios at 90 and 100 1C are shown in Figures 1a and d. Atthe beginning of the drawing, up to the ratio of 200%, both the SAXSand WAXS patterns show an isotropic amorphous phase. In the SAXSpattern at 250%, a weak X-shaped pattern is observed at 100 1C whilea 4-spot pattern is observed at 90 1C in addition to the X-shapedpattern, suggesting that the crystallization rate at 90 1C is higher thanthat at 100 1C. Note that it is hard to see the weak scattering intensityin the 2D patterns, so we confirmed the anisotropy of the weakscattering in plots of the 1D scattering intensity as a function of theazimuthal angle. In quiescent crystallization, generally speaking, thecrystallization rate increases with temperature in the so-called coldcrystallization region,17 but the data from the uniaxial drawingprocess contradict this prediction. This contradiction might bebecause it is harder for aligned polymer chains to relax duringdrawing at a lower temperature due to their low mobility, resulting inorientation-induced crystallization. In the WAXS patterns at 250%,some clear Bragg diffractions from the (010), (�110) and (100)planes in the triclinic form are observed at 90 1C, whereas no Braggpeaks, but an oriented broad amorphous peak, are observed at 100 1C,confirming the slower crystallization at 100 1C.
At draw ratios above 250%, the 4-spot patterns appear at the high qend of the streak in the X-shaped patterns in the SAXS data at both 90and 100 1C, which is assigned to the stacking of inclined lamellarcrystals,1 although the shapes of the 4-spot patterns are quantitativelydifferent from each other. This difference will be discussed later. TheBragg diffractions from the (010), (�110) and (100) planes in thetriclinic form above 250% are displaced from the equator line,showing the tilted orientation of the polymer chains as reported byAsano et al.1 The displacement of the Bragg peaks decreases with thedraw ratio, meaning that the chain titling increases with the drawratio, especially at 90 1C.
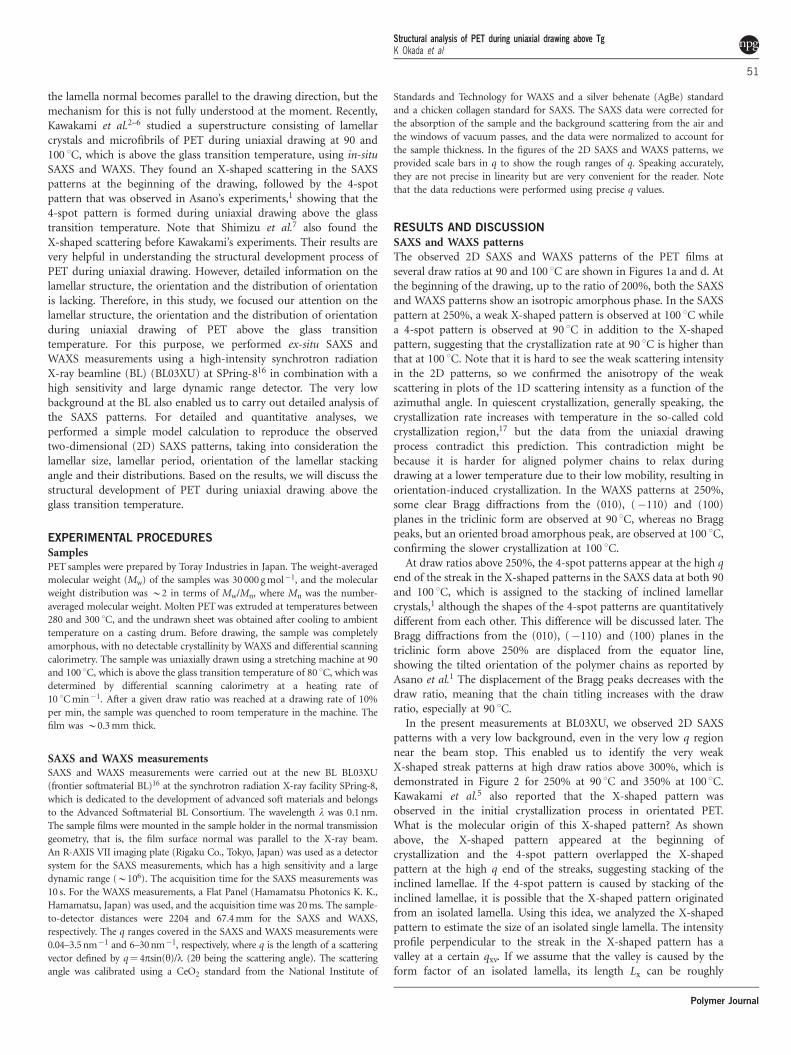
In the present measurements at BL03XU, we observed 2D SAXSpatterns with a very low background, even in the very low q regionnear the beam stop. This enabled us to identify the very weakX-shaped streak patterns at high draw ratios above 300%, which isdemonstrated in Figure 2 for 250% at 90 1C and 350% at 100 1C.Kawakami et al.5 also reported that the X-shaped pattern wasobserved in the initial crystallization process in orientated PET.What is the molecular origin of this X-shaped pattern? As shownabove, the X-shaped pattern appeared at the beginning ofcrystallization and the 4-spot pattern overlapped the X-shapedpattern at the high q end of the streaks, suggesting stacking of theinclined lamellae. If the 4-spot pattern is caused by stacking of theinclined lamellae, it is possible that the X-shaped pattern originatedfrom an isolated lamella. Using this idea, we analyzed the X-shapedpattern to estimate the size of an isolated single lamella. The intensityprofile perpendicular to the streak in the X-shaped pattern has avalley at a certain qxv. If we assume that the valley is caused by theform factor of an isolated lamella, its length Lx can be roughly
Structural analysis of PET during uniaxial drawing above TgK Okada et al
51
Polymer Journal
estimated as Lx¼ 2p/qxv, although the value depends on the modelsused in the analysis. The length evaluated from Lx¼ 2p/qxv wasB80 nm for the draw ratio of 400% at 100 1C. The lamellar thicknesswas also estimated using the intensity profile parallel to the streak ofthe X-shaped pattern and the Guinier method18 assuming that thecross-section of the isolated lamella was a sphere and the diameter ofthe sphere was the thickness of the lamella. The estimated value of thethickness is B6 nm at the drawing ratio of 400% at 100 1C. Theselength and the thickness values of the isolated lamella will bediscussed later.
Invariant and long periodFor further discussion, the apparent invariants (the integratedintensities) of the SAXS patterns, the long period and the azimuthalangle dependence of the 4-spot pattern intensity are evaluated. Theapparent invariant for the X-shaped pattern was calculated as follows.First, we calculated the intensity profile along the streak in theX-shaped pattern. In the low q range, the intensity profile wassmoothly extrapolated to q¼ 0, using a Gauss function to merge itwith the Guinier regime and neglecting any large-scale structure nearthe beam stop. In the high q range, we tried to separate out theintensity of the 4-spot pattern, which was very high above the drawratio of 300%, and it was impossible. Hence, we limited theintegration range up to q¼ 0.44 nm�1 and the azimuthal angle rangefrom 10 to 451.
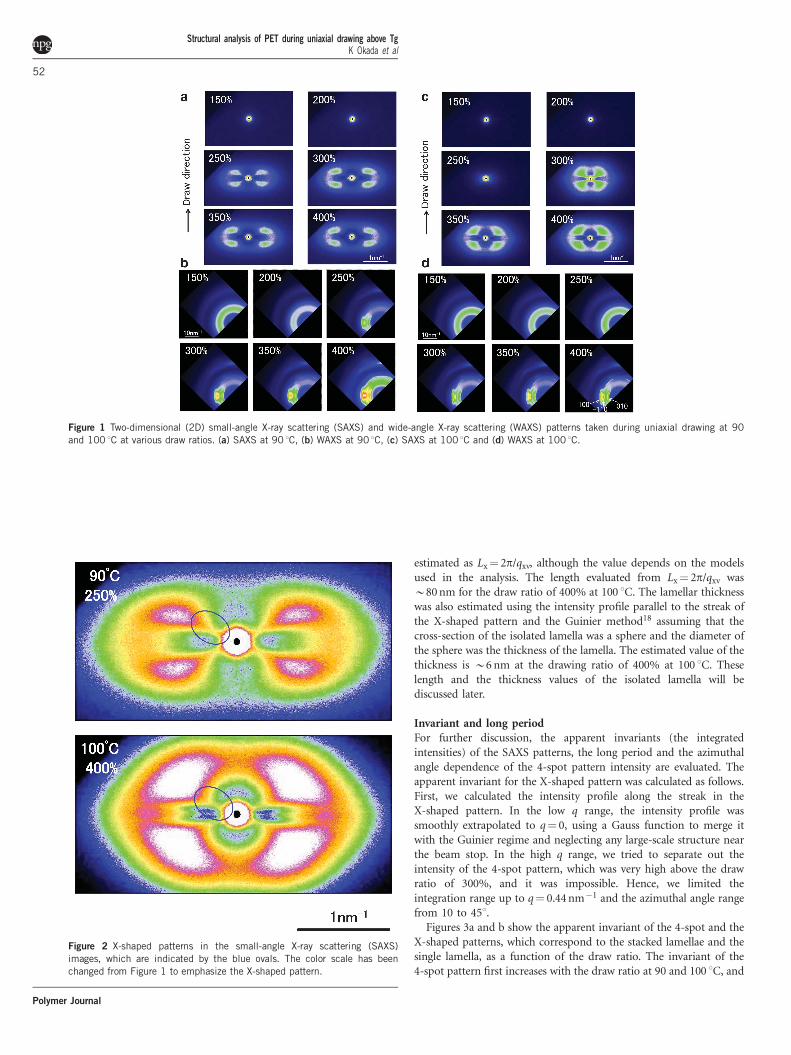
Figures 3a and b show the apparent invariant of the 4-spot and theX-shaped patterns, which correspond to the stacked lamellae and thesingle lamella, as a function of the draw ratio. The invariant of the4-spot pattern first increases with the draw ratio at 90 and 100 1C, and
Figure 1 Two-dimensional (2D) small-angle X-ray scattering (SAXS) and wide-angle X-ray scattering (WAXS) patterns taken during uniaxial drawing at 90
and 100 1C at various draw ratios. (a) SAXS at 90 1C, (b) WAXS at 90 1C, (c) SAXS at 100 1C and (d) WAXS at 100 1C.
Figure 2 X-shaped patterns in the small-angle X-ray scattering (SAXS)
images, which are indicated by the blue ovals. The color scale has been
changed from Figure 1 to emphasize the X-shaped pattern.
Structural analysis of PET during uniaxial drawing above TgK Okada et al
52
Polymer Journal
it levels off above 300% at 90 1C. Additionally, the invariant of theX-shaped pattern has a maximum at 300% for 90 and 100 1C,although the peak intensity is very weak, especially at 90 1C. Thisresult implies that many lamellar crystals are formed in the range ofdraw ratios between 300 and 400% and that the newly formedlamellar crystals are inserted between the existing lamellar crystals, atleast at 100 1C. In other words, the number of isolated single lamellarcrystals decreases and hence the number of stacked lamellar crystalsincreases.
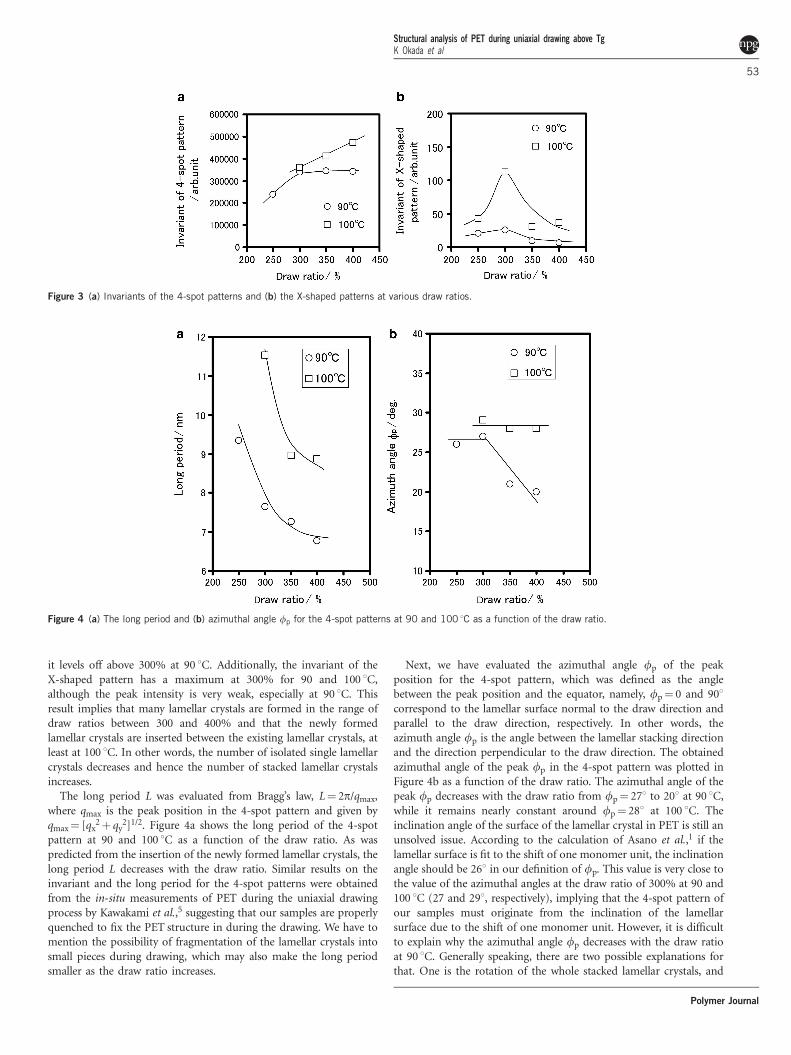
The long period L was evaluated from Bragg’s law, L¼ 2p/qmax,where qmax is the peak position in the 4-spot pattern and given byqmax¼ [qx
2þ qy2]1/2. Figure 4a shows the long period of the 4-spot
pattern at 90 and 100 1C as a function of the draw ratio. As waspredicted from the insertion of the newly formed lamellar crystals, thelong period L decreases with the draw ratio. Similar results on theinvariant and the long period for the 4-spot patterns were obtainedfrom the in-situ measurements of PET during the uniaxial drawingprocess by Kawakami et al.,5 suggesting that our samples are properlyquenched to fix the PET structure in during the drawing. We have tomention the possibility of fragmentation of the lamellar crystals intosmall pieces during drawing, which may also make the long periodsmaller as the draw ratio increases.
Next, we have evaluated the azimuthal angle fp of the peakposition for the 4-spot pattern, which was defined as the anglebetween the peak position and the equator, namely, fp¼ 0 and 901correspond to the lamellar surface normal to the draw direction andparallel to the draw direction, respectively. In other words, theazimuth angle fp is the angle between the lamellar stacking directionand the direction perpendicular to the draw direction. The obtainedazimuthal angle of the peak fp in the 4-spot pattern was plotted inFigure 4b as a function of the draw ratio. The azimuthal angle of thepeak fp decreases with the draw ratio from fp¼ 271 to 201 at 90 1C,while it remains nearly constant around fp¼ 281 at 100 1C. Theinclination angle of the surface of the lamellar crystal in PET is still anunsolved issue. According to the calculation of Asano et al.,1 if thelamellar surface is fit to the shift of one monomer unit, the inclinationangle should be 261 in our definition of fp. This value is very close tothe value of the azimuthal angles at the draw ratio of 300% at 90 and100 1C (27 and 291, respectively), implying that the 4-spot pattern ofour samples must originate from the inclination of the lamellarsurface due to the shift of one monomer unit. However, it is difficultto explain why the azimuthal angle fp decreases with the draw ratioat 90 1C. Generally speaking, there are two possible explanations forthat. One is the rotation of the whole stacked lamellar crystals, and
Figure 3 (a) Invariants of the 4-spot patterns and (b) the X-shaped patterns at various draw ratios.
Figure 4 (a) The long period and (b) azimuthal angle fp for the 4-spot patterns at 90 and 100 1C as a function of the draw ratio.
Structural analysis of PET during uniaxial drawing above TgK Okada et al
53
Polymer Journal

the other is the decrease in the inclination angle fp of the lamellarsurface. At the moment, the latter is more plausible because it isdifficult to imagine that the stacked direction rotates to the directionnormal to drawing. However, we have no conclusions to make on themolecular picture from this observation.
Simulation of 2D SAXS patternsNext, we investigated the details of the interesting but complicatedshape of the 4-spot pattern. To investigate the shape, we tried toreproduce the observed SAXS patterns using a simple model that took
into account the lamellar size, lamellar period, lamellar orientationand its distribution.
The lamellar model used in the calculation is illustrated in Figure 5.The draw direction is parallel to the vertical axis (y axis), and thestacking direction is defined by the angle f in Figure 5. The intensitydistribution for the lamellar structure I(qx, qy, f¼ 0) is calculatedas follows:
Iðqx; qy;f¼ 0Þ / sin2ðaqx/2Þðaqx/2Þ2
� sin2ðbqy/2Þðbqy/2Þ2
� 1þ eiAqx�� ��2 ð1Þ
Here, a and b are the lamellar thickness parallel to the stackingdirection of the lamellae and the lamellar length normal to thestacking direction of the lamellae, respectively, and A is the longperiod. Note that the lamella length b is distinguished from thelamella length Lx. The former and the latter are the length in themodel and the experimentally observed length, respectively. The firstterm on the right hand side of equation (1) is the form factor of thelamella, and the second term is the interference term between twolamellae. The intensity of each stacked lamellae with different stackingdirection fi was calculated and the total SAXS intensity I(qx,qy) wasobtained by summing up the contributions from all lamellae withweight fractions wi, which is given by
Iðqx; qyÞ¼X
i
wi � Iiðqx; qy;fiÞ ð2Þ
The comparison between the observed and calculated 2D SAXSpatterns is shown in Figure 6 for the three 4-spot patterns for theFigure 5 The model of the lamellar structure used in the calculation.
Figure 6 Comparison between the observed and calculated 4-spot patterns for 300% at 90 and 100 1C and for 400% at 100 1C.
Structural analysis of PET during uniaxial drawing above TgK Okada et al
54
Polymer Journal
drawing ratios of 300% at 90 and 100 1C and of 400% at 100 1C. Thecalculated patterns reproduced the complicated features of theobserved 4-spot patterns rather well, except for near the origin inq-space. This is due to contributions from the form factors becausewe only considered the stacking of two lamellae.
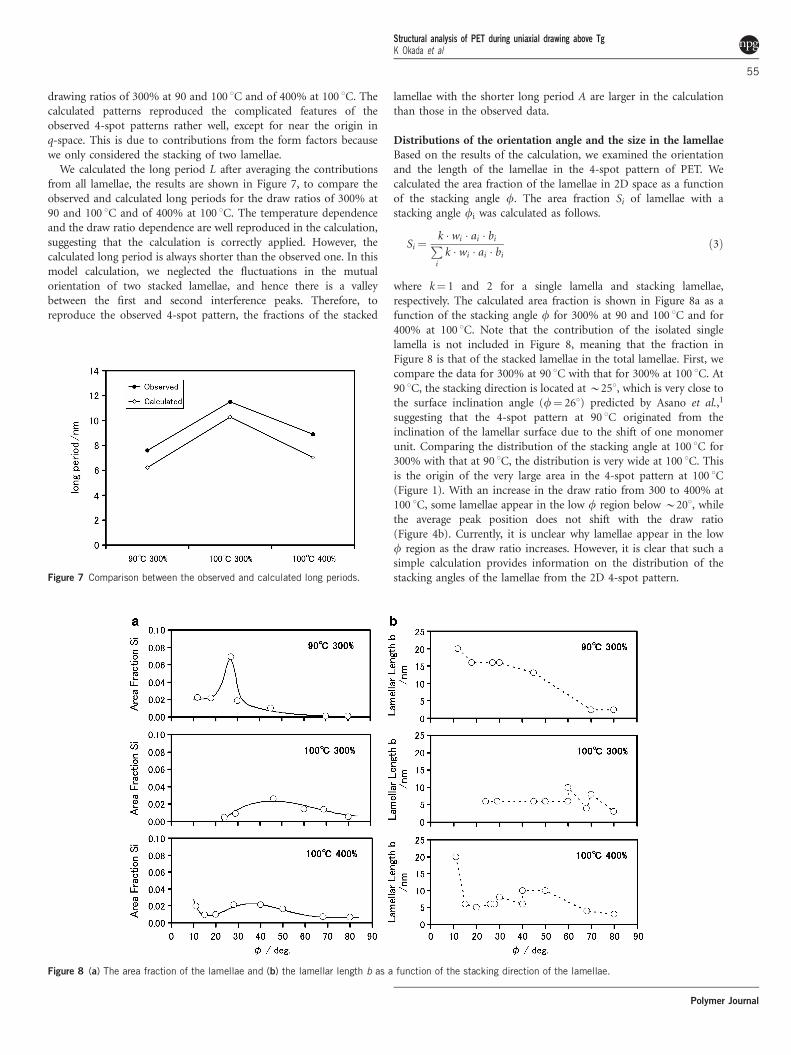
We calculated the long period L after averaging the contributionsfrom all lamellae, the results are shown in Figure 7, to compare theobserved and calculated long periods for the draw ratios of 300% at90 and 100 1C and of 400% at 100 1C. The temperature dependenceand the draw ratio dependence are well reproduced in the calculation,suggesting that the calculation is correctly applied. However, thecalculated long period is always shorter than the observed one. In thismodel calculation, we neglected the fluctuations in the mutualorientation of two stacked lamellae, and hence there is a valleybetween the first and second interference peaks. Therefore, toreproduce the observed 4-spot pattern, the fractions of the stacked
lamellae with the shorter long period A are larger in the calculationthan those in the observed data.
Distributions of the orientation angle and the size in the lamellaeBased on the results of the calculation, we examined the orientationand the length of the lamellae in the 4-spot pattern of PET. Wecalculated the area fraction of the lamellae in 2D space as a functionof the stacking angle f. The area fraction Si of lamellae with astacking angle fi was calculated as follows.
Si¼k � wi � ai � biP
i
k � wi � ai � bið3Þ
where k¼ 1 and 2 for a single lamella and stacking lamellae,respectively. The calculated area fraction is shown in Figure 8a as afunction of the stacking angle f for 300% at 90 and 100 1C and for400% at 100 1C. Note that the contribution of the isolated singlelamella is not included in Figure 8, meaning that the fraction inFigure 8 is that of the stacked lamellae in the total lamellae. First, wecompare the data for 300% at 90 1C with that for 300% at 100 1C. At90 1C, the stacking direction is located at B251, which is very close tothe surface inclination angle (f¼ 261) predicted by Asano et al.,1
suggesting that the 4-spot pattern at 90 1C originated from theinclination of the lamellar surface due to the shift of one monomerunit. Comparing the distribution of the stacking angle at 100 1C for300% with that at 90 1C, the distribution is very wide at 100 1C. Thisis the origin of the very large area in the 4-spot pattern at 100 1C(Figure 1). With an increase in the draw ratio from 300 to 400% at100 1C, some lamellae appear in the low f region below B201, whilethe average peak position does not shift with the draw ratio(Figure 4b). Currently, it is unclear why lamellae appear in the lowf region as the draw ratio increases. However, it is clear that such asimple calculation provides information on the distribution of thestacking angles of the lamellae from the 2D 4-spot pattern.Figure 7 Comparison between the observed and calculated long periods.
Figure 8 (a) The area fraction of the lamellae and (b) the lamellar length b as a function of the stacking direction of the lamellae.
Structural analysis of PET during uniaxial drawing above TgK Okada et al
55
Polymer Journal
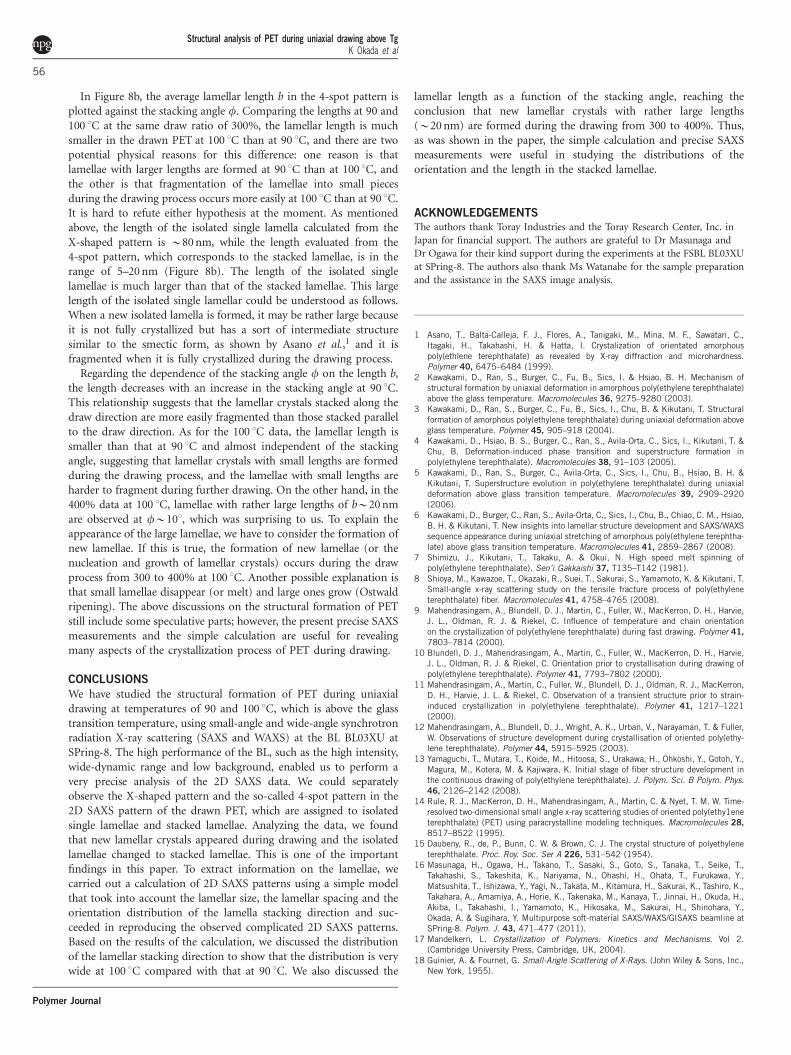
In Figure 8b, the average lamellar length b in the 4-spot pattern isplotted against the stacking angle f. Comparing the lengths at 90 and100 1C at the same draw ratio of 300%, the lamellar length is muchsmaller in the drawn PET at 100 1C than at 90 1C, and there are twopotential physical reasons for this difference: one reason is thatlamellae with larger lengths are formed at 90 1C than at 100 1C, andthe other is that fragmentation of the lamellae into small piecesduring the drawing process occurs more easily at 100 1C than at 90 1C.It is hard to refute either hypothesis at the moment. As mentionedabove, the length of the isolated single lamella calculated from theX-shaped pattern is B80 nm, while the length evaluated from the4-spot pattern, which corresponds to the stacked lamellae, is in therange of 5–20 nm (Figure 8b). The length of the isolated singlelamellae is much larger than that of the stacked lamellae. This largelength of the isolated single lamellar could be understood as follows.When a new isolated lamella is formed, it may be rather large becauseit is not fully crystallized but has a sort of intermediate structuresimilar to the smectic form, as shown by Asano et al.,1 and it isfragmented when it is fully crystallized during the drawing process.
Regarding the dependence of the stacking angle f on the length b,the length decreases with an increase in the stacking angle at 90 1C.This relationship suggests that the lamellar crystals stacked along thedraw direction are more easily fragmented than those stacked parallelto the draw direction. As for the 100 1C data, the lamellar length issmaller than that at 90 1C and almost independent of the stackingangle, suggesting that lamellar crystals with small lengths are formedduring the drawing process, and the lamellae with small lengths areharder to fragment during further drawing. On the other hand, in the400% data at 100 1C, lamellae with rather large lengths of bB20 nmare observed at fB101, which was surprising to us. To explain theappearance of the large lamellae, we have to consider the formation ofnew lamellae. If this is true, the formation of new lamellae (or thenucleation and growth of lamellar crystals) occurs during the drawprocess from 300 to 400% at 100 1C. Another possible explanation isthat small lamellae disappear (or melt) and large ones grow (Ostwaldripening). The above discussions on the structural formation of PETstill include some speculative parts; however, the present precise SAXSmeasurements and the simple calculation are useful for revealingmany aspects of the crystallization process of PET during drawing.
CONCLUSIONS
We have studied the structural formation of PET during uniaxialdrawing at temperatures of 90 and 100 1C, which is above the glasstransition temperature, using small-angle and wide-angle synchrotronradiation X-ray scattering (SAXS and WAXS) at the BL BL03XU atSPring-8. The high performance of the BL, such as the high intensity,wide-dynamic range and low background, enabled us to perform avery precise analysis of the 2D SAXS data. We could separatelyobserve the X-shaped pattern and the so-called 4-spot pattern in the2D SAXS pattern of the drawn PET, which are assigned to isolatedsingle lamellae and stacked lamellae. Analyzing the data, we foundthat new lamellar crystals appeared during drawing and the isolatedlamellae changed to stacked lamellae. This is one of the importantfindings in this paper. To extract information on the lamellae, wecarried out a calculation of 2D SAXS patterns using a simple modelthat took into account the lamellar size, the lamellar spacing and theorientation distribution of the lamella stacking direction and suc-ceeded in reproducing the observed complicated 2D SAXS patterns.Based on the results of the calculation, we discussed the distributionof the lamellar stacking direction to show that the distribution is verywide at 100 1C compared with that at 90 1C. We also discussed the
lamellar length as a function of the stacking angle, reaching theconclusion that new lamellar crystals with rather large lengths(B20 nm) are formed during the drawing from 300 to 400%. Thus,as was shown in the paper, the simple calculation and precise SAXSmeasurements were useful in studying the distributions of theorientation and the length in the stacked lamellae.
ACKNOWLEDGEMENTSThe authors thank Toray Industries and the Toray Research Center, Inc. in
Japan for financial support. The authors are grateful to Dr Masunaga and
Dr Ogawa for their kind support during the experiments at the FSBL BL03XU
at SPring-8. The authors also thank Ms Watanabe for the sample preparation
and the assistance in the SAXS image analysis.
1 Asano, T., Balta-Calleja, F. J., Flores, A., Tanigaki, M., Mina, M. F., Sawatari, C.,Itagaki, H., Takahashi, H. & Hatta, I. Crystalization of orientated amorphouspoly(ethlene terephthalate) as revealed by X-ray diffraction and microhardness.Polymer 40, 6475–6484 (1999).
2 Kawakami, D., Ran, S., Burger, C., Fu, B., Sics, I. & Hsiao, B. H. Mechanism ofstructural formation by uniaxial deformation in amorphous poly(ethylene terephthalate)above the glass temperature. Macromolecules 36, 9275–9280 (2003).
3 Kawakami, D., Ran, S., Burger, C., Fu, B., Sics, I., Chu, B. & Kikutani, T. Structuralformation of amorphous poly(ethylene terephthalate) during uniaxial deformation aboveglass temperature. Polymer 45, 905–918 (2004).
4 Kawakami, D., Hsiao, B. S., Burger, C., Ran, S., Avila-Orta, C., Sics, I., Kikutani, T. &Chu, B. Deformation-induced phase transition and superstructure formation inpoly(ethylene terephthalate). Macromolecules 38, 91–103 (2005).
5 Kawakami, D., Ran, S., Burger, C., Avila-Orta, C., Sics, I., Chu, B., Hsiao, B. H. &Kikutani, T. Superstructure evolution in poly(ethylene terephthalate) during uniaxialdeformation above glass transition temperature. Macromolecules 39, 2909–2920(2006).
6 Kawakami, D., Burger, C., Ran, S., Avila-Orta, C., Sics, I., Chu, B., Chiao, C. M., Hsiao,B. H. & Kikutani, T. New insights into lamellar structure development and SAXS/WAXSsequence appearance during uniaxial stretching of amorphous poly(ethylene terephtha-late) above glass transition temperature. Macromolecules 41, 2859–2867 (2008).
7 Shimizu, J., Kikutani, T., Takaku, A. & Okui, N. High speed melt spinning ofpoly(ethylene terephthalate). Sen’i Gakkaishi 37, T135–T142 (1981).
8 Shioya, M., Kawazoe, T., Okazaki, R., Suei, T., Sakurai, S., Yamamoto, K. & Kikutani, T.Small-angle x-ray scattering study on the tensile fracture process of poly(ethyleneterephthalate) fiber. Macromolecules 41, 4758–4765 (2008).
9 Mahendrasingam, A., Blundell, D. J., Martin, C., Fuller, W., MacKerron, D. H., Harvie,J. L., Oldman, R. J. & Riekel, C. Influence of temperature and chain orientationon the crystallization of poly(ethylene terephthalate) during fast drawing. Polymer 41,
7803–7814 (2000).10 Blundell, D. J., Mahendrasingam, A., Martin, C., Fuller, W., MacKerron, D. H., Harvie,
J. L., Oldman, R. J. & Riekel, C. Orientation prior to crystallisation during drawing ofpoly(ethylene terephthalate). Polymer 41, 7793–7802 (2000).
11 Mahendrasingam, A., Martin, C., Fuller, W., Blundell, D. J., Oldman, R. J., MacKerron,D. H., Harvie, J. L. & Riekel, C. Observation of a transient structure prior to strain-induced crystallization in poly(ethylene terephthalate). Polymer 41, 1217–1221(2000).
12 Mahendrasingam, A., Blundell, D. J., Wright, A. K., Urban, V., Narayaman, T. & Fuller,W. Observations of structure development during crystallisation of oriented poly(ethy-lene terephthalate). Polymer 44, 5915–5925 (2003).
13 Yamaguchi, T., Mutara, T., Koide, M., Hitoosa, S., Urakawa, H., Ohkoshi, Y., Gotoh, Y.,Magura, M., Kotera, M. & Kajiwara, K. Initial stage of fiber structure development inthe continuous drawing of poly(ethylene terephthalate). J. Polym. Sci. B Polym. Phys.46, 2126–2142 (2008).
14 Rule, R. J., MacKerron, D. H., Mahendrasingam, A., Martin, C. & Nyet, T. M. W. Time-resolved two-dimensional small angle x-ray scattering studies of oriented poly(ethy1eneterephthalate) (PET) using paracrystalline modeling techniques. Macromolecules 28,
8517–8522 (1995).15 Daubeny, R., de, P., Bunn, C. W. & Brown, C. J. The crystal structure of polyethylene
terephthalate. Proc. Roy. Soc. Ser A 226, 531–542 (1954).16 Masunaga, H., Ogawa, H., Takano, T., Sasaki, S., Goto, S., Tanaka, T., Seike, T.,
Takahashi, S., Takeshita, K., Nariyama, N., Ohashi, H., Ohata, T., Furukawa, Y.,Matsushita, T., Ishizawa, Y., Yagi, N., Takata, M., Kitamura, H., Sakurai, K., Tashiro, K.,Takahara, A., Amamiya, A., Horie, K., Takenaka, M., Kanaya, T., Jinnai, H., Okuda, H.,Akiba, I., Takahashi, I., Yamamoto, K., Hikosaka, M., Sakurai, H., Shinohara, Y.,Okada, A. & Sugihara, Y. Multipurpose soft-material SAXS/WAXS/GISAXS beamline atSPring-8. Polym. J. 43, 471–477 (2011).
17 Mandelkern, L. Crystallization of Polymers: Kinetics and Mechanisms. Vol 2.(Cambridge University Press, Cambridge, UK, 2004).
18 Guinier, A. & Fournet, G. Small-Angle Scattering of X-Rays. (John Wiley & Sons, Inc.,New York, 1955).
Structural analysis of PET during uniaxial drawing above TgK Okada et al
56
Polymer Journal