structural analysis of pylon head for cable stayed …isomase.org/jomase/vol.51 jan...
TRANSCRIPT

Journal of Ocean, Mechanical and Aerospace -Science and Engineering-, Vol.51
January 30, 2018
1 JOMAse | Received: 30-October-2017 | Accepted: 30-January-2018 | [(51) 1: 1-6] Published by International Society of Ocean, Mechanical and Aerospace Scientists and Engineers, www.isomase.org., ISSN: 2354-7065 & e-ISSN: 2527-6085
Structural Analysis of Pylon Head for Cable Stayed Bridge Using Non-Linear Finite Element Method
Musthafa Akbar a,* and Aditya Sukma Nugraha b
a)Department of Mechanical Engineering, Faculty of Engineering, Universitas Riau, Indonesia b)Center for Electricity and Mechatronics, Indonesian Institute of Sciences, Indonesia
*Corresponding author: [email protected] Paper History Received: 30-October-2017 Received in revised form: 10-January-2018 Accepted: 30-January-2018
ABSTRACT Cable-stayed bridge is a type of bridge structure that commonly used for long-span range. This study provides an important opportunity to advance the understanding nonlinearities of material and geometry which is used for pylon of cable-stayed bridge structure. This study limited to response of pylon structure subjected to tension load which already calculated previously using structural analysis program. The methodology of structural analysis in order to determine working stress in the pylon structure under cable tension load is based on non-linear finite element method by incorporating an elastic-plastic material model and involve large deformation logarithm. In this study, laboratory experiment was held using test method ASTM A370. In finite element of plasticity analysis Ramberg-Osgood model was used to generate stress-strain curve of material. Based on finite element analysis that we have done, both of pylon structure will be fail or experience permanent plastic deformation if it subjected to loading conditions as mentioned in this research. The most critical regions in the structure are at Section A2 for left side pylon and at Section A11 for right side pylon. In critical regions, maximum Von-Misses stress reach 427.96 MPa for left side pylon and 430.56 MPa for right side pylon. Those stress value are beyond yield strength of material which is used for the structure. Design optimization can be done for the structure with some considerations, e.g. modification of design in the critical region, improve material properties or just change thickness of material in the critical regions.
KEY WORDS: Cable Stayed Bridge, Structural Analysis, Finite Element Method, Nolinearitie. NOMENCLATURE
E Modulus Elasticity v^ Poisson Ratio σu Ultimate Strength σ_y Yield Strength 1.0 BACKGROUND Cable-stayed bridge is a type of bridge structure that commonly used for long-span range. In cable-stayed bridge, the towers or pylons of the bridge are used to support either dynamic or static load in the structure. Load from the bridge is transferred into pylon head using a set of cables. In its applications, one or more pylon head is used, depend on load and construction of the bridge. Compression load will transmitted into the pylon material which resulted from tension load in the cable.
This study provides an important opportunity to advance the understanding nonlinearities of material and geometry which is used for pylon of cable-stayed bridge structure. Due to practical constraints, this paper cannot provide a comprehensive review of overall loading conditions in the bridge structure. This study limited to response of pylon structure subjected to tension load which already calculated previously using civil structural analysis program. Weight of bridge structure, properties of cable and bridge material, static load, dynamic load, and another parameter are considered in the previous analysis.
Several researchers were publish their works regarding to structural analysis of cable-stayed bridge. Raid Karoumi [1] develop a method in non-linear finite element method for modelling cable supporting bridge. His work limited only to modelling of cable supported bridge with using non-linear finite
Journal of Ocean, Mechanical and Aerospace -Science and Engineering-, Vol.51
January 30, 2018
2 JOMAse | Received: 30-October-2017 | Accepted: 30-January-2018 | [(51) 1: 1-6] Published by International Society of Ocean, Mechanical and Aerospace Scientists and Engineers, www.isomase.org., ISSN: 2354-7065 & e-ISSN: 2527-6085
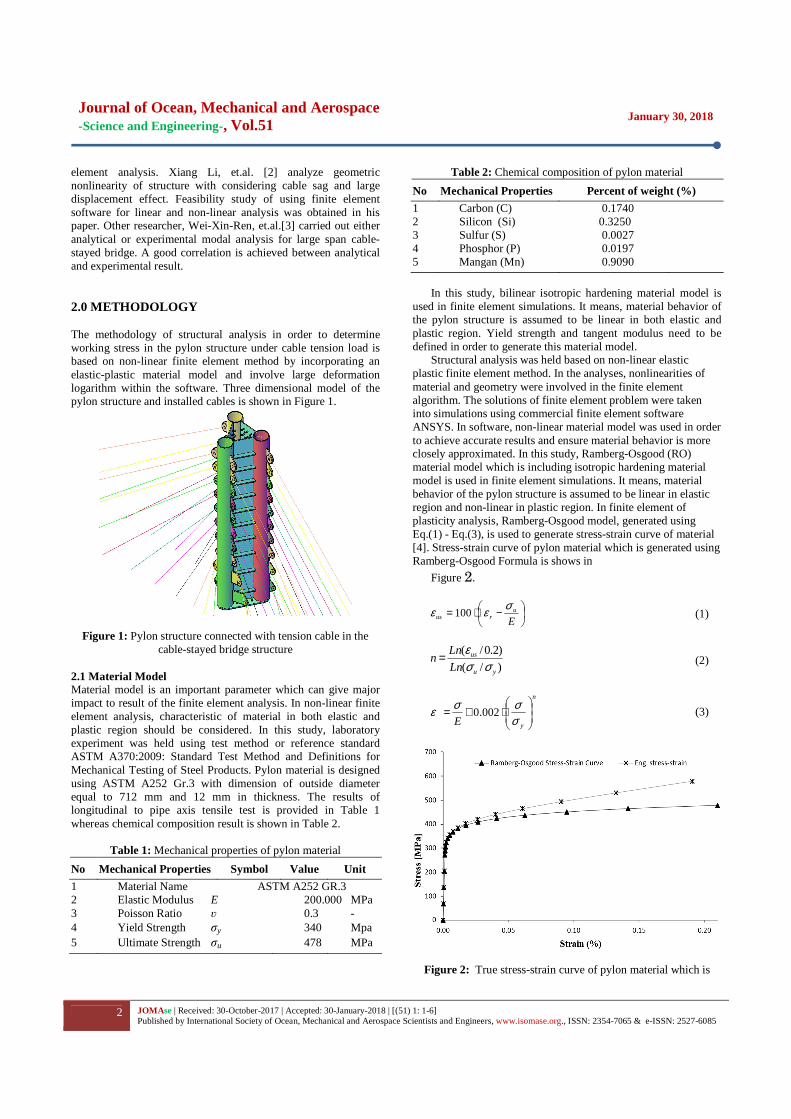
element analysis. Xiang Li, et.al. [2] analyze geometric nonlinearity of structure with considering cable sag and large displacement effect. Feasibility study of using finite element software for linear and non-linear analysis was obtained in his paper. Other researcher, Wei-Xin-Ren, et.al.[3] carried out either analytical or experimental modal analysis for large span cable-stayed bridge. A good correlation is achieved between analytical and experimental result. 2.0 METHODOLOGY The methodology of structural analysis in order to determine working stress in the pylon structure under cable tension load is based on non-linear finite element method by incorporating an elastic-plastic material model and involve large deformation logarithm within the software. Three dimensional model of the pylon structure and installed cables is shown in Figure 1.
Figure 1: Pylon structure connected with tension cable in the cable-stayed bridge structure
2.1 Material Model Material model is an important parameter which can give major impact to result of the finite element analysis. In non-linear finite element analysis, characteristic of material in both elastic and plastic region should be considered. In this study, laboratory experiment was held using test method or reference standard ASTM A370:2009: Standard Test Method and Definitions for Mechanical Testing of Steel Products. Pylon material is designed using ASTM A252 Gr.3 with dimension of outside diameter equal to 712 mm and 12 mm in thickness. The results of longitudinal to pipe axis tensile test is provided in Table 1 whereas chemical composition result is shown in Table 2.
Table 1: Mechanical properties of pylon material
No Mechanical Properties Symbol Value Unit
1 Material Name ASTM A252 GR.3 2 Elastic Modulus E 200.000 MPa 3 Poisson Ratio ʋ 0.3 - 4 Yield Strength σy 340 Mpa 5 Ultimate Strength σu 478 MPa
Table 2: Chemical composition of pylon material
No Mechanical Properties Percent of weight (%)
1 Carbon (C) 0.1740 2 Silicon (Si) 0.3250 3 Sulfur (S) 0.0027 4 Phosphor (P) 0.0197 5 Mangan (Mn) 0.9090
In this study, bilinear isotropic hardening material model is used in finite element simulations. It means, material behavior of the pylon structure is assumed to be linear in both elastic and plastic region. Yield strength and tangent modulus need to be defined in order to generate this material model.
Structural analysis was held based on non-linear elastic plastic finite element method. In the analyses, nonlinearities of material and geometry were involved in the finite element algorithm. The solutions of finite element problem were taken into simulations using commercial finite element software ANSYS. In software, non-linear material model was used in order to achieve accurate results and ensure material behavior is more closely approximated. In this study, Ramberg-Osgood (RO) material model which is including isotropic hardening material model is used in finite element simulations. It means, material behavior of the pylon structure is assumed to be linear in elastic region and non-linear in plastic region. In finite element of plasticity analysis, Ramberg-Osgood model, generated using Eq.(1) - Eq.(3), is used to generate stress-strain curve of material [4]. Stress-strain curve of pylon material which is generated using Ramberg-Osgood Formula is shows in
Figure 2.
−⋅=E
urus
σεε 100 (1)
)/(
)2.0/(
yu
us
Ln
Lnn
σσε
= (2)
n
yE
⋅+=
σσσε 002.0 (3)
Figure 2: True stress-strain curve of pylon material which is
Journal of Ocean, Mechanical and Aerospace -Science and Engineering-, Vol.51
January 30, 2018
3 JOMAse | Received: 30-October-2017 | Accepted: 30-January-2018 | [(51) 1: 1-6] Published by International Society of Ocean, Mechanical and Aerospace Scientists and Engineers, www.isomase.org., ISSN: 2354-7065 & e-ISSN: 2527-6085
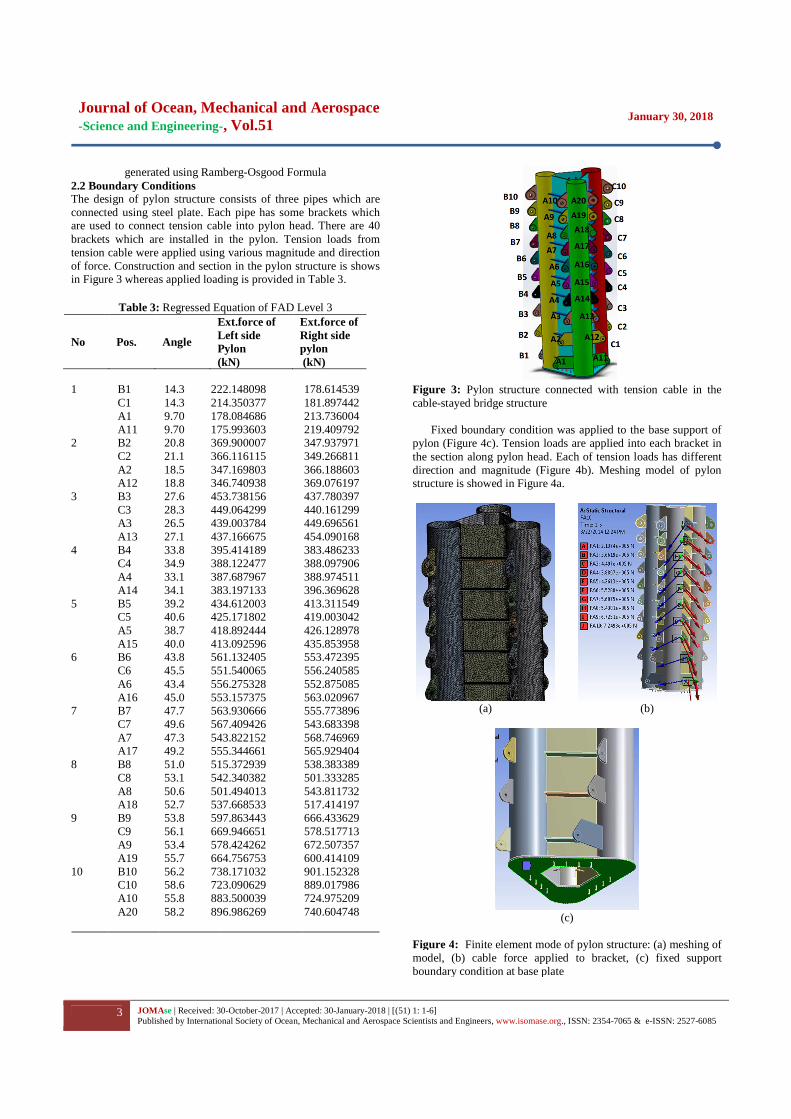
generated using Ramberg-Osgood Formula 2.2 Boundary Conditions The design of pylon structure consists of three pipes which are connected using steel plate. Each pipe has some brackets which are used to connect tension cable into pylon head. There are 40 brackets which are installed in the pylon. Tension loads from tension cable were applied using various magnitude and direction of force. Construction and section in the pylon structure is shows in Figure 3 whereas applied loading is provided in Table 3.
Table 3: Regressed Equation of FAD Level 3
No Pos. Angle
Ext.force of Left side Pylon (kN)
Ext.force of Right side pylon (kN)
1 B1 14.3 222.148098 178.614539 C1 14.3 214.350377 181.897442 A1 9.70 178.084686 213.736004 A11 9.70 175.993603 219.409792 2 B2 20.8 369.900007 347.937971 C2 21.1 366.116115 349.266811 A2 18.5 347.169803 366.188603 A12 18.8 346.740938 369.076197 3 B3 27.6 453.738156 437.780397 C3 28.3 449.064299 440.161299 A3 26.5 439.003784 449.696561 A13 27.1 437.166675 454.090168 4 B4 33.8 395.414189 383.486233 C4 34.9 388.122477 388.097906 A4 33.1 387.687967 388.974511 A14 34.1 383.197133 396.369628 5 B5 39.2 434.612003 413.311549 C5 40.6 425.171802 419.003042 A5 38.7 418.892444 426.128978 A15 40.0 413.092596 435.853958 6 B6 43.8 561.132405 553.472395 C6 45.5 551.540065 556.240585 A6 43.4 556.275328 552.875085 A16 45.0 553.157375 563.020967 7 B7 47.7 563.930666 555.773896 C7 49.6 567.409426 543.683398 A7 47.3 543.822152 568.746969 A17 49.2 555.344661 565.929404 8 B8 51.0 515.372939 538.383389 C8 53.1 542.340382 501.333285 A8 50.6 501.494013 543.811732 A18 52.7 537.668533 517.414197 9 B9 53.8 597.863443 666.433629 C9 56.1 669.946651 578.517713 A9 53.4 578.424262 672.507357 A19 55.7 664.756753 600.414109 10 B10 56.2 738.171032 901.152328 C10 58.6 723.090629 889.017986 A10 55.8 883.500039 724.975209 A20 58.2 896.986269 740.604748
Figure 3: Pylon structure connected with tension cable in the cable-stayed bridge structure
Fixed boundary condition was applied to the base support of pylon (Figure 4c). Tension loads are applied into each bracket in the section along pylon head. Each of tension loads has different direction and magnitude (Figure 4b). Meshing model of pylon structure is showed in Figure 4a.
(a) (b)
(c)
Figure 4: Finite element mode of pylon structure: (a) meshing of model, (b) cable force applied to bracket, (c) fixed support boundary condition at base plate

Journal of Ocean, Mechanical and Aerospace -Science and Engineering-, Vol.51
January 30, 2018
4 JOMAse | Received: 30-October-2017 | Accepted: 30-January-2018 | [(51) 1: 1-6] Published by International Society of Ocean, Mechanical and Aerospace Scientists and Engineers, www.isomase.org., ISSN: 2354-7065 & e-ISSN: 2527-6085
3.0 RESULTS AND ANALYSIS In this paper, structural analysis was conducted based on resulted stress and deformation along the pylon structure. Non linear finite element simulations were carried out to generate such stress and deformation behavior of the structure. Von-misses stress criterion was used due to complex loading and stress conditions in the numerical model. Based on stress contour which is showed in Figure 5, maximum Von-Misses stress in the structure are 427.96 MPa for left side and 430.56 MPa for right side pylon of the bridge.
(a) (b)
(c) (d)
Figure 5: Stress contour along pylon structure: (a) front view of left side pylon, (b) back view of left side pylon, (c) front view of right side pylon, (d) back view of right side pylon.
The main critical areas in the structure are at bottom side of the pylon. In left pylon, maximum stress occur at section A2, second bracket from the base of pylon, whereas in right pylon occur at section A1. Stresses which are resulted around those
sections are considered above yield strength of material. It means, working stresses in the material are causing permanent or plastic deformation which is not acceptable for pylon structure. Figure 6 shows stress distribution in the critical region.
(a)
(b)
Figure 6: Stress distribution at bottom side of pylon: (a) left side pylon, (b) right side pylon
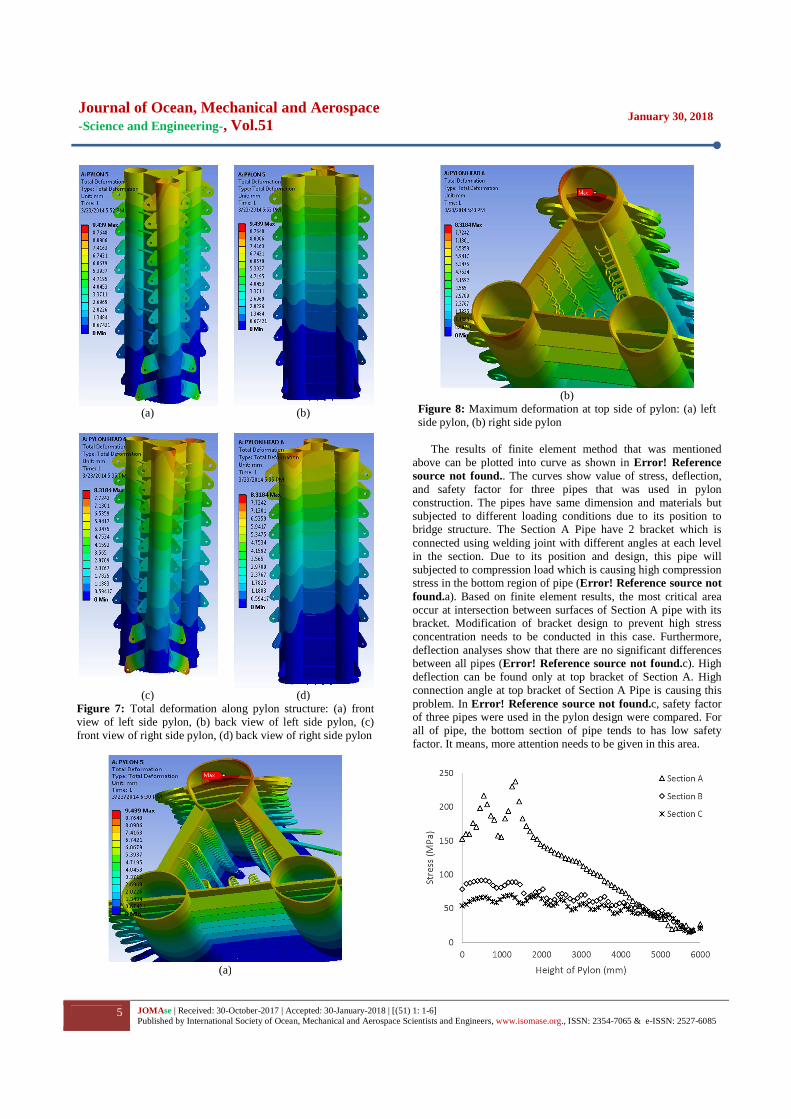
Total deformation along pylon structure can be seen in Figure 7. These results are determined to analyze balance and stability of the structure, not only in the pylon head but also for overall bridge structure. In simulations, hollow portion of pylon is assumed empty whereas in actual condition that part is filled with concrete materials. This assumption will make simulation results are larger than actual stress in the structure. Maximum deformation for both pylons are same in the top side, but at different point. Maximum deformation in left side pylon is 9.43 mm whereas in right side pylon is 8.31 mm. Large deformation in the pylon head is show in Figure 8. Distortion of pipe will reduce tension force in the cable and at same has influence on stability of the bridge.
Journal of Ocean, Mechanical and Aerospace -Science and Engineering-, Vol.51
January 30, 2018
5 JOMAse | Received: 30-October-2017 | Accepted: 30-January-2018 | [(51) 1: 1-6] Published by International Society of Ocean, Mechanical and Aerospace Scientists and Engineers, www.isomase.org., ISSN: 2354-7065 & e-ISSN: 2527-6085
(a) (b)
(c) (d) Figure 7: Total deformation along pylon structure: (a) front view of left side pylon, (b) back view of left side pylon, (c) front view of right side pylon, (d) back view of right side pylon
(a)
(b)
Figure 8: Maximum deformation at top side of pylon: (a) left side pylon, (b) right side pylon
The results of finite element method that was mentioned
above can be plotted into curve as shown in Error! Reference source not found.. The curves show value of stress, deflection, and safety factor for three pipes that was used in pylon construction. The pipes have same dimension and materials but subjected to different loading conditions due to its position to bridge structure. The Section A Pipe have 2 bracket which is connected using welding joint with different angles at each level in the section. Due to its position and design, this pipe will subjected to compression load which is causing high compression stress in the bottom region of pipe (Error! Reference source not found.a). Based on finite element results, the most critical area occur at intersection between surfaces of Section A pipe with its bracket. Modification of bracket design to prevent high stress concentration needs to be conducted in this case. Furthermore, deflection analyses show that there are no significant differences between all pipes (Error! Reference source not found.c). High deflection can be found only at top bracket of Section A. High connection angle at top bracket of Section A Pipe is causing this problem. In Error! Reference source not found.c, safety factor of three pipes were used in the pylon design were compared. For all of pipe, the bottom section of pipe tends to has low safety factor. It means, more attention needs to be given in this area.

Journal of Ocean, Mechanical and Aerospace -Science and Engineering-, Vol.51
January 30, 2018
6 JOMAse | Received: 30-October-2017 | Accepted: 30-January-2018 | [(51) 1: 1-6] Published by International Society of Ocean, Mechanical and Aerospace Scientists and Engineers, www.isomase.org., ISSN: 2354-7065 & e-ISSN: 2527-6085
(a)
(b)
(c)
Figure 9: Distribution along longitudinal axis of pylon for: (a) stress, (b) deflection, and (c) safety factor 4.0 CONCLUSION Based on finite element analysis that we have done, there are some conclusions were taken:
1. Both of pylon structure will be fail or experience permanent plastic deformation if it subjected to loading conditions as mentioned in this paper.
2. The most critical regions in the structure are at Section A2 for left side pylon and at Section A11 for right side pylon.
3. In critical regions, maximum Von-Misses stress reach 427.96 MPa for left side pylon and 430.56 MPa for right side pylon. Those stress value are beyond yield strength of material which is used for the structure.
4. Design optimization can be done for the structure with some considerations, e.g. modification of design in the critical region, improve material properties or just change thickness of material in the critical regions.
REFERENCE 1. R. Karoumi, “Some modeling aspects in the nonlinear finite
element analysis of cable supported bridges,” Comput. Struct., vol. 71, no. 4, pp. 397–412, May 1999.
2. X. Li, Y. Liu, and A. F. Zhang, “Geometric Nonlinear Analysis of Low-Pylon Cable-Stayed Bridge Based on Finite Element Method,” in Applied Mechanics and Materials, 2013, vol. 353, pp. 3664–3668.
3. W.-X. Ren, X.-L. Peng, and Y.-Q. Lin, “Experimental and analytical studies on dynamic characteristics of a large span cable-stayed bridge,” Eng. Struct., vol. 27, no. 4, pp. 535–548, Mar. 2005.
4. W. Ramberg, W. R. Osgood, U. States., and N. A. C. for Aeronautics., Description of stress-strain curves by three parameters. Washington D.C.: National Advisory Committee for Aeronautics, 1943.