structural analysis on mutation residues and interfacial ... papers/2013 tim disease 1471-2… ·...
TRANSCRIPT
RESEARCH Open Access
Structural analysis on mutation residues andinterfacial water molecules for human TIMdisease understandingZhenhua Li1, Ying He1, Qian Liu2, Liang Zhao1, Limsoon Wong3, Chee Keong Kwoh1, Hung Nguyen2, Jinyan Li2*
From Asia Pacific Bioinformatics Network (APBioNet) Twelfth International Conference on Bioinformatics(InCoB2013)Taicang, China. 20-22 September 2013
Abstract
Background: Human triosephosphate isomerase (HsTIM) deficiency is a genetic disease caused often by thepathogenic mutation E104D. This mutation, located at the side of an abnormally large cluster of water in the inter-subunit interface, reduces the thermostability of the enzyme. Why and how these water molecules are directlyrelated to the excessive thermolability of the mutant have not been investigated in structural biology.
Results: This work compares the structure of the E104D mutant with its wild type counterparts. It is found that thewater topology in the dimer interface of HsTIM is atypical, having a “wet-core-dry-rim” distribution with 16 watermolecules tightly packed in a small deep region surrounded by 22 residues including GLU104. These watermolecules are co-conserved with their surrounding residues in non-archaeal TIMs (dimers) but not conservedacross archaeal TIMs (tetramers), indicating their importance in preserving the overall quaternary structure. As thestructural permutation induced by the mutation is not significant, we hypothesize that the excessive thermolabilityof the E104D mutant is attributed to the easy propagation of atoms’ flexibility from the surface into the core viathe large cluster of water. It is indeed found that the B factor increment in the wet region is higher than otherregions, and, more importantly, the B factor increment in the wet region is maintained in the deeply buried core.Molecular dynamics simulations revealed that for the mutant structure at normal temperature, a clear increase ofthe root-mean-square deviation is observed for the wet region contacting with the large cluster of interfacialwater. Such increase is not observed for other interfacial regions or the whole protein. This clearly suggests that, inthe E104D mutant, the large water cluster is responsible for the subunit interface flexibility and overallthermolability, and it ultimately leads to the deficiency of this enzyme.
Conclusions: Our study reveals that a large cluster of water buried in protein interfaces is fragile and high-maintenance, closely related to the structure, function and evolution of the whole protein.
IntroductionHuman triosephosphate isomerase (TIM) deficiency,first reported by Schneider et al. in 1965 [1], is a geneticdisease caused by the dysfunction of TIM. Clinical phe-notypic characteristics of this disease include chronic
hemolytic anemia and progressive neuromuscular disor-der, which can eventually lead to early childhood death.In aged people, induced dysfunction of TIM is relatedto the neurodegenerative Alzheimer’s disease [2,3]. Dis-eased cells of patients with TIM deficiency usually exhi-bit reduced TIM activity and a high level of thesubstrate DHAP. There are also many misfolded TIMproteins in diseased cells which accumulate to formlarge protein aggregates directly responsible for the neu-rodegenerative disorder [4]. A more recent study shows
* Correspondence: [email protected] Analytics Institute and Center for Health Technologies, Faculty ofEngineering and Information Technology, University of Technology Sydney,PO Box 123, NSW 2007, AustraliaFull list of author information is available at the end of the article
Li et al. BMC Bioinformatics 2013, 14(Suppl 16):S11http://www.biomedcentral.com/1471-2105/14/S16/S11
© 2013 Li et al.; licensee BioMed Central Ltd. This is an open access article distributed under the terms of the Creative CommonsAttribution License (http://creativecommons.org/licenses/by/2.0), which permits unrestricted use, distribution, and reproduction inany medium, provided the original work is properly cited.
that reduced activity of TIM can lead to an oxidizedredox state, making the subject sensitive to oxidativestress, and this explains why the disease phenotype pro-gresses gradually [5].More than 10 mutations [6] have been observed in
Homo sapiens TIM (HsTIM) that causes the TIM defi-ciency, such as E104D [7], V231M [8], F240L [9], C41Y[10], and I170V [10]. The mutation E104D, a glutamateat position 104 substituted by an aspartate, occurs mostoften of these mutations. E104D was first studied byDaar et al. in 1986 [7] by comparing two unrelated TIMpatients. An important finding is that the E104D mutantis thermolabile–that is, when the temperature goes upslightly, the enzyme is easily subject to destruction orgreat change, and then the enzyme loses its activityquickly. Following these pioneering studies [1,7], manyother patients with the E104D mutation from severalfamilies across the world have been investigated[8,11-13]. All these patients are believed to originatefrom a common ancestor dated back to more than 1000years ago [14]. In 1994, a recombinant HsTIM structurewas solved at 2.8 Å resolution [15], and the local residueorganization of GLU104 was unveiled. However, the con-clusion–the E104D mutation changes the structure of theactive sites through a chain of perturbations–is notexactly correct. Rather, in 2006, Ralser et al. concludedthat TIM deficiency is caused by the altered dimerizationbut not the inactivity of the enzyme [16]. In 2008, thestructure of E104D HsTIM mutant was solved at a betterresolution 1.85 Å [17]. Comparing with the wild typestructure, it was found that there is no significant changein the active site region, and found that the catalyticactivity of the mutant enzyme is at the same magnitudeas the native enzyme. However, the structural compari-son of the mutated site between the wild type and themutant reveals that there is a perturbation in the organi-zation of the interfacial water molecules. Despite of theseconflicting statements in the past research, the commonunderstanding on the pathogenesis of the mutationE104D shares the following points: (i) There is an altera-tion of the binding of the two subunits in the E104Dmutant [16]; (ii) The altered binding of the two subunitsharms thermostability of the protein [1]; and (iii) theexcessive thermolability causes the dysfunction of theenzyme [1]. These are wet-lab results and are hencevalid. The only gap yet to be filled in the chain of knowl-edge explaining the pathogenesis of the mutation E104Dis to find out how exactly the E104D alters the binding ofthe two subunits. It is already known that the interfacialwater molecules play an important role in the binding ofthe two subunits [17]. However, the literature work doesnot answer why and how the interfacial water moleculescontribute to the excessive thermolability of the mutant.
In fact, it is unknown whether or not the presence of thelarge water cluster is responsible for the thermolability.In this work, we conduct a comparative analysis on
the wild type HsTIM and the E104D mutant’s structuresto understand the pathogenesis of this mutation andaddress three specific questions:
• why the mutation E104D can alter the binding affi-nity of the two subunits,• how the mutation E104D introduces excessivethermolability to the enzyme, and• what role the interfacial water molecules play.
The HsTIM dimer interface is a very abnormal interfacein terms of the distribution of water molecules. The watermolecules are unevenly distributed in an atypical “wet-core-dry-rim” manner. Most of the 25 interfacial watermolecules are tightly enveloped by 22 residues in a deepregion (denoted by region A) with the residue GLU104 atthe periphery (Figure 1). Both the water and the residuesin region A are well conserved in eukaryotic and bacterialTIMs (dimers), but the conservation is not observed inarchaeal TIMs (tetramers). These facts motivate us toexamine whether this large cluster of water in region A isneeded in nature to maintain the quaternary structure ofnon-archaeal TIMs, and whether the protecting residueshave to be conserved as well to maintain this water clusterduring evolution. The overall dimer interface of E104DHsTIM mutant has a similar size and wetness as that ofthe native enzyme, and the structural perturbation interms of the spatial movement of atoms in this mutant isnot significant. The native and the mutant also have thesame number of interfacial water molecules. All theseindicate that the pathogenesis of the mutation is notsimply attributed to the structural perturbation of theinterface.This work goes beyond the scope of structural pertur-
bation studies. We hypothesize that the large cluster ofwater in region A transmits the atoms’ mobility from thesurface deeply into the core of the interface, and that thismobility transmission can harm the thermostability ofthe subunit binding and the function of the protein. Asthe B factor of atoms is closely related to the thermolabil-ity of a protein [18,19], the elevated normalized B factorsare used to understand the increased flexibility of theinterfacial water and other atoms clustered near themutated site (i.e., water in region A).To validate our hypothesis of the role of water cluster in
region A, molecular dynamics simulations were run forthe wild type and the mutant HsTIM. The difference inthe root-mean-square deviation (RMSD) between the twostructures over the simulation is only observed in regionA. For other interfacial regions and the whole protein, the
Li et al. BMC Bioinformatics 2013, 14(Suppl 16):S11http://www.biomedcentral.com/1471-2105/14/S16/S11
Page 2 of 15
RMSD does not change much. Thus we conclude that it isthe water molecules in region A that are directly responsi-ble for the excessive thermolability of the enzyme.As highlights, our pathogenesis study for the mutation
E104D is to affirm: (i) this mutation can lead to an excessivethermolability of the enzyme, and (ii) the binding betweenthe two subunits is harmed by the increased flexibility ofthe interfacial atoms, which are amplified by the large clus-ter of buried water near the mutation site. In other words,the abnormal organizational topology of water molecules inthe HsTIM dimer interface is the key to understanding thefundamental mechanism of the HsTIM deficiency. Ourresults can be generalized to understand that large clustersof water molecules in protein binding interface are veryhigh-maintenance, and they can greatly affect the overallstructure, function and evolution of the protein.
MethodsProtein structures used in this studyThe structures of wild type HsTIM and mutant E104Dare taken from a previous study [17]. To get the TIM
structures of other species, a search of “triosephosphateisomerase” in the protein data bank was performed. Andthe structures are selected manually. TIM structurescollected by Wierenga et al. [20] are also considered.After removing some structures with mutations, orwithout solvent information, we get the wild type TIMstructures from 20 different species. The detailed infor-mation of these structures can be found in Table 1.The water distribution topology of HsTIM dimer inter-
face is compared with a data set of homodimeric inter-faces. They are selected from 206 obligate interfacescollected from a few previous studies [21-24]. Obligateprotein interfaces are considered as a homodimeric inter-face if the two interacting protein chains are identical.Some interfaces with less than 10 water molecules areremoved as their rWBL and gini coefficient (definedlater) are of large variance. Finally, 91 homodimers areleft and they are used in a comparative analysis to illus-trate the abnormality of HsTIM dimer interface. Theinformation of these 91 interfaces and their propertiesare available in Additional file 1.
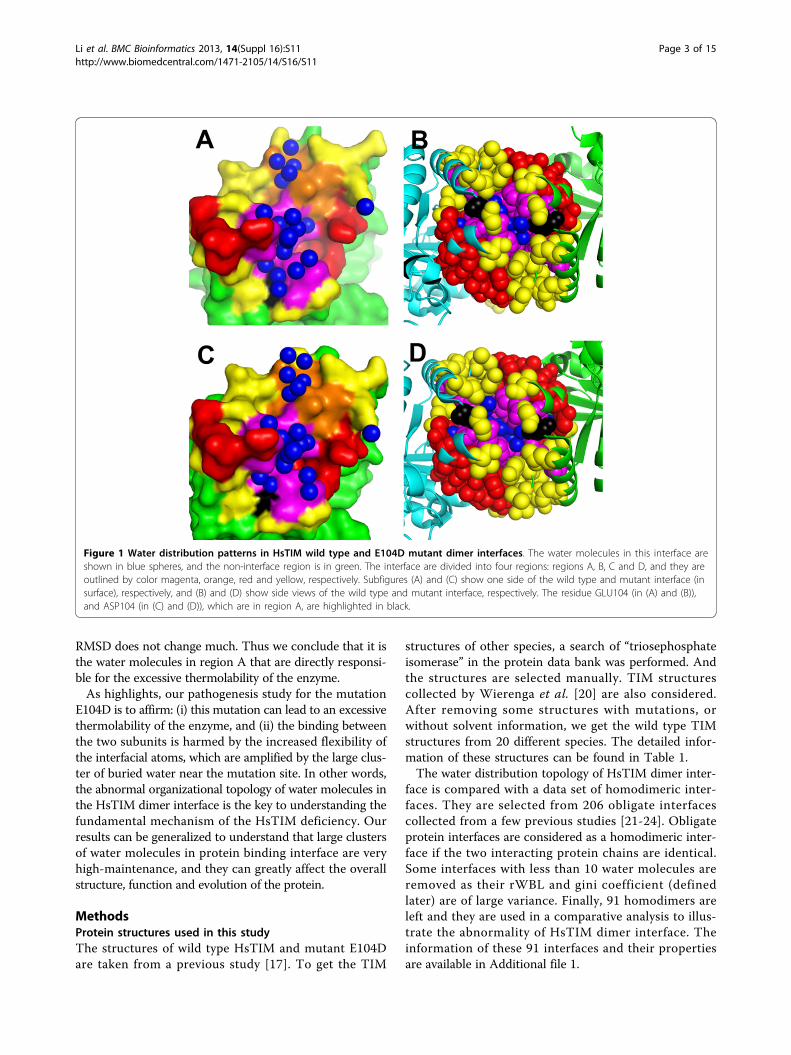
Figure 1 Water distribution patterns in HsTIM wild type and E104D mutant dimer interfaces. The water molecules in this interface areshown in blue spheres, and the non-interface region is in green. The interface are divided into four regions: regions A, B, C and D, and they areoutlined by color magenta, orange, red and yellow, respectively. Subfigures (A) and (C) show one side of the wild type and mutant interface (insurface), respectively, and (B) and (D) show side views of the wild type and mutant interface, respectively. The residue GLU104 (in (A) and (B)),and ASP104 (in (C) and (D)), which are in region A, are highlighted in black.
Li et al. BMC Bioinformatics 2013, 14(Suppl 16):S11http://www.biomedcentral.com/1471-2105/14/S16/S11
Page 3 of 15

Definitions of protein-water-protein tripartite interface,burial level and gini coefficientWe consider only heavy atoms in this study. Watermolecules immobilized in a protein/protein complex areconsidered as a part of the protein/protein complexrather than a part of bulk solvent. Water molecules witha larger than 10 Å2 solvent accessible surface area(SASA) are defined as exposed as a part of bulk solventand they are removed iteratively from a structure untilno water molecules are exposed in the structure. Theremaining structure including those buried water mole-cules are considered as the protein complex and areused in the subsequent processes in our work.For each protein complex structure, an atomic contact
graph is defined with atoms as its nodes and atomiccontacts as its edges. Atomic contacts are defined bycombining the Voronoi diagram and an atom-atom dis-tance. The distance threshold for an atomic contactbetween two atoms is the sum of their radii plus thediameter of a water molecule 2.75 Å.Protein-water-protein tripartite interfaceWe define the interface between two proteins as a tripar-tite graph, which is a subgraph of the atomic contactgraph of the whole protein complex. The nodes of aninterface tripartite graph consist of three sets of atoms: theoxygen atoms of the interfacial water molecules and theatoms from the two interacting partners that have atomiccontact with interfacial water or with the interacting
partner. A water molecule is defined as interfacial water ifit has atomic contacts with both sides. The edges in thetripartite graph are the atomic contacts among the threesets. In this way the atom level interface is defined as a setof atoms. We also define any residue that has at least oneatom in the interface as an interfacial residue.Burial level and relative water burial levelThe burial level of an atom a (denoted as BLa) in a pro-tein complex is calculated in the atomic contact graph.It is the length of the shortest path to the nearestexposed atom-an atom with an SASA larger than 10 Å2.The relative water burial level (rWBL) is calculated as
the average burial level of water divided by the averageburial level of all interfacial atoms:
rWBL =
∑a ∈IW
BLa/|IW |∑
a ∈I BLa/|I| (1)
where I is the set of atoms in the interface, IW is theoxygen atoms of the water molecules in interface, and|I| is the cardinality of set I, which is the number ofatoms in this interface. According to this definition, alarge rWBL indicates that the water molecules are dee-ply buried.Gini coefficient of water distributionGini coefficient is widely used to describe the uneven-ness of a distribution. Usually it is used to measure theinequality of income or wealth. Its value is between
Table 1 TIM structures and subunit interfaces used in this study
Domain PDB Organism Resolution (Å) #Water #Atoms Wetness rWBL gini
Eukarya 2JK2 H. sapiens 1.70 25 546 0.046 1.282 0.684
1R2R O. cuniculus 1.50 30 563 0.053 1.140 0.681
1TPH G. gallus 1.80 23 517 0.044 1.270 0.724
2I9E T. molitor 2.00 17 498 0.034 0.894 0.687
1MO0 C. elegans 1.70 29 530 0.055 1.063 0.620
1YPI S. cerevisiae 1.90 22 503 0.044 1.304 0.649
1TPF T. brucei 1.80 22 479 0.046 1.034 0.633
1TCD T. cruzi 1.83 19 464 0.041 1.004 0.655
1AMK L. mexicana 1.83 23 483 0.048 1.017 0.630
1M6J E. histolytica 1.50 23 490 0.047 1.159 0.631
1YDV P. falciparum 2.20 28 540 0.052 1.049 0.515
Bacteria 1TRE E. coli 2.60 12 491 0.024 1.293 0.671
1AW2 M. marina 2.65 17 478 0.036 1.032 0.709
1B9B T. maritima 2.85 11 502 0.022 1.162 0.680
3GVG M. tuberculosis 1.55 41 587 0.070 1.132 0.594
3KXQ B. henselae 1.60 46 600 0.077 1.121 0.502
2JGQ H. pylori 2.30 31 555 0.056 1.146 0.525
Archaea 1HG3 P. woesei 2.70 18 458 0.039 1.103 0.611
2H6R M. jannaschii 2.30 5 400 0.013 1.268 0.747
1W0M T. tenax 2.50 21 487 0.043 1.075 0.516
The TIM structures from 20 organisms used and their properties: resolution, number of interfacial waters, number of interfacial atoms, wetness, rWBL and ginicoefficient (from column 4 to column 9).
Li et al. BMC Bioinformatics 2013, 14(Suppl 16):S11http://www.biomedcentral.com/1471-2105/14/S16/S11
Page 4 of 15

0 and 1. A lower gini coefficient indicates a moreuneven income distribution of a country. Gini coeffi-cient is defined based on the Lorenz curve [25]. Lorenzcurve is a plot of the cumulative share of populationordered from the lowest income to the highest incomeversus the cumulative share of the income. If theincomes are absolutely equal, the Lorenz curve will be astraight line, which is called line of equality. The ginicoefficient is defined as the area between the Lorenzcurve and the line of equality divided by the area underthe line of equality.Here, we borrow the concept of gini coefficient to
address how unevenly the water is distributed in an inter-face. The (probabilistic) distribution of the number ofcontacting interfacial water molecules (of interfacial non-water atoms) is used. In our case, for an interface, theLorenz curve is the connection of several successive linesegments, where the horizontal axis is between 0 and n(n is the number of non water interfacial atoms) and the
vertical axis between 0 and∑n
j=0yj. Here, yj is the num-
ber of contacting interfacial water molecules of interfacialatom j (y0 is set to 0) and the sequence from y1 to yn issorted in a non decreasing order with yj ≤ yj+1. TheLorenz curve starts at point (0, 0), and then a line seg-
ment is created between each (i - 1,∑i−1
j=0 yj) and (i,∑i
j=0 yj). Let X be the area between the Lorenz curve and
the line of equality (i.e. the line segment between (0, 0)
and (n,∑n
j=0yj)), and let Y be the area under the line of
equality. The gini coefficient of the interface is defined as:
G =XY
=
∑ni=1 iyi
n∑n
i=1 yi+
n + 1n
(2)
Structural alignment, water correspondence and B factornormalizationAs the sequences of the wild type HsTIM and E104Dmutant differ only from each other in one position, weperform structural alignment of the two structures bysuperimposing them using Pymol [26]. The algorithm isbased on the amino acid sequences of the two struc-tures. Once the aligned wild type and mutant structuresare obtained, the 25 water molecules in wild type aresearched in the mutant structure to determine whetherit reappears or not. If two interfacial water molecules,one in wild type and the other in mutant, are within 1.0Å distance from each other, and they are mutually theclosest water molecule to each other, we say the waterin the wild type structure reappears in the mutant.Due to the environmental differences when a protein
structure is solved, the B factors in different structures
cannot be compared directly. The B factor of a proteincomplex is normalized within the complex as:
B∗ =B − B̄a
σa(3)
where B is the original B factor reported in the PDBrecord, and B̄a and sa are the mean and standard deviationof the B factors of non water atoms which are at least 15 Åaway from the Cg of the mutated residue–GLU104. We donot consider water here because the water informationquality is correlated with the resolution [27] and, maybe,other environmental issues. We also exclude the atomsnear the mutated site from calculating mean and standarddeviation as the mutation is expected to change the B fac-tors of atoms near it. In this way we compare the B factorof an atom in wild type and mutant with non water atomsfar from the mutation site as references.
Molecular dynamics simulationTwo molecular dynamics simulations were run for thewild type [PDB: 2JK2] and the E104D mutant [PDB:2VOM] HsTIMs. Buried water molecules were includedin the initial structures. For both simulations, the proteinstructure was solvated in a water box where a minimumof 10 Å distance was kept between the protein and theboundary. Charges were neutralized by either Cl- or Na+
ions. Solvation and ionization were performed using thethe VMD software [28].For both simulations, CHARMM22 parameter set [29]
with CMAP correction [30] was used, and the step sizewas set to 2 fs. The solvated and ionized system was mini-mized for 1000 steps and simulated for 2500000 steps(5 ns). Initial velocities were set with human body tem-perature (310 K). Langevin piston pressure control wasused to control the system pressure at 1 atm. Periodicboundary conditions were used, and a threshold cutoff of12 Å was set for non-bonded interactions. Particle meshEwald method [31] was used to calculate long-range elec-trostatic interactions. The simulations was carried outwith the NAMD software [32].
ResultsWe first present results to illustrate how exactly atypicalthe HsTIM dimer interface is, followed by results on theevolution of the water and residues in the interface ofTIMs. We then present a hypothesis to understand thepathogenesis of the mutation E104D, and validate thehypothesis by molecular dynamics simulations.
The abnormal hydration in HsTIM dimer interfacesFigure 1(A) shows one side of the interface and all ofthe 25 interfacial water molecules (in blue). We divide
Li et al. BMC Bioinformatics 2013, 14(Suppl 16):S11http://www.biomedcentral.com/1471-2105/14/S16/S11
Page 5 of 15
the interface residues and water molecules into fourregions for detailed analysis: (i) region A which is a wetregion consisting of 16 water molecules and their sur-rounding 11 residues (in magenta and black color) fromeach side including the pathogenic mutation site 104 (inblack color), (ii) region B which is another wet regionwith 5 water molecules and 6 residues (in orange color)from each side, (iii) region C (in red color) which is thefunctional region of the enzyme, containing 15 residuesfrom each side including three of the four active siteresidues (ASN11, LYS13 and HIS95), and (iv) region D(in yellow color) which is a region in the interface con-taining residues and water that are not in region A, B orC. As the interface is homodimeric and symmetric, theresidues in these 4 regions can be doubled actually.Specifically in region A, the residue GLU104, whose
mutation into aspartate causes TIM deficiency, is high-lighted in black as shown in Figures 1(A) and 1(B). Itcan be seen that this residue is located at the watersideand reaches its side chain deeply into the water clusterin region A to “lock” this large amount of water mole-cules inside.The total 25 water molecules in this interface account
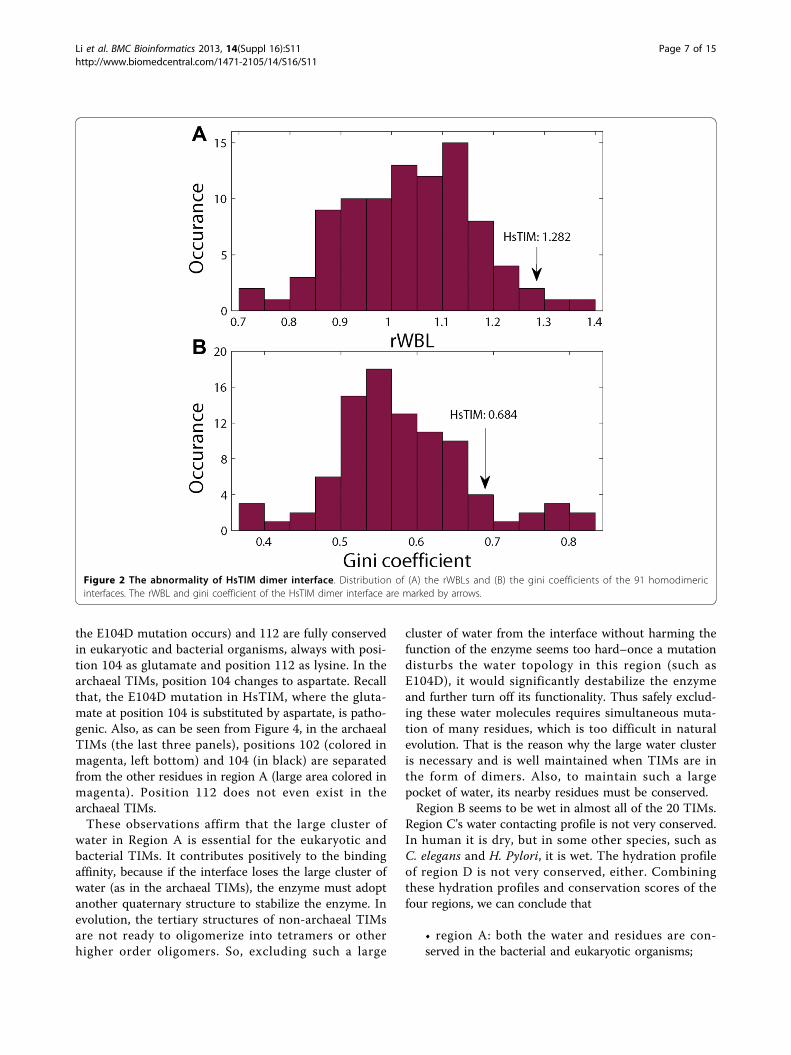
for 4.6% of the entire interfacial atoms. This wetness issimilar to the average wetness of obligate interfaces [33].However, it can be seen that these water molecules aredistributed in an unusual way with a very special topol-ogy. First, most of these water molecules are deeply bur-ied and clustered near the core of the interface. Second,these water molecules are unevenly distributed, mainly intwo wet regions. Normally, water molecules in proteinbinding interfaces are organized in a “dry-core-wet-rim”manner with most water molecules placed near the rimand the wetness goes down progressively from rim tocore [33]. This interface does not follow such a trend atall. In particular, the average burial level of the watermolecules is 2.32, yielding an extraordinarily high rWBL(the relative burial level of water in an interface, seeMaterials and Methods) of 1.282 with regard to the aver-age burial level of all the interfacial atoms 1.81. This kindof large water cluster is also unusual in terms of bindingfree energy, as immobilizing water molecules at the coreof a protein interface is energetically expensive [34].To see more about this water distribution abnormality,
we compared the HsTIM dimer interface with 91 otherhomodimer interfaces by calculating their rWBL and ginicoefficients. Results are shown in Figure 2. The rWBLdescribes the extent to which the water molecules are dee-ply buried and the gini coefficient indicates how uneventhe water distribution in the interface is. Both the rWBLand the gini coefficient of HsTIM dimer interface are veryhigh, comparing to the 91 homodimeric interfaces, indi-cating that the water distribution in this interface is very
different from typical homodimeric interfaces. In Figure 2,a few interfaces have a higher rWBL or a higher gini coef-ficient than HsTIM dimer interface. Note that most ofthese interfaces are very dry with very few interfacial watermolecules. When the number of interfacial water is small,the variance of rWBL is very large, and the gini coefficientis large due to fewer water-contacting atoms. The distribu-tion pattern of water molecules in these interfaces is thusof low significance.
Evolutionary studies on HsTIM dimer interface hydrationThere are 21 species’ wild type triosephosphate isomer-ase structures that have been solved by X-ray crystallo-graphy and the data is deposited in the protein databank [35] as of 2011. One of them (PDB: 1BTM) doesnot have solvent information, so it is excluded from ouranalysis. The 20 TIM structures are listed in Table 1.Modern eukaryotic TIMs are believed to have the alpha-
proteobacterial origin [36]. Thus, they are more similar tobacterial TIMs than to archaeal TIMs. Eukaryotic and bac-terial TIMs are dimers and archaeal TIMs are tetramers.In Figure 3(A), multiple sequence alignments of the inter-face residues (according to HsTIM) and their interfacialhydration profiles are shown. In Figure 4, organization ofinterfacial water molecules and the four regions (alignedin sequence with the four regions in HsTIM) are shown.An archaeal TIM tetramer has two distinct inter-subunitchain-chain binding interfaces, and here the one with thelarger overlap with HsTIM dimer interface is used. InFigure 3, the 20 organisms are ordered with the 11 eukar-yotes at the top, the 6 bacteria in the middle and the 3archaea at the bottom. The conservation according toConsurf [37] of these positions are shown in Figure 3(B),accordingly.As shown in Figure 3(A), region A is wet in all of the
eukaryotic and bacterial TIMs, indicating a large clusterof water is present in all non-archaeal TIMs. In Figure 4,it seems that three bacterial TIM dimer interfaces (inE. coli, M. marina and T. maritima TIMs) are dry inregion A. However, these three structures are solved atvery poor resolutions (Table 1), which usually implies aunder-reporting of water information [27]. Meanwhile, asin the other non-archaeal TIMs, large inter-protein cav-ities are observed in these structures, which may accom-modate water molecules. Thus, we believe these threeinterfaces are as wet as the other non-bacterial TIMdimer interfaces. Region A of the archaeal TIMs does nothave as much water as that of the non-archaeal organ-isms, as can be seen from Figure 3(A) and Figure 4.Furthermore, three positions (positions 102, 104 and 112according to HsTIM numbering) in the eukaryotic andbacterial TIM dimer interfaces are not in the correspond-ing interface in the archaeal TIMs. Positions 104 (where
Li et al. BMC Bioinformatics 2013, 14(Suppl 16):S11http://www.biomedcentral.com/1471-2105/14/S16/S11
Page 6 of 15
the E104D mutation occurs) and 112 are fully conservedin eukaryotic and bacterial organisms, always with posi-tion 104 as glutamate and position 112 as lysine. In thearchaeal TIMs, position 104 changes to aspartate. Recallthat, the E104D mutation in HsTIM, where the gluta-mate at position 104 is substituted by aspartate, is patho-genic. Also, as can be seen from Figure 4, in the archaealTIMs (the last three panels), positions 102 (colored inmagenta, left bottom) and 104 (in black) are separatedfrom the other residues in region A (large area colored inmagenta). Position 112 does not even exist in thearchaeal TIMs.These observations affirm that the large cluster of
water in Region A is essential for the eukaryotic andbacterial TIMs. It contributes positively to the bindingaffinity, because if the interface loses the large cluster ofwater (as in the archaeal TIMs), the enzyme must adoptanother quaternary structure to stabilize the enzyme. Inevolution, the tertiary structures of non-archaeal TIMsare not ready to oligomerize into tetramers or otherhigher order oligomers. So, excluding such a large
cluster of water from the interface without harming thefunction of the enzyme seems too hard–once a mutationdisturbs the water topology in this region (such asE104D), it would significantly destabilize the enzymeand further turn off its functionality. Thus safely exclud-ing these water molecules requires simultaneous muta-tion of many residues, which is too difficult in naturalevolution. That is the reason why the large water clusteris necessary and is well maintained when TIMs are inthe form of dimers. Also, to maintain such a largepocket of water, its nearby residues must be conserved.Region B seems to be wet in almost all of the 20 TIMs.
Region C’s water contacting profile is not very conserved.In human it is dry, but in some other species, such asC. elegans and H. Pylori, it is wet. The hydration profileof region D is not very conserved, either. Combiningthese hydration profiles and conservation scores of thefour regions, we can conclude that
• region A: both the water and residues are con-served in the bacterial and eukaryotic organisms;
Figure 2 The abnormality of HsTIM dimer interface. Distribution of (A) the rWBLs and (B) the gini coefficients of the 91 homodimericinterfaces. The rWBL and gini coefficient of the HsTIM dimer interface are marked by arrows.
Li et al. BMC Bioinformatics 2013, 14(Suppl 16):S11http://www.biomedcentral.com/1471-2105/14/S16/S11
Page 7 of 15
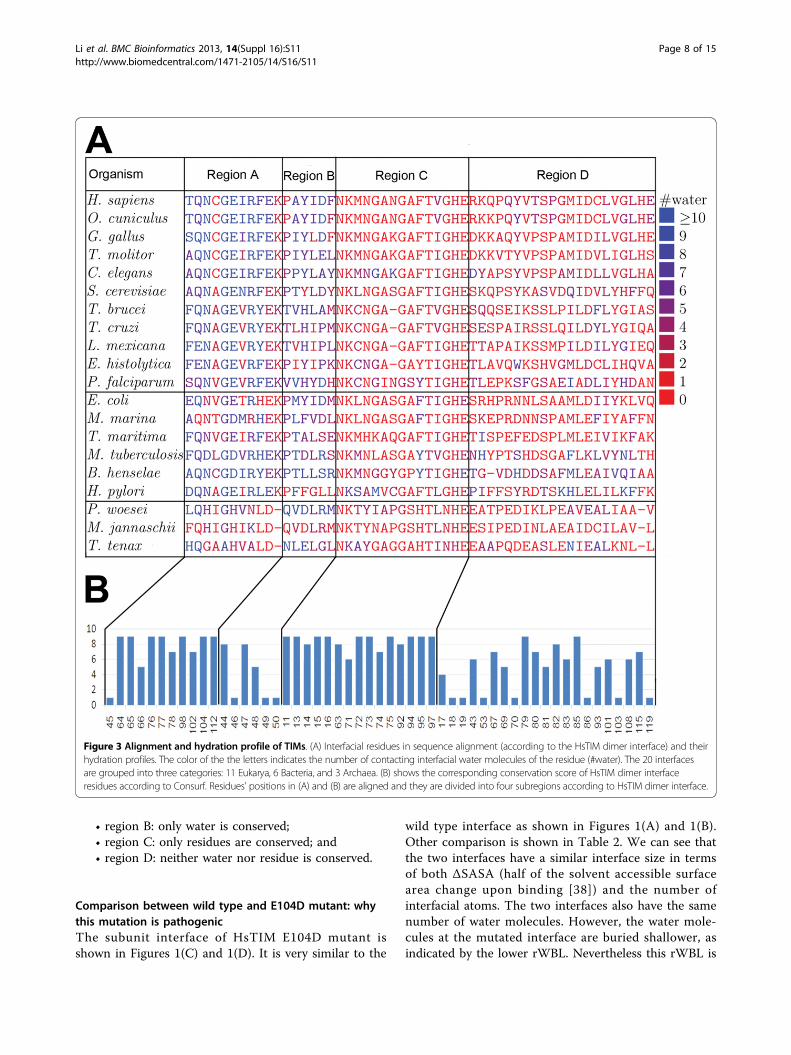
• region B: only water is conserved;• region C: only residues are conserved; and• region D: neither water nor residue is conserved.
Comparison between wild type and E104D mutant: whythis mutation is pathogenicThe subunit interface of HsTIM E104D mutant isshown in Figures 1(C) and 1(D). It is very similar to the
wild type interface as shown in Figures 1(A) and 1(B).Other comparison is shown in Table 2. We can see thatthe two interfaces have a similar interface size in termsof both ΔSASA (half of the solvent accessible surfacearea change upon binding [38]) and the number ofinterfacial atoms. The two interfaces also have the samenumber of water molecules. However, the water mole-cules at the mutated interface are buried shallower, asindicated by the lower rWBL. Nevertheless this rWBL is
Figure 3 Alignment and hydration profile of TIMs. (A) Interfacial residues in sequence alignment (according to the HsTIM dimer interface) and theirhydration profiles. The color of the the letters indicates the number of contacting interfacial water molecules of the residue (#water). The 20 interfacesare grouped into three categories: 11 Eukarya, 6 Bacteria, and 3 Archaea. (B) shows the corresponding conservation score of HsTIM dimer interfaceresidues according to Consurf. Residues’ positions in (A) and (B) are aligned and they are divided into four subregions according to HsTIM dimer interface.
Li et al. BMC Bioinformatics 2013, 14(Suppl 16):S11http://www.biomedcentral.com/1471-2105/14/S16/S11
Page 8 of 15

Figure 4 Regions A, B, C and D in TIMs. (A) Regions A, B, C and D in the TIMs of the 20 species in our data set. This figure shows the fourregions in HsTIM dimer interface (the panel in the upper left corner) and their aligned residues in the TIMs from the other 19 organisms.Residues are colored with the same scheme as Figure 1. The water molecules (blue spheres) shown in each panel are the interfacial water.Please note that these figures are not the actual interfaces (except the one of Homo sapiens TIM), but just the part that are aligned with HsTIMdimer interface, though the water molecules are actual interfacial water.
Li et al. BMC Bioinformatics 2013, 14(Suppl 16):S11http://www.biomedcentral.com/1471-2105/14/S16/S11
Page 9 of 15
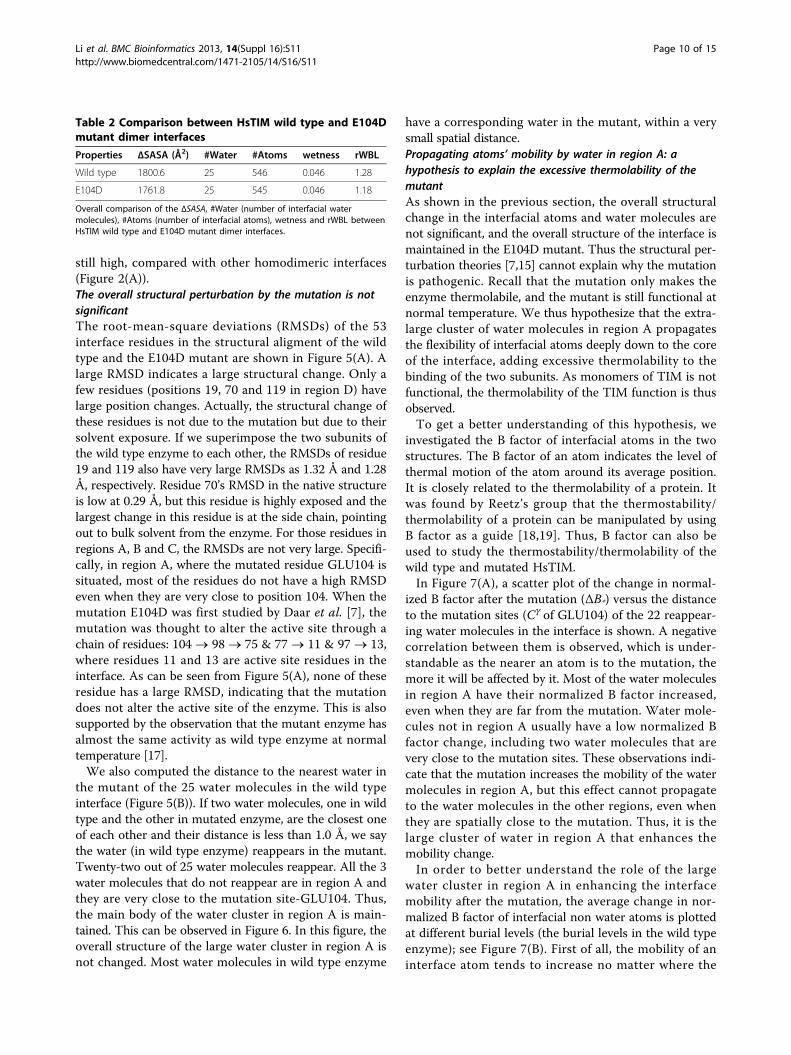
still high, compared with other homodimeric interfaces(Figure 2(A)).The overall structural perturbation by the mutation is notsignificantThe root-mean-square deviations (RMSDs) of the 53interface residues in the structural aligment of the wildtype and the E104D mutant are shown in Figure 5(A). Alarge RMSD indicates a large structural change. Only afew residues (positions 19, 70 and 119 in region D) havelarge position changes. Actually, the structural change ofthese residues is not due to the mutation but due to theirsolvent exposure. If we superimpose the two subunits ofthe wild type enzyme to each other, the RMSDs of residue19 and 119 also have very large RMSDs as 1.32 Å and 1.28Å, respectively. Residue 70’s RMSD in the native structureis low at 0.29 Å, but this residue is highly exposed and thelargest change in this residue is at the side chain, pointingout to bulk solvent from the enzyme. For those residues inregions A, B and C, the RMSDs are not very large. Specifi-cally, in region A, where the mutated residue GLU104 issituated, most of the residues do not have a high RMSDeven when they are very close to position 104. When themutation E104D was first studied by Daar et al. [7], themutation was thought to alter the active site through achain of residues: 104 ® 98 ® 75 & 77 ® 11 & 97 ® 13,where residues 11 and 13 are active site residues in theinterface. As can be seen from Figure 5(A), none of theseresidue has a large RMSD, indicating that the mutationdoes not alter the active site of the enzyme. This is alsosupported by the observation that the mutant enzyme hasalmost the same activity as wild type enzyme at normaltemperature [17].We also computed the distance to the nearest water in
the mutant of the 25 water molecules in the wild typeinterface (Figure 5(B)). If two water molecules, one in wildtype and the other in mutated enzyme, are the closest oneof each other and their distance is less than 1.0 Å, we saythe water (in wild type enzyme) reappears in the mutant.Twenty-two out of 25 water molecules reappear. All the 3water molecules that do not reappear are in region A andthey are very close to the mutation site-GLU104. Thus,the main body of the water cluster in region A is main-tained. This can be observed in Figure 6. In this figure, theoverall structure of the large water cluster in region A isnot changed. Most water molecules in wild type enzyme
have a corresponding water in the mutant, within a verysmall spatial distance.Propagating atoms’ mobility by water in region A: ahypothesis to explain the excessive thermolability of themutantAs shown in the previous section, the overall structuralchange in the interfacial atoms and water molecules arenot significant, and the overall structure of the interface ismaintained in the E104D mutant. Thus the structural per-turbation theories [7,15] cannot explain why the mutationis pathogenic. Recall that the mutation only makes theenzyme thermolabile, and the mutant is still functional atnormal temperature. We thus hypothesize that the extra-large cluster of water molecules in region A propagatesthe flexibility of interfacial atoms deeply down to the coreof the interface, adding excessive thermolability to thebinding of the two subunits. As monomers of TIM is notfunctional, the thermolability of the TIM function is thusobserved.To get a better understanding of this hypothesis, we
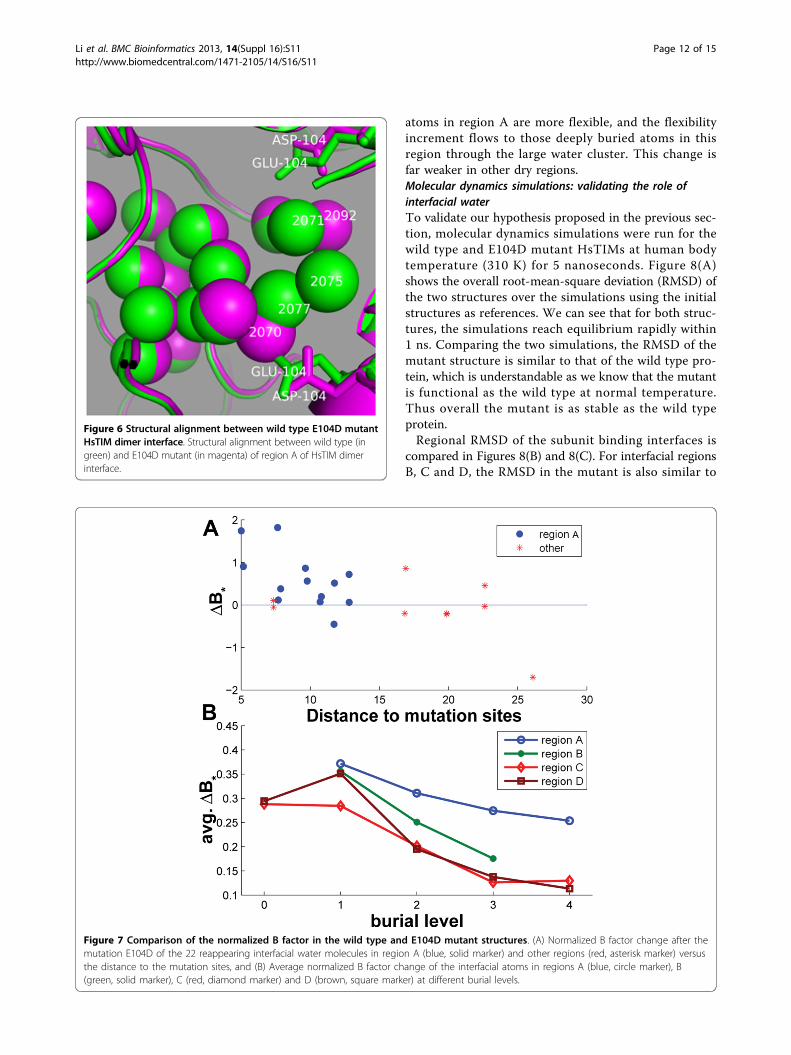
investigated the B factor of interfacial atoms in the twostructures. The B factor of an atom indicates the level ofthermal motion of the atom around its average position.It is closely related to the thermolability of a protein. Itwas found by Reetz’s group that the thermostability/thermolability of a protein can be manipulated by usingB factor as a guide [18,19]. Thus, B factor can also beused to study the thermostability/thermolability of thewild type and mutated HsTIM.In Figure 7(A), a scatter plot of the change in normal-
ized B factor after the mutation (ΔB*) versus the distanceto the mutation sites (Cg of GLU104) of the 22 reappear-ing water molecules in the interface is shown. A negativecorrelation between them is observed, which is under-standable as the nearer an atom is to the mutation, themore it will be affected by it. Most of the water moleculesin region A have their normalized B factor increased,even when they are far from the mutation. Water mole-cules not in region A usually have a low normalized Bfactor change, including two water molecules that arevery close to the mutation sites. These observations indi-cate that the mutation increases the mobility of the watermolecules in region A, but this effect cannot propagateto the water molecules in the other regions, even whenthey are spatially close to the mutation. Thus, it is thelarge cluster of water in region A that enhances themobility change.In order to better understand the role of the large
water cluster in region A in enhancing the interfacemobility after the mutation, the average change in nor-malized B factor of interfacial non water atoms is plottedat different burial levels (the burial levels in the wild typeenzyme); see Figure 7(B). First of all, the mobility of aninterface atom tends to increase no matter where the
Table 2 Comparison between HsTIM wild type and E104Dmutant dimer interfaces
Properties ΔSASA (Å2) #Water #Atoms wetness rWBL
Wild type 1800.6 25 546 0.046 1.28
E104D 1761.8 25 545 0.046 1.18
Overall comparison of the ΔSASA, #Water (number of interfacial watermolecules), #Atoms (number of interfacial atoms), wetness and rWBL betweenHsTIM wild type and E104D mutant dimer interfaces.
Li et al. BMC Bioinformatics 2013, 14(Suppl 16):S11http://www.biomedcentral.com/1471-2105/14/S16/S11
Page 10 of 15

atom is located or how deep it is buried, as all the averagechanges are larger than 0. Second, the mobility of atomsin region A increases the most comparing with the mobi-lity increment of atoms in the other three regions. Moreimportantly, the increase in mobility propagates itselfdeeply into the core of region A, while in other threeregions the mobility increment drops quickly when burial
level goes up. When the region has more water, themobility increment decrease slower when the burial levelgoes higher, and that is why region B also have a highermobility increment than the two dry regions (regions Cand D), though it is much drier than region A.The mobility change of the interfacial water molecules
and atoms indicates that after the mutation, water and
Figure 5 Structural perturbation of the mutation. (A) The RMSD of the interfacial residues and (B) the distance of the 25 water molecules inwild type interface to their nearest water in the mutant. The water molecules are sorted by their distance to the mutation sites. For waterB2077, a water molecule in the mutant that is mutually the closest to it is observed with a distance larger than 1.0 Å (not reappear). For watersB2071 and A2075, no water that is mutually closest to them are observed, so a bar higher than 2.5 Å is shown for them. The remaining 22waters reappear in the mutant.
Li et al. BMC Bioinformatics 2013, 14(Suppl 16):S11http://www.biomedcentral.com/1471-2105/14/S16/S11
Page 11 of 15
atoms in region A are more flexible, and the flexibilityincrement flows to those deeply buried atoms in thisregion through the large water cluster. This change isfar weaker in other dry regions.Molecular dynamics simulations: validating the role ofinterfacial waterTo validate our hypothesis proposed in the previous sec-tion, molecular dynamics simulations were run for thewild type and E104D mutant HsTIMs at human bodytemperature (310 K) for 5 nanoseconds. Figure 8(A)shows the overall root-mean-square deviation (RMSD) ofthe two structures over the simulations using the initialstructures as references. We can see that for both struc-tures, the simulations reach equilibrium rapidly within1 ns. Comparing the two simulations, the RMSD of themutant structure is similar to that of the wild type pro-tein, which is understandable as we know that the mutantis functional as the wild type at normal temperature.Thus overall the mutant is as stable as the wild typeprotein.Regional RMSD of the subunit binding interfaces is
compared in Figures 8(B) and 8(C). For interfacial regionsB, C and D, the RMSD in the mutant is also similar to
Figure 6 Structural alignment between wild type E104D mutantHsTIM dimer interface. Structural alignment between wild type (ingreen) and E104D mutant (in magenta) of region A of HsTIM dimerinterface.
Figure 7 Comparison of the normalized B factor in the wild type and E104D mutant structures. (A) Normalized B factor change after themutation E104D of the 22 reappearing interfacial water molecules in region A (blue, solid marker) and other regions (red, asterisk marker) versusthe distance to the mutation sites, and (B) Average normalized B factor change of the interfacial atoms in regions A (blue, circle marker), B(green, solid marker), C (red, diamond marker) and D (brown, square marker) at different burial levels.
Li et al. BMC Bioinformatics 2013, 14(Suppl 16):S11http://www.biomedcentral.com/1471-2105/14/S16/S11
Page 12 of 15
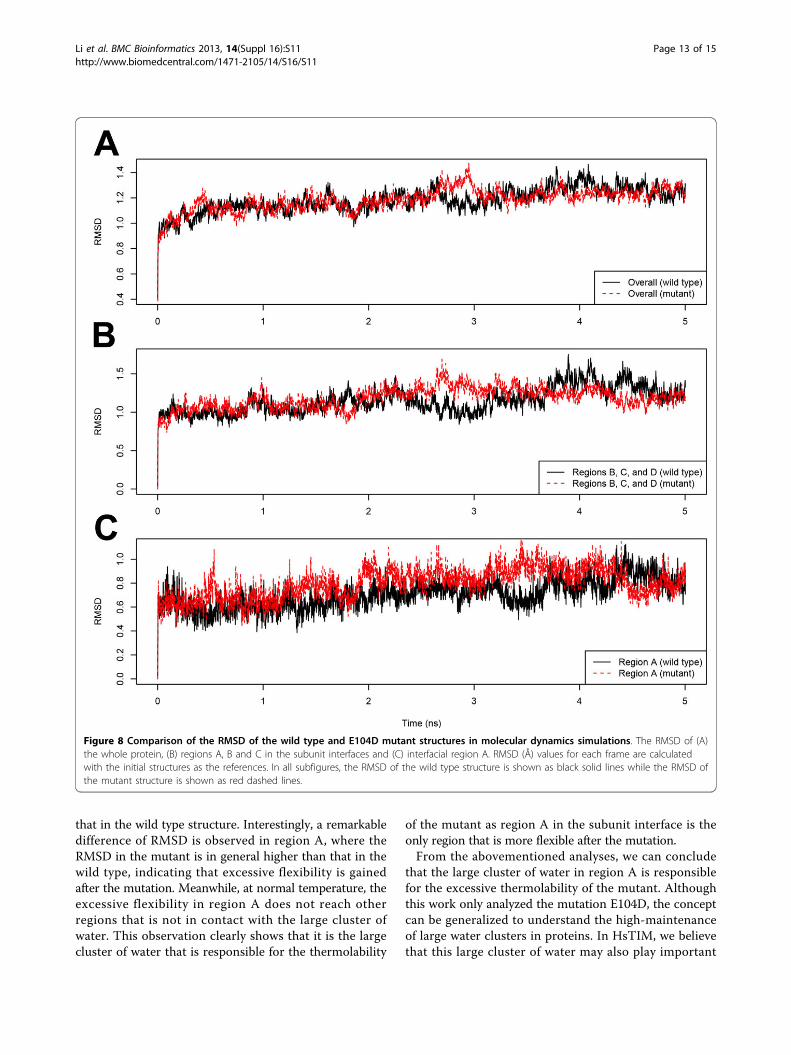
that in the wild type structure. Interestingly, a remarkabledifference of RMSD is observed in region A, where theRMSD in the mutant is in general higher than that in thewild type, indicating that excessive flexibility is gainedafter the mutation. Meanwhile, at normal temperature, theexcessive flexibility in region A does not reach otherregions that is not in contact with the large cluster ofwater. This observation clearly shows that it is the largecluster of water that is responsible for the thermolability
of the mutant as region A in the subunit interface is theonly region that is more flexible after the mutation.From the abovementioned analyses, we can conclude
that the large cluster of water in region A is responsiblefor the excessive thermolability of the mutant. Althoughthis work only analyzed the mutation E104D, the conceptcan be generalized to understand the high-maintenanceof large water clusters in proteins. In HsTIM, we believethat this large cluster of water may also play important
Figure 8 Comparison of the RMSD of the wild type and E104D mutant structures in molecular dynamics simulations. The RMSD of (A)the whole protein, (B) regions A, B and C in the subunit interfaces and (C) interfacial region A. RMSD (Å) values for each frame are calculatedwith the initial structures as the references. In all subfigures, the RMSD of the wild type structure is shown as black solid lines while the RMSD ofthe mutant structure is shown as red dashed lines.
Li et al. BMC Bioinformatics 2013, 14(Suppl 16):S11http://www.biomedcentral.com/1471-2105/14/S16/S11
Page 13 of 15
role in the pathogenesis of other point mutations in thisenzyme and this water cluster could also be one of thereasons why there are so many pathogenic point muta-tions in this enzyme [6].
ConclusionAn investigation of a mutation that causes HsTIM defi-ciency, E104D, is conducted. The HsTIM dimer inter-face is abnormally hydrated with a very strange waterdistribution pattern–wet-core-dry-rim. The water mole-cules are mainly clustered compactly in a region withthe residue GLU104 aside. This residue, along with sev-eral other residues in this region, is highly conservedwhen this region is wet. Comparing the wild type andthe E104D mutant structures, no significant structuralchange was observed. The overall structure of the pro-tein, including most of the large cluster of water, ismaintained after the mutation. We hypothesize that, inthe mutant, the water molecules in the subunit interfaceintroduce the excessive thermolability to the protein bypropagating atoms’ flexibility into the core of the inter-face. This hypothesize was supported by the fact thatatoms near the large cluster of water have a larger Bfactor increment than those in other interfacial regions.The hypothesize was further validated by using molecu-lar dynamics simulations. We showed that the interfacialregion near the large cluster of water was the onlyregion that had a higher RMSD in the mutant than inthe wild type.
Additional material
Additional file 1: A pdf file contains Table S1, which lists theproperties of the 91 homodimeric interfaces used for comparison.
Competing interestsThe authors declare that they have no competing interests.
Authors’ contributionsZL, LW and JY designed the methods; ZL, QL and LZ performed experiment;YH and JL supervised the study; CKK, LW and NH participated in the dataanalysis; ZL, QL and JL wrote the paper; All authors read and approved thefinal manuscript.
AcknowledgementsThis work was supported in part by two Singapore MOE Tier-2 grants(T208B2203 and MOE2009-T2-2-004), and supported in part by an ARCDiscovery Project (DP130102124).
DeclarationsPublication of this article was funded by a UTS 2013 Early Career ResearchGrant.This article has been published as part of BMC Bioinformatics Volume 14Supplement 16, 2013: Twelfth International Conference on Bioinformatics(InCoB2013): Bioinformatics. The full contents of the supplement areavailable online at http://www.biomedcentral.com/bmcbioinformatics/supplements/14/S16.
Authors’ details1School of Computer Engineering, Nanyang Technological University,Singapore 639798. 2Advanced Analytics Institute and Center for HealthTechnologies, Faculty of Engineering and Information Technology, Universityof Technology Sydney, PO Box 123, NSW 2007, Australia. 3School ofComputing, National University of Singapore, Singapore 117417.
Published: 22 October 2013
References1. Schneider AS, Valentine WN, Hattori M, Heins HL: Hereditary Hemolytic
Anemia with Triosephosphate Isomerase Deficiency. N Engl J Med 1965,272(5):229-235.
2. Guix FX, Ill-Raga G, Bravo R, Nakaya T, de Fabritiis G, Coma M, Miscione GP,Villa-Freixa J, Suzuki T, Fernandez-Busquets X, Valverde MA, de Strooper B,Munoz FJ: Amyloid-dependent triosephosphate isomerasenitrotyrosination induces glycation and tau fibrillation. Brain 2009,132:1335-1345.
3. Tajes M, Guivernau B, Ramos-Fernández E, Bosch-Morató M, Palomer E,Guix FX, Muñoz FJ: The patho-physiology of triose phosphate isomerasedysfunction in Alzheimer’s disease. Histol Histopathol 2013, 28:43-51.
4. Orosz F, Oláh J, Ovádi J: Triosephosphate isomerase deficiency: Facts anddoubts. IUBMB Life 2006, 58(12):703-715.
5. Hrizo SL, Fisher IJ, Long DR, Hutton JA, Liu Z, Palladino MJ: Earlymitochondrial dysfunction leads to altered redox chemistry underlyingpathogenesis of TPI deficiency. Neurobiology of Disease 2013.
6. Orosz F, Oláh J, Ovádi J: Triosephosphate isomerase deficiency: newinsights into an enigmatic disease. Biochim. Biophys. Acta 2009,1792:1168-1174.
7. Daar IO, Artymiuk PJ, Phillips DC, Maquat LE: Human triose-phosphateisomerase deficiency: a single amino acid substitution results in athermolabile enzyme. Proc Natl Acad Sci USA 1986, 83(20):7903-7907.
8. Neubauer BA, Pekrun A, Beauregard SW, Lakomek M, Schroeter W: Relationbetween genetic defect, altered protein structure, and enzyme functionin triose-phosphate isomerase (TPI) deficiency. Eur J Pediatr 1992, , Suppl151: 232-232.
9. Hollan S, Fujii H, Hirono A, Hirono K, Karro H, Miwa S, Harsanyi V, Gyodi E,Inselt-Kovacs M: Hereditary triosephosphate isomerase (TPI) deficiency:two severely affected brothers one with and one without neurologicalsymptoms. Hum Genet 1993, 92(5):486-490.
10. Arya R, Lalloz MRA, Bellingham AJ, Layton DM: Evidence for founder effectof the glu104asp substitution and identification of new mutations intriosephosphate isomerase deficiency. Human Mutation 1997,10(4):290-294.
11. Pekrun A, Neubauer BA, Eber SW, Lakomek M, Seidel H, Schroter W:Triosephosphate isomerase deficiency: biochemical and moleculargenetic analysis for prenatal diagnosis. Clin Genet 1995, 47(4):175-179.
12. Schneider A, Westwood B, Yim C, Prchal J, Berkow R, Labotka R, Warrier R,Beutler E: Triosephosphate isomerase deficiency: repetitive occurrence ofpoint mutation in amino acid 104 in multiple apparently unrelatedfamilies. Am J Hematol 1995, 50(4):263-268.
13. Linarello RE, Shetty AK, Thomas T, Warrier RP: Triosephosphate isomerasedeficiency in a child with congenital hemolytic anemia and severehypotonia. Pediatr Hematol Oncol 1998, 15(6):553-556.
14. Schneider A, Westwood B, Yim C, Cohen-Solal M, Rosa R, Labotka R, Eber S,Wolf R, Lammi A, Beutler E: The 1591C mutation in triosephosphateisomerase (TPI) deficiency. Tightly linked polymorphisms and a commonhaplotype in all known families. Blood Cells Mol Dis 1996, 22(12):115-125.
15. Mande SC, Mainfroid V, Kalk KH, Goraj K, Martial JA, Hol WG: Crystalstructure of recombinant human triosephosphate isomerase at 2.8 Åresolution. Triosephosphate isomerase-related human genetic disordersand comparison with the trypanosomal enzyme. Protein Sci 1994,3(5):810-821.
16. Ralser M, Heeren G, Breitenbach M, Lehrach H, Krobitsch S: TriosePhosphate Isomerase Deficiency Is Caused by Altered Dimerization–notCatalytic Inactivity–of the Mutant Enzymes. PLoS ONE 2006, 1:e30.
17. Rodriguez-Almazan C, Arreola R, Rodriguez-Larrea D, Aguirre-Lopez B, deGomez-Puyou MT, Perez-Montfort R, Costas M, Gomez-Puyou A, Torres-Larios A: Structural Basis of Human Triosephosphate IsomeraseDeficiency: Mutation E104D is related to alterations of a conserved
Li et al. BMC Bioinformatics 2013, 14(Suppl 16):S11http://www.biomedcentral.com/1471-2105/14/S16/S11
Page 14 of 15
water network at the dimer interface. J Biol Chem 2008,283(34):23254-23263.
18. Reetz MT, Carballeira JD, Vogel A: Iterative Saturation Mutagenesis on theBasis of B Factors as a Strategy for Increasing Protein Thermostability.Angew Chem Int Ed 2006, 45(46):7745-7751.
19. Reetz MT, Soni P, Fernández L: Knowledge-guided laboratory evolution ofprotein thermolability. Biotechnol Bioeng 2009, 102(6):1712-1717.
20. Wierenga R, Kapetaniou E, Venkatesan R: Triosephosphate isomerase: ahighly evolved biocatalyst. Cell Mol Life Sci 2010, 67:3961-3982.
21. Ponstingl H, Henrick K, Thornton JM: Discriminating betweenhomodimeric and monomeric proteins in the crystalline state. ProteinsStruct Funct Bioinf 2000, 41:47-57.
22. Bahadur RP, Chakrabarti P, Rodier F, Janin J: A dissection of specific andnon-specific protein-protein interfaces. J Mol Biol 2004, 336(4):943-955.
23. Mintseris J, Weng Z: Structure, function, and evolution of transient andobligate protein-protein interactions. Proc Natl Acad Sci USA 2005,102(31):10930-10935.
24. Zhu H, Domingues F, Sommer I, Lengauer T: NOXclass: prediction ofprotein-protein interaction types. BMC Bioinf 2006, 7:27.
25. Lorenz MO: Methods of Measuring the Concentration of Wealth.Publications of the American Statistical Association 1905, 9(70):209-219.
26. Schrödinger LLC: The PyMOL Molecular Graphics System, Version 1.3r1.2010.
27. Carugo O, Bordo D: How many water molecules can be detected byprotein crystallography? Acta Crystallogr D Biol Crystallogr 1999,55(Pt 2):479-483.
28. Humphrey W, Dalke A, Schulten K: VMD: Visual molecular dynamics.Journal of Molecular Graphics 1996, 14:33-38.
29. MacKerell AD, Bashford D, Dunbrack RL, Evanseck JD, Field MJ, Fischer S,Gao J, Guo H, Ha S, Joseph-McCarthy D, Kuchnir L, Kuczera K, Lau FTK,Mattos C, Michnick S, Ngo T, Nguyen DT, Prodhom B, Reiher WE, Roux B,Schlenkrich M, Smith JC, Stote R, Straub J, Watanabe M, Wiórkiewicz-Kuczera J, Yin D, Karplus M: All-Atom Empirical Potential for MolecularModeling and Dynamics Studies of Proteins. The Journal of PhysicalChemistry B 1998, 102(18):3586-3616.
30. Mackerell AD: Empirical force fields for biological macromolecules:Overview and issues. Journal of Computational Chemistry 2004,25(13):1584-1604.
31. Darden T, York D, Pedersen L: Particle mesh Ewald: An N.log(N) methodfor Ewald sums in large systems. The Journal of Chemical Physics 1993,98(12):10089-10092.
32. Phillips JC, Braun R, Wang W, Gumbart J, Tajkhorshid E, Villa E, Chipot C,Skeel RD, Kalé L, Schulten K: Scalable molecular dynamics with NAMD.J Comput Chem 2005, 26(16):1781-1802.
33. Li Z, He Y, Wong L, Li J: Progressive dry-core-wet-rim hydration trend ina nested-ring topology of protein binding interfaces. BMC Bioinf 2012,13:51+.
34. Fischer S, Verma CS: Binding of buried structural water increases theflexibility of proteins. Proc Natl Acad Sci USA 1999, 96(17):9613-9615.
35. Berman HM, Westbrook J, Feng Z, Gilliland G, Bhat TN, Weissig H,Shindyalov IN, Bourne PE: The Protein Data Bank. Nucleic Acids Res 2000,28:235-242.
36. Keeling PJ, Doolittle WF: Evidence that eukaryotic triosephosphateisomerase is of alpha-proteobacterial origin. Proc Natl Acad Sci USA 1997,94(4):1270-1275.
37. Ashkenazy H, Erez E, Martz E, Pupko T, Ben-Tal N: ConSurf 2010:calculating evolutionary conservation in sequence and structure ofproteins and nucleic acids. Nucleic Acids Res 2010, 38(suppl 2):W529-W533.
38. Jones S, Thornton JM: Principles of protein-protein interactions. Proc NatlAcad Sci USA 1996, 93:13-20.
doi:10.1186/1471-2105-14-S16-S11Cite this article as: Li et al.: Structural analysis on mutation residues andinterfacial water molecules for human TIM disease understanding. BMCBioinformatics 2013 14(Suppl 16):S11.
Submit your next manuscript to BioMed Centraland take full advantage of:
• Convenient online submission
• Thorough peer review
• No space constraints or color figure charges
• Immediate publication on acceptance
• Inclusion in PubMed, CAS, Scopus and Google Scholar
• Research which is freely available for redistribution
Submit your manuscript at www.biomedcentral.com/submit
Li et al. BMC Bioinformatics 2013, 14(Suppl 16):S11http://www.biomedcentral.com/1471-2105/14/S16/S11
Page 15 of 15