structural and trophic alterations in macrobenthic communities downstream from a fish farm outlet
TRANSCRIPT

Hydrobiologia 242 : 41-49, 1992 .© 1992 Kluwer Academic Publishers. Printed in Belgium .
Structural and trophic alterations in macrobenthic communitiesdownstream from a fish farm outlet
Julio A. CamargoCentro de Investigacion y Tecnologia del Instituto Nacional de Investigaciones Agrarias (CIT-INIA),Valdeolmos, Madrid, Spain : Present address : Department ofBiology, Colorado State University, Fort Collins,Colorado 80526, USA
Received 5 July 1990 ; in revised form 19 December 1991 ; accepted 14 January 1992
Key words : trout farm outlets, benthic macroinvertebrates, structural and trophic alterations
Abstract
The changes generated by a Spanish trout farm, located in the upper Rio Tajuna (Central Spain), onbenthic macroinvertebrates were studied by comparing biological characteristics of an upstream station(S-1) with those of three downstream sites placed 0.01 (S-2), 0.15 (S-3) and 1 (S-4) km below the fishfarm outlet . In addition, a biological index is presented for estimating relative contributions (informa-tive weights) of major macroinvertebrate groups to the macrobenthic community . Species richness andShannon diversity were depressed downstream from the trout farm . However, density and biomassvalues were significantly higher at downstream stations during the summer, presumably due to an in-crease in water temperature and food supply . Amphipods, plecopterans and planarians were the mac-roinvertebrates most adversely affected by the fish farm effluent. Coleopterans, ephemeropterans andtrichopterans were absent immediately below the outlet (S-2), but exhibited a partial downstream spa-tial recovery of their informative weights at S-3 and S-4 . The abundance of tubificid worms, chironomids,simuliids and leeches increased below the trout farm, with dipterans predominating at all downstreamsampling sites. The macrobenthic trophic structure was altered downstream from the trout farm by asignificant increase in collectors (gatherers and filter feeders) and predators, and a marked decrease inshredders and scrapers . The highest environmental impact was found just below the troutfarm outlet(S-2). It is concluded that the fish farm generates potamological effects on the functional structure ofthe macrobenthic community .
41
Introduction
River pollution as a result of fish cultural activi-ties was suggested about forty years ago by Lagler(1949). According to Liao (1970), effluents of in-land fish farms contain three different types ofpollutants : (1) pathogenic bacteria, viruses andparasites, (2) drugs and disinfectants from dis-
ease and parasite control, and (3) residual foodand fecal materials. The third type of pollutantsappear to be most important in generating phys-icochemical and biological alterations in environ-mental conditions downstream from salmonidfarms (Alabaster, 1982), primarily when artificialdiets of dry pellets are used (Butz & Vens-Cappell,1982). It has been stated that about 650 g of dry

42
matter is formed for each kilogramme of troutproduced (Myllyla, 1976) .
The main physicochemical changes producedby residual food and fecal materials downstreamfrom outlets of salmonid farming activities are anincrease in BOD, COD, suspended solids, totalammonia, total nitrogen, ortho phosphorus andtotal phosphorus, a settlement of suspended sol-ids on the downstream bottom, and a net de-crease in dissolved oxygen and pH (Hinshaw,1973 ; Bergheim & Selmer-Olsen, 1978 ; Solbe,1982; Solberg & Bregnballe, 1982; Kaspar et al .,1988 ; Mur7oz, 1989). The biological alterationsgenerated by fish farms on downstream ecosys-tems have been less studied and depend on fishfarm management, fish farm location along theriver, and particular ecological characteristics ofeach recipient river . A significant increase in pe-riphyton and macrophyte production has beengenerally reported as a direct consequence ofphosphorus eutrophication (Szluha, 1974 ; Mark-mann, 1982 ; Beveridge, 1984). With regard toaquatic animal communities, benthic macroinver-tebrates appear to be more adversely affected thanfisheries by salmonid farm effluents, primarily bythe siltation of suspended solids on the down-stream bottom (Alabaster, 1982 ; Mantle, 1982 ;Markmann, 1982) .
In Spain, there are about 200 salmonid farmsthat constitute the economically most importantform of inland aquaculture . Many of these troutfarms are located in headwaters, where adverseeffects of their waste effluents on aquatic com-munities may be higher . However, no significantstudy has been conducted up to the present . Themain purpose of this study was to examine struc-tural and trophic alterations in the benthic mac-roinvertebrate community downstream from theoutlet of a typical Spanish trout farm . This fishfarm was selected because its management, an-nual production and stream location are similarto those of many other trout farms in Spain .
The study area
Field studies were conducted in the upper RioTajuifta, a stream located in Central Spain (Guad-
alajara) within the Tajo Basin . The watershed ofthis stream is mainly underlain by calcareousrocks, like limestones, which induce the forma-tion of hard waters with high ionic content . Theupper Rio Tajufia's natural flow regime is char-acterized by maximum flows during winter andspring and minimum flows during summer andautumn, with a mean annual flow of about0.6 m3 s -1 . The stream section in the study areavaries from 2 to 6 m in width and 20 to 110 cmin depth . The Rio Tajuria, upstream from the troutfarm, supports a naturally reproducing browntrout (Salmo trutta) population .
The trout farm (Fig . 1) is situated about 13 kmdownstream from the stream source . Annual pro-duction of this fish farm is about 75 tons of rain-bow trout (Oncorhynchus mykiss), using dry pel-lets as artificial diet . Waste treatment involvessimple settlement in a sedimentation pond with-out the addition of chemicals .
The alterations in physicochemical conditionsdownstream from the fish farm outlet have beenmonitored by Mufioz (1989) . In general, concen-trations of nitrogen and phosphorus compounds,such as total ammonia, nitrite and ortho phos-phorus, increase significantly below the troutfarm, whereas the concentration of dissolved ox-ygen can decrease down to a value of 2 .7 mg 1 -' .
Four sampling stations were selected along thestudy area (Fig . 1). A sampling site (S-1) placedupstream from the trout farm was used as a ref-erence station . Second (S-2), third (S-3) andfourth (S-4) sampling sites were respectivelyplaced about 0.01, 0 .15 and 1 km downstreamfrom the trout farm outlet . The third station wassituated just below a small waterfall (1 .8 m inheight). The stream bottom was mainly stony withcobbles and pebbles at all sampling sites, exceptS-2 where it was covered by a thick layer of or-ganic sediment .
Materials and methods
Spring (May) and summer (July) surveys wereundertaken during 1986 . Benthic macroinverte-brates were collected using a Hess cylindrical

R .o Taro
Fig. 1 . General diagram of the trout farm showing the loca-tion of sampling stations along the Rio Tajuna (Central Spain,Tajo Basin) .
sampler, which enclosed a sampling area of 0 .1 m2and was equipped with a 0 .5 m net with a meshsize of 250 µm. Five samples were taken at eachstation on each sampling date. Each sample wascollected on or near the area of greatest currentvelocity and was preserved in 4 % formalin untillaboratory analysis . Specimens were identified tospecies or genus, except aquatic earthworms andsome midge larvae (identified to family) . Follow-ing identification and counting, quantitative sam-ples were dried in an oven at 60 ° C for 24 hours .Density and biomass (dry-weight) were estimatedfor each taxon and for the total macrobenthiccommunity. In addition, species richness and di-
43
versity were estimated by calculating number oftaxa and Shannon's index. Significant differences(P<0 .05) between the reference station anddownstream sampling sites were determined by at-test in accordance with Sokal & Rohlf (1981) .
Four functional feeding groups (shredders, col-lectors, predators and scrapers) were assigned inaccordance with Cummins & Klug (1979), Ta-chet et al. (1981), and Garcia de Jalon & Gonza-lez del Tanago (1986). The relative abundance ofeach feeding group was calculated on the basis ofbiomass estimates .
The relative contribution of each major mac-roinvertebrate group to the macrobenthic com-munity was estimated by totaling the informativeweight of each taxon in each respective macroin-vertebrate group, using the following biologicalindex :
sIW = (bi N + n; B) 50/B N
where IW is the informative weight or relativecontribution of a major macroinvertebrate groupin a sample from the studied macrobenthic com-munity, S is the number of species or taxa in thatmacroinvertebrate group, b . is the biomass of aspecies or taxon i from the same sample, n, is thenumber of individuals of the same species or taxoni from the sample, B is the total biomass of themacroinvertebrate community from the sample,and N is the total number of individuals in themacroinvertebrate community from the sample .This index takes values between 0 (no informativeweight) and 100 (maximum informative weight) .The use of this index assumes that a species i canincrease its dominance (informative weight) whenits biomass is divided into a higher number ofindividuals or when each individual increases insize .
The percentage of environmental impact (EI)generated by the fish farm effluent on the mac-robenthic community at each downstream sam-pling site was quantified by the biological indexdeveloped by Camargo (1990) :
EI=(2A-B-C)50/A

44
where A is the number of taxa upstream from thedisturbance point, B is the number of taxa down-stream from the disturbance point, and C is thenumber of taxa common to both places .
Results
Species composition
Mean density values (n = 5) for each taxon arepresented in Table 1 . Polycelis sp ., Polycelis felina,Lumbriculidae, Glossiphonia complanata, Bythi-nella sp., Ephemera danica, Ecdyonurus sp .,Paraleptophlebia submarginata, Leuctra sp ., Iso-perla sp ., Perla marginata, Elmis maugetii, Rioluscupreus, Rhyacophila meridionalis, Agapetus fus-cipes, Plectronemia conspersa, Lepidostoma hirtum,Sericostoma baeticum, Ablabesmyia sp ., Ortho-cladius sp . and Athericidae were not collected atall sampling sites downstream from the trout farmeffluent. In addition, Ancylus fluviatilis, Echino-gammarus longisetosus, Ephemerella ignita, Esolusangustatus, Limnius wolkmari and Ithytrichia sp.were absent immediately below the outlet (S-2)and their abundance decreased significantly(P<0 .05) at S-3 and S-4 .
On the contrary, Helobdella stagnalis, Sialis sp .,Haliplus sp., Anthomyidae, Planorbis sp ., Pisidiumsp., Thienemanniella sp., Chironomus thummi,Pentapedilum sp., Micropsectra sp ., Tanytarsus sp .and Empididae were only collected at samplingsites downstream from the fish arm . In addition,densities of Tubificidae, Erpobdella sp., Cricotopussp . and Eukiefferiella sp . increased significantly(P<0.05) at all downstream sampling stations,and densities of Baetis rhodani, Nemoura sp .,Hydroptila sp., Hydropsyche pictetorum, Eusi-mulium sp., Odagmia ornata and Ceratopogonidaeincreased significantly (P<0 .05) at S-3 and S-4 .
Echinogammarus longisetosus was the mostabundant taxon at S-1 and predominated up-stream from the trout farm . Tubificidae andChironomus thummi were the most abundant anddominant taxa at S-2 . Tubificidae, Eusimuliumsp., Odagmia ornata, Cricotopus sp . and Eukief-feriella sp . had the highest densities at S-3 . These
latter four diptera taxa together with Baetisrhodani were the numerically dominant genera atS-4 .
Macroinvertebrate groups
The relative contribution (informative weight) ofeach major macroinvertebrate group to the mac-robenthic community at each sampling site isshown in Fig. 2 . A higher number of macroinver-tebrate groups were collected upstream from thetrout farm, being dipterans the dominant benthicmacroinvertebrates downstream due to the highinformative weights of chironomids and simuli-ids. Amphipoda, Tricladida and Plecoptera werethe macroinvertebrate groups most adversely af-fected by the fish farm effluent .
At the reference site (S-1), oligochaetes (4.1leeches (1.0%), planarians (2.2%) and dipterans(8 .8 %) had low informative weights, whereas am-phipods had the highest weight (24.1 %) . Mol-luscs (11.6%), coleopterans (10.2%), trichopter-ans (13.8%), ephemeropterans (14.2%) andplecopterans (10 .0%) exhibited median relativecontributions to the macroinvertebrate commu-nity .
Immediately below the trout farm outlet (S-2),dipterans (52 .1 %)and oligochaetes (39.4%) werethe dominant macroinvertebrates . Megalopterans(1 .3%), leeches (5.3%) and molluscs (1.9%) hadlow informative weights, while other groups wereabsent .
At S-3 and S-4 dipterans had the highest in-formative weights (51 .1% and 49.2%) . As thedistance from the fish farm effluent increased,relative contributions of leeches (26.9% and18.5%) and oligochaetes (8.5% and 2.5%) de-creased whereas ephemeropterans (4.8% and8.9%), trichopterans (3 .1% and 12 .9%), co-leopterans (0.4 % and 2.6 %) and molluscs (3.8 %and 4.8%) increased, reflecting a gradual andpartial downstream spatial recovery of informa-tive weights in these macroinvertebrate groups .However, plecopterans (1% and 0.6%) did notincrease their relative contribution, and amphi-pods were present, although with a very low in-formative weight (0.4%), at S-3 only .

Table 1 . Mean densities (individuals m -z ) for each taxon at sampling sites during spring and summer surveys .
45
S-1 S-2 S-3 S-4
Spring Summer Spring Summer Spring SummerSpring Summer
Polycelis sp . 10 20 0 0 0 0 0 0Polycelis felina 66 62 0 0 0 0 0 0Tubificidae 66 226 2953 1640 588 362 102 116Lumbriculidae 10 22 0 0 0 0 0 0Helobdella stagnalis 0 0 44 70 138 194 46 32Glossiphonia complanata 2 2 0 0 0 0 0 0Erpobdella sp . 14 18 36 44 176 388 124 208Bythinella sp . 222 358 0 0 0 0 0 0Ancylus fluviatilis 66 112 0 0 18 72 22 24Planorbis sp. 0 0 8 48 38 20 30 36Pisidium sp . 0 0 20 108 34 20 78 54Echinogammarus longisetosus 754 792 0 0 14 16 0 0Ephemera danica 98 64 0 0 0 0 0 0Ecdyonurus sp. 142 38 0 0 0 0 0 0Baetis rhodani 100 32 0 0 212 260 226 538Ephemerella ignita 144 94 0 0 40 0 70 0Pharaleptophlebia submarginata 4 8 0 0 0 0 0 0Nemoura sp. 8 2 0 0 38 20 20 6Leuctra sp. 37 36 0 0 0 0 0 0Isoperla sp . 26 16 0 0 0 0 0 0Perla marginata 18 10 0 0 0 0 0 0Sialis sp . 0 0 4 10 0 0 0 0Elmis maugetii 134 36 0 0 0 0 0 0Esolus angustatus 158 242 0 0 14 26 0 0Limnius wolkmari 130 202 0 0 6 4 0 0Riolus cupreus 44 24 0 0 0 0 0 0Haliplus sp . 0 0 0 0 0 0 20 58Rhyacophila meridionalis 16 10 0 0 0 0 0 0Agapetus fuscipes 116 54 0 0 0 0 0 0Hydroptila sp . 52 22 0 0 46 34 136 128Ithytrichia sp . 48 30 0 0 20 12 32 0Hydropsyche pictetorum 60 14 0 0 34 22 170 50Plectronemia conspersa 16 4 0 0 0 0 0 0Lepidostoma hirtum 38 18 0 0 0 0 0 0Sericostoma baeticum 32 44 0 0 0 0 0 0Tipula sp . 0 0 0 0 0 12 0 0Eusimulium sp. 50 12 0 0 230 548 496 872Odagmia ornata 90 34 0 0 364 536 448 646Ablabesmyia sp . 10 4 0 0 0 0 0 0Cricotopus sp . 66 58 63 97 516 856 444 356Eukiefferiella sp . 22 20 90 130 586 628 544 372Orthocladius sp . 48 54 0 0 0 0 0 0Thienemanniella sp . 0 0 0 0 14 26 56 40Chironomus thummi 0 0 740 3743 52 107 0 0Pentapedilum sp . 0 0 43 363 10 20 0 0Polypedilum sp . 80 50 14 67 50 148 32 66Micropsectra sp . 0 0 83 106 210 298 114 232Tanytarsus sp . 0 0 44 40 204 428 155 308Ceratopogenidae 20 0 0 0 32 22 80 26Empididae 0 0 0 0 60 134 6 18Athericidae 20 20 0 0 0 0 0 0Anthomyidae 0 0 0 0 14 10 0 0

46
sW
Community structure
The structure of the macrobenthic community ateach sampling site is presented in Table 2 . Spe-cies richness and Shannon diversity values weresignificantly (P<0.05) higher upstream from thetrout farm in both surveys, decreasing markedlyat S-2. In addition, the number of taxa was sig-
100
90
60F
50rrW•
40W
F.•
•30
a•
200wz 10
0S-1 S-2 S-3
SAMPLING SITES
Fig. 2 . Relative contributions (informative weights) of major macroinvertebrate groups at each sampling station .
S-4
E3 OLIGOCHAETA
•
MOLLUSCA
•
HIRUDINEA
•
TRICLADIDA
El AMPHIPODA
•
DIPTERA
•
MEGALOPTERA
•
CLLEOPTERA
•
TRICHOPTERA
•
EPHEMEROPTERA
M PLECOPTERA
nificantly (P< 0 .05) higher at S-3 than at S-2 andS-4 during the summer survey .
Conversely, total density and total biomass in-creased significantly (P<0.05) during the sum-mer at all downstream sampling sites with regardto the reference station as a likely consequence ofthe increase in water temperature and food sup-ply, reaching mean values as high as 6458 (indi-
Table 2 . The macrobenthic community structure. Mean values and standard deviations (n = 5) of biological parameters estimatedat sampling sites (S-1, S-2, S-3 and S-4) during spring and summer surveys .
S-1 S-2 S-3 S-4
Spring Summer Spring Summer Spring Summer Spring Summer
Species richness 32 .6 30 .0 9 .7 11 .3 23 .8 23 .6 20.2 18 .4(# taxa) (3 .5) (3 .7) (2 .3) (1 .2) (1 .8) (2 .1) (0.8) (1 .3)
Total density 3049 2853 4139 6458 3832 5228 3431 4279(individuals M -2) (698) (465) (341) (686) (594) (791) (265) (533)
Total biomass 5394 4871 2561 10196 5018 7660 5581 6684(mg m -2 ) (1080) (1062) (296) (1463) (1804) (1110) (1366) (1417)
Shannon diversity 4.2 3 .8 1 .5 1 .9 3 .7 3 .7 3 .7 3 .5(bits) (0 .3) (0 .2) (0 .1) (0 .1) (0 .3) (0 .1) (0 .1) (0 .2)
viduals M-2) and 10196 (mg m - 2 ) just below thtrout farm outlet . However, total biomass de-creased significantly (P< 0 .05) at S-2 during thespring, with a mean value as low as 2 561(mg m -2) .
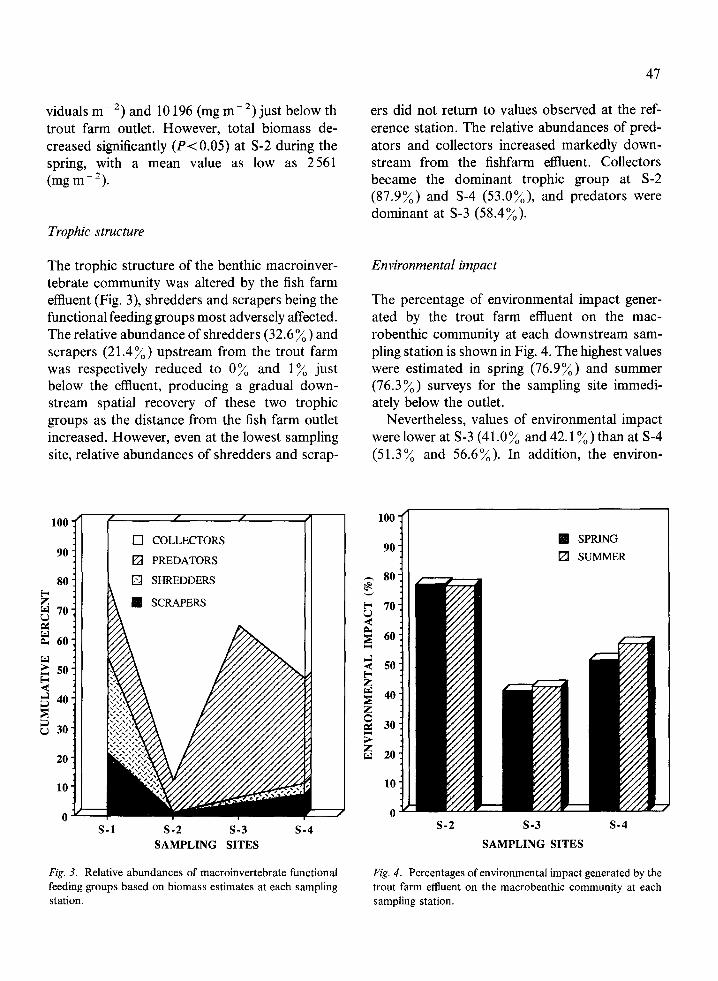
Trophic structure
The trophic structure of the benthic macroinver-tebrate community was altered by the fish farmeffluent (Fig . 3), shredders and scrapers being thefunctional feeding groups most adversely affected .The relative abundance of shredders (32 .6%) andscrapers (21 .4%) upstream from the trout farmwas respectively reduced to 0 % and 1 % justbelow the effluent, producing a gradual down-stream spatial recovery of these two trophicgroups as the distance from the fish farm outletincreased. However, even at the lowest samplingsite, relative abundances of shredders and scrap-
S-1 S-2
S-3SAMPLING SITES
S-4
Fig . 3. Relative abundances of macroinvertebrate functionalfeeding groups based on biomass estimates at each samplingstation .
ers did not return to values observed at the ref-erence station. The relative abundances of pred-ators and collectors increased markedly down-stream from the fishfarm effluent . Collectorsbecame the dominant trophic group at S-2(87 .9%) and S-4 (53.0%), and predators weredominant at S-3 (58.4%) .
Environmental impact
The percentage of environmental impact gener-ated by the trout farm effluent on the mac-robenthic community at each downstream sam-pling station is shown in Fig . 4 . The highest valueswere estimated in spring (76 .9%) and summer(76.3%) surveys for the sampling site immedi-ately below the outlet .
Nevertheless, values of environmental impactwere lower at S-3 (41.0% and 42 .1 %) than at S-4(51.3% and 56 .6%). In addition, the environ-
100
90
~.•
80
U 70
•
60
50Fz•
• 40za•
30
z•
20
10
0S-2 S-3
SAMPLING SITES
S-4
47
Fig . 4. Percentages of environmental impact generated by thetrout farm effluent on the macrobenthic community at eachsampling station .

48
mental impact was higher during the summer thanin the spring at those two sampling stations .
Discussion
The highest environmental impact generated bythe trout farm outlet on the macrobenthic com-munity at S-2 was primarily produced by the silt-ation of suspended solids (mainly organic matter)as an apparently anaerobic sludge deposit on thestream bottom of this sampling station . This set-tlement was the main environmental factor re-sponsible for a marked decrease in species rich-ness and Shannon diversity, inducing the dis-appearance of most sensitive macroinvertebrategroups like plecopterans, ephemeropterans, co-leopterans, amphipods, trichopterans and planar-ians, and favoring the dominant development oftubificid worms and red chironomids (containinghaemoglobin and other respiratory pigments forregulating their oxygen uptake). These benthicmacroinvertebrates have been found to be char-acteristic organisms in this type of sludge (Man-tle, 1982; Markmann, 1982) .
The significant increase in values of speciesrichness and diversity at S-3 and S-4 with regardto S-2 was due chiefly to a recovery of the streambottom quality . However, the lower environmen-tal impact estimated at S-3 with regard to S-4 wasprobably generated by a higher recovery of envi-ronmental factors, like dissolved oxygen, inducedby the waterfall located immediately above S-3 .In addition, the higher environmental impact es-timated during the summer survey at S-3 and S-4was surely caused by a higher adverse influenceof the trout farm effluent on water physicochem-ical conditions as a direct consequence of thelowest stream flow during that season .
In general, those structural alterations in themacrobenthic community are usually caused byorganic pollutions (Hynes, 1963 ; Hawkes, 1979 ;Hellawell, 1986), reflecting a substitution ofrithronic macroinvertebrate species for potamicones. Thus, in this study, the most abundantpredators upstream from the fish farm were ple-copterans and planarians, whereas downstream
leeches became the dominant predators by theirhigher informative weights .
On the other hand, the marked alteration inthe macrobenthic trophic structure downstreamfrom the trout farm was due primarily to thedisappearance of detritivore shredders likeEchinogammarus longisetosus, Sericostoma bae-ticum and Lepidostoma hirtum, and scrapers likeBythinella sp ., Ecdyonurus sp ., Agapetus fuscipesand Elmidae species . However, the likely increasein food supply generated by the fish farm outletat downstream sampling stations, induced thedominant development of collectors (gatherersand filter feeders) like tubificids, baetids, simuliidsand chironomids . The unusual dominance ofpredators at S-3 was due mainly to the highabundance of Erpobdella sp . and Helobdellastagnalis which could pry on insect larvae driftedfrom S-2 . In this connection, a significant domi-nance of predators (leeches) has been found justbelow small eutrophic impoundments in othercalcareous streams of the Iberian Peninsula(Camargo, 1989 ; Camargo & Garcia de Jalon,1990) .According to The River Continuum Concept
(Vannote et al., 1980), shredders are abundantonly in headwaters ; predators maintain a similarrelative abundance along the entire stream pro-file; scrapers are best developed in middlereaches ; and collectors (filter feeders and gather-ers) become the dominant trophic group in lowerreaches. In this sense, the changes produced bythe fish farm effluent on the macrobenthic trophicstructure agree, in general, with this theoreticaltrophic model along the stream longitudinal gra-dient, which would indicate that the trout farmgenerates downstream potamological effects onthe trophic structure of the benthic macroinver-tebrate community. Similar effects have beenfound with regard to periphyton production ratesdownstream from a fish hatchery discharge (Szlu-ha, 1974) .
It is concluded that the stream's self-purifica-tion was insufficient to assimilate the organic dis-charge from the trout farm outlet . However, smallwaterfalls could improve the stream's self-purifi-cation of organic pollution generated by trout

farms, the spatial recovery of macrobenthic com-munities being accelerated .
Acknowledgements
I am particulary grateful to Dr D . Garcia de Jalonand Dr 0. Soriano for their scientific assistanceduring the taxonomic identification of trichopter-ans and chironomids . Comments and reviews byDr N. J. Voelz improved the quality of this manu-script. The Department of Animal Health (CIT-INIA) provided logistical support during thisstudy. Funds for this research were provided bya grant from the National Institute for AgrarianResearch (INIA) in Spain .
References
Alabaster, J . S ., 1982 . Survey of fish-farm effluents in someEIFAC countries . EIFAC Technical Paper 41 : 5-20 .
Bergheim, A. & A. R. Selmer-Olsen, 1978 . River pollutionfrom a large trout farm in Norway . Aquaculture 14: 267-270 .
Beveridge, M . C. M ., 1984. Cage and pen fish farming . Car-rying capacity models and environmental impact . FAOFisheries Technical Paper 255 : 1-131 .
Butz, I . & B . Vens-Cappell, 1982 . Organic load from themetabolic products of rainbow trout fed with dry food .EIFAC Technical Paper 41 : 73-82 .
Camargo, J . A ., 1989. Estudio ecotoxicologico del impactoambiental generado por una regulacion de caudales y unvertido de fluor, sobre las comunidades de animales acu-aticos del Rio Duraton. Doctoral Dissertation, Madrid Au-tonomous University, Madrid, Spain .
Camargo, J . A ., 1990 . Performance of a new ecotoxicologicalindex to assess environmental impacts on freshwater com-munities . Bull . envir . Contam. Toxicol. 44: 529-534 .
Camargo, J . A. & D . Garcia de Jalon, 1990 . The downstreamimpacts of the Burgomillodo reservoir, Spain . RegulatedRivers: Research & Management 5 : 305-317 .
Cummins, K. W. & M . J . Klug, 1979 . Feeing ecology of streaminvertebrates . Ann . Rev . Ecol . System . 10: 147-172 .
Garcia de Jalon, D . & M. Gonzalez del Tanago, 1986. Meto-
49
dos Biolbgicos para el Estudio de la Calidad de las Aguas .
Aplicacion a la Cuenca del Duero . Monografia 45, ICONA,Madrid (Spain), 244 pp .
Hawkes, H. A., 1979. Invertebrates as indicators of riverwater quality . In A. James & L. Evison (eds), BiologicalIndicators of Water Quality . John Wiley and Sons, Chich-ester : 2,1-2,45 .
Hellawell, J . M., 1986 . Biological Indicators of FreshwaterPollution and Environmental Management . Elsevier Ap-plied Science Publishers, London and New York, 546 pp .
Hinshaw, R. N ., 1973 . Pollution as a Result of Fish CulturalActivities . Ecological Research Series, U .S. EnvironmentalProtection Agency, Washington, D.C ., 53 pp.
Hynes, H . B. N ., 1963. The Biology of Polluted Waters, 2ndedn. Liverpool University Press, England, 202 pp .
Kaspar, H . F ., H . H . Grahame & A . J . Holland, 1988 . Effectsof sea cage salmon farming on sediment nitrification anddissimilatory nitrate reductions . Aquaculture 70 : 333-344 .
Lagler, K . F ., 1949 . Studies in Freshwater Fishery Biology .J. W. Edwards, Ann Arbor (Michigan), 231 pp .
Liao, P . B ., 1970. Potential pollution of salmonid fish hatch-eries . Water Sewage Works 117 : 291-297 .
Mantle, G . J ., 1982 . Biological and chemical changes associ-ated with the discharge of fishfarm effluents . EIFAC Tech-nical Paper 41 : 103-112 .
Markmann, P. N ., 1982 . Biological effects of effluents fromDanish fish farms . EIFAC Technical Paper 41 : 99-102 .
Murloz, M . J ., 1989. Indice de calidad y toxicidad de aguapara salmonidos. Doctoral Dissertation No. 77, NationalInstitute for Agrarian Research (INIA), Spain .
Myllyla, E . K ., 1976 . Waste-water problems caused by fishfarms. M.S. Thesis, Institute of Limnology, University ofHelsinki, Helsinki .
Sokal, R. R. & F . J . Rohlf, 1981 . Biometry. W. H. Freemanand Co ., San Francisco, 776 pp .
Solbe, J . F. de L . G., 1982. Fish-farm effluents: a UnitedKingdom survey. EIFAC Technical Paper 41 : 29-55 .
Solberg, S . O. & F . Bregnballe, 1982 . Pollution from farmedtrout feed with minced trash fish . EIFAC Technical Paper41 : 65-71 .
Szluha, A . T ., 1974 . Potamological effects of fish hatcherydischarge . Trans. am . Fish . Soc . 103 : 226-234 .
Tachet, H ., M. Bournaud & P . Richoux, 1981 . Introductiona 1'Etude des Macroinvertebres des Eaux Douces .L'Association Francaise de Limnologie, Paris, 155 pp .
Vannote, R . L ., G. W. Minshall, K . W. Cummins, J . R . Sedell& C. E. Cushing, 1980 . The river continuum concept. Can .J . Fish . aquat. Sci . 37: 130-137 .