structural behaviour in concrete frame corners of civil
TRANSCRIPT

civil defenceshelter
Structural Behaviour in Concrete Frame Cornersof Civil Defence SheltersNon-linear Finite Element Analyses and Experiments
MORGAN JOHANSSON
Division of Concrete StructuresDepartment of Structural EngineeringChalmers University of TechnologyGöteborg, Sweden 2000

THESIS FOR THE DEGREE OF DOCTOR OF PHILOSOPHY
Structural Behaviour in Concrete Frame Corners
of Civil Defence Shelters
Non-linear Finite Element Analyses and Experiments
MORGAN JOHANSSON
Division of Concrete Structures
Department of Structural Engineering
Chalmers University of Technology
Göteborg, Sweden 2000

Structural Behaviour in Concrete Frame Corners of Civil Defence SheltersNon-linear Finite Element Analyses and ExperimentsMORGAN JOHANSSONISBN 91-7197-889-5
©MORGAN JOHANSSON, 2000
Doktorsavhandlingar vid Chalmers tekniska högskolaNy serie nr 1576ISSN 0346-718X
Publication 00:2Arb nr: 1106Division of Concrete StructuresDepartment of Structural EngineeringChalmers University of TechnologySE-41296 GöteborgSwedenTelephone + 46 (0)31-772 1000
Cover:Schematic view of crack pattern obtained in opening (left) and closing (right) framecorners of civil defence shelter subjected to external pressure.
Chalmers ReproserviceGöteborg, Sweden 2000
Structural Behaviour in Concrete Frame Corners of Civil Defence SheltersNon-linear Finite Element Analyses and ExperimentsMORGAN JOHANSSONDivision of Concrete StructuresDepartment of Structural EngineeringChalmers University of Technology
ABSTRACTFrom a safety point of view it is important that a concrete structure, apart from necessary loadcapacity, also is able to show ductile behaviour that allows redistribution of forces so that alocal failure not lead to total collapse of the structure. A structure’s ability to exhibit suchbehaviour is highly dependent on the reinforcement detailing of the joint connections betweenits independent members. Accordingly, to obtain sound structural behaviour, the joints shouldideally be as strong as the structural members connected to them and show ductile behaviourin the ultimate limit state. Even though fulfilling these requirements, the reinforcementdetailings in frame corners previously prescribed in the Swedish Shelter Regulations for thedesign of civil defence shelters were difficult to apply correctly. Therefore, a simpler method,by which all reinforcement bars are spliced within the corner region, was proposed andevaluated.
To examine the effectiveness of the new detailing when subjected to a positive (opening of thecorner) or a negative (closing of the corner) moment, a combination of a literature survey,static full-scale tests and static non-linear finite element analyses has been carried out. Themain parameters varied were the reinforcement detailing and the reinforcement ratio, and itwas found that the new alternative is suitable to use. However, since a civil defence shelter isdesigned to withstand transient loading, such as blast waves from a nearby explosion or theimpact of falling masses from a collapsing building, this also has to be taken intoconsideration.
When subjected to such loads, the response of a structure may be quite different from that ofstatic loading. The peak load for transient loads is often several times higher than the“equivalent” static load used in the design of the shelter. Further, if the load is applied fastenough, it is possible that part of the structure will still “not be aware” of the loading whenanother part reaches failure. Therefore, non-linear finite element analyses based on explicitintegration were carried out to increase the knowledge of how a structure behaves whensubjected to such transient loads. It was found that even though the global structural behaviourmay differ widely there are still large similarities in the local behaviour between a static and atransient load case. The results imply that the conclusions made in the previous static studiesare valid also for a transient loaded structure.
Keywords: Concrete, frame corners, reinforcement detailing, spliced reinforcement, non-linear finite element analyses, civil defence shelters, blast load, impact load.

LIST OF PUBLICATIONS
The following papers are included in this thesis:
Paper I“Reinforcement Detailing in Concrete Frame Corners”Submitted to ACI Structural Journal.
Paper II“Nonlinear Finite-Element Analyses of Concrete Frame Corners”Published in ASCE Journal of Structural Engineering, Vol. 126, No. 2, February, 2000,pp. 190-199.
Paper III“FE Analyses of Concrete Civil Defence Shelters Subjected to Transient Loading”Submitted to ASCE Journal of Structural Engineering.


Preface
This study deals with the reinforcement detailing in concrete frame corners of civil defenceshelters and the response of such structures when subjected to transient loads. Experimentsand finite element analyses, based on non-linear fracture mechanics, were conducted toevaluate a new design proposal. The work presented in this thesis was carried out fromNovember 1994 to March 2000 at the Division of Concrete Structures, Chalmers Universityof Technology. The project was financed by the Swedish Rescue Services Agency.
I wish to thank my supervisor, Professor Kent Gylltoft, for his guidance and support. I wouldalso like to thank Björn Ekengren, from the Swedish Rescue Services Agency, for hisencouraging engagement in the project, which has resulted in many valuable discussions.Special thanks are due to Mario Plos, who was an invaluable support in my first year as adoctoral student, and after that also has provided valuable advice. For their joyful, never-ending support and encouragement, I thank my fellow colleagues at the Department ofStructural Engineering, especially the doctoral students at the Division of Concrete Structures,and in particular my colleague Jonas Magnusson who, despite his peculiar behaviour, hasbeen of great help. Special thanks are also due to my master thesis workers, Mikael Olsson,Mathias Johansson, Stefan Karlsson and Peter Grassl, whom I have had the pleasure tosupervise within the project and whose contribution is much appreciated. Thanks also to thestaff of the Structural Engineering Laboratory, for their invaluable assistance in theexperimental part of this work. Special thanks are due to Lars Wahlström for help with photosand scanned figures. Last, but not least, I would like to express my gratitude to YvonneJuliusson for her assistance and help.
Göteborg, March 2000
Morgan Johansson

I
Contents
AbstractList of PublicationsPrefaceContentsNotations
1 Introduction 11.1 Background 11.2 Research significance 21.3 Aim of the study 51.4 Limitations 61.5 Outline of contents 7
2 Reinforcement Detailings in Frame Corners 92.1 Introduction 9
2.1.1 Requirements 92.1.2 Frame corners studied 102.1.3 Definition of corner efficiency 12
2.2 Mechanical behaviour of different detailings 142.2.1 Opening frame corners 142.2.2 Closing frame corners 212.2.3 Spalling of the side concrete cover 22
2.3 Corner efficiency 262.3.1 Comparison of opening and closing corners 262.3.2 Influencing parameters
2.3.2.1 Inclined bars 292.3.2.2 Radial stirrups 342.3.2.3 Other important parameters 352.3.2.4 Detailings that might attain full efficiency 38
2.3.3 Estimation of corner efficiency in opening corners 392.3.3.1 General remarks 392.3.3.2 Equilibrium model 402.3.3.3 Empirical expressions 42
II
2.4 Discussion 452.4.1 Opening corners 45
2.4.1.1 Choosing detailing 452.4.1.2 Expected efficiency 462.4.1.3 Use of mechanical reinforcement ratio in the design 50
2.4.2 Closing corners 532.5 Concluding remarks 54
3 Non-linear Finite Element Analyses of Concrete Structures 573.1 Why use finite element modelling? 573.2 Fracture mechanics for concrete 573.3 Crack models 59
3.3.1 General 593.3.2 Discrete crack models 603.3.3 Smeared crack models 603.3.4 Embedded crack models 62
3.4 Localisation 633.4.1 Tension 633.4.2 Compression 673.4.3 Possible solution 68
3.5 Numerical approach 693.6 Finite element analyses of frame corners 713.7 Concluding remarks 76
4 Structural Behaviour at Dynamic Loading 774.1 General remarks 774.2 Response at transient loading 784.3 Blast load 81
4.3.1 Explosive shock in air 814.3.2 Reflection of shock waves 834.3.3 Diffraction of shock waves 864.3.4 Pressure-time relation used in finite element analyses 87
4.4 Impact load 88

III
5 Strain Rate Effects in Concrete 915.1 Introduction 915.2 Testing at high strain rates 925.3 Strain rate influence of concrete strength 955.4 Possible explanations for the increase in concrete strength 96
5.4.1 Characterisation of strain rate effects 965.4.2 Viscous effects 975.4.3 Structural effects 102
5.5 Effect of concrete strength on strain rate sensitivity 1035.6 Effect of strain rate on other material parameters 1065.7 Influence of strain rate on reinforcement 1085.8 Strain rate mesh dependency in finite element analyses 109
6 Numerical Solution Methods for Dynamic Problems 1156.1 General 1156.2 Mode superposition 1156.3 Direct integration methods 116
6.3.1 General 1166.3.2 Explicit integration method 1176.3.3 Implicit integration method 1196.3.4 Solution of non-linear problems 1196.3.5 Stability 1206.3.6 Way of loading 1226.3.7 Choosing integration method 1246.3.8 Central difference method in Abaqus/Explicit 125
7 Conclusions 1277.1 General 1277.2 Suggestions for future research 129
8 References 131
Appendix A Summary of Frame Corner TestsAppendix B Simply Supported Beams Reinforced with Spliced Reinforcement
Loops

IV
Notations
Roman upper case letters
Aelement area of elementAs reinforcement areaAs
* active reinforcement area when inclined bars are accounted forAs,i reinforcement area of inclined barsAs,r reinforcement area of radial stirrupsAs,red reduced reinforcement area of reinforcement loopsAφ reinforcement area of one barC compressive force, charge, damping matrixE Young’s modulusEB energy needed to break one floor slabEc Young’s modulus of concreteEimpact kinetic energy of falling masses just prior to impactEs Young’s modulus of reinforcementF loadFc compressive forceFs tensile force, resisting force due to the Stéfan effectFR resisting forceFdyn dynamic load capacityFsta static load capacityGc shear modulus of uncracked concreteGcrack shear modulus of cracked concreteGF fracture energyH height of collapsing buildingI incident shock waveK empirical factor, stiffness matrixL lengthM moment, mass matrixMA moment in section AMB moment in section BMtot total massMuc estimated moment capacityMuc
* estimated moment capacity when inclined bars are accounted for

V
Muc,A estimated moment capacity in section AMuc,B estimated moment capacity in section BMue estimated moment capacity using equilibrium modelMut moment capacity in testP load vector, loadPs
- peak underpressurePs
+ peak overpressureR tensile force, reflected shock waveT tensile forceT - duration of negative phaseT + duration of positive phaseU velocity of incident wave, displacement vectorU� velocity vectorU�� acceleration vectorV volumeVI velocity of incident waveVR velocity of reflected wave
Roman lower case letters
b widthc side concrete cover, stress wave velocityd effective heightfc compressive cylinder strength of concretefc characteristic compressive cylinder strength of concretefc,cube compressive cube strength of concretefsu ultimate strength of reinforcementfsy yield strength of reinforcementft tensile strength of concreteft,dyn dynamic tensile strength of concreteft,sta static tensile strength of concretefyk characteristic yield strength of reinforcementfsy,r tensile strength of radial stirrupsf(w) softening functiong gravity

VI
h distance between two platesh� separation velocityht distance from top of shelter to centre of collapsing buildingi + impulse intensity of positive phasei - impulse intensity of negative phaseht distance from top of shelter to centre of collapsing buildingk stiffnessl lever arm, crack extensionlA lever arm to section AlB lever arm to section Blcrack, ldc effective length in equilibrium modellelement element lengthm mass, mass per unit arean number of floors in collapsing building, number of barsp pressurep0 ambient pressureq distributed load, dynamic pressureqimpact equivalent static impact loadqweapon equivalent static weapon loadr radius of bent bars spacing of reinforcementsm mean crack spacingt width of localisation band, timet0 time constantta time of arrivalu displacementv velocityv0, vr, vs, particle velocityvimpact mass velocity at impactw crack openingw/c water-cement ratiowu ultimate crack openingz, z1, z2, z* internal lever arm

VII
Greek letters
α angle, factor controlling decaying overpressure, factor in the Newmark methodαI angle of incident waveαI,crit critical angle at which Mach reflection occursαR angle of reflected waveβ angle, shear retentionγ ratio between tensile forces∆F load increment∆L elongation
L�∆ elongation velocity∆t time increment∆tcr critical time stepδ displacement, numerical damping in the Newmark methodε� strain rateεc concrete strainεc1 strain within localisation band in element using embedded crack modelεc2 strain in element using smeared crack modelεel elastic strainεcrack crack strainεs reinforcement strainεu ultimate concrete strain in tensionεu,l ultimate concrete strain in tension when l = lelement
εu,s ultimate concrete strain in tension when l = sm
ζ amount of extra reinforcement loopsη efficiency, liquid viscosityθ angle between cracksθ0, θr, θs temperatureξ damping coefficientρ reinforcement ratio, line describing location of triple point, densityρcrit critical reinforcement ratioρi reinforcement ratio of inclined barsρr density in reflected waveρs density in incident waveσ stressσ1, σ2 principal stresses

VIII
σc concrete stressσs reinforcement stressσsp tensile strengthσx tensile stress in x-directionσy tensile stress in y-directionφ bar diameter, eigenvectorω angular frequencyωcrit critical mechanical reinforcement ratioωmax maximum angular frequencyωs mechanical reinforcement ratioωs
* mechanical reinforcement ratio when the presence of inclined bars is consideredmaxshelterω maximum mechanical reinforcement ratio in Swedish civil defence sheltersminshelterω minimum mechanical reinforcement ratio in Swedish civil defence shelters
1
1 Introduction
1.1 Background
From a safety point of view it is important that a concrete structure, apart from necessary loadcapacity, also is able to exhibit ductile behaviour that allows redistribution of forces so that alocal failure not lead to total collapse of the structure. A concrete frame structure’s ability tomeet these requirements is highly dependent on the reinforcement detailing of the jointconnections between its independent members. Despite this, the discussion andrecommendations given in the Swedish building codes and handbooks (e.g. BBK 94, Boverket1994; Betonghandboken 1990; and BRO 94 1994) about what reinforcement detailing must beused in reinforced concrete joint connections are rather limited. Accordingly, there is a needas well as a demand in Sweden for more knowledge in this field, something that apart fromthe work presented herein is also made clear by the number of valuable contributions recentlymade by, for example, Plos (1995), Karlsson (1999) and Lundgren (1999).
The Swedish Rescue Services Agency, though, presents detailed instructions in its ShelterRegulations on how the reinforcement in a civil defence shelter is to be arranged.Nevertheless, the detailings for frame corners prescribed in the previous Shelter Regulations,Swedish Rescue Services Agency (1990, 1994), shown in Figures 1.1a and 1.1b were regardedas time-consuming and rather difficult to carry out correctly. Consequently, the SwedishRescue Services Agency wanted a simpler corner detailing to be used and a research projectwas therefore initiated at the Division of Concrete Structures at Chalmers University ofTechnology; see Plos (1994a, b). The criterion set up was that the new detailing should beable to withstand loading at least as well as the conventional ones but also be easier toassemble at the construction site. With this as a basis the proposal shown in Figure 1.1c,making use of reinforcement loops spliced within the corner, was worked out. This detailinghas then been thoroughly evaluated and the results obtained and conclusions drawn arepresented in this thesis.
When designing a civil defence shelter according to the present Shelter Regulations, it is forpractical reasons regarded as a statically loaded structure. However, in reality a shelter mustbe able to withstand highly dynamic loading due to, for example, blast waves from a nearbyexplosion or the impact of falling masses from a collapsing building. When subjected to suchloads, the global response of a structure can be considerably different compared to that ofstatic loading. The peak load for transient loads is, for instance, often several times higher

2
than the “equivalent” static load used in the design of the shelter, but their duration is insteadvery limited in time. Further, if the load is applied fast enough, it is possible that part of thestructure will still not even “be aware” of the external loading when another part reachesfailure. Simplified, it can be said that the boundary conditions of the structure change withtime. Due to the strain rates obtained in this kind of loading, the material properties of bothconcrete and reinforcement will also change, making the response of the structure even morecomplicated to understand. Therefore, the change in material behaviour and change instructural response of a civil defence shelter, when subjected to such loading, were alsoincluded in the study.
Opening moment
Both closing andopening moments
Conventional detailings
New detailing(a)
(c)
inclinedbars
(b)
Closing moment
Figure 1.1 Reinforcement detailings previously used in the Swedish Shelter Regulations in(a) closing and (b) opening frame corners. The new reinforcement detailingevaluated herein is shown in (c).
1.2 Research significance
When making the design drawing it may seem as easy to use, for instance, the L-shapedreinforcement detailing shown in Figure 1.1a as that of reinforcement loops in Figure 1.1.c.However, there are several occasions when this is not true. A good example is theconstruction of a civil defence shelter within an existing building. The work is then made

3
substantially more complicated by the severe lack of space when reinforcing and casting theshelter’s concrete members. According to Ekengren (1996) such shelters are approximatelythree to four times as expensive to build as those in a newly constructed building. Animportant reason for this considerable increase in cost is the difficulty of carrying out thereinforcement detailings in the structure’s joint connections. When for example the shelterroof slab is constructed inside an existing building, it is first cast on the ground and then liftedup to its final position; see Ekengren (1998). After this, the adjoining walls are reinforced, andit is when the connections between the slab and these walls are to be solved that it becomesclearly a significant advantage if the joint detailing can be carried out using reinforcementloops as shown in Figure 1.1c. Accordingly, the advantage of the new proposal is not todecrease the total amount of reinforcement needed; on the contrary, this detailing may evenresult in an increased amount. Instead, the gain is of practical value. By simplifying the framecorner detailing in this way, the construction work can be carried out in less time and, aboveall, with a decreased risk of incorrect positioning of the reinforcement. Consequently, thesimplification may result in a structure of higher quality that is also less expensive toconstruct.
Figure 1.2 Casting and lifting of roof slab in civil defence shelter inside an existing building.
Another advantage with this detailing is its potential use in structures made up ofprefabricated members. Here, the possibility to produce the structural members at a factoryduring controlled conditions and then just cast the remaining connections at the constructionsite seems desirable. When using the conventional detailings, though, this has not beenpossible. However, since the reinforcement in the new proposal is spliced within the cornerregion only, such solutions may be considerably easier to use.

4
Further, when handling very large structural parts, such as the tunnel segments used in theArlanda Link, between the centre of Stockholm and Arlanda Airport, e.g. Mörnstad (1998),the use of the proposed detailing might be very advantageous. Here, the reinforcement cagesfor the roof and floor slabs were prefabricated in factory. However, the U-shapes necessary ifthe wall reinforcement were included, would render difficulties with transportation andhandling of the cages. Therefore, it was regarded a better solution to instead add the wallreinforcement at the construction site as shown in Figure 1.3a. The result was that only about60% of the total reinforcement in the final cages were prefabricated. If reinforcement loopscould have been used instead, though, a simplified substructure of the different structuralmembers as shown in Figure 1.3b had also been possible. This had then considerablyincreased the prefabricated part of the reinforcement cages, and hence made the constructionprocess be more effective, Mörnstad (2000).
Reinforcement cages before assembling
(a)
prefabricated reinforcementcages when using
reinforcement loops
Reinforcement cages after assembling
splicing zone betweenindividual reinforcement
cages
zone where additionalreinforcement were
added
(b)
prefabricated reinforcementcages when using L-shaped
bars in corners
Figure 1.3 Schematic view of reinforcement cages before and after assembling in tunnelsegment when using the reinforcement detailings similar to those shown inFigures1.1a and 1.1c, respectively.
5
The traditional approach in the study of concrete structures is to carry out experiments.However, to study the structural behaviour more thoroughly, the finite element method mayalso be used. It has been found that this approach, in which the non-linear behaviour ofconcrete may be simulated using non-linear fracture mechanics and plasticity, provides animportant complement to experiments and that its use may result in further understanding ofthe concrete response that otherwise would not be possible. Even though the use of non-linearfinite element analyses on concrete structures are comparably new in Sweden, there are stillquite a few that posses the knowledge necessary to adequately simulate their response whensubjected to static loading. Even so, there are still many problems to be solved, of which someare presented and dealt with in this thesis. However, the use of non-linear finite elementanalyses on concrete structures, subjected to transient loads such as impulse loading from anearby explosion or impact of falling masses, is still quite modest. Such studies havepreviously been made mostly by the military, e.g. the Defence Research Establishment, FOA.However, such analyses may also be of substantial interest for civilian purposes, e.g.accidental explosions in the process industry or the impact from a truck colliding at full speedwith a concrete column in a bridge. Further, even though Sweden so far has been more or lessfree from terrorist attacks, one should not forget that important installations, such as nuclearpower plants, may still be a potential target. Consequently, the need for further knowledge ofhow to carry out both static and dynamic analyses must not be underestimated. Hence, it isalso important to create a foundation at a university where this kind of knowledge can growand develop.
1.3 Aim of the study
The main aim of this research project was to evaluate a new design proposal in Swedish civildefence shelters and to determine whether it was appropriate to replace the detailingspreviously used in closing and opening frame corners with the new alternative. As stated inSection 1.1 the structural service criterion set up by the Swedish Rescue Services Agency wasthat the new reinforcement detailing must withstand loading at least as well as theconventional detailing so that a safe and ductile structure is obtained. To determine whetherthis criterion is fulfilled, a better understanding of the behaviour of frame corners underloading to failure and of the structural response in the corner area is required. Therefore, apartfrom a thorough literature survey, full-scale tests and non-linear finite element analyses werecarried out. Experiments provide information on the real behaviour in a structure, while thelatter approach makes it possible to simulate the progressive cracking and change in strain and
6
stress states under increased load, and thus provides the means for further understanding andincreased knowledge that otherwise would not be possible. Hence, such a combination may bea very powerful tool and allows a better understanding of the structural behaviour of the framecorner.
The load conditions used in the design of a Swedish civil defence shelter are static equivalentsto the dynamic loads expected. However, whether this approximation is appropriate has notbeen sufficiently examined. Therefore, the main aim of the dynamic study was to increase theknowledge of how a shelter behaves when subjected to such transient loads, which was doneby using non-linear finite element analyses. Based on this study, the question whetherconclusions gained in static tests and analyses also are valid for structures subjected totransient load cases hoped to be answered. Another aim was to gather knowledge about whatinfluence high strain rate may have on different concrete parameters such as strength andstiffness.
1.4 Limitations
The work presented herein can roughly be divided into two parts: static studies of thebehaviour in concrete frame corners and what reinforcement detailing should be used, anddynamic studies of a civil defence shelter subjected to transient loading. Although the workpresented in this thesis was originally initiated to improve the reinforcement detailing of civildefence shelters, the results and conclusions reached can of course also be used in other kindsof concrete structures. Nevertheless, the comparisons and discussions of the differentdetailings made are generally concentrated on their use in civil defence shelters. The cornerstudy was limited to frame corners of 90°. Further, the influence of haunches in the corner,and the possible effect that the corner size may have, were not included. The former, though,are normally not used in a civil defence shelter and the latter is not considered to be a problemsince the dimensions examined are similar to those used in such a structure. However, inlarger structures, such as a concrete bridge, the dimensions used may be far larger than thosestudied herein, and consequently a somewhat different behaviour may also be obtained. Someof the finite element analyses presented were unable to accurately simulate the behaviourobserved in tests. This was due to the material models used and the approximations chosen inthe modelling. As briefly discussed in Section 7.2, though, these shortcomings may be solved,among other things, by the use of better material models now available.The type of transientloads that may act on a civil defence shelter causes high load rates on the structure. This in
7
turn leads to high strain rates in the material, which is known to affect the properties of bothconcrete and reinforcement. Nevertheless, the influence of high strain rates on the materialproperties was not taken into account in the dynamic analyses. This simplification was mademainly for two reasons. First, in the finite element programme used it was not possible toinclude these effects in the concrete material models. Second, even though it was possible totake these effects into account for the reinforcement it was decided not to do so, since thestrain rate obtained here was found to be mesh-dependent; see Section 5.8. Consequently, alldynamic analyses were carried out using non-rate-dependent material models. Further, noexperimental tests were performed to verify the dynamic analyses. Nevertheless, it is believedthat the knowledge gained will be of significant use.
Another limitation in the dynamic study was that the effects of splinter were neglected in thefinite element analyses. To generalise, the influences of splinter essentially mean two things:their impact contribution to the impulse load, and the considerable damage the splinters maycause in both concrete and reinforcement. Further, to complicate matters one cannot be surewhether the splinter or the blast load will reach the structure first since this, among otherthings, depends on the weight of the exploding device and its distance to the structure. Whateffect these different cases have on the structure’s ability to withstand the explosion, though,is not clear. Consequently, to include this part here would have complicated the study toomuch and it was thought better to postpone its introduction to a continuing project.
1.5 Outline of contents
This thesis is composed of an introductory part and three papers published or submitted forpublication in reviewed scientific journals. The introductory part gives a background to thematerial treated in the papers, but also discusses subjects not included there. Further, somesections in the former stand for themselves, and the introductory part and the three papersshould, therefore, be regarded as a whole.
Chapter 2 presents a literature survey of frame corners subjected to opening or closingmoment (static loading). The mechanical behaviour obtained when using different detailings,primarily the three types shown in Figure 1.1, are discussed. Proposals of how to use thisknowledge in the design are also given. Non-linear finite element analyses and their use tobetter understand the mechanical behaviour of frame corners are treated in Chapter 3. InChapter 4 a discussion about what structural response is obtained when using transient

8
loading is presented. Further, a brief background for the blast and impact analyses carried outis given. Chapter 5 deals with the high strain rates obtained when a concrete structure issubjected to such loads, and what effect they may have on the concrete material parameters.Different approaches found in the literature and possible explanations for this phenomenonare presented and discussed. The inclusion of strain rate effects in dynamic finite elementanalyses is also treated briefly. Chapter 6 describes the background for different integrationmethods, and especially the explicit central difference method used in the dynamic finiteelement analyses carried out herein. Finally, the major conclusions and suggestions for futureresearch are given in Chapter 7.
Papers I and II deal with the static behaviour of concrete frame corners. The former presentsfull-scale tests of both opening and closing corners carried out by the author and compares theresults with those found in the literature. Paper II, though, presents non-linear finite elementanalyses simulating some of the closing corners in these tests. Finally, dynamic finite elementanalyses are used in Paper III to simulate the structural behaviour of a civil defence sheltersubjected to the blast load of a nearby explosion and the impact of falling masses from acollapsing building.

9
2 Reinforcement Detailings in Frame Corners
2.1 Introduction
2.1.1 Requirements
In many types of reinforced concrete structures, sectional forces have to be transmittedbetween adjoining members, as shown in Figure 2.1. From a safety point of view it isimportant that such structures, apart from necessary load capacity, also exhibit ductilebehaviour so that a local failure does not lead to total collapse of the structure. A structure’sability to meet this requirement is highly dependent on the reinforcement detailing used in thejoint connections. The positioning of the reinforcing steel in the adjoining members is oftenobvious; however, this is not the case in corner joints. Compared with the former, thedetailing of corners in reinforced concrete frame structures represents a relatively untouchedfield. Despite important contributions made by, for instance, Nilsson (1973), Mayfield et al.(1971, 1972), and Stroband and Kolpa (1981, 1983), for every test made on a corner jointseveral hundred tests to check the bending and shear capacity of beams have been carried out.Ideally, a joint should resist a moment at least as large as the calculated failure moment of themembers framing into it, and ensure ductile behaviour in the ultimate limit state. Nilssonsummarises the requirements for a corner subjected to bending as:• the joint shall be able to withstand a moment of at least the same magnitude as those on the
adjoining sections;• for joints which do not satisfy this design criterion, the ductility shall be sufficient to
prevent brittle failure so that redistribution of forces in the structure will be possible;• crack widths at corners under service load shall be limited to an acceptable magnitude;• the reinforcement shall be easy to fabricate and position; the risk of incorrect detailing is
significantly decreased when a simplified detailing is used. In the following sections, the structural behaviour of frame corners is presented and differentreinforcement detailings are discussed. Since the design criteria in civil defence shelters referto the ultimate limit state, the requirement of crack widths at service load mentioned as pointthree above are not further considered; the other three criteria, though, are regarded in thepresentation and discussed below.

10
gravity loads
internalpressure
external pressure
explosion
civil defenceshelter
Figure 2.1 Structures with corners subjected to opening or closing moments. Based on Nilsonand Winter (1991), and Johansson and Karlsson (1997).
2.1.2 Frame corners studied
A concrete frame corner can be separated into two principal types: those that are subjected toa positive moment (opening of the corner) and those subjected to a negative moment (closingof the corner) as shown in Figure 2.2. Generally, the first case is more difficult to detailproperly; see Mayfield et al. (1971) and Nilsson and Losberg (1976). The reason isschematically shown in Figure 2.3, which shows the difference in the structural behaviour of aframe corner subjected to an opening or a closing moment. By the use of a very simplifiedstrut-and-tie model, it can be shown that an opening of the corner tries to split the corner intwo by pushing off the outside concrete portion. This is opposite to what happens whenclosing the corner; the tensile and compressive forces then instead interact in a way thatconfines the concrete within the corner. This also means that the two cases will present quitedifferent difficulties in the detailing. However, since the reinforcement detailing in openingcorners is more sensitive than that in closing corners, the former is also treated in this thesismore thoroughly. A corner region in a structure may, due to different load combinations,usually be subjected to both opening and closing moments during its service time. This isespecially true in structures subjected to dynamic loading, since the structure then might swayback and fourth. For simplicity, though, the following presentation treats only the case ofmonotonic loading until failure.
11
opening moment
closing moment
Figure 2.2 Definition of positive (opening) and negative (closing) moment.
C
T
C T
R
R
T
C
T C
R
R
(a) (b)
Figure 2.3 Sketch of the principal forces in a corner subjected to (a) positive (opening)moment and (b) negative (closing) moment.
As shown in Figure 2.2 a frame corner may be of any angle; experimental studies of openingcorners with other angles than 90° have been reported by Nilsson (1973), Kordina (1984),Abdul-Wahab and Ali (1989), Abdul-Wahab and Al-Roubai (1998), and Abdul-Wahab andSalman (1999). To the author’s knowledge no such tests have been carried out on cornerssubjected to closing moment. Only frame corners at an angle of 90°, though, are treated here.In the following sections the structural behaviour of such frame corners subjected to openingor closing moment is discussed; a thorough summary of the tests treated in this dissertationcan be found in Appendix A.
12
2.1.3 Definition of corner efficiency
As stated in the first point in Section 2.1.1, the strength of a corner shall ideally be at least aslarge as that of its adjoining members. In what degree this requirement is fulfilled, is normallyexpressed as corner efficiency, and in the following sections this term will also be frequentlyused in the presentation and discussion of different reinforcement detailings of frame corners.
The corner efficiency is here defined as the ratio between the moment capacity obtained intests, independent of what final failure mode is obtained, to the theoretically estimatedmoment capacity of the members (weakest member used) making up the corner. The formerwas determined as the product of the external force and the lever arm between its acting axisand the critical section as defined in Figure 2.4. These sections mark the border between thecorner and its adjoining members, and from this it is clear that somewhat different criticalsections are used for opening and closing moments, respectively. The estimated momentcapacity was calculated in these sections by a cross-sectional analysis using a rectangularstress block as described in, for example, Betonghandboken (1990) and Eurocode 2, CEN(1991), where the influence of any possible normal force due to the external load and thereinforcement on the compressive side was accounted for (if not stated otherwise, theinfluence of dead weight was not taken into account).
l
F
M
M
l F
M
M
criticalsectionexpectedcrack
M = F ⋅ l
(a) (b)
Figure 2.4 Definition of critical sections used when determining moment capacity obtained intests for: (a) opening moment and (b) closing moment.

13
The definition made above may appear as clear and simple. However, when additionalreinforcement is positioned within the corner in order to strengthen it, the extra reinforcementmay also affect the capacity of the adjoining members. This is, for example, the case wheninclined bars are added at the inside of a corner subjected to opening moment, as shown inFigure 1.1c. Whether such additional reinforcement should be accounted for, whendetermining the estimated moment capacity of the adjoining member, can be discussed. In allprevious evaluations of opening frame corners referred to in this thesis, the influence of theinclined bars have been neglected when estimating the moment capacity of the weakestadjoining member. Therefore, this approach is herein denoted as the conventional evaluationmethod. However, the presence of such bars would of course not only affect the cornercapacity, but also the capacity of the adjoining members. Consequently, it is more correct totake their contribution into account when determining the moment capacity of the member.Rather surprisingly, this approach has, to the author’s knowledge, not previously been used inthe evaluation of opening frame corners, and it is therefore denoted here as the new evaluationmethod. This approach also makes it possible to consistently compare the efficiency ofdifferent reinforcement detailings. It also gives a rather good indication whether a ductilebehaviour will be obtained, since 100% efficiency in use of an under-reinforced cross-sectionwill lead to yielding of the reinforcement. Of the detailings compared in the followingsections, though, only the one using inclined bars at the inside of the corner will differ inefficiency; for the rest of the detailings, the two evaluation methods are exactly the same.
It can be argued that if the corner capacity reached in a test is equal to or higher than thatnecessary in the design, all is well. This may be true if only the structure’s strength isimportant, and its ductility is of no interest; i.e. the extra reinforcement has then filled itspurpose, and what structural response is obtained at loads higher than the design load isregarded to be of no importance. Hence, it would then be possible to purposely increase theamount of tensile reinforcement at the corner in order to provide the corner strength necessary.However, the magnitude and distribution of the loads that may act on a structure is often notentirely known, and in such cases it is important that a structure shows ductile behaviour thatallows redistribution of forces. To obtain this, the structure must be capable of largedeformations before final failure. Therefore, an increased moment capacity of the corner jointsmay not be an adequate solution since ductile behaviour of the corner may be at least asimportant if the structure is to withstand the external load designed for. Especially in a civildefence shelter, such ductile behaviour is of great importance in enabling the structure towithstand severe impulse loading, in which very large loads act during a limited time period;see Chapter 4 and Paper III. Hence, since the dissipation of energy is considerably larger in
14
plastic response than in elastic, ductile corner behaviour is more advantageous than thatprovided by a corner reaching higher load capacity, but fails in brittle manner. Accordingly, itmight be more important that the second point given in Section 2.1.1, regarding the jointductility, is fulfilled than the first point, stating that the joint shall be at least as strong as itsweakest adjoining member.
2.2 Mechanical behaviour of different detailings
2.2.1 Opening frame corners
For the opening moment it is quite clear that a crack will form at the inside of the corner.However, it is perhaps not as obvious that there is also risk of a second inclined crack withinthe corner that has to be taken into account when determining the detailing. Figure 2.5a showsa detailing, denoted Type 1, where this has not been done. This solution was common beforethe extensive experimental studies carried out in the late sixties and early seventies (e.g.Swann 1969; Mayfield et al. 1971, 1972; Balint and Taylor 1972; and Nilsson 1973) thatshowed its substantial shortcoming. It was found that this detailing was far from satisfactory,resulting in efficiencies (i.e. the ratio of the measured capacity divided by the calculatedcapacity in the adjoining members) as low as 8%. The reason is that there was no diagonalreinforcement to resist the diagonal tensile force in the corner (compare Figure 2.3a) and thecompressed concrete outside the tensile reinforcement is therefore pushed off as shown inFigure 2.5b. When this occurs, the compressive zone suddenly disappears and the corner failsin a very brittle manner. The presence of L-shaped reinforcement around the outside of thecorner serves little purpose since this reinforcement normally is compressed and, therefore,cannot prevent failure of the corner. Instead, it might even have a negative effect since it mayassist in pushing the corner off. A comparison with the strut-and-tie model shown inFigure 2.3 makes it clear that such a corner, without any diagonal reinforcement, depends onlyon the resistance of the concrete tensile strength to counteract the tensile force R; thus, usingmore reinforcement on either the tensile or compressive sides is of little help.
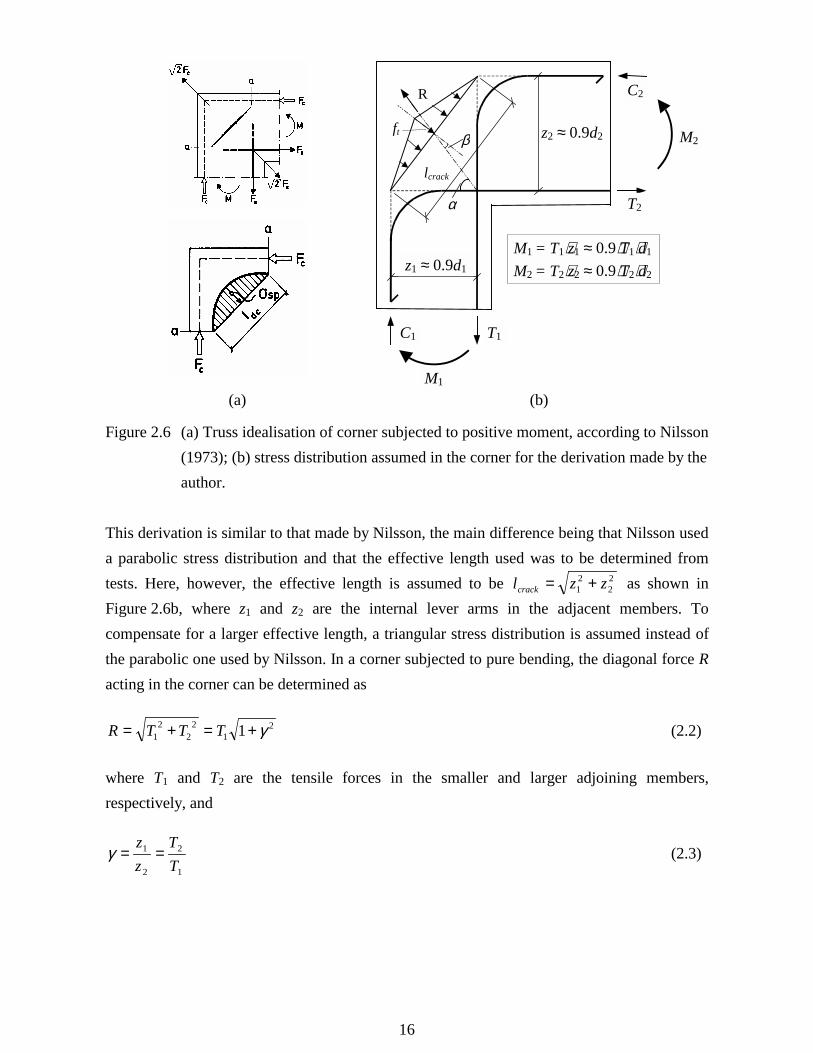
Nilsson (1973) derived an expression to estimate what bending moment can be applied on anopening corner when the reinforcement detailing matches that of Type 1. Based on linearelastic behaviour, he assumed a parabolic stress distribution along an effective length ldc as
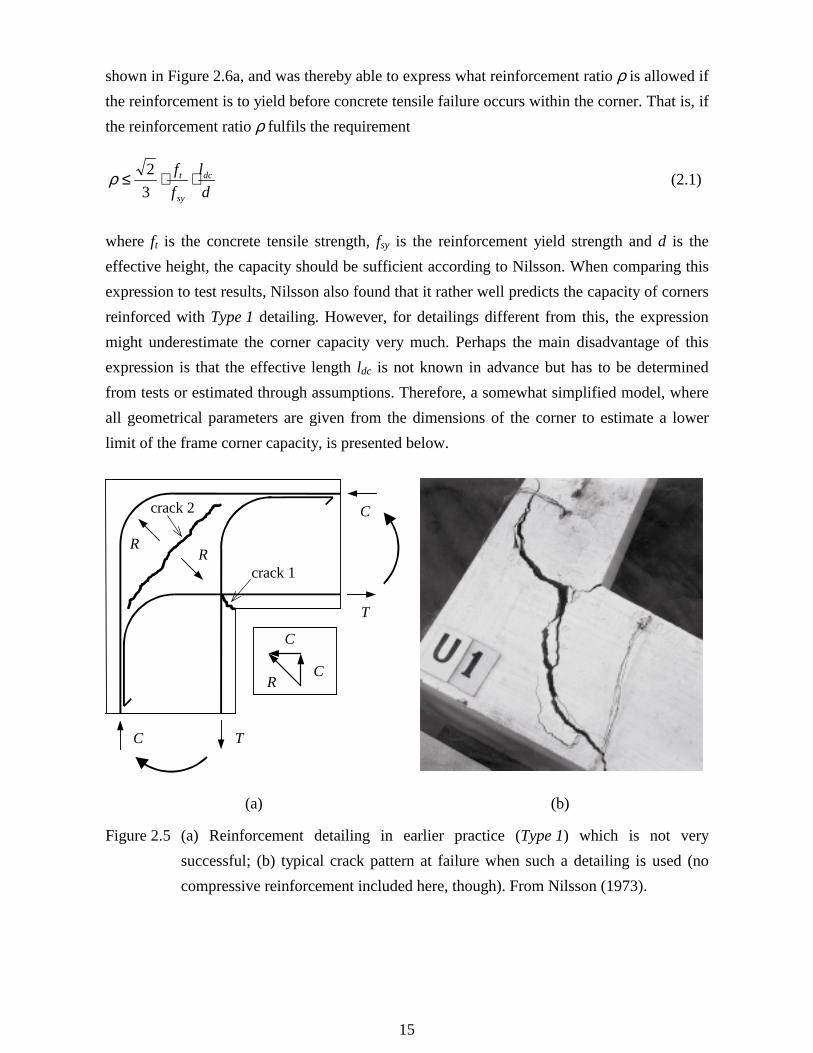
15
shown in Figure 2.6a, and was thereby able to express what reinforcement ratio ρ is allowed ifthe reinforcement is to yield before concrete tensile failure occurs within the corner. That is, ifthe reinforcement ratio ρ fulfils the requirement
dl
ff dc
sy
t ⋅⋅≤32ρ (2.1)
where ft is the concrete tensile strength, fsy is the reinforcement yield strength and d is theeffective height, the capacity should be sufficient according to Nilsson. When comparing thisexpression to test results, Nilsson also found that it rather well predicts the capacity of cornersreinforced with Type 1 detailing. However, for detailings different from this, the expressionmight underestimate the corner capacity very much. Perhaps the main disadvantage of thisexpression is that the effective length ldc is not known in advance but has to be determinedfrom tests or estimated through assumptions. Therefore, a somewhat simplified model, whereall geometrical parameters are given from the dimensions of the corner to estimate a lowerlimit of the frame corner capacity, is presented below.
crack 2
crack 1
C
T
TC
R
C
C
RR
(a) (b)
Figure 2.5 (a) Reinforcement detailing in earlier practice (Type 1) which is not verysuccessful; (b) typical crack pattern at failure when such a detailing is used (nocompressive reinforcement included here, though). From Nilsson (1973).
16
R
lcrack
ftβ
C2
T2
T1C1
M1
z1 ≈ 0.9d1
z2 ≈ 0.9d2
α
M1 = T1⋅z1 ≈ 0.9⋅T1⋅d1
M2 = T2⋅z2 ≈ 0.9⋅T2⋅d2
M2
(a) (b)
Figure 2.6 (a) Truss idealisation of corner subjected to positive moment, according to Nilsson(1973); (b) stress distribution assumed in the corner for the derivation made by theauthor.
This derivation is similar to that made by Nilsson, the main difference being that Nilsson useda parabolic stress distribution and that the effective length used was to be determined fromtests. Here, however, the effective length is assumed to be 2
221 zzlcrack += as shown in
Figure 2.6b, where z1 and z2 are the internal lever arms in the adjacent members. Tocompensate for a larger effective length, a triangular stress distribution is assumed instead ofthe parabolic one used by Nilsson. In a corner subjected to pure bending, the diagonal force Racting in the corner can be determined as
21
22
21 1 γ+=+= TTTR (2.2)
where T1 and T2 are the tensile forces in the smaller and larger adjoining members,respectively, and
1
2
2
1
TT
zz
==γ (2.3)

17
is a factor obtained from the moment equilibrium M1 = M2 shown in Figure 2.6b. Unless usingover-reinforced cross-sections, yielding of the tensile reinforcement will be obtained beforemaximum moment capacity is reached. Hence, the requirement of full efficiency is hereapproximated to be fulfilled if the tensile reinforcement yields, i.e.
21,
21 11 γγ +=+= ssy AfTR (2.4)
where fsy is the yield strength of the reinforcement and As,1 is the cross-section area inmember 1. If assuming a triangular stress distribution within the corner as shown inFigure 2.6b, the concrete resistance force FR offered by the concrete can be estimated as
βcos2
⋅= cracktR
blfF (2.5)
where ft is the concrete tensile strength, b is the width of the corner, lcrack is the effectivelength, and β is the angle between the direction of the tensile force R and the normal to theassumed crack direction. Using the assumption for lcrack given above, expressing
22
21
212cossin2cos
zzzz
+== ααβ (2.6)
and setting z1 ≈ 0.9d1, where d1 is the effective height in the smallest adjacent member, theforce FR can be written as
2
1
1
9.0
γ+=
bdfF t
R (2.7)
Finally, by setting R = FR it is possible to estimate a reinforcement ratio ρ in the smallestadjacent member, below which the reinforcement will yield, as
sy
ts
ff
bdA
⋅+
== 21
1,1 1
9.0γ
ρ (2.8)
However, since
12
1 ≤=ddγ (2.9)

18
this means that different sizes of the adjoining members result in larger resistance againstcracking within the corner. Hence, according to this model the maximum reinforcement ratiothat always would be possible to use, while still reaching yielding in the reinforcement, is
sy
tcrit f
f45.0=ρ (2.10)
which corresponds to the case when the two adjoining members are of equal dimensions.Evidently, the efficiency of detailing Type 1 depends on the concrete tensile strength, thereinforcement ratio and the steel yield strength. This conclusion also holds true for thedetailings presented below, even though they are not as critical as this detailing.
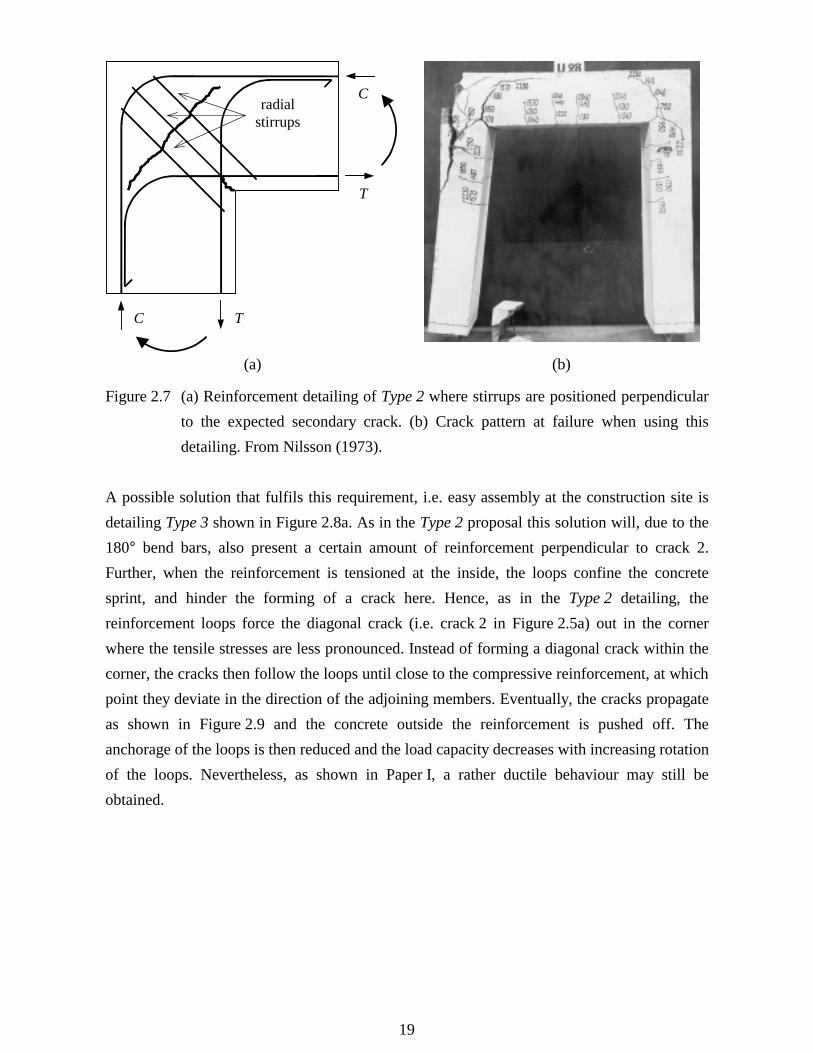
A possible solution to balance the tensile force R, and thus the failure of the corner, would beto position reinforcement bars perpendicular to it as shown in Figure 2.7a. Tests on suchdetailings, here denoted as Type 2, have also been carried out by several researchers (seeAppendix A), and it has been shown that the use of such radial reinforcement within thecorner substantially improves the structural behaviour of the corner, resulting in aconsiderable increase of the efficiency. The amount of diagonal reinforcement needed acrossthe crack can be determined by using equation (2.4), making sure that the whole tensile forceR is taken by the reinforcement. Nevertheless, even though this detailing gives considerablyimproved behaviour, it does still not fulfil the requirement of full efficiency. This is becausethe radial reinforcement is not anchored at the outside of the corner and the equilibriumrequirement of the strut-and-tie model (see Figure 2.3a) can, therefore, not be fulfilled.Instead, a critical crack can therefore form outside the L-shaped reinforcement as shown inFigure 2.7b, and the outer concrete part is pushed off. Further, the detailing does not fulfil therequirement that it should be easy to carry out; see point four in Section 2.1.1. The use ofstirrups may be possible in beam-column corners, but in wall-slab corners such a detailingcould be quite complicated to carry out. Therefore, another solution is necessary if the demandfor an easily fabricated detailing is to be met.
19
Cradial
stirrups
T
TC
(a) (b)
Figure 2.7 (a) Reinforcement detailing of Type 2 where stirrups are positioned perpendicularto the expected secondary crack. (b) Crack pattern at failure when using thisdetailing. From Nilsson (1973).
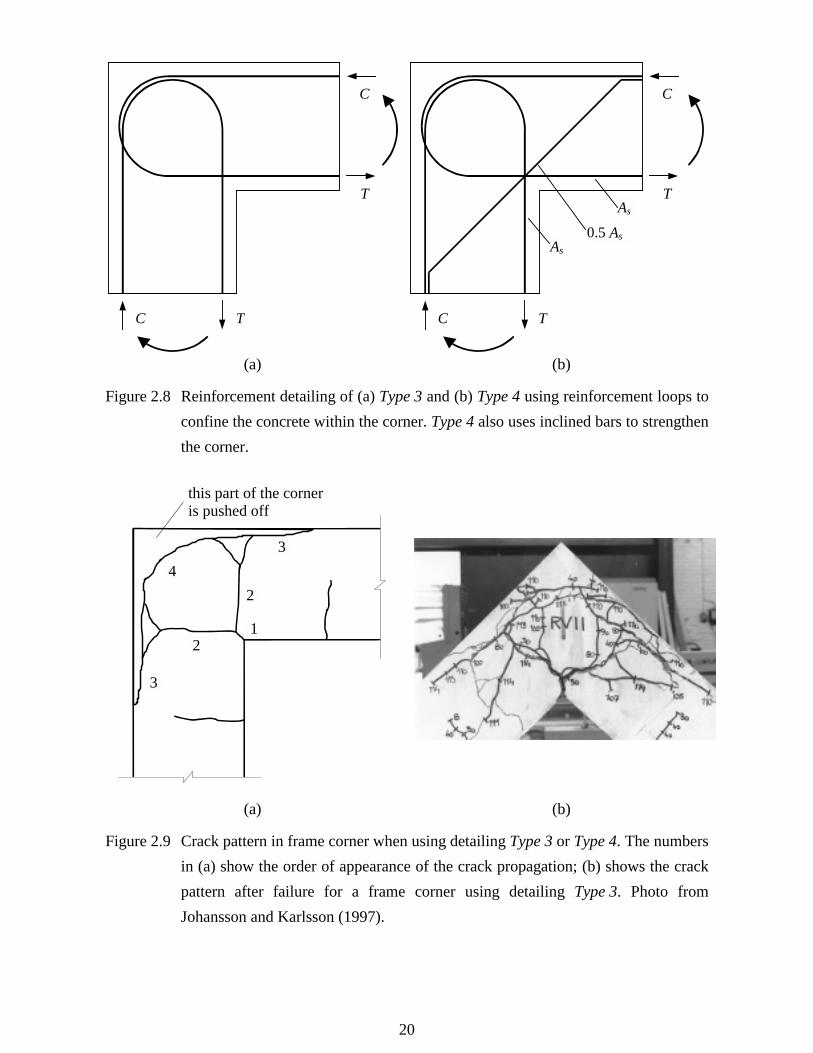
A possible solution that fulfils this requirement, i.e. easy assembly at the construction site isdetailing Type 3 shown in Figure 2.8a. As in the Type 2 proposal this solution will, due to the180° bend bars, also present a certain amount of reinforcement perpendicular to crack 2.Further, when the reinforcement is tensioned at the inside, the loops confine the concretesprint, and hinder the forming of a crack here. Hence, as in the Type 2 detailing, thereinforcement loops force the diagonal crack (i.e. crack 2 in Figure 2.5a) out in the cornerwhere the tensile stresses are less pronounced. Instead of forming a diagonal crack within thecorner, the cracks then follow the loops until close to the compressive reinforcement, at whichpoint they deviate in the direction of the adjoining members. Eventually, the cracks propagateas shown in Figure 2.9 and the concrete outside the reinforcement is pushed off. Theanchorage of the loops is then reduced and the load capacity decreases with increasing rotationof the loops. Nevertheless, as shown in Paper I, a rather ductile behaviour may still beobtained.
20
C
T
TC
C
T
TC
As
0.5 AsAs
(a) (b)
Figure 2.8 Reinforcement detailing of (a) Type 3 and (b) Type 4 using reinforcement loops toconfine the concrete within the corner. Type 4 also uses inclined bars to strengthenthe corner.
this part of the corneris pushed off
1
2
2
3
3
4
(a) (b)
Figure 2.9 Crack pattern in frame corner when using detailing Type 3 or Type 4. The numbersin (a) show the order of appearance of the crack propagation; (b) shows the crackpattern after failure for a frame corner using detailing Type 3. Photo fromJohansson and Karlsson (1997).
21
Most researchers working with opening frame corners have tested detailing Type 3 or similarproposals and it has been shown that the efficiencies of this detailing and that of Type 2 arecomparable. However, full efficiency is not obtained with either detailing and since this,together with an easily fabricated detailing, was the main goal, further studies were carriedout. After an extensive experimental test series, Nilsson (1967, 1973) concluded that such asolution is possible (when using the conventional evaluation method, see Section 2.1.3) if theType 3 detailing is strengthened by inclined bars positioned at the inside of the corner asshown in Figure 2.8b. Quite naturally, the structural behaviour of this detailing is very similarto that of Type 3. The inclined bars, though, delay the growing of the first crack at the insideof the corner and thereby also delay the propagation of the crack outside the compressivereinforcement. Nilsson determined experimentally that the area of the inclined bars should beabout one-half that of the main reinforcement; see Figure 2.8b. According to Karlsson (1999)this detailing is nowadays accepted in many countries, possibly in combination with diagonalstirrups positioned similarly to those in Type 2.
2.2.2 Closing frame corners
As stated in Section 2.1.2, a frame corner subjected to closing moment is not as sensitive asone subjected to an opening moment. This is because it in the former case is considerablyeasier to attain a reinforcement detailing that may balance the internal forces also afterconcrete cracking has occurred. For opening corners, though, this is not the case, and it cantherefore be said that the behaviour of such corners is characterised by the concrete tensilestrength, while closing corners depend more on the concrete compressive strength.Consequently, there also exist several suitable solutions, of which detailing Type 1 andType 3, shown in Figures 2.4 and 2.7a, respectively, are two good possibilities.
Since the internal lever arm increases within the corner, it might appear that a joint region in aclosing corner is always stronger than its adjoining members. Yet it has been shown in teststhat the corner in certain cases fails before yielding of the tensile reinforcement, and henceresults in capacities lower than that expected. The possible causes of this behaviour are,according to Stroband and Kolpa (1983), the following:• premature crushing of the concrete at the inside of the corner in the concrete compressive
zone;• crushing failure of the diagonal compressive strut within the corner;• spalling of the side concrete cover, which causes anchorage failure of the reinforcement.
22
Further, if the tensile reinforcement is spliced within the corner, the possibility of ananchorage failure exists in the same way, as is the case in an ordinary beam with splicedreinforcement. Of the possible failure types mentioned here, spalling of the side concretecover is regarded as especially interesting and is therefore treated more thoroughly inSection 2.2.3.
Premature crushing of the concrete at the inside of the corner is possible when thecombination of the concrete compressive strength, reinforcement yield strength andreinforcement ratio is such that a high mechanical reinforcement ratio, ωs, is obtained. Highcompressive stresses are then concentrated in the region of the internal angle; compare thestrut-and-tie model in Figure 2.3b. However, in this region there also exists a favourablemultiaxial compressive state of stress that wholly or partly compensates for these largestresses and, hence, usually give the corner the strength required to resist concrete crushing.Such a favourable stress state, though, is not necessarily the case in the diagonal compressivestrut (it might be if confining stirrups are positioned within the corner) and for large values ofωs there is risk of compressive failure in this part. Stroband and Kolpa derived an expressionwhich suggests that ωs must be limited to 0.240 if such a failure is to be avoided.
2.2.3 Spalling of the side concrete cover
When a bar changes direction, there will be radial compressive stresses as shown inFigure 2.10a. These stresses give rise to tensile stresses that try to split the concrete in theplane of the bend. Tests and theoretical studies of this kind of failure in beams have beencarried out by, for instance: Timm (1969), Leonhardt et al. (1973), Franz and Timm (1972),Kordina and Fuchs (1972), Dragosavic et al. (1975), and Grassl (1999). Wästlund (1935),Östlund (1963), Elinder and Hallhagen (1967), and Stroband and Kolpa (1983) haveexamined the effect of spalling in frame corners. In this section the effects of this phenomenonand how it can be treated are briefly discussed. For a thorough summary of the behaviour inthe concrete around bent reinforcement bars the reader is referred to, for example,Timm (1969) or Grassl (1999).
It has been found that the magnitude of the splitting stresses depends on the bar diameter, theirbending radius and the steel yield strength. Further, experimental results indicate that the riskof spalling failure increases when reinforcement loops such as those in detailing Type 3 areused, compared to the L-shaped bars in detailing Type 1; see Stroband and Kolpa and Paper II.

23
Because of the positive effect of confinement a large side concrete cover has a positive effecton the resistance against spalling. Further, transverse reinforcement bars within the loops orradial stirrups around the loops may help in restraining the tensile stresses perpendicular to thebend. However, although such reinforcement may be easy to assemble in a beam-column jointit might be very difficult to do this in a wall-slab connection at the construction site.
σσφ
φ πσr
s ss
Ar r
= = ⋅4
sc
φAsσs
r
Asσs
(a) (b)
Figure 2.10 Schematic view of (a) radial compressive stresses and (b) possible splittingcracks in the plane of the bent bar. Based on Stroband and Kolpa (1983).
If the splitting stresses reach the tensile strength of the concrete, cracks are formed in theplane of the loops and spalling of the side concrete cover is possible; see Figures 2.10b and2.11. If this happens, the reinforcement bars close to the free concrete sides lose theiranchorage and the load capacity decreases, something that according to Stroband and Kolpaoccurs suddenly. However, tests carried out by the author and reported by Grassl show thatthis is not necessarily the case; see Appendix B. The reason is that even though the outerreinforcement bars are lost, resulting in fewer bars available to transmit the load, theconfinement of the interior bars still provides enough anchorage to considerably delay a totalfailure. Hence, the post-peak response, i.e. the behaviour after maximum load, depends to alarge degree on what percentage of the total reinforcement amount is affected. That is, if forinstance a beam-column connection reinforced with only a small number of bars (Strobandand Kolpa had two φ6 in their tests; see Appendix A) loses the outer bars, there is substantialrisk of a brittle behaviour. However, if only a limited number of the total reinforcement barsavailable are affected, as is the case in a wall-slab joint, the spalling will have little effect onthe total load capacity, and ductile behaviour is therefore still possible.

24
Figure 2.11 Spalling of side concrete cover in frame corner (Type 3) when using splicedreinforcement loops. Photos from Johansson (1996) and Grassl (1999),respectively.
Spalling of the side concrete cover may be a problem for both opening and closing framecorners. In the former case, though, failure is often introduced due to other reasons, and sideconcrete spalling is therefore not regarded as such a large problem for opening corners. Forclosing corners, though, it is considerably larger risk that this failure mode will cause totalcorner failure, and then also limit the corner capacity. Nevertheless, tests on opening corners,presented in Paper I, showed that this phenomena might b very important to better understandand interpret the test results of opening corners.
Different proposals of how to take into account the spalling of the side concrete cover can befound in the literature; three of these are compared below. The final expressions are generallyderived to give a minimum ratio r / φ between the radius of the bend bars and the bar diameterat which the detailing still is able to avoid spalling of the side concrete cover. CEB-FIP ModelCode, CEB (1993), presents such an expression based on the concrete response whensubjected to splitting forces:
c
sy
ff
cr ⋅
+⋅≥
φφ
φ 26.12 (2.11)
25
where c is the concrete cover perpendicular to the plane of the bend bars, fsy is the steel yieldstrength and fc is the compressive strength of the concrete. Using the approximate relationbetween the compressive stress fc and the concrete tensile stress ft, given in equation (2.20), itcan be rewritten as
t
sy
ff
cr ⋅
+⋅≥
5.01042.0
φφ(2.12)
which is very similar to that presented in Stroband and Kolpa (1983), i.e.
t
sy
ff
cr ⋅
+⋅≥
5.01050.0
φφ(2.13)
Neither of the above, though, takes into account at what angle the bars are bent, somethingthat is considered in the Swedish Concrete Code BBK 94, Boverket (1994). Here, anempirical expression
����
�+⋅−−⋅≥ 5.0
)2sin(15.0028.0
φαφc
ffr
t
sy where 5.3≤φc (2.14)
somewhat different from that proposed by CEB and by Stroband and Kolpa is used. Exceptfor the introduction of the bending angle α (α = 180° for a reinforcement loop), though, theratio r / φ depends on the same parameters as above. This introduction of the bending angleseems reasonable, since tests by both Stroband and Kolpa and the author indicated that therisk of spalling failure increases when using reinforcement loops, compared to when using L-shaped bars as in the Type 1 detailing. Dragosavic et al. (1975) also proposed an empiricalexpression, in which the influence of transverse bars is taken into account. It is not includedhere, though, since it requires a large side concrete cover (c ≥ 4.5φ) to be valid for use. Theresults of the other three expressions are compared in Figure 2.12a. From this it can be seenthat the minimum value of the ratio r / φ varies quite widely for low values of fsy / ft. Forinstance, at a strength ratio of 250, which is quite a reasonable ratio when using meanstrengths, the requirement in BBK 94 is only about 60% of that predicted by the CEB-FIPModel Code. A possible reason might be that the expression in the former is based on thecharacteristic tensile strengths used in BBK 94, which are generally somewhat lower thanthose given in, for example, the Model Code for concrete of the same compressive strength.Nevertheless, in the tests on frame corners presented in Paper I, spalling of the side concretecover also occurred despite fulfilling the requirements set by both BBK 94 and the ModelCode. Even when more than doubling the side concrete cover in the tests of opening moment,

26
there were strong indications that splitting stresses caused by the bend bars influenced theresponse of the outer reinforcement loops. Figure 2.12b compares the ratio r / φ in the framecorners, presented in Paper I, using such loops as that required by the Model Code. Here, theratio between the side concrete cover and the bar diameter varied as 2 ≤ c / φ ≤ 4.5, which alsohas a considerable influence on the predicted ratio r / φ allowed. Thus, this very limitedcomparison suggests that the expressions given in the literature may be inadequate to use forspliced reinforcement loops in frame corners.
0
5
10
15
20
100 200 300 400 500
StrobandCEBBBK 94
fsy / ft
r / φ
0
5
10
15
20
100 200 300 400 500
fsy / ft
r / φ
c / φ = 2
c / φ = 3.5
c / φ = 4.5c / φ = 3.5
c / φ = 4.5
c / φ = 2
(a) (b)
Figure 2.12 (a) Comparison of ratio r / φ required in different references to avoid spalling ofthe side concrete cover when the ratio c / φ = 2; (b) comparison between testsand allowable ratio r / φ according to CEB (1993). Black dot means spallingfailure, grey means that spalling was initiated, and white means no spalling.
2.3 Corner efficiency
2.3.1 Comparison of opening and closing corners
When comparing the efficiencies of different corner detailings it is common to plot them as afunction of the reinforcement ratio, ρ. However, since in Section 2.2.1 it was concluded thatboth the concrete and steel qualities are of high importance, it is better to plot the efficiency asa function of the mechanical reinforcement ratio, ωs; i.e.:

27
c
sys
c
sys bdf
fAff
== ρω (2.15)
where fc is the cylinder compressive strength of the concrete.
A comparison of the efficiency obtained in tests of opening frame corners reinforced with thefour detailings presented (or similar to those, see Appendix A) is shown in Figure 2.13. Tobetter visualise the background for the conclusions drawn by Nilsson and others, theefficiencies were here determined using the conventional evaluation method, i.e. no accountwas taken to the extra moment capacity in the adjoining members provide by the inclined barsin the Type 4 detailing; see Section 2.1.3. Further, of the results containing detailing Type 2only those tests where the amount of stirrups were able to counteract the tensile force, R, areincluded; all tests of this detailing, though, are compared in Appendix A. The reinforcementratios used varied between 0.38 and 3.02%, and the approximate concrete cylindercompressive strength ranged from 10 to 52 MPa. From this comparison the considerableinefficiency of the Type 1 detailing and the apparent advantage of the Type 4 detailing,respectively, are clear (for a complete summary of these test results, see Appendix A). Further,it can be seen that detailing Type 3 is rather effective even though not reaching full efficiency;Type 2, though, seems to be somewhat less reliable. Therefore, in the following treatment ofopening corners only the Type 3 and Type 4 detailings are dealt with. A closer look atFigure 2.13 shows that the efficiency of these two detailings seems to drop dramatically whenωs exceeds 0.200, thus suggesting that neither detailing should be particularly appropriate touse for mechanical reinforcement ratios higher than this limit.
The efficiencies of the Type 1 and Type 3 detailings in closing frame corners are compared inFigure 2.14. It is found that for mechanical reinforcement ratios ωs below a value of about0.300 the efficiency is usually in the vicinity of or above 100%. Those results that did notmeet this requirement showed for most cases, a different failure mode than the expectedflexural failure; see also Paper I and Paper II for further discussion. Nevertheless, since oneaim of the work presented in this dissertation was to investigate whether the Type 1 detailingcould be replaced by Type 3, it is especially interesting to note that the two detailings, forpractical purposes, seem to be quite equivalent. Thus, this indicates that such a change alsoshould be appropriate.

28
0
20
40
60
80
100
120
140
0.000 0.100 0.200 0.300 0.400 0.500
Mechanical reinforcement ratio
Efficiency [%]
Type 1
Type 2
Type 3
Type 4
Figure 2.13 Efficiency of reinforcement detailings in frame corner subjecting to openingmoment. In the Type 4 detailing, no account is taken to the inclined bar’scontribution to the expected moment capacity; see Section 2.1.3.
0
20
40
60
80
100
120
140
0.000 0.100 0.200 0.300 0.400 0.500
Mechanical reinforcement ratio
Efficiency [%]
Type 1
Type 3
Figure 2.14 Efficiency of different reinforcement detailings in a frame corner subjected toclosing moment.

29
Figure 2.15 compares the efficiencies of detailings Type 1 and Type 3 in frame cornerssubjected to opening and closing moments. From this it is very clear that frame cornerssubjected to opening moment are considerably more sensitive than frame corners subjected toclosing moment. This is especially true for the Type 1 detailing, which in closing momentgenerally reaches an efficiency of 100%, while it for opening moment usually is below 50%.The Type 3 detailing provides a substantial larger resemblance when subjected to opening orcloser moment even though the difference in efficiency obtained is still evident. Thus, it canbe concluded that the use of reinforcement loops within the corner seems to be a good choicefor frame corners that might be subjected to both opening and closing moment. Hence, thisdetailing is further used in the following section, in which different approaches that mightfurther increase the corner efficiency in opening frame corners is presented and discussed.
0
20
40
60
80
100
120
140
0.000 0.100 0.200 0.300 0.400 0.500Mechanical reinforcement ratio
Efficiency [%]
Type 1
opening moment
0
20
40
60
80
100
120
140
0.000 0.100 0.200 0.300 0.400 0.500Mechanical reinforcement ratio
Efficiency [%]
Type 3
closing moment
(a) (b)
Figure 2.15 Comparison of reinforcement detailings when subjected to opening or closingmoment: (a) Type 1 detailing; (b) Type 3 detailing.
2.3.2 Influencing parameters
2.3.2.1 Inclined bars
According to the comparison made in Figure 2.13 the Type 4 detailing should without doubtbe superior to that of Type 3. However, a comment on these results should be made before anyhasty conclusions are made. As mentioned in Section 2.1.3, when Nilsson and other

30
researchers determined the efficiency of the Type 4 detailing, they did not include thecontribution to the moment capacity in the critical section from the inclined bars. Neither didthey take this extra reinforcement into account when determining the reinforcement ratio ofthe detailing. This approach, the conventional evaluation method, was also used for the resultspresented in Figure 2.13. Therefore, it is somewhat deceptive to interpret reported test resultsof opening frame corners that make use of inclined bars positioned at the inside of the corner.However, by using the new evaluation method, described in Section 2.1.3, a consistentcomparison of different reinforcement detailings is possible. As shown in Figure 2.16, theactive amount of reinforcement As
* counteracting the crack in the critical section can bedetermined as
isss AAA ,*
21+= (2.16)
where As and As,i are the reinforcement areas of the loops and inclined bars, respectively.Using this area As
* when estimating the corner’s moment capacity and mechanicalreinforcement ratio, the result will also be quite different; see Figure 2.17. Here, the efficiencyof Type 3 is compared to the modified efficiency of Type 4. It is then clear that theirefficiencies are rather similar, something that also was confirmed in tests by the author; seePaper I.
isss FFF ,
*
21+=
Fs
Fs Fs,i
Fs*
Fs*
Type 3
As*As,i As
Type 4
Figure 2.16 How to take into account the contribution of the inclined bars in detailing Type 4when transforming it into a Type 3 detailing.
Consequently, from the author’s point of view the Type 4 detailing does not fulfil therequirement of 100% efficiency. It can be argued that the purpose of adding inclined bars atthe inside of an opening corner is not explicitly there to provide full efficiency in the criticalsection, as defined in the new evaluation method described in Section 2.1.3, but to force thefinal failure to occur outside the corner. This is also what often happened in tests by Nilssonand others, which led to the detailing being regarded as successful. However, as discussed

31
below and in Paper I, the appearance of a critical crack outside the corner depends to a largedegree on the moment distribution close to the corner and whether the reinforcement loops arespliced to straight bars just outside the corner or not. If the external moment decreases atincreasing distance from the corner, as is usually the case, one cannot be sure that a criticalcrack forms in any of the adjoining members prior to corner failure. Due to the crack distanceobtained in reinforced concrete, the moment acting in a potential critical section outside thecorner may be considerably lower than that in the corner. If this crack section is positioned tooclose to the corner, the inclined bars might increase the section’s moment capacity, and hencefurther reduce the chance for the final failure to occur there. Therefore, if the inclined bars areto have a negligible effect on the adjoining member’s moment capacity, the critical crack mustat least form close to the section where the inclined bars reach the compressive zone.
0
20
40
60
80
100
120
140
0.000 0.100 0.200 0.300 0.400 0.500
Mechanical reinforcement ratio
Efficiency [%]
Type 3
Type 4
Figure 2.17 Comparison of the efficiencies of detailing Type 3 and Type 4 when the inclinedbars in Type 4 are considered in determining the capacity and reinforcement ratioof the detailing, i.e. using the new evaluation method described in Section 2.1.3.

32
lA
lB
A
B
C
F FFF
MB = F⋅lB
MA = F⋅lA
Figure 2.18 Schematic view of potential critical crack sections in an opening corner.
Figure 2.18 shows a schematic case of a corner subjected to opening moment. Here, crack Acorresponds to the critical defined in Section 2.1.3. Crack B is the crack in the adjoiningmember that is closest to the corner and even though it in this case forms close to the corner, itis assumed here that the inclined bars have a negligible influence on the section’s momentcapacity. Depending on what effect the inclined bars have on the moment capacity insection B, it might instead be crack C that has to develop into a critical crack if final failure isto occur outside the corner region. Nevertheless, if failure is to be obtained in section B, themoment MB has to reach the section’s capacity Muc,B before the moment MA reaches thecapacity Muc,A of the corner. The relation between these capacities can be expressed as
Muc,A = η⋅Muc,B (2.17)
where η represents the efficiency for detailing Type 4. According to Figure 2.18 it variesbetween about 0.90 and 1.25 when ωs ≤ 0.200. Thus, if the critical crack is to form outside thecorner region, the ratio MA / MB has to be larger than the efficiency η. But since there are aninfinite number of possible load cases, it is difficult to give a general statement of whether thiswill happen or not.
Nevertheless, Figure 2.19 shows some examples of the ratio between these moments that maybe obtained for different load cases of an elastic beam with constant stiffness over its length.Here, the critical section in the adjoining member (i.e. crack B) is assumed to form at adistance of 0.2 m from crack A. Regarding the combined effect of the inclined bars and themean crack distance in the concrete, this distance is in most cases probably underestimated,which also means that it is an assumption on the safe side. Comparing the moment ratiosMA / MB, obtained in the presented load cases, it is clear that they for most cases are higher

33
than the efficiencies reached when using the Type 4 detailing. Hence, failure will occur withinthe corner before any critical cracks are able to form in the adjoining members. Theexceptions are the cantilever beams, which for beam lengths of about 4 m and 2 m,respectively, lead to ratios below 1.10, which makes it reasonable to believe that failure inthese cases may occur in an adjoining member.
2 3 4 5 6 7 8
Beam length, L [m]
1.0
1.1
1.2
1.3
1.4
1.5MA / MB
L
L
L
1.0
1.1
1.2
1.3
1.4
1.5MA / MB
2 3 4 5 6 7 8
Beam length, L [m]
L
LL
(a) (b)
Figure 2.19 Ratio between moment in fixed support and moment at a distance of 0.2 m.
However, if inclined bars are used and the aim to prevent failure within the corner shall bemet, one must make sure that the reinforcement loops are not spliced to straight bars justoutside the corner region. Under no circumstances shall such splices be positioned closer tothe corner than the section where the inclined bars reach the compressive zone; seeFigure 2.20. If they are, the presence of extra reinforcement next to the corner will no doubtprevent the forming of a critical crack in this region. When using just reinforcement loops,though, the positioning of the splice probably does not make any difference since the criticalcracks then will form within the corner in either case.

34
correctpositioning
of splice
incorrectpositioning
of splice
Figure 2.20 Correct and incorrect positioning of splices when using inclined bars.
2.3.2.2 Radial stirrups
As shown in Figure 2.13 the addition of radial stirrups within the corner of detail Type 1, thustransforming it into detail Type 2, has a very positive effect on the corner efficiency. Thisinfluence has inspired some researchers (Mayfield et al. 1971, 1972; Stroband and Kolpa1981; and Skettrup et al. 1984) to investigate the influence of such radial bars in combinationwith reinforcement loops, i.e. detailings of Type 3 and Type 4. The results of these tests aresummarised in Figure 2.21, and from this it can be seen that the influence of the stirrups (theamount varying between 25% and 141% of that necessary to counteract the tensile force R) isnot particularly pronounced. In fact it is only for very high mechanical reinforcement ratios(ωs > 0.300) in the Type 4 detailing that the stirrups’ presence seems to have any particulareffect. Hence, this suggests that the adding of such diagonal reinforcement within the cornerhas a very limited effect if reinforcement loops, such as those in detailing Type 3 and Type 4,are used. This can be interpreted as that the reinforcement loops are sufficient to prevent theforming of a critical crack within the loops. Instead, final failure will be similar to thatobtained when no radial stirrups are used, i.e. loss of the concrete part outside the loops andeventually result in an anchorage failure; see Figure 2.9. That additional stirrups within thecorner do not have the intended effect is not surprising though. Recalling the strut-and-tiemodel shown in Figure 2.3a, the tensile force R still has to be balanced by reinforcementadequately anchored at the outside of the corner. This is still not the case here and fullefficiency is therefore not either to be expected.
Thus, the radial stirrups will more or less act as surplus reinforcement and therefore have littleeffect on the ultimate capacity of the detailing. Nevertheless, the improved efficiencies at highmechanical reinforcement ratio in the Type 4 detailing indicate that the reinforcementprovided still might be of some use. A closer look at those tests without stirrups (carried out
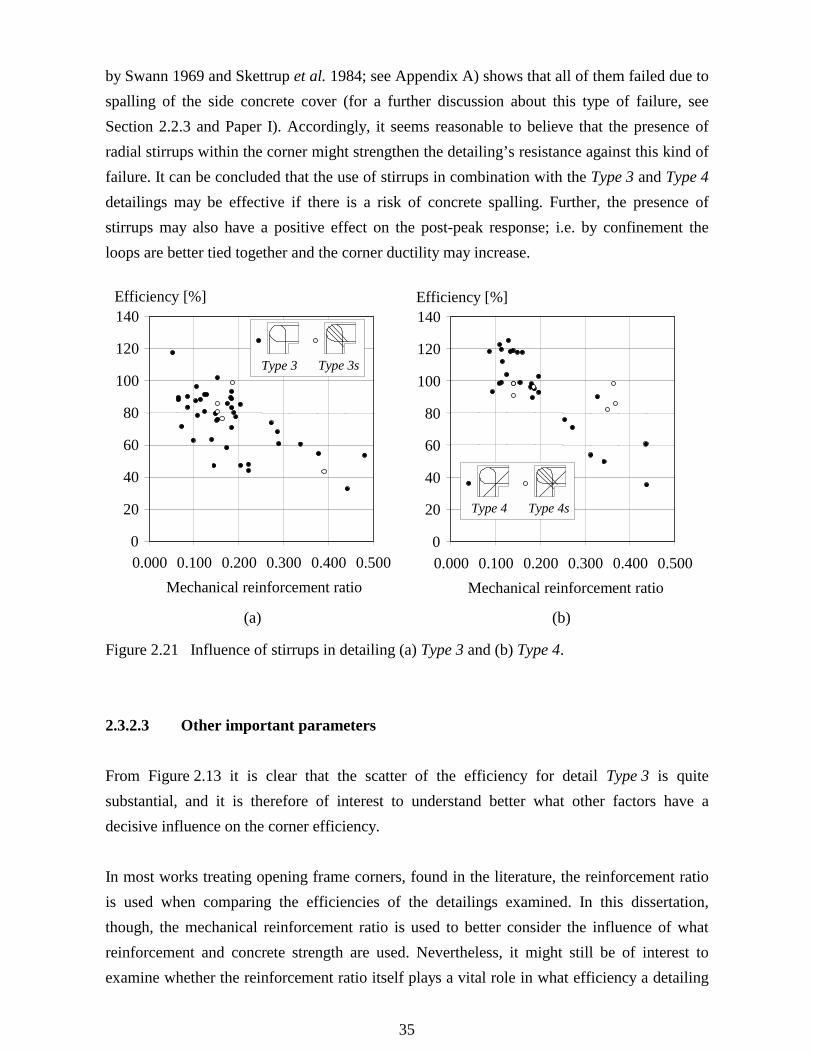
35
by Swann 1969 and Skettrup et al. 1984; see Appendix A) shows that all of them failed due tospalling of the side concrete cover (for a further discussion about this type of failure, seeSection 2.2.3 and Paper I). Accordingly, it seems reasonable to believe that the presence ofradial stirrups within the corner might strengthen the detailing’s resistance against this kind offailure. It can be concluded that the use of stirrups in combination with the Type 3 and Type 4detailings may be effective if there is a risk of concrete spalling. Further, the presence ofstirrups may also have a positive effect on the post-peak response; i.e. by confinement theloops are better tied together and the corner ductility may increase.
0
20
40
60
80
100
120
140
0.000 0.100 0.200 0.300 0.400 0.500Mechanical reinforcement ratio
Efficiency [%]
Type 3 Type 3s
0
20
40
60
80
100
120
140
0.000 0.100 0.200 0.300 0.400 0.500Mechanical reinforcement ratio
Efficiency [%]
Type 4 Type 4s
(a) (b)
Figure 2.21 Influence of stirrups in detailing (a) Type 3 and (b) Type 4.
2.3.2.3 Other important parameters
From Figure 2.13 it is clear that the scatter of the efficiency for detail Type 3 is quitesubstantial, and it is therefore of interest to understand better what other factors have adecisive influence on the corner efficiency.
In most works treating opening frame corners, found in the literature, the reinforcement ratiois used when comparing the efficiencies of the detailings examined. In this dissertation,though, the mechanical reinforcement ratio is used to better consider the influence of whatreinforcement and concrete strength are used. Nevertheless, it might still be of interest toexamine whether the reinforcement ratio itself plays a vital role in what efficiency a detailing
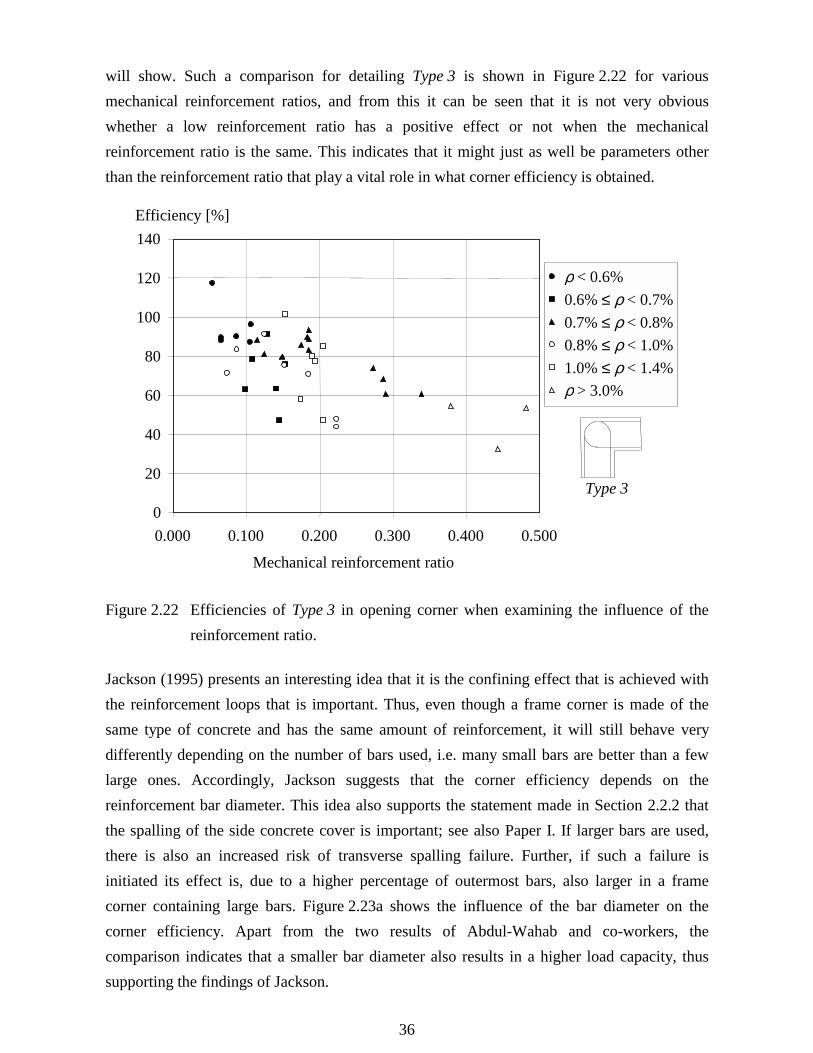
36
will show. Such a comparison for detailing Type 3 is shown in Figure 2.22 for variousmechanical reinforcement ratios, and from this it can be seen that it is not very obviouswhether a low reinforcement ratio has a positive effect or not when the mechanicalreinforcement ratio is the same. This indicates that it might just as well be parameters otherthan the reinforcement ratio that play a vital role in what corner efficiency is obtained.
0
20
40
60
80
100
120
140
0.000 0.100 0.200 0.300 0.400 0.500
Mechanical reinforcement ratio
Efficiency [%]
ρ < 0.6% 0.6% ≤ ρ < 0.7% 0.7% ≤ ρ < 0.8% 0.8% ≤ ρ < 1.0% 1.0% ≤ ρ < 1.4% ρ > 3.0%
Type 3
Figure 2.22 Efficiencies of Type 3 in opening corner when examining the influence of thereinforcement ratio.
Jackson (1995) presents an interesting idea that it is the confining effect that is achieved withthe reinforcement loops that is important. Thus, even though a frame corner is made of thesame type of concrete and has the same amount of reinforcement, it will still behave verydifferently depending on the number of bars used, i.e. many small bars are better than a fewlarge ones. Accordingly, Jackson suggests that the corner efficiency depends on thereinforcement bar diameter. This idea also supports the statement made in Section 2.2.2 thatthe spalling of the side concrete cover is important; see also Paper I. If larger bars are used,there is also an increased risk of transverse spalling failure. Further, if such a failure isinitiated its effect is, due to a higher percentage of outermost bars, also larger in a framecorner containing large bars. Figure 2.23a shows the influence of the bar diameter on thecorner efficiency. Apart from the two results of Abdul-Wahab and co-workers, thecomparison indicates that a smaller bar diameter also results in a higher load capacity, thussupporting the findings of Jackson.

37
In addition, since in the tests presented in Paper I it was concluded that spalling of the sideconcrete cover probably affected the maximum load and the risk of spalling depends on theratio between loop diameter and bar diameter, this relation was also further examined; seeFigure 2.23b. The loop diameter was here assumed to be proportional to the effective height,i.e. the ratio shown is d/φ. These results suggest that a high value of this ratio also results inhigher efficiency. The exception to this is the results reported by Kordina and Fuchs (1970),who obtained rather high efficiencies even though the d/φ ratio was relatively low. Theirspecimens, though, had a width of 700 mm and were reinforced with a total of six bars, whichmay explain the limited influence of a possible transverse spalling failure. Further, one resultfrom Jackson’s test series obtained a low efficiency despite a high value of the ratio d/φ.However, the final crack pattern in this specimen strongly indicates that it spalled on at leastone of its free sides, thus inevitably also decreasing the final efficiency.
0
20
40
60
80
100
120
140
0.000 0.100 0.200 0.300 0.400 0.500Mechanical reinforcement ratio
Efficiency [%]
6 mm8 mm10 mm12 mm16 mm 19 mm
Abdul-W.
Type 3
0
20
40
60
80
100
120
140
0.000 0.100 0.200 0.300 0.400 0.500Mechanical reinforcement ratio
Efficiency [%]
Jackson
Kordina
Type 3
d/φ > 1614 > d/φ ≥ 1612 > d/φ ≥ 1410 > d/φ ≥ 12d/φ = 6.5
(a) (b)
Figure 2.23 Efficiencies of detailing Type 3 in opening corner when examining the influenceof (a) bar diameter, and (b) ratio of effective height and bar diameter.

38
2.3.2.4 Detailings that might attain full efficiency
From the above it is clear that neither of the detailings previously discussed could guaranteefull efficiency when this is defined as in the new evaluation method shown presented inSection 2.1.3. To succeed in this task, it is necessary to ensure that spalling of the outside partof the corner does not occur. As shown in Section 2.3.2.2 the adding of radial stirrups aroundthe reinforcement loops has proven to be insufficient. This is because such reinforcement isunable to prevent the forming of critical cracks at the outside of the corner; instead the cracksevade the reinforcement and propagate behind it. Accordingly, to hinder such cracks thereinforcement bars have to be anchored at the outside of the corner. A detailing that mightfulfil this requirement but which is complicated to carry out is shown in Figure 2.24a. Here,the radial stirrups within the corner are connected to a anchorage plate positioned outside thecorner, thus enabling the reinforcement to counteract the tensile force R, shown in Figure 2.3a,once cracking of the concrete has occurred. The amount of stirrups should then be determinedto correspond to this force R. Further, no extra reinforcement loops or inclined bars should beneeded since the stirrups and anchorage plate then fill their purpose. Finally, eventual splicesof loops and straight bars in the adjoining members should, as discussed in Section 2.3.2.1, bepositioned at a certain distance from the corner to enable the forming of critical cracks in theadjoining members. Whether such a solution would behave as intended, though, has to befurther examined before used in practice. In any case, it is the author’s belief that thisdetailing, due to its rather high complexity, might not be very desirable. Nevertheless, it is stillmentioned here as a possible solution to this complex problem.
anchorage plateconcrete ofhigher quality
(a) (b)
Figure 2.24 Suggestion of possible improvements in the detailings used in opening framecorners.

39
Another way to achieve full efficiency, when using reinforcement loops only, is to make surethat the mechanical reinforcement ratio ωs does not exceed the limit given in equation (2.18).With sufficiently small reinforcement ratios, this might be possible by using concrete ofhigher strength in just the corner region; see Figure 2.24b. Hence, the mechanicalreinforcement ratio in the corner would be determined based on the basis of this higherconcrete strength. Especially fibre-reinforced concrete would then be of great use in such aprocedure, as has also been shown in tests and non-linear finite element analyses of splicedbeams, e.g. Broo and Broo (1997). In addition, due to a more favourable relation between thetensile and compressive strength compared to that of plain concrete, the value of ωcrit derivedin equation (2.18) could be increased when using fibre-reinforced concrete. Further,depending on what fibre amount is used, the considerable increase in fracture energy in suchconcrete implies that a more rectangular stress distribution would be more accurate than thetriangular one assumed in Figure 2.6b. Thus, by using fibre-reinforced concrete within thecorner only, it is reasonable to believe that the mechanical reinforcement ratio that guaranteesyielding of the reinforcement could be considerably increased, probably at least as high asωcrit = 0.060. Abdul-Wahab and Al-Roubai (1998), for instance, obtained an efficiency of 97%when the mechanical reinforcement ratio was 0.089 and the fibre volume used was 1%; seeAppendix A. Thus, the use of higher concrete strength in the corner region can be ofconsiderable advantage. Especially when using prefabricated members such a procedureseems to be a preferable method, while for in situ casting it may perhaps be somewhat moredifficult to realise.
2.3.3 Estimation of corner efficiency in opening corners
2.3.3.1 General remarks
From the comparison of different detailings in opening frame corners presented in Figure 2.13it is evident that the scatter of the efficiencies obtained is quite large. Even so, some attemptshave been made in the literature to propose an expression to estimate the efficiency of framecorners using detailing Type 3 or Type 4. It is the author’s opinion, though, that none havebeen very successful. Although such an expression is not proposed in this dissertation, theattempts previously reported are briefly summarised and discussed. For closing corners,though, it can be concluded that as long as flexural failure is obtained and side concretespalling does not limit the corner capacity, the conventional evaluation method, introduced inSection 2.1.3, is sufficient to use when estimating the expected capacity.
40
2.3.3.2 Equilibrium model
As mentioned above, Nilsson derived an expression that is based on an equilibrium model, seeequation (2.1), and a simplified version of it was presented in Section 2.2.1. Figure 2.25compares the estimated efficiencies determined according to this method with those obtainedin tests of detailing Type 1, Type 2 and Type 3. The estimated efficiencies for detailingsType 1 and Type 3 were determined by calculating the tensile stress in the reinforcement byuse of equation (2.8). For Type 2, though, the influence of the radial stirrups was accountedfor by modifying equation (2.7) as
��
�
�
��
�
��
�
�
+=⋅
++=
2,,
,,
,2
1
12
cos
1
9.0
max
γγ
β
γrsssy
rsrsy
rsctc
sct
R AfAf
AfEEbdf
F (2.18)
before setting it equal to the tensile force R. Here, Es and Ec are the Young’s modulus for steeland concrete, respectively; As,s is the cross-section area of the inclined stirrups and fsy,s is theiryield strength. The tensile stress in the main reinforcement was determined and then used toestimate the related moment capacity. The estimated efficiency was finally obtained bydividing this capacity by the estimated ultimate moment capacity in the critical section asdefined in Section 2.1.3; the efficiency, though, was limited to 100%. From Figure 2.25 it canbe seen that when the estimated efficiency is lower than 60% all but four cases are estimatedon the safe side. However, of the tests for detailings Type 1 and Type 2 in which the estimatedefficiency is higher than this, the method’s prediction is generally on the unsafe side. Whencomparing the test results of the frame corners using reinforcement loops (i.e. Type 3) it isevident, though, that the equilibrium model clearly underestimates their efficiency. Hence, itseems safe to use the expression given in equation (2.10) to determine an upper limit on themechanical reinforcement ratio, where yielding of the reinforcement is guaranteed when usingthe Type 3 detailing.
According to the CEB-FIP Model Code, CEB (1993), the mean tensile strength, ft, can bedetermined as
( ) 3/2830.0 −= ct ff (2.19)

41
Type 2
0
20
40
60
80
100
120
140
0 20 40 60 80 100
Estimated efficiency [%]
Efficiency from test [%]
Expected
Type 3
Type 1
Figure 2.25 Comparison of efficiencies obtained in tests for detailings Type 1, Type 2 andType 3 with that estimated by using a equilibrium model.
where fc is the mean compressive cylinder strength. However, in the range of 15 to 50 MPa, asatisfactory approximation of this expression is
ct ff 075.0≈ (2.20)
If using concrete with higher strength than this, up to strength of 80 MPa, the approximaterelation
ct ff 067.0≈ (2.21)
can be applied instead. Using these approximations together with equations (2.10) and (2.15)it is possible to derive a lower limit of the mechanical reinforcement ratio where the tensilereinforcement yields as
c
sycritcrit f
fρω = ≈ 0.033 when 15 ≤ fc ≤50 MPa (2.22a)
≈ 0.030 when 50 < fc ≤80 MPa (2.22b)
42
2.3.3.3 Empirical expressions
Below, when comparing the efficiencies of tests using detail Type 4, the conventionalevaluation method is used when determining the efficiencies. That is, the increase in estimatedmoment capacity due to the inclined bars is not taken into account, the reason being that thisis the method used when the expressions presented below were originally derived.
Noor (1977) proposed two empirical expressions to estimate the moment capacity Muc forframe corners reinforced with detailing Type 3 or Type 4, respectively, i.e.
( ) cubec
Typeuc fbdM ,
3 42.005.0 ⋅+= ρ (2.23)
and
cubeccubec
syi
Typeuc fbd
f
fM ,
,
4 0035.042.005.0 ⋅�
��
�
�++= ρρ (2.24)
based on his own tests and tests reported by Swann (1969), Mayfield et al. (1972), andNilsson (1973). Here ρ and ρi are the reinforcement ratios of the reinforcement loops and theinclined bars, respectively, and fc,cube is the cube compressive strength of the concrete. Nooralso proposed a lower limit
cubecuc fbdM ,16.0 ⋅≥ (2.25)
determined from test results of frame corners using the Type 1 detailing.
Further, Abdul-Wahab and Al-Roubai (1998) recently proposed an empirical expression toestimate the moment capacity of opening frame corners reinforced with detailing Type 3 orType 4. Here it is also possible to take into account the corner angle α and whether fibre-reinforced concrete (FRC) is used or not:
43
( ) ( )2cos2sin1,
2
αα+⋅
= cubecuc
fbdKM (2.26)
where K = 0.471 (detail Type 3) = 0.769 (detail Type 4) = 0.610 (detail Type 3, FRC) = 0.833 (detail Type 4, FRC)
This expression has certain similarities to the equilibrium model discussed above, in that it
depends on the corner dimensions b and d and also on the concrete strength
( cubecf , corresponds here to the tensile strength ft). However, in the absence of a more
thorough theoretical analysis the coefficient K was based on a total of 35 tests carried out by
Abdul-Wahab and Al-Roubai, and Abdul-Wahab and Salman (1999), to match the positive
effect that the reinforcement loops and possibly inclined bars have on the corner capacity.
A comparison of the corner efficiencies obtained when using these expressions to thatobtained in tests is made in Figures 2.26 and 2.27. From these figures it is also evident that thepredictions made using Noor’s expression are far from satisfactory, the worst case predictingan efficiency of more than 100% (no limitation is given) but not even reaching 40% realefficiency. Consequently, it would be unsafe to use this expression in the design of an openingframe corner. However, Abdul-Wahab and Al-Roubai are rather successful in their attempt topredict a capacity on the safe side. The drawback is that the predictions made in several casesunderestimate the capacity considerably. A major reason for this is that their expression doesnot take into account the amount of reinforcement in the corner or what strength it has, i.e.neglecting two parameters that have proven to have a substantial influence on the cornerefficiency. Although a useful start, such an expression, to be fully satisfying, should also beable to take into account these two important parameters. Further, it is not clear whatminimum ratio of inclined bars must be present in the corner to use the K-value for the Type 4detailing. The amount of inclined reinforcement used in the comparison of detailing Type 4made in Figure 2.27 is never lower than 45% of the main reinforcement. Therefore, it is theauthor’s recommendation that if the inclined reinforcement amount is lower than this thecoefficient K for detailing Type 3 should be used.

44
0
20
40
60
80
100
120
140
0 20 40 60 80 100 120 140
Estimated efficiency [%]
Efficiency from test [%]
Expected
Type 3
Type 4
Figure 2.26 Comparison of efficiencies obtained in tests for detailings Type 3 and Type 4,with the expressions in equations (2.19) and (2.20), respectively, given by Noor(1977).
Expected
Type 3
Type 4
0
20
40
60
80
100
120
140
0 20 40 60 80 100 120 140
Estimated efficiency [%]
Efficiency from test [%]
Figure 2.27 Efficiencies obtained in tests for detailings Type 3 and Type 4 compared with theprediction by equation (2.22) given by Abdul-Wahab and Al-Roubai (1998).
45
2.4 Discussion
2.4.1 Opening corners
2.4.1.1 Choosing detailing
The comparison made in Section 2.3.2.1 of the structural behaviour of opening corners,regarding whether to use inclined bars or not, suggests that if the moment distribution close tothe corner is not constant the adding of inclined bars does not have the effect intended.Consequently, in a real structure the final failure will most likely take place within the cornerregion. This together with the discussion presented in Paper I, shows that the inclined bars canjust as well be replaced by reinforcement loops that are simpler to position, i.e. the detailingproposed in Figure 1.1c. Still, it is important to point out that this solution also is unsuccessfulin guaranteeing full efficiency. However, the aim of adding extra reinforcement loops is toprovide a detailing that leads to a structural response similar to that obtained when using thegenerally accepted detailing using inclined bars proposed by Nilsson (1973). The presence ofsuch extra reinforcement provides an additional strength to the corner so that its final capacitycorresponds to what would have been obtained in the original detailing if fulfilling therequirement of full efficiency. It should be emphasised that even though the capacitiesobtained will be approximately the same, the total structural response will differ. In the lattercase a ductile response similar to that of a reinforced beam would, due to the expectedyielding of the reinforcement, have been the result. In the former, though, final failure willoccur due to loss of anchorage when the compressed concrete outside the loops is pushed off.Due to this, reinforcement yielding is not reached, and accordingly the joint ductility isaffected negatively. Nevertheless, tests by the author of opening corners, presented in Paper I,show that a ductile response is still possible. In two of these tests, the reinforcement loopseven yielded at the inside of the corner but still full efficiency was not obtained. It maytherefore be argued that the statements made in Section 2.2.1 that reinforcement yielding willresult in full efficiency is not true. Yet, this can be explained by the occurrence of sideconcrete spalling in both tests. The bars at which the strain was registered were positioned farfrom the concrete edges and were therefore not affected by the loss of side concrete cover.Instead, the strain in these bars increased in order to balance the external load when the outerreinforcement loops unloaded. Consequently, it can be concluded that while neither of thesedetailings reaches an efficiency of 100%, they may still satisfy the ductility requirement set inSection 2.1.1. If the detailing is based on the recommendations given by Nilsson, in which the
46
amount of inclined bars shall be at least half that of the main reinforcement, equation (2.16)states that an amount of at least 35% extra reinforcement loops can be used instead, i.e.As
* = 1.35As. As a result of the author’s work this solution is also what is now prescribed inthe present Swedish Shelter Regulations, Swedish Rescue Services Agency (1998).
Before continuing the discussion it must be clarified that the use of inclined bars, in astructural sense, is not inferior to the detailing proposed herein, using reinforcement loopsonly. Inclined bars may even result in a better solution since there is then still a chance that thefinal failure will occur outside the corner region. Tests carried out by the author, though (seePaper I), indicated that if a failure does occur within the corner, then the presence of a largeramount of reinforcement loops might have a positive influence on the post-peak ductility. Themajor advantage with the detailing using just reinforcement loops, however, is that it may beconsiderably easier to carry out and also presents some other advantages as initially discussedin Section 1.2. Nevertheless, perhaps the greatest gain is that the designer may now have thefreedom to choose the detailing that he or she thinks fits best. There may for instance be caseswhere it is regarded as easier to add inclined bars to the detailing rather than extrareinforcement loops, and then such a detailing should of course be used.
2.4.1.2 Expected efficiency
In Section 2.3.3.2 it was shown that an upper limit of the mechanical reinforcement ratio, atwhich the tensile reinforcement is guaranteed to yield within the corner, could be derived asωcrit = 0.033. Thus, it would be appropriate to use the Type 3 detailing without adding anyextra reinforcement loops when fulfilling this requirement. However, it seems reasonable thateven though a frame corner with a mechanical reinforcement ratio of, say, 0.040 would needsome extra reinforcement to reach the moment capacity wanted, it would probably not need allthe extra 35% of reinforcement loops as is currently the case. At what ratio the full amount ofextra reinforcement loops needs to be added is not clear, but an attempt is made here to give areasonable estimation that can be used in practice. To do this, the expression proposed byAbdul-Wahab and Al-Roubai (1998) presented in Section 2.3.3.3 is used. If approximating theestimated moment capacity as
Mu = 0.9fsyAs (2.27)
47
and set this equal to the estimated capacity in equation (2.26), it is possible to derive amaximum reinforcement ratio where the efficiency of the detailing reaches 100%. UsingK = 0.471 (i.e. reinforcement loops in plain concrete) and setting α = 90° the maximumreinforcement ratio can be written as
sy
cubec
ff ,349.0=ρ (2.28)
which is similar to the expression derived in equation (2.10). When evaluating the test resultsfrom different researchers the relation between the compressive cube strength andcompressive cylinder strength was set to fc,cube = 1.35fc; see Appendix A. Using the samerelation here, the mechanical reinforcement ratio can be expressed as
cs f
405.0=ω (2.29)
This expression is compared to that derived by the author in Figure 2.28, and from this it isclear that the latter seems to be quite conservative compared to the former. However, this ismainly due to how the expressions were derived. The critical reinforcement ratio proposed bythe author is based on the equilibrium model for the Type 1 detailing presented inSection 2.2.1, while the expression proposed by Abdul-Wahab and Al-Roubai is an empiricalrelation based directly on tests results of the Type 3 detailing. Further, it should be pointed outthat the former has an advantage since it predicts a mechanical reinforcement ratio where thereinforcement is guaranteed to yield before failure of the corner. This is not the case in thelatter expression, which in some cases overestimates the capacity at high-predictedefficiencies. Therefore, the limit of ωs = 0.033 is herein also preferred. Nevertheless, theexpression in equation (2.29) may still be used to estimate at which mechanical reinforcementratio all the extra amount of 35% reinforcement loops must be added. From Figure 2.28 it canbe seen that the value of this expression decreases with increasing value of the compressivestrength. Abdul-Wahab and Al-Roubai give no limit on the concrete strength for using theirexpression. But, the maximum cube strength used in the tests on which they based theirexpression was about 30 to 40 MPa; using the relation fc,cube = 1.35fc,cyl as above, thiscorresponds to a (cylinder) compressive strength of about 22 to 30 MPa. Further, aspreviously stated in Section 2.3.1, the maximum compressive strength used in all the tests thatare compared in Figure 2.13 was approximately 52 MPa. This indicates that the expressionproposed by Abdul-Wahab and Al-Roubai should be valid for concrete strengths up to at least50 MPa. Hence, using fc = 50 MPa in equation (2.29) yields a mechanical reinforce-
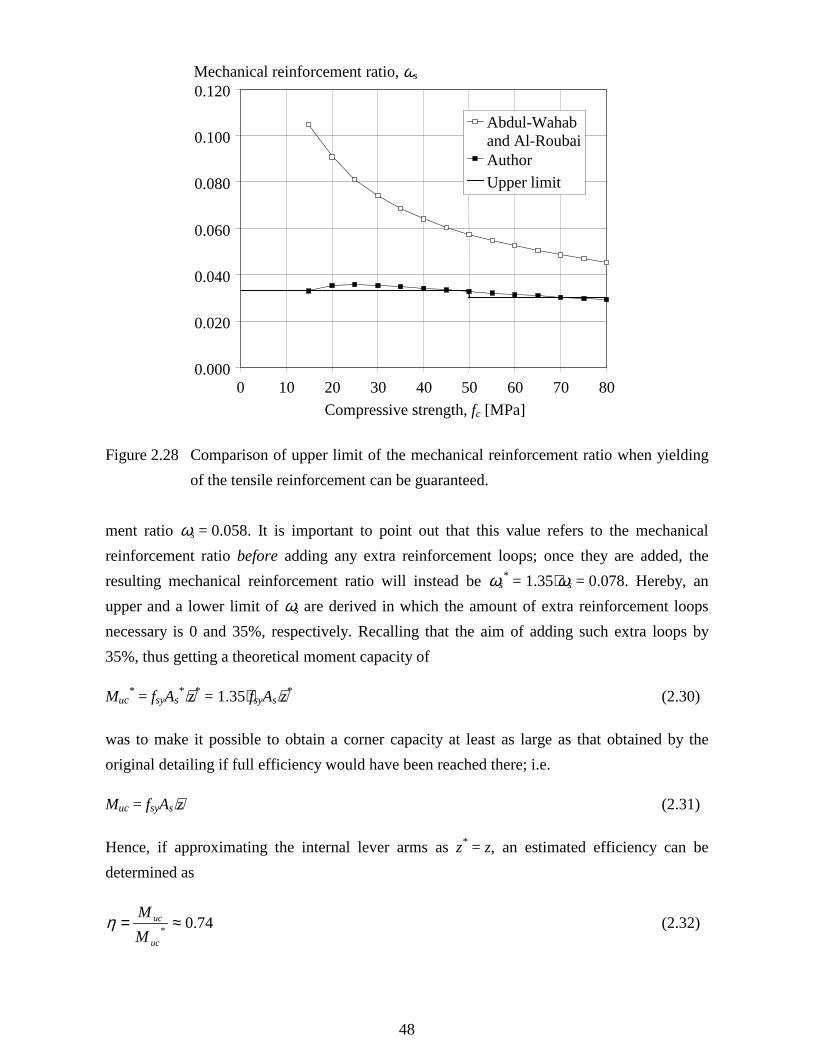
48
0.000
0.020
0.040
0.060
0.080
0.100
0.120
0 10 20 30 40 50 60 70 80Compressive strength, fc [MPa]
Mechanical reinforcement ratio, ωs
Abdul-Wahaband Al-RoubaiAuthorUpper limit
Figure 2.28 Comparison of upper limit of the mechanical reinforcement ratio when yieldingof the tensile reinforcement can be guaranteed.
ment ratio ωs = 0.058. It is important to point out that this value refers to the mechanicalreinforcement ratio before adding any extra reinforcement loops; once they are added, theresulting mechanical reinforcement ratio will instead be ωs
* = 1.35⋅ωs = 0.078. Hereby, anupper and a lower limit of ωs are derived in which the amount of extra reinforcement loopsnecessary is 0 and 35%, respectively. Recalling that the aim of adding such extra loops by35%, thus getting a theoretical moment capacity of
Muc* = fsyAs
*⋅z* = 1.35⋅fsyAs⋅z* (2.30)
was to make it possible to obtain a corner capacity at least as large as that obtained by theoriginal detailing if full efficiency would have been reached there; i.e.
Muc = fsyAs⋅z (2.31)
Hence, if approximating the internal lever arms as z* = z, an estimated efficiency can bedetermined as
74.0* ≈=uc
uc
MMη (2.32)

49
These results can be summarised as shown in Table 2.1. When ωs ≥ 0.058 the minimumefficiency expected is 74% while for ωs ≤ 0.033 it is 100%; between these values a linearinterpolation can be used. However, as mentioned in Section 2.3.1, it is not recommended touse the Type 3 detailing for ωs > 0.200 and, since 35% extra reinforcement loops are added,this means that the maximum ratio allowed before adding such loops is ωs = 0.148.
Table 2.1 Expected efficiency when using different mechanical reinforcement ratios. Valuesare compared to test results in Figure 2.27.
Mechanicalreinforcement
ratio, ωs 1
Amount of extrareinforcement loops, γ
[%]
Resulting mechanicalreinforcement ratio,
ωs* 2
Expectedefficiency, η
[%]0.033 ≤ ωs 0 0.033 ≤ ωs
* 1000.033 < ωs ≤ 0.058 0 < γ ≤ 35 0.033 < ωs
* ≤ 0.078 100 > η ≥ 740.058 < ωs ≤ 0.148 35 0.078 < ωs
* ≤ 0.200 741Before adding extra reinforcement loops.2After adding extra reinforcement loops.
Since the work presented herein was initiated to examine the use of reinforcement detailingsin civil defence shelters, it is also of interest to compare the limits of the mechanicalreinforcement ratio with that allowed in the Swedish Shelter Regulations, Swedish RescueServices Agency (1998). Here, the minimum reinforcement ratio is set to ρ = 0.14%. Further,the concrete used in Swedish shelters shall be of at least strength class K30, resulting in amean compressive cylinder strength of about 27 MPa; the mean yield strength of the hot-rolled deformed bars of type K500 presently used in Sweden is about 550 MPa. Accordingly,the minimum reinforcement ratio in such shelters corresponds to a mechanical reinforcementratio 029.0min ≈shelterω , i.e. somewhat lower than ωs =0.033 proposed in Table 2.1 at whichyielding of the reinforcement is guaranteed prior to corner failure. The maximumreinforcement ratio allowed in the Swedish Shelter Regulations, though, is 1.1%. Combinedwith the mean strength values used above, this results in a mechanical reinforcement ratio
224.0max =shelterω , i.e. a value higher than the upper limit of 0.200. This indicates that if usingsuch high reinforcement ratios, concrete of higher strength than K30 is required to obtain anadequate behaviour of the detailing.

50
2.4.1.3 Use of mechanical reinforcement ratio in the design
Previously it has been discussed what amount of extra reinforcement loops should be added atdifferent mechanical reinforcement ratios. However, so far the value of ωs has always beenbased on the mean strength values for both concrete and reinforcement. It can be justlyargued, though, that it is on the unsafe side to rely entirely on such mean values whendetermining limits to be used in the design. Further, the experimental results referred to hereinwere obtained in tests carried out during a relatively short time; i.e. the tests took not morethan perhaps an hour or two to carry out. To the author’s knowledge, no tests on opening orclosing corners are reported in the literature in which sustained loading has been used.Nevertheless, it is commonly accepted that the strength of concrete usually is lower duringsuch load conditions. In both the Swedish Concrete Code BBK 94, Boverket (1994), and inEurocode 2, CEN (1991), this phenomenon is taken into account by multiplying the concretecompressive strength with a factor of 0.85. In the former, this factor is already built into thecharacteristic values, while in the latter it has to be included within the calculations todetermine the sectional capacity in the ultimate limit state. From this it is clear that it isimportant to discuss how the mechanical reinforcement ratio should be determined in thedesign of a structure. A suggestion of how to do so in the design of concrete frame corners istherefore presented below.
A comparison is again made with the recommendations given by Nilsson (1973) whoconcluded that the Type 4 detailing should be applicable in opening frame corners if thereinforcement ratio was lower than 1.2% and 0.8% when the two different Swedishreinforcement grades Ks40 and Ks60, respectively, were used. In the Swedish Concrete CodeBBK 94, Boverket (1994), this was interpreted as
ykf5≤ρ (2.33)
where fyk is the characteristic yield strength of the reinforcement. Since this value for Ks40and Ks60 was approximately 400 and 600 MPa, respectively, it seems like a sound and ratheraccurate simplification. However, if this reinforcement ratio is to be translated to acorresponding mechanical reinforcement ratio, and thus enable a comparison to the limit ofωs ≤ 0.200 proposed herein, one has to decide what value shall be used for the concretestrength. The concrete strength used by Nilsson varied somewhat, but can generally be said tohave had a mean compressive cube strength of about 25 to 35 MPa. Considering that hiscuring conditions were such that these strengths were perhaps about 5% lower than what
51
would have been obtained using the curing conditions described by the Swedish Standard,BST Byggstandardiseringen (1991), it can be said that this concrete approximatelycorresponds to that obtained in strength class K20 to K30 today.
Since the characteristic yield strength is used in the expression given in equation (2.33) itseems reasonable to use the characteristic strength for concrete too. For concrete of strengthclass K30 this is, according to BBK 94, fck = 21.5 MPa and using this strength results in amechanical reinforcement ratio, based entirely on characteristic values, ωsk = 0.232; i.e. avalue that is somewhat higher than that proposed herein. If instead using the recommendationgiven by Nilsson, this results in ωsk = 0.223 which still is a little bit too high. It is worthnoting, though, that the maximum mechanical reinforcement ratio used by Nilsson newerexceeded 0.200 (see Appendix A), thus satisfying the maximum value of ωs proposed by theauthor.
Therefore, by using the same reasoning as when writing the Swedish concrete codes this,suggests that it should be sufficient to use the characteristic values of concrete andreinforcement to determine ωs. The advantages of using these values are that they are wellknown by designers and that, at least in the Swedish regulations, they also include theinfluence of long-term loading. If following for example Eurocode 2, in which the long-terminfluence is not included in the characteristic values, this effect has to be taken into accountwhen determining ωs.
However, since the idea is that the reinforcement should yield to obtain a fully acceptabledetailing, it is important not to underestimate the reinforcement yield strength. This indicatesthat it might be more correct (i.e. safer) to use the mean yield strength instead of thecharacteristic yield strength when determining what mechanical reinforcement ratio a sectionin a reinforced concrete structure corresponds to. It can also be argued that if yielding is to beobtained in the corner, prior to failure, it should be more correct to use an upper characteristicvalue on the reinforcement yield strength. However, no recommendations of suchcharacteristic values are given in, for example BBK 94, and an approximate value on themean tensile strength is therefore used. Based on experience of reinforcement tests (typeK500) on various bar diameters carried out at the Division of Concrete Structures at ChalmersUniversity of Technology, it is the author’s opinion that the mean yield strength usually is atleast 10% higher than that of the corresponding characteristic strength. Accordingly, themechanical reinforcement ratio could in the design process approximately be determined as

52
ck
yk
ck
sys f
fff ⋅
≈=1.1
ρρω (2.34)
Using this expression to recalculate the mechanical reinforcement ratios of the test results ofdetailing Type 3, the relations shown in Figure 2.29 can be determined. The results are alsocompared to the relation presented in Table 2.1, and this indicates that the limitations andefficiencies presented there should be appropriate to use.
0
20
40
60
80
100
120
140
0.000 0.100 0.200 0.300 0.400 0.500
Mechanical reinforcement ratio
Efficiency [%]
Mean strengthCharacteristic strengthExpected efficiency
Type 3
Figure 2.29 Comparison of test results when the mechanical reinforcement ratio is based onthe mean and characteristic compressive strengths. The “expected efficiency”refers to the values given in Table 2.1.

53
2.4.2 Closing corners
As discussed in Section 2.2.2 the reinforcement detailing in closing frame corners causes farfewer problems than that in opening corners. The test results suggest that both detailingsexamined would be acceptable for mechanical reinforcement ratios as high as ωs = 0.200. Forhigher values, the test data are somewhat too scarce to provide a definite statement. It seemslikely, though, that these detailings will be effective only up to a certain ratio; Stroband andKolpa (1983), for instance, suggest that ωs ≤ 0.240 if crushing of the diagonal compressivestrut is to be avoided. However, of the three failure types mentioned in Section 2.2.2, spallingof the side concrete cover seems to be more dangerous when using spliced reinforcementloops within the corner. Here, it is primarily not the mechanical reinforcement ratio that isimportant, but rather what combination of bending radius, bar diameter, side concrete cover,and concrete and reinforcement strength is used. A very limited comparison with the testsreported in Paper I suggests that the expressions given in the literature may be inadequate touse for spliced reinforcement loops in frame corners. Nevertheless, as discussed inSection 2.2.3, whether this kind of failure is dangerous or not depends very much on thenumber of bars used in the corner; a greater number of small bars is better than large but fewbars. Generally, though, it can be stated that spalling of the side concrete cover is not really aproblem in wall-slab joints, while in beam-column connections it may be of majorimportance. As is the case for opening moment, however, an increase in concrete strengthwithin the corner may be the solution to this kind of problem. When determining themechanical reinforcement ratio in the design of closing moments, the approach described inSection 2.4.1.3 can be used.
As discussed in Section 2.2.1 and shown in Figure 2.13, the Type 1 detailing is veryinefficient for opening corners. This might not be a problem in statically loaded structureswhere it is known that the corner will not be subjected to any opening moments. A civildefence shelter, though, must be able to withstand highly transient loads such as the blastpressure of a bomb exploding nearby. Therefore, the corner regions will also be subjected toboth opening and closing moments. Even though the stresses due to opening moment in acorner may be substantially lower than what it was primarily designed for in closing moment,they may very well still exceed the capacity provided by the Type 1 detailing. The Type 3detailing, though, is able to resist opening moments that are at least about 75% of the closingmoment. Thus, by replacing the conventional detailing (i.e. Type 1) with the new proposal(Type 3), a considerable improvement of the structure’s total behaviour is also obtained.Consequently, this is what has been done in the present Swedish Shelter Regulations.

54
2.5 Concluding remarks
The use of inclined bars in opening frame corners may not be as efficient as commonlythought. Instead the inclined bars may as well be replaced by an equivalent amount of extrareinforcement loops, thus resulting in a detailing that may be considerably easier to carry outat the construction site. Neither detailing, though, fulfils the requirement of full efficiency as itis defined herein (new evaluation method, see Section 2.1.3) unless the mechanicalreinforcement ratio is sufficiently low. It is common to relate the corner efficiency to thereinforcement ratio. However, the results herein show that the reinforcement and concretestrengths also play a vital part for the corner behaviour and, therefore, the use of themechanical reinforcement ratio ωs is a better approach. Further, comparisons of test results onopening corners indicate that the use of many small bars in favour of a few large ones has anadvantageous effect on the corner behaviour. The ratio between the effective height and thebar diameter of the loops also seems to have a positive effect on the efficiency, since thisdecreases the risk of side concrete spalling. An upper limit of the mechanical reinforcementratio, ωs = 0.033, was derived for which full efficiency is guaranteed, provided thatreinforcement loops such as those proposed herein are used. Due to this, some possiblesolutions that may reach higher efficiency are also discussed and it is concluded that perhapsthe best method, if using high reinforcement ratios and full efficiency still is to be achieved, isto increase the concrete strength within the corner. Fibre-reinforced concrete is then believedto be especially advantageous, not least due to its considerably larger fracture energy intension. Moreover, it is concluded that if inclined bars are to be used it is important not tosplice reinforcement loops and straight bars just outside the corner region.
Frame corners subjected to closing moment are less sensitive to which reinforcement detailingis used. Consequently, even though test results indicate that the use of reinforcement loopscauses higher splitting stresses, this detailing has proven to be at least as efficient as theconventional one. An important reason is that the negative influence due to eventual spallingof the side concrete cover will be of minor, if any, importance in a civil defence shelter. Here,a corner region will be confined in the transverse direction due to the three-dimensionalstructure, and if this is not enough, the large numbers of bars in a wall-slab connection in sucha structure ensure that the change in response will be negligible. In a beam-column joint,though, side concrete spalling may become a major problem, so this kind of failure cannot beneglected in such structures. Therefore, it is also a bit worrying that the expressions found indifferent codes do not seem to be fully reliable for predicting the initiation of such splittingcracks when reinforcement loops are used in frame corners. Nevertheless, it was concluded
55
that the use of the new detailing in closing corners is a considerable improvement in a civildefence shelter, since such corners may be subjected to both opening and closing momentsduring the transient loading they are designed to withstand. Consequently, the findingspresented herein strongly suggest that the new reinforcement proposal of splicedreinforcement loops within the corner, introduced in Section 1.1 is suitable to replace theconventional detailings in both opening and closing frame corners in civil defence shelters. Inopening corners, though, an extra amount of up to 35% extra reinforcement may be required.As a result of the work presented here, this detailing is now prescribed in the present SwedishShelter Regulations, Swedish Rescue Services Agency (1998).

56
57
3 Non-linear Finite Element Analyses of ConcreteStructures
3.1 Why use finite element modelling?
When studying the response of a concrete structure subjected to external load, the traditionalway is to carry out experiments in which different parameters are varied. The observationsmade may then be used to propose mechanical or empirical models that can adequatelydescribe the structure’s behaviour. However, not only is this approach quite expensive but itcannot be counted on to give all the information needed. Another approach is to make use ofthe advanced computational techniques available today. By using the non-linear finite elementmethod, in which the concrete material models are based on non-linear fracture mechanics toaccount for cracking, together with plasticity models for the reinforcement steel and theconcrete in compression, the need for experiments can be greatly reduced. In such a finiteelement analysis, it is possible to evaluate the response of a structure more thoroughly thancan be done in an experiment. However, the experiments cannot be replaced completely sincethey are still vital to check whether the finite element simulations correspond to reality. Thismeans that even if both methods have their advantages when used alone, they can become aneven more powerful tool when used together. Accordingly, in combination with theexperiments, the use of non-linear finite element analyses will result in a better understandingand prediction of the mechanical behaviour in a structure during loading to failure.
This chapter tries to give a brief background for the use of non-linear finite element analyseswhen simulating the behaviour of concrete structures. Especially the problems associated withlocalisation, which occurs when a crack is initiated or the peak strength of concrete is reached,are dealt with. Further, results from finite element studies on concrete frame corners arepresented and briefly discussed.
3.2 Fracture mechanics for concrete
The fracture mechanics models commonly used for concrete originate from studies of theinitiation and propagation of a crack in a uniaxial concrete tensile test. In a concrete structure,cracking occurs when the tensile strength of concrete is reached. Figure 3.1 sketches thefailure development of a crack in a concrete specimen subjected to increasing tensiledeformation; a typical mean stress-displacement relation for such a test specimen is shown in

58
Figure 3.2. When the specimen is loaded in tension, microcracks form at local weak points(Figure 3.1b) and under increasing load these microcracks become connected to each otherand are localised to a fracture zone at the weakest section (Figure 3.1c). After the maximumload is reached, the tensile strength in the fracture zone decreases with increasingdeformation, while the strain outside the zone decreases (Figure 3.1d). Eventually, a true crackthat cannot transmit any tensile stresses is formed in the zone (Figure 3.1e). The concretearound the formed crack, which has never reached the tensile strength, will then unloadcompletely and a redistribution of stresses and deformations in the structure takes place.
L
σc = 0
(a)
σc = ft(w = 0)
(c)
σc < ft
(b)
( )1 + ε c L ( )1 + ε c L
( )1 + +ε c L w
(d) (e)
σc = f(w)(0 < w < wu)
( )1 + +ε c L w w
σc = 0(w ≥ wu)
Figure 3.1 Stages in the formation of a crack in a concrete specimen subjected to increasingelongation.
Once a fracture zone has formed, the stress transferred through the zone depends upon thecrack opening w and can be defined as σc = f(w), where f(w) is a function that describes thesoftening behaviour of the concrete; see Figure 3.2. The area under the softening curve, f(w),represents the energy release when concrete cracks and is, according to Hillerborg

59
∆L
εc⋅L cwc
σc
εc cwc
σcσc
εc wwu
GF
σc = f(w)
Figure 3.2 Mean stress-displacement relation for a uniaxial tensile test specimen. Thedisplacement is separated into a stress-strain relation and a stress-crack openingrelation. The area under the softening curve f(w) represents the fracture energy GF.
et al. (1976), the mean energy per unit area of a formed crack. This energy, called the fractureenergy and denoted GF, is an essential concept when modelling cracking in concrete. Fracturemechanics for concrete and concrete structures in general is treated by, for instance, Elfgren(1989), and Hofstetter and Mang (1995).
3.3 Crack models
3.3.1 General
In finite element modelling of cracks in concrete, there are three major concepts for treatingcracks: the discrete crack approach, the smeared crack approach and the embedded crackapproach. In this section, only the principal differences in these approaches are mentioned.More thorough descriptions of them can be found in, for example, Hofstetter and Mang(1995) or Jirasek (1999). A historical background of different crack models is not given hereinbut may be found in, for example, Kwak and Filippou (1990), or de Borst (1995).
Common to all models is that a crack is initiated when it fulfils a so-called crack initiationcriterion. This is usually taken to be when the maximum principal stress reaches the tensilestrength of the material, although there are variants considering, for example, the influence ofthe multiaxial stress state. Once initiated, the crack response is described by a stress-displacement or stress-strain relation based on the fracture energy in the material.

60
3.3.2 Discrete crack models
In the discrete crack approach, the crack is modelled as a geometrical discontinuity andseparate elements are used to simulate the cracks and the material between the cracks. It canbe said that the method lumps the deformation due to cracking into discontinuousdisplacements. The fictitious crack model presented by Hillerborg et al. (1976), in which theconcept of fracture energy was first introduced, is such a model and the crack response is heredescribed by a stress-crack opening relation. However, since separate elements are used tomodel a crack in the discrete crack approach, the possible crack path must be assumed inadvance and the finite element mesh arranged so that the crack path follows the elementboundaries. This is a serious drawback of the approach; a great amount of work is required toestablish the finite element mesh since the user has to decide where and how the cracks mayarise. It also imposes a limitation on the spontaneous crack pattern.
3.3.3 Smeared crack models
According to Rots (1988), the smeared crack approach is the counterpart of the discrete crackapproach. Here, the localised non-linearity of the crack is “smeared” out over the finiteelement, i.e. all the material deformations, including the crack, are considered in the sameelement and hence, cracks may form in each integration point within the element.Accordingly, a cracked solid is modelled as a continuum allowing the cracked material to bedescribed with a stress-strain relation. As this means that the crack pattern need not be takeninto account in advance, the smeared crack approach is a more attractive procedure than thediscrete crack approach. The smeared crack models reported in the literature can besubdivided into the following: fixed orthogonal cracks, fixed non-orthogonal cracks, rotatingcracks and plasticity models.
In the first two kind of model, once a crack is initiated it is permanently locked in a directionperpendicular to the maximum principal stress at the time of initiation. Both methods allowthe formation of additional cracks at the same point. However, as indicated by its name, in afixed orthogonal crack model such cracks may only form perpendicular to already initiatedcracks. In non-orthogonal models, though, this limitation does not exist. Instead, the numberof cracks that may form at an integration point is determined by a threshold angle chosen bythe user. A new crack may only arise if it forms at an angle to already existing cracks thatexceeds the threshold angle. Further, once initiated a fixed crack is never removed. This
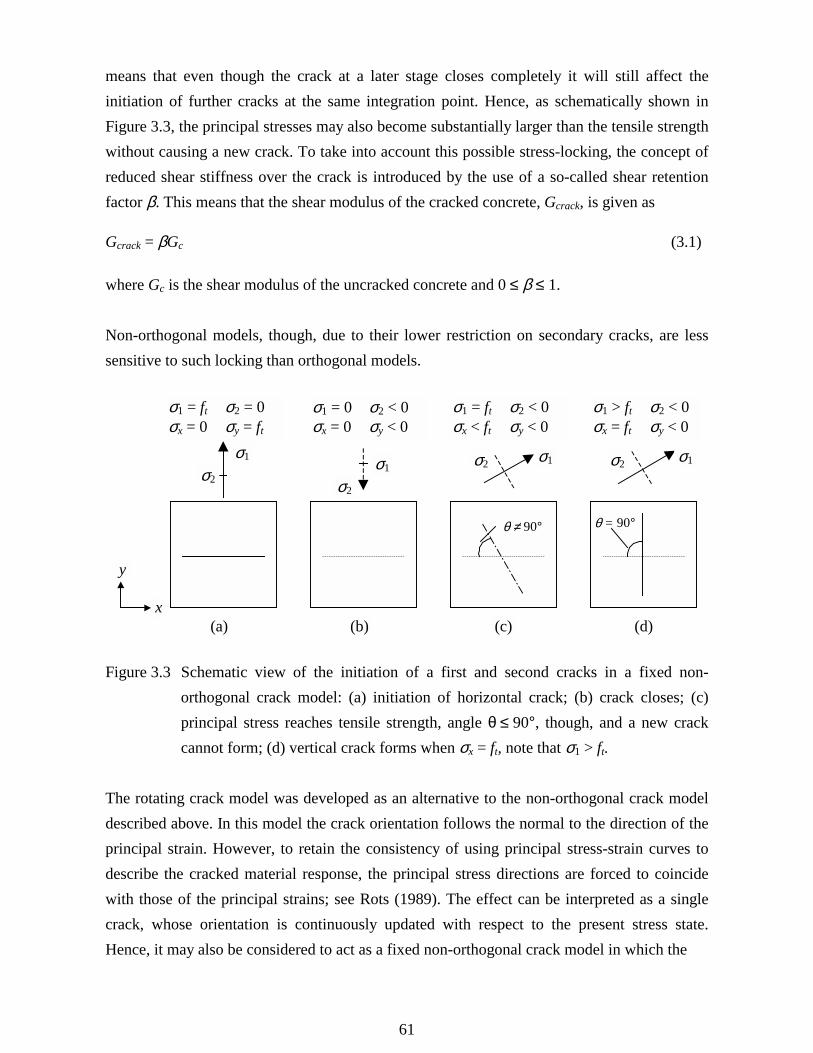
61
means that even though the crack at a later stage closes completely it will still affect theinitiation of further cracks at the same integration point. Hence, as schematically shown inFigure 3.3, the principal stresses may also become substantially larger than the tensile strengthwithout causing a new crack. To take into account this possible stress-locking, the concept ofreduced shear stiffness over the crack is introduced by the use of a so-called shear retentionfactor β. This means that the shear modulus of the cracked concrete, Gcrack, is given as
Gcrack = βGc (3.1)
where Gc is the shear modulus of the uncracked concrete and 0 ≤ β ≤ 1.
Non-orthogonal models, though, due to their lower restriction on secondary cracks, are lesssensitive to such locking than orthogonal models.
σ1 = ft σ2 = 0σx = 0 σy = ft
θ ≠ 90° θ = 90°
σ1 = 0 σ2 < 0σx = 0 σy < 0
σ1 = ft σ2 < 0σx < ft σy < 0
σ1 > ft σ2 < 0σx = ft σy < 0
(a) (b) (c) (d)x
y
σ1 σ1
σ2
σ1σ2 σ1σ2σ2
Figure 3.3 Schematic view of the initiation of a first and second cracks in a fixed non-orthogonal crack model: (a) initiation of horizontal crack; (b) crack closes; (c)principal stress reaches tensile strength, angle θ ≤ 90°, though, and a new crackcannot form; (d) vertical crack forms when σx = ft, note that σ1 > ft.
The rotating crack model was developed as an alternative to the non-orthogonal crack modeldescribed above. In this model the crack orientation follows the normal to the direction of theprincipal strain. However, to retain the consistency of using principal stress-strain curves todescribe the cracked material response, the principal stress directions are forced to coincidewith those of the principal strains; see Rots (1989). The effect can be interpreted as a singlecrack, whose orientation is continuously updated with respect to the present stress state.Hence, it may also be considered to act as a fixed non-orthogonal crack model in which the
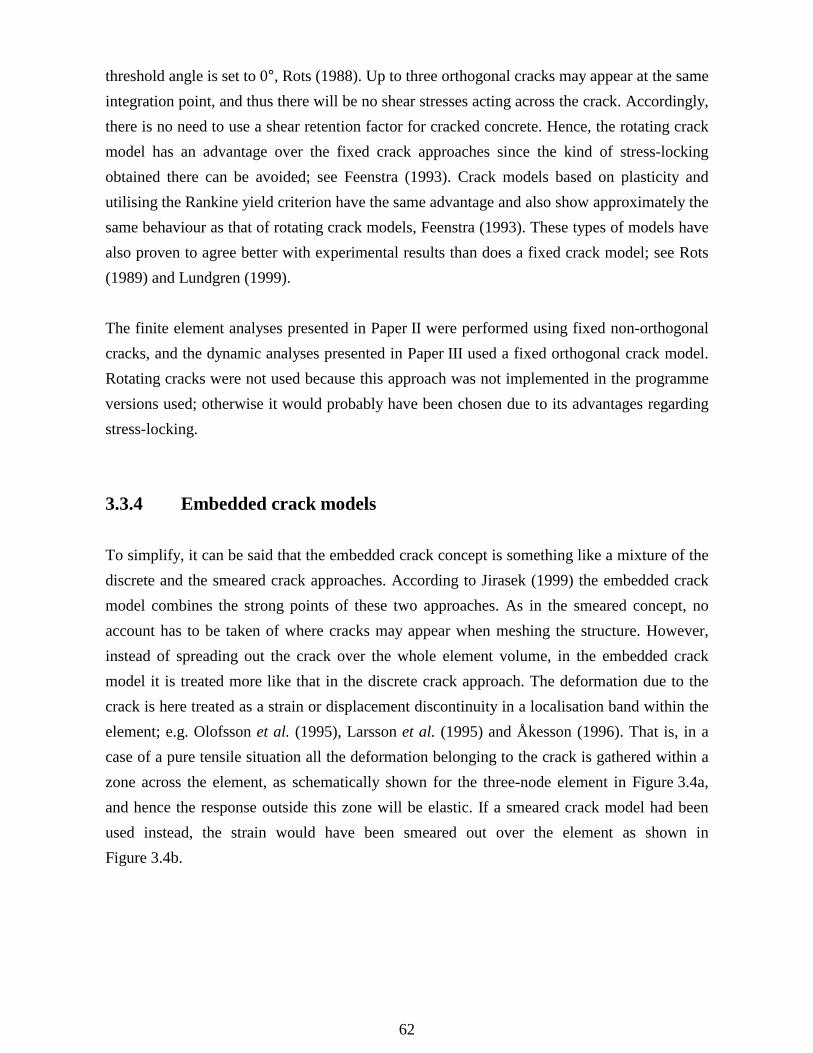
62
threshold angle is set to 0°, Rots (1988). Up to three orthogonal cracks may appear at the sameintegration point, and thus there will be no shear stresses acting across the crack. Accordingly,there is no need to use a shear retention factor for cracked concrete. Hence, the rotating crackmodel has an advantage over the fixed crack approaches since the kind of stress-lockingobtained there can be avoided; see Feenstra (1993). Crack models based on plasticity andutilising the Rankine yield criterion have the same advantage and also show approximately thesame behaviour as that of rotating crack models, Feenstra (1993). These types of models havealso proven to agree better with experimental results than does a fixed crack model; see Rots(1989) and Lundgren (1999).
The finite element analyses presented in Paper II were performed using fixed non-orthogonalcracks, and the dynamic analyses presented in Paper III used a fixed orthogonal crack model.Rotating cracks were not used because this approach was not implemented in the programmeversions used; otherwise it would probably have been chosen due to its advantages regardingstress-locking.
3.3.4 Embedded crack models
To simplify, it can be said that the embedded crack concept is something like a mixture of thediscrete and the smeared crack approaches. According to Jirasek (1999) the embedded crackmodel combines the strong points of these two approaches. As in the smeared concept, noaccount has to be taken of where cracks may appear when meshing the structure. However,instead of spreading out the crack over the whole element volume, in the embedded crackmodel it is treated more like that in the discrete crack approach. The deformation due to thecrack is here treated as a strain or displacement discontinuity in a localisation band within theelement; e.g. Olofsson et al. (1995), Larsson et al. (1995) and Åkesson (1996). That is, in acase of a pure tensile situation all the deformation belonging to the crack is gathered within azone across the element, as schematically shown for the three-node element in Figure 3.4a,and hence the response outside this zone will be elastic. If a smeared crack model had beenused instead, the strain would have been smeared out over the element as shown inFigure 3.4b.
63
t∆L
L
F
Embedded crack Smeared crack
εc1
εelεc2
crackedregion
( )tLtL elc −+⋅=∆ εε 1
LL c ⋅=∆ 2ε
(a) (b)
Figure 3.4 Schematic view of the strain distribution in a three-node element subjected to anelongation ∆L when using (a) an embedded crack model, and (b) a smeared crackmodel.
3.4 Localisation
3.4.1 Tension
As mentioned above, a stress-crack opening relation is often used to simulate the softeningcurve of cracked concrete. There are many proposals of what this relation might look like, butsince the bilinear relation given in Gylltoft (1983) has been used in all analyses in this work, itis also used in the coming discussion. The fracture energy GF and tensile strength ft are hereused to calculate an ultimate crack opening wu where the post-peak stress reaches zero; seePaper II or III. However, since the input data to the crack models used are based on stress-strain, the stress-crack opening relation has to be smeared over a certain distance, the crackextension l. Thereby, the ultimate crack strain εu can be determined as
lfG
lw
t
Fuu
4==ε (3.2)
From this expression it is clear that the value of the crack extension l is just as important asthe fracture energy GF when determining the ultimate crack strain εu. Evidently, the numericalresponse will be accurate only if the width of the softening region obtained in an analysis isequal to the assumed crack extension l. It is therefore a very important issue to accuratelydetermine this length prior to carrying out the analysis.

64
The crack pattern obtained in an analysis does differ from case to case depending on, forexample, geometry, boundary conditions and load conditions. However, in the case ofunreinforced concrete a crack usually localises within a row of elements as schematicallyshown in Figure 3.5a. In such a case, a correct crack extension would be to use the length ofthe element in which the crack localises. If using a smeared crack approach, l is usually set tolelement, the length of the element perpendicular to the crack; see Paper II. However, since thedirection of the crack might be difficult to know in advance, or if cracks form in more thanone direction in the element, a mean value is normally used. A common approximation in atwo-dimensional model is to determine lelement as
elementelement Al = (3.3)
where Aelement is the area of the element in question. Accordingly, in a mesh with differentelement sizes the length l also differs between elements of different size. If instead using theembedded crack model, it is considerably easier to determine this length, since here the widthof the localisation band is what will represent the length lelement. In a reinforced concretestructure, though, it may be more complicated to determine the expected crack extension.
The above reasoning holds true also in a reinforced concrete structure in which the interactionbetween the reinforcement and the surrounding concrete is modelled accurately. In such a casethe cracks will, as schematically shown in Figure 3.5b, appear in a way similar to thatobtained in tests. However, if perfect bond is assumed in the modelling, i.e. if the nodes usedto define the reinforcement and concrete elements are locked to each other so that the strainsin both materials remain the same, the element length can no longer be used to determine thestress-strain relation. Instead of crack localisation, the cracks are to spread out over an evendistance as shown in Figure 3.5c (this presumes, though, that the elements used are smallerthan the mean crack spacing, as is the case in all the analyses carried out in this thesis). Thissmeared zone of cracks will then represent the discrete cracks observed in an experiment.Accordingly, a more satisfactory approximation of the crack extension should be to use themean crack spacing sm; see de Borst (1995), Plos (1995) and Johansson (1996).
However, when the cracks propagate further into the structure, away from the reinforcement,they seem to localise in one or two elements. This suggests that the approximation of thecrack extension as the mean crack spacing is incorrect in these unreinforced regions. Instead itseems more correct to approximate the crack extension as the element length. To furtherexemplify this, Figure 3.6a shows the crack pattern obtained in a closing corner whenassuming perfect bond between reinforcement and concrete (static analysis of shelter,

65
presented in Paper III) and hence, the crack extension was approximated as the mean crackspacing. Still, as can be seen from the obtained crack pattern, this assumption is valid onlyclose to the reinforcement in tension. For the concrete at a certain distance from thereinforcement, it would probably, as illustrated in Figure 3.6b, have been more correct toapproximate the crack extension as the element length.
Reinforced – perfect bond
M
ft
εu,s
mt
Fsu sf
G 14, ⋅=ε
M(c)
σs
εcrack
σs
elementt
Flu lf
G 14, ⋅=ε
ft
εu,l
Unreinforced
MM(a)
εcrackεu,l / 6
3tf
lelement
Reinforced – bond-slip considered
elementt
Flu lf
G 14, ⋅=ε
ft
εu,l
MM(b)
σs
εcracksm reinforcement
reinforcement
Figure 3.5 Schematic view of crack patterns obtained when modelling unreinforced andreinforced concrete. Filled line shows the stress-strain relation used; dashed linesare shown for comparison only.
From the discussion above it might seem that there may only be problems with localisationwhen assuming perfect bond. However, this is not true. Depending on, for instance, the sizeand orientation of the elements used and what load case is studied, one cannot be sure that thecracks will localise within one element even though accurately modelling the bond-sliprelation; see for example Johansson (1997) and Lundgren (2000). Neither will the difficultyautomatically be resolved by using the embedded crack model (Magnusson 2000), since it willencounter the same type of problem as the smeared crack approach, perhaps making itnecessary to adjust the stress-strain relation used here too.

66
q
l ≈ sm
l ≈ lelement
reinforcement
q = 50 kN/m2
q = 100 kN/m2
(a) (b)
Figure 3.6 (a) Crack pattern in closing corner when assuming perfect bond; (b) approxi-mation of crack extension l that should be rather accurate.
To summarise, if the crack extension is assumed as the mean crack spacing and this length islarger than the length of the elements used, the results obtained will probably be somewhat toobrittle. On the other hand, by approximating the crack extension as the element length, theresponse will most likely be somewhat too ductile, even though the interaction betweenconcrete and reinforcement is accurately dealt with. Hence, it may be important to carry out asensitivity study to more thoroughly examine what influence the stress-strain relation used hason the response of the structure studied. A quite approximate way to do this is to vary thecrack extension l used by, say, a factor of two: halved when using perfect bond and doubledwhen modelling the bond-slip. If this change has little effect on the result, then the analysis ismore likely to be trusted. However, if such a change has large impact on the structuralresponse one should be careful when interpreting the results. A correct approach would thenbe to modify the crack extension originally used in those parts where the assumptions provedto be invalid. A new analysis than has to be carried out and the validity of the assumptionschecked. Evidently, this may lead to a cumbersome iteration process that may be quite time-consuming. But, if the post-peak ductility in tension proves to be vital, it may be the only wayto obtain correct results.

67
3.4.2 Compression
That cracking can cause localisation problems may be easy to understand, but that this is alsothe case with concrete in compression might perhaps not be as obvious. Nevertheless, it hasbeen stated by several researchers (e.g. van Mier 1984; Hillerborg 1988; van Mier et al. 1997;Lee and Willam 1997) that the post-peak response for compressed concrete is a localisedphenomenon. Van Mier showed that the post-peak ductility, among other things, depends onthe height of the concrete specimen used. Figure 3.7a shows the normalised stress-strainrelation for uniaxial compressive tests on concrete prisms of height 50, 100 and 200 mm.According to this, a specimen with smaller height results in greater ductility. However, ifinstead comparing the displacement in the same specimens, the relations shown in Figure 3.7bare obtained. Consequently, it can be concluded that the corresponding stress-strain relationsdo not represent the concrete material behaviour but just a structural effect. The similarity toconcrete in tension and the concept of fracture energy comes to mind. Hence, it seemsreasonable to solve this in a way similar to that for concrete in tension, that is, introducefracture energy for concrete in compression. This was done by, for example, Markeset (1993)and Feenstra (1993). However, the use of fracture energy is not enough, since as in the case ofcracking, it is a displacement and not a strain that must be simulated. Therefore, there is also aneed of a softening zone in which the localisation in compression may occur (compare the useof the crack extension l for cracking).
The stress-strain relations for concrete in compression given in the literature, e.g. CEB-FIPModel Code, CEB (1993), normally use the mean strain in the specimen and are therefore notsuitable to be used as input data for finite element analyses in which the softening of concreteis to be simulated. Such relations, i.e. the measured displacement divided by the height of thespecimen (300 mm in CEB-FIP Model Code), do not take into account that a localisationoccurs in the material. Nevertheless, up to the maximum strength this is an appropriateapproximation since the strain in the concrete thus far is quite homogeneous distributed.However, when reaching the post-peak part this is no longer the case and the materialbehaviour will be incorrect to use. If, for example, applying such a stress-strain relation in afinite element analysis where the softening zone in the analysis becomes 50 mm, this meansthat the post-peak relation given will be 300 / 50 = 6 times too steep. Not only does this resultin a more brittle behaviour, but it may also lead to such numerical difficulties that a solutioncannot be found. This is what happened in the finite element analyses presented in Paper II,and is also the reason why the post-peak stress-strain relation for concrete in compressionthere was modified in some of the analyses.

68
0.0
0.2
0.4
0.6
0.8
1.0
1.2
0 2 4 6 8 10Strain [‰]
height 50 mmheight 100 mmheight 200 mm
σc / fc
0.0
0.2
0.4
0.6
0.8
1.0
1.2
0.0 0.1 0.2 0.3 0.4 0.5 0.6Displacement [mm]
height 50 mmheight 100 mmheight 200 mm
σc / fc
(a) (b)
Figure 3.7 Post-peak behaviour of concrete prisms subjected to uniaxial compression:(a) normalised stress-strain relation; (b) normalised stress-displacement relation.Based on van Mier (1984).
If it is known over what length the concrete softening will take place in an analysis, it is easyto make the necessary modifications in the post-peak part of the stress-strain relation.Unfortunately, though, this length is generally unknown. For concrete in tension this lengthmay, if accurate bond-slip relations are used as discussed in Section 3.4.1, be comparably easyto approximate to the element length. This is possible since the localisation due to crackingthen generally occurs within one row of elements. However, for concrete in compression, thisis usually not the case. The softening zone will here instead be smeared out over a number ofelements, making it much more difficult to determine. Therefore, it is necessary to use alength larger than the element length to accurately consider the post-peak behaviour incompression. If this turns out to be important for the response that is to be studied, an iterativeprocedure similar to that proposed for concrete in tension may be carried out.
3.4.3 Possible solution
From the above it is evident that the localisation problems described are important issues to beresolved if more reliable finite element tools are to be obtained. A quite cumbersome andtime-consuming iterative procedure was proposed above as an approximate way to handle this
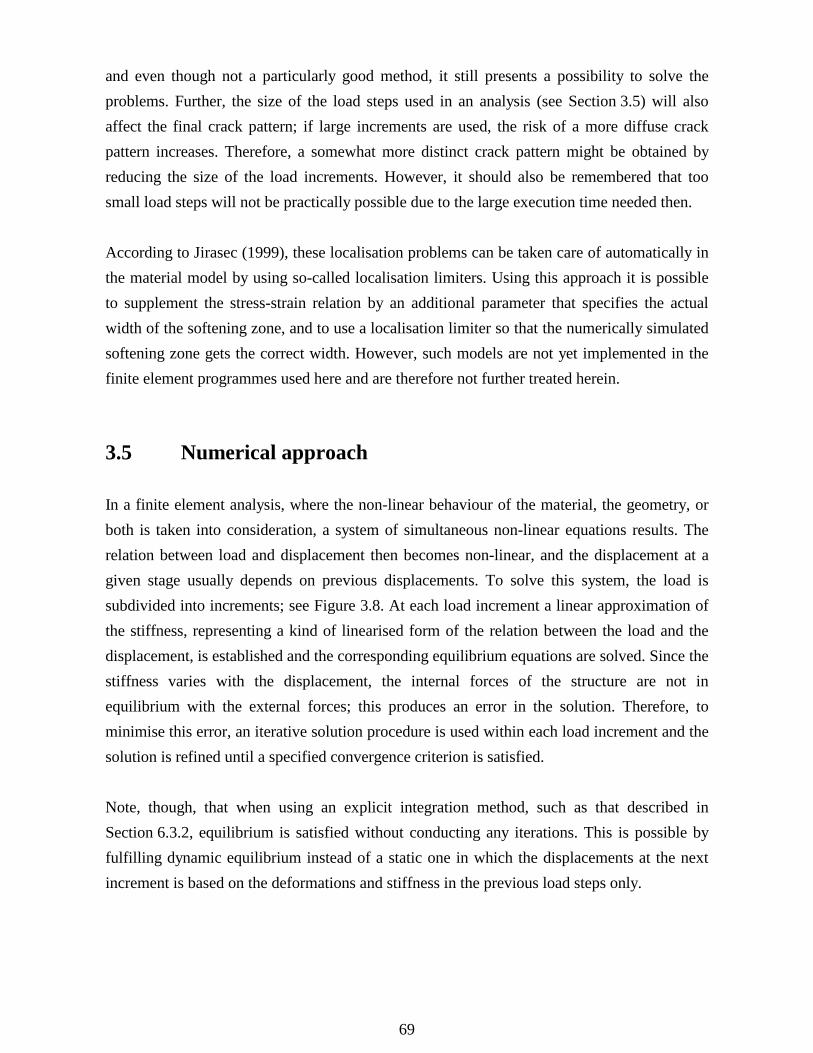
69
and even though not a particularly good method, it still presents a possibility to solve theproblems. Further, the size of the load steps used in an analysis (see Section 3.5) will alsoaffect the final crack pattern; if large increments are used, the risk of a more diffuse crackpattern increases. Therefore, a somewhat more distinct crack pattern might be obtained byreducing the size of the load increments. However, it should also be remembered that toosmall load steps will not be practically possible due to the large execution time needed then.
According to Jirasec (1999), these localisation problems can be taken care of automatically inthe material model by using so-called localisation limiters. Using this approach it is possibleto supplement the stress-strain relation by an additional parameter that specifies the actualwidth of the softening zone, and to use a localisation limiter so that the numerically simulatedsoftening zone gets the correct width. However, such models are not yet implemented in thefinite element programmes used here and are therefore not further treated herein.
3.5 Numerical approach
In a finite element analysis, where the non-linear behaviour of the material, the geometry, orboth is taken into consideration, a system of simultaneous non-linear equations results. Therelation between load and displacement then becomes non-linear, and the displacement at agiven stage usually depends on previous displacements. To solve this system, the load issubdivided into increments; see Figure 3.8. At each load increment a linear approximation ofthe stiffness, representing a kind of linearised form of the relation between the load and thedisplacement, is established and the corresponding equilibrium equations are solved. Since thestiffness varies with the displacement, the internal forces of the structure are not inequilibrium with the external forces; this produces an error in the solution. Therefore, tominimise this error, an iterative solution procedure is used within each load increment and thesolution is refined until a specified convergence criterion is satisfied.
Note, though, that when using an explicit integration method, such as that described inSection 6.3.2, equilibrium is satisfied without conducting any iterations. This is possible byfulfilling dynamic equilibrium instead of a static one in which the displacements at the nextincrement is based on the deformations and stiffness in the previous load steps only.
70
4∆tF
3∆tF
2∆tF
∆tF
u
F
∆F
∆F
∆F
∆F
Figure 3.8 Increasing error of the solution when using the incremental load method withoutcorrection for a system with one degree of freedom.
There are several different iteration methods available that can be used in the solution process.The general procedure, though, is the same for all iteration methods; the difference is in howthe stiffness matrix is determined. The iterative methods can be divided roughly into threecategories: the tangent stiffness method, the initial stiffness method and the secant stiffnessmethod, see Figure 3.9. In the tangent stiffness method, the stiffness matrix is determined ateach iteration, resulting in a method that requires few iterations, but where every iteration isrelatively time-consuming. In the initial stiffness method, the stiffness is determined at thebeginning of each load step and it is then used throughout the whole iteration process withinan increment. This method requires more iterations to reach convergence than the tangentstiffness method but, since the same stiffness matrix is used in each iteration within theincrement, every iteration is faster. The secant stiffness method uses the information fromprevious solutions to update the inverse stiffness matrix in each iteration, which results in aconvergence rate somewhere between that of the tangent and the initial stiffness methods. Theiteration methods used in the analyses presented here were the Modified Newton-Raphsonmethod (initial stiffness method) and the BFGS method (secant stiffness method). Of these,the latter were found to encounter fewer numerical problems when used. Further informationon these iteration methods can be found in for instance Bathe (1996).
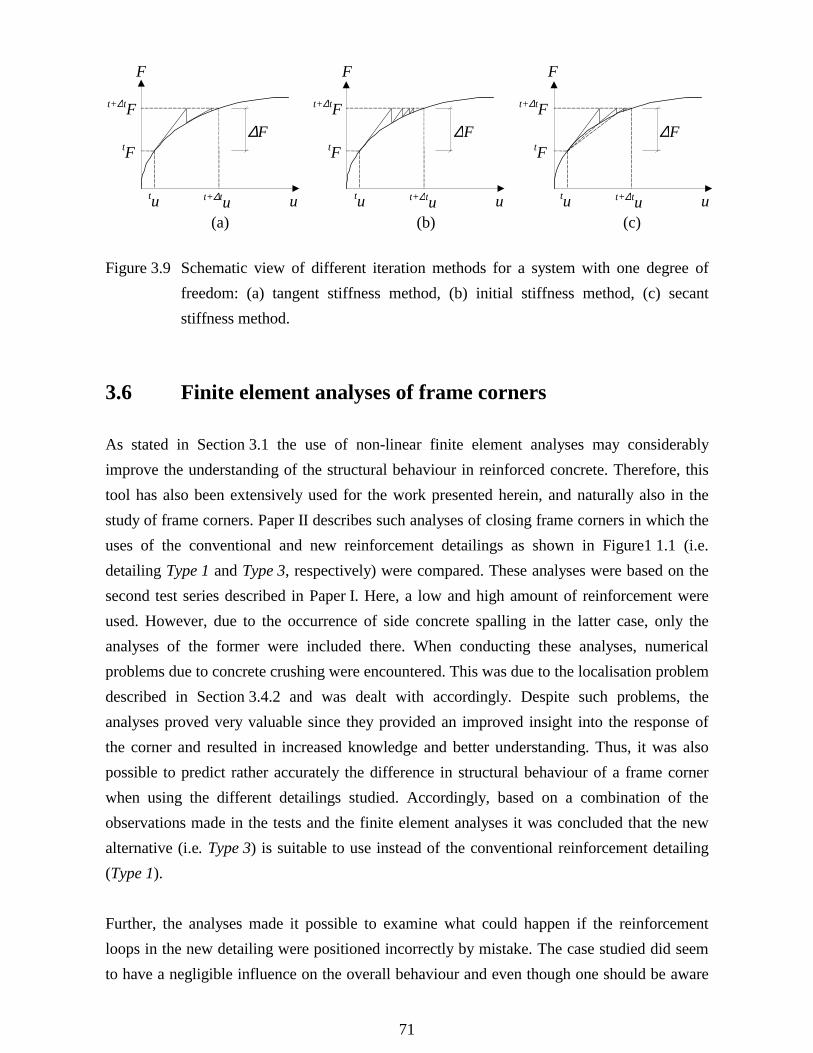
71
t+∆tu utu
t+∆tF
F
tF
(a)
∆F
u(b)
t+∆tutu
t+∆tF
F
tF∆F
t+∆tu utu
t+∆tF
F
tF
(c)
∆F
Figure 3.9 Schematic view of different iteration methods for a system with one degree offreedom: (a) tangent stiffness method, (b) initial stiffness method, (c) secantstiffness method.
3.6 Finite element analyses of frame corners
As stated in Section 3.1 the use of non-linear finite element analyses may considerablyimprove the understanding of the structural behaviour in reinforced concrete. Therefore, thistool has also been extensively used for the work presented herein, and naturally also in thestudy of frame corners. Paper II describes such analyses of closing frame corners in which theuses of the conventional and new reinforcement detailings as shown in Figure1 1.1 (i.e.detailing Type 1 and Type 3, respectively) were compared. These analyses were based on thesecond test series described in Paper I. Here, a low and high amount of reinforcement wereused. However, due to the occurrence of side concrete spalling in the latter case, only theanalyses of the former were included there. When conducting these analyses, numericalproblems due to concrete crushing were encountered. This was due to the localisation problemdescribed in Section 3.4.2 and was dealt with accordingly. Despite such problems, theanalyses proved very valuable since they provided an improved insight into the response ofthe corner and resulted in increased knowledge and better understanding. Thus, it was alsopossible to predict rather accurately the difference in structural behaviour of a frame cornerwhen using the different detailings studied. Accordingly, based on a combination of theobservations made in the tests and the finite element analyses it was concluded that the newalternative (i.e. Type 3) is suitable to use instead of the conventional reinforcement detailing(Type 1).
Further, the analyses made it possible to examine what could happen if the reinforcementloops in the new detailing were positioned incorrectly by mistake. The case studied did seemto have a negligible influence on the overall behaviour and even though one should be aware
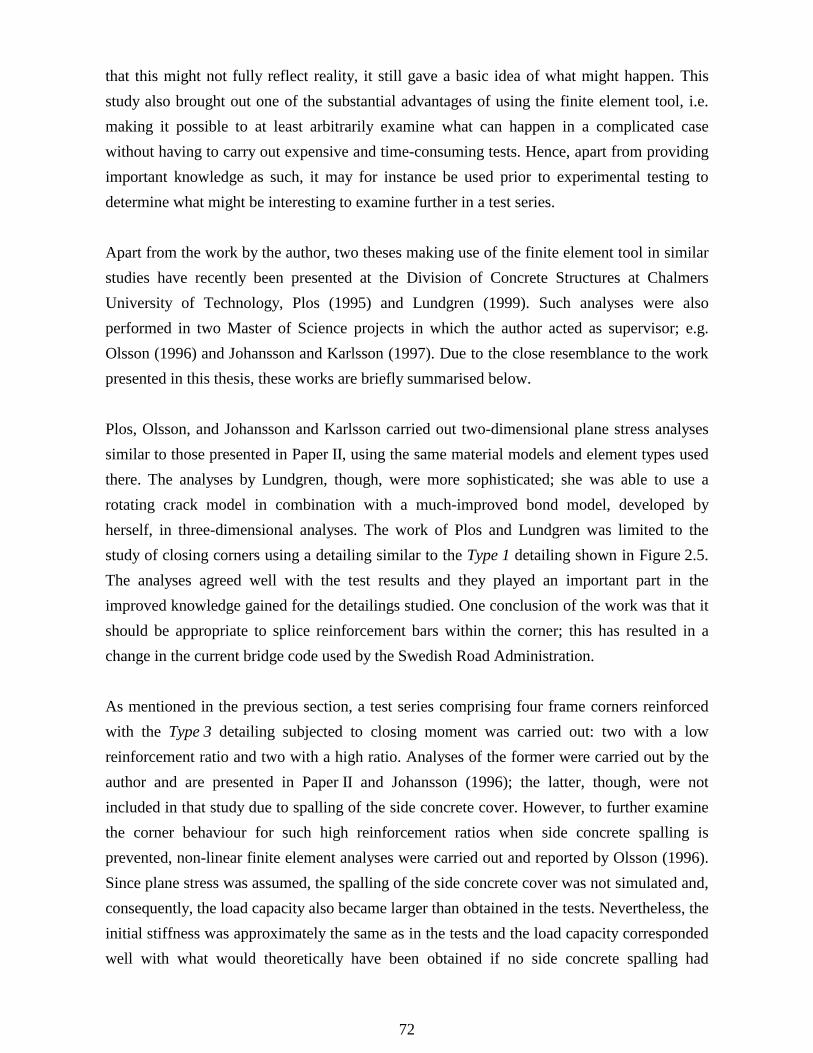
72
that this might not fully reflect reality, it still gave a basic idea of what might happen. Thisstudy also brought out one of the substantial advantages of using the finite element tool, i.e.making it possible to at least arbitrarily examine what can happen in a complicated casewithout having to carry out expensive and time-consuming tests. Hence, apart from providingimportant knowledge as such, it may for instance be used prior to experimental testing todetermine what might be interesting to examine further in a test series.
Apart from the work by the author, two theses making use of the finite element tool in similarstudies have recently been presented at the Division of Concrete Structures at ChalmersUniversity of Technology, Plos (1995) and Lundgren (1999). Such analyses were alsoperformed in two Master of Science projects in which the author acted as supervisor; e.g.Olsson (1996) and Johansson and Karlsson (1997). Due to the close resemblance to the workpresented in this thesis, these works are briefly summarised below.
Plos, Olsson, and Johansson and Karlsson carried out two-dimensional plane stress analysessimilar to those presented in Paper II, using the same material models and element types usedthere. The analyses by Lundgren, though, were more sophisticated; she was able to use arotating crack model in combination with a much-improved bond model, developed byherself, in three-dimensional analyses. The work of Plos and Lundgren was limited to thestudy of closing corners using a detailing similar to the Type 1 detailing shown in Figure 2.5.The analyses agreed well with the test results and they played an important part in theimproved knowledge gained for the detailings studied. One conclusion of the work was that itshould be appropriate to splice reinforcement bars within the corner; this has resulted in achange in the current bridge code used by the Swedish Road Administration.
As mentioned in the previous section, a test series comprising four frame corners reinforcedwith the Type 3 detailing subjected to closing moment was carried out: two with a lowreinforcement ratio and two with a high ratio. Analyses of the former were carried out by theauthor and are presented in Paper II and Johansson (1996); the latter, though, were notincluded in that study due to spalling of the side concrete cover. However, to further examinethe corner behaviour for such high reinforcement ratios when side concrete spalling isprevented, non-linear finite element analyses were carried out and reported by Olsson (1996).Since plane stress was assumed, the spalling of the side concrete cover was not simulated and,consequently, the load capacity also became larger than obtained in the tests. Nevertheless, theinitial stiffness was approximately the same as in the tests and the load capacity correspondedwell with what would theoretically have been obtained if no side concrete spalling had
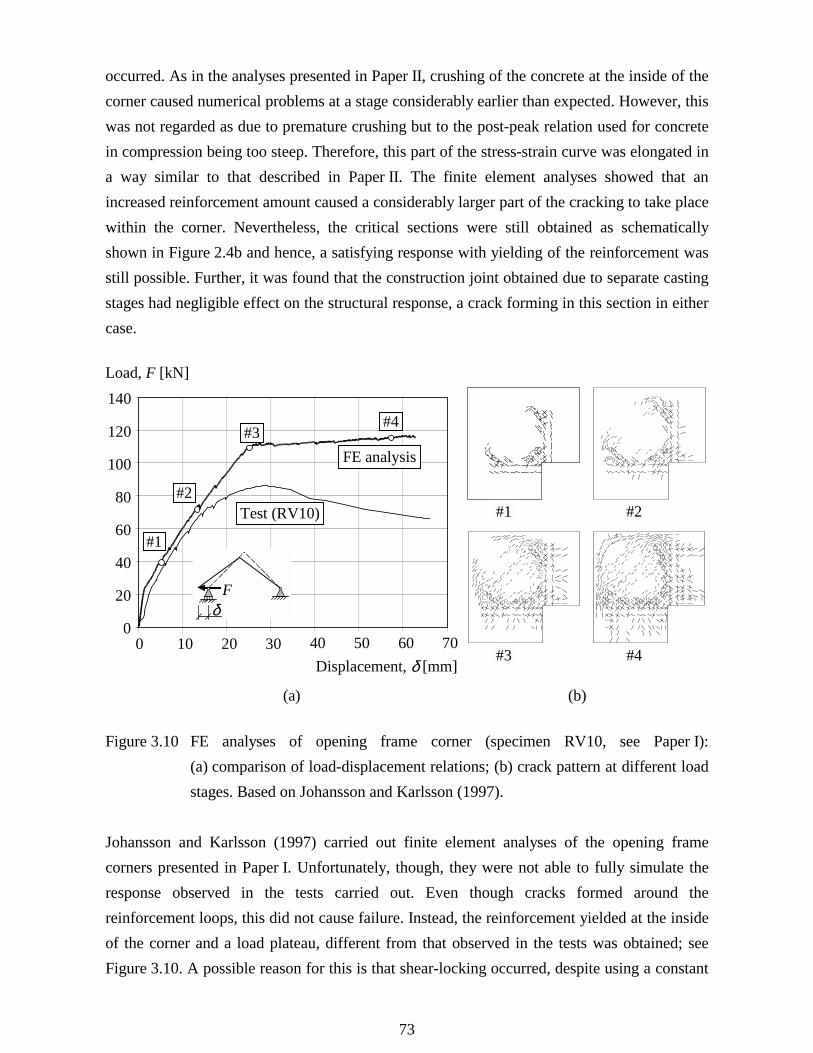
73
occurred. As in the analyses presented in Paper II, crushing of the concrete at the inside of thecorner caused numerical problems at a stage considerably earlier than expected. However, thiswas not regarded as due to premature crushing but to the post-peak relation used for concretein compression being too steep. Therefore, this part of the stress-strain curve was elongated ina way similar to that described in Paper II. The finite element analyses showed that anincreased reinforcement amount caused a considerably larger part of the cracking to take placewithin the corner. Nevertheless, the critical sections were still obtained as schematicallyshown in Figure 2.4b and hence, a satisfying response with yielding of the reinforcement wasstill possible. Further, it was found that the construction joint obtained due to separate castingstages had negligible effect on the structural response, a crack forming in this section in eithercase.
0
20
40
60
80
100
120
140
0 10 20 30 40 50 60 70Displacement, δ [mm]
Load, F [kN]
#1 #2
#3 #4
#1
#2
#3#4
FE analysis
Test (RV10)
(a) (b)
δF
Figure 3.10 FE analyses of opening frame corner (specimen RV10, see Paper I):(a) comparison of load-displacement relations; (b) crack pattern at different loadstages. Based on Johansson and Karlsson (1997).
Johansson and Karlsson (1997) carried out finite element analyses of the opening framecorners presented in Paper I. Unfortunately, though, they were not able to fully simulate theresponse observed in the tests carried out. Even though cracks formed around thereinforcement loops, this did not cause failure. Instead, the reinforcement yielded at the insideof the corner and a load plateau, different from that observed in the tests was obtained; seeFigure 3.10. A possible reason for this is that shear-locking occurred, despite using a constant

74
shear retention value of 0.05, and prevented the failure from developing as expected; if therotating crack concept had been used instead, a more realistic response might have been theresult. Another probable reason for the different behaviour is that the two-dimensional planestress model used to model the concrete was unable to take into account the loss of capacitydue to the probable spalling initiation of the side concrete cover. Hence, all reinforcement barswere fully active in the analyses, while this most probably was not the case in the tests; seePaper I. Nevertheless, the analyses supported the conclusion drawn in Section 2.3.2.1 that theinclined bars used in the Type 4 detailing may be replaced by an extra amount ofreinforcement loops, thus transforming it into a Type 3 detailing.
When studying the literature regarding the research on concrete frame corners, it is evidentthat most work carried out so far has been done by experimental studies. This is not thatsurprising since most research within the field was carried out from the late 1960s until theearly 1980s and the availability of robust and reliable concrete material models are relativelynew. Nevertheless, non-linear finite element analyses have also been used to some degree asshown in the previous two sections. Other researchers who have used non-linear finiteelement analyses to study the behaviour in frame corners are Krauthammer and co-workers,e.g. Marx (1993), Otani and Krauthammer (1997), and Ku and Krauthammer (1999); asummary of the results gained is given in Krauthammer (1998). Both two-dimensional andthree-dimensional analyses of a concrete structure subjected to an internal explosion (i.e.opening moment) were made. As further discussed in Section 4.1, the pressure in such a loadcase is highly dynamic and thus very different from a static one. The dimensions of thestructure studied were very large; see Figure 3.11. Especially notable is the large amount ofinclined reinforcement, its amount being about five times that of tensile reinforcement at theinside of the smaller adjoining member, which was determined from the connection’s shearcapacity, see Marx (1993). Different reinforcement detailings were investigated; among otherthings, the influence of stirrups in the adjoining member and within the corner was examined.Further, the amount of inclined bars and their distance to the outside of the corner werevaried.

75
6000 975
3750
900
1φ22 1φ35
1φ35
1φ25
2φ35stirrups φ16
s150 mm stirrupsφ12
stirrups φ16s150 mm
[mm]
Figure 3.11 Approximate dimensions of frame corner studied by Krauthammer and co-workers. The reinforcement amounts given are valid for a strip of width 100 mm.The plastic zones obtained are marked with grey. Based on Krauthammer (1998).
In none of the analyses did the corner fail due to loss of the outside part of the corner, i.e. thetype of failure commonly observed in static tests; see Section 2.2.1. Whether this was due tothe impulse loading, the concrete model being unable to capture this type of failure, or tosomething else is not clear. Nevertheless, failure was instead obtained due to rupture of thereinforcement at the inside of the corner or, more commonly, failure within a plastic hingeformed in the region where the inclined bars reached the compressive zone; see Figure 3.11. Apossible explanation for this response is that the amount of inclined bars in the corner was somuch larger than that of the tensile reinforcement that the capacity of the plastic hinges wasreached before the inside of the corner. Nevertheless, Krauthammer (1998) states that theresults “confirmed that a connection detail based on static design should not be expected tosurvive the severe loading associated with explosive loads.” However, based on thereinforcement detailing used and the fact that concrete failure was not obtained within thecorner, it seems to be a sound interpretation that the detailing itself was not insufficient.Instead, the results suggest that the design method used underestimated the amount of tensilereinforcement needed in both the corner and the adjoining members, and that this is the reasonwhy failure was obtained in most of the cases examined.
76
3.7 Concluding remarks
It has been shown that non-linear finite element analyses can be a very powerful tool in thestudy of reinforced concrete structures, for instance in the study of opening or closing framecorners. However, it is important to be aware that such analyses cannot completely replace theneed of experimental testing; tests will always be needed since they describe the reality whilethe former just attempts to simulate it. Hence, certain phenomena may be observed in a testthat the material models or element types used in the analyses are unable to reproducecorrectly. On the other hand, though, finite element analyses may supply the means for furtherunderstanding and an extensive increase in knowledge of the often complicated response inreinforced concrete structures. Hence, this tool may make it possible to explain phenomena ina way that would simply not be possible by using only conventional testing and evaluationmethods. Further, it must be pointed out that even though the analyses may be unable todescribe the response quite correctly, they can still often be successfully employed to give theuser a basic idea of what behaviour may be expected in a given situation. Non-linear finiteelement analyses may therefore also be a very useful tool when determining what experimentsshould be carried out. Consequently, it can be concluded that the two methods are used totheir fullest advantage only when combined.
Several different crack models are available today in commercial finite element programmes,making it possible to obtain rather reliable results in analyses of reinforced concretestructures. However, the use of such an advanced tool also puts a high demand on the user.Without awareness of what the given input means and the ability to critically examine theresults, it may lead to critical misjudgements in the interpretation of the response obtained.The post-peak behaviours for concrete in tension and compression, for instance, are bothhighly localised phenomena, making it difficult to determine a correct stress-strain relation touse in an analysis. To be able to simulate such a response accurately, the concept of fractureenergy and the length of the softening region have to be considered. Hence, if one is not awareof this or how to handle it the results obtained may be quite incorrect. Even for an experienceduser such localisation may still cause substantial problems in the modelling of a structure.This, then, is a field of great importance that is still to be elucidated.

77
4 Structural Behaviour at Dynamic Loading
4.1 General remarks
When designing a civil defence shelter according to the present Swedish Shelter Regulations,Swedish Rescue Services Agency (1998), dynamic load cases are not used. Instead,equivalent static load cases are employed to make calculations easier for the designer. As aweapon load, the long-term pressure (both positive and negative) due to a nuclear detonationat long range is assumed, and for the impact of falling debris from a collapsing building anequivalent static load is employed; see Figure 4.1a. However, the real loads that a shelter mustbe able to withstand are quite different and more similar to those shown in Figure 4.1b. Thepressure, due to a nearby explosion, acting on the front shelter wall will present a very largepeak pressure that decreases to zero within a couple of milliseconds. The impact, though, willbe composed of a falling mass hitting the shelter with a certain velocity.
qweapon qimpact
(a)
(b)
mv
p
p = p(t) ≠ qweaponDynamicload case
Weapon load
qweapon qweapon
Impact load
Static loadcase
Figure 4.1 Comparison between (a) equivalent static loads and (b) probable dynamic loadsthat may act on a civil defence shelter.
To further study the effect of such highly dynamic load cases, non-linear finite elementanalyses were carried out; see Paper III. In accordance with the criterion in the SwedishShelter Regulations, the time-dependent pressure due to an explosion of 125 kg TNT at adistance of five metres was used as the blast load. The impact of falling debris was based on

78
Shelter
Mtot =14 640 kgvimpact = 9.6 m/s
5.0
0.2
Shelter
0.16
0.5 kN/m23.0
3.0
3.0
3.0
0.5 kN/m2
0.5 kN/m2
[m]5.0 5.0
125 kgTNT
Shelter
(a) (b)
Shelter
4 880 kg
4 880 kg
4 880 kg
Figure 4.2 Dynamic load cases studied in Paper III using non-linear finite element analyses:a) pressure from blast load, and b) impact load due to falling masses.
the collapse of a three-story concrete building standing on top of the shelter, see Figure 4.2.However, to better understand the response obtained and the reasons for the choices made, abrief background about such extreme load cases is presented in the following sections.
4.2 Response at transient loading
A structure subjected to dynamic load may behave very differently compared to when it isloaded statically. This is especially true if the load applied is very intense, with a high peakvalue and acting during a very short time. Such so-called impulse loads, or highly transientloads, are obtained when for example a structure is subjected to the pressure from a nearbyexplosion or the impact from colliding objects, i.e. the kind of dynamic loads that may act ona civil defence shelter.
When a load is applied on a structure, stress waves caused by the load travel back and forth inthe structure, “informing” all its parts of what is going on. The time it takes for thisinformation to be distributed depends on the wave speed (i.e. the speed of sound in thematerial) and on the structure’s shape. The former may be determined as
ρEc = (4.1)
79
where E is Young's modulus and ρ is the density of the material, and will in normal-strengthconcrete be approximately 3,500 m/s. Accordingly, the time needed for this distribution isusually very short and normally does not cause any problems. However, as stated above, thepressure caused by a nearby explosion may not last more than a couple of milliseconds andwill present an extremely high peak pressure. Consequently, the pressure will affect thestructure but there will not be time enough for the information to spread through the structure,and hence a very different response may initially be obtained.
A good example of this is a simply supported beam (plain concrete) subjected to the impact ofa drop weight hitting the beam with a certain speed; see Figure 4.3. The crack directly belowthe load would eventually form also with statically loading. However, the inclined shearcracks and the cracks at the top of the beam would not appear in such a case. The reason fortheir appearance is that, at the time of cracking, the supports are still unaware of the dropweight hitting the beam. Hence, this failure mode would be obtained regardless of whether thebeam had been fixed, or as now, simply supported. Instead, the current boundary conditionscan perhaps best be regarded as time-dependent fixed supports, where the locations of thesesupports move toward the ends of the beam with a speed equal to the wave speed in the beam.This would also explain the forming of bending cracks at the top of the beam. Another goodexample of how the initial behaviour may be affected due to such time-dependent boundaryconditions is the initial behaviour of a shelter wall subjected to the impulse load from anearby explosion, as shown in Paper III.
400 40025 25
100
[mm]
m = 31 kg v = 10 m/s
(a) (b)
Figure 4.3 (a) Load set-up of simply supported beam with width 100 mm; (b) crack patternobtained when subjected to the impact of falling drop weight. Based on Ågårdhand Laine (1997).
Based on the above, it is clear that the possibility of global force redistribution within astructure subjected to such loads may be very different from that in a statically loadedstructure. Such a redistribution needs a certain amount of time to take place, a time that

80
evidently need not be available in a structure subjected to an impulse load. Accordingly, theability of such a redistribution to take place may therefore also be reduced. Unfortunately, thepossibility of such force redistribution is very important in structures subjected to impulseloads. This makes it even more important that the materials (especially the reinforcement) andthe detailings used in such concrete structures can guarantee ductile behaviour. With this as abackground, it is therefore disturbing that the reinforcement ductility used in Sweden hasdecreased quite considerably during the last ten to fifteen years. Even though it was recentlydecided that a more ductile reinforcement should now be made available in Sweden(Fundia 1999), the difference from the material properties of the steel used during the 1970sand 1980s are still great, see Johansson (1997). This statement is valid for both the strain atultimate stress and the ratio between ultimate strength and yield strength.
Due to the small time periods during which an impulsive load may act, the gathering of testdata becomes more difficult when conducting such experiments. As an example, in static testsit is usually possible to visually register and mark the forming of cracks during loading,information that tends to be vital when interpreting the test results. However, this is notpossible in a transiently loaded structure; for such registration a high-speed camera isrequired. Further, the arrangements necessary when conducting, for example, explosion testsor drop tests may be far more difficult to carry out, compared to static tests. Therefore, the useof finite element analyses may become an even more powerful tool in such studies, since thistool makes it possible to continuously follow the response in the structure regardless of time.Moreover, the structural behaviour, considering for example the global inertia effects or thetime-dependent boundary conditions, is taken into account automatically. A problem arises,though, due to the change in material behaviour of both concrete and steel when subjected tohigh strain rates. That is, when the load velocity of the material increases, its properties suchas strength and stiffness also change. This is a very complicated field that has yet to beclarified; nevertheless, what influence a high strain rate has on, especially, concrete is furtherpresented and discussed in Chapter 5. The numerical approach for such short-durationresponses also differs from that suitable in static or quasi-static loading, and is therefore dealtwith in Chapter 6.
Often it may not be practical or even necessary to use advanced finite element analyses todetermine the global response of a structure subjected to a dynamic load. Instead, whensolving such problems the mass, stiffness and external load of the structure may betransformed so that a single-degree-of-freedom system (SDOF system) can be used; see forinstance Balazs (1997). This is made possible by converting these properties so that the work
81
carried out by the external and internal forces in the SDOF system is the same as the workcarried out in the real structure. Further, an equivalent mass is used so that the kinetic energygenerated in the SDOF system is the same as that in the real structure. Depending on what issought, such an approximation may in many cases also be adequate. However, since theconversions made usually are based on static behaviour, this method is not able to takedirectly into account the time-dependent boundary conditions that may be very importantwhen studying the initial behaviour of a structure. Therefore, an SDOF system may be highlyunsuitable when studying the initial behaviour of a structure subjected to an impulse load,such as the beam shown in Figure 4.3. Hence, even though an SDOF model in many casesmay be a useful tool it should be pointed out that it may be unsuitable due to its considerablecoarseness; i.e. if for instance the crack pattern is of interest, a more detailed finite elementanalysis should of course also be used.
4.3 Blast load
4.3.1 Explosive shock in air
According to the English edition of the Swedish Shelter Regulations, Swedish RescueServices Agency (1994), a civil defence shelter shall be able to withstand “the effect of apressure wave corresponding to that produced by a 250 kilograms GP-bomb with 50 weightpercent TNT which bursts freely outside at a distance of 5.0 metres from the outside of theshelter during free pressure release”. Further, the shelter shall endure the impact of splinterfrom such a bomb. Apart from these “close range” requirements, the shelter shall also resistthe long-term pressure (overpressure of 50 kPa and underpressure of 8 kPa) from a nuclearbomb that detonates at a long distance. This section gives a very brief description of the blastwaves generated by an explosion in free air, and is included to give the reader a backgroundfor the blast load used in the finite element analyses presented in Paper III. As stated inSection 1.4, though, the influence of splinter was not considered in these analyses. Moreinformation about the origin and development of blast loads may be found in, for example,Baker (1973) or Kinney and Graham (1985). The expressions given below are valid only forexplosions of conventional weapons (i.e. not nuclear weapons).
An explosion is, according to Kinney and Graham, a phenomenon resulting from a suddenrelease of energy and whose magnitude is established by the amount of energy released. Thereare many different sources of such energy releases, but a generally accepted standard of
82
measurement for them is the energy released in the explosion of TNT. Thus, differentexplosives are generally considered in TNT-equivalencies and, since energy is proportional tomass, it is also common to specify the explosives in terms of mass instead of energy.
The energy release of an explosion will push back the surrounding atmosphere and a blastwave, travelling faster than the speed of sound, will form. A typical pressure-time relation ofan ideal blast wave is shown in Figure 4.4. The explosion detonates at time t = 0 and after acertain time ta, the wave front reaches the target. The pressure in the wave front will rise fromthe ambient pressure, p0 (in our case the air pressure ≈ 100 kPa), to p0 + Ps
+ during a veryshort time (a couple of microseconds). The pressure then decays to the ambient pressure againat time ta + T + ending the positive phase. A negative phase will then form with amplitude ofp0 - Ps
- when the rush of air toward the explosion centre forms a partial vacuum. Eventuallythe pressure will be back to p0 at total time ta + T + + T -. The portion of the time history abovethe ambient pressure p0 is called the positive phase and the portion below p0 is called thenegative phase. The positive and negative impulse intensities can be defined as shown inequations (4.2) and (4.3) respectively.
is-
ta + T + ta + T + + T -ta
p0
p0 – Ps-
p0 + Ps+
is+
positivephase
negativephase
p
t
Figure 4.4 Schematic view of an ideal blast wave.
( )++
+ −=Tt
t
a
a
dtptpi 0)( (4.2)
( )−+
+
−+
+
− −=TTt
Tt
a
a
dttppi )(0 (4.3)

83
The positive impulse i+ together with the peak pressure Ps+ and the duration T + are important
parameters that are used to describe the shape of the blast load. Different researchers haveproposed several “blast wave shapes” with varying complexities. Baker (1973) describes sixof these, where the simplest one is a linear function involving only two parameters and themost complex is an exponential function including five parameters. Because of its simplicityand allowance of accurate matching to observed parameters, Baker propose the use of
p t p P tT
est T( ) = + −� �
++
− +0 1 α (4.4)
where t is time after shock arrival (i.e., measured after the arrival time, ta) and α is a waveform parameter that describes the rate of decay of the overpressure. This expression is alsoproposed by Kinney and Graham (1985) and used in both ConWep (1992) and FortH 2(1987). Consequently, it has also been used in this work to determine the pressure-timerelation for an explosion. Combining equations (4.2) and (4.4) gives
( )���
� −−= −+++ α
ααeTPi s 111
2 (4.5)
from which α can be obtained. The corresponding relations for the negative phase have,according to Baker been almost totally ignored by researchers. A probable reason is that mostinvestigators have considered the negative phase as relatively unimportant compared to thepositive phase, or that they have encountered difficulties in accurately measuring itscharacteristics. According to Baker, the only expression proposed for the negative phase isthat proposed by Brode (1955), in equation (4.6). Here, time is measured from the start of thenegative phase ta + T +. The negative phase, though, was neglected in the analyses presentedin Paper III.
p t p P tT
tT
est T( ) = − −� �
−− −
− −0
41 (4.6)
4.3.2 Reflection of shock waves
The information given above is valid for a blast wave that is free to develop in free air withoutany kind of disturbances. However, when a blast wave encounters a denser object, itscharacteristics will change dramatically. Thus, in order to better understand the pressure-timeshape of a blast load acting on a structure, it is helpful to be at least vaguely aware of what
84
happens when a shock wave is reflected from a denser surface or diffracted around an object.The former topic is treated here and the latter in Section 4.3.3.
The simplest case of reflection is normal reflection, where the shock wave hits a dense surfaceat a right angle. In Figure 4.5a the incident shock wave I is approaching the wall with avelocity VI. The conditions in front of the wave are the ones for still air (indicated by thesubscript 0) while the conditions immediately behind are those for a free-air shock with agiven pressure (p0 + Ps), density (ρs), temperature (θs) and particle velocity (us). Immediatelyafter reflection at the wall (Figure 1b) the reflecting wave moves away from the wall into theregion associated with the incident wave at a velocity VR. At the wall surface the pressure(p0 + Pr), density (ρr) and temperature (θr) are all increased to a value above that of theincident wave, while the particle velocity is reduced to zero. The overpressure, Pr, is calledthe reflected pressure and can be several times as high as the pressure, Ps, of the incidentwave. For weak shocks (Ps << p0) where acoustic approximations are valid, the reflectedoverpressure will be twice as high as that of the incident wave. For stronger shocks this ratiocan be increased considerably and can, according to Baker (1973), in extreme cases perhapsbe as high as 20 or more.
VI
p0 + Ps, ρs, θs, vs
p0, ρ0, θ0, v0 = 0
I
p0 + Ps, ρs, θs, vs
p0 + Pr, ρr, θr, vr = 0
RVR
a) b)
Figure 4.5 Normal reflection of a plane shock from a rigid wall: (a) immediately beforereflection; (b) immediately after reflection. Based on Baker (1973).
Figure 4.6 shows a case similar to that shown in Figure 4.5 but now the shock wave hits arigid wall at an oblique angle αI. The properties in Region A are those of still air and inRegion B those for a free-air shock. The conditions in Region C indicate reflected shockproperties. On contact with the wall the shock will reflect at an angle αR that is different fromαI. This new angle is determined with the condition that the particle velocity normal to thewall is equal to zero and will thereby be a function of the incident angle aI and the velocity Uof the incident wave. These properties can be compared to those of acoustic waves. Here, theangle of the incident and reflected wave is always the same. Further, where regular reflectionoccurs for 0 ≤ αI ≤ 90° the reflected pressure Pr = 2Ps for all values of αI. There is a critical

85
angle αI,crit, such that the reflection described above is not possible for αI > αI,crit. What valuethis critical angle has depends on the velocity of the incident shock; see Kinney and Graham(1985). For a wave velocity of Mach 1.5 (where Mach 1.0 is the speed of sound) and above,αI,crit ≈ 40°. This is the so-called Mach reflection, a complex but important phenomenon thatis further described below.
αR
p0 + Pr,ρr, θr,
vr sin αR = 0
VI
p0, ρ0, θ0,v0 = 0
IR
VR
αI
p0 + Ps, ρs,θs, vs
A
B
C
Figure 4.6 Ordinary oblique reflection of a plane shock from a rigid wall. Based on Baker(1973).
When the incident wave hits a surface at the critical angle αI,crit or more steeply a Machreflection occurs. Now, in contrast to the ordinary oblique reflection, the wave will notbounce away directly. Instead it spurts away along the surface before being reflected. This hasthe effect that a new shock wave, a Mach stem, takes form almost perpendicular to thesurface. As the shock system moves along the surface, the height of the Mach stem increases.This means that the intersection point between the Mach stem and the incident and reflectedshock, the so-called triple point, will get further away from the surface as the shock systemmoves.
In Figure 4.7 the reflection process of a strong shock waves, separated into three stages, isshown. In the first stage the incident wave I1 has just touched the reflecting surface. Thereflected pressure will then be more than twice as high as anywhere else on the incident wave.As the incident wave expands, so does the reflected wave. The reflected wave, however, willnot be spherical since the angle of reflection αR is less than the angle of the incident wave αI
(a reflected acoustic wave, however, would be spherical due to equal angles αI and αR). At acertain distance from the charge C, the incident angle αI is equal to the critical angle αI,crit
which means that a Mach stem is formed (stage two in Figure 4.7). As the shock systemexpands further, the Mach stem grows rapidly and “swallows” the inclined and reflectedwaves above it, as shown by the line ρ, which describes the line of the triple point. In stagethree, the Mach stem dominates the shock close to the surface and an almost vertical shock

86
front has formed. Further, the pressure in the Mach stem and in the neighbourhood of thetriple point will be considerably larger than those in I3. This means that depending on thedistance to a given target and the height of the target, the whole target may or may not be hitby a uniformly distributed pressure at the same time.
Figure 4.7 Reflection of strong shock waves. From Baker (1973).
4.3.3 Diffraction of shock waves
All information given here about the diffraction of shock waves is based on Baker (1973).When a shock wave encounters a solid object, such as a building, a complicated interactiontermed diffraction occurs. The process of a plane shock wave hitting a two-dimensionalstructure is sketched in Figure 4.8. When the incident wave, I, strikes the wall a reflectedwave, R, moves in the opposite direction and the pressure at the wall surface increasesinstantaneously from p0 + Ps to p0 + Pr. Above the wall, however, the incident wave continuesits movement relatively undisturbed and the pressure remains at p0 + Ps. Due to the differencein pressures at the upper left corner of the wall, the reflected pressure will decrease as ararefaction wave moves down the wall. A vortex of spinning air with low overpressures at itscentre will then form at the corner, thus further decreasing the pressure in this region. In thestage shown in Figure 4.8b the pressure at the lower part of the front wall is still p0 + Pr whilethe upper part has a pressure similar to that in the incident wave. As the shock wave reachesthe back wall of the structure, the shock wave diffracts around the corner (Figure 4.8c) and asecond vortex is formed. The pressure on the back wall behind this diffracted shock front issomewhat less than p0 + Ps while the pressure in front of it is equal to the ambient pressure p0;at the roof the pressure is still close to p0 + Ps. At the front wall, the rarefaction wave hasnegated the reflected wave and the pressure is now p0 + q, where q is the dynamic pressure.
87
Figure 4.8 Diffraction of shock front over a two-dimensional structure. From Baker (1973).
The behaviour described above will depend on the geometrical dimensions of the solid object.If the width of the object is large, the rarefaction wave may have negated the reflected wavebefore the shock front reaches the back wall, etc. Diffraction is, of course, also valid for athree-dimensional structure. In this case the shock wave can also diffract at the sides of thestructure.
4.3.4 Pressure-time relation used in finite element analyses
From Sections 4.3.2 and 4.3.3 it is clear that it is very complicated to determine a correctpressure-time relation for various parts of a real structure; apart from the difficulty of takinginto account different reflections, the load also depends on the structure’s geometry.Therefore, certain simplifications have been necessary in the study. As quoted inSection 4.3.1 the Swedish Shelter Regulations clearly state that the weapon load chosencorresponds to that of an explosion in free air where the pressure release is free. Thus, theinterpretation made was that reflection from the ground could be neglected. This may alsohold true for the diffraction. Nevertheless, the following reasoning was used to justify thedisregard of the diffraction effect. The analyses carried out only model a single strip of theshelter. This approximation should be appropriate if the out-of-plane length of the shelter islarge enough and the bearing capacity in the transverse direction can be neglected. In this waythe problem with diffraction at the end walls can be avoided. This would also be the case withthe diffraction at the front wall if the wall is high enough, i.e., a building is on top of theshelter. Therefore, the shelter subjected to a blast load was assumed to have some kind of
88
light structure (i.e., wooden building) on top which would delay the diffraction in such a waythat it can be neglected. With these approximations the pressure-time relation can becalculated according to the equations given in Section 4.3.1.
For a charge of 125 kg TNT (250 kg bomb with 50 weight percent TNT) exploding at adistance of 5 metres, ConWep (1992) gives blast parameters as shown in Table 2.1. Hereby,the factor α in equation (4.5) can be determined for the reflected wave (α = 15.00) and thepressure-time relation for the positive phase be expressed according to equation (4.4). Theresult is shown in Paper III, and from this it can be seen that the pressure decreases veryrapidly from a value of about 5 MPa at the time of arrival to a pressure of 22 kPa after just3 ms. The approximated pressure-time relation used in the finite element analyses leads to asomewhat increased impulse intensity of about 6%. However, this approximation is believedto be negligible compared to other uncertainties in the blast analyses.
4.4 Impact load
A shelter may be exposed to falling masses as a result of weapon impact on a nearby building.Therefore, it must be designed to withstand such a load. However, as is the case with theweapon load, an impact load is a complicated dynamic load case, and consequently, it is notrealistic for a designer to use such a load in the design of a civil defence shelter. Therefore,when revising the regulations in the 1970s there was a demand for an expression of anequivalent static load that could be used in the design process. An early approach for such astatic load was presented by Hallgren and Granström (1975) and further simplified byHallgren and Granström (1977). After this, some minor changes have been made and theequivalent static load given in the present Swedish Shelter Regulations, Swedish RescueService Agencies (1998), is now expressed as
timpact hmq ⋅⋅= 4.1 (4.7)
where m is the dead weight per square meter of the building above the shelter (units given inkN/m2) and ht is the distance from the centre point of this building to the top of the shelter.The expression given in equation (4.7) is based on an SDOF system where the followingassumptions are made:
• the behaviour of the structure is fully plastic;• plastic impact between falling mass and shelter roof;• the falling mass hit the shelter roof with a constant amount per time unit.
89
Other important assumptions made are, for example, that all the impact energy dissipates dueto bending and that the active time, i.e. the time it takes for all the mass to hit the shelter, isset to 0.5 s. Hallgren and Granström (1977) stated that the latter assumption probably issomewhat optimistic but that this to a large degree should be compensated by the former, thatno energy is consumed due to crushing or shear at the supports. Apart from the work byHallgren and Granström, the derivation of this expression may also be found in Johansson(1999b). Impact loading due to falling masses has experimentally and theoretically beenexamined by, for example, Sundquist (1977, 1978, 1979) and Andersson (1985, 1987a, b).
The collapse sequence of the building, assumed in the derivation of equation (4.7), starts atthe top and proceeds downward, thus dragging the underlying floors along in its fall; seeFigure 4.9. The top floor slab is assumed to start falling with an initial velocity of zero andaccelerate until it hits the underlying floor. Its movement is then decreased due to plasticimpact and breaking of the slab hit. The two slabs then continue to fall down with a velocitycorresponding to the reduced kinetic energy. This process is repeated until the roof of theshelter is reached. Assuming plastic impact between the impacting floors, the kinetic energyof the falling mass just prior to its impact with the shelter roof may be expressed as
=
++−⋅=n
iBtotimpact n
nnEin
gHME1
22
3 221 (4.8)
where Mtot is the total falling mass of the building above the shelter, g is gravity, H is the totalheight of the building above the shelter roof, n is the number of floors and EB is the energyneeded to break one floor slab in the collapsing building. A derivation of this expression canbe found in, for instance, Hallgren and Granström (1977) or Andersson (1985). Due touncertainty about the capacity of each floor slab, though, the energy term EB was set to zerowhen determining the impact velocity vimpact in the finite element analyses, and it could thenbe determined as (given n = 3 and H =9 m)
=
⋅=⋅
=n
itot
impactimpact i
ngH
ME
v1
23
122
= 9.6 m/s (4.9)
90
(d)(c)(b)(a)
vimpact
Figure 4.9 Schematic description of collapse sequence assumed: (a) the third floor starts tofall with zero initial velocity; (b) third floor is about to hit second floor; (c) afterplastic impact between third and second floor they continue downward to firstfloor; (d) all three floors falling with the same velocity just before hitting theshelter roof.

91
5 Strain Rate Effect in Concrete
5.1 Introduction
When a structure is subjected to transient loads such as the blast load from a nearby explosionor the impact from falling debris, the strain rate in the material may also be substantiallyhigher than what is the case in a statically loaded structure; see Figure 5.1. Althoughsomewhat generalised this figure still gives a rather adequate picture of what strain rates maybe acting in different kinds of load cases. Properties of the materials used in reinforcedconcrete structures are all more or less strain-rate-dependent. Thus, a change in the strain ratemay also result in important changes in the properties of the loaded material. Therefore, whenmodelling a structure subjected to loads generating high strain rates, it may be important takethese effects into account, and hence it is necessary to be aware of how and why this changeoccurs. In this chapter the influence of high strain rates on the concrete properties are mainlydiscussed, although the effect on the reinforcement steel and bond-slip relation are also treatedbriefly.
10-8 10-7 10-6 10-5 10-4 10-3 10-2 10-1 100 101 102 103
creep static earthquake hard impact blast
strain rate [s-1]
Figure 5.1 Approximate range of the expected strain rates in different load cases. Based onBischoff and Perry (1991).
Before continuing the discussion of the effect of high strain rates, it may be helpful to furtherexamine what strain rate the “ordinary” static loading represents. Figure 5.1 indicates that itshould be at a rate of about 10-5 s-1. This agrees quite well with the values given in the CEB-FIP Model Code, CEB (1993), where the strain rate for static loading in compression andtension is 30⋅10-6 s-1 and 3⋅10-6 s-1, respectively. Those values also correspond to that used inSweden for static standard tests, e.g. compression tests and fracture energy tests on RILEM-beams; see BST Byggstandardiseringen (1991) and RILEM 50-FMC (1985), respectively.
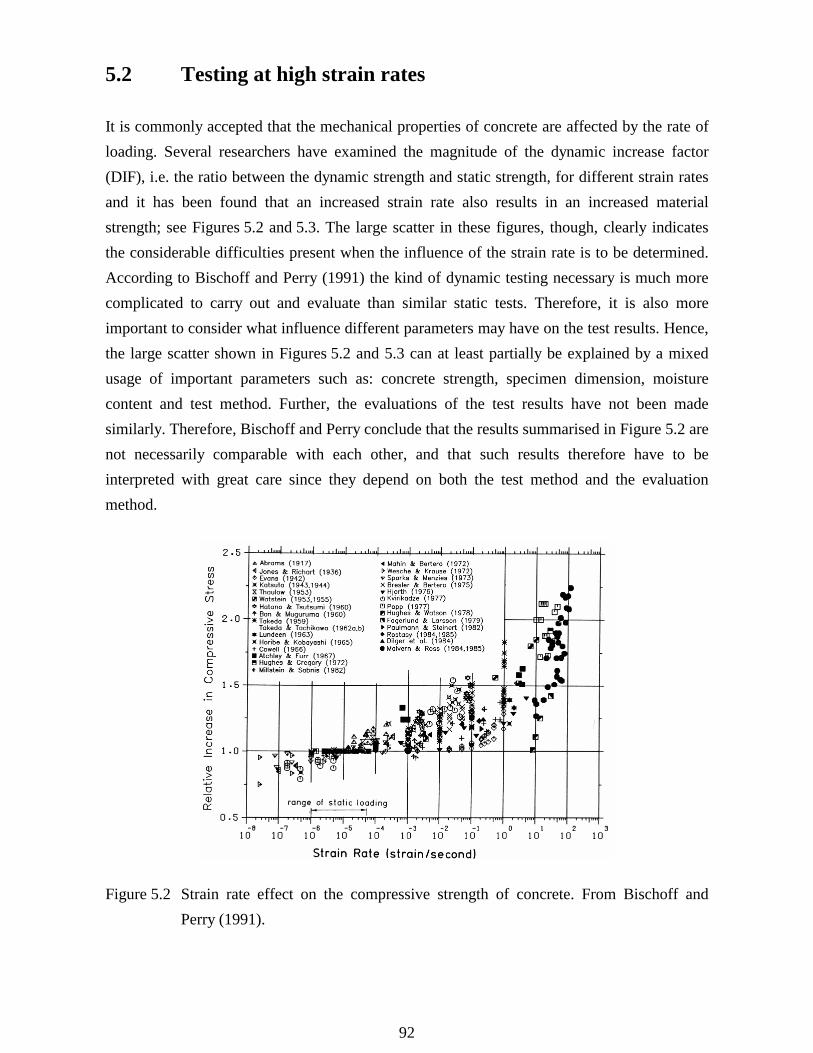
92
5.2 Testing at high strain rates
It is commonly accepted that the mechanical properties of concrete are affected by the rate ofloading. Several researchers have examined the magnitude of the dynamic increase factor(DIF), i.e. the ratio between the dynamic strength and static strength, for different strain ratesand it has been found that an increased strain rate also results in an increased materialstrength; see Figures 5.2 and 5.3. The large scatter in these figures, though, clearly indicatesthe considerable difficulties present when the influence of the strain rate is to be determined.According to Bischoff and Perry (1991) the kind of dynamic testing necessary is much morecomplicated to carry out and evaluate than similar static tests. Therefore, it is also moreimportant to consider what influence different parameters may have on the test results. Hence,the large scatter shown in Figures 5.2 and 5.3 can at least partially be explained by a mixedusage of important parameters such as: concrete strength, specimen dimension, moisturecontent and test method. Further, the evaluations of the test results have not been madesimilarly. Therefore, Bischoff and Perry conclude that the results summarised in Figure 5.2 arenot necessarily comparable with each other, and that such results therefore have to beinterpreted with great care since they depend on both the test method and the evaluationmethod.
Figure 5.2 Strain rate effect on the compressive strength of concrete. From Bischoff andPerry (1991).
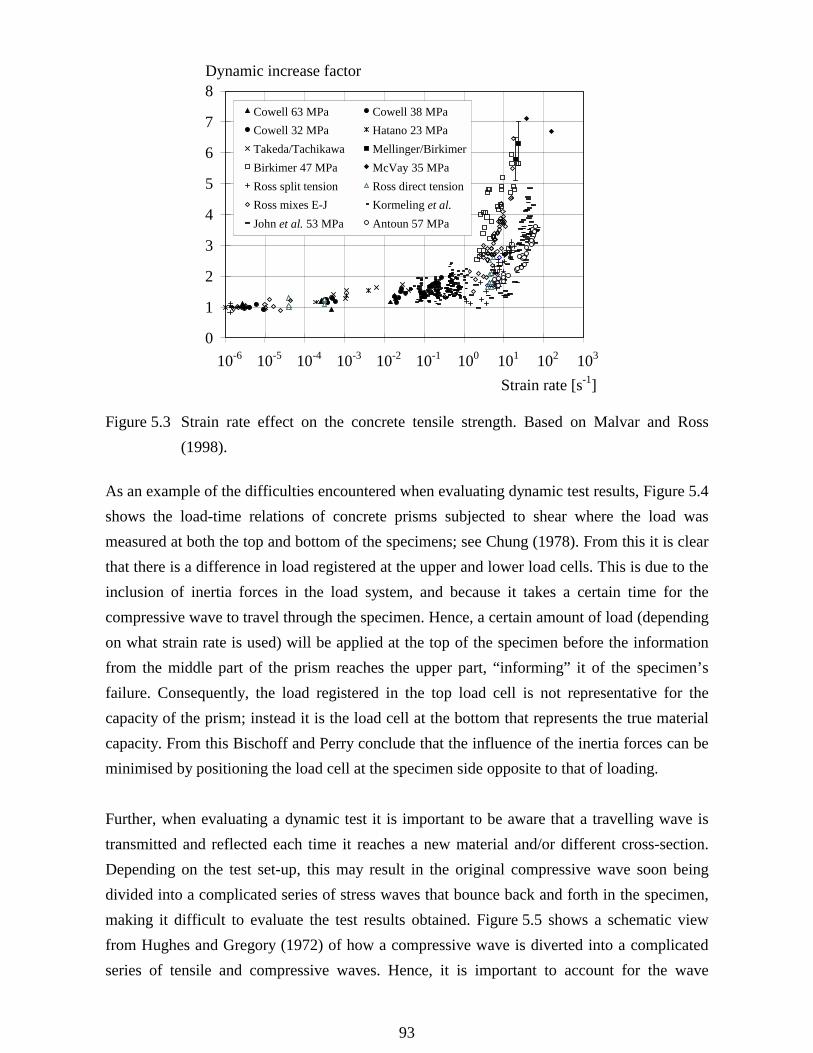
93
0
1
2
3
4
5
6
7
8
10-6 10-5 10-4 10-3 10-2 10-1 100 101 102 103
Strain rate [s-1]
Dynamic increase factor
Cowell 63 MPa Cowell 38 MPaCowell 32 MPa Hatano 23 MPaTakeda/Tachikawa Mellinger/BirkimerBirkimer 47 MPa McVay 35 MPaRoss split tension Ross direct tensionRoss mixes E-J Kormeling et al.John et al. 53 MPa Antoun 57 MPa
Figure 5.3 Strain rate effect on the concrete tensile strength. Based on Malvar and Ross(1998).
As an example of the difficulties encountered when evaluating dynamic test results, Figure 5.4shows the load-time relations of concrete prisms subjected to shear where the load wasmeasured at both the top and bottom of the specimens; see Chung (1978). From this it is clearthat there is a difference in load registered at the upper and lower load cells. This is due to theinclusion of inertia forces in the load system, and because it takes a certain time for thecompressive wave to travel through the specimen. Hence, a certain amount of load (dependingon what strain rate is used) will be applied at the top of the specimen before the informationfrom the middle part of the prism reaches the upper part, “informing” it of the specimen’sfailure. Consequently, the load registered in the top load cell is not representative for thecapacity of the prism; instead it is the load cell at the bottom that represents the true materialcapacity. From this Bischoff and Perry conclude that the influence of the inertia forces can beminimised by positioning the load cell at the specimen side opposite to that of loading.
Further, when evaluating a dynamic test it is important to be aware that a travelling wave istransmitted and reflected each time it reaches a new material and/or different cross-section.Depending on the test set-up, this may result in the original compressive wave soon beingdivided into a complicated series of stress waves that bounce back and forth in the specimen,making it difficult to evaluate the test results obtained. Figure 5.5 shows a schematic viewfrom Hughes and Gregory (1972) of how a compressive wave is diverted into a complicatedseries of tensile and compressive waves. Hence, it is important to account for the wave
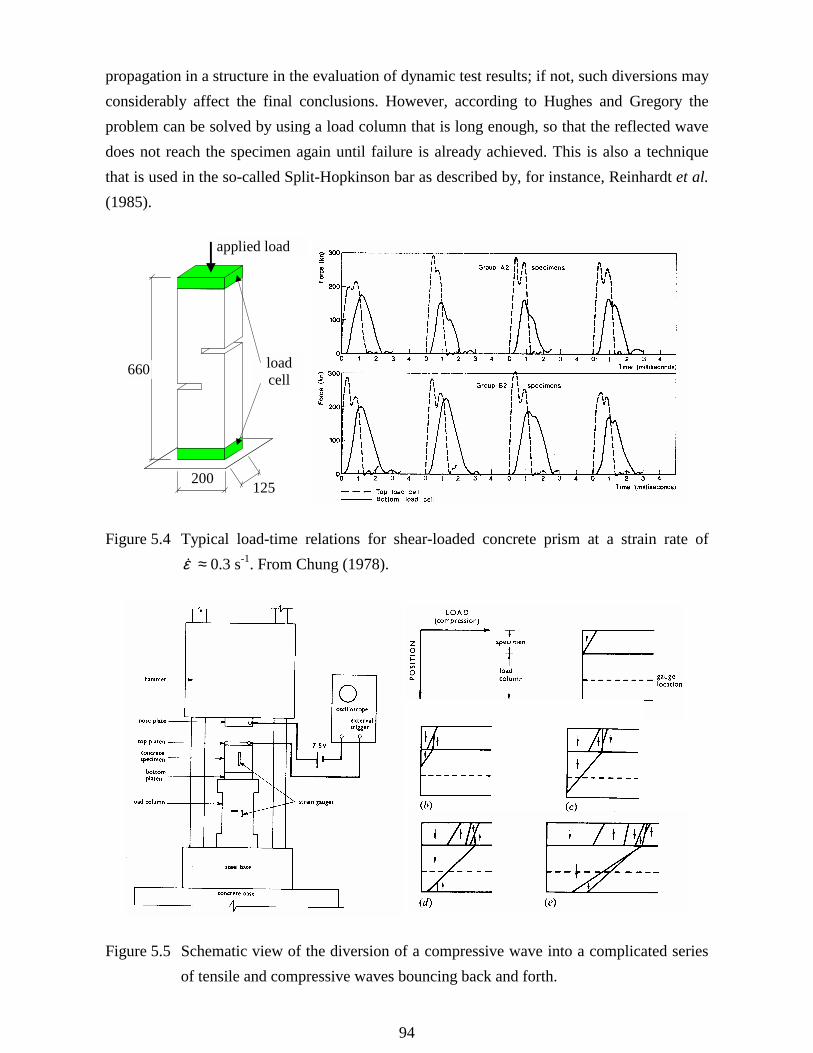
94
propagation in a structure in the evaluation of dynamic test results; if not, such diversions mayconsiderably affect the final conclusions. However, according to Hughes and Gregory theproblem can be solved by using a load column that is long enough, so that the reflected wavedoes not reach the specimen again until failure is already achieved. This is also a techniquethat is used in the so-called Split-Hopkinson bar as described by, for instance, Reinhardt et al.(1985).
125
660 loadcell
applied load
200
Figure 5.4 Typical load-time relations for shear-loaded concrete prism at a strain rate ofε� ≈ 0.3 s-1. From Chung (1978).
Figure 5.5 Schematic view of the diversion of a compressive wave into a complicated seriesof tensile and compressive waves bouncing back and forth.

95
5.3 Strain rate influence of concrete strength
Various researchers have proposed expressions that try to describe how the concrete strengthdepends on the strain rate. Such proposals for concrete in compression have, for instance,been made by Seabold (1970), Dilger et al. (1984), Soroushian et al. (1986) and the CEB-FIPModel Code, CEB (1993); proposals for concrete in tension can, for example, be found inCEB (1993), Ross et al. (1996), and Malvar and Ross (1998). These expressions, though,differ considerably as to appearance, and in some cases also as to what properties they dependon. The expressions reported in Seabold, Dilger and Soroushian et al. just give a DIF as afunction of the strain rate; the latter, though, differs between wet and dry concrete (i.e.concrete that has been prevented from drying out and whose micropores thereby contain freewater). Ross et al. proposed a more complicated expression that takes into account parameterssuch as the fracture toughness and compressive strength of the concrete. However, perhaps themost accepted relations are those presented in the CEB-FIP Model Code where the DIF ofconcrete in both tension and compression is related to its static compressive strength. Theexpression proposed by Malvar and Ross for concrete in tension is also an improvement ofthat in the Model Code. The different proposals mentioned above are compared in Figures 5.6and 5.7. From these it is also clear that there is uncertainty about what effect the strain ratehas. Further comparisons are thus hereafter made with the expressions given in CEB (1993)and Malvar and Ross (1998).
0
1
2
3
4
10-5 10-4 10-3 10-2 10-1 100 101 102 103
Strain rate [s-1]
Fdyn / Fsta
CEB, fc = 30 MPaCEB, fc = 60 MPaSoroushian et al., drySoroushian et al., wetDilger et al.Seabold
Figure 5.6 Comparison of DIF-strain rate relations for concrete in compression, given in theliterature.

96
0
1
2
3
4
10-6 10-5 10-4 10-3 10-2 10-1 100 101 102 103
Strain rate [s-1]
Fdyn / Fsta
CEB, fc=30 MPa CEB, fc = 60 MPa
Ross et al., fc = 28 MPa
Malvar and Ross, fc = 30 MPa Malvar and Ross, fc = 60 MPa
Figure 5.7 Comparison of DIF-strain rate relations for concrete in tension, given in theliterature.
5.4 Possible explanations for the increase in concrete strength
5.4.1 Characterisation of strain rate effects
The strain rate effect in concrete can, somewhat simplified, be divided into two differentkinds: viscous and structural effects. The former, which leads to relatively moderate strengthenhancements at increased strain rate, can be said to occur at strain rates up to the so-calledtransition zone; see Figure 5.8. A commonly accepted theory is that this increase is largely dueto the presence of free water in the concrete micropores, see further in Section 5.4.2. Sincethis is also an explanation that the author supports, it is treated in somewhat more detailherein. At strain rates above that of the transition zone the strength increase is more dramaticbecause structural effects, i.e. inertia and confinement, dominate the dynamic strengthcontribution. This is further discussed in Section 5.4.3.

97
10-5 10-4 10-3 10-2 10-1 100 101 102 103
Strain rate [s-1]
1.0
0.5
1.5
2.0
2.5
3.0
3.5
4.0
Fdyn / Fsta
30
structural effects: - inertia forces - confinement
viscous effects:- free water
transitionzone
Figure 5.8 Schematic view of the strain rates at which the viscous and structural effects,respectively, are dominant.
5.4.2 Viscous effects
It is commonly accepted that the non-linearity of the concrete decreases with increasing strainrate. According to Zielinski et al. (1981) this is due to the difference in crack propagationobtained at higher load rates compared to that of static loading. When the load is appliedslowly, it is possible for the cracks to propagate in a way that demands lower energyconsumption. Hence, it is possible for the cracks to pass around strong aggregates and form inthe weaker zones. However, at high strain rates, when a large amount of energy is introducedin the specimen during a very short period of time, this is no longer possible to the sameextent. Instead, the cracks are forced to take a shorter route and propagate through strongerzones which, if loaded at lower strain rates, it would otherwise have avoided. Consequently,the crack propagation will also differ from that in a static case as schematically shown inFigure 5.9. If the load velocity is high enough, the cracks may even propagate through theaggregates instead of through weaker cement paste; see Rossi (1991a). Thereby, the materialhomogeneity increases, which results in a stiffer behaviour and higher strength of theconcrete. This failure mode is similar to that obtained in static testing of high-strengthconcrete, e.g. by Claeson (1998). Therefore, it is tempting to compare the behaviour ofnormal-strength concrete subjected to high strain rates with that of statically loaded high-
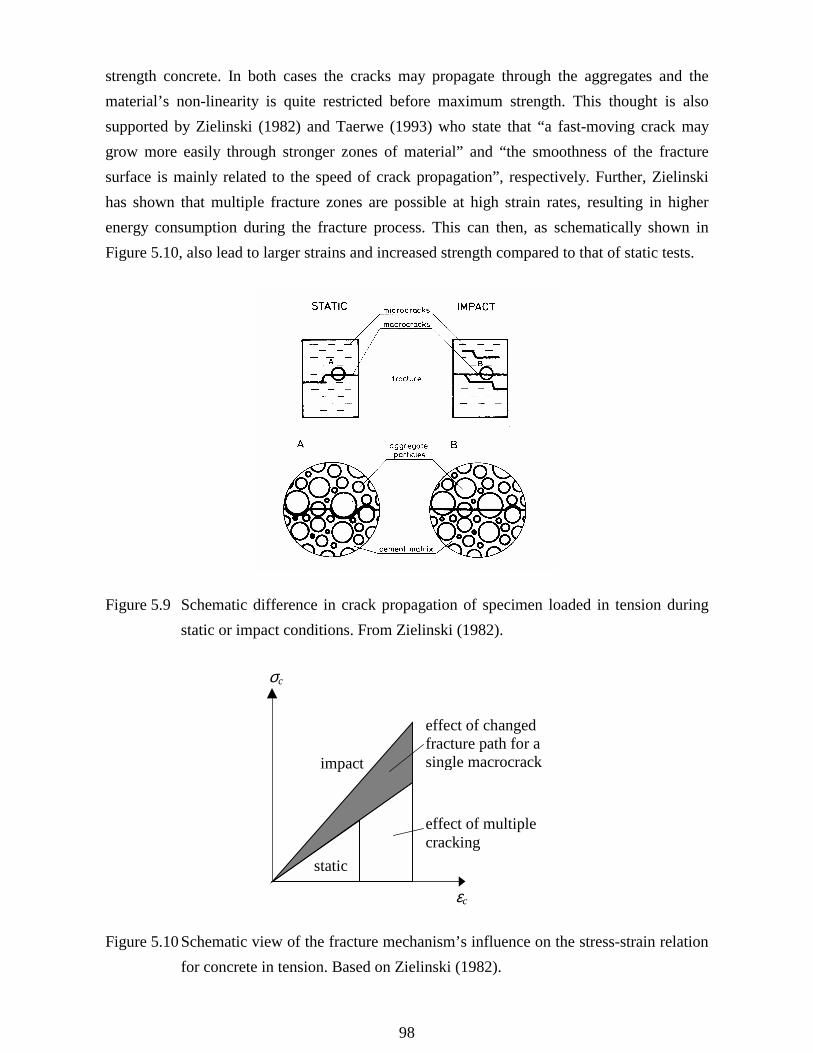
98
strength concrete. In both cases the cracks may propagate through the aggregates and thematerial’s non-linearity is quite restricted before maximum strength. This thought is alsosupported by Zielinski (1982) and Taerwe (1993) who state that “a fast-moving crack maygrow more easily through stronger zones of material” and “the smoothness of the fracturesurface is mainly related to the speed of crack propagation”, respectively. Further, Zielinskihas shown that multiple fracture zones are possible at high strain rates, resulting in higherenergy consumption during the fracture process. This can then, as schematically shown inFigure 5.10, also lead to larger strains and increased strength compared to that of static tests.
Figure 5.9 Schematic difference in crack propagation of specimen loaded in tension duringstatic or impact conditions. From Zielinski (1982).
impact
static
effect of multiplecracking
effect of changedfracture path for asingle macrocrack
εc
σc
Figure 5.10 Schematic view of the fracture mechanism’s influence on the stress-strain relationfor concrete in tension. Based on Zielinski (1982).

99
The relations presented by Soroushian et al. in Figure 5.6 indicate that wet concrete, i.e.concrete that has been prevented from drying out and whose micropores thereby contain freewater, is more sensitive to high strain rates than dry concrete. This observation agrees wellwith those by other researchers, e.g. Kaplan (1980), Reinhardt et al. (1990) and Rossi et al.(1994). They suggest that the fundamental cause of changed crack propagation, and thushigher strength and stiffness, observed in concrete at high strain rates is the presence of freewater in the micropores of the concrete.
Reinhardt et al. (1990) present the results from a pilot test series in which the effects of highstrain rate are examined for concrete in tension. Twenty cylindrical specimens(φ74 x 100 mm) were cast using a so-called micro concrete with a maximum aggregate size of2 mm. Seven days after casting the specimens were demoulded. Half of them were thenprevented from drying and the other ten were dried in an oven at 105°C for five days. Hereby,the relative humidity of the wet and dry specimens was more or less 100% and 0%,respectively, at the day of testing. The specimens were tested in a Split-Hopkinson bar atstrain rates between 0.50 and 1.25 s-1 and it was found that the capacity of the wet specimenswas very sensitive to the strain rate while the dry ones remained unaffected. In a continuousstudy of the above, Rossi et al. (1994) examined the behaviour of more “normal” concreteusing a maximum aggregate size of 10 mm. The dimensions of the specimens were the samebut the dry specimens were now oven-dried for three weeks. Further, the influence of differentwater-cement ratios (w/c ratios) was examined in the wet specimens. The results of this studyare summarised in Figures 5.11 and 5.12, from which it is also clear that wet concrete is farmore sensitive to high strain rates than dry concrete. However, as distinct from theobservations made by Reinhardt et al. with the micro concrete, the dry concrete here showed acertain sensitivity to the strain rate. Rossi et al. give three possible explanations for this: itmight be due to a physical phenomenon other than the presence of free water; inertia forcescan possibly affect the results obtained from the Hopkinson bar; and finally, the dry specimensprobably cannot be regarded as totally dried out since this would demand a very large amountof energy. The last hypothesis was also confirmed in tests on specimens that had been driedfor one week only. From Figure 5.11 it can also be seen that the influence of the strain rateincreases with increased value of the w/c ratio. However, a closer look reveals that theabsolute increase in strength (i.e. ft,dyn – ft,sta) was more or less independent of the w/c ratio ofthe concrete; see Figure 5.12. These results are also useful when comparing the strain ratesensitivity of concrete of different static strength as discussed in Section 5.5.

100
0.5
1.0
1.5
2.0
2.5
3.0
10-6 10-5 10-4 10-3 10-2 10-1 100 101 102
Strain rate [s-1]
Fdyn / Fsta
CEB, fc = 30 MPaCEB, fc = 60 MPaMalvar, fc = 30 MPaMalvar, fc = 60 MPaWet, w/c = 0.7Wet, w/c = 0.5Wet, w/c = 0.3Dry, w/c = 0.5
Figure 5.11 Influence of strain rate on the tensile strength for wet and dry concrete when thew/c ratio is varied. Each point represents an average of between six and eleventests. Based on test data presented in Rossi et al. (1994).
0
2
4
6
8
10
12
10-6 10-5 10-4 10-3 10-2 10-1 100 101 102
Strain rate [s-1]
Fdyn / Fsta
Wet, w/c = 0.3Wet, w/c = 0.5Wet, w/c = 0.7Dry, w/c = 0.5
Figure 5.12 Difference in concrete tensile strength at various strain rates and w/c ratios. Thecontinuous lines are logarithmic regressions. Based on test data presented inRossi et al. (1994).
101
Kaplan (1980) explains that a probable reason for the influence of the moisture content at highstrain rate is the presence of free water in the concrete micropores. When a concrete specimenis loaded in compression the pores tend to close, thus forcing any water present to movewithin the specimen. This movement gives rise to an inner pressure which depends on thepore size, the amount of free water in the pore and the closing speed of the pore. Such aninternal pressure may help the solid phase of the concrete to resist the external force, thusdelaying the crack initiation so that a higher compressive strength is obtained. A similarhypothesis is proposed in Rossi (1991a) to describe the physical cause of increased tensilestrength. Rossi explains that a possible physical explanation can be found by the use of the so-called Stéfan effect. Simplified, it can be said that the presence of a thin viscous film (e.g.water) trapped between two plane and parallel plates that move apart gives rise to a resistingforce. In a concrete structure the walls of the micropores can be approximated as such platesand, when a tensile force tries to open the pore, a counteracting force Fs arises that hinders theseparation. Accordingly, the influence of free water within the concrete microporesstrengthens the cement paste, making it so strong that cracks may propagate through theaggregates rather than in the normally weaker zones of the cement matrix; see Rossi (1991b).Consequently, a larger external force is needed which results in a higher strength. Thus, eventhough not explaining the strain rate phenomenon in exactly the same way, the statements ofZielinski and Rossi and co-workers can in a sense still be regarded as rather similar. They allagree that the geometry of the fracture plane changes with increasing strain rate, i.e. leading toaggregate fracture instead of fracture in the weaker cement paste.
The resisting force Fs due to the Stéfan effect can, according to Rossi, be expressed as
hhVFs
�5
2
23
πη= (5.1)
where η is the liquid viscosity, V is its volume, h is the initial distance between the two platesthat separate and h� is the velocity of separation. However, Rossi emphasises that thisexpression not should be used to determine the value of Fs but just be regarded as anexplanatory model to simplify the understanding of what happens in the concrete. If used thus,it can also be seen from the expression that the size of the pore has a considerably larger effectthan the amount of free water, and that the restraining force is proportional to the velocity ofseparation.

102
It is highly interesting to note that Han (1996) makes use of the same explanations in histhesis about long-term effects in high-strength concrete. This indicates that it is the samephenomenon that causes the change in concrete strength for both long-time loading andloading at very high strain rates. Both phenomena described above will have a positive effecton the concrete strength in compression. In tension, though, only the Stéfan effect influencesthe change in strength, which according to Han means that the strain rate effect in absoluteterms will also have a larger effect for concrete in compression than in tension. This isopposite to a common opinion in the literature, e.g. CEB (1993) and Ross et al. (1995), thatthe strain rate sensitivity is higher for concrete in tension than it is for concrete incompression. However, this is probably due to different definitions of “sensitivity”. Theabsolute increase at high strain rates is undoubtedly higher in compression, but due to thecomparably low static tensile strength its relative strength increase (i.e. DIF) is higher intension than in compression; see also Figure 5.12.
5.4.3 Structural effects
The summarised test results presented in Figures 5.2 and 5.3 indicate that there is a suddenincrease in concrete strength with increasing strain rate at a certain critical strain rate. Of theexpressions discussed in Section 5.3 and shown in Figures 5.6 and 5.7 only those of CEB(1993), Ross et al. (1996) and Malvar and Ross (1998) try to take this so-called transitionzone into account. According to CEB this occurs at a strain rate of 30 s-1 for concrete in bothtension or compression. Ross et al., though, differ between these two stress cases and statethat the transition zone for dry concrete in tension occurs somewhere in the interval of 1 to10 s-1 while the corresponding strain rates for concrete in compression are 60 to 80 s-1. Thisuse of different transition zones for concrete in tension and compression corresponds better tothe observations made in tests; compare Figures 5.2 and 5.3. This also suggests that thelocation of the transition zone given in CEB is not valid; a change by a factor of ten, so itappears at a strain rate of about 3 s-1, seems more reasonable. This is why Malvar and Ross(1998) proposed a modification to the CEB expression for concrete in tension, in which thetransition zone was set to occur at a strain rate of 1 s-1. However, none of these references triesto give any physical explanation for why this sudden increase occurs at all.
Rossi and Toutlemonde (1996), though, state that the increase in tensile strength up to a strainrate of about 1 s-1 is due to the viscous effects described by the Stéfan model. After this, theinertia forces are no longer negligible and at a strain rate higher than 10 s-1 their contribution
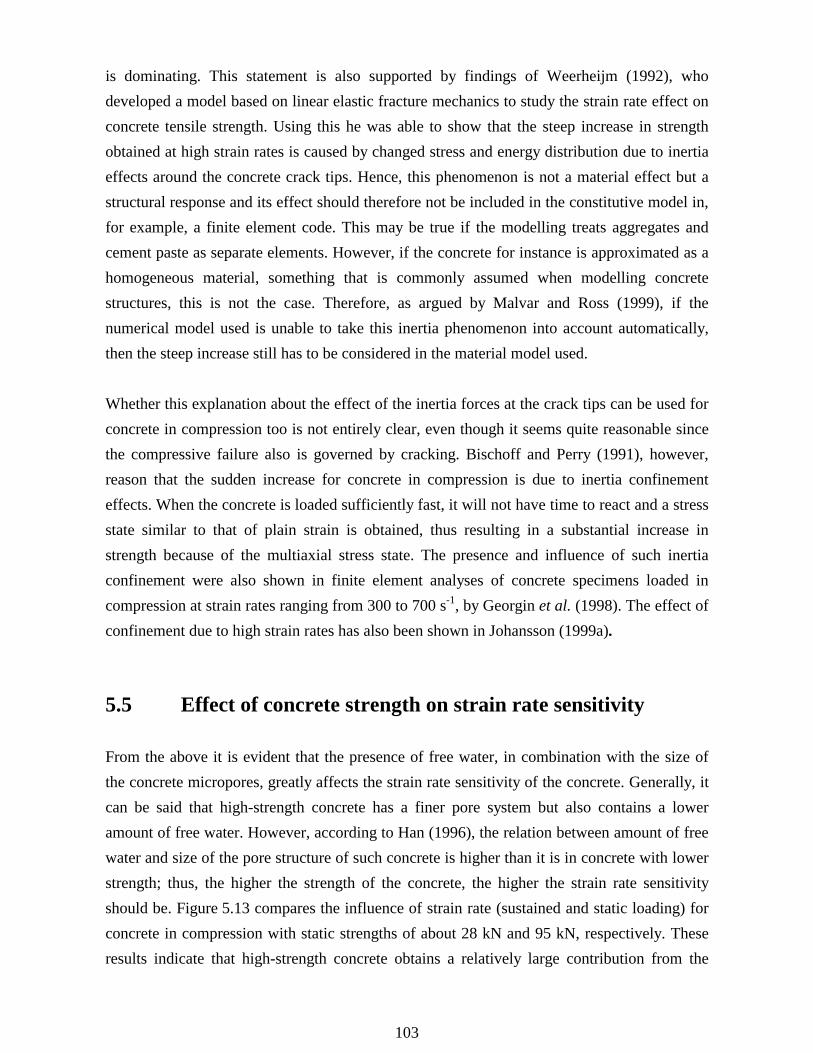
103
is dominating. This statement is also supported by findings of Weerheijm (1992), whodeveloped a model based on linear elastic fracture mechanics to study the strain rate effect onconcrete tensile strength. Using this he was able to show that the steep increase in strengthobtained at high strain rates is caused by changed stress and energy distribution due to inertiaeffects around the concrete crack tips. Hence, this phenomenon is not a material effect but astructural response and its effect should therefore not be included in the constitutive model in,for example, a finite element code. This may be true if the modelling treats aggregates andcement paste as separate elements. However, if the concrete for instance is approximated as ahomogeneous material, something that is commonly assumed when modelling concretestructures, this is not the case. Therefore, as argued by Malvar and Ross (1999), if thenumerical model used is unable to take this inertia phenomenon into account automatically,then the steep increase still has to be considered in the material model used.
Whether this explanation about the effect of the inertia forces at the crack tips can be used forconcrete in compression too is not entirely clear, even though it seems quite reasonable sincethe compressive failure also is governed by cracking. Bischoff and Perry (1991), however,reason that the sudden increase for concrete in compression is due to inertia confinementeffects. When the concrete is loaded sufficiently fast, it will not have time to react and a stressstate similar to that of plain strain is obtained, thus resulting in a substantial increase instrength because of the multiaxial stress state. The presence and influence of such inertiaconfinement were also shown in finite element analyses of concrete specimens loaded incompression at strain rates ranging from 300 to 700 s-1, by Georgin et al. (1998). The effect ofconfinement due to high strain rates has also been shown in Johansson (1999a).
5.5 Effect of concrete strength on strain rate sensitivity
From the above it is evident that the presence of free water, in combination with the size ofthe concrete micropores, greatly affects the strain rate sensitivity of the concrete. Generally, itcan be said that high-strength concrete has a finer pore system but also contains a loweramount of free water. However, according to Han (1996), the relation between amount of freewater and size of the pore structure of such concrete is higher than it is in concrete with lowerstrength; thus, the higher the strength of the concrete, the higher the strain rate sensitivityshould be. Figure 5.13 compares the influence of strain rate (sustained and static loading) forconcrete in compression with static strengths of about 28 kN and 95 kN, respectively. Theseresults indicate that high-strength concrete obtains a relatively large contribution from the

104
internal pore pressure due to free water even for strain rates corresponding to that of staticloading; the capacity of the normal-strength concrete, though, is more or less unaffected. Thereason is that the micropores in the stronger concrete are so small that the movement of freewater even for very low strain rates results in a substantial contribution to the total strength.For the normal-strength concrete, though, the amount of free water in relation to the size ofthe micropores is so low that its contribution is still negligible. Based on this, it can beconcluded that a part of the static strength for concrete of higher strength is made up ofcontributions from the viscous effects in the material's micropores. Hence, a part of thispotential “reserve” in strength has already been used before the strain rate even has passed thatcorresponding to static loading.
Figure 5.13 Comparison of stress-strain relations obtained for concrete of different strengthswhen the strain rate is varied. The strain rates given refer to the transverse strainrate where the higher value corresponds to static loading. From Han (1996).
Nevertheless, at sufficiently high strain rates the presence of free water also affects thestrength of normal-strength concrete. This contribution, according to the results obtained byRossi et al. (1994) as shown in Figure 5.11, is approximately the same independently of thestatic strength of the concrete. Compared with the static strength, though, the strain ratesensitivity will increase with decreasing static strength. This idea corresponds well with theexpressions presented in CEB (1993) where the static strength of the concrete is taken intoaccount. As shown in Figures 5.6 and 5.7 the increase in strength due to strain rate is higherfor low-strength concrete. However, in absolute terms, the increase is more or less the same inboth tension and compression, respectively; see Figure 5.14.

105
0
5
10
15
20
10-5 10-4 10-3 10-2 10-1 100 101 102
strain rate [s-1]
Absolute increase in stress [Mpa]
ft = 2.36 MPa ft = 4.18 MPa
fc = 30 MPa fc = 60 MPa
Figure 5.14 Contribution of strength due to strain rate effects lower than 30 s-1 for differentconcrete strengths. According to CEB (1993).
The conclusions drawn above, regarding what influence the static strength has on the strainrate sensitivity, are not supported by everyone. Bischoff and Perry (1992) state, in theirsummary of the strain rate influence of compressive strength, that many researchers concludedthat concrete of high static strength is less sensitive to high strain rates. However, they alsopoint out that they do not agree that their summary indicates that this would be the case. Basedon the results presented in Figure 5.12 it still seems reasonable to take into account the staticstrength of the concrete, as is done in CEB (1993) and Malvar and Ross (1998), whendetermining what influence high strain rates have.
As discussed in Section 5.4.3 the transition zone, i.e. the steep increase in strength, forconcrete in tension appears at a strain rate that is approximately ten times lower than that forcompressed concrete. It was concluded that the reason for this phenomenon was the influenceof inertia forces within the material. The inertia effects will be negligible until such high strainrates are reached that the inertia forces within the concrete at least attain a value reasonablyclose to that of the static strength. Evidently, the lower the value these forces have to attain thelower is the required strain rate, and accordingly inertia effects should influence low-strengthconcrete earlier than high-strength concrete. Based on this reasoning, it is the author’s beliefthat the static strength also affects the strain rate at which the transition zone appears. Apart
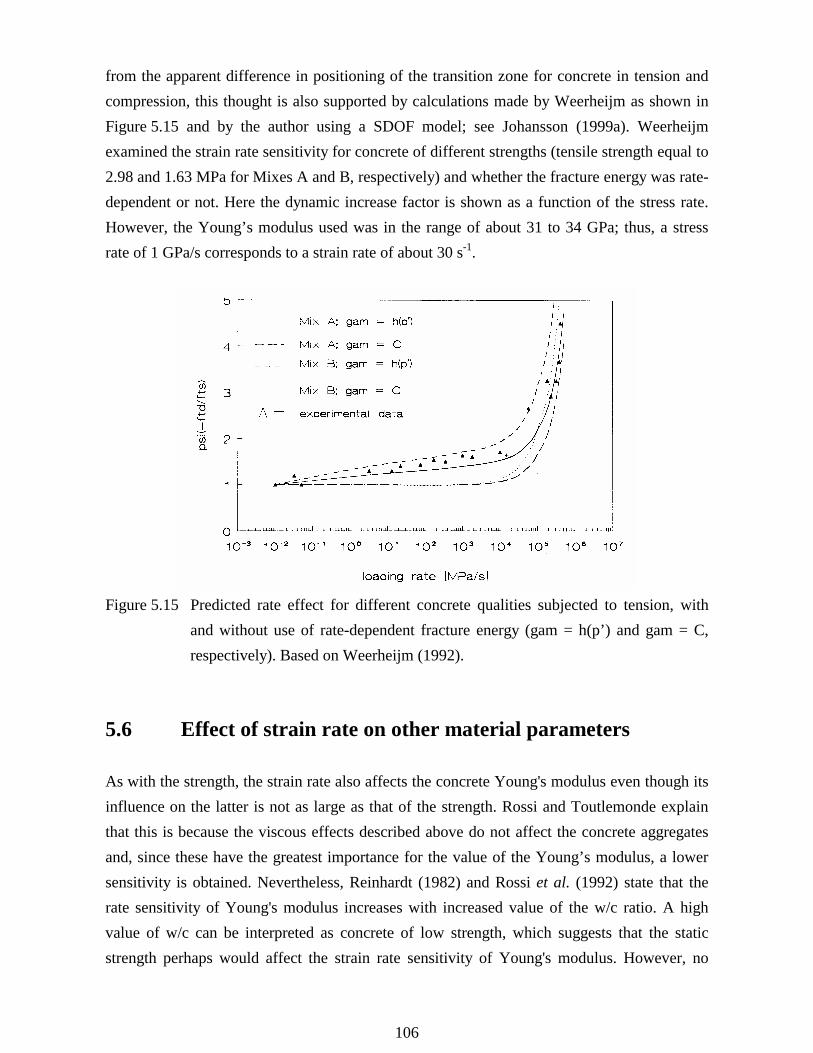
106
from the apparent difference in positioning of the transition zone for concrete in tension andcompression, this thought is also supported by calculations made by Weerheijm as shown inFigure 5.15 and by the author using a SDOF model; see Johansson (1999a). Weerheijmexamined the strain rate sensitivity for concrete of different strengths (tensile strength equal to2.98 and 1.63 MPa for Mixes A and B, respectively) and whether the fracture energy was rate-dependent or not. Here the dynamic increase factor is shown as a function of the stress rate.However, the Young’s modulus used was in the range of about 31 to 34 GPa; thus, a stressrate of 1 GPa/s corresponds to a strain rate of about 30 s-1.
Figure 5.15 Predicted rate effect for different concrete qualities subjected to tension, withand without use of rate-dependent fracture energy (gam = h(p’) and gam = C,respectively). Based on Weerheijm (1992).
5.6 Effect of strain rate on other material parameters
As with the strength, the strain rate also affects the concrete Young's modulus even though itsinfluence on the latter is not as large as that of the strength. Rossi and Toutlemonde explainthat this is because the viscous effects described above do not affect the concrete aggregatesand, since these have the greatest importance for the value of the Young’s modulus, a lowersensitivity is obtained. Nevertheless, Reinhardt (1982) and Rossi et al. (1992) state that therate sensitivity of Young's modulus increases with increased value of the w/c ratio. A highvalue of w/c can be interpreted as concrete of low strength, which suggests that the staticstrength perhaps would affect the strain rate sensitivity of Young's modulus. However, no
107
such consideration is taken in either CEB (1993) or Soroushian et al. (1986). The strain rateeffect according to these references is compared in Figure 5.16a; the former differs betweenthe sensitivities in compression and tension. To the author’s knowledge, there are no reportsin the literature stating that either of them exhibits a transition zone where the influence of thestrain rate suddenly increases.
CEB - CompressionCEB - TensionSoroushian et al.
0.8
1.0
1.2
1.4
1.6
1.8
2.0
10-5 10-4 10-3 10-2 10-1 100 101 102 103
Strain rate [s-1]
Fdyn / Fsta
CEB - CompressionCEB - TensionSoroushian et al.
0.8
1.0
1.2
1.4
1.6
1.8
2.0
10-5 10-4 10-3 10-2 10-1 100 101 102 103
Strain rate [s-1]
Fdyn / Fsta
(a) (b)
Figure 5.16 Influence of strain rate on: (a) Young's modulus, (b) strain at maximum stress.Based on CEB (1988, 1993) and Soroushian et al. (1986). The former differsbetween the rate sensitivities of concrete in compression and tension.
The strain rate effect on the strain at maximum stress is according to Bischoff and Perry(1991), unclear. In their summary of results reported in the literature they found contradictorytest results, stating that the strain at maximum stress may both increase and decrease withincreasing strain rate. Nevertheless, Bischoff and Perry think that the results indicate that thestrain does increase with increasing strain rate. The expressions given by CEB Bulletind’Information No 187, CEB (1988), and Soroushian et al. are presented in Figure 5.16b; noneof the expressions take the static strength into account.
How the fracture energy changes with increasing strain rate has not been examined to a largedegree, even though Ulfkjaer et al. (1996) state that it does increase at higher strain rates. Thisis also supported by CEB (1988) which gives an expression based on the velocity of the crackopening. Weerheijm (1992), though, states that this is not the case. Instead, the increase indeformation capacity and fracture energy observed in tests is due to multiple fracture and
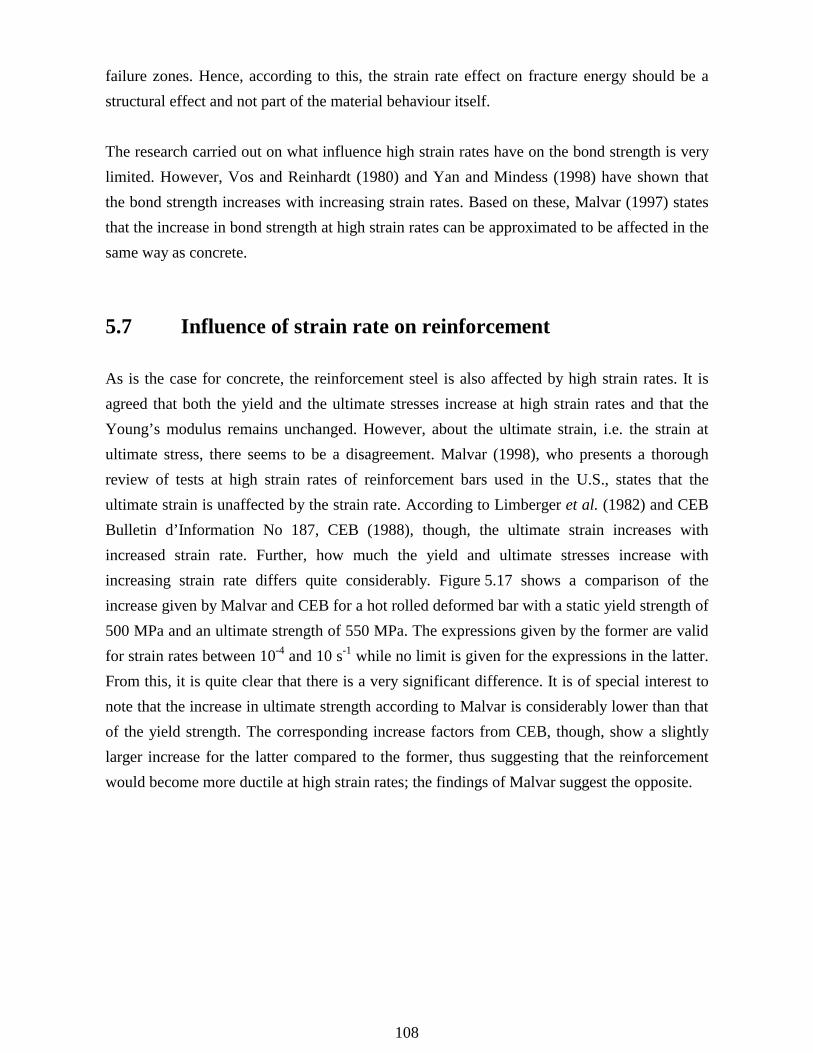
108
failure zones. Hence, according to this, the strain rate effect on fracture energy should be astructural effect and not part of the material behaviour itself.
The research carried out on what influence high strain rates have on the bond strength is verylimited. However, Vos and Reinhardt (1980) and Yan and Mindess (1998) have shown thatthe bond strength increases with increasing strain rates. Based on these, Malvar (1997) statesthat the increase in bond strength at high strain rates can be approximated to be affected in thesame way as concrete.
5.7 Influence of strain rate on reinforcement
As is the case for concrete, the reinforcement steel is also affected by high strain rates. It isagreed that both the yield and the ultimate stresses increase at high strain rates and that theYoung’s modulus remains unchanged. However, about the ultimate strain, i.e. the strain atultimate stress, there seems to be a disagreement. Malvar (1998), who presents a thoroughreview of tests at high strain rates of reinforcement bars used in the U.S., states that theultimate strain is unaffected by the strain rate. According to Limberger et al. (1982) and CEBBulletin d’Information No 187, CEB (1988), though, the ultimate strain increases withincreased strain rate. Further, how much the yield and ultimate stresses increase withincreasing strain rate differs quite considerably. Figure 5.17 shows a comparison of theincrease given by Malvar and CEB for a hot rolled deformed bar with a static yield strength of500 MPa and an ultimate strength of 550 MPa. The expressions given by the former are validfor strain rates between 10-4 and 10 s-1 while no limit is given for the expressions in the latter.From this, it is quite clear that there is a very significant difference. It is of special interest tonote that the increase in ultimate strength according to Malvar is considerably lower than thatof the yield strength. The corresponding increase factors from CEB, though, show a slightlylarger increase for the latter compared to the former, thus suggesting that the reinforcementwould become more ductile at high strain rates; the findings of Malvar suggest the opposite.
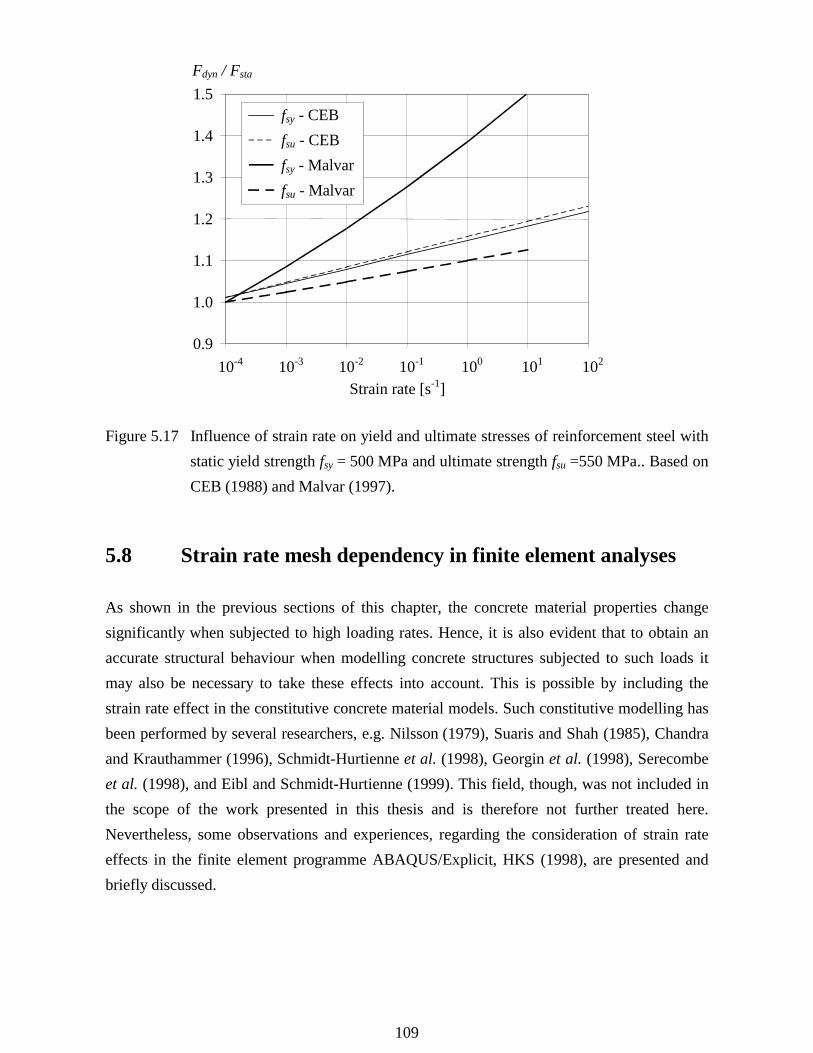
109
1.0
0.9
1.1
1.2
1.3
1.4
1.5
10-4 10-3 10-2 10-1 100 101 102
Strain rate [s-1]
Fdyn / Fsta
fsy - Malvar fsu - Malvar
fsy - CEB fsu - CEB
Figure 5.17 Influence of strain rate on yield and ultimate stresses of reinforcement steel withstatic yield strength fsy = 500 MPa and ultimate strength fsu =550 MPa.. Based onCEB (1988) and Malvar (1997).
5.8 Strain rate mesh dependency in finite element analyses
As shown in the previous sections of this chapter, the concrete material properties changesignificantly when subjected to high loading rates. Hence, it is also evident that to obtain anaccurate structural behaviour when modelling concrete structures subjected to such loads itmay also be necessary to take these effects into account. This is possible by including thestrain rate effect in the constitutive concrete material models. Such constitutive modelling hasbeen performed by several researchers, e.g. Nilsson (1979), Suaris and Shah (1985), Chandraand Krauthammer (1996), Schmidt-Hurtienne et al. (1998), Georgin et al. (1998), Serecombeet al. (1998), and Eibl and Schmidt-Hurtienne (1999). This field, though, was not included inthe scope of the work presented in this thesis and is therefore not further treated here.Nevertheless, some observations and experiences, regarding the consideration of strain rateeffects in the finite element programme ABAQUS/Explicit, HKS (1998), are presented andbriefly discussed.
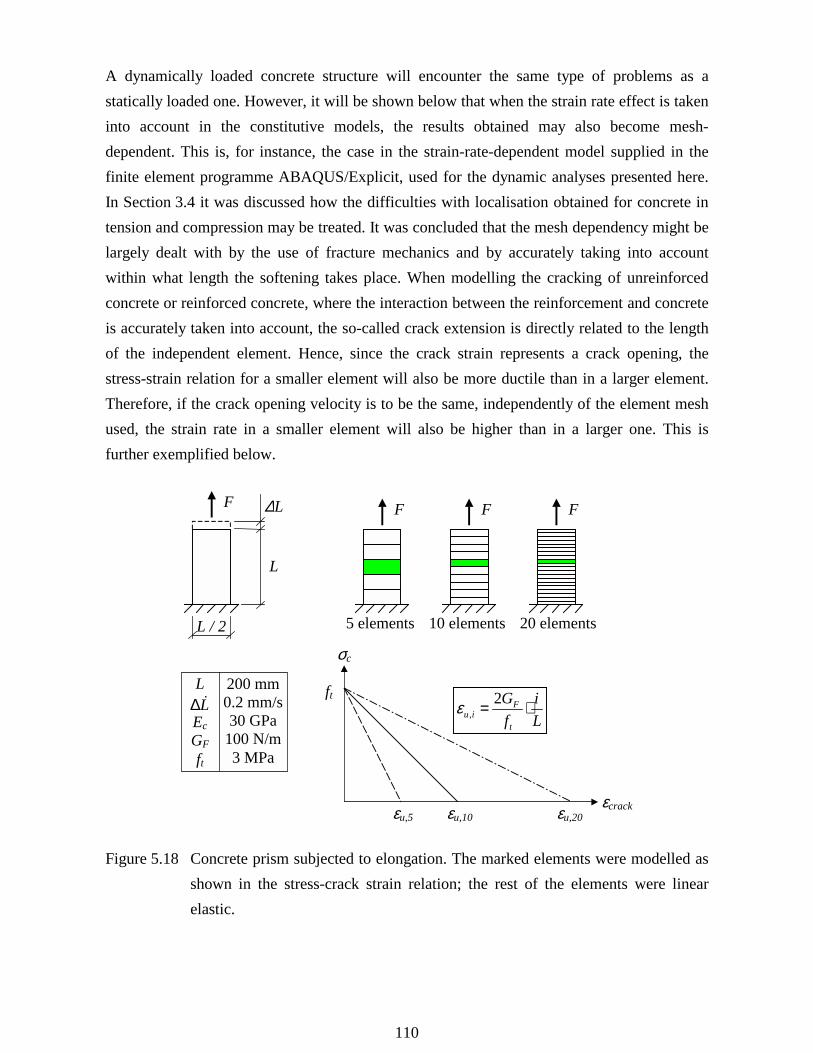
110
A dynamically loaded concrete structure will encounter the same type of problems as astatically loaded one. However, it will be shown below that when the strain rate effect is takeninto account in the constitutive models, the results obtained may also become mesh-dependent. This is, for instance, the case in the strain-rate-dependent model supplied in thefinite element programme ABAQUS/Explicit, used for the dynamic analyses presented here.In Section 3.4 it was discussed how the difficulties with localisation obtained for concrete intension and compression may be treated. It was concluded that the mesh dependency might belargely dealt with by the use of fracture mechanics and by accurately taking into accountwithin what length the softening takes place. When modelling the cracking of unreinforcedconcrete or reinforced concrete, where the interaction between the reinforcement and concreteis accurately taken into account, the so-called crack extension is directly related to the lengthof the independent element. Hence, since the crack strain represents a crack opening, thestress-strain relation for a smaller element will also be more ductile than in a larger element.Therefore, if the crack opening velocity is to be the same, independently of the element meshused, the strain rate in a smaller element will also be higher than in a larger one. This isfurther exemplified below.
F
5 elements
F
10 elements
F
20 elements
F ∆L
L
L / 2
LL�∆
EcGFft
200 mm0.2 mm/s30 GPa
100 N/m3 MPa
εu,5 εu,10 εu,20
ft
Li
fG
t
Fiu ⋅= 2
,ε
εcrack
σc
Figure 5.18 Concrete prism subjected to elongation. The marked elements were modelled asshown in the stress-crack strain relation; the rest of the elements were linearelastic.

111
Figure 5.18 shows a concrete prism, of length 0.2 m and cross-section 100 x 100 mm,subjected to an elongation in displacement-controlled loading at speed L�∆ . The prism wasmodelled by using three different element meshes made up of 5, 10 or 20 beam elements. Oneelement in each mesh, positioned approximately in the prism midsection, was modelled asnon-linear with a tensile strength and a linear stress-crack strain relation using von Misesplasticity; the rest of the elements were modelled as linear elastic. As mentioned above, thestress-strain relations used are related to the size of the cracking element, hence assuring thatthe resulting force-elongation relation will be the same independently of what element meshwas used.
Figure 5.19a shows the strain rate obtained in the cracking element. Initially, it is the same forall three meshes. However, when the tensile strength is reached at an elongation of∆L = 0.02 mm and cracking is initiated, a localisation is obtained in the cracked element; therest of the elements in the prism unload. The strain rate will then also be considerablyaffected, obtaining a value inversely proportional to the length of the element. This has noeffect, though, if the material model used is strain-rate-independent; the load-elongationrelation will then be the same independently of what mesh is used. However, if the strain rateeffect is included in the concrete constitutive model it may cause a considerable change in thegeneral behaviour.
0
5
10
15
20
25
30
35
40
0.00 0.01 0.02 0.03 0.04 0.05 0.06 0.07 0.08
Strain rate [s-1 ⋅10-3]
20 elements10 elements5 elements
Elongation, ∆L [mm]
Strain rate [s-1 ⋅10-3]
0
5
10
15
20
25
30
35
40
0.00 0.01 0.02 0.03 0.04 0.05 0.06 0.07 0.08Elongation, ∆L [mm]
20 elements10 elements5 elements
(a) (b)
Figure 5.19 Strain rate in cracking element when the material model is: (a) non-rate-dependent; (b) rate-dependent.
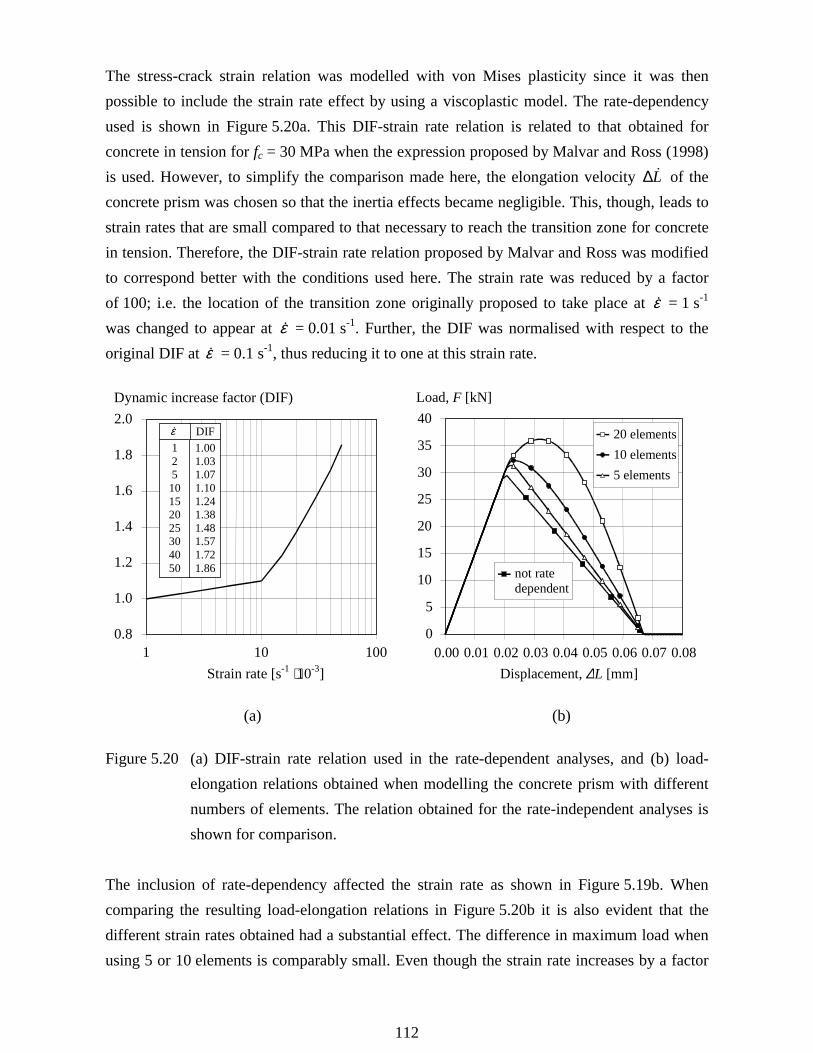
112
The stress-crack strain relation was modelled with von Mises plasticity since it was thenpossible to include the strain rate effect by using a viscoplastic model. The rate-dependencyused is shown in Figure 5.20a. This DIF-strain rate relation is related to that obtained forconcrete in tension for fc = 30 MPa when the expression proposed by Malvar and Ross (1998)is used. However, to simplify the comparison made here, the elongation velocity L�∆ of theconcrete prism was chosen so that the inertia effects became negligible. This, though, leads tostrain rates that are small compared to that necessary to reach the transition zone for concretein tension. Therefore, the DIF-strain rate relation proposed by Malvar and Ross was modifiedto correspond better with the conditions used here. The strain rate was reduced by a factorof 100; i.e. the location of the transition zone originally proposed to take place at ε� = 1 s-1
was changed to appear at ε� = 0.01 s-1. Further, the DIF was normalised with respect to theoriginal DIF at ε� = 0.1 s-1, thus reducing it to one at this strain rate.
0.8
1.0
1.2
1.4
1.6
1.8
2.0
1 10 100Strain rate [s-1 ⋅10-3]
Dynamic increase factor (DIF)
12510152025304050
1.001.031.071.101.241.381.481.571.721.86
DIFε�
0
5
10
15
20
25
30
35
40
0.00 0.01 0.02 0.03 0.04 0.05 0.06 0.07 0.08Displacement, ∆L [mm]
Load, F [kN]
20 elements10 elements5 elements
not ratedependent
(a) (b)
Figure 5.20 (a) DIF-strain rate relation used in the rate-dependent analyses, and (b) load-elongation relations obtained when modelling the concrete prism with differentnumbers of elements. The relation obtained for the rate-independent analyses isshown for comparison.
The inclusion of rate-dependency affected the strain rate as shown in Figure 5.19b. Whencomparing the resulting load-elongation relations in Figure 5.20b it is also evident that thedifferent strain rates obtained had a substantial effect. The difference in maximum load whenusing 5 or 10 elements is comparably small. Even though the strain rate increases by a factor

113
of two; its effect on the material properties is still about the same. However, the increase inload capacity is more apparent for the prism modelled by 20 elements. Here, the strain rate atmaximum load has passed the transition zone and the DIF is therefore considerably increased.From this it can be concluded that, depending on which side of the transition zone theresulting strain rates are obtained at, a change in element size may have a very significanteffect on the final result. Using different DIF-strain rate relations for different mesh sizescould perhaps partly solve this problem, but it is still to be determined what element lengthcorresponds to the original DIF-strain rate relation proposed by for instance, Malvar and Ross.Until then, it is the author’s opinion that the use of rate-dependent material models, such asthose in ABAQUS/Explicit, should be exercised with great care. This is also the reason whythe reinforcement in the shelter analyses presented in Paper III was not modelled as a rate-dependent material.

114
115
6 Numerical solution methods for dynamic problems
6.1 General
The equilibrium equation for a dynamic problem can be written as
PKUUCUM =++ ��� (6.1)
where M, C and K represent the mass, damping and stiffness matrices; U�� , U� and U are theacceleration, velocity and displacement vectors, respectively. When using numerical methodsto solve this equation, two different classes of methods are, according to Bathe (1996),generally used: the mode superposition and direct integration methods. The choice of whichmethod is best to use is determined by the numerical effectiveness. The dynamic analysespresented in this thesis, though, have only made use of the latter, so the former is mentionedvery briefly. For a more thorough description of mode superposition, see for instance Bathe(1996).
6.2 Mode superposition
In the mode superposition method, the dynamic equilibrium equation (6.1) is first transformedinto a form in which is less costly to solve. The transformation matrix used may be establishedby neglecting the damping and using the displacement solutions of the free-vibrationequilibrium equations
0=+ KUUM �� (6.2)
To solve this, the displacement can be assumed to be have the form
)(sin 0ttU −= ωφ (6.3)
where φ is a vector of order n describing the shapes of the n first modes, ω is the angularfrequency, t is time and t0 is a time constant. Combining equations (6.2) and (6.3) aneigenproblem of the form
φωφ MK 2= (6.4)
is obtained. The eigenvalues and their corresponding eigenvectors are found, and the latterform the transformation matrix. As shown in for example Bathe, the use of this transformation

116
matrix yields a decoupled system of equations, which means that the response of the modes inthe analysed structure can be determined individually. These modes can then be superposedand the response of the whole structure determined. Thus, the advantage with a modesuperposition analysis is that not all modes have to be considered; instead only those believedto affect the response of the structure studied need to be taken into account. This is theprimary reason why this procedure can be much more effective than direct integrationmethods. However, it also means that the effectiveness depends on how many modes have tobe taken into account, something that usually depends on a combination of the geometry ofthe structure, the distribution in time and space of the load, and the load frequency content. Aharmonically loaded structure needs a small number of modes, while for example a highlytransient load, such as a blast load, needs substantially more modes to obtain an accuratesolution. Further, the method might not be very effective for solving non-linear problems. Themode superposition procedure is well suited to solve strictly linear problems where a highercost-efficiency often can be achieved, compared to a direct integration method. However, fornon-linear problems the mode forms will vary with time, which means that they will have tobe recalculated in each step, thus making the method far less attractive for such problems.According to Bathe, mode superposition only efficient for non-linear dynamic problems onlyif a relatively small number of modes is necessary; if this criterion cannot be met, then directintegration should be used instead.
6.3 Direct integration methods
6.3.1 General
When solving a problem by using a direct integration method, the expression in equation (6.1)is solved numerically through an incremental process. The term “direct” means that notransformation to another form of this expression takes place prior to the numericalintegration. The direct integration methods are, according to Bergan et al. (1986), commonlyclassified into two groups: explicit and implicit methods. The essential difference betweenthese two classes can be said to be when in time the equilibrium of equation (6.1) is solved.For the explicit methods, the displacement vector t+∆tU is solved by using the equilibrium attime t; for the implicit methods it is instead solved at time t+∆t; compare equations (6.5) and(6.6) respectively.
117
PUKUCUM tttt =++ ��� (6.5)
PUKUCUM tttttttt ∆+∆+∆+∆+ =++ ��� (6.6)
The index used refers to what time the parameter used belongs to; e.g. Ut �� indicates theacceleration at time t and Utt �∆+ refers to the velocity at time t+∆t. Here, M, C and K areassumed to be constant in time.
Several integration methods have been developed, of which many can be said to be specialcases of the more generalised Newmark method which is briefly treated here; for moreinformation the reader is referred to, for instance, Hughes (1987) or Bathe (1996). In theNewmark method, the velocity and displacement vectors are expressed as
( )[ ]UUtUU tttttt ������ ∆+∆+ +−∆+= δδ1 (6.7)
���
� +��
��
−∆+∆+= ∆+∆+ UUtUtUU ttttttt ����� αα212 (6.8)
where δ and α are parameters that are used to obtain accuracy and stability, respectively.According to Bergan et al. (1986) the former is used to control the numerical damping in thesolution algorithm, and the latter is used to control what solution method is used. To betterillustrate the difference between explicit and implicit integration methods, the explicit centraldifference method and the implicit trapezoidal rule (also referred to as the constant-averageacceleration method) are presented below. To better visualise the difference between themethods, initially only linear problems are treated here; the influence of non-linear behaviouris discussed in Section 6.3.4.
6.3.2 Explicit integration method
By setting the numerical damping to zero, i.e. δ = 0.5, and using α = 0 in the Newmarkmethod, the central difference method is obtained, which is a commonly used explicit method.Using the values given above for δ and α in equations (6.7) and (6.8), and assuming a constanttime step ∆t, the acceleration and velocity at time t can be expressed as
( )UUUt
U tttttt ∆−∆+ +−∆
= 212
�� (6.9)
( )UUt
U ttttt ∆−∆+ −∆
=21
� (6.10)

118
The solution for the displacement U at time t+∆t is then obtained by combining these twoexpressions with that in equation (6.5) and an expression for t+∆tU can be derived as
����
� ���
�
∆−
∆−
���
�
∆−−
�
���
�
∆+
∆= ∆−
−∆+ U
tC
tMU
tMKP
tC
tMU tttttt
22
2 22
1
2 (6.11)
Since all terms on the right-hand side are known from time t-∆t or time t, the displacementt+∆tU can be explicitly determined.
It can be shown that the central difference method is conditionally stable, i.e. that the timestep ∆t used in equation (6.11) has to be less than or equal to a critical time step ∆tcr if anacceptable solution is to be obtained; see also Section 6.3.5. This critical time step is normallyvery small, which usually means that it takes a lot of increments for the analysis to cover thetime period that is to be examined. Consequently, an important criterion for the method to beof practical use is that the response in each increment can be solved very effectively.However, this is possible by neglecting the effect of damping or making sure to use a diagonaldamping matrix, and by using a lumped (i.e. diagonal) mass matrix. Thereby, the inverted partin equation (6.11) can easily be determined and t+∆tU solved by the use of ordinary matrixmultiplication. Hence, a fast and effective solution method is obtained since the calculationsnecessary in each increment become very “cheap”.
As shown in equation (6.11) the calculation of t+∆tU makes use of both tU and t-∆tU. However,this means that when solving the displacement at time ∆t information about the displacementat time -∆t is needed. Hence, to calculate the displacement at time ∆t it is necessary to use aspecial starting procedure that according to Bathe is expressed as
UtUtUUt ��� 02
00
2∆+∆−=∆− (6.12)
119
6.3.3 Implicit integration method
If δ and α are set to 0.5 and 0.25, respectively, in the Newmark method the so-calledtrapezoidal rule is obtained. Thus, the velocity and displacement vectors can be written as
( )UUtUU tttttt ������ ∆+∆+ +∆+=2
(6.13)
( )UUtUtUU ttttttt ����� ∆+∆+ +∆+∆+=4
2
(6.14)
and by using these expressions in equation (6.6) the displacement at time t+∆t can be derivedas
����
� ���
�
∆+
∆+
���
� +∆
++�
���
� +∆
+∆
= ∆+−
∆+ Ut
CtMUC
tMUMPK
tC
tMU ttttttt 24424
2
1
2��� (6.15)
Contrary to the central difference method, the trapezoidal rule is unconditionally stable; thatis, the stability of the solution remains independent of what value of the time step ∆t is used.Neither does it need a special starting procedure since the displacement at time t+∆t onlydepends on parameters at time t and t+∆t. This is the unconditionally stable method originallyproposed by Newmark and is, according to Bathe, also the one which has the most desirableaccuracy characteristic. A closer look at the expression in equation (6.15) reveals that thestiffness matrix K is included in the term that has to be inverted (i.e. the effective stiffnessmatrix) to obtain the displacement t+∆tU. Due to his requirement each increment will be farmore “expensive” in this method than the central difference method, where this procedure isnot necessary; compare equation (6.11). Finally, it is worth noting that if the effect of inertiaand damping is neglected in the expression given in equation (6.15) it is reduced to a staticanalysis, i.e. if C and M is set to zero the static solution is obtained for a time-dependent load.Doing the same with the central difference method, though, is not possible.
6.3.4 Solution of non-linear problems
The expressions to determine the displacement at time t+∆t by an explicit and an implicitmethod were derived in equations (6.11) and (6.15), respectively. It has been discussed abovethat the treatment of the stiffness matrix differs in the two methods. However, in theforegoing, only linear problems were treated; thus the stiffness matrix K was also constant. If
120
the problem is non-linear, there are more differences in how a solution is obtained in thedifferent analyses. If assuming non-linear material behaviour, the stiffness matrix K will nolonger be constant; instead at time t it depends on the displacement tU. Accordingly equations(6.11) and (6.15) can be rewritten as
����
� ���
�
∆−
∆−
���
�
∆−−
�
���
�
∆+
∆= ∆−
−∆+ U
tC
tMU
tMKP
tC
tMU ttttttt
22
2 22
1
2 (6.16)
and
����
� ���
�
∆+
∆+
���
� +∆
++�
���
� +∆
+∆
= ∆+−
∆+∆+ Ut
CtMUC
tMUMPK
tC
tMU ttttttttt 24424
2
1
2��� (6.17)
respectively. Above, it has been assumed that only the stiffness matrix depends on time, andthat the mass and damping remain constant. For the solution of t+∆tU using the explicit centraldifference method in equation (6.16) there will not be any essential changes, the distinctionbeing that the stiffness is now time-dependent. Consequently, since t+∆tU depends only onvalues already known, the same procedure as in the linear case can be used. However, this isnot the case for the implicit trapezoidal rule. Here t+∆tU depends on t+∆tK, which in turndepends on t+∆tU. Hence, the use of an iteration process is necessary to reach a solution, thusmaking the method even more “expensive”. To summarise, when using an explicit method itdoes not matter whether the problem is linear or non-linear; the time needed to solve theproblem will be the same anyway. But, for an implicit method it will have a large effect, sincea non-linear problem has to be solved with the help of an iteration process.
6.3.5 Stability
It was mentioned above that the central difference method is conditionally stable, and that itsmajor disadvantage was that it has to make use of an often very small time step ∆t. Contraryto this, the implicit trapezoidal rule is unconditionally stable, meaning that there is no suchlimitation on what time step can be used. That a solution is stable means that any errors in thesolution, due for example to round-off in the computer, do not grow in the continuoscalculation. However, as already noted, the stability of a solution can be guaranteed by using asufficiently small time step ∆t so that the response in the highest-frequency component is
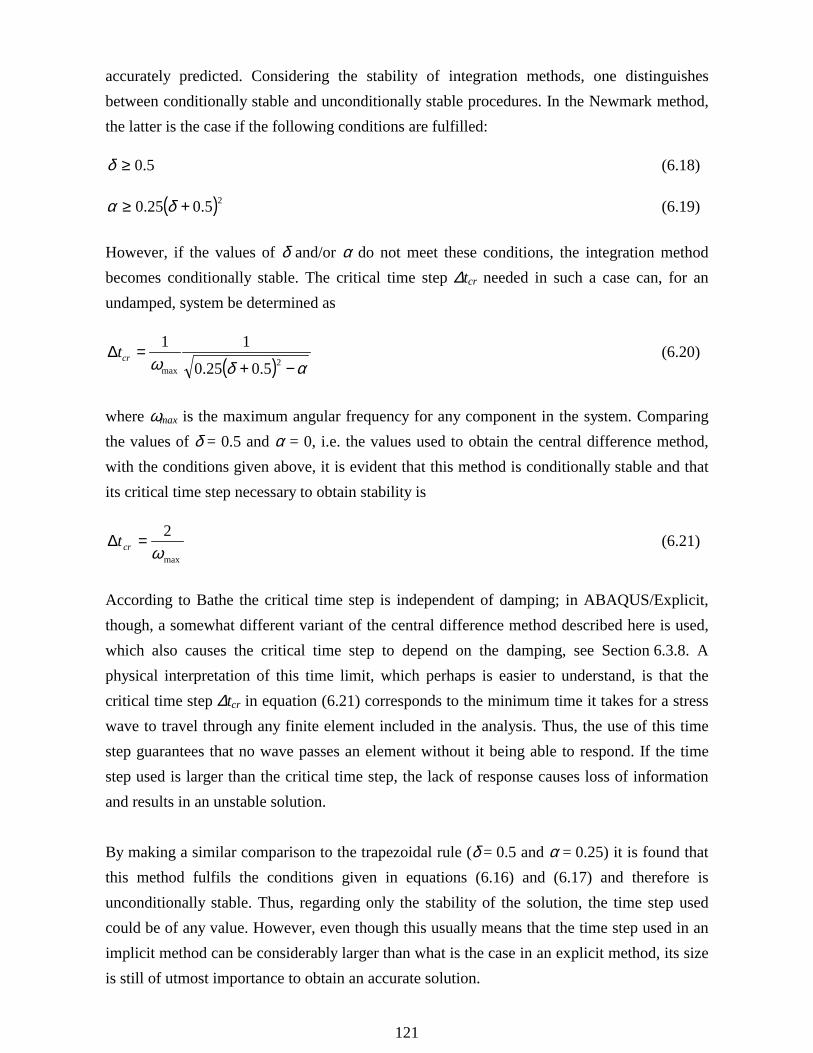
121
accurately predicted. Considering the stability of integration methods, one distinguishesbetween conditionally stable and unconditionally stable procedures. In the Newmark method,the latter is the case if the following conditions are fulfilled:
5.0≥δ (6.18)
( )25.025.0 +≥ δα (6.19)
However, if the values of δ and/or α do not meet these conditions, the integration methodbecomes conditionally stable. The critical time step ∆tcr needed in such a case can, for anundamped, system be determined as
( ) αδω −+=∆
2max 5.025.0
11crt (6.20)
where ωmax is the maximum angular frequency for any component in the system. Comparingthe values of δ = 0.5 and α = 0, i.e. the values used to obtain the central difference method,with the conditions given above, it is evident that this method is conditionally stable and thatits critical time step necessary to obtain stability is
max
2ω
=∆ crt (6.21)
According to Bathe the critical time step is independent of damping; in ABAQUS/Explicit,though, a somewhat different variant of the central difference method described here is used,which also causes the critical time step to depend on the damping, see Section 6.3.8. Aphysical interpretation of this time limit, which perhaps is easier to understand, is that thecritical time step ∆tcr in equation (6.21) corresponds to the minimum time it takes for a stresswave to travel through any finite element included in the analysis. Thus, the use of this timestep guarantees that no wave passes an element without it being able to respond. If the timestep used is larger than the critical time step, the lack of response causes loss of informationand results in an unstable solution.
By making a similar comparison to the trapezoidal rule (δ = 0.5 and α = 0.25) it is found thatthis method fulfils the conditions given in equations (6.16) and (6.17) and therefore isunconditionally stable. Thus, regarding only the stability of the solution, the time step usedcould be of any value. However, even though this usually means that the time step used in animplicit method can be considerably larger than what is the case in an explicit method, its sizeis still of utmost importance to obtain an accurate solution.
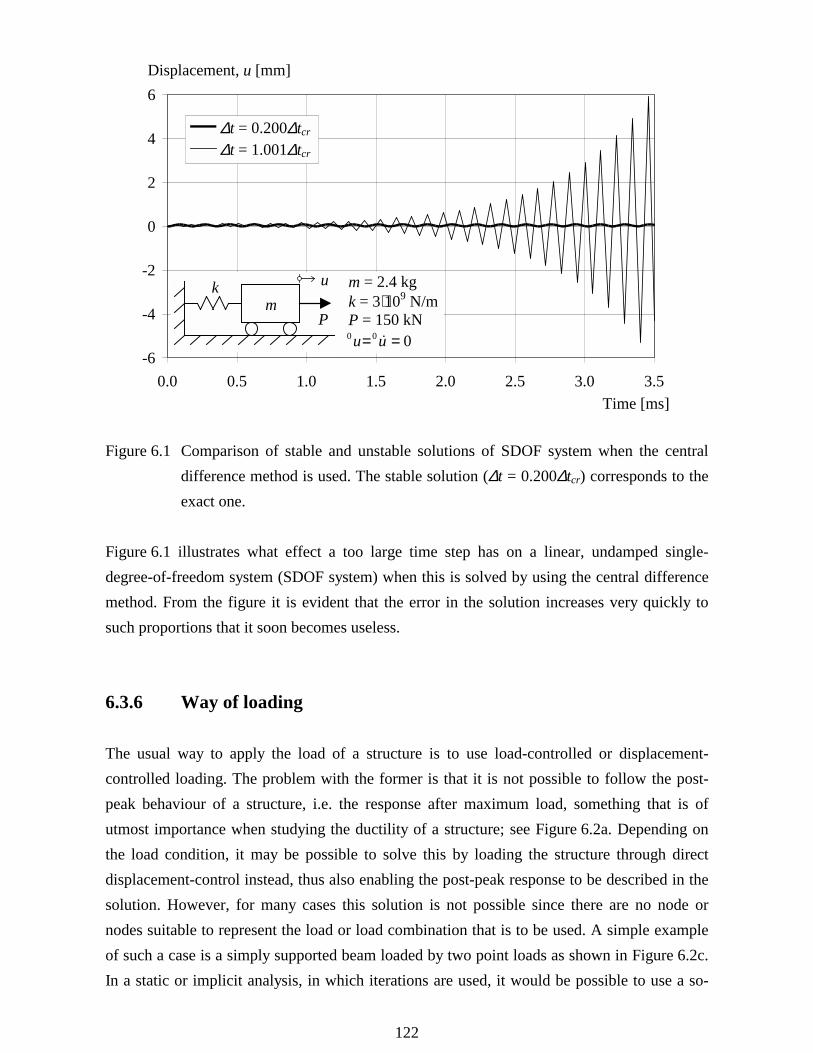
122
-6
-4
-2
0
2
4
6
0.0 0.5 1.0 1.5 2.0 2.5 3.0 3.5
m = 2.4 kg k = 3⋅109 N/m P = 150 kN
000 == uu �
mP
k u
Time [ms]
Displacement, u [mm]
∆t = 0.200∆tcr
∆t = 1.001∆tcr
Figure 6.1 Comparison of stable and unstable solutions of SDOF system when the centraldifference method is used. The stable solution (∆t = 0.200∆tcr) corresponds to theexact one.
Figure 6.1 illustrates what effect a too large time step has on a linear, undamped single-degree-of-freedom system (SDOF system) when this is solved by using the central differencemethod. From the figure it is evident that the error in the solution increases very quickly tosuch proportions that it soon becomes useless.
6.3.6 Way of loading
The usual way to apply the load of a structure is to use load-controlled or displacement-controlled loading. The problem with the former is that it is not possible to follow the post-peak behaviour of a structure, i.e. the response after maximum load, something that is ofutmost importance when studying the ductility of a structure; see Figure 6.2a. Depending onthe load condition, it may be possible to solve this by loading the structure through directdisplacement-control instead, thus also enabling the post-peak response to be described in thesolution. However, for many cases this solution is not possible since there are no node ornodes suitable to represent the load or load combination that is to be used. A simple exampleof such a case is a simply supported beam loaded by two point loads as shown in Figure 6.2c.In a static or implicit analysis, in which iterations are used, it would be possible to use a so-

123
called arch length method to follow the response until final failure; but in an explicit methodthis is, to the author’s knowledge, not possible since no iterations are carried out. It wouldperhaps be possible to follow the post-peak response using load-controlled loading also butthen an iterative procedure including the external load and the displacement in the controllednode would be necessary. Therefore, regarding the possibility to model different load cases, anexplicit method is at a disadvantage of an implicit one.
δ
F(b)
(c)Displacement, δ
Load, F
(a)
point reached when usingload-controlled loading
point reached whenusing displacement-controlled loading
Figur 6.2 (a) Schematic view showing the difference in response that it is possible to followwhen using load-controlled or displacement-controlled loading. Example of loadcase where it is (b) possible, and (c) not possible, to use direct displacementcontrolled loading.
Apart from displacement-controlled loading, it is also possible in dynamic analyses to applythe load as velocity-controlled as well. The advantage of this method is that the load then isapplied more “smoothly” than is the case using displacement-controlled loading. Thus, it ispossible to avoid acceleration terms approaching infinity as schematically shown inFigure 6.3.
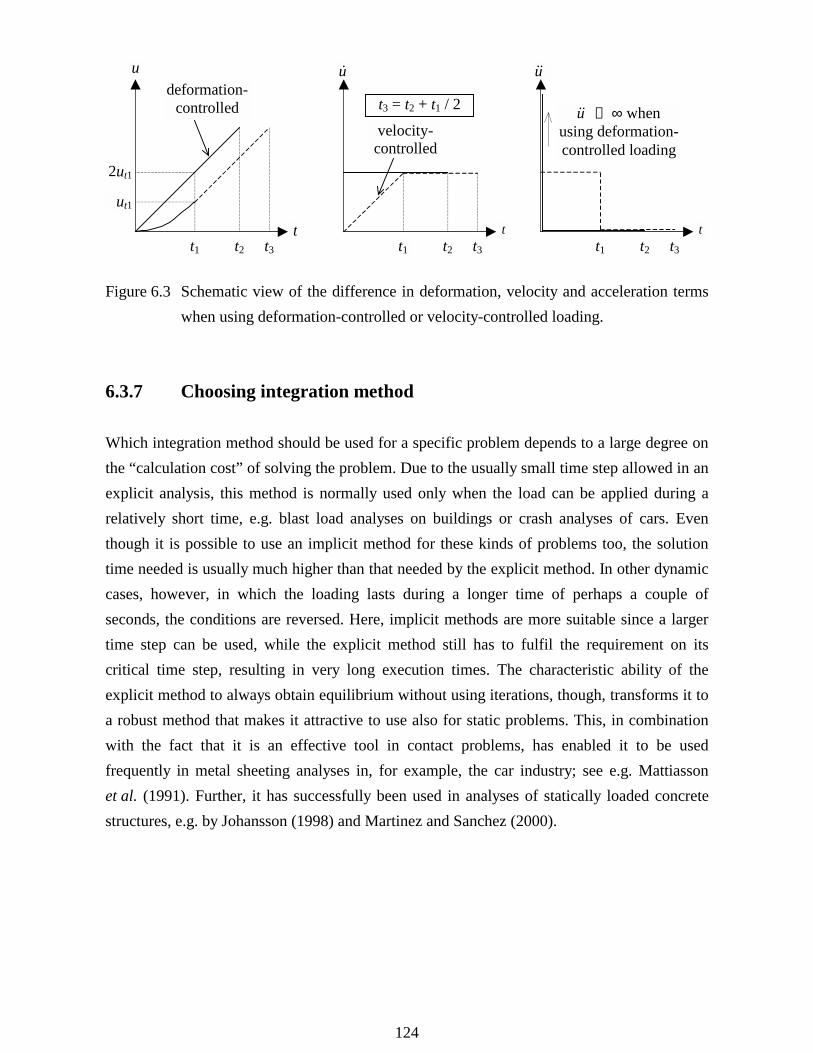
124
t
u
t
u�
t
u��
t1 t2 t3 t1 t2 t3 t1 t2 t3
u�� → ∞ whenusing deformation-controlled loading
t3 = t2 + t1 / 2
2ut1
ut1
deformation-controlled
velocity-controlled
Figure 6.3 Schematic view of the difference in deformation, velocity and acceleration termswhen using deformation-controlled or velocity-controlled loading.
6.3.7 Choosing integration method
Which integration method should be used for a specific problem depends to a large degree onthe “calculation cost” of solving the problem. Due to the usually small time step allowed in anexplicit analysis, this method is normally used only when the load can be applied during arelatively short time, e.g. blast load analyses on buildings or crash analyses of cars. Eventhough it is possible to use an implicit method for these kinds of problems too, the solutiontime needed is usually much higher than that needed by the explicit method. In other dynamiccases, however, in which the loading lasts during a longer time of perhaps a couple ofseconds, the conditions are reversed. Here, implicit methods are more suitable since a largertime step can be used, while the explicit method still has to fulfil the requirement on itscritical time step, resulting in very long execution times. The characteristic ability of theexplicit method to always obtain equilibrium without using iterations, though, transforms it toa robust method that makes it attractive to use also for static problems. This, in combinationwith the fact that it is an effective tool in contact problems, has enabled it to be usedfrequently in metal sheeting analyses in, for example, the car industry; see e.g. Mattiassonet al. (1991). Further, it has successfully been used in analyses of statically loaded concretestructures, e.g. by Johansson (1998) and Martinez and Sanchez (2000).
125
6.3.8 Central difference method in ABAQUS/Explicit
The central difference method used in ABAQUS/Explicit, HKS (1997), is somewhat differentfrom the one described in Section 6.3.2 and is therefore treated briefly here. The expression inequation (6.9) for the acceleration remains the same but the velocity in equation (6.10) ischanged to
( )t t t t tUt
U U− −= −∆ ∆
∆2 1� (6.22)
i.e. the velocity is specified at time t-∆t/2 instead of time t. By combining equations (6.5),(6.9) and (6.22) it is possible to derive an expression for the displacement at time t+∆tcorresponding to that shown in equation (6.11) and the displacement t+∆tU can then be derivedas
t t t t t tU t M P K Mt
Ct
U Mt
Ct
U+ − −= − − −� � − −�
����
�
��
�
∆ ∆∆∆ ∆ ∆ ∆
2 12 2
2 (6.23)
As is the case in equation (6.11) all parameters on the right-hand side are known and thedisplacement t+∆tU can therefore be determined explicitly. Further, from this it can be seenthat the damping matrix C is no longer part of the term that has to be inverted. Accordingly,any type of damping can now be taken into account without affecting the efficiency of thecalculation. The mass matrix, though, still has to be lumped to ensure that a quick solution ofM -1 is possible. This kind of central difference method gives the same accuracy as thatpreviously described. However, contrary to the original method discussed in Section 6.3.2 thedamping coefficient now influences the stability of the solution:
( )ξξω
−+=∆ 2
max
12crt (6.24)
and hence the critical time step ∆tcr becomes a function of the damping coefficient ξ.

126
127
7 Conclusions
7.1 General
The main aim of this research project was to evaluate a new design proposal of thereinforcement detailing in concrete frame corners of Swedish civil defence shelters, and toexamine whether this detailing, consisting of reinforcement loops spliced within the corner, isappropriate to replace the detailings previously used in closing and opening frame corners.This part of the study was carried out by a combination of a literature survey, experimentaltesting and non-linear finite element analyses. Further, since a civil defence shelter must beable to withstand highly dynamic load cases, where the structural response might be quitedifferent, another aim was to increase the knowledge of what structural response is obtainedwhen subjected to such loads and to examine whether the conclusions drawn from static testsand analyses could also be used in such a case. This was dealt with by studying a civildefence shelter, subjected to a blast load from an explosion or falling masses from acollapsing building, using dynamic non-linear finite element analyses.
The reinforcement detailings used in opening frame corners are very critical for what responsewill be obtained. A common approach is to use reinforcement loops combined with inclinedbars positioned at the inside of the corner. However, it is shown herein that the use of suchinclined bars may not be as efficient as commonly thought. Instead they may as well bereplaced by an equivalent amount of extra reinforcement loops, thus resulting in a detailingthat may be considerably easier to carry out. Neither detailing, though, is guaranteed to fulfilthe requirement of full efficiency, as it is defined here, unless the mechanical reinforcement islower than an upper limit, here derived to be ωs = 0.033 for concrete of compressive strengthless than 50 MPa. This might be difficult to fulfil if using high reinforcement ratios, and adiscussion of possible solutions is therefore presented. It was found that the best methodprobably is to increase the concrete strength within the corner, especially by the use of fibre-reinforced concrete. Although full efficiency of such a corner detailing may not be achieved, aductile behaviour may very well still be obtained. Further, it was concluded that if inclinedbars are to be used it is important not to splice the reinforcement loops and straight bars justoutside the corner region.
Contrary to opening corners, frame corners subjected to closing moment are less sensitive towhat reinforcement detailing is used. Accordingly, even though test results indicate that theuse of reinforcement loops causes increased risk of concrete side spalling, the new proposal

128
has proven to be at least as efficient as the conventional one. The negative influence due tosuch spalling of the side concrete cover will, in a wall-slab connection, be of minorimportance due to the large number of bars present. In a beam-column joint, though, this isnot necessarily the case and special attention must be given to the spalling phenomenon insuch structures since it may have great influence on the final capacity.
In the dynamic analyses of a shelter it was found that the global response of a structuresubjected to a blast load, in the initial stage, may be very different from that of a static load. Amajor reason is that the boundary conditions of a structure subjected to high-rate loading maybe regarded as time-dependent. Nevertheless, the results obtained indicate that no criticalcracks will form within the corner region, and it therefore seems reasonable to believe that theresponse within such a corner will be similar to that obtained in a statically loaded structure.Accordingly, even though the structural behaviour may be completely different in static andtransient loaded structures the local behaviour may still be rather similar. Consequently, it canbe concluded that it is suitable to replace the conventional detailings in both opening andclosing frame corners in civil defence shelters with the new reinforcement proposal of splicedreinforcement loops within the corner. In opening corners, though, an additionalreinforcement amount up to 35% may be required. As a result of the work presented herein,this detailing is now prescribed in the present Swedish Shelter Regulations, Swedish RescueServices Agency (1998).
The non-linear finite element analyses carried out within the scope of this work have shownthat the finite element method can be a very powerful tool in the study of reinforced concretestructures. Such analyses may supply the means for further understanding and increasedknowledge of the often complicated response in reinforced concrete structures, making itpossible to explain phenomena in a way that would not be possible by using onlyconventional testing and evaluation methods. Nevertheless, it is important to remember thatexperimental testing cannot be neglected since they always describe the reality, while theformer is just an attempt to simulate it. Hence, while both methods have certain advantageswhen used alone, they will only be at their fullest advantage when combined. However, theuse of such an advanced tool also puts a high demand on the user. The post-peak behavioursfor concrete in tension and compression, for instance, are both highly localised phenomena,making it difficult to determine a correct stress-strain relation to use in an analysis. To be ableto accurately simulate such a response the concept of fracture energy and the length of thesoftening region have to be considered. For concrete in tension this is a fully acceptedapproach, whereas for concrete in compression it is still not commonly used. Thus, the stress-

129
strain relations for the latter, which can be found in the literature, cannot be used directly in afinite element analysis since they are related to the height of the specimens used whenevaluating it, and not the zone in which softening will take place in an analysis.
Concrete structures subjected to high loading rates will also exhibit high strain rates thatinfluence the material properties of both concrete and reinforcement. Hence, it may beimportant to include those effects when modelling concrete structures subjected to transientloading. However, it was found that the strain rate obtained might depend on what elementsizes are used (this is, for instance, the case in the programme ABAQUS/Explicit used herein)and the material properties then also become mesh-dependent. Therefore, it was concludedthat rate dependent material models have to be used with great care if the results are to betrusted.
7.2 Suggestions for future research
The static analyses carried out herein showed some shortcomings regarding their possibility topredict the occurrence of side concrete spalling and the loss of the compressed concrete at theoutside of opening frame corners. The former deficiency was due to the use of two-dimensional plane stress elements, while the latter was because of the concrete materialmodels used. In both cases, the anchorage of the reinforcement loops is vital for the responseobtained. Therefore, it is important that the stress state surrounding the reinforcement bars isaccurately accounted for when modelling the interaction between reinforcement and concrete,so that the loss of concrete cover is also reflected in the loops’ bond behaviour. This ispossible by using, for instance, the bond model proposed by Lundgren (1999). Accordingly,three-dimensional finite element analyses, including more sophisticated crack models thanthose used herein, so that the loss of the concrete part at the outside of the corner is accuratelydescribed, and incorporating Lundgren’s bond model, would be highly informative in thefuture study of concrete frame corners. Such analyses could then be used to increase theunderstanding of response observed in tests. In such a study it would also be comparativelyeasy to include the effect of haunches and/or different sizes of the corner.
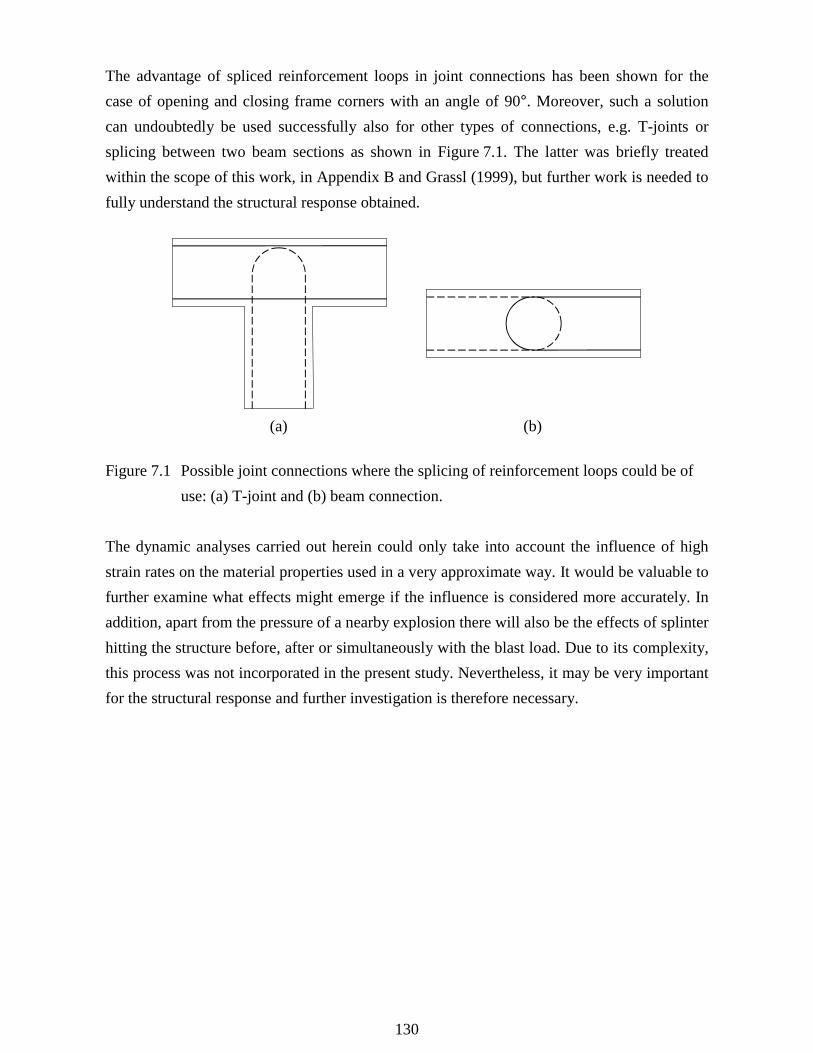
130
The advantage of spliced reinforcement loops in joint connections has been shown for thecase of opening and closing frame corners with an angle of 90°. Moreover, such a solutioncan undoubtedly be used successfully also for other types of connections, e.g. T-joints orsplicing between two beam sections as shown in Figure 7.1. The latter was briefly treatedwithin the scope of this work, in Appendix B and Grassl (1999), but further work is needed tofully understand the structural response obtained.
(a) (b)
Figure 7.1 Possible joint connections where the splicing of reinforcement loops could be ofuse: (a) T-joint and (b) beam connection.
The dynamic analyses carried out herein could only take into account the influence of highstrain rates on the material properties used in a very approximate way. It would be valuable tofurther examine what effects might emerge if the influence is considered more accurately. Inaddition, apart from the pressure of a nearby explosion there will also be the effects of splinterhitting the structure before, after or simultaneously with the blast load. Due to its complexity,this process was not incorporated in the present study. Nevertheless, it may be very importantfor the structural response and further investigation is therefore necessary.

131
References
Abdul-Wahab H.M.S. and Ali W.A. (1989): Strength and Behaviour of Reinforced ConcreteObtuse Corners under Opening Bending Moments. ACI Structural Journal, Vol. 86, No. 6,pp. 679-685.
Abdul-Wahab H.M.S. and Al-Roubai A.A.M. (1998): Strength and behaviour of steel fibrereinforced concrete corners under opening bending moment, Magazine of ConcreteResearch, Vol. 50, No. 4, pp. 305-318.
Abdul-Wahab H.M.S. and Salman S.A.R. (1999): Effect of Corner Angle on Efficiency ofReinforced Concrete Joints under Opening Bending Moment, ACI Structural JournalVol. 96, No. 1, pp. 115-121.
Anderson L. (1985): Inverkan på skyddsrum av byggnadsras (Influence of collapse load onCivil defence Shelters – Static and Dynamic Loaded Concrete Strips. In Swedish).Department of Building Statics and Structural Engineering, Royale Institute ofTechnology, Message No. 141, Stockholm, Sweden.
Anderson L. (1987a): Statisk and dynamisk belastning av betongplattstrimlor (Static andDynamic Loading of Concrete Strips. In Swedish). Department of Building Statics andStructural Engineering, Royale Institute of Technology, Message No. 145, Stockholm,Sweden.
Anderson L. (1987b): Energiåtgång vid dynamisk engångslast på betongplattor, Del 1(Energy dissipation at impact loding of concrete slabs, Part 1. In Swedish). Department ofBuilding Statics and Structural Engineering, Royale Institute of Technology, MessageNo. 148, Stockholm, Sweden.
Baker W.E. (1973): Explosions in air. University of Texas press, Austin, USA.
Balasz P. (1997): Beräkningsmetoder vid stötvågsbelastade konstruktioner (Methods forCalculations of Blast Loaded Structural Behaviour. In Swedish). Department of Weaponsand Protection, National Defence Research Establishment, FOA-R97-00473-311,Stockholm, Sweden.

132
Balint P.S. and Taylor H.P.J. (1972): Reinforcement Detailing of Frame Corner Joints withParticular Reference to Opening Corners, Technical Report 42.462, Cement and ConcreteAssociation, London, England.
Bathe K-J. (1996): Finite Element Procedures. Prentice-Hall, Englewood Cliffs, New Jersey.
Betonghandboken (1990): Betonghandboken – Konstruktion, utgåva 2 (Concrete HandbookDesign, Second Edition. In Swedish). Edited by Cederwall K., Lorentsen M. and ÖstlundL., AB Svensk Byggtjänst, Stockholm, Sweden.
Betonghandboken (1994): Betonghandboken – Material, utgåva 2 (Concrete HandbookMaterial, Second Edition. In Swedish). Edited by Ljungkrantz C., Möller G. andPetersons N.., AB Svensk Byggtjänst, Stockholm, Sweden.
Boverket (1994): Boverkets handbok för Betongkonstruktioner BBK 94, Band 1,Konstruktion (Boverket's Handbook for Concrete Structures, BBK 94, Vol. 1, Design. InSwedish). Boverket, Byggavdelningen, Karlskrona, Sweden.
Bergan P.G., Larsen P.K. and Mollestad E. (1986): Svingning av konstruksjoner, Andrautgåvan (Vibration of Structures. In Norwegian). Tapir, Trondheim, Norway.
Bischoff P.H. and Perry S.H. (1991): Compressive behaviour of concrete at high strain rates.Materials and Structures, 1991, 24, pp. 425-450.
Brode H.L. (1955): Numerical Solutions of Spherical Blast Waves. Jour. Appl. Phys,. Vol. 26,No. 6, pp 766-775.
Broo H. and Broo M. (1997): Fog av högpresterande fiberbetong i prefabricerad brobaneplatta(Joint of High-Strength Concrete in Prefabricated Bridge Slab. In Swedish). Division ofConcrete Structures, Chalmers Univeristy of Technology, Master Thesis 97:2, Göteborg,Sweden.
BST Byggstandardiseringen (1991): Betongprovning med Svensk Standard, BST handbok 12,utgåva 6 (Concrete Testing according to Swedish Standard, BST Handbook 12, sixthedition. In Swedish), SIS – standardiseringskommisionen i Sverige and Svensk Byggtjänst,Stockholm, Sweden.
133
CEB (1988): Concrete Structures under Impact and Impulsive Loading. CEB Bulletind’Information No 187, Lausanne, Switzerland.
CEB (1993): CEB-FIP Model Code 1990, Design Code. Thomas Telford, Lausanne,Switzerland.
CEN (1991): Eurocode 2: Design of concrete structures - Part 1: General rules and rules forbuildings. European Comittee for Standardization.
Chandra D. and Krauthammer T. (1996): Rate-Sensitive Michromechanical Damagae Modelfor Brittle Solid. Journal of Engineering Mechanics, Vol. 122, No. 5, pp. 412-422.
Chung H.W. (1978): Shear strength of concrete joints under dynamic loads. Concrete, mar1978, pp. 27-29.
Claeson C. (1998): Structural Behaviour of Reinforced High-Strength Concrete Columns.Division of Concrete Structures, Chalmers Univeristy of Technology, Ph.D. Thesis,Publication 98:1, Göteborg, Sweden.
ConWep (1992): ConWep – Collection of conventional weapons effects calculations basedon TM 5-855-1, Fundamentals of Protective Design for Conventional Weapons, U.S.Army Engineer Waterways Experiment Station, Vicksburg, USA.
de Borst R. (1999): Analyses of Reinforced Concrete In a Historical Perspective. NordicSymposium on Modern Design of Concrete Structures, Aalborg University, Denmark,pp. 261-299.
Dilger W.H., Kand R. and Kowalczyk R. (1984): Ductility of Plain and Confined ConcreteUnder Different Strain Rates. ACI Journal, Jan-Feb, pp. 73-81.
Dragosavic M., van den Beukel A. and Gijsbers F.B.J. (1975): Loop connections betweenprecast concrete components loaded in bending. HERON, Vol. 20, No. 3, Delft, TheNetherlands.
134
Ekengren B. (1996): Ramhörn i skyddsrum - licentiatinledning (Frame Corners in CivilDefence Shelters – Introduction to Discussion at Licentiate Seminar. In Swedish). SwedishRescue Services Agency, Karlstad, Sweden.
Ekengren B. (1998): Förändrade regler för skyddsrum (Changed Regulations for CivilDefence Shelters. In Swedish). Bygg & Teknik, 6/98, Stockholm, Sweden, pp. 29-32.
Eibl J. and Schmidt-Hurtienne B. (1999): Strain-Rate-Sensitive Constitutive Law forConcrete. Journal of Engineering Mechanics, Vol. 125, No. 12, pp. 1411-1420.
Elfgren L., editor (1989): Fracture Mechanics of Concrete Structures, From Theory toApplications. Report of the technical committee 90-FMA Fracture Mechanics to Concrete- Application, RILEM. Chapman and Hall, London.
Elinder U. and Hallhagen B. (1967): Spjälkningsrisk vid bockad buntad armering (Risk ofspalling when using bent bundled reinforcement bars. In Swedish). The Royal Institute ofTechnology, Stockholm, Sweden.
Feenstra P.H. (1993): Computational aspects of biaxial stress in plain and reinforced concrete.Delft University, Delft University Press, Delft, The Netherlands.
FortH 2 (1987): Fortifikationshandbok del 2, Kapitel 4-6 (Fortification’s Handbook part 2,Chapter 4-6. In Swedish). Försvarets Läromedelscentral, Stockholm, Sweden.
Franz G. and Timm G. (1973): Versuche zur Haken- und Schlaufenverbindung beibiegebeanspruchten Platten (Test of Hook and Loop Connections for Slabs Subjected toBending. In German.) Deutscher Ausschuss für Stahlbeton, Heft 226, pp. 23-54.
Fundia (1999): Letter of information regarding reinforcement type B500BT (In Swedish).August, Halmstad, Sweden.
Georgin J.F., Reynouard J.M. and Nerabet O. (1998): Modelling of concrete at high strainrate. Computational Modelling of Concrete Structure, Edited by de Borst, Bicanic, Mangand Meschke, Balkema, Rotterdam, The Netherlands, pp. 593-601.

135
Grassl P. (1999): Splicing of Reinforcement Loops in Beams: Experiments and Non-linearFinite Element Analyses. Division of Concrete Structures, Chalmers University ofTechnology, Master Thesis 99:4, Göteborg, Sweden.
Gylltoft K. (1983): Fracture Mechanics Models for Fatigue in Concrete Structures. Divisionof Structural Engineering, Luleå University of Technology, Doctoral Thesis 1983:25D,Luleå, Sweden.
Hallgren P. and Granström S. (1977): Ras mot Skyddsrumstak - beräkningsmodell (Impactload on shelter roof. In Swedish). Tyréns, Stockholm, Sweden.
Hallgren P. and Granström S. (1975): Takplattans motståndsförmåga mot ras - fallförsök iSvanö fabrik (The resistance of the roof slab against impact loads – impact tests in SvanöFactory. In Swedish). Tyréns, Stockholm, Sweden.
Han N. (1996): Time Dependent Behaviour of High Strength Concrete. Delft University ofTechnology, Delft University Press, Delft, The Netherlands.
HKS (1998): ABAQUS/Explicit User’s Manual, Version 5.7. Hibbit, Karlsson and SorensenInc. Pawtucket, USA.
Hillerborg A., Modéer M. and Petersson P-E. (1976): Analysis of Crack Formation and CrackGrowth in Concrete by means of Fracture Mechanics and Finite Elements. Cement andConcrete Research, Vol. 6, No. 6, pp. 773-782.
Hillerborg A. (1988): Rotational Capacity of Reinforced Concree Beams. Nordic ConcreteResearch, No. 7, Oslo, Norway, pp. 121-134.
Hofstetter G. and Mang H.A. (1995): Computational Mechanics of Reinforced ConcreteStructures. Vieweg & Sohn Verlagsgesellschaft, Braunschweig, Germany.
Hughes B.P., and Gregory R. (1972): Concrete subjected to high rates of loading incompression. Magazine of Concrete Research, Vol. 24, No. 78, pp. 25-36.
Hughes T.J.R. (1987): The Finite Element Method, Linear Static and Dynamic Finite ElementAnalyses. Prentice-Hall, Englewodd Cliffs, New Jersey, USA.

136
Jackson N. (1995): Design of reinforced concrete opening corners, The Structural Engineer,Vol. 73, No. 13, pp. 209-213.
Jirasek M. (1999): Numerical Modelling of Deformation and Failure of Materials. Shortcourse held at Rheinisch-Westfälische Technische Handschule, Aachen, Germany.
Johansson J.P.M. and Karlsson S. (1997): Nytt armeringsutförande i betongramhörn utsattaför positivt moment (New Reinforcement Detailing in Concrete Frame Corners Subjectedto Positive Moment – in Swedish). Division of Concrete Structures, Chalmers Universityof Technology, Master Thesis 97:5, Göteborg, Sweden.
Johansson M. (1996): New Reinforcement Detailing in Concrete Frame Corners of CivilDefence Shelters: Non-linear Finite Element Analyses and Experiments. Division ofConcrete Structures, Chalmers University of Technology, Licentiate Thesis, Publication96:1, Göteborg, Sweden.
Johansson M. (1997): Armeringsseghetens inverkan på deformationsförmågan hos betong-konstruktioner (Influence of Reinforcement Ductility on the Deformation Capacity ofConcrete Structures. In Swedish). Division of Concrete Structures, Chalmers University ofTechnology, Report 97:1, Göteborg, Sweden.
Johansson M. (1998): Betongens töjningshastighetsberoende and explicit lösningsmetodik(Strain Rate Effects in Concrete and Explicit solution Methods. In Swedish). Division ofConcrete Structures, Chalmers University of Technology, Report 98:2, Göteborg, Sweden.
Johansson M. (1999a): Strain Rate Dependency in Concrete Explained by a SDOF model.Presented in Material Test Procedures in Support of Dynamic Material Modelling, Editedby Ågårdh L., FOA Defence Research Establishment, FOA-R-99-01227-311, Stockholm,Sweden.
Johansson M. (1999b): Non-linear Finite Element Analyses of Civil Defence ShelterSubjected to Explosion Load or Impact Load. Division of Concrete Structures, ChalmersUniversity of Technology, Report 99:8, Göteborg, Sweden.

137
Kaplan S.A. (1980): Factors affecting the relationship between rate of loading and measuredcompressive strength of concrete. Magazine of Concrete Research, Vol. 32, No. 111,pp. 79-88.
Karlsson M. (1999): Armeringsutformning i ramhörn and knutar (Reinforcement Detailing inFrame Corners and Joints. In Swedish). Teknikområde Anläggning, NCC Teknik,Göteborg, Sweden.
Kinney G. F. and Graham K. J. (1985): Explosive shocks in air, Second Edition. Springer-Verlag, New York, USA.
Kordina K. and Fuchs G. (1970): Untersuchungen zur Anwendung von hakenförmigenÜbergreifungsstößen in Rahmenecken (Examination of the use of Reinforcement Loops inFrame Corners. In German). Institut für Baustoffkunde und Stahlbetonbau, DerTechnischen Universität Braunschweig, Braunschweig, Germany.
Kordina K. and Fuchs G. (1973): Untersuchungen an Übergreifungs-Vollstößen mithakenförmig-gebogenen Rippenstählen (Studies of Splicing of Hook-formed Bars. InGerman). Deutscher Ausschuss für Stahlbeton, Heft 226, pp. 55-81.
Kordina K. (1984): Bewehrungsführung in Ecken und Rahmenknoten (Reinforcement Designof Corners and Joints in Reinforced Concrete Frame Structures. In German). DeutscherAusschuss für Stahlbeton, Heft 354, pp 5-93.
Krauthammer T. (1998): Structural Concrete and Steel Connections for Blast ResistantDesign. Transient loading and response of structures, Edited by Langseth M. andKrauthammer T., Trondheim, Norway, pp. 161-195.
Ku C-K. and Krauthammer T. (1999): Numerical Assessment of Reinforced Concrete Knee-Joints under Explosively Apllied Loads. ACI Structural Journal, Vol. 96, No. 2,pp. 239-247.
Kwak H-G. and Filippou F.C. (1990): Finite Element Analysis of Reinforced ConcreteStructures under Monotonic Loads. Department of Civil Engineering, University ofCalifornia Berkeley, Report No. UCB/SEMM-90/14, California, USA.

138
Larsson L., Runesson K. and Åkesson M. (1995): Embedded Cohesive Crack Models Basedon Regularized Discontinous Displacements. Fracture Mechanics of Concrete Structures,FRAMCOS-2, Edited by Wittmann F.H., Zurich, Switzerland, pp. 899-911.
Lee Y-H. and Willam K. (1997): Mechanical Properties of Concrete in UniaxialCompression. ACI Materials Journal, V. 94, No. 6, pp. 457-471.
Leonhardt F., Walther R. and Dieterle H. (1973): Versuche zur Ermittlung der Tragfähigkeitvon Zugschlaufstößen (In German). Deutscher Ausschuss für Stahlbeton, Heft 226,pp. 1-53.
Limberger E., Brandes K. and Herter J. (1982): Influence of Mechanical Properties ofReinforcing Steel on the Ductility of Reinforced Concrete Beams with Respect to HighStrain Rates. Presented in Concrete Structures under Impact and Impulsive Loading, BAM,Berlin, Germany, pp. 134-156.
Lundgren K. (1999): Three-Dimensional Modelling of Bond in Reinforced Concrete:Theoretical Model, Experiments and Applications. Division of Concrete Structures,Chalmers University of Technology, Ph.D. Thesis, Publication 99:1, Göteborg, Sweden.
Magnusson J. (2000): Bond and Anchorage of Ribbed Bars in High-Strength Concrete.Division of Concrete Structures, Chalmers University of Technology, Ph.D. Thesis,Publication 00:1, Göteborg, Sweden.
Malvar L. J. (1998): Review of static and dynamic properties of steel reinforcing bars. ACIMaterials Journal, Vol. 95, No. 5, pp. 609-616.
Malvar L. J. and Ross C. A. (1998): Review of strain rate effects for concrete in tension. ACIMaterials Journal, Vol. 95, No. 6, pp. 735-739.
Malvar L. J., and Ross C. A. (1999). Discussion of Malvar and Ross (1998), ACI MaterialsJournal, Vol. 99, No. 6, pp. 614-616.
Markeset G. (1993): Failure of Concrete under Compressive Strain Gradients. Department ofStructural Engineering, The Norwegian Institute of Technology, Ph.D. Thesis, Trondheim,Norway.

139
Martinez C. and Sanchez D. (2000): Nonlinear Finite Element Analysis if Continuous DeepBeams. Division of Concrete Structures, Chalmers Univeristy of Technology, MasterThesis 00:5, Göteborg, Sweden.
Mattiasson K., Bernspång L., Honecker A., Schedin E., Hammam T. and Melander A. (1991):On the use of explicit time integration in finite element simulation of industrial sheetforming process. Department of Structural Mechanics, Chalmers Univeristy ofTechnology, Publication 91:2, Göteborg, Sweden.
Mayfield B., Kong, F.K., Bennison, A. and Davies, J.C.D.T. (1971): Corner Joint Details inStructural Lightweight Concrete, ACI Journal, V. 68, No. 5, pp. 366-372.
Mayfield B., Kong F.K., and Bennison A. (1972): Strength and Stiffness of LightweightConcrete Corners, ACI Journal, V. 69, No. 7, pp. 420-427.
Marx E.M. (1993): Analysis of Reinforced Concrete Wall to Slab Connections Subjected toSevere Impulse Loading. Department of Civil Engineering, The Pennsylvania StateUniversity.
Mörnstad M. (1998): Cut-and-Cover Tunnels at the Arlanda Link. IABSE Conference, TunnelStructures, Stockholm, Sweden, pp. 181-186.
Mörnstad M. (2000): Personal Communication. Chief Engineer, NCC AB, Malmö, Sweden.
Nilsson I.H.E. (1976): Undersökning av ramhörn med positivt moment (Reinforced ConcreteFrame Joints Subjected to Positive Moment, Test Report 2. In Swedish). Division ofConcrete Structures, Chalmers University of Technology, Report 67:1, Göteborg, Sweden.
Nilsson I.H.E. (1973): Reinforced concrete corners and joints subjected to bending moment.National Swedish Institute for Building Research, Document D7:1973, Stockholm,Division of Concrete Structures, Chalmers University of Technology, Ph.D. Thesis,Publication 73:6, Göteborg, Sweden.
Nilsson I.H.E. and Losberg, A. (1976): Reinforced Concrete Corners and Joints Subjected toBending Moment, ASCE Journal of the Structural Division, Vol. 102, No. 6,pp. 1229-1254.

140
Nilsson L. (1979): Impact Loading on Concrete Structures, A constitutive modelling, finiteelement analysis, and experimental study of nonlinear wave propagation. Department ofStructural Mechanics, Chalmers University of Technology, Ph.D. Thesis, Publication 79:1,Göteborg, Sweden.
Noor F.A. (1977): Ultimate Strength and Cracking of Wall Corners, Concrete, Cement andConcrete Association, London, July, pp. 31-35.
Olofsson T., Ohlsson U. and Klisinski M. (1995): A Simple Fracture Mechanics Model forMixed-mode Failure in Concrete. Fracture Mechanics of Concrete Structures,FRAMCOS-2, Edited by Wittmann F.H., Zurich, Switzerland, pp 473-494.
Olsson M. (1996): Olinjär finit elementanalys av ramhörn i armerad betong (Non-linear FiniteElement Analysis of Concrete Frame Corners. In Swedish). Division of ConcreteStructures, Chalmers University of Technology, Master Thesis 96:6, Göteborg, Sweden.
Otani R.K. and Krauthammerr T. (1997): Assessment of Reinforcement Details for BlastContainment Structures. ACI Structural Journal, Vol. 94, No. 2, pp. 124-132.
Plos M. (1994a): Ny armeringsskarv för ramhörn i skyddsrum (New Reinforcement Splice forFrame Corners in Civil Defence Shelters. In Swedish). Division of Concrete Structures,Chalmers University of Technology, Report 94:2, Göteborg, Sweden.
Plos M. (1994b): Splicing of Reinforcement in Frame Corners -Experimental Studies. NordicConcrete Research, Publ. no. 14, The Nordic Concrete Federation, Oslo, Norway,pp 103-121.
Plos M. (1995): Application of Fracture Mechanics to Concrete Bridges - Finite ElementAnalyses and Experiments. Division of Concrete Structures, Chalmers University ofTechnology, Ph.D. Thesis, Publication 95:3, Göteborg, Sweden.
Reinhardt H.W. (1982): Concrete under Impact Loading, Tensile Strength and Bond.HERON, Vol. 27, No. 3, Delft, The Netherlands.
Reinhardt H.W., Körmeling H.A., Zielinski A.J. (1985): The split Hopkinson bar, a versatiletool for the impct testing of concrete. Materials and Structures, Vol. 19, pp. 55-63.

141
Reinhardt H.W., Rossi P., van Mier J.G.M. (1990): Joint investigation of concrete at highstrain rates of loading. Materials and Structures, Vol. 23, pp. 213-216.
RILEM 50-FMC (1985): Determination of the Fracture Energy of Mortar and Concrete byMeans of Three-point Bend Tests on Notched Beams. Materials and Structures, Vol. 18,pp. 285-290.
Ross C.A., Tedesco J.W., Kuennen S.T. (1995): Effects of Strain Rate on Concrete Strength.ACI Materials Journal, Vol. 92, No. 1, pp. 37-47.
Ross C.A., Jerome D.M., Tedesco J.W., Hughes M.L. (1996): Moisture and Strain RateEffects on Concrete Strength. ACI Materials Journal, Vol. 93, No. 3, pp. 293-300.
Rossi P. (1991a): A physical phenomenon which can explain the mechanical behaviour ofconcrete under high strain rates. Materials and Structures, Vol. 24, pp. 422-424.
Rossi P. (1991b): Influence of cracking in the presence of free water on the mechanicalbehaviour of concrete. Magazine of Concrete Research, Vol. 42, No. 154, pp. 53-57.
Rossi P., van Mier J.G.M., Boulay C., Le Maou F. (1992): The dynamic behaviour ofconcrete: influence of free water. Materials and Structures, Vol. 25, pp. 509-514.
Rossi P., van Mier G.M., Toutlemonde F., Le Maou F., Boulay C. (1994): Effect of loadingrate on the strength of concrete subjected to uniaxial tension. Materials and Structures,Vol. 27, pp. 260-264.
Rossi P. and Toutlemonde F. (1996): Effect of loading rate on the tensile behaviour ofconcrete: description of the physical mechanisms. Materials and Structures, Vol. 29, Mar.,pp. 116-118.
Rots J.G. (1988): Computational Modelling of Concrete Fracture. Department of CivilEngineering, Delft University of Technology, pp. 132.
Rots J.G. (1989): Fracture Mechanics of Concrete Structures: From theory to applications.RILEM Technical Committee 90-FMA, Edited by Elfgren L., Chapman and Hall, London,England, pp. 138-145.
142
Schmidt-Hurtienne B., Häußler U. and Eibl J. (1998): Strain Rate Effects in Concrete – anUniaxial Constitutive Law. Transient loading and response of structures, Edited byLangseth M. and Krauthammer T., Trondheim, Norway, pp. 41-61.
Seabold R.B. (1970): Dynamic Shear Strength of Reinforced ConcreteBeams, Part III.Technical Report No. R-695, U.S. Naval Civil Engineering Laboratory, Port Hueneme,USA.
Serecombe J., Ulm F.-J. and Toutlemonde F. (1998): Viscous Hardening Plasticity forConcrete in High-Rate Dynamics. Journal of Engineering Mechanics, Vol. 124, No. 9,pp. 1050-1057.
Skettrup E., Strabo J., Andersen N.H. and Brondum-Nielsen T. (1984): Concrete FrameCorners, ACI Journal, Vol. 81, No. 6, 1984, pp. 587-593.
Soroushian P., Choi K-B., Alhamad A. (1986): Dynamic Constitutive Behaviour of Concrete.ACI Journal, Mar.-Apr., pp. 251-259.
Stroband J. and Kolpa J.J. (1981): The Behaviour of Reinforced Concrete Column-to-Beamjoints, Part 2: Corners Subjected to Positive Moments, Stevin Laboratory, Delft Universityof Technology, Report 5-81-5, Delft, The Netherlands
Stroband J. and Kolpa J.J. (1983): The behaviour of reinforced concrete column-to-beamjoints, Part 1, Corners subjected to negative moments. Stevin Laboratory, Delft Universityof Technology, Report 5-83-9, Delft, The Netherlands.
Suaris W. and Shah S.P. (1985): Constitutive Model for Dynamic Loading of Concrete.Journal of Structural Engineering. Vol. 111, No. 3, pp. 563-576.
Sundquist H. (1977): Betongplatta på pelare vid dynamisk engångslast, Del 3 (Concrete Slabon Column Subjected to Impact Load, Part 3. In Swedish). Department of Building Staticsand Structural Engineering, Royale Institute of Technology, Message No. 126, Stockholm,Sweden.

143
Sundquist H. (1978): Betongplatta på pelare vid dynamisk engångslast, Del 2 (Concrete Slabon Column Subjected to Impact Load, Part 2. In Swedish). Department of Building Staticsand Structural Engineering, Royale Institute of Technology, Message No. 125, Stockholm,Sweden.
Sundquist H. (1979): Concrete Slabs Supported on Slender Columns under Short DurationLoads, Summary. Department of Building Statics and Structural Engineering, RoyaleInstitute of Technology, Ph.D. Thesis, Message No. 134, Stockholm, Sweden.
Swann R. A., (1969): Flexural Strength of Corners of Reinforced Concrete Portal Frames.Technical Report TRA 434, Cement and Concrete Association, London.
Swedish Rescue Services Agency (1990): Skyddsrumsregler SR – Första utgåvan (ShelterRegulations – First Edition. In Swedish). Swedish Rescue Services Agency, PublicationB54-141/92, Karlstad, Sweden.
Swedish Rescue Services Agency (1994): Shelter Regulations, SR - English edition. SwedishRescue Services Agency, Publication B54-168/94, Karlstad, Sweden.
Swedish Rescue Services Agency (1998): Skyddsrumsregler SR – Produktion andvidmakthållande (Shelter Regulations – Production and Maintenance. In Swedish).Swedish Rescue Services Agency, Publication B54-141/98, Karlstad, Sweden.
Taerwe L. (1993): Empirical Analysis of the Fracture Process in High Strength ConcreteLoaded in Uniaxial Compression. Fracture and Damage of Concrete and Rock – FDCR-2,Vienna, Austria, Edited by Rassmanith H.P., E & FN Spon, pp. 122-134.
Timm G. (1969): Untersuchungen zur Verbindung von Stahlbetonplatten mit hakenförmiggebogenen Stäben (Examination of Connections of Reinforced Concrete Slabs using Hook-formed Bars. In German.) Department of Civil Engineering, University of Karlsruhe, Ph.D.Thesis, Karlsruhe, Germany.
Ulfkjaer J.P., Pilegaard Hansen L., Qvist S., Madsen S.H. (1996): Fracture Energy of PlainConcrete Beams at Different Rates of Loading. Fracture & Dynamics Paper No. 74,Department of Building Technology and Structural Engineering, Aalborg University,Aalborg, Denmark.

144
van Mier J.G.M. (1984): Strain Softening of Concrete Under Multiaxial Loading Conditions.Eindhoven University of Technology, Ph.D. Thesis, Eindhoven, The Netherlands.
van Mier J.G.M., Shah S.P., Arnaud M., Balayssac J.P., Bascoul A., Choi S., Dasenbrock D.,Ferrara G., French C., Gobbi M.E., Karihaloo B.L., König G., Kotsovos M.D., Labuz J.,Lange-Kornbak D., Markeset G., Pavlovic M.N., Simsch G., Thienel K-C. andTuratsinze A., (1997): Strain-softening of concrete in uniaxial compression. Materials andStructures, Vol. 30, May, pp. 195-209.
Vos E. and Reinhardt H-W. (1980): Bond resistance of deformed bars, plain bars and strandsunder impact loading. Department of Civil Engineering, Delft University of Technology,Report 5-80-6, Delft, The Netherlands
Vägverket (1994): BRO 94 - Allmän teknisk beskrivning för broar (Bridge 94 – GeneralTechnical Description for Bridges. In Swedish). Swedish Road Administration, Borlänge,Sweden.
Weerheijm J. (1992): Concrete under impact tensile loading and lateral compression. TNO-Prins Maurits Laboratory, Ph.D. Thesis, Rijswijk, The Netherlands.
Wästlund G. (1935): Om armering av vinkelformade betongkonstruktioner (Reinforcement ofAngle-shaped Concrete Structures. In Swedish). Betong, No. 1, Stockholm, Sweden,pp. 22-35.
Yan C. and Mindess S. (1998): Effect of Loading Rate on Bond Behaviour Under DynamicLoading. Concrete and Blast Effects, ACI International SP-175, Edited by Bounds W.,Michigan, USA, pp. 179-197.
Zielinski A.J., Reinhardt H.W., Körmeling H.A. (1981): Experiments on concrete underuniaxial impact tensile loading. Materials and Structures, Vol. 14, No. 80, pp. 103-112.
Zielinski A.J. (1982): Fracture of Concrete and Mortar under Uniaxial Impact TensileLoading. Delft University of Technology, Ph.D. Thesis, Delft, The Netherlands.

145
Ågårdh L. and Laine L. (1997): Experiments and FE-Modelling of Fibre Reinforced ConcreteBeams Expose to Impact. Reprint from 2nd Asian Pacific Conference of Shock and ImpactLoads on Structures, Melbourne, Australia.
Åkesson M. (1996): Implementation and Application of Fracture Mechanics Models forConcrete Structures. Division of Concrete Structures, Chalmers University of Technology,Ph.D. Thesis, Publication 96:2, Göteborg, Sweden.
Östlund L. (1963): Inverkan av bockningsradier and täckande betongskikt hos kamstål påspjälkningsrisken för armerade betongkonstruktioner (The Influence of Bending Radiusand Concrete Cover for Deformed Bars on the Risk of Splitting Failure in ReinforcedConcrete Structures. In Swedish). The Royal Institute of Technology, Stockholm, Sweden.
A1
Appendix A Summary of Frame Corner Tests
This Appendix summarises the test results of frame corners subjected to opening or closingmoment that are presented in Chapter 2. In the original work, the cube strength was often usedwhen referring to the compressive strength of the concrete. However, both the Swedishconcrete handbook Code BBK 94, Boverket (1994), and Eurocode 2, CEN (1991), make useof the concrete cylinder strength in the design. Therefore, recalculations to such values weremade where necessary. It is well known that the compressive strength depends on both thecuring condition and the geometry of the specimen tested; see Betonghandboken Material(1994). But, there was often no clear information on what curing conditions had been used,and when such information was available, the method used often differed considerably fromthat prescribed in standards of today. Hence, it would not be an easy task to consistentlyrecalculate the concrete used in the different tests. As a simplification, the cube strength fc,cube
was therefore related to the cylinder strength fc as
fc,cube = 1.35fc (A.1)
which is the relation given in BST Byggstandardiseringen (1991) for dry cured concrete cubes(side 150 mm) and water cured concrete cylinders (φ150 x 300 mm). Further, no account wastaken of the influence of different cube or cylinder sizes used. The approximation inequation (A.1) might lead to a slight underestimation of the concrete cylinder strength and theresults obtained were therefore compared to the case if fc,cube = 1.25fc had been used instead. Itwas then found that the difference was quite negligible (see Figure A1) and it was concludedthat the approximation made was appropriate. Due to this recalculation of the compressivestrength, and the fact that all tests presented here were originally not evaluated in the sameway, the theoretical strength Muc of each frame corner was redetermined. Hence, theefficiencies presented herein may also differ somewhat from those reported by the originalauthors.
Several different reinforcement detailings were tested. Many of them, though, show such largeresemblances to each other that the structural responses obtained were more or less the same.Accordingly, it was possible to divide them into three major types: Type 1, Type 3 and Type 4;see Figure A.1. Of these types, the addition of radial bars in the Type 1 detailing wasconsidered so important that it was denoted detailing Type 2. The combination of radialstirrups and reinforcement loops (i.e. detailings Type 3 and Type 4) did not have a verypronounced effect and they were therefore only regarded as variants of the original detailings.
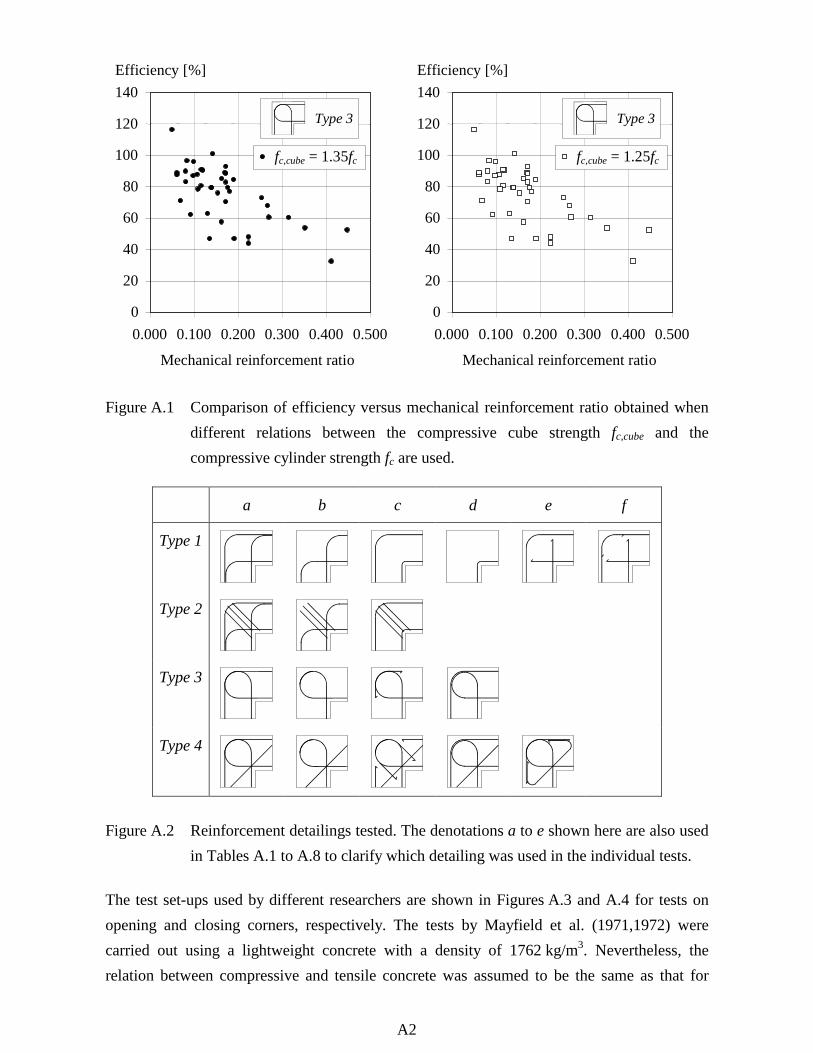
A2
0
20
40
60
80
100
120
140
0.000 0.100 0.200 0.300 0.400 0.500
Mechanical reinforcement ratio
Efficiency [%]
fc,cube = 1.35fc
Type 3
0
20
40
60
80
100
120
140
0.000 0.100 0.200 0.300 0.400 0.500
Mechanical reinforcement ratio
Efficiency [%]
fc,cube = 1.25fc
Type 3
Figure A.1 Comparison of efficiency versus mechanical reinforcement ratio obtained whendifferent relations between the compressive cube strength fc,cube and thecompressive cylinder strength fc are used.
a b c d e f
Type 1
Type 2
Type 3
Type 4
Figure A.2 Reinforcement detailings tested. The denotations a to e shown here are also usedin Tables A.1 to A.8 to clarify which detailing was used in the individual tests.
The test set-ups used by different researchers are shown in Figures A.3 and A.4 for tests onopening and closing corners, respectively. The tests by Mayfield et al. (1971,1972) werecarried out using a lightweight concrete with a density of 1762 kg/m3. Nevertheless, therelation between compressive and tensile concrete was assumed to be the same as that for
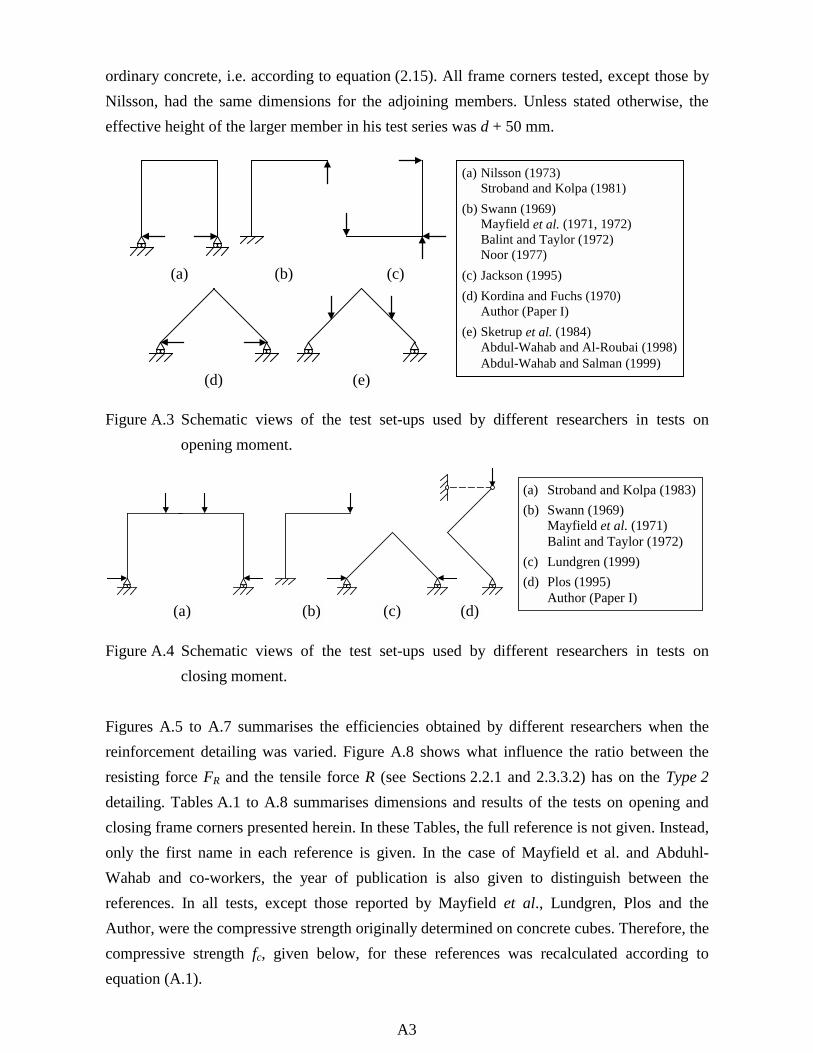
A3
ordinary concrete, i.e. according to equation (2.15). All frame corners tested, except those byNilsson, had the same dimensions for the adjoining members. Unless stated otherwise, theeffective height of the larger member in his test series was d + 50 mm.
(a) Nilsson (1973)Stroband and Kolpa (1981)
(b) Swann (1969)Mayfield et al. (1971, 1972)Balint and Taylor (1972)Noor (1977)
(c) Jackson (1995)(d) Kordina and Fuchs (1970)
Author (Paper I)(e) Sketrup et al. (1984)
Abdul-Wahab and Al-Roubai (1998)Abdul-Wahab and Salman (1999)
(e)(d)
(a) (b) (c)
Figure A.3 Schematic views of the test set-ups used by different researchers in tests onopening moment.
(a) Stroband and Kolpa (1983)(b) Swann (1969)
Mayfield et al. (1971)Balint and Taylor (1972)
(c) Lundgren (1999)(d) Plos (1995)
Author (Paper I)(a) (b) (c) (d)
Figure A.4 Schematic views of the test set-ups used by different researchers in tests onclosing moment.
Figures A.5 to A.7 summarises the efficiencies obtained by different researchers when thereinforcement detailing was varied. Figure A.8 shows what influence the ratio between theresisting force FR and the tensile force R (see Sections 2.2.1 and 2.3.3.2) has on the Type 2detailing. Tables A.1 to A.8 summarises dimensions and results of the tests on opening andclosing frame corners presented herein. In these Tables, the full reference is not given. Instead,only the first name in each reference is given. In the case of Mayfield et al. and Abduhl-Wahab and co-workers, the year of publication is also given to distinguish between thereferences. In all tests, except those reported by Mayfield et al., Lundgren, Plos and theAuthor, were the compressive strength originally determined on concrete cubes. Therefore, thecompressive strength fc, given below, for these references was recalculated according toequation (A.1).
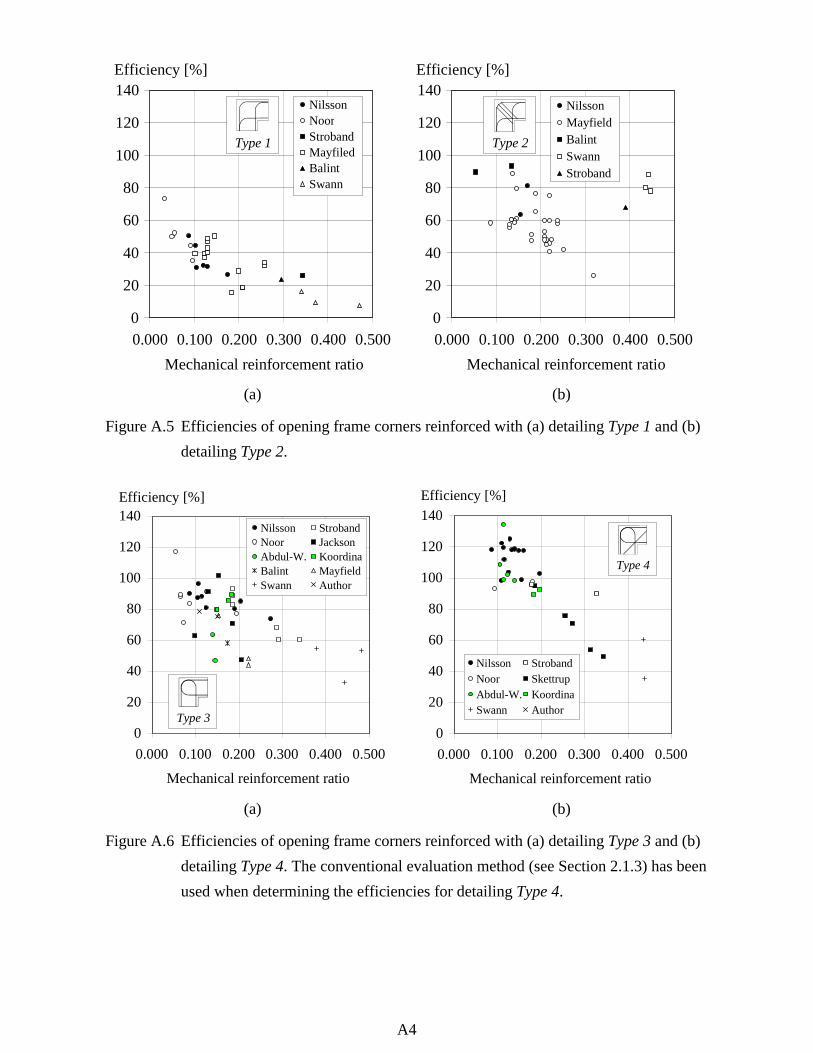
A4
0
20
40
60
80
100
120
140
0.000 0.100 0.200 0.300 0.400 0.500Mechanical reinforcement ratio
Efficiency [%]
NilssonNoorStrobandMayfiledBalintSwann
Type 1
0
20
40
60
80
100
120
140NilssonMayfieldBalintSwannStroband
0.000 0.100 0.200 0.300 0.400 0.500Mechanical reinforcement ratio
Efficiency [%]
Type 2
(a) (b)
Figure A.5 Efficiencies of opening frame corners reinforced with (a) detailing Type 1 and (b)detailing Type 2.
0
20
40
60
80
100
120
140
0.000 0.100 0.200 0.300 0.400 0.500
Mechanical reinforcement ratio
Nilsson StrobandNoor JacksonAbdul-W. KoordinaBalint MayfieldSwann Author
Efficiency [%]
Type 30
20
40
60
80
100
120
140
0.000 0.100 0.200 0.300 0.400 0.500
Mechanical reinforcement ratio
Efficiency [%]
Type 4
Nilsson StrobandNoor SkettrupAbdul-W. KoordinaSwann Author
(a) (b)
Figure A.6 Efficiencies of opening frame corners reinforced with (a) detailing Type 3 and (b)detailing Type 4. The conventional evaluation method (see Section 2.1.3) has beenused when determining the efficiencies for detailing Type 4.

A5
0
20
40
60
80
100
120
140
0.000 0.100 0.200 0.300 0.400 0.500Mechanical reinforcement ratio
Efficiency [%]
SwannMayfieldStrobandPlosBalintLundgren
Type 1
0
20
40
60
80
100
120
140
SwannMayfieldStrobandPlosAuthor
0.000 0.100 0.200 0.300 0.400 0.500Mechanical reinforcement ratio
Efficiency [%]
Type 3
(a) (b)
Figure A.7 Efficiencies of closing frame corners reinforced with (a) detailing Type 1 and (b)detailing Type 3.
0
20
40
60
80
100
0.000 0.100 0.200 0.300 0.400 0.500
Mechanical reinforcement ratio
Efficiency [%]
Type 1
FR / R > 100%20% ≤ FR / R < 80%40% ≤ FR / R < 60%20% ≤ FR / R < 40%FR / R < 20%
Type 2
Figure A.8 Influence of radial stirrups within the corner for varying value on the ratio FR / R.
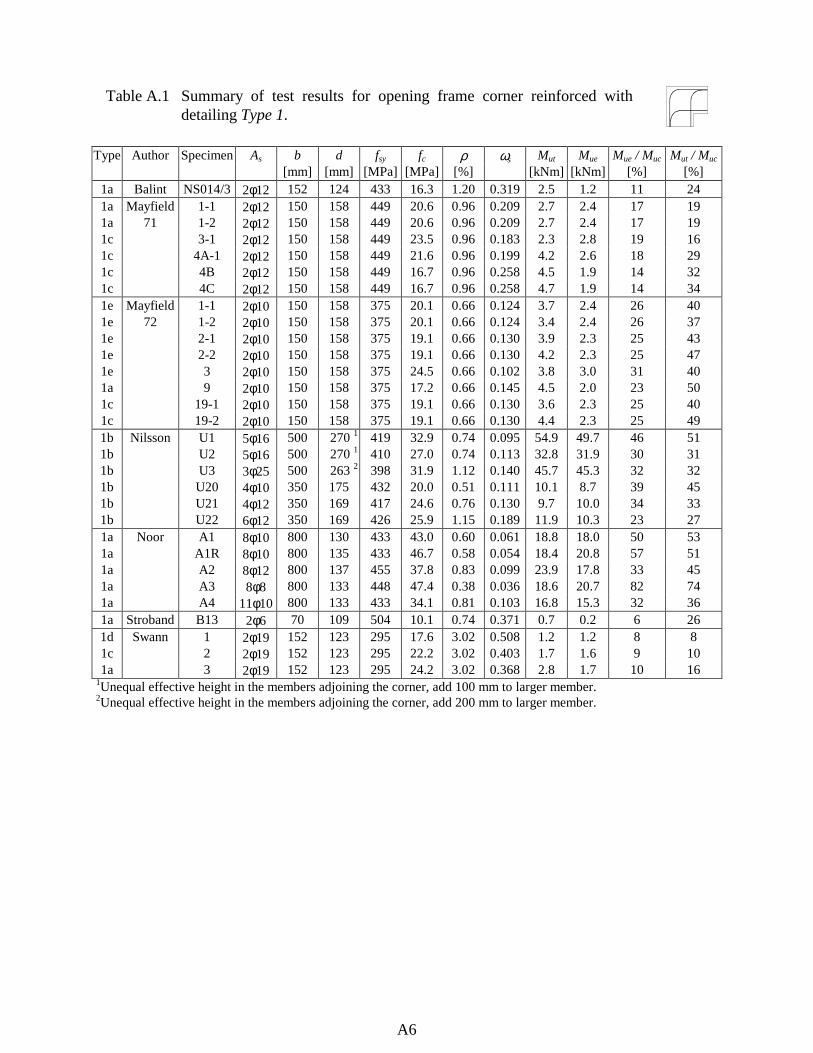
A6
Table A.1 Summary of test results for opening frame corner reinforced withdetailing Type 1.
Type Author Specimen As b d fsy fc ρ ωs Mut Mue Mue / Muc Mut / Muc
[mm] [mm] [MPa] [MPa] [%] [kNm] [kNm] [%] [%]1a Balint NS014/3 2φ12 152 124 433 16.3 1.20 0.319 2.5 1.2 11 241a Mayfield 1-1 2φ12 150 158 449 20.6 0.96 0.209 2.7 2.4 17 191a 71 1-2 2φ12 150 158 449 20.6 0.96 0.209 2.7 2.4 17 191c 3-1 2φ12 150 158 449 23.5 0.96 0.183 2.3 2.8 19 161c 4A-1 2φ12 150 158 449 21.6 0.96 0.199 4.2 2.6 18 291c 4B 2φ12 150 158 449 16.7 0.96 0.258 4.5 1.9 14 321c 4C 2φ12 150 158 449 16.7 0.96 0.258 4.7 1.9 14 341e Mayfield 1-1 2φ10 150 158 375 20.1 0.66 0.124 3.7 2.4 26 401e 72 1-2 2φ10 150 158 375 20.1 0.66 0.124 3.4 2.4 26 371e 2-1 2φ10 150 158 375 19.1 0.66 0.130 3.9 2.3 25 431e 2-2 2φ10 150 158 375 19.1 0.66 0.130 4.2 2.3 25 471e 3 2φ10 150 158 375 24.5 0.66 0.102 3.8 3.0 31 401a 9 2φ10 150 158 375 17.2 0.66 0.145 4.5 2.0 23 501c 19-1 2φ10 150 158 375 19.1 0.66 0.130 3.6 2.3 25 401c 19-2 2φ10 150 158 375 19.1 0.66 0.130 4.4 2.3 25 491b Nilsson U1 5φ16 500 270 1 419 32.9 0.74 0.095 54.9 49.7 46 511b U2 5φ16 500 270 1 410 27.0 0.74 0.113 32.8 31.9 30 311b U3 3φ25 500 263 2 398 31.9 1.12 0.140 45.7 45.3 32 321b U20 4φ10 350 175 432 20.0 0.51 0.111 10.1 8.7 39 451b U21 4φ12 350 169 417 24.6 0.76 0.130 9.7 10.0 34 331b U22 6φ12 350 169 426 25.9 1.15 0.189 11.9 10.3 23 271a Noor A1 8φ10 800 130 433 43.0 0.60 0.061 18.8 18.0 50 531a A1R 8φ10 800 135 433 46.7 0.58 0.054 18.4 20.8 57 511a A2 8φ12 800 137 455 37.8 0.83 0.099 23.9 17.8 33 451a A3 8φ8 800 133 448 47.4 0.38 0.036 18.6 20.7 82 741a A4 11φ10 800 133 433 34.1 0.81 0.103 16.8 15.3 32 361a Stroband B13 2φ6 70 109 504 10.1 0.74 0.371 0.7 0.2 6 261d Swann 1 2φ19 152 123 295 17.6 3.02 0.508 1.2 1.2 8 81c 2 2φ19 152 123 295 22.2 3.02 0.403 1.7 1.6 9 101a 3 2φ19 152 123 295 24.2 3.02 0.368 2.8 1.7 10 16
1Unequal effective height in the members adjoining the corner, add 100 mm to larger member.2Unequal effective height in the members adjoining the corner, add 200 mm to larger member.
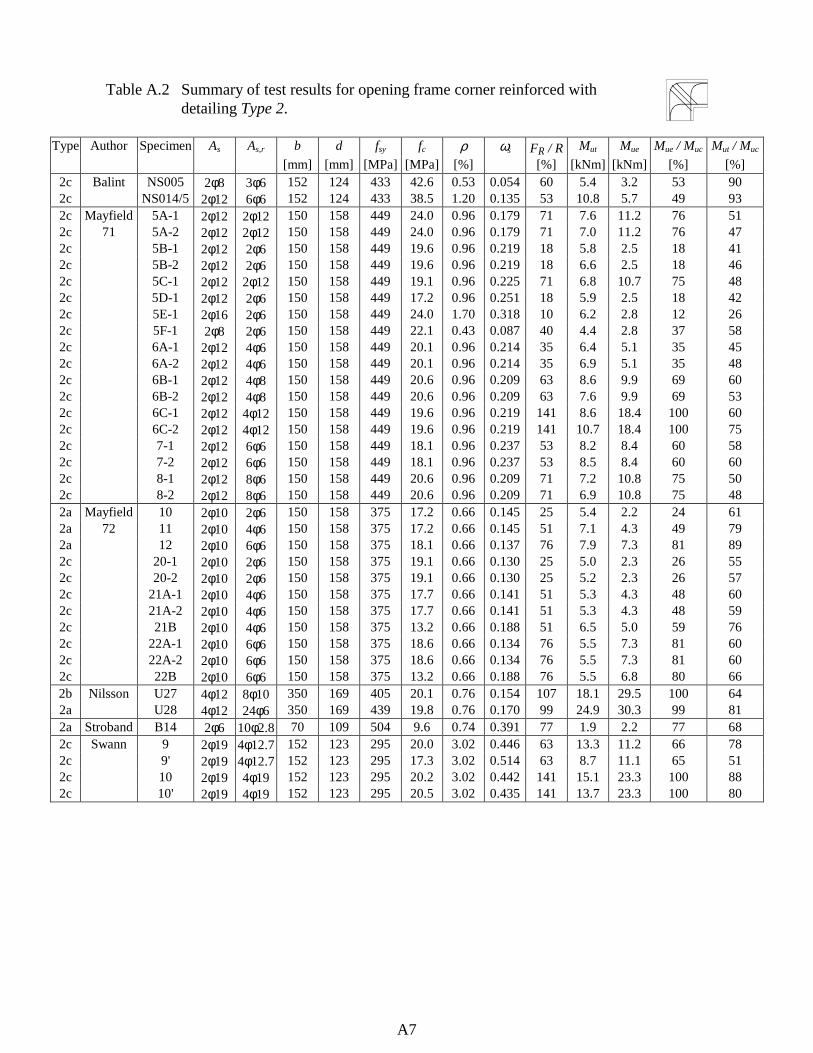
A7
Table A.2 Summary of test results for opening frame corner reinforced withdetailing Type 2.
Type Author Specimen As As,r b d fsy fc ρ ωs FR / R Mut Mue Mue / Muc Mut / Muc
[mm] [mm] [MPa] [MPa] [%] [%] [kNm] [kNm] [%] [%]2c Balint NS005 2φ8 3φ6 152 124 433 42.6 0.53 0.054 60 5.4 3.2 53 902c NS014/5 2φ12 6φ6 152 124 433 38.5 1.20 0.135 53 10.8 5.7 49 932c Mayfield 5A-1 2φ12 2φ12 150 158 449 24.0 0.96 0.179 71 7.6 11.2 76 512c 71 5A-2 2φ12 2φ12 150 158 449 24.0 0.96 0.179 71 7.0 11.2 76 472c 5B-1 2φ12 2φ6 150 158 449 19.6 0.96 0.219 18 5.8 2.5 18 412c 5B-2 2φ12 2φ6 150 158 449 19.6 0.96 0.219 18 6.6 2.5 18 462c 5C-1 2φ12 2φ12 150 158 449 19.1 0.96 0.225 71 6.8 10.7 75 482c 5D-1 2φ12 2φ6 150 158 449 17.2 0.96 0.251 18 5.9 2.5 18 422c 5E-1 2φ16 2φ6 150 158 449 24.0 1.70 0.318 10 6.2 2.8 12 262c 5F-1 2φ8 2φ6 150 158 449 22.1 0.43 0.087 40 4.4 2.8 37 582c 6A-1 2φ12 4φ6 150 158 449 20.1 0.96 0.214 35 6.4 5.1 35 452c 6A-2 2φ12 4φ6 150 158 449 20.1 0.96 0.214 35 6.9 5.1 35 482c 6B-1 2φ12 4φ8 150 158 449 20.6 0.96 0.209 63 8.6 9.9 69 602c 6B-2 2φ12 4φ8 150 158 449 20.6 0.96 0.209 63 7.6 9.9 69 532c 6C-1 2φ12 4φ12 150 158 449 19.6 0.96 0.219 141 8.6 18.4 100 602c 6C-2 2φ12 4φ12 150 158 449 19.6 0.96 0.219 141 10.7 18.4 100 752c 7-1 2φ12 6φ6 150 158 449 18.1 0.96 0.237 53 8.2 8.4 60 582c 7-2 2φ12 6φ6 150 158 449 18.1 0.96 0.237 53 8.5 8.4 60 602c 8-1 2φ12 8φ6 150 158 449 20.6 0.96 0.209 71 7.2 10.8 75 502c 8-2 2φ12 8φ6 150 158 449 20.6 0.96 0.209 71 6.9 10.8 75 482a Mayfield 10 2φ10 2φ6 150 158 375 17.2 0.66 0.145 25 5.4 2.2 24 612a 72 11 2φ10 4φ6 150 158 375 17.2 0.66 0.145 51 7.1 4.3 49 792a 12 2φ10 6φ6 150 158 375 18.1 0.66 0.137 76 7.9 7.3 81 892c 20-1 2φ10 2φ6 150 158 375 19.1 0.66 0.130 25 5.0 2.3 26 552c 20-2 2φ10 2φ6 150 158 375 19.1 0.66 0.130 25 5.2 2.3 26 572c 21A-1 2φ10 4φ6 150 158 375 17.7 0.66 0.141 51 5.3 4.3 48 602c 21A-2 2φ10 4φ6 150 158 375 17.7 0.66 0.141 51 5.3 4.3 48 592c 21B 2φ10 4φ6 150 158 375 13.2 0.66 0.188 51 6.5 5.0 59 762c 22A-1 2φ10 6φ6 150 158 375 18.6 0.66 0.134 76 5.5 7.3 81 602c 22A-2 2φ10 6φ6 150 158 375 18.6 0.66 0.134 76 5.5 7.3 81 602c 22B 2φ10 6φ6 150 158 375 13.2 0.66 0.188 76 5.5 6.8 80 662b Nilsson U27 4φ12 8φ10 350 169 405 20.1 0.76 0.154 107 18.1 29.5 100 642a U28 4φ12 24φ6 350 169 439 19.8 0.76 0.170 99 24.9 30.3 99 812a Stroband B14 2φ6 10φ2.8 70 109 504 9.6 0.74 0.391 77 1.9 2.2 77 682c Swann 9 2φ19 4φ12.7 152 123 295 20.0 3.02 0.446 63 13.3 11.2 66 782c 9' 2φ19 4φ12.7 152 123 295 17.3 3.02 0.514 63 8.7 11.1 65 512c 10 2φ19 4φ19 152 123 295 20.2 3.02 0.442 141 15.1 23.3 100 882c 10' 2φ19 4φ19 152 123 295 20.5 3.02 0.435 141 13.7 23.3 100 80
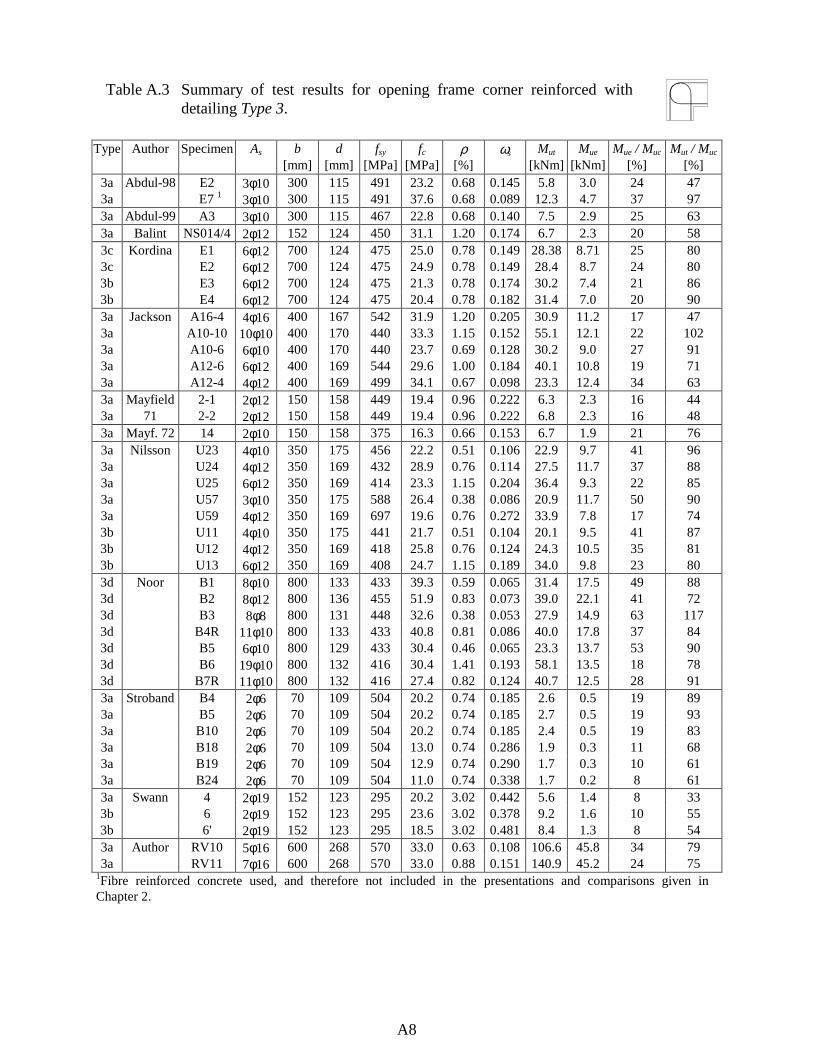
A8
Table A.3 Summary of test results for opening frame corner reinforced withdetailing Type 3.
Type Author Specimen As b d fsy fc ρ ωs Mut Mue Mue / Muc Mut / Muc
[mm] [mm] [MPa] [MPa] [%] [kNm] [kNm] [%] [%]3a Abdul-98 E2 3φ10 300 115 491 23.2 0.68 0.145 5.8 3.0 24 473a E7 1 3φ10 300 115 491 37.6 0.68 0.089 12.3 4.7 37 973a Abdul-99 A3 3φ10 300 115 467 22.8 0.68 0.140 7.5 2.9 25 633a Balint NS014/4 2φ12 152 124 450 31.1 1.20 0.174 6.7 2.3 20 583c Kordina E1 6φ12 700 124 475 25.0 0.78 0.149 28.38 8.71 25 803c E2 6φ12 700 124 475 24.9 0.78 0.149 28.4 8.7 24 803b E3 6φ12 700 124 475 21.3 0.78 0.174 30.2 7.4 21 863b E4 6φ12 700 124 475 20.4 0.78 0.182 31.4 7.0 20 903a Jackson A16-4 4φ16 400 167 542 31.9 1.20 0.205 30.9 11.2 17 473a A10-10 10φ10 400 170 440 33.3 1.15 0.152 55.1 12.1 22 1023a A10-6 6φ10 400 170 440 23.7 0.69 0.128 30.2 9.0 27 913a A12-6 6φ12 400 169 544 29.6 1.00 0.184 40.1 10.8 19 713a A12-4 4φ12 400 169 499 34.1 0.67 0.098 23.3 12.4 34 633a Mayfield 2-1 2φ12 150 158 449 19.4 0.96 0.222 6.3 2.3 16 443a 71 2-2 2φ12 150 158 449 19.4 0.96 0.222 6.8 2.3 16 483a Mayf. 72 14 2φ10 150 158 375 16.3 0.66 0.153 6.7 1.9 21 763a Nilsson U23 4φ10 350 175 456 22.2 0.51 0.106 22.9 9.7 41 963a U24 4φ12 350 169 432 28.9 0.76 0.114 27.5 11.7 37 883a U25 6φ12 350 169 414 23.3 1.15 0.204 36.4 9.3 22 853a U57 3φ10 350 175 588 26.4 0.38 0.086 20.9 11.7 50 903a U59 4φ12 350 169 697 19.6 0.76 0.272 33.9 7.8 17 743b U11 4φ10 350 175 441 21.7 0.51 0.104 20.1 9.5 41 873b U12 4φ12 350 169 418 25.8 0.76 0.124 24.3 10.5 35 813b U13 6φ12 350 169 408 24.7 1.15 0.189 34.0 9.8 23 803d Noor B1 8φ10 800 133 433 39.3 0.59 0.065 31.4 17.5 49 883d B2 8φ12 800 136 455 51.9 0.83 0.073 39.0 22.1 41 723d B3 8φ8 800 131 448 32.6 0.38 0.053 27.9 14.9 63 1173d B4R 11φ10 800 133 433 40.8 0.81 0.086 40.0 17.8 37 843d B5 6φ10 800 129 433 30.4 0.46 0.065 23.3 13.7 53 903d B6 19φ10 800 132 416 30.4 1.41 0.193 58.1 13.5 18 783d B7R 11φ10 800 132 416 27.4 0.82 0.124 40.7 12.5 28 913a Stroband B4 2φ6 70 109 504 20.2 0.74 0.185 2.6 0.5 19 893a B5 2φ6 70 109 504 20.2 0.74 0.185 2.7 0.5 19 933a B10 2φ6 70 109 504 20.2 0.74 0.185 2.4 0.5 19 833a B18 2φ6 70 109 504 13.0 0.74 0.286 1.9 0.3 11 683a B19 2φ6 70 109 504 12.9 0.74 0.290 1.7 0.3 10 613a B24 2φ6 70 109 504 11.0 0.74 0.338 1.7 0.2 8 613a Swann 4 2φ19 152 123 295 20.2 3.02 0.442 5.6 1.4 8 333b 6 2φ19 152 123 295 23.6 3.02 0.378 9.2 1.6 10 553b 6' 2φ19 152 123 295 18.5 3.02 0.481 8.4 1.3 8 543a Author RV10 5φ16 600 268 570 33.0 0.63 0.108 106.6 45.8 34 793a RV11 7φ16 600 268 570 33.0 0.88 0.151 140.9 45.2 24 75
1Fibre reinforced concrete used, and therefore not included in the presentations and comparisons given inChapter 2.

A9
Table A.4 Summary of test results for opening frame corner reinforced withdetailing Type 4.
Type Author Specimen As As,i b d fsy fc ρ ωs ρ* ωs* Mut Mut / Muc Mut / Muc
*
[mm] [mm] [MPa] [MPa] [%] [%] [kNm] [%] [%]4a Abdul-W A1 3φ10 3φ10 300 115 491 29.8 0.68 0.113 1.17 0.192 12.4 99 614a 98 A2 1 3φ10 3φ10 300 115 491 27.3 0.68 0.123 1.17 0.210 12.8 102 634a A3 1 3φ10 3φ10 300 115 491 31.9 0.68 0.105 1.17 0.180 13.7 109 664a A4 1 3φ10 3φ10 300 115 491 29.7 0.68 0.113 1.17 0.193 16.9 135 824a Abdul-99 B3 3φ10 3φ10 300 115 467 22.9 0.68 0.139 1.17 0.238 11.6 98 614e Kordina E5 6φ12 6φ10 700 124 466 18.5 0.78 0.197 1.17 0.293 31.9 93 634e E6 6φ12 6φ10 700 124 466 20.0 0.78 0.182 1.17 0.272 30.9 89 614a Nilsson UV5 4φ12 4φ12 350 169 422 24.4 0.76 0.133 1.31 0.226 35.6 118 734a UV6 4φ12 4φ10 350 169 413 21.2 0.76 0.149 1.14 0.222 34.4 118 824a UV7 4φ12 4φ8 350 169 413 24.6 0.76 0.128 1.01 0.169 37.0 125 974a U50 4φ10 4φ8 350 175 662 24.4 0.51 0.139 0.75 0.202 40.2 119 854a U50c 4φ10 4φ8 350 175 658 21.8 0.51 0.155 0.75 0.225 33.0 99 714a U50d 4φ10 4φ8 350 175 679 27.9 0.51 0.125 0.75 0.181 36.3 104 744a U51 4φ12 4φ10 350 169 657 25.6 0.76 0.196 1.14 0.293 46.6 103 734a U52 3φ10 3φ8 350 175 605 27.0 0.38 0.086 0.56 0.125 28.3 118 834e U53 3φ10 3φ8 350 175 646 21.7 0.38 0.115 0.56 0.167 28.2 112 794c U54 3φ10 3φ8 350 175 652 22.9 0.38 0.110 0.56 0.159 31.1 123 874a U56 2 3φ10 3φ8 350 175 598 20.4 0.38 0.113 0.56 0.164 27.9 120 854a U61 4φ10 3φ8 350 175 625 20.1 0.51 0.160 0.69 0.214 37.2 118 914d Noor BD1 11φ8 5φ8 800 132 498 28.2 0.52 0.093 0.69 0.122 32.4 93 714d BD2 19φ10 9φ10 800 132 416 32.6 1.41 0.180 1.89 0.241 73.5 98 744a Skettrup 7701 2φ25 1φ25 229 413 597 18.1 1.04 0.342 1.41 0.463 106.0 50 374a 7702 2φ20 1φ20 224 426 573 13.9 0.66 0.271 0.89 0.367 99.0 71 534a 7703 2α 1α 227 730 575 21.9 0.97 0.255 1.31 0.345 471.0 76 574a 7704 2φ25 1φ25 226 745 564 17.7 0.58 0.186 0.79 0.251 369.0 95 714a 8001 2φ16 1φ16 162 231 562 19.3 1.07 0.313 1.45 0.424 25.2 54 404a Stroband B9 2φ6 2φ6 70 109 504 20.9 0.74 0.179 1.27 0.305 2.8 96 574a B23 2φ6 2φ6 70 109 504 11.4 0.74 0.327 1.27 0.559 2.6 90 544a Swann 5 2φ19 2φ19 152 123 295 20.4 3.02 0.438 5.16 0.747 6.0 35 214b 7 2φ19 2φ19 152 123 295 20.5 3.02 0.436 5.16 0.744 9.8 61 444a Author RV9 5φ16 3φ16 600 268 570 33.0 0.63 0.108 0.89 0.154 133.5 98 701Fibre reinforced concrete used, and therefore not included in the presentations and comparisons given in Chapter 2.2Unequal effective height in the members adjoining the corner, add 200 mm to larger member.3α = φ20 + φ25.

A10
Table A.5 Summary of test results for opening frame corner reinforced withdetailing Type 3 with stirrups.
Type Author Specimen As As,r b d fsy fc ρ ωs FR / R Mut Mue Mue / Muc Mut / Muc
[mm] [mm] [MPa] [MPa] [%] [%] [kNm] [kNm] [%] [%]3a Mayfield 15 2φ10 2φ6 150 158 375 16.3 0.66 0.153 25 7.5 2.2 25 863a 72 16 2φ10 4φ6 150 158 375 16.3 0.66 0.153 51 7.1 4.3 49 813a 17 2φ10 6φ6 150 158 375 15.3 0.66 0.163 76 6.6 7.0 81 773a Stroband B6 2φ6 10φ2.8 70 109 504 20.2 0.74 0.185 77 2.8 2.2 78 993a B20 2φ6 10φ2.8 70 109 504 9.6 0.74 0.391 77 1.2 2.2 77 43
Table A.6 Summary of test results for opening frame corner reinforced withdetailing Type 4 with stirrups.
Type Author Specimen As As,i As,r b d fsy fc ρ ωs ρ* ωs* F / R Mut Mue Mue / Muc Mut / Muc Mut / Muc*
[mm] [mm] [MPa] [MPa] [%] [%] [%] [kNm] [kNm] [%] [%] [%]4a Mayfield 18-A 2φ10 2φ6 2φ6 150 158 375 17.8 0.66 0.140 1.14 0.175 25 8.1 2.2 24 91 744a 72 18-B 2φ10 2φ6 2φ6 150 158 375 17.8 0.66 0.140 1.14 0.175 25 8.8 2.2 24 98 804c Skettrup 8002 2φ16 1φ16 β 162 231 589 17.2 1.07 0.368 0.76 0.130 95 38.2 45.9 100 86 694c 8003 2φ16 1φ16 β 162 232 605 17.8 1.07 0.364 0.76 0.129 95 45.3 47.5 100 98 794c 8201 2φ16 1φ16 β 162 231 645 16.3 1.07 0.425 0.76 0.150 95 48.5 50.2 100 103 844c 8203 2φ16 1φ16 β 162 228 650 17.2 1.09 0.411 0.77 0.145 95 49.1 49.5 100 104 844c 8205 2φ16 1φ16 β 162 228 644 15.6 1.09 0.449 0.77 0.159 95 44.1 48.9 100 96 794c 8207 2φ16 1φ16 2φ12 162 228 655 17.9 1.09 0.398 0.77 0.141 40 48.1 22.0 46 100 814a Stroband B8 2φ6 2φ6 4φ6 70 109 504 20.2 0.74 0.185 1.27 0.316 141 2.8 4.0 100 96 574a B22 2φ6 2φ6 4φ6 70 109 504 10.7 0.74 0.350 1.27 0.598 141 2.3 4.0 100 82 50
1β = 4φ10 + 2φ12.
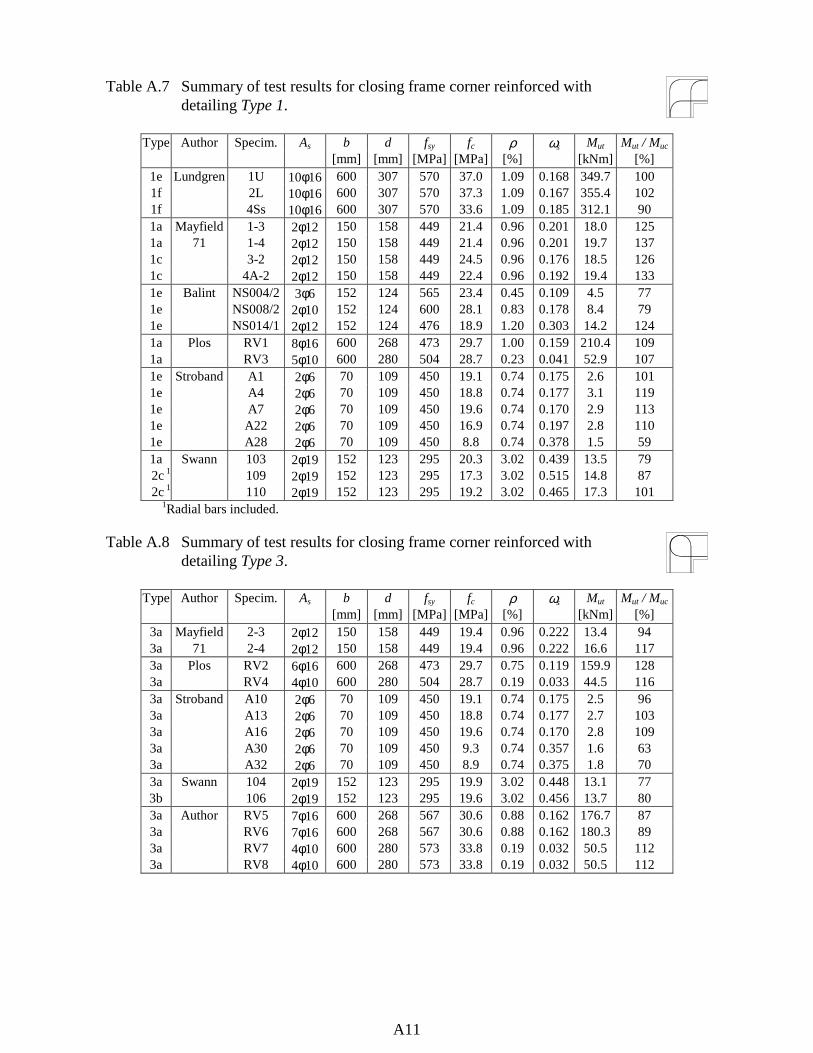
A11
Table A.7 Summary of test results for closing frame corner reinforced withdetailing Type 1.
Type Author Specim. As b d fsy fc ρ ωs Mut Mut / Muc
[mm] [mm] [MPa] [MPa] [%] [kNm] [%]1e Lundgren 1U 10φ16 600 307 570 37.0 1.09 0.168 349.7 1001f 2L 10φ16 600 307 570 37.3 1.09 0.167 355.4 1021f 4Ss 10φ16 600 307 570 33.6 1.09 0.185 312.1 901a Mayfield 1-3 2φ12 150 158 449 21.4 0.96 0.201 18.0 1251a 71 1-4 2φ12 150 158 449 21.4 0.96 0.201 19.7 1371c 3-2 2φ12 150 158 449 24.5 0.96 0.176 18.5 1261c 4A-2 2φ12 150 158 449 22.4 0.96 0.192 19.4 1331e Balint NS004/2 3φ6 152 124 565 23.4 0.45 0.109 4.5 771e NS008/2 2φ10 152 124 600 28.1 0.83 0.178 8.4 791e NS014/1 2φ12 152 124 476 18.9 1.20 0.303 14.2 1241a Plos RV1 8φ16 600 268 473 29.7 1.00 0.159 210.4 1091a RV3 5φ10 600 280 504 28.7 0.23 0.041 52.9 1071e Stroband A1 2φ6 70 109 450 19.1 0.74 0.175 2.6 1011e A4 2φ6 70 109 450 18.8 0.74 0.177 3.1 1191e A7 2φ6 70 109 450 19.6 0.74 0.170 2.9 1131e A22 2φ6 70 109 450 16.9 0.74 0.197 2.8 1101e A28 2φ6 70 109 450 8.8 0.74 0.378 1.5 591a Swann 103 2φ19 152 123 295 20.3 3.02 0.439 13.5 79
2c 1 109 2φ19 152 123 295 17.3 3.02 0.515 14.8 87 2c 1 110 2φ19 152 123 295 19.2 3.02 0.465 17.3 101
1Radial bars included.
Table A.8 Summary of test results for closing frame corner reinforced withdetailing Type 3.
Type Author Specim. As b d fsy fc ρ ωs Mut Mut / Muc
[mm] [mm] [MPa] [MPa] [%] [kNm] [%]3a Mayfield 2-3 2φ12 150 158 449 19.4 0.96 0.222 13.4 943a 71 2-4 2φ12 150 158 449 19.4 0.96 0.222 16.6 1173a Plos RV2 6φ16 600 268 473 29.7 0.75 0.119 159.9 1283a RV4 4φ10 600 280 504 28.7 0.19 0.033 44.5 1163a Stroband A10 2φ6 70 109 450 19.1 0.74 0.175 2.5 963a A13 2φ6 70 109 450 18.8 0.74 0.177 2.7 1033a A16 2φ6 70 109 450 19.6 0.74 0.170 2.8 1093a A30 2φ6 70 109 450 9.3 0.74 0.357 1.6 633a A32 2φ6 70 109 450 8.9 0.74 0.375 1.8 703a Swann 104 2φ19 152 123 295 19.9 3.02 0.448 13.1 773b 106 2φ19 152 123 295 19.6 3.02 0.456 13.7 803a Author RV5 7φ16 600 268 567 30.6 0.88 0.162 176.7 873a RV6 7φ16 600 268 567 30.6 0.88 0.162 180.3 893a RV7 4φ10 600 280 573 33.8 0.19 0.032 50.5 1123a RV8 4φ10 600 280 573 33.8 0.19 0.032 50.5 112

A12

B1
Appendix B Simply Supported Beams Reinforced with SplicedReinforcement Loops
The following tests have been carried out as part of a Master Thesis work by Peter Grasslunder supervision by the author. Below, only a very brief description of the test results isgiven; for further information about this work, see Grassl (1999).
Simply supported beams were tested to examine what influence the splice length of thereinforcement loops and width of the beam had on the structural response of the beam. Thebeam dimensions and reinforcement ratio were determined to be the same as in the framecorner tests presented in Paper I. Further, the concrete and reinforcement quality was similarwith a compressive strength fc = 28 MPa and reinforcement yield strength fsy = 543 MPa. Thebeam dimensions and test set-up are shown in Figure B.1, while Table B.1 presents theparameters varied. To simplify the registration of the longitudinal cracks expected in thespliced zone, the beams were tested upside-down.
A-A
3 000
3 200
lspliceA
A φ16
φ10 s200
deformation-controlledloading
32
b
32300φ16
40 40lsplice
r
Figure B.1 Dimensions and test set-up of beams.

B2
Table B.1 Parameters varied in the beam tests.
Specimen b lsplice r As ρ ωs
[mm] [mm] [mm] [%]
RV12 600 220 110 7 φ16 0.88 0.171
RV13 - " - 600 - " - - " - - " - - " -
RV14 1200 - " - - " - 14 φ16 - " - - " -
RV15 1 600 --- --- 7 φ16 - " - - " -1Unspliced beam used as reference beam.
The load-displacement relations obtained in tests are compared in Figure B.2; the maximumload and the corresponding displacement are summarised in Table B.2. Due to the larger beamwidth of RV14, the load values for this specimen were halved to ensure a direct comparison tothe other beams. The reference beam RV15 obtained a ductile behaviour and failed due toshear at a rather large displacement. The behaviour in the beams provided with short splicelength, though (i.e. specimens RV12 and RV14), was determined by spalling of the sideconcrete cover. This is also reflected in the load-displacement relation, where it can be seenthat neither specimen reached the same load capacity as the reference beam RV15.Nevertheless, both specimens still obtained a rather ductile post-peak behaviour. In specimenRV13, where long splice lengths were provided, side concrete spalling was never initiated.However, splitting cracks at the straight part of the spliced loops were observed at a load of260 kN. Shortly after this, the load suddenly dropped about by 50 kN and a distribution ofinternal forces took place, when the main anchorage of the loops changed from the straight tothe bent part. The load then increased again until shear failure was obtained, hence resulting ina brittle failure at a rather small displacement. The beam crack patterns at end of test areshown in Figure B.3.
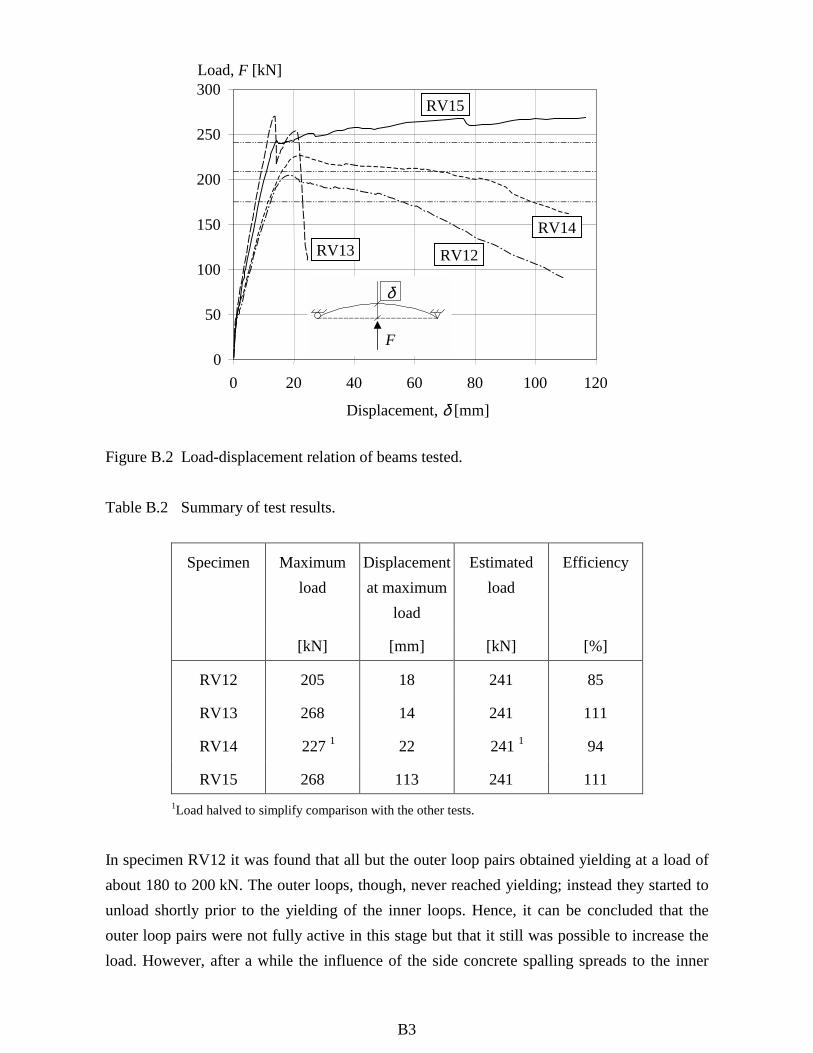
B3
0
50
100
150
200
250
300
0 20 40 60 80 100 120
Displacement, δ [mm]
Load, F [kN]
RV15
RV13 RV12
RV14
F
δ
Figure B.2 Load-displacement relation of beams tested.
Table B.2 Summary of test results.
Specimen Maximumload
Displacementat maximum
load
Estimatedload
Efficiency
[kN] [mm] [kN] [%]
RV12 205 18 241 85
RV13 268 14 241 111
RV14 227 1 22 241 1 94
RV15 268 113 241 1111Load halved to simplify comparison with the other tests.
In specimen RV12 it was found that all but the outer loop pairs obtained yielding at a load ofabout 180 to 200 kN. The outer loops, though, never reached yielding; instead they started tounload shortly prior to the yielding of the inner loops. Hence, it can be concluded that theouter loop pairs were not fully active in this stage but that it still was possible to increase theload. However, after a while the influence of the side concrete spalling spreads to the inner

B4
Specimen RV12 Specimen RV13
Specimen RV14 Specimen RV15
Figure B.3 Crack patterns at final failure.
loops so that they eventually unload too, thus limiting the maximum load capacity. From this,it seems reasonable that the structural response obtained is related to what percentage of thetotal reinforcement amount is affected by the initiation of the side concrete spalling; i.e. thenumber of internal bars compared to the total amount of reinforcement is important. This wasalso confirmed in the tests; the maximum load and post-peak ductility reached in specimenRV14 were higher than those of specimen RV12. In the former, two out of fourteen bars wereaffected; i.e. 86% of the reinforcement present was still fully available to balance the externalload. The corresponding value for specimen RV12 was five out of seven bars or, differentlyput 71% of the original amount of reinforcement. Thus, it is also logical that the formerobtains both higher load capacity and improved post-peak response compared to the latter.
Even though the load capacity reached in specimen RV13 was higher than that in thespecimens using short splice length, it may be argued that its structural behaviour was lesspreferable due to its sudden load drop. The somewhat too low load capacity obtained, whenshort splice length was used, can be dealt with in a simplified way by not taking into accountthe outer reinforcement loops when determining the structure’s load capacity; i.e. by basingthe estimated moment capacity on a reduced reinforcement amount As,red as

B5
As,red = (n-2)⋅Aφ
where n is the total number of reinforcement loops used and Aφ is the cross-section of one bar.If using this approach for specimen RV12 and RV14, the estimated load and efficiencyobtained would then be as shown in Table B.3.
Table B.3 Summary of test results; specimen RV15 is included for comparison.
Specimen Maximumload
Estimatedload
Efficiency
[kN] [kN] [%]
RV12 205 175 117
RV14 227 1 209 1 109
RV15 268 241 1111Load halved to simplify comparison with the other tests.

B6
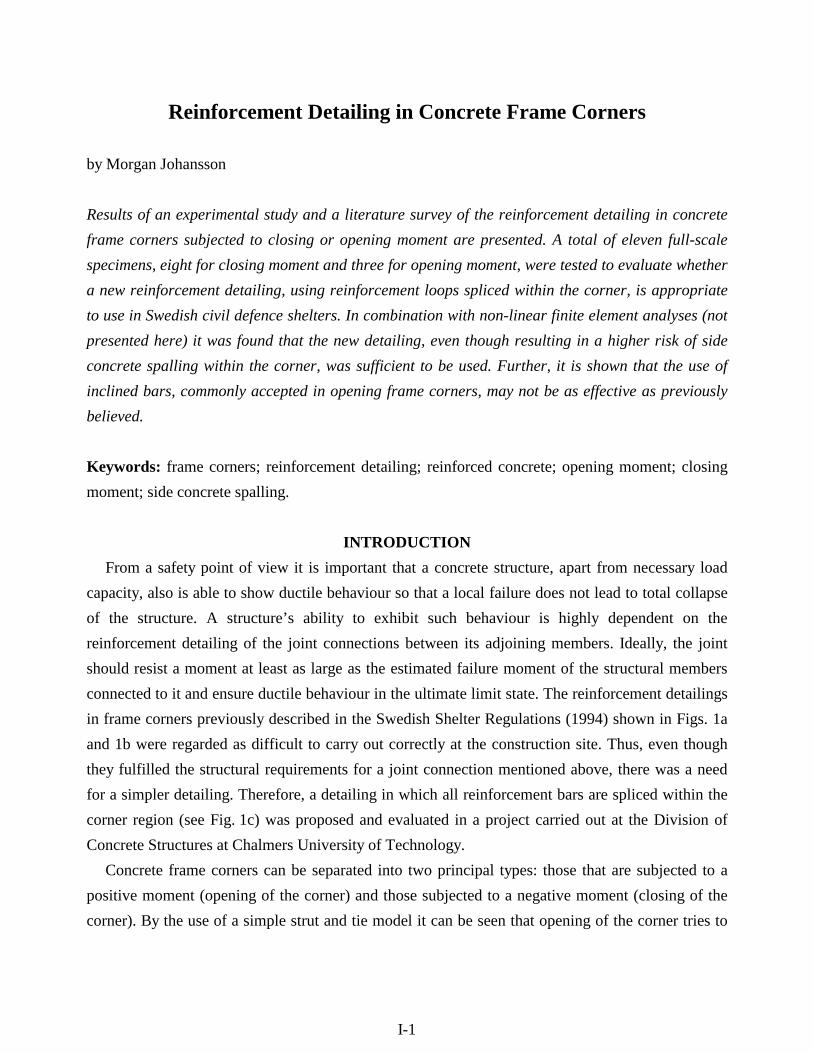
I-1
Reinforcement Detailing in Concrete Frame Corners
by Morgan Johansson
Results of an experimental study and a literature survey of the reinforcement detailing in concreteframe corners subjected to closing or opening moment are presented. A total of eleven full-scalespecimens, eight for closing moment and three for opening moment, were tested to evaluate whethera new reinforcement detailing, using reinforcement loops spliced within the corner, is appropriateto use in Swedish civil defence shelters. In combination with non-linear finite element analyses (notpresented here) it was found that the new detailing, even though resulting in a higher risk of sideconcrete spalling within the corner, was sufficient to be used. Further, it is shown that the use ofinclined bars, commonly accepted in opening frame corners, may not be as effective as previouslybelieved.
Keywords: frame corners; reinforcement detailing; reinforced concrete; opening moment; closingmoment; side concrete spalling.
INTRODUCTIONFrom a safety point of view it is important that a concrete structure, apart from necessary load
capacity, also is able to show ductile behaviour so that a local failure does not lead to total collapseof the structure. A structure’s ability to exhibit such behaviour is highly dependent on thereinforcement detailing of the joint connections between its adjoining members. Ideally, the jointshould resist a moment at least as large as the estimated failure moment of the structural membersconnected to it and ensure ductile behaviour in the ultimate limit state. The reinforcement detailingsin frame corners previously described in the Swedish Shelter Regulations (1994) shown in Figs. 1aand 1b were regarded as difficult to carry out correctly at the construction site. Thus, even thoughthey fulfilled the structural requirements for a joint connection mentioned above, there was a needfor a simpler detailing. Therefore, a detailing in which all reinforcement bars are spliced within thecorner region (see Fig. 1c) was proposed and evaluated in a project carried out at the Division ofConcrete Structures at Chalmers University of Technology.
Concrete frame corners can be separated into two principal types: those that are subjected to apositive moment (opening of the corner) and those subjected to a negative moment (closing of thecorner). By the use of a simple strut and tie model it can be seen that opening of the corner tries to

I-2
inclined bar
(a) (b) (c)
Fig. 1 Schematic figures of the detailings previously described in the Swedish ShelterRegulations for (a) closing moment; (b) opening moment; (c) the new proposalexamined.
split the corner in two by pushing off the outside portion (Fig. 2). This is opposite to whathappens when closing the corner; the tensile and compressive forces then interact in a waythat instead confines the concrete between them. Accordingly, the two cases also present quitedifferent difficulties in their respective reinforcement detailing. Generally speaking, it can besaid that an opening moment is characterised by the concrete tensile failure, while a closingmoment depends more on the compressive strength of the concrete. Consequently, intheoretical and experimental studies it has also been concluded that the reinforcementdetailing of frame corners is more sensitive in the former case than the latter (Mayfield et al.1971; Nilsson and Losberg 1976). Therefore, the main effort of experimental studies has alsobeen concentrated on frame corners subjected to opening moments. Especially Mayfield et al.(1971, 1972) and Nilsson (1973) carried out extensive test series where many differentreinforcement detailings were examined. Other valuable contributions to the knowledge ofopening corners have been made by, for example: Swann (1969), Noor (1977), Stroband andKolpa (1981), Jackson (1995), and Abdul-Wahab and Al-Roubai (1998). Of these, Swann,Mayfield et al. (1971), Stroband and Kolpa (1983) also studied the behaviour of closing framecorners; other researchers in this field are for instance Balint and Taylor (1972), Plos (1994)and Lundgren (1999).
The aim of this study was to investigate whether the proposed reinforcement detailing(detailing c in Fig. 1) is appropriate to use instead of the conventional ones (detailings a and bin Fig 1.). To do this, a combination of full-scale tests, comparison to previous research andnon-linear finite element analyses was carried out. This paper, though, is limited to the twofirst parts; for information about the finite element analyses, see Johansson (1996), Karlssonand Johansson (1997), and Johansson (2000a).
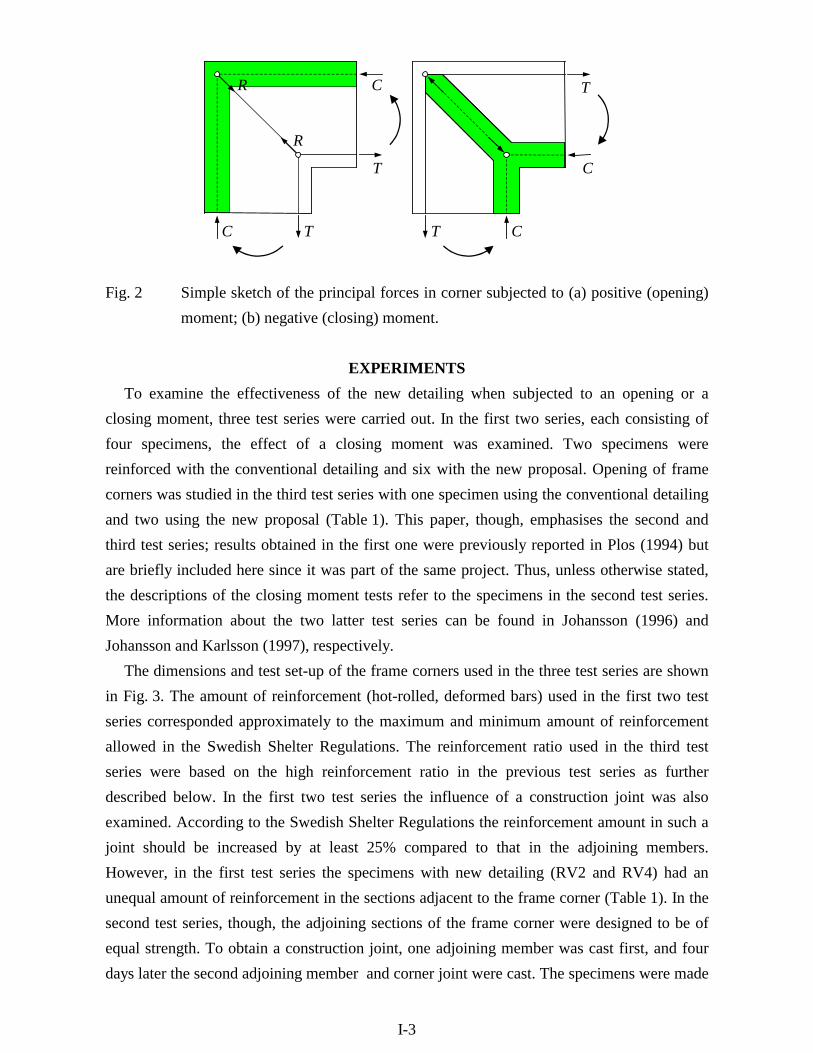
I-3
R
T
C
C T T C
T
C
R
Fig. 2 Simple sketch of the principal forces in corner subjected to (a) positive (opening)moment; (b) negative (closing) moment.
EXPERIMENTSTo examine the effectiveness of the new detailing when subjected to an opening or a
closing moment, three test series were carried out. In the first two series, each consisting offour specimens, the effect of a closing moment was examined. Two specimens werereinforced with the conventional detailing and six with the new proposal. Opening of framecorners was studied in the third test series with one specimen using the conventional detailingand two using the new proposal (Table 1). This paper, though, emphasises the second andthird test series; results obtained in the first one were previously reported in Plos (1994) butare briefly included here since it was part of the same project. Thus, unless otherwise stated,the descriptions of the closing moment tests refer to the specimens in the second test series.More information about the two latter test series can be found in Johansson (1996) andJohansson and Karlsson (1997), respectively.
The dimensions and test set-up of the frame corners used in the three test series are shownin Fig. 3. The amount of reinforcement (hot-rolled, deformed bars) used in the first two testseries corresponded approximately to the maximum and minimum amount of reinforcementallowed in the Swedish Shelter Regulations. The reinforcement ratio used in the third testseries were based on the high reinforcement ratio in the previous test series as furtherdescribed below. In the first two test series the influence of a construction joint was alsoexamined. According to the Swedish Shelter Regulations the reinforcement amount in such ajoint should be increased by at least 25% compared to that in the adjoining members.However, in the first test series the specimens with new detailing (RV2 and RV4) had anunequal amount of reinforcement in the sections adjacent to the frame corner (Table 1). In thesecond test series, though, the adjoining sections of the frame corner were designed to be ofequal strength. To obtain a construction joint, one adjoining member was cast first, and fourdays later the second adjoining member and corner joint were cast. The specimens were made

I-4
in pairs; the two specimens that would be directly compared with each other were cast withconcrete from the same batch. The specimens in the third test series did not have aconstruction joint and were all cast at the same time. The distance from the centre of theoutermost bar to the free concrete sides was 40 mm in the closing frame corners. In theopening frame corners this distance was doubled to 80 mm to avoid spalling failure of the sideconcrete cover. The concrete covers on the tensile and compressive side of the specimenswere 1.5φ in all specimens, where φ is the bar diameter used; the reinforcement bars were inall specimens positioned in one layer only. The strength of the concrete used was determinedby tests on water-cured cylinders (φ150 x 300 mm) at day of testing according to Swedishstandard, BST Byggstandardiseringen (1991).
Table 1 Reinforcement amount and detailing in tested frame corners.
Type of Detailing 1 Test Reinforcement fsy fc ρ ωs
moment specimen adjoiningmembers
corner [MPa] [MPa] [%]
a RV1 6φ16 8φ16 473 29.7 1.00 0.159c RV2 - " - 6φ16 2 - " - - " - 0.75 0.119a RV3 4φ10 5φ10 504 28.7 0.23 0.041 c RV4 - " - 4φ10 3 - " - - " - 0.19 0.033c RV5 5φ16 7φ16 567 30.6 0.88 0.162c RV6 - " - - " - - " - - " - 0.88 0.162c RV7 3φ10 4φ10 573 33.8 0.19 0.032 c RV8 - " - - " - - " - - " - 0.19 0.032b RV9 5φ16 5φ16 4 570 32.2 0.63 5 0.110 5
c RV10 - " - 5φ16 - " - - " - 0.63 0.110 c RV11 - " - 7φ16 - " - - " - 0.88 0.155
1 The notation refers to that used in Fig. 1.2 Unequal amount in adjacent sections; 8φ16 crossed the construction joint.3 Unequal amount in adjacent sections; 5φ10 crossed the construction joint.4 Also 3φ16 inclined bars.5 ρ = 0.89 and ωs = 0.158 if the inclined bars are taken into account as shown in Eq. (2).

I-5
2150
300
loadline
constructionjoint
21501700
300
600
A-A
A A
300
B B2150
loadline
300
600
B-B
300
300
21501700
Transducer usedfor displacementcontrol
Load cell
Hydraulic jackLoadline
HydraulicjackLoad cell
Constructionjoint
Displacementtransducer
Loadline
a) b)
Fig. 3 Dimensions and test set-up of (a) first and second test series (closing moment);and (b) third test series (opening moment).
It is common to discuss in terms of reinforcement ratio ρ when determining the allowableamount of reinforcement in a frame corner. However, this measure is inadequate since it doesnot take into account the reinforcement quality or the strength of the concrete. This statementis especially true for frame corners subjected to opening moment, where the concretebehaviour in tension may have a very large influence on the overall response, but also inclosing moments when there is risk of spalling of the concrete side cover or crushing of thecompressive zone. However, a variable that takes these factors into consideration is themechanical reinforcement ratio
c
sys
c
sys bdf
fAff
== ρω (1)
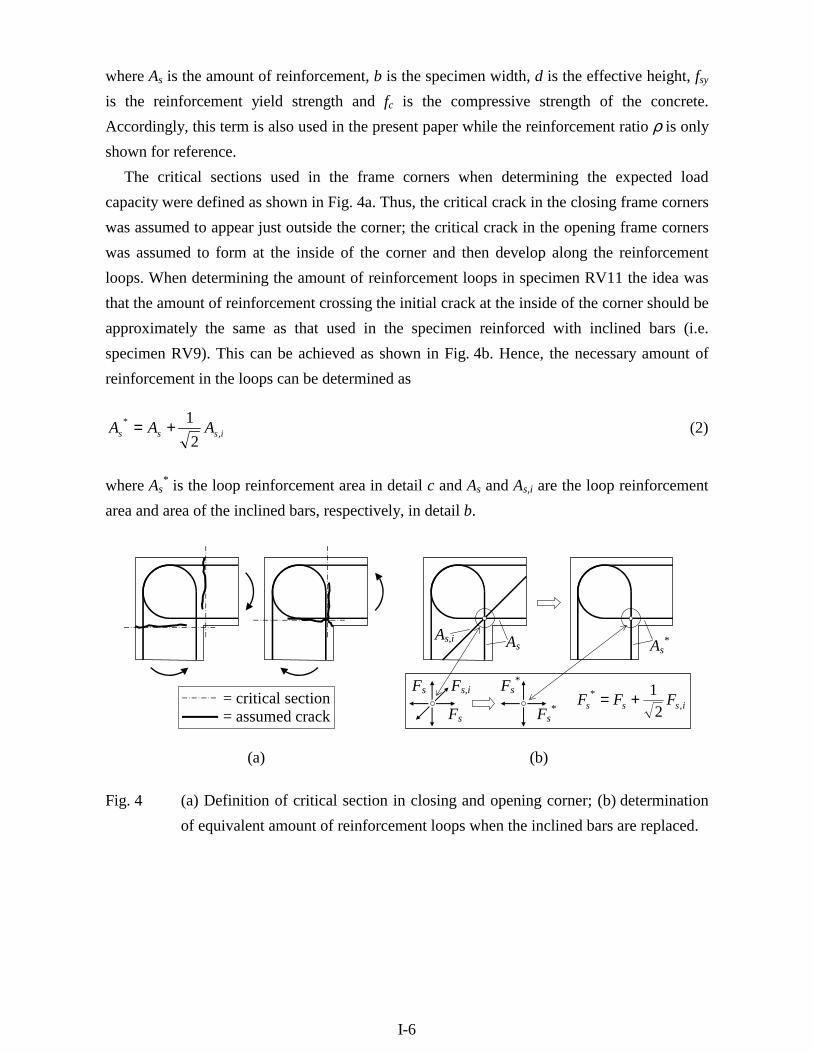
I-6
where As is the amount of reinforcement, b is the specimen width, d is the effective height, fsy
is the reinforcement yield strength and fc is the compressive strength of the concrete.Accordingly, this term is also used in the present paper while the reinforcement ratio ρ is onlyshown for reference.
The critical sections used in the frame corners when determining the expected loadcapacity were defined as shown in Fig. 4a. Thus, the critical crack in the closing frame cornerswas assumed to appear just outside the corner; the critical crack in the opening frame cornerswas assumed to form at the inside of the corner and then develop along the reinforcementloops. When determining the amount of reinforcement loops in specimen RV11 the idea wasthat the amount of reinforcement crossing the initial crack at the inside of the corner should beapproximately the same as that used in the specimen reinforced with inclined bars (i.e.specimen RV9). This can be achieved as shown in Fig. 4b. Hence, the necessary amount ofreinforcement in the loops can be determined as
isss AAA ,*
21+= (2)
where As* is the loop reinforcement area in detail c and As and As,i are the loop reinforcement
area and area of the inclined bars, respectively, in detail b.
Fs
Fs Fs,i
Fs*
Fs*
isss FFF ,*
21+=
As*As,i As
= critical section= assumed crack
(a) (b)
Fig. 4 (a) Definition of critical section in closing and opening corner; (b) determinationof equivalent amount of reinforcement loops when the inclined bars are replaced.
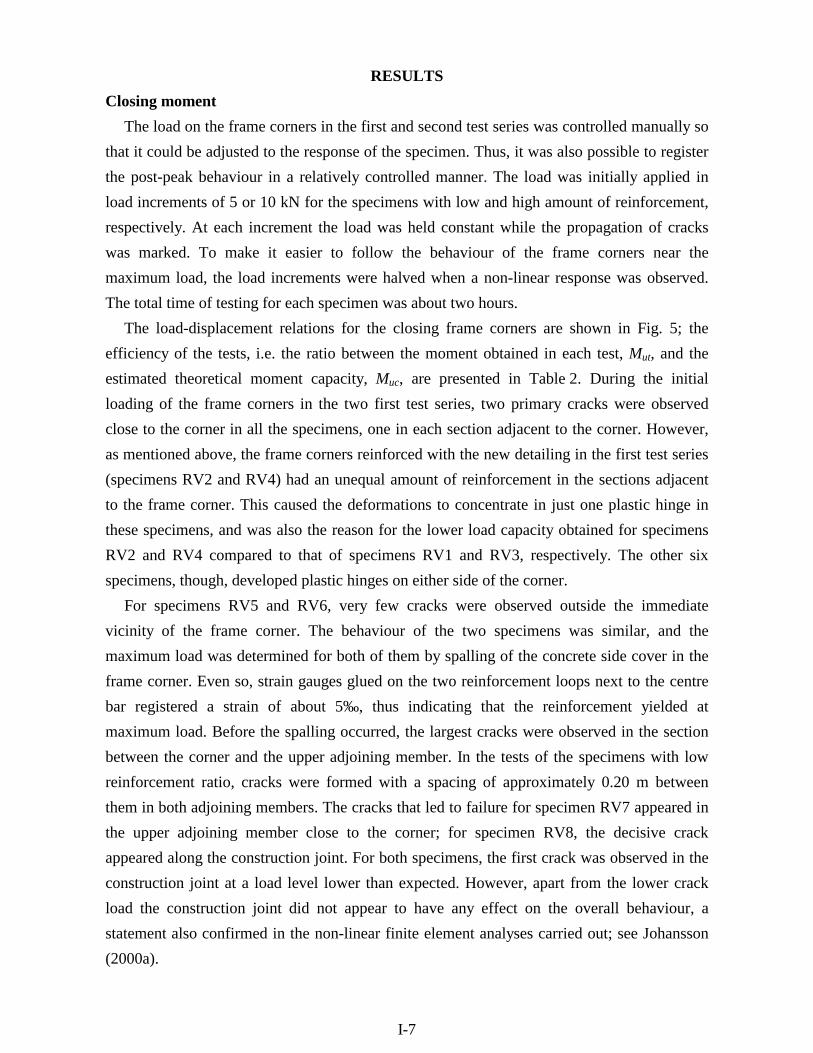
I-7
RESULTSClosing moment
The load on the frame corners in the first and second test series was controlled manually sothat it could be adjusted to the response of the specimen. Thus, it was also possible to registerthe post-peak behaviour in a relatively controlled manner. The load was initially applied inload increments of 5 or 10 kN for the specimens with low and high amount of reinforcement,respectively. At each increment the load was held constant while the propagation of crackswas marked. To make it easier to follow the behaviour of the frame corners near themaximum load, the load increments were halved when a non-linear response was observed.The total time of testing for each specimen was about two hours.
The load-displacement relations for the closing frame corners are shown in Fig. 5; theefficiency of the tests, i.e. the ratio between the moment obtained in each test, Mut, and theestimated theoretical moment capacity, Muc, are presented in Table 2. During the initialloading of the frame corners in the two first test series, two primary cracks were observedclose to the corner in all the specimens, one in each section adjacent to the corner. However,as mentioned above, the frame corners reinforced with the new detailing in the first test series(specimens RV2 and RV4) had an unequal amount of reinforcement in the sections adjacentto the frame corner. This caused the deformations to concentrate in just one plastic hinge inthese specimens, and was also the reason for the lower load capacity obtained for specimensRV2 and RV4 compared to that of specimens RV1 and RV3, respectively. The other sixspecimens, though, developed plastic hinges on either side of the corner.
For specimens RV5 and RV6, very few cracks were observed outside the immediatevicinity of the frame corner. The behaviour of the two specimens was similar, and themaximum load was determined for both of them by spalling of the concrete side cover in theframe corner. Even so, strain gauges glued on the two reinforcement loops next to the centrebar registered a strain of about 5‰, thus indicating that the reinforcement yielded atmaximum load. Before the spalling occurred, the largest cracks were observed in the sectionbetween the corner and the upper adjoining member. In the tests of the specimens with lowreinforcement ratio, cracks were formed with a spacing of approximately 0.20 m betweenthem in both adjoining members. The cracks that led to failure for specimen RV7 appeared inthe upper adjoining member close to the corner; for specimen RV8, the decisive crackappeared along the construction joint. For both specimens, the first crack was observed in theconstruction joint at a load level lower than expected. However, apart from the lower crackload the construction joint did not appear to have any effect on the overall behaviour, astatement also confirmed in the non-linear finite element analyses carried out; see Johansson(2000a).
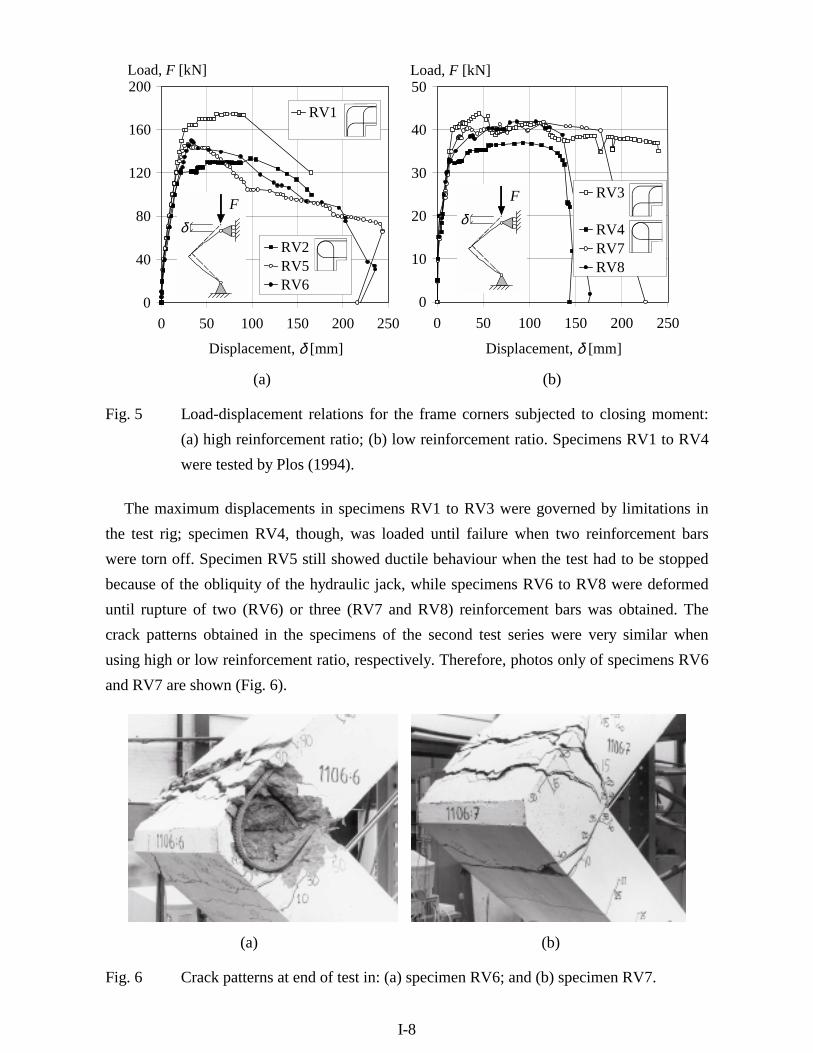
I-8
0
40
80
120
160
200
0 50 100 150 200 250
Displacement, δ [mm]
Load, F [kN]
δF
RV1
RV2RV5RV6
0
10
20
30
40
50
0 50 100 150 200 250
Displacement, δ [mm]
Load, F [kN]
δF RV3
RV4RV7RV8
(a) (b)
Fig. 5 Load-displacement relations for the frame corners subjected to closing moment:(a) high reinforcement ratio; (b) low reinforcement ratio. Specimens RV1 to RV4were tested by Plos (1994).
The maximum displacements in specimens RV1 to RV3 were governed by limitations inthe test rig; specimen RV4, though, was loaded until failure when two reinforcement barswere torn off. Specimen RV5 still showed ductile behaviour when the test had to be stoppedbecause of the obliquity of the hydraulic jack, while specimens RV6 to RV8 were deformeduntil rupture of two (RV6) or three (RV7 and RV8) reinforcement bars was obtained. Thecrack patterns obtained in the specimens of the second test series were very similar whenusing high or low reinforcement ratio, respectively. Therefore, photos only of specimens RV6and RV7 are shown (Fig. 6).
(a) (b)
Fig. 6 Crack patterns at end of test in: (a) specimen RV6; and (b) specimen RV7.
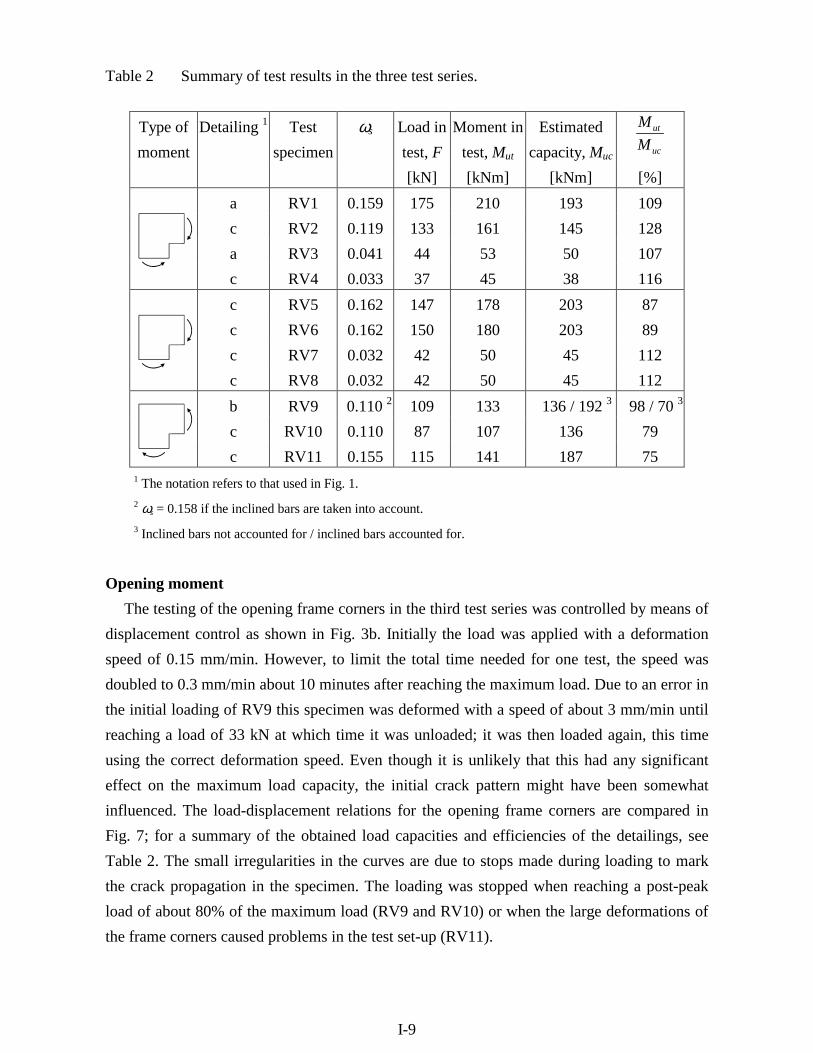
I-9
Table 2 Summary of test results in the three test series.
Type ofmoment
Detailing 1 Testspecimen
ωs Load intest, F
Moment intest, Mut
Estimatedcapacity, Muc uc
ut
MM
[kN] [kNm] [kNm] [%]a RV1 0.159 175 210 193 109c RV2 0.119 133 161 145 128a RV3 0.041 44 53 50 107 c RV4 0.033 37 45 38 116c RV5 0.162 147 178 203 87c RV6 0.162 150 180 203 89c RV7 0.032 42 50 45 112 c RV8 0.032 42 50 45 112b RV9 0.110 2 109 133 136 / 192 3 98 / 70 3
c RV10 0.110 87 107 136 79 c RV11 0.155 115 141 187 751 The notation refers to that used in Fig. 1.2 ωs = 0.158 if the inclined bars are taken into account.3 Inclined bars not accounted for / inclined bars accounted for.
Opening momentThe testing of the opening frame corners in the third test series was controlled by means of
displacement control as shown in Fig. 3b. Initially the load was applied with a deformationspeed of 0.15 mm/min. However, to limit the total time needed for one test, the speed wasdoubled to 0.3 mm/min about 10 minutes after reaching the maximum load. Due to an error inthe initial loading of RV9 this specimen was deformed with a speed of about 3 mm/min untilreaching a load of 33 kN at which time it was unloaded; it was then loaded again, this timeusing the correct deformation speed. Even though it is unlikely that this had any significanteffect on the maximum load capacity, the initial crack pattern might have been somewhatinfluenced. The load-displacement relations for the opening frame corners are compared inFig. 7; for a summary of the obtained load capacities and efficiencies of the detailings, seeTable 2. The small irregularities in the curves are due to stops made during loading to markthe crack propagation in the specimen. The loading was stopped when reaching a post-peakload of about 80% of the maximum load (RV9 and RV10) or when the large deformations ofthe frame corners caused problems in the test set-up (RV11).
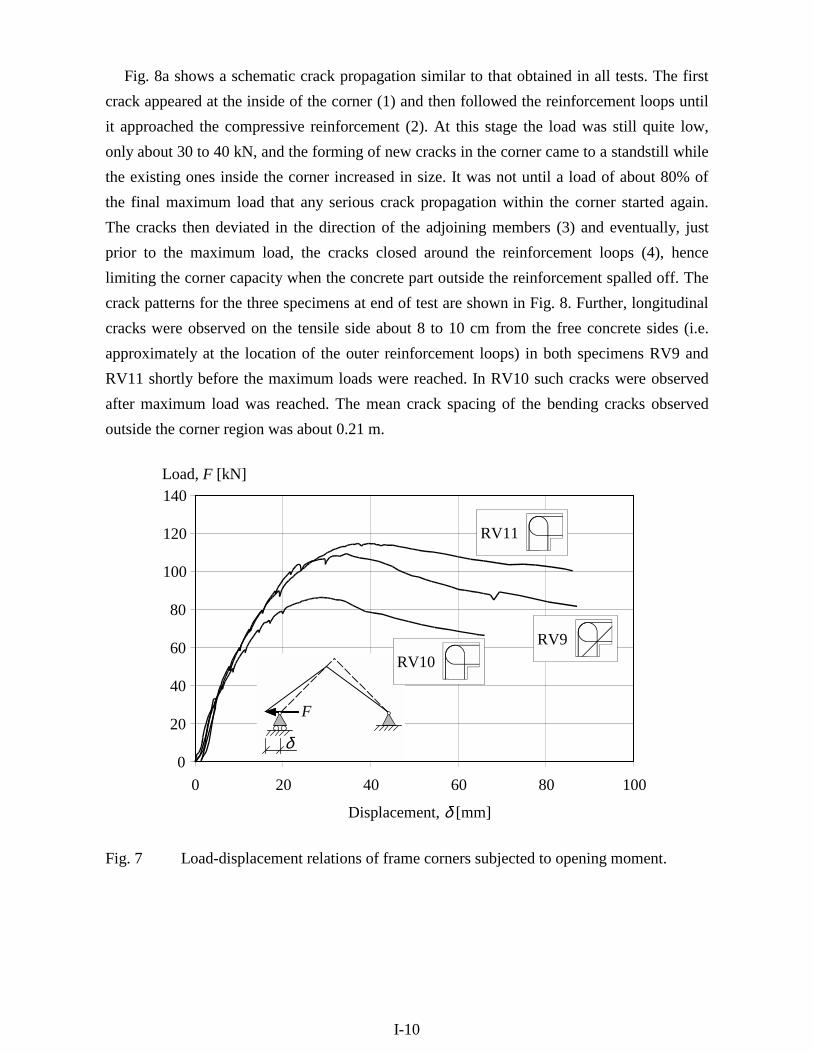
I-10
Fig. 8a shows a schematic crack propagation similar to that obtained in all tests. The firstcrack appeared at the inside of the corner (1) and then followed the reinforcement loops untilit approached the compressive reinforcement (2). At this stage the load was still quite low,only about 30 to 40 kN, and the forming of new cracks in the corner came to a standstill whilethe existing ones inside the corner increased in size. It was not until a load of about 80% ofthe final maximum load that any serious crack propagation within the corner started again.The cracks then deviated in the direction of the adjoining members (3) and eventually, justprior to the maximum load, the cracks closed around the reinforcement loops (4), hencelimiting the corner capacity when the concrete part outside the reinforcement spalled off. Thecrack patterns for the three specimens at end of test are shown in Fig. 8. Further, longitudinalcracks were observed on the tensile side about 8 to 10 cm from the free concrete sides (i.e.approximately at the location of the outer reinforcement loops) in both specimens RV9 andRV11 shortly before the maximum loads were reached. In RV10 such cracks were observedafter maximum load was reached. The mean crack spacing of the bending cracks observedoutside the corner region was about 0.21 m.
0
20
40
60
80
100
120
140
0 20 40 60 80 100
Displacement, δ [mm]
Load, F [kN]
δ
F
RV9
RV11
RV10
Fig. 7 Load-displacement relations of frame corners subjected to opening moment.
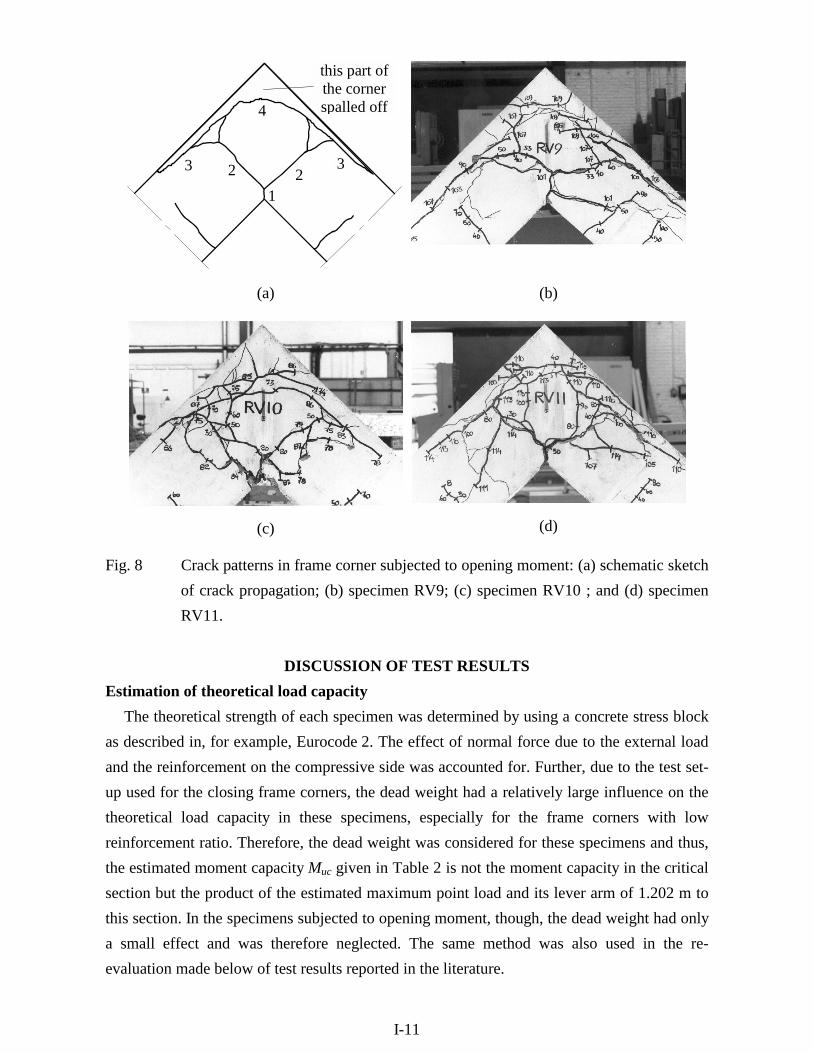
I-11
this part ofthe cornerspalled off
122 33
4
(a) (b)
(c) (d)
Fig. 8 Crack patterns in frame corner subjected to opening moment: (a) schematic sketchof crack propagation; (b) specimen RV9; (c) specimen RV10 ; and (d) specimenRV11.
DISCUSSION OF TEST RESULTSEstimation of theoretical load capacity
The theoretical strength of each specimen was determined by using a concrete stress blockas described in, for example, Eurocode 2. The effect of normal force due to the external loadand the reinforcement on the compressive side was accounted for. Further, due to the test set-up used for the closing frame corners, the dead weight had a relatively large influence on thetheoretical load capacity in these specimens, especially for the frame corners with lowreinforcement ratio. Therefore, the dead weight was considered for these specimens and thus,the estimated moment capacity Muc given in Table 2 is not the moment capacity in the criticalsection but the product of the estimated maximum point load and its lever arm of 1.202 m tothis section. In the specimens subjected to opening moment, though, the dead weight had onlya small effect and was therefore neglected. The same method was also used in the re-evaluation made below of test results reported in the literature.

I-12
Closing momentDue to uneven capacities in the adjoining member, it is not possible to make a direct
comparison of the specimens in the first test series. However, the efficiencies were all above100% and the ductility similar, thus indicating that the examined detailings are comparable.The unusually high efficiency obtained in specimen RV2 was due to substantial hardening inthe reinforcement; as can be seen in Fig. 5, though, yielding of the reinforcement firstoccurred at a load of about 121 kN which corresponds well to the estimated load capacity of120 kN. Because of the spalling of the concrete side cover in specimens RV5 and RV6 in thesecond test series, a somewhat lower maximum load capacity than expected was obtained.Also, the plateau in the load-displacement relation, observed for RV1 and RV2, did notappear. The differences between the estimated and observed maximum load capacities for thespecimens with low reinforcement ratios, though, were similar and the large plateau in theload-displacement relation was observed in all tests.
Based on experience gained in tests on simply supported beams of identical concrete crosssections and spliced with the same type and amount of reinforcement loops as used here,according to Grassl (1999), it can be assumed that the efficiency of the outermost bars, due tothe spalling of the concrete cover, probably was only about 50% when the maximum load wasreached. On this assumption, the estimated load capacity obtained would be 144 kN, a valuethat corresponds quite well with the loads of 147 kN and 150 kN reached in the tests of thespecimens that spalled (i.e. RV5 and RV6). Because of the spalling, the strain in the innerreinforcement bars increased more rapidly near the maximum load in an attempt tocompensate for the loss of the outermost bars. Eventually, though, depending for example onthe bar spacing, the loss of concrete cover may influence the bars further from the free sidetoo and cause them to lose their anchorage capacity as well, something that probably alsohappened here. However, the fact that two reinforcement bars in RV6 were torn off before theend of the tests shows that the innermost bars were still fully active. Hence, contrary to whatis said in Stroband and Kolpa (1983), the spalling did not give rise to a sudden failure. Thereason for this was that even though the contribution of the outer bars in specimens RV5 andRV6, due to loss of anchorage, largely disappeared close to the maximum load, the inner barswere still able to balance a large part of the load. The specimen width and number ofreinforcement bars used by Stroband and Kolpa in their tests were 70 mm and 2φ6,respectively. Thus, when the reinforcement loops started to fail in anchorage due to thespalling, there were no extra bars to assist in balancing the internal section force.
Accordingly, if a large percentage of the total reinforcement amount is affected by spalling,as may be the case in beam-column joints, there is a risk of brittle behaviour. From the tests itcan be concluded that there is higher risk of spalling of the side concrete cover when using the
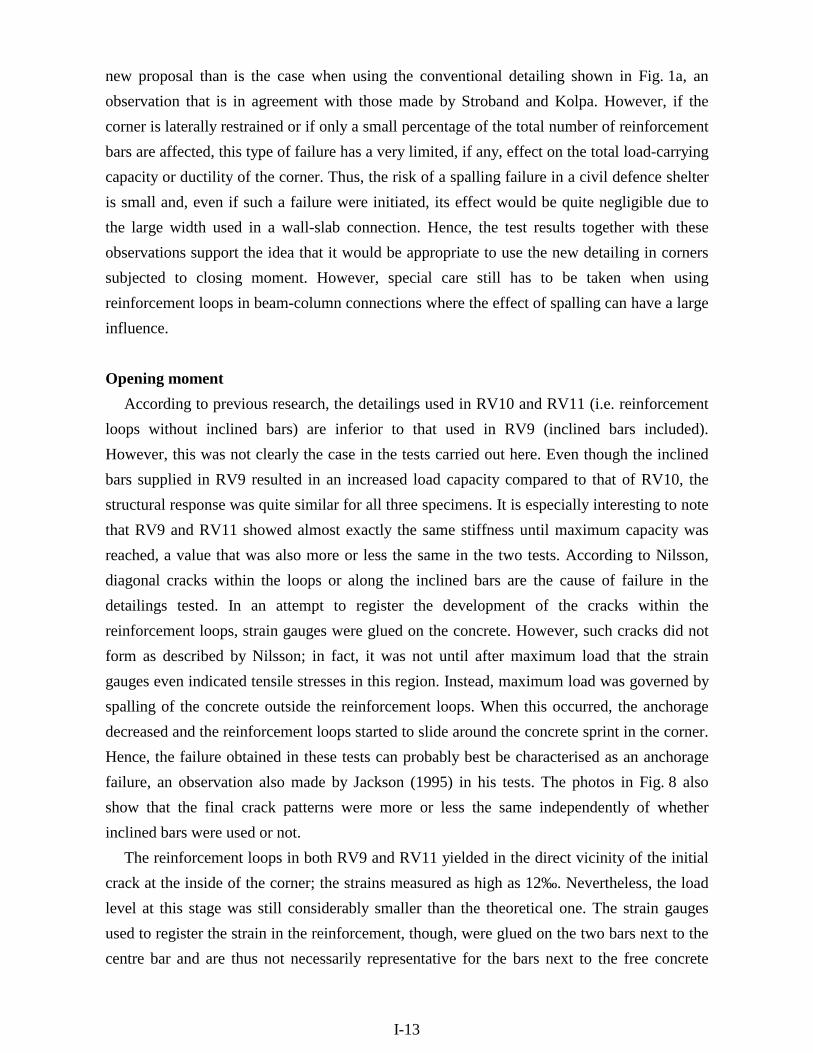
I-13
new proposal than is the case when using the conventional detailing shown in Fig. 1a, anobservation that is in agreement with those made by Stroband and Kolpa. However, if thecorner is laterally restrained or if only a small percentage of the total number of reinforcementbars are affected, this type of failure has a very limited, if any, effect on the total load-carryingcapacity or ductility of the corner. Thus, the risk of a spalling failure in a civil defence shelteris small and, even if such a failure were initiated, its effect would be quite negligible due tothe large width used in a wall-slab connection. Hence, the test results together with theseobservations support the idea that it would be appropriate to use the new detailing in cornerssubjected to closing moment. However, special care still has to be taken when usingreinforcement loops in beam-column connections where the effect of spalling can have a largeinfluence.
Opening momentAccording to previous research, the detailings used in RV10 and RV11 (i.e. reinforcement
loops without inclined bars) are inferior to that used in RV9 (inclined bars included).However, this was not clearly the case in the tests carried out here. Even though the inclinedbars supplied in RV9 resulted in an increased load capacity compared to that of RV10, thestructural response was quite similar for all three specimens. It is especially interesting to notethat RV9 and RV11 showed almost exactly the same stiffness until maximum capacity wasreached, a value that was also more or less the same in the two tests. According to Nilsson,diagonal cracks within the loops or along the inclined bars are the cause of failure in thedetailings tested. In an attempt to register the development of the cracks within thereinforcement loops, strain gauges were glued on the concrete. However, such cracks did notform as described by Nilsson; in fact, it was not until after maximum load that the straingauges even indicated tensile stresses in this region. Instead, maximum load was governed byspalling of the concrete outside the reinforcement loops. When this occurred, the anchoragedecreased and the reinforcement loops started to slide around the concrete sprint in the corner.Hence, the failure obtained in these tests can probably best be characterised as an anchoragefailure, an observation also made by Jackson (1995) in his tests. The photos in Fig. 8 alsoshow that the final crack patterns were more or less the same independently of whetherinclined bars were used or not.
The reinforcement loops in both RV9 and RV11 yielded in the direct vicinity of the initialcrack at the inside of the corner; the strains measured as high as 12‰. Nevertheless, the loadlevel at this stage was still considerably smaller than the theoretical one. The strain gaugesused to register the strain in the reinforcement, though, were glued on the two bars next to thecentre bar and are thus not necessarily representative for the bars next to the free concrete

I-14
side. Hence, based on the observations made by Grassl discussed in the previous section, thisstrongly indicates that the load capacity of the opening frame corners was affected by spallingof the side concrete cover. This statement is also strengthened by the appearance of thelongitudinal cracks observed close to the free concrete sides in both specimens beforereaching maximum load. Accordingly, it is the author’s belief that if spalling of the sideconcrete cover had been prevented, a higher load capacity would also have been obtained inthe tests. Whether the efficiency would have reached 100%, though, is unclear but notprobable since the forming of the critical crack around the reinforcement loops (crack 4 in Fig.8a) at a later stage would still have affected the anchorage capacity and thus decreased theforce taken by the reinforcement loops. Further, the post-peak behaviour in specimens RV9and RV10 was more or less the same; a somewhat more ductile behaviour was obtained inRV11. Based on the amount of reinforcement loops used in each specimen, this indicates thatthe response in this stage to a large degree depends on the amount of reinforcement loops,while the presence of inclined bars seems to have a quite negligible effect in this stage.
COMPARISON WITH OTHER RESEARCHAs mentioned in the introduction, various researchers have been working with the
behaviour of frame corners subjected to closing and/or opening moment and several detailingshave been tested and evaluated. Hence, an attempt is made here to summarise the test resultsknown by the author using the detailings shown in Fig. 1 and detailings similar to those asshown in Johansson (2000b). Different combinations, using various amounts and types ofsecondary reinforcement, are not considered. Due to this, the work by Luo et al. (1994) wasnot included; further, the tests reported by Östlund (1963) was not taken into account since noinformation about the steel strength was available.
The load-displacement relations after maximum load are rarely shown in the literature.This is due to the use of pure load-controlled testing by which it is not possible to register thepost-peak behaviour. Accordingly, this makes it hard to know anything about the post-peakductility obtained when using different detailings; many results are instead reported only asthe ratio of the maximum moment obtained in test and the theoretical estimated ultimatemoment. Such results reported by various researchers on frame corners subjected to closingand opening moment, respectively, are illustrated in Figs. 9 and 10; a thorough summary ofthe results can be found in Johansson (2000b). Due to limited space, the sources of the testresults in these figures are only identified by the use of the author’s name first mentioned inthe reference list. Most of these reports originally refer to the concrete compressive strength asthe cube strength. However, since the compressive strength used for design in both Eurocode
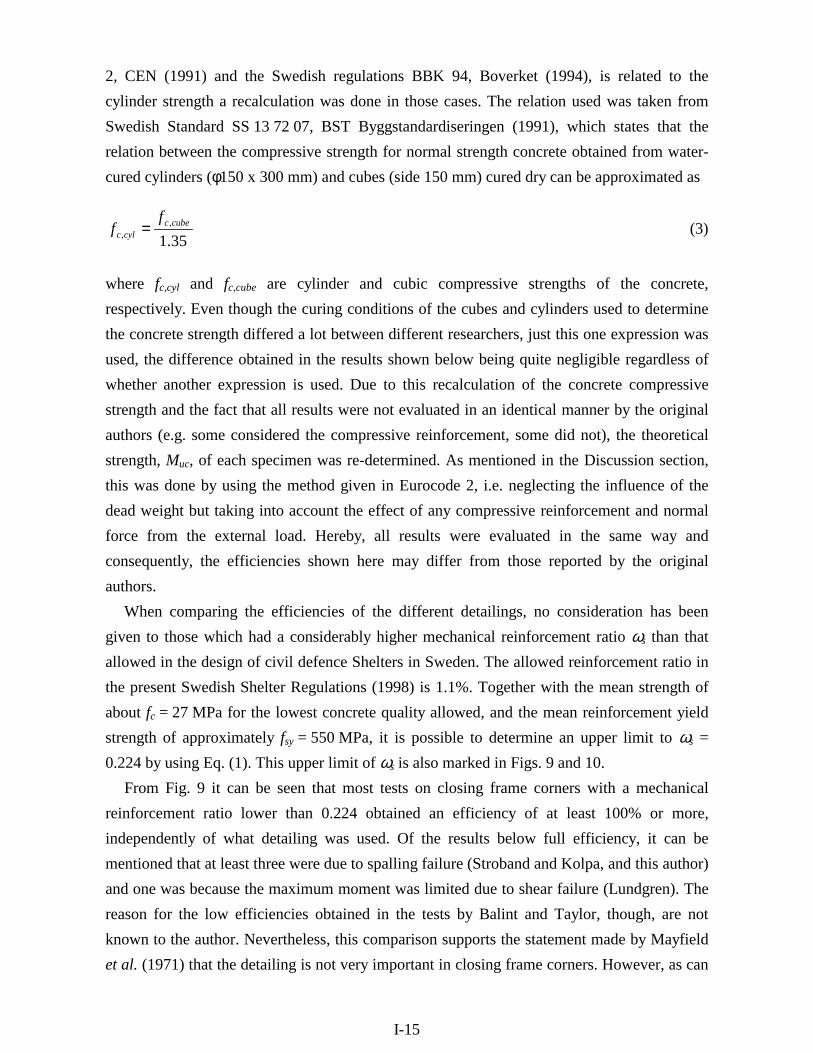
I-15
2, CEN (1991) and the Swedish regulations BBK 94, Boverket (1994), is related to thecylinder strength a recalculation was done in those cases. The relation used was taken fromSwedish Standard SS 13 72 07, BST Byggstandardiseringen (1991), which states that therelation between the compressive strength for normal strength concrete obtained from water-cured cylinders (φ150 x 300 mm) and cubes (side 150 mm) cured dry can be approximated as
35.1,
,cubec
cylc
ff = (3)
where fc,cyl and fc,cube are cylinder and cubic compressive strengths of the concrete,respectively. Even though the curing conditions of the cubes and cylinders used to determinethe concrete strength differed a lot between different researchers, just this one expression wasused, the difference obtained in the results shown below being quite negligible regardless ofwhether another expression is used. Due to this recalculation of the concrete compressivestrength and the fact that all results were not evaluated in an identical manner by the originalauthors (e.g. some considered the compressive reinforcement, some did not), the theoreticalstrength, Muc, of each specimen was re-determined. As mentioned in the Discussion section,this was done by using the method given in Eurocode 2, i.e. neglecting the influence of thedead weight but taking into account the effect of any compressive reinforcement and normalforce from the external load. Hereby, all results were evaluated in the same way andconsequently, the efficiencies shown here may differ from those reported by the originalauthors.
When comparing the efficiencies of the different detailings, no consideration has beengiven to those which had a considerably higher mechanical reinforcement ratio ωs than thatallowed in the design of civil defence Shelters in Sweden. The allowed reinforcement ratio inthe present Swedish Shelter Regulations (1998) is 1.1%. Together with the mean strength ofabout fc = 27 MPa for the lowest concrete quality allowed, and the mean reinforcement yieldstrength of approximately fsy = 550 MPa, it is possible to determine an upper limit to ωs =0.224 by using Eq. (1). This upper limit of ωs is also marked in Figs. 9 and 10.
From Fig. 9 it can be seen that most tests on closing frame corners with a mechanicalreinforcement ratio lower than 0.224 obtained an efficiency of at least 100% or more,independently of what detailing was used. Of the results below full efficiency, it can bementioned that at least three were due to spalling failure (Stroband and Kolpa, and this author)and one was because the maximum moment was limited due to shear failure (Lundgren). Thereason for the low efficiencies obtained in the tests by Balint and Taylor, though, are notknown to the author. Nevertheless, this comparison supports the statement made by Mayfieldet al. (1971) that the detailing is not very important in closing frame corners. However, as can

I-16
be seen in Fig. 10, such is not the case with opening frame corners. Due to this, the furtherdiscussion focuses on the opening of frame corners.
0
20
40
60
80
100
120
140
0.000 0.100 0.200 0.300 0.400 0.500
Mechanical reinforcement ratio
Efficiency [%]
Swann SwannMayfield MayfieldStroband StrobandPlos PlosBalint AuthorLundgren
Detail a Detail c
0
20
40
60
80
100
120
140
0.000 0.100 0.200 0.300 0.400 0.500
Mechanical reinforcement ratio
Efficiency [%]
Detail a Detail c
Fig. 9 Efficiency of frame corners subjected to closing moment when the reinforcementdetailing varies. The dashed line marks the maximum mechanical reinforcementratio allowed in the Swedish Shelter Regulations.
0
20
40
60
80
100
120
140
0.000 0.100 0.200 0.300 0.400 0.500
Mechanical reinforcement ratio
Efficiency [%]
Detail b
Nilsson StrobandNoor SkettrupAbdul-W. KoordinaSwann Author
0
20
40
60
80
100
120
140
0.000 0.100 0.200 0.300 0.400 0.500
Mechanical reinforcement ratio
Nilsson StrobandNoor JacksonAbdul-W. KoordinaBalint MayfieldSwann Author
Efficiency [%]
Detail c
Fig. 10 Efficiency of frame corners subjected to opening moment when differentdetailings are used. The dashed line marks the maximum mechanicalreinforcement ratio allowed in the Swedish Shelter Regulations.
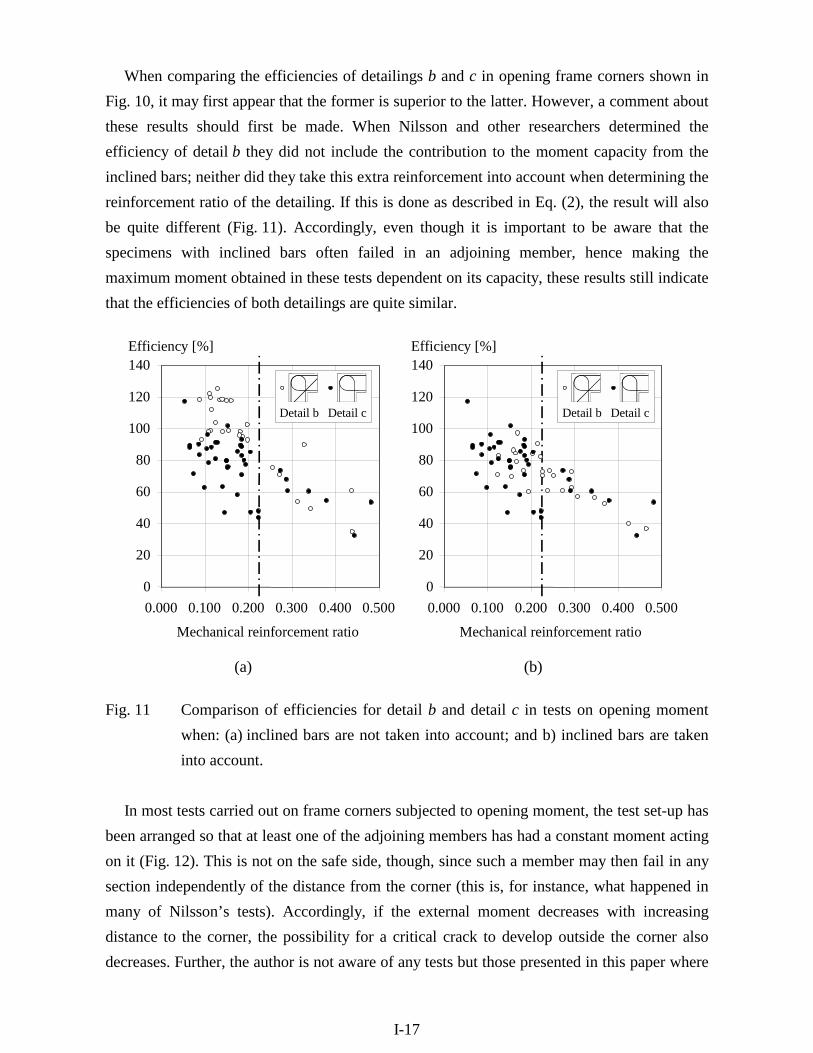
I-17
When comparing the efficiencies of detailings b and c in opening frame corners shown inFig. 10, it may first appear that the former is superior to the latter. However, a comment aboutthese results should first be made. When Nilsson and other researchers determined theefficiency of detail b they did not include the contribution to the moment capacity from theinclined bars; neither did they take this extra reinforcement into account when determining thereinforcement ratio of the detailing. If this is done as described in Eq. (2), the result will alsobe quite different (Fig. 11). Accordingly, even though it is important to be aware that thespecimens with inclined bars often failed in an adjoining member, hence making themaximum moment obtained in these tests dependent on its capacity, these results still indicatethat the efficiencies of both detailings are quite similar.
0
20
40
60
80
100
120
140
0.000 0.100 0.200 0.300 0.400 0.500
Mechanical reinforcement ratio
Efficiency [%]
Detail b Detail c
0
20
40
60
80
100
120
140
0.000 0.100 0.200 0.300 0.400 0.500
Mechanical reinforcement ratio
Efficiency [%]
Detail b Detail c
(a) (b)
Fig. 11 Comparison of efficiencies for detail b and detail c in tests on opening momentwhen: (a) inclined bars are not taken into account; and b) inclined bars are takeninto account.
In most tests carried out on frame corners subjected to opening moment, the test set-up hasbeen arranged so that at least one of the adjoining members has had a constant moment actingon it (Fig. 12). This is not on the safe side, though, since such a member may then fail in anysection independently of the distance from the corner (this is, for instance, what happened inmany of Nilsson’s tests). Accordingly, if the external moment decreases with increasingdistance to the corner, the possibility for a critical crack to develop outside the corner alsodecreases. Further, the author is not aware of any tests but those presented in this paper where
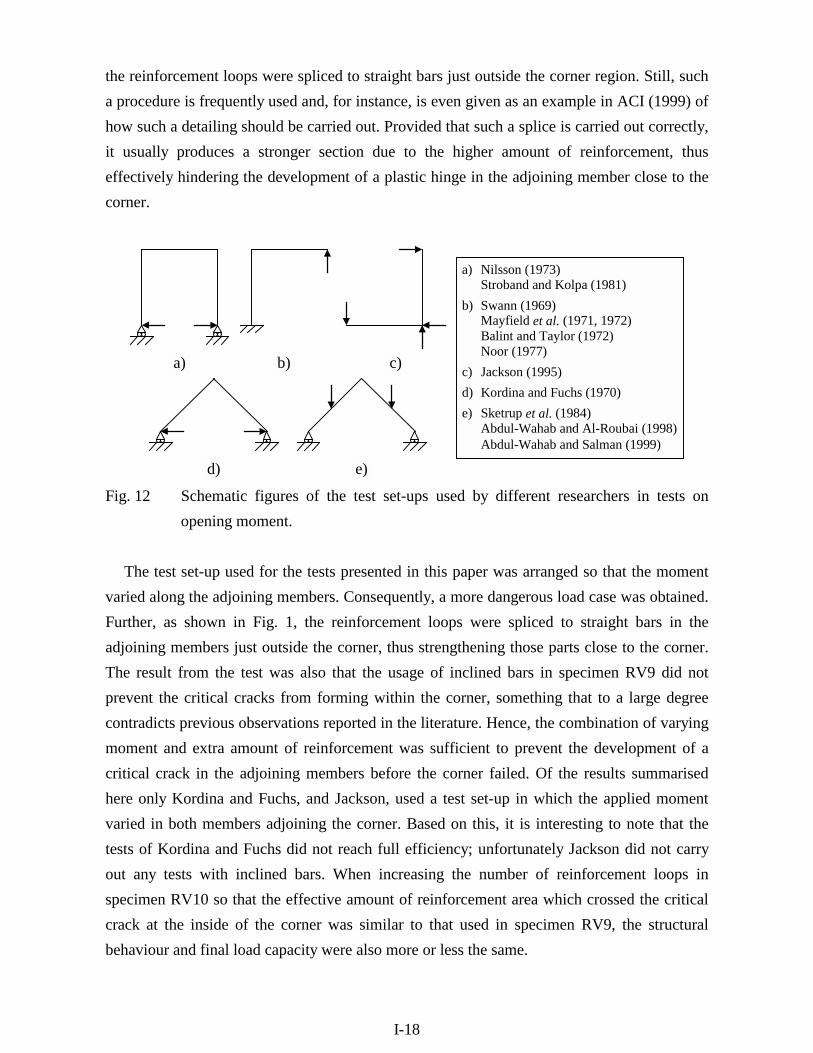
I-18
the reinforcement loops were spliced to straight bars just outside the corner region. Still, sucha procedure is frequently used and, for instance, is even given as an example in ACI (1999) ofhow such a detailing should be carried out. Provided that such a splice is carried out correctly,it usually produces a stronger section due to the higher amount of reinforcement, thuseffectively hindering the development of a plastic hinge in the adjoining member close to thecorner.
a) Nilsson (1973)Stroband and Kolpa (1981)
b) Swann (1969)Mayfield et al. (1971, 1972)Balint and Taylor (1972)Noor (1977)
c) Jackson (1995)d) Kordina and Fuchs (1970)e) Sketrup et al. (1984)
Abdul-Wahab and Al-Roubai (1998)Abdul-Wahab and Salman (1999)
e)d)
a) b) c)
Fig. 12 Schematic figures of the test set-ups used by different researchers in tests onopening moment.
The test set-up used for the tests presented in this paper was arranged so that the momentvaried along the adjoining members. Consequently, a more dangerous load case was obtained.Further, as shown in Fig. 1, the reinforcement loops were spliced to straight bars in theadjoining members just outside the corner, thus strengthening those parts close to the corner.The result from the test was also that the usage of inclined bars in specimen RV9 did notprevent the critical cracks from forming within the corner, something that to a large degreecontradicts previous observations reported in the literature. Hence, the combination of varyingmoment and extra amount of reinforcement was sufficient to prevent the development of acritical crack in the adjoining members before the corner failed. Of the results summarisedhere only Kordina and Fuchs, and Jackson, used a test set-up in which the applied momentvaried in both members adjoining the corner. Based on this, it is interesting to note that thetests of Kordina and Fuchs did not reach full efficiency; unfortunately Jackson did not carryout any tests with inclined bars. When increasing the number of reinforcement loops inspecimen RV10 so that the effective amount of reinforcement area which crossed the criticalcrack at the inside of the corner was similar to that used in specimen RV9, the structuralbehaviour and final load capacity were also more or less the same.
I-19
Accordingly, it can be concluded that the usage of inclined bars is not more effective instrengthening the corner region than is the use of extra reinforcement loops; the test resultspresented here even indicate the opposite. Instead, it is the lower amount of reinforcement inthe adjoining member compared to that in the corner that causes the failure to occur outsidethe corner. Hence, the reliability of the inclined bars depends on the external momentdistribution and whether the reinforcement loops are spliced to straight bars just outside thecorner. When using only reinforcement loops it is unlikely that the final failure will occuroutside the corner. This is because the loops increase the load capacity in the adjoiningmember just as much as in the corner. Thus, since the external moment probably reaches itsmaximum within the corner and the theoretical moment capacity is the same in both cases, itis inevitable that the critical section also will be positioned at the inside of the corner. Evenso, as has been shown in the tests presented here, quite a ductile behaviour might very wellstill be the case. Consequently, the inclined bars could, if it seems proper, equally well bereplaced by extra reinforcement loops. If a response similar to that obtained when usinginclined bars is wanted, Eq. (1) can be used to determine the necessary amount of extrareinforcement loops in the connection. The amount of inclined bars previously prescribed inthe Swedish Shelter Regulations was based on the recommendations given in Nilsson (1973)and thus required this amount to be at least half that of the reinforcement loops used. Hence,using Eq. (1) it can be concluded that, if detail c is to be used the total amount ofreinforcement loops shall be about 1.35As where As is the amount of reinforcement needed ifthe efficiency of the detailing had been 100%. This value is also what is prescribed in thepresent regulations, Swedish Rescue Services Agency (1998).
CONCLUSIONSA combination of full-scale tests and a literature survey of concrete frame corners
subjected to closing or opening moment has been carried out to evaluate the usage of a newreinforcement proposal, using reinforcement loops spliced within the corner, in Swedish civildefence shelters.
Although there is a greater risk of spalling of the side concrete cover, it was concluded thatit is suitable to replace the conventional detailing previously used in closing frame cornerswith the new one. However, special care still has to be taken when using this kind of detailingin beam-column connections where the effect of spalling can have large influences on thefinal capacity.
It was found that the commonly accepted reinforcement detailing in opening corners, usinginclined bars at the inside of the corner, may not be as effective as previously believed; itsefficiency largely depends on the applied moment distribution and the detailing of the
I-20
reinforcement just outside the corner area. A similar effect can instead be obtained by thepresence of extra reinforcement loops, thus making the detailing easier to carry out. Further, itwas found that even though full efficiency of such a corner detailing may not be achieved,ductile behaviour may very well still be obtained. While the test series is quite limited, it stillindicates that the post-peak response of opening frame corners depends to a large degree onthe amount of reinforcement loops, whereas the influence of any inclined bars seems to besmall.
The work presented has, in combination with non-linear finite element analyses resulted, ina change of the previous Shelter Regulations so that the detailing evaluated here now is alsovalid for use in the design of civil defence shelters in Sweden.
ACKNOWLEDGEMENTSThe research presented in this paper was financed by the Swedish Rescue Services Agency.The author would like to thank Professor Kent Gylltoft, head of the Division of ConcreteStructures, for his support and advice. Special thanks are due to Björn Ekengren at theSwedish Rescue Services Agency and Dr. Mario Plos at Reinertsen Engineering for theirmuch appreciated and encouraging support in the project. The author would also like toexpress his gratitude to Stefan Karlsson and Mathias Johansson for their valuablecontributions in the testing and evaluation of the opening frame corners. Thanks also to thestaff of the Structural Engineering Laboratory, for their invaluable assistance in theexperimental part of this work.
NOTATIONSAs reinforcement areaAs
* effective reinforcement area when inclined bars are consideredAs,i reinforcement area of inclined barsb widthC compressive forced effective heightF loadFs force in reinforcement loopsFs
* effective force when inclined bars are consideredFs,i force in inclined barsfc concretefc,cube compressive cube strength of concretefc,cyl compressive cylinder strength of concrete
I-21
fsy reinforcement yield strengthMuc estimated moment capacityMut maximum moment obtained in testR resultant forceT tensile forceδ displacementρ reinforcement ratioφ diameterωs mechanical reinforcement ratio
REFERENCESAbdul-Wahab, H. M. S., and Al-Roubai, A. A. M., “Strength and behaviour of steel fibre
reinforced concrete corners under opening bending moment, ”Magazine of ConcreteResearch, V. 50, No. 4, Dec. 1998, pp. 305-318.
Abdul-Wahab, H. M. S., and Salman, S.A.R., “Effect of Corner Angle on Efficiency ofReinforced Concrete Joints under Opening Bending Moment,” ACI Structural Journal V. 96,No. 1, Jan-Feb. 1999, pp. 115-121.
ACI Committee 315, “Details and Detailing of Concrete Reinforcement (ACI 315-92),”American Concrete Institute, Farmington Hills, Mich., 1999.
Balint, P. S., and Taylor, H. P. J., “Reinforcement Detailing of Frame Corner Joints withParticular Reference to Opening Corners, ”Technical Report 42.462, Cement and ConcreteAssociation, London, 1972, 16 pp.
Boverket, “Boverkets handbok för Betongkonstruktioner BBK 94, Band 1, Konstruktion(Boverket's Handbook for Concrete Structures, BBK 94, Vol. 1, Design),” Boverket,Byggavdelningen, Karlskrona, Sweden, 1994, 185 pp. (in Swedish)
BST Byggstandardiseringen, “Betongprovning med Svensk Standard, BST handbok 12,utgåva 6 (Concrete Testing according to Swedish Standard, BST Handbook 12, sixthedition),” SIS – standardiserings-kommisionen i Sverige och Svensk Byggtjänst, Stockholm,Sweden, 1991, 285 pp. (in Swedish)
Eurocode 2, “Design of concrete structures Part 1: General rules and rules for buildings,”European Committee for Standardisation, 1991, 253 pp.
Grassl, P., “Splicing of Reinforcement Loops in Beams: Experiments and Non-linear FiniteElement Analyses,” Division of Concrete Structures, Chalmers University of Technology,Master Thesis 99:4, Göteborg, Sweden, 1999.
Jackson, N., “Design of reinforced concrete opening corners,” The Structural Engineer,Vol. 73, No. 13, July 1995, pp. 209-213.

I-22
Johansson, J. P. M., and Karlsson, S., “Nytt armeringsutförande i betongramhörn utsattaför positivt moment (New Reinforcement Detailing in Concrete Frame Corners Subjected toPositive Moment),” Division of Concrete Structures, Chalmers University of Technology,Master Thesis 97:5, Göteborg, Sweden, 1997. (in Swedish)
Johansson, M., “New Reinforcement Detailing in Concrete Frame Corners of CivilDefence Shelters: Non-linear Finite Element Analyses and Experiments,” Division ofConcrete Structures, Chalmers University of Technology, Licentiate Thesis 96:1, Göteborg,Sweden, 1996.
Johansson M., “Non-linear Finite Element Analyses of Concrete Frame Corners,” ASCEJournal on Structural Engineering in Feb. V. 126, No. 2, Feb. 2000a, pp. 190-199.
Johansson M., “Structural Behaviour in Concrete Frame Corners of Civil Defence Shelters:Non-linear Finite Element Analyses and Experiments”, Division of Concrete Structures,Chalmers University of Technology, Ph.D. Thesis, Göteborg, Sweden. To be published inMar. 2000b.
Kordina, K., and Fuchs, G., “Untersuchungen zur Anwendung von hakenförmigenÜbergreifungsstößen in Rahmenecken (Examination of the use of Reinforcement Loops inFrame Corners,” Institut für Baustoffkunde und Stahlbetonbau, Der Technischen UniversitätBraunschweig, Braunschweig, Germany, 1970. (in German)
Lundgren, K., “Static Tests of Frame Corners Subjected to Closing Moments,” Division ofConcrete Structures, Chalmers University of Technology, Report 99:2, Göteborg, Sweden,1999.
Luo, Y. H.; Durrani, A. J.; Bai, S.; and Yuan, J., “Study of Reinforcing Detail of TensionBars in Frame Corner Connections,” ACI Structural Journal, V. 91, No. 4, July-Aug. 1994,pp. 486-496.
Mayfield, B.; Kong, F. K.; Bennison, A.; and Davies, J. C. D. T., “Corner Joint Details inStructural Lightweight Concrete,” ACI Journal, V. 68, No. 5, May 1971, pp. 366-372.
Mayfield, B.; Kong, F. K.; and Bennison, A., “Strength and Stiffness of LightweightConcrete Corners,” ACI Journal, V. 69, No. 7, July 1972, pp. 420-427.
Nilsson, I. H. E., “Reinforced concrete corners and joints subjected to bending moment.”National Swedish Institute for Building Research, Document D7:1973, Stockholm, Sweden,1973.
Nilsson, I. H. E., and Losberg, A., “Reinforced Concrete Corners and Joints Subjected toBending Moment,” ASCE Journal of the Structural Division, V. 102, No. 6, June 1976, pp.1229-1254.
Noor, F.A., “Ultimate Strength and Cracking of Wall Corners,” Concrete, Cement andConcrete Association, London, July 1977, pp. 31-35.

I-23
Plos, M., “Splicing of Reinforcement in Frame Corners -Experimental Studies,” NordicConcrete Research, Publ. No. 14, The Nordic Concrete Federation, Norsk Betongforening,Oslo, Norway, 1994, pp. 103-121.
Skettrup, E.; Strabo, J; Andersen, N. H.; and Brondum-Nielsen T., “Concrete FrameCorners,” ACI Journal, V. 81, No. 6, Nov-Dec. 1984, pp. 587-593.
Stroband, J., and Kolpa, J. J., “The behaviour of reinforced concrete column-to-beamjoints, Part 1: Corners Subjected to Negative Moments,” Stevin Laboratory, Delft Universityof Technology, Report 5-83-9, Delft, The Netherlands, 1983, 105 pp.
Stroband, J.; and Kolpa, J. J., “The Behaviour of Reinforced Concrete Column-to-Beamjoints, Part 2: Corners Subjected to Positive Moments,” Stevin Laboratory, Delft University ofTechnology, Report 5-81-5, Delft, The Netherlands, 1981, 103 pp.
Swann, R. A., “Flexural Strength of Corners of Reinforced Concrete Portal Frames,”Technical Report TRA 434, Cement and Concrete Association, London, 1969.
Shelter Regulations, “Shelter Regulations, SR English edition,” Swedish Rescue ServicesAgency, Publication B54-168/94, Karlstad, Sweden, 1994, 94 pp.
Shelter Regulations, “Skyddsrumsregler SR – Produktion och vidmakthållande (ShelterRegulations – Production and Maintenance),” Swedish Rescue Services Agency, PublicationB54-141/98, Karlstad, Sweden, 1998, 167 pp. (in Swedish)
Östlund, L., “Inverkan av bockningsradier och täckande betongskikt hos kamstål påspjälkningsrisken för armerade betongkonstruktioner (The Influence of Bending Radius andConcrete Cover for Deformed Bars on the Risk of Splitting Failure in Reinforced ConcreteStructures),” The Royal Institute of Technology, Stockholm, Sweden, 1963. (in Swedish)
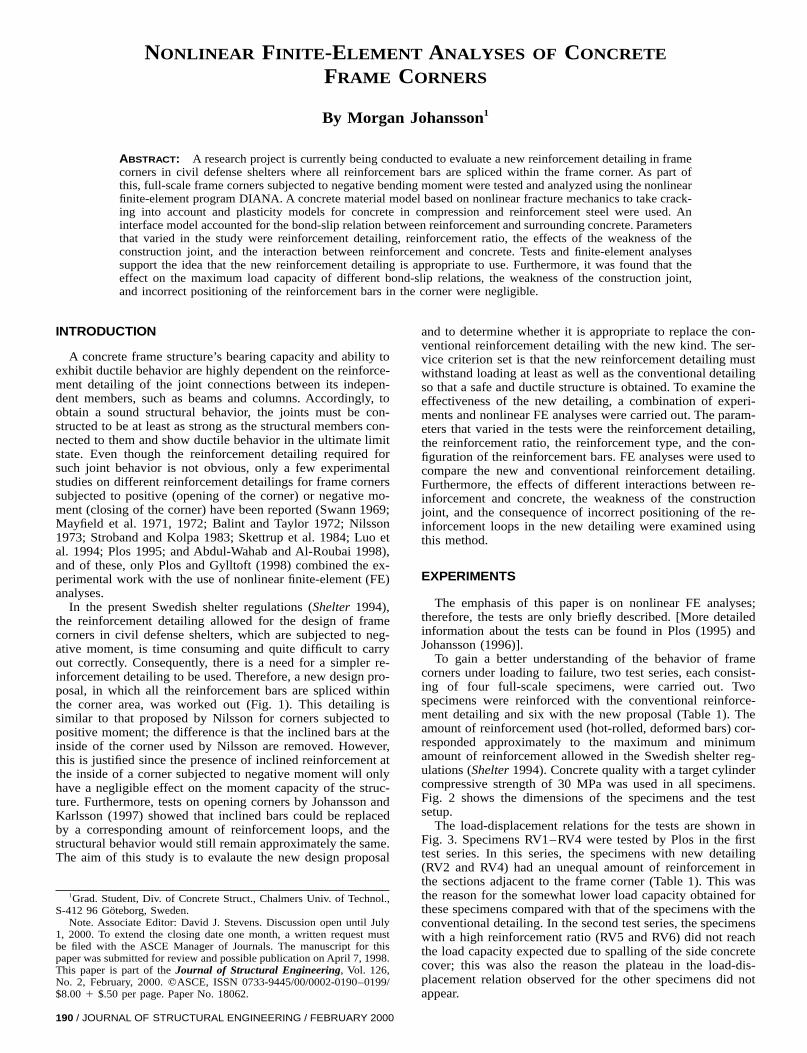
NONLINEAR FINITE-ELEMENT ANALYSES OF CONCRETE
FRAME CORNERS
By Morgan Johansson1
ABSTRACT: A research project is currently being conducted to evaluate a new reinforcement detailing in framecorners in civil defense shelters where all reinforcement bars are spliced within the frame corner. As part ofthis, full-scale frame corners subjected to negative bending moment were tested and analyzed using the nonlinearfinite-element program DIANA. A concrete material model based on nonlinear fracture mechanics to take crack-ing into account and plasticity models for concrete in compression and reinforcement steel were used. Aninterface model accounted for the bond-slip relation between reinforcement and surrounding concrete. Parametersthat varied in the study were reinforcement detailing, reinforcement ratio, the effects of the weakness of theconstruction joint, and the interaction between reinforcement and concrete. Tests and finite-element analysessupport the idea that the new reinforcement detailing is appropriate to use. Furthermore, it was found that theeffect on the maximum load capacity of different bond-slip relations, the weakness of the construction joint,and incorrect positioning of the reinforcement bars in the corner were negligible.
INTRODUCTION
A concrete frame structure’s bearing capacity and ability toexhibit ductile behavior are highly dependent on the reinforce-ment detailing of the joint connections between its indepen-dent members, such as beams and columns. Accordingly, toobtain a sound structural behavior, the joints must be con-structed to be at least as strong as the structural members con-nected to them and show ductile behavior in the ultimate limitstate. Even though the reinforcement detailing required forsuch joint behavior is not obvious, only a few experimentalstudies on different reinforcement detailings for frame cornerssubjected to positive (opening of the corner) or negative mo-ment (closing of the corner) have been reported (Swann 1969;Mayfield et al. 1971, 1972; Balint and Taylor 1972; Nilsson1973; Stroband and Kolpa 1983; Skettrup et al. 1984; Luo etal. 1994; Plos 1995; and Abdul-Wahab and Al-Roubai 1998),and of these, only Plos and Gylltoft (1998) combined the ex-perimental work with the use of nonlinear finite-element (FE)analyses.
In the present Swedish shelter regulations (Shelter 1994),the reinforcement detailing allowed for the design of framecorners in civil defense shelters, which are subjected to neg-ative moment, is time consuming and quite difficult to carryout correctly. Consequently, there is a need for a simpler re-inforcement detailing to be used. Therefore, a new design pro-posal, in which all the reinforcement bars are spliced withinthe corner area, was worked out (Fig. 1). This detailing issimilar to that proposed by Nilsson for corners subjected topositive moment; the difference is that the inclined bars at theinside of the corner used by Nilsson are removed. However,this is justified since the presence of inclined reinforcement atthe inside of a corner subjected to negative moment will onlyhave a negligible effect on the moment capacity of the struc-ture. Furthermore, tests on opening corners by Johansson andKarlsson (1997) showed that inclined bars could be replacedby a corresponding amount of reinforcement loops, and thestructural behavior would still remain approximately the same.The aim of this study is to evalaute the new design proposal
1Grad. Student, Div. of Concrete Struct., Chalmers Univ. of Technol.,S-412 96 Goteborg, Sweden.
Note. Associate Editor: David J. Stevens. Discussion open until July1, 2000. To extend the closing date one month, a written request mustbe filed with the ASCE Manager of Journals. The manuscript for thispaper was submitted for review and possible publication on April 7, 1998.This paper is part of the Journal of Structural Engineering, Vol. 126,No. 2, February, 2000. qASCE, ISSN 0733-9445/00/0002-0190–0199/$8.00 1 $.50 per page. Paper No. 18062.
190 / JOURNAL OF STRUCTURAL ENGINEERING / FEBRUARY 2000
and to determine whether it is appropriate to replace the con-ventional reinforcement detailing with the new kind. The ser-vice criterion set is that the new reinforcement detailing mustwithstand loading at least as well as the conventional detailingso that a safe and ductile structure is obtained. To examine theeffectiveness of the new detailing, a combination of experi-ments and nonlinear FE analyses were carried out. The param-eters that varied in the tests were the reinforcement detailing,the reinforcement ratio, the reinforcement type, and the con-figuration of the reinforcement bars. FE analyses were used tocompare the new and conventional reinforcement detailing.Furthermore, the effects of different interactions between re-inforcement and concrete, the weakness of the constructionjoint, and the consequence of incorrect positioning of the re-inforcement loops in the new detailing were examined usingthis method.
EXPERIMENTS
The emphasis of this paper is on nonlinear FE analyses;therefore, the tests are only briefly described. [More detailedinformation about the tests can be found in Plos (1995) andJohansson (1996)].
To gain a better understanding of the behavior of framecorners under loading to failure, two test series, each consist-ing of four full-scale specimens, were carried out. Twospecimens were reinforced with the conventional reinforce-ment detailing and six with the new proposal (Table 1). Theamount of reinforcement used (hot-rolled, deformed bars) cor-responded approximately to the maximum and minimumamount of reinforcement allowed in the Swedish shelter reg-ulations (Shelter 1994). Concrete quality with a target cylindercompressive strength of 30 MPa was used in all specimens.Fig. 2 shows the dimensions of the specimens and the testsetup.
The load-displacement relations for the tests are shown inFig. 3. Specimens RV1–RV4 were tested by Plos in the firsttest series. In this series, the specimens with new detailing(RV2 and RV4) had an unequal amount of reinforcement inthe sections adjacent to the frame corner (Table 1). This wasthe reason for the somewhat lower load capacity obtained forthese specimens compared with that of the specimens with theconventional detailing. In the second test series, the specimenswith a high reinforcement ratio (RV5 and RV6) did not reachthe load capacity expected due to spalling of the side concretecover; this was also the reason the plateau in the load-dis-placement relation observed for the other specimens did notappear.
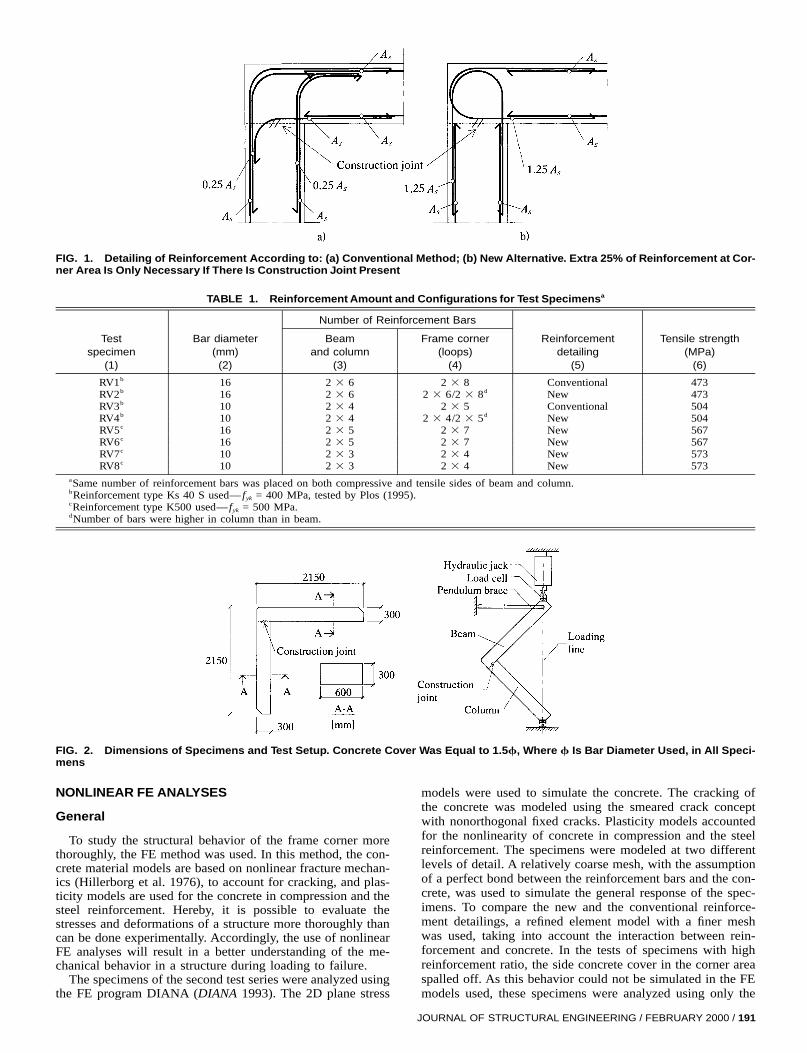
FIG. 1. Detailing of Reinforcement According to: (a) Conventional Method; (b) New Alternative. Extra 25% of Reinforcement at Cor-ner Area Is Only Necessary If There Is Construction Joint Present
TABLE 1. Reinforcement Amount and Configurations for Test Specimensa
Testspecimen
(1)
Bar diameter(mm)(2)
Number of Reinforcement Bars
Beamand column
(3)
Frame corner(loops)
(4)
Reinforcementdetailing
(5)
Tensile strength(MPa)
(6)
RV1b 16 2 3 6 2 3 8 Conventional 473RV2b 16 2 3 6 2 3 6/2 3 8d New 473RV3b 10 2 3 4 2 3 5 Conventional 504RV4b 10 2 3 4 2 3 4/2 3 5d New 504RV5c 16 2 3 5 2 3 7 New 567RV6c 16 2 3 5 2 3 7 New 567RV7c 10 2 3 3 2 3 4 New 573RV8c 10 2 3 3 2 3 4 New 573
aSame number of reinforcement bars was placed on both compressive and tensile sides of beam and column.bReinforcement type Ks 40 S used— fyk = 400 MPa, tested by Plos (1995).cReinforcement type K500 used— fyk = 500 MPa.dNumber of bars were higher in column than in beam.
FIG. 2. Dimensions of Specimens and Test Setup. Concrete Cover Was Equal to 1.5f, Where f Is Bar Diameter Used, in All Speci-mens
NONLINEAR FE ANALYSES
General
To study the structural behavior of the frame corner morethoroughly, the FE method was used. In this method, the con-crete material models are based on nonlinear fracture mechan-ics (Hillerborg et al. 1976), to account for cracking, and plas-ticity models are used for the concrete in compression and thesteel reinforcement. Hereby, it is possible to evaluate thestresses and deformations of a structure more thoroughly thancan be done experimentally. Accordingly, the use of nonlinearFE analyses will result in a better understanding of the me-chanical behavior in a structure during loading to failure.
The specimens of the second test series were analyzed usingthe FE program DIANA (DIANA 1993). The 2D plane stress
models were used to simulate the concrete. The cracking ofthe concrete was modeled using the smeared crack conceptwith nonorthogonal fixed cracks. Plasticity models accountedfor the nonlinearity of concrete in compression and the steelreinforcement. The specimens were modeled at two differentlevels of detail. A relatively coarse mesh, with the assumptionof a perfect bond between the reinforcement bars and the con-crete, was used to simulate the general response of the spec-imens. To compare the new and the conventional reinforce-ment detailings, a refined element model with a finer meshwas used, taking into account the interaction between rein-forcement and concrete. In the tests of specimens with highreinforcement ratio, the side concrete cover in the corner areaspalled off. As this behavior could not be simulated in the FEmodels used, these specimens were analyzed using only the
JOURNAL OF STRUCTURAL ENGINEERING / FEBRUARY 2000 / 191

FIG. 3. Load-Displacement Relations for Test Specimens. Specimens RV1–RV4 Were Tested by Plos (1995)
less detailed model. In this paper only the more detailed anal-yses of specimens with low reinforcement ratio are presented.[A more thorough description of the analyses can be found inJohansson (1996).]
Modeling of Concrete
In the analyses used here, cracking is taken into consider-ation by using a constant stress cutoff criterion. This meansthat once the maximum principal tensile stress reaches the ten-sile strength, independent of the other principal stresses, acrack is initiated perpendicular to the principal stress. The ori-entation of the crack is then stored and the material responseperpendicular to the crack is determined by a stress-strain re-lation for the cracked material volume. Additional cracks mayappear at the same location, but their formation is restrictedto a minimum angle (here, set at 607) to previous cracks.
To simulate the softening curve of the concrete, a bilinearstress-crack opening relation according to recommendationsgiven in Gylltoft (1983) was used. The fracture energy GF andthe tensile strength ft were used to calculate the value of theultimate crack opening wu. A three-point bending test accord-ing to the recommendations of RILEM 50-FMC (1985) deter-mined the fracture energy of the concrete. The tensile strengthft used in the analyses was determined from the compressivestrength fc according to CEB-FIP Model Code (CEB-FIP1993)
2/3f = 0.30( f ) (1)t c
In the refined model the analyses took into account the in-teraction between the reinforcement and the concrete in theregion close to the corner where cracking of the concrete wasexpected. Hereby, the crack distribution was given by the anal-ysis, and since the smeared cracking of each element repre-sents the development of one real crack, the stress-strain re-lation of the cracked concrete depends on the length of theFE. Therefore, in this region, the crack width was divided bythe element lengths to determine the softening stress-strain re-lation used in the analyses. This length lelement was approxi-mated as the length perpendicular to an assumed crack direc-tion as shown in Fig. 4. Outside the corner area, this directionwas set to be perpendicular to the direction of the beam andcolumn, respectively. Within the corner the cracks were as-sumed to be ‘‘pointing’’ at the inside of the corner.
In the regions where perfect bonding between the reinforce-
192 / JOURNAL OF STRUCTURAL ENGINEERING / FEBRUARY 2000
FIG. 4. Definition of Element Length lelement
ment and concrete was assumed, the stress-strain relation forthe concrete was determined by dividing the ultimate crackopening by the mean crack distance sm (0.2 m) observed inthe tests. However, as an approximation to consider the higherstiffness in the structure due to the effects of tension stiffening(Plos 1995), the gradient of the descending part of the stress-strain curve was halved for the concrete where perfect bondwas assumed.
In compression, the response of the concrete was taken intoaccount by an elastic-plastic model. The elastic stress-state waslimited by a Drucker-Prager yield surface. Once yielding hadoccurred, an associated flow rule with isotropic hardening wasused. In DIANA, this yield surface is evaluated from the cur-rent stress state, the angle of internal friction f, and the co-hesion c. In accordance with recommendations given in theDIANA manual, the angle of internal friction in concrete wasapproximated to be f = 307. The cohesion c used in the anal-yses was calculated as
1 2 sin fpc = f (ε ) (2)c uniaxial 2 cos f
where was the compressive strength as a function ofpf (ε )c uniaxial
the plastic strain in the direction of the uniaxial stress. Thestress-strain relations up to the peak stress were determined onstandard uniaxial tests on cylinders in which concrete from thesame batch as the test specimens was used. In these tests thestress-strain relation could only be registered up to the maxi-mum strength. Therefore, the postpeak behavior of the con-crete was evaluated using the cylinder compression strengthaccording to recommendations in CEB-FIP Model Code. Pois-son’s ratio was approximated to be 0.20.
In Fig. 5, the stiffness used in the analyses for unloaded

FIG. 5. Stiffness Used in Analyses for Unloaded Concrete in Compression and Tension (lelement 5 sm /2 When Perfect Bond Is As-sumed)
TABLE 2. Material Properties for Concrete Used in Analyses
Object(1)
Ec
(GPa)(2)
fc
(MPa)(3)
ft
(MPa)(4)
Gf
(N/m)(5)
Column 24.6 27.8 2.7 108Beam 23.5 33.8 3.1 66
concrete in tension and compression is shown. When thecracked concrete is unloaded, the secant unloading modulus isused as tangent stiffness so that the strain across the crack isreduced linearly to zero as the stress approaches zero. Whenconcrete in compression is unloaded, the initial elastic stiffnessis used. The material properties of the concrete used in theanalyses are shown in Table 2.
Modeling of Reinforcement
The von Mises yield criterion with associated flow and iso-tropic strain hardening was used to describe the constitutivebehavior of the reinforcement bars. These were modeled witheither the DIANA option ‘‘embedded reinforcements’’ or, ac-cording to recommendations given in the DIANA-manual,separate steel elements using truss elements. In the embeddedreinforcement option, the reinforcement does not have separatedegrees of freedom; instead, the strength and stiffness of theconcrete elements are increased in the direction of the embed-ded reinforcement. With this model, perfect bonding is as-sumed between the reinforcement and the surrounding mate-rial. When the interaction between the reinforcement and theconcrete was taken into consideration, the reinforcement bars
were modeled by separate elements, using truss elements incombination with interface elements. The mechanical proper-ties of the reinforcement were Young’s modulus Es = 191 GPa;yield strength fsy = 573 MPa; ultimate strength fsu = 675 MPa,strain at hardening εsh = 2.8%; and strain at maximum stressεsu = 12.0%.
In DIANA, the bond-slip relation between the reinforcementand the concrete is modeled using interface elements. In theseelements, the bond stresses only depend on the longitudinalslip; the stresses normal to the bar are described with a stifflinear relation to the deformations in this direction. Conse-quently, splitting failures cannot be modeled. Instead, the ef-fect of splitting has to be included in the nonlinear bond-sliprelation. The bond-slip relation between the reinforcement andthe concrete was approximated according to the CEB-FIPModel Code (CEB-FIP 1993). Here, the effect of splittingcracks is taken into account by giving different bond-slip re-lations for confined and unconfined concrete. Furthermore, thecode differs between two different bond qualities: ‘‘good’’ and‘‘other.’’ Because no splitting cracks were observed in the testspecimens with low reinforcement ratio, ‘‘confined concrete’’was assumed in the analyses. However, according to Engstrom(1992), the bond stress decreases considerably when the re-inforcement steel yields. In the bond-slip relation proposed byEngstrom, the bond stress is not given explicitly but dependson when the steel reinforcement yields. The principal bond-slip relation for this yield case is similar to the relation givenwhen ‘‘unconfined concrete’’ is assumed; therefore, as an ap-proximation, ‘‘unconfined concrete’’ was assumed for the re-inforcement bars positioned close to the corner where yieldingof the reinforcing steel was likely to occur. To study the effect
FIG. 6. Bond-Slip Relations Used in Analyses for Interaction in Column
JOURNAL OF STRUCTURAL ENGINEERING / FEBRUARY 2000 / 193

of the structural behavior of various bond-slip relations, bothgood and other bond conditions were used in the analyses. Toillustrate the essential difference of the bond qualities andbond conditions mentioned above, the bond-slip relations usedwithin the column are shown in Fig. 6.
FE Models
In the FE analyses, 2D plane-stress first-order elements wereused to model the concrete. A Gauss integration scheme with2 3 2 integration points were used. To enhance the bendingbehavior of the elements, selective reduced integration(Hughes 1987) was used when evaluating the shear. Hereby,the shear strains are evaluated in the element midpoint only,and the shear locking, usually encountered when using fullyintegrated elements of the first order, can be avoided. To com-pare the effect of the new and the conventional reinforcementdetailing, two different models, with a total of 322 and 336elements, respectively, were used (Fig. 7). Two-node truss el-ements in combination with four-node interface elements, atotal of 137 and 203 each, for the new and conventional de-tailing, respectively, were used to model more accurately thereinforcement bars within 1.0 m of the corner. Outside thisarea, the reinforcement bars were modeled with embedded re-inforcement. The material parameters for concrete and rein-forcing steel were identical in both models.
194 / JOURNAL OF STRUCTURAL ENGINEERING / FEBRUARY 2000
Furthermore, the effect of the weakness in the constructionjoint on the structural behavior of the frame corner was ex-amined. The test specimens were cast with a construction joint(Fig. 2). The test results indicated that this joint exhibited azone of weakness in the material in which cracking first oc-curred. This was modeled by reducing the tensile strength andthe fracture energy of the concrete modeling the constructionjoint. Thus, the first crack was made to form at the same placeas in the tests, and because this crack was observed at a loadlevel approximately half of that expected, the tensile strengthand fracture energy of the concrete modeling the constructionjoint were reduced to 50%. Furthermore, to study the effectof the weakness in the construction joint, an FE analysis withtensile strength and fracture energy reduced to 90%, comparedwith that used in the rest of the model, was also carried outfor both reinforcement detailings. By using this slight weak-ness, the first crack was still made to form at the same placeas in the tests.
Unless otherwise stated, good bond condition and a con-struction joint strength of 50%, compared with that in the restof the model, were used in the FE analyses.
Numerical Procedure
A displacement-controlled incremental loading was appliedin the FE analyses to model the load of the structure. Two
FIG. 8. Crack Patterns Obtained for Test Specimens: (a) RV7; (b) RV8
FIG. 7. FE Mesh and Modeling of Reinforcement Bars of Frame Corner with: (a) New Reinforcement Detailing; (b) Conventional De-tailing

different iteration methods, the modified Newton-Raphsonmethod and the BFGS (Broyden-Fletcher-Goldfarb-Shanno)secant stiffness method [e.g., Bathe (1996)], were tested. Itwas found in the more detailed analyses that the formermethod gave a somewhat smoother load-displacement relationthan that achieved with the latter. However, the difference inthe results obtained when using these methods was negligible,and because fewer numerical problems were encountered with
the BFGS method, this was the iteration method mainly used.To check the quality of the solution within each increment, atolerance given as a percentage (usually 0.01%) of the energynorm was used as the convergence criterion.
Results
In the first stage of the analyses, the bond condition corre-sponding to that of the test specimens was to be determined.
FIG. 11. Distribution of Tensile Stresses in Reinforcement Bars in Frame Corner for Tests and FE Analyses (New Reinforcement De-tailing)
FIG. 10. Load-Displacement Relations for Tests and FE Analyses with New Reinforcement Detailing. Values between Brackets ShowStrength of Concrete Modeling Construction Joint
FIG. 9. Crack Pattern at End of Analyses for Frame Corner with New Reinforcement Detailing When Assuming Two BondConditions:(a) Good; (b) Other
JOURNAL OF STRUCTURAL ENGINEERING / FEBRUARY 2000 / 195

Two criteria can be used for this determination: (1) The meanspacing of the major cracks observed in the test specimens;and (2) the load-displacement relation obtained in the tests.The former criterion was assumed to be the better one to usebecause some factors of uncertainty, such as the fracture en-ergy and the generally stiffer behavior of the FE analysis, haveless effect on it. The crack pattern and load-displacement re-lations of the analyses were compared with those obtained inthe tests (Figs. 8 to 10). The FE analysis assuming good bondcondition showed the best agreement with the mean crackspacing of 0.2 m observed in the tests. Therefore, a bond-sliprelation corresponding to this one was assumed to be the clos-est to that of the test specimens even though the load-displace-ment relation was somewhat stiff in comparison with the tests.
The distribution of the tensile stresses along the reinforce-ment loops, when yielding of the steel reinforcement has justoccurred is presented in Fig. 11. The difference in the distrib-uted tensile stresses observed for the different bond-slip rela-
196 / JOURNAL OF STRUCTURAL ENGINEERING / FEBRUARY 2000
tions was due to the different appearance of major cracks inthe column and the beam near the corner area.
In Fig. 12, the load-displacement relation of the FE analysesfor the frame corner with the new reinforcement detailing iscompared with that of the frame corner with the conventionalreinforcement detailing. The crack propagation and the distri-bution of tensile stresses along the reinforcement bars at thecorner are shown in Figs. 13 and 14 for the frame corner withconventional detailing at displacements between 26 and 32mm.
Discussion of Results
The results of the FE analyses corresponded quite well withthe results from the experiments; the behavior was similar forboth the maximum load capacity obtained and the stiffness ofthe structure. Furthermore, the crack pattern and positioningof the plastic hinges in the detailed analyses corresponded very
FIG. 13. Crack Propagation in Corner Area for Conventional Reinforcement Detailing at Load Levels Marked in Fig. 12
FIG. 12. Comparison of Load-Displacement Relations for Frame Corners Carried Out with New and Conventional ReinforcementDe-tailing. Crack Propagation in Corner at Marked Points, (a) to (d), Is Shown in Fig. 13.
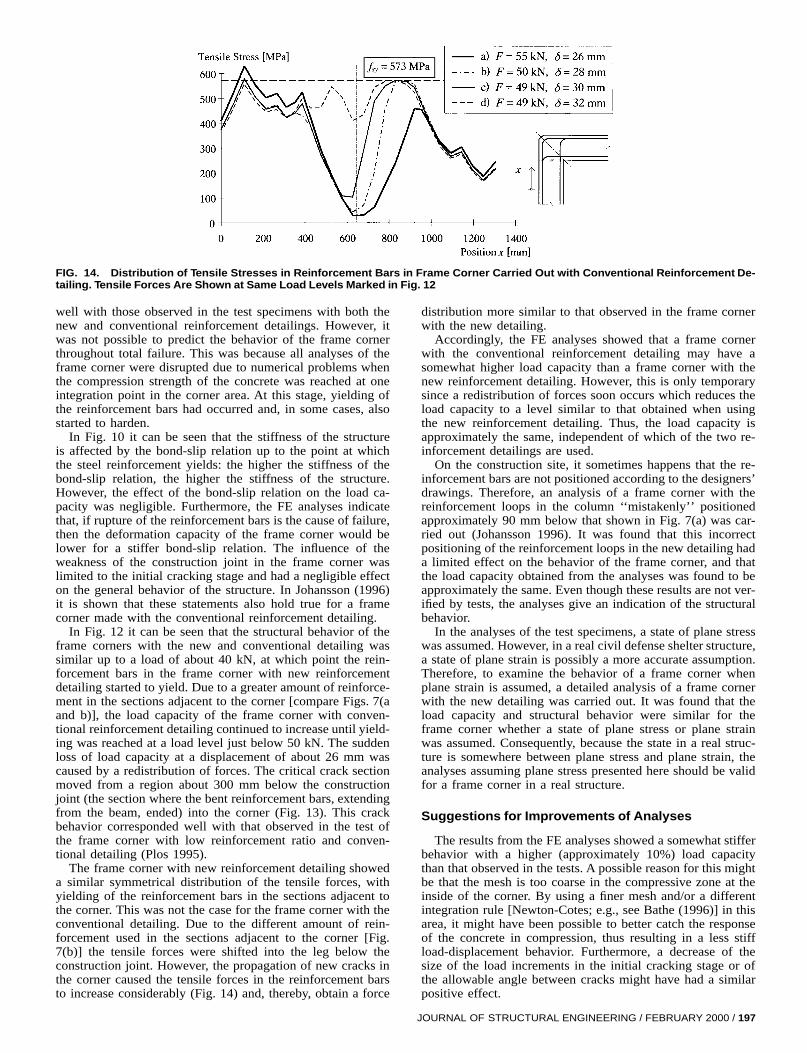
FIG. 14. Distribution of Tensile Stresses in Reinforcement Bars in Frame Corner Carried Out with Conventional Reinforcement De-tailing. Tensile Forces Are Shown at Same Load Levels Marked in Fig. 12
well with those observed in the test specimens with both thenew and conventional reinforcement detailings. However, itwas not possible to predict the behavior of the frame cornerthroughout total failure. This was because all analyses of theframe corner were disrupted due to numerical problems whenthe compression strength of the concrete was reached at oneintegration point in the corner area. At this stage, yielding ofthe reinforcement bars had occurred and, in some cases, alsostarted to harden.
In Fig. 10 it can be seen that the stiffness of the structureis affected by the bond-slip relation up to the point at whichthe steel reinforcement yields: the higher the stiffness of thebond-slip relation, the higher the stiffness of the structure.However, the effect of the bond-slip relation on the load ca-pacity was negligible. Furthermore, the FE analyses indicatethat, if rupture of the reinforcement bars is the cause of failure,then the deformation capacity of the frame corner would belower for a stiffer bond-slip relation. The influence of theweakness of the construction joint in the frame corner waslimited to the initial cracking stage and had a negligible effecton the general behavior of the structure. In Johansson (1996)it is shown that these statements also hold true for a framecorner made with the conventional reinforcement detailing.
In Fig. 12 it can be seen that the structural behavior of theframe corners with the new and conventional detailing wassimilar up to a load of about 40 kN, at which point the rein-forcement bars in the frame corner with new reinforcementdetailing started to yield. Due to a greater amount of reinforce-ment in the sections adjacent to the corner [compare Figs. 7(aand b)], the load capacity of the frame corner with conven-tional reinforcement detailing continued to increase until yield-ing was reached at a load level just below 50 kN. The suddenloss of load capacity at a displacement of about 26 mm wascaused by a redistribution of forces. The critical crack sectionmoved from a region about 300 mm below the constructionjoint (the section where the bent reinforcement bars, extendingfrom the beam, ended) into the corner (Fig. 13). This crackbehavior corresponded well with that observed in the test ofthe frame corner with low reinforcement ratio and conven-tional detailing (Plos 1995).
The frame corner with new reinforcement detailing showeda similar symmetrical distribution of the tensile forces, withyielding of the reinforcement bars in the sections adjacent tothe corner. This was not the case for the frame corner with theconventional detailing. Due to the different amount of rein-forcement used in the sections adjacent to the corner [Fig.7(b)] the tensile forces were shifted into the leg below theconstruction joint. However, the propagation of new cracks inthe corner caused the tensile forces in the reinforcement barsto increase considerably (Fig. 14) and, thereby, obtain a force
distribution more similar to that observed in the frame cornerwith the new detailing.
Accordingly, the FE analyses showed that a frame cornerwith the conventional reinforcement detailing may have asomewhat higher load capacity than a frame corner with thenew reinforcement detailing. However, this is only temporarysince a redistribution of forces soon occurs which reduces theload capacity to a level similar to that obtained when usingthe new reinforcement detailing. Thus, the load capacity isapproximately the same, independent of which of the two re-inforcement detailings are used.
On the construction site, it sometimes happens that the re-inforcement bars are not positioned according to the designers’drawings. Therefore, an analysis of a frame corner with thereinforcement loops in the column ‘‘mistakenly’’ positionedapproximately 90 mm below that shown in Fig. 7(a) was car-ried out (Johansson 1996). It was found that this incorrectpositioning of the reinforcement loops in the new detailing hada limited effect on the behavior of the frame corner, and thatthe load capacity obtained from the analyses was found to beapproximately the same. Even though these results are not ver-ified by tests, the analyses give an indication of the structuralbehavior.
In the analyses of the test specimens, a state of plane stresswas assumed. However, in a real civil defense shelter structure,a state of plane strain is possibly a more accurate assumption.Therefore, to examine the behavior of a frame corner whenplane strain is assumed, a detailed analysis of a frame cornerwith the new detailing was carried out. It was found that theload capacity and structural behavior were similar for theframe corner whether a state of plane stress or plane strainwas assumed. Consequently, because the state in a real struc-ture is somewhere between plane stress and plane strain, theanalyses assuming plane stress presented here should be validfor a frame corner in a real structure.
Suggestions for Improvements of Analyses
The results from the FE analyses showed a somewhat stifferbehavior with a higher (approximately 10%) load capacitythan that observed in the tests. A possible reason for this mightbe that the mesh is too coarse in the compressive zone at theinside of the corner. By using a finer mesh and/or a differentintegration rule [Newton-Cotes; e.g., see Bathe (1996)] in thisarea, it might have been possible to better catch the responseof the concrete in compression, thus resulting in a less stiffload-displacement behavior. Furthermore, a decrease of thesize of the load increments in the initial cracking stage or ofthe allowable angle between cracks might have had a similarpositive effect.
JOURNAL OF STRUCTURAL ENGINEERING / FEBRUARY 2000 / 197

FIG. 15. Comparison of Load-Displacement When Stress-Strain Relations in Compression Are Modified to Take into Account Lengthof Elements. Different Values of Fracture Energy (Full and Halved) Were Used
The major problem encountered in the analyses was thecrushing of the concrete in one integration point. This causedthe analyses to stop at a displacement far lower than that ob-served in the tests. A probable explanation for this is the brit-tleness in the postpeak behavior of the concrete in compres-sion. The essential stress-strain relation used for the concretein compression is shown in Fig. 5. However, van Mier (1984)showed that the postpeak behavior of concrete is due to alocalization in the material. Consequently, the stress-strain re-lations used in the analyses for concrete in compressionshould, as is the case when dealing with cracking, also be afunction of the element length. This was not considered in theanalyses, which means that the postpeak stress-strain relationsused in compression are too brittle. The length of the standardcylinders, used to evaluate the recommendations given in theCEB-FIP Model Code, is 300 mm. This indicates that thestress-strain relation given in the CEB-FIP Model Code shouldbe valid when the elements used in an analysis are 300 mm.However, the length of the elements near the corner in theseanalyses is 50 mm. Therefore, an analysis where this was takeninto consideration was carried out. The postpeak stress-strainrelation in compression was modified by a factor of 300/50 =6 (i.e., after the peak the plastic strain was multiplied by 6).However, this modification presumed that, when the compres-sive strength is reached in one element, a localization willoccur and the adjacent elements unload elastically. This wasnot the case in the analysis, which meant that a stiffer behaviorwith an increasing load capacity (due to the hardening of thereinforcement) was obtained (Fig. 15). Thus the analysis wasstopped (even though it could have been driven further) at adisplacement of about 75 mm. Even though these secondstress-strain relations were too ductile, the results from theanalyses indicate that a similar modification of the postpeakbehavior is correct. In what way this modification should havebeen done instead has not been further studied within thescope of the work presented here.
In Fig. 15, the importance of the fracture energy is alsoshown (the stress-strain relations in compression are still mod-ified as described above). It was found that the behavior ofthe frame corner was approximately the same independent ofthe fracture energy used in the analyses. However, when usinga lower value (halved) on the fracture energy a better corre-spondence in the load-displacement relation was obtained, thusindicating that the tensile stress-strain relation used in the anal-yses was somewhat too ductile. This can be due to severalreasons such as different sizes and curing conditions of the
198 / JOURNAL OF STRUCTURAL ENGINEERING / FEBRUARY 2000
specimens used in the tests and those used to measure thefracture energy. It can also be due to the method used whendetermining the element length lelement as described in Fig. 4.
CONCLUSIONS
A new design proposal in concrete frame corners in civildefense shelters has been studied using full-scale tests in com-bination with nonlinear FE analyses. The parameters studiedwere the reinforcement detailing, the reinforcement ratio, theeffects of the weakness of the construction joint, and the in-teraction between reinforcement and concrete.
The tests and the FE analyses conducted have shown thatthe conventional and the new reinforcement detailings forpractical purposes are equivalent for a frame corner structurewith a low amount of reinforcement. Comparisons of tests andFE analyses indicate that this is also the case for a frame cor-ner with a high amount of reinforcement. Thus, the tests andanalyses support the idea that the new alternative is suitableto use instead of the conventional reinforcement detailing.
The FE analyses have shown that the stiffness of the struc-ture is affected by the bond-slip relation up to the point atwhich the steel reinforcement starts to yield: the higher thestiffness of the bond-slip relation, the higher the stiffness ofthe structure. When rupture of the reinforcement bars is thecause of final failure, a weak bond-slip relation has a positiveeffect on the deformation capacity of the structure. However,the maximum load capacity is relatively unaffected by thebond-slip relation.
The weakness of the construction joint affects the structuralbehavior of the frame corner only in the initial cracking stage;its effect on the maximum load capacity is negligible. The FEanalyses showed that an incorrect positioning of the reinforce-ment loops in one of the legs adjacent to the corner has alimited effect on the maximum load capacity.
Due to localization in the postpeak region, the elementlength should be considered when determining the concretestress-strain relations used in compression. However, theredoes not seem to be a direct connection between what modi-fication should be made and the length of the independentelement.
ACKNOWLEDGMENTS
The work presented was carried out at the Division of Concrete Struc-tures, Chalmers University of Technology, Goteborg, Sweden, and wasfinanced by the Swedish Rescue Services Agency, Karlstad, Sweden. The
writer would like to thank his supervisor Prof. Kent Gylltoft for his guid-ance and support. Special thanks are due to Bjorn Ekengren and MagnusKjellman from the Swedish Rescue Services Agency and Mario Plos fortheir enthusiastic encouragement and valuable help in the project.
APPENDIX I. REFERENCES
Abdul-Wahab, H. M. S., and Al-Roubai, A. A. M. (1998). ‘‘Strength andbehaviour of steel fibre reinforced concrete corners under openingbending moment.’’ Mag. of Concrete Res., 50(4), 305–318.
Balint, P. S., and Taylor, H. P. J. (1972). ‘‘Reinforcement detailing offrame corner joints with particular reference to opening corners.’’ Tech.Rep. 42.462, Cement and Concrete Association, London.
Bathe, K. J. (1996). Finite element procedures. Prentice-Hall, EnglewoodCliffs, N.J.
CEB-FIP model code 1990, design code. (1993). Thomas Telford, Lau-sanne, Switzerland.
DIANA, version 6.1 (1996). Dept. of Engrg. Mech. and Information Tech-nol., TNO Building and Construction Research, Delft, The Netherlands.
Engstrom, B. (1992). ‘‘Ductility of tie connections in precast structures,’’PhD thesis, Div. of Concrete Struct., Chalmers University of Technol-ogy, Goteborg, Sweden.
Gylltoft, K. (1983). ‘‘Fracture mechanics models for fatigue in concretestructures,’’ PhD thesis, Div. of Struct. Engrg., Lulea University ofTechnology, Lulea, Sweden.
Hillerborg, A., Modeer, M., and Petersson, P.-E. (1976). ‘‘Analysis ofcrack formation and crack growth in concrete by means of fracturemechanics and finite elements.’’ Cement and Concrete Res., 6(6), 773–782.
Hughes, T. J. R. (1987). The finite element method—Linear static anddynamic finite element analyses. Prentice-Hall, Englewood Cliffs, N.J.
Johansson, M. (1996). ‘‘New reinforcement detailing in concrete framecorners of civil defence shelters: Non-linear finite element analyses andexperiments,’’ Licentiate thesis, Div. of Concrete Struct., ChalmersUniversity of Technology, Goteborg, Sweden.
Johansson, M., and Karlsson, S. (1997). ‘‘New reinforcement detailing inconcrete frame corners subjected to positive moment.’’ Rep. 97:5, Div.of Concrete Struct., Chalmers University of Technology, Goteborg,Sweden (in Swedish).
Luo, Y. H., Durrani, A. J., Bai, S., and Yuan, J. (1994). ‘‘Study of rein-forcing detail of tension bars in frame corner connections.’’ ACI Struct.J., 91(4), 486–496.
Mayfield, B., Kong, F. K., and Bennison, A., and Davies, J. C. D. T.(1971). ‘‘Corner joint details in structural lightweight concrete.’’ ACIJ., 68(5), 366–372.
Mayfield, B., Kong, F. K., and Bennison, A. (1972). ‘‘Strength and stiff-ness of lightweight concrete corners.’’ ACI J., 69(7), 420–427.
Nilsson, I. H. E. (1973). ‘‘Reinforced concrete corners and joints sub-jected to bending moment.’’ Document D7:1973, National SwedishInstitute for Building Research, Stockholm, Sweden.
Plos, M. (1995). ‘‘Application of fracture mechanics to concrete bridges
—Finite element analyses and experiments,’’ PhD thesis, Div. of Con-crete Struct., Chalmers University of Technology, Goteborg, Sweden.
Plos, M., and Gylltoft, K. (1998). ‘‘Nonlinear FE analyses of RC bridgeframe corners, based on fracture mechanics.’’ J. Bridge Engrg., ASCE,3(4), 204–210.
RILEM 50-FMC Committee. (1985). ‘‘Determination of the fracture en-ergy of mortar and concrete by means of three-point bend tests onnotched beams.’’ Mat. and Struct., 18(106), 285–290.
Shelter regulations, SR. (1994). English Ed., Publ. B54-168/94, SwedishRescue Services Agency, Karlstad, Sweden.
Skettrup, E., Strabo, J., Andersen, N. H., and Brondum-Nielsen, T. (1984).‘‘Concrete frame corners.’’ ACI J., 81(6), 587–593.
Stroband, J., and Kolpa, J. J. (1983). ‘‘The behaviour of reinforced con-crete column-to-beam joints, Part 1, Corners subjected to negative mo-ments.’’ Rep. 5-83-9, Stevin Lab., Delft University of Technology,Delft, The Netherlands.
Swann, R. A. (1969). ‘‘Flexural strength of corners of reinforced concreteportal frames.’’ Tech. Rep. TRA 434, Cement and Concrete Association,London.
van Mier, J. G. M. (1984). ‘‘Strain softening of concrete under multiaxialloading conditions,’’ PhD thesis, Eindhoven University of Technology,Eindhoven, The Netherlands.
APPENDIX II. NOTATION
The following symbols are used in this paper:
c = cohesion;Ec = Young’s modulus for concrete;Es = Young’s modulus for steel;F = load;fc = compressive strength of concrete;
fsu = ultimate strength of reinforcement;fsy = yield strength of reinforcement;ft = tensile strength of concrete;
fyk = characteristic yield strength of reinforcement;GF = fracture energy;
lelement = length of FE as defined in Fig. 4;s = slip;
sm = mean crack spacing;wu = ultimate crack opening;
x = coordinate along reinforcement bars in corner region;d = displacement;εc = concrete strain;
εsh = strain at steel hardening;εsu = strain at maximum steel stress;εu = ultimate strain;
pε uniaxial = plastic strain in direction of uniaxial stress;sc = concrete stress;t = bond stress; andf = bar diameter, angle of internal friction.
JOURNAL OF STRUCTURAL ENGINEERING / FEBRUARY 2000 / 199
III-1
FE ANALYSES OF CONCRETE CIVIL DEFENCE SHELTERSSUBJECTED TO TRANSIENT LOADING
By Morgan Johansson
ABSTRACT: Civil defence shelters subjected to a blast load from a nearby explosion or theimpact due to falling masses from a collapsing building were studied using the non-linearfinite element programme ABAQUS/Explicit. It was found that the most critical stage in theshelter subjected to a blast load was during the first 10 ms. Further, it was observed that thedeformations obtained in the shelter subjected to falling masses largely depend on the time ittakes for the whole mass to hit the structure but, more importantly, also the mass of eachindependent part hitting the structure. Nevertheless, in none of the analyses did any criticalcracks form within the corners, so it seems reasonable to believe that the response within atransiently loaded corner will be similar to that obtained in a statically loaded structure. It wasconcluded that even though the structural behaviour can differ a lot when subjected totransient loads, locally there are still large similarities to that in static loading.
Keywords: Transient loading, blast load, impact load, civil defence shelter, non-linear finiteelement analysis, dynamic, reinforcement detailings in corner
INTRODUCTION
From a safety point of view is it important that a concrete structure, apart from necessaryload capacity, also is able to show ductile behaviour that allows redistribution of forces so thata total collapse of the structure can be avoided if local failure is obtained. The ability of aconcrete frame structure to meet these requirements depends much on the reinforcementdetailing of the joint connections between its independent members. In co-operation betweenthe Swedish Rescue Services Agency and the Division of Concrete Structures at ChalmersUniversity of Technology, such a reinforcement detailing, using reinforcement loops splicedwithin the corner, has previously been evaluated for frame corners in civil defence shelters;see Plos (1995), Johansson (1996, 2000a, 2000b) and Johansson and Karlsson (1997). Statictests and non-linear finite element analyses have shown that it is feasible to replace theconventional detailing with a new one. However, since a civil defence shelter is designed towithstand transient loading, such as blast waves from an explosion and falling debris fromcollapsing buildings, this has to be taken into consideration.
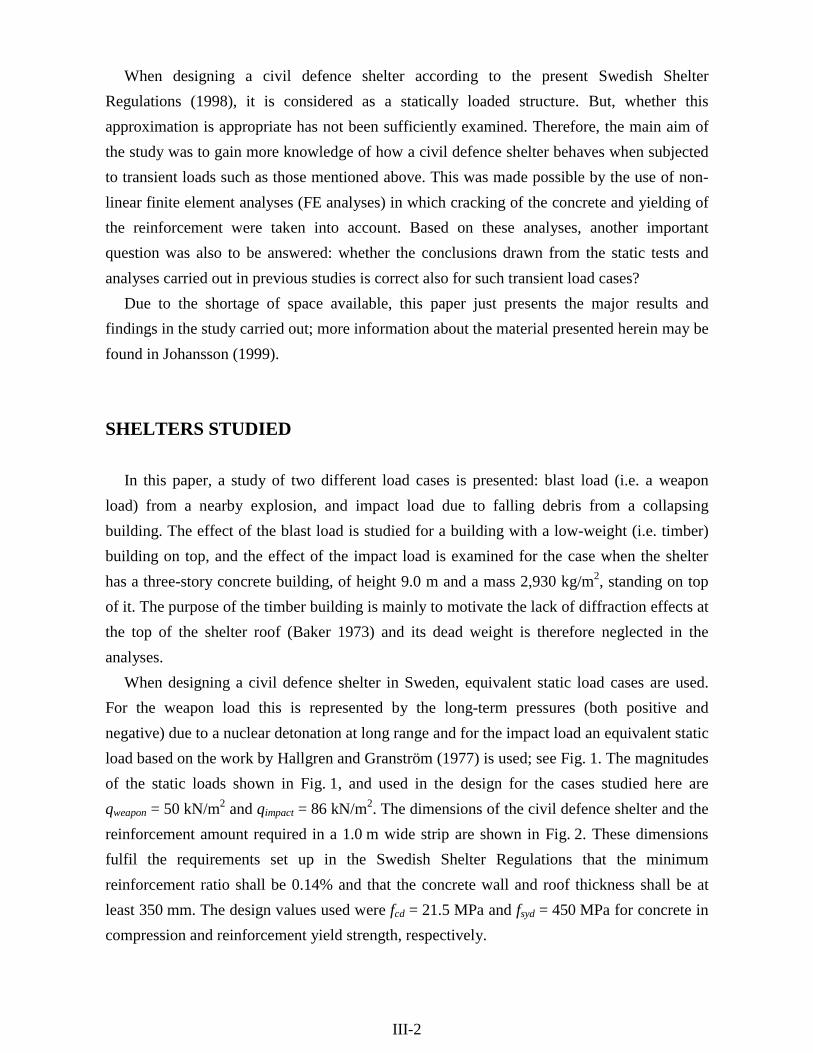
III-2
When designing a civil defence shelter according to the present Swedish ShelterRegulations (1998), it is considered as a statically loaded structure. But, whether thisapproximation is appropriate has not been sufficiently examined. Therefore, the main aim ofthe study was to gain more knowledge of how a civil defence shelter behaves when subjectedto transient loads such as those mentioned above. This was made possible by the use of non-linear finite element analyses (FE analyses) in which cracking of the concrete and yielding ofthe reinforcement were taken into account. Based on these analyses, another importantquestion was also to be answered: whether the conclusions drawn from the static tests andanalyses carried out in previous studies is correct also for such transient load cases?
Due to the shortage of space available, this paper just presents the major results andfindings in the study carried out; more information about the material presented herein may befound in Johansson (1999).
SHELTERS STUDIED
In this paper, a study of two different load cases is presented: blast load (i.e. a weaponload) from a nearby explosion, and impact load due to falling debris from a collapsingbuilding. The effect of the blast load is studied for a building with a low-weight (i.e. timber)building on top, and the effect of the impact load is examined for the case when the shelterhas a three-story concrete building, of height 9.0 m and a mass 2,930 kg/m2, standing on topof it. The purpose of the timber building is mainly to motivate the lack of diffraction effects atthe top of the shelter roof (Baker 1973) and its dead weight is therefore neglected in theanalyses.
When designing a civil defence shelter in Sweden, equivalent static load cases are used.For the weapon load this is represented by the long-term pressures (both positive andnegative) due to a nuclear detonation at long range and for the impact load an equivalent staticload based on the work by Hallgren and Granström (1977) is used; see Fig. 1. The magnitudesof the static loads shown in Fig. 1, and used in the design for the cases studied here areqweapon = 50 kN/m2 and qimpact = 86 kN/m2. The dimensions of the civil defence shelter and thereinforcement amount required in a 1.0 m wide strip are shown in Fig. 2. These dimensionsfulfil the requirements set up in the Swedish Shelter Regulations that the minimumreinforcement ratio shall be 0.14% and that the concrete wall and roof thickness shall be atleast 350 mm. The design values used were fcd = 21.5 MPa and fsyd = 450 MPa for concrete incompression and reinforcement yield strength, respectively.

III-3
These static loads, though, are just simplifications used to make it easier to design theshelter; the real loads acting on the shelter will be more similar to those shown in Fig. 3a. Thepressure, due to a nearby explosion, acting on the front shelter wall is highly transient and willpresent a very large peak pressure but a short duration. On the other hand, the impact loadwill be composed of falling debris hitting the shelter roof with a certain velocity.
qweapon
qweapon qweapon
qimpact
a)(a) (b)
Fig. 1 Equivalent static loads used in the design of a shelter: (a) weapon load; (b) impactload.
5.0 m, As = 400 mm2
5.0 m, As = 550 mm2
5.0 m, As = 400 mm2
3.0 m As = 910 mm2
5.0 m, As = 910 mm2
1.65 m As = 450 mm2
1.35 m As = 550 mm2
0.35 m0.35 m
0.2 m
0.35 m
0.35 m0.35 m
0.2 m
0.35 m
(a) (b)
Fig. 2 Dimensions and reinforcement detailing for civil defence shelter subjected to:(a) weapon load; (b) impact load. The reinforcement centre is positioned 30 mmfrom the concrete edge.
According to the Swedish Shelter Regulations (1998) a civil defence shelter shall be ableto withstand the effect of a pressure wave corresponding to that produced by 125 kg TNTwhich bursts freely outside at a distance of 5.0 metres from the outside of the shelter duringfree pressure release. From this description the blast load’s pressure-time relation can beapproximated as shown in Fig. 3b, ConWep (1992). In the FE analyses the impact load issimulated by letting falling masses hit the shelter roof with a certain velocity. Assuming that

III-4
0
1,000
2,000
3,000
4,000
5,000
0 1 2 3 4 5
Time [ms]
Pressure, p [kPa]
p
Pressure fromConWep(1992)
Simplified relationused in analysis
Time[ms]0.0000.3000.6001.0001.5002.0003.0008.974
Pressure [kPa]5,0062,9301,713836340137220
(a) (b)
m
v
p
p = p(t) ≠ qweapon
impactload
blastload
Fig. 3 (a) Transient loads carried out in the FE analyses presented herein; (b) pressure-timerelation used in the blast load analyses.
the collapse of the concrete building standing on top of the shelter starts at the top floor, andassuming plastic impact, the velocity of the falling mass can be determined to be 9.6 m/s justbefore reaching the shelter roof; see Johansson (1999, 2000b).
NON-LINEAR FE ANALYSES
Modelling of concrete and reinforcement
The analyses presented herein were carried out using the finite element programmeABAQUS/Explicit, HKS (1998). The programme uses the explicit integration method and istherefore a suitable tool to study structures subjected to transient loading. Here it is possible tomodel the cracking of concrete by the use of the brittle cracking model, which is a smearedcrack model with fixed, orthogonal cracks. Unfortunately, this model was developed for caseswhere concrete cracking dominates and is therefore limited to linear elastic behaviour incompression. To consider the non-linear response of concrete in compression a plastic model,such as that of von Mises or Drucker-Prager, can be used. However, it is not possible tocombine these models with the crack model in the same element. Therefore, in the analysespresented in this paper, linear elastic material behaviour was used for concrete incompression.

III-5
A crack is initiated perpendicular to the maximum principal stress when this, independentof the other principal stresses, reaches the tensile strength of the material. Once initiated theorientation of the crack is fixed for the duration of the analysis and a stress-strain relation, asshown in Fig. 4a, determines the material response perpendicular to the crack. Hence, stressescan be transferred across the crack until it reaches its ultimate strain, εu, in which case it issaid to be fully open. When the cracked concrete is unloaded and reloaded, the secant stiffnessis used, and thus a crack closes completely when the stress reaches zero. Additional cracksmay form at the same location but must be perpendicular to the present crack (i.e. orthogonalcracks). This limitation of the formation of a second or third crack is still valid even if the firstcrack closes completely. Consequently, once a crack has formed it will also affect the crackformation at later stages of the load history. Accordingly, stress locking may occur and theability of the cracked concrete to take shear forces along the crack is therefore reduced withincreasing crack openings. In ABAQUS/Explicit this is treated by the use of a shear retentionmodel in which the cracked shear stiffness Gcrack can be described as
( ) ccrackcrack GG εβ= (1)
where β(εcrack) is a function (given by the user) of the crack strain εcrack in the studied crackand Gc is the shear stiffness of the uncracked material. This means that when the crackopening is large enough the shear stiffness reaches zero.
1.0
εβu
β
εcrack
ft / 3
ft
εcrackεuεu / 6
σc
(a) (b)
Fig. 4 Modelling of concrete in: (a) tension; (b) shear retention.
To simulate the softening curve of the cracked concrete, a bilinear stress-crack openingrelation according to recommendations given in Gylltoft (1983) was used as shown in Fig. 4a.The fracture energy GF was used together with the tensile strength ft, to calculate the ultimatecrack opening wu where the post-peak stress reaches zero. However, the input data to the

III-6
crack model is given by a stress-crack strain curve, and thus the stress-crack opening relationhas to be translated to this by dividing the crack opening by an appropriate crack extension l.Thereby, the ultimate crack strain εu can be calculated as
lfG
lw
t
Fuu
4==ε (2)
From this expression it is obvious that the value of the crack extension l is just as importantas the fracture energy GF when determining the ultimate strain εu. If there is no reinforcementin the concrete, l is usually set to the length of the element perpendicular to the crack; seeJohansson (2000a, 2000b). In a reinforced concrete structure, though, it is more complicatedto determine l. If the interaction between reinforcement and concrete is taken into accountproperly, the method described above can be used. However, when modelling a reinforcedstructure where perfect bond is assumed, it is probably more correct to use the mean crackspacing as a value for the crack extension l; see de Borst (1995), Plos (1995) and Johansson(2000b). In the analyses carried out here, perfect bond was assumed, and the crack extension lused in Eq. (2) was therefore approximated to be equal to a mean crack spacing of 0.2 m. Thematerial properties used in the FE analyses were based on mean values: tensile strengthft = 2.36 MPa, fracture energy GF = 100 N/m, Young’s modulus Ec = 30 GPa and Poisson’sratio ν = 0.2. Hence, the ultimate crack strain used was εu = 0.847‰.
In these analyses the linear relation shown in Fig. 4b was used to model the shearretention; εβu was set to 10εu and 47.2εu for the blast load and impact load, respectively. Theformer value was not based on a physical interpretation, but on a previous study in Johansson(1998) which showed that it had negligible effect on the structural behaviour of a framecorner. Therefore, the use of a “reasonable” value was assumed to be accurate enough.However, in the impact load analyses, the concrete failed in a way that was interpreted to bedue to large shear forces. The shear retention was then determined more thoroughly. Such aphysical interpretation is possible by considering the maximum aggregate size used in theanalysed structure. It seems reasonable to assume that the shear capacity perpendicular to acrack is exhausted when the crack opening exceeds a value larger than half the aggregate size.Hereby, it is possible to determine a relation between εβu and εu as
F
t
u
u
Gfd
8φβ
εε
= (3)
and εβu = 47.2εu was obtained by assuming a maximum aggregate size dφ = 16 mm.The steel reinforcement was modelled using von Mises yield criterion with associated flow
and isotropic hardening. As for the concrete, mean material properties were used for thereinforcement: yield strength fsy =550 MPa, ultimate strength fsu =605 MPa, Young’s modulusEs =200 GPa, strain at hardening εsh =2.75‰ and strain at ultimate strength εsu = 100‰.

III-7
However, since ABAQUS/Explicit takes into account the theory of large deformations, thesevalues were recalculated into true stresses σs,true and logarithmic strains εln,s, using
)1(, sstrues εσσ +≈ (4)
( )ss εε += 1lnln, (5)
where σs and εs are the engineer stress and engineer strain of the steel, respectively; see HKS(1998).
Strain rate effects
It is commonly accepted that the material properties of both concrete and steel are affectedby what strain rate effect they are subjected to. From the test summaries provided by, forexample, Bischoff and Perry (1991), and Malvar and Ross (1998) it is evident that the load-carrying capacity of concrete in compression and tension can be substantially increased athigh strain rates. This is especially true for strain rates that exceed the value of the so-calledtransition zone which appears at a strain rate of approximately 3 s-1 and 30 s-1 for concrete intension and compression, respectively. Below such strain rates, though, the dynamic increasefactor (DIF) for a concrete of a compressive strength fc = 30 MPa is, according to the CEB-FIP Model Code, CEB (1993), less than 1.6 and 1.7 in compression and tension, respectively.Reinforcement is less strain rate sensitive than concrete and does not seem to have a transitionzone like that observed for concrete, Malvar (1998).
In ABAQUS/Explicit it is not possible to consider the effect of the strain rate in theconstitutive equations for concrete. Consequently, this effect is neglected in the analysescarried out here. For the steel reinforcement it is possible to take the strain rate effect intoaccount but since the magnitude of its strain rate will be mesh-dependent (see Johansson2000b), it was decided not to include it in the analyses.
FE models
The concrete, the ground and the simulated falling masses were modelled using four-nodeplane stress elements with reduced gauss integration; the reinforcement was modelled usingtwo-node truss elements. Since non-linear material behaviour was used, no material dampingwas included; the default value of 0.06 for the bulk viscosity, though, was kept to reduce the“noise” in the solution.

III-8
Many factors can affect the final result in a FE analysis and, since there are always someuncertainties in the choices made, it is important to examine the sensitivity of the results dueto different parameters. The shelter subjected to blast load was exposed to such a sensitivitystudy where the main parameters varied were: element mesh, assumed crack extension, andthe coefficient of friction between ground and floor slab. Further, the influence of differentshear retention εβu, the use of non-linear behaviour of concrete in compression, and modellingthe concrete using plain strain elements, were also examined. However, the space available inthis paper does not permit these comparisons to be dealt with herein, and therefore only theresults of one of the blast load analyses are presented here. Nevertheless, it should bementioned that even though these parameters did affect the structural response of the shelter,the initial behaviour, which is of most interest for such a structure, was found to beapproximately the same. For more information on the other analyses, see Johansson (1999).
The element mesh used for the shelter in both the blast and impact analyses is shown inFig. 5. To get a proper picture of the behaviour of the shelter it was modelled so that it couldlift from, and/or slide along, the ground when subjected to a blast load. This was madepossible by modelling the contact between the shelter floor slab and the ground. In theanalyses presented herein the frictional coefficient was set to 0.75. Initially the ground wasmodelled as a rigid surface but it was found that this caused the shelter to lift from the groundand then bounce, instead of slide, along it. Hence, the influence of the frictional coefficientwas considerably reduced in a very unrealistic way. By modelling the ground as a linearelastic material (6 x 0.3 m modelled by 50 x 6 elements), though, the bouncing vanished and amore realistic behaviour was obtained.
The blast load was modelled with the pressure-time relation shown in Fig. 3b, the samepressure being applied on the whole shelter front wall. The impact load was simulated bymodelling falling mass parts and their impact with the shelter roof. Since a sensitivity studywas carried out for the blast load it was not done here. According to the theoreticalbackground of the design method used in the Swedish Shelter Regulations, the falling debrisis assumed to hit the shelter roof with a constant mass per second. This was modelled byactivating different amounts of the total mass within a constant time interval. The timeinterval chosen was 1/5, 1/10 and 1/20 of the total time, hereafter denoted as the active time,which it took for all of the falling debris to reach the shelter; i.e. the mass was modelled as 6,11 and 21 individual parts, respectively, see Fig. 6a. Thus, the average amount of mass hittingthe shelter was about the same as that assumed when the equivalent static load was derived(Fig. 6b). Further, to examine the influence of the active time, it was also varied to be 0.50,0.25 or 0.10 s.
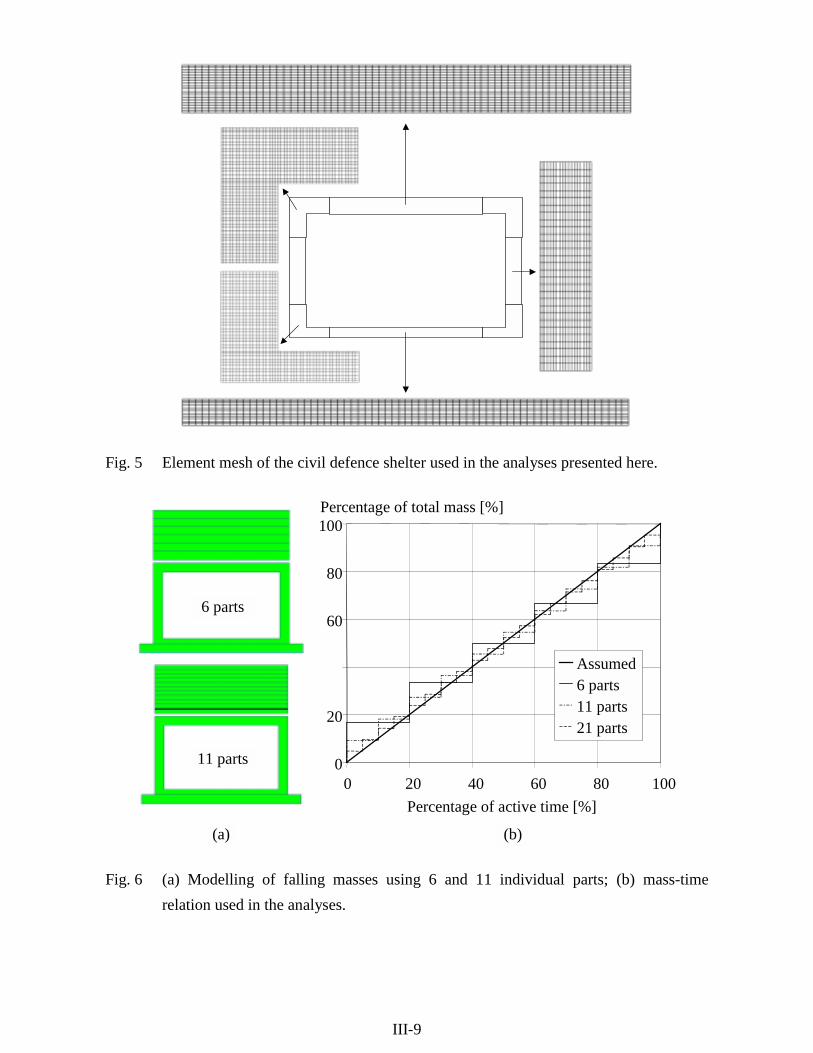
III-9
Fig. 5 Element mesh of the civil defence shelter used in the analyses presented here.
11 parts
6 parts
0
20
60
80
100
0 20 40 60 80 100Percentage of active time [%]
Percentage of total mass [%]
Assumed6 parts11 parts21 parts
(a) (b)
Fig. 6 (a) Modelling of falling masses using 6 and 11 individual parts; (b) mass-timerelation used in the analyses.
III-10
When modelling the impact load, the intention was to simulate a falling mass of debriswith a very low stiffness. The Young’s modulus and strength of the falling debris weretherefore approximated as one tenth of those of concrete in tension, i.e. Edebris = 3 GPa andfdebris = 0.236 MPa. Von Mises plasticity was used and a bilinear stress-strain relation withzero hardening was assumed. The falling masses were modelled as individual parts, each partbuilt up of 50 x 3 (6 and 11 parts) or 50 x 2 (21 parts) elements, where the interaction ofadjacent parts was modelled with contact assuming a coefficient of friction equal to 0.10.Further, the density of the rubble was assumed to be 2/3 of that of the concrete, i.e.1600 kg/m3.
RESULTS
Blast load analysis
The blast load acts during a very short but intense period of time. As can be seen inFig. 3b, it starts with a pressure just above 5 MPa, decreases rapidly to about 20 kPa after3 ms and reaches zero pressure just prior to 9 ms. The wave velocity, c, in the material can bedetermined as
ρEc = (6)
where E is Young's modulus and ρ is the density of the material. With a Young's modulus of30 GPa and a density of 2400 kg/m3 the wave velocity in the concrete becomes about3500 m/s. This means that it will take about 1.4 ms before the compressive stress wavereaches the right wall “informing” it that the structure has been hit by an external pressure. Itwill then take a further 0.3 ms before the whole structure (the midsection of the right wall isfarthest away) “knows” what has happened. Consequently, when the reflection of this stresswave reaches the left wall again, the external overpressure has all but vanished. This will alsogreatly affect the behaviour of the structure, especially in the left wall. In Fig. 7a thepropagation of the stress wave in the shelter is shown for the first 0.4 ms. After this time thecompressive wave has reached about 1.4 m into the floor and roof slabs. It is also possible tosee how a stress wave reflects back and forth in the front wall, changing sign at eachreflection.
III-11
t = 0.05 ms t = 0.15 ms
t = 0.25 ms t = 0.40 ms
-0.5
0.0
0.5
1.0
1.5
2.0
0.0 0.1 0.2 0.3 0.4 0.5 0.6 0.7 0.8 0.9 1.0Time [ms]
#5a#4a#3a#2a#1a
(a) (b)
σ < 0
σ < 0
σ > 0
σ < 0
σ < 0
σ > 0
Horizontal displacement [mm]
#5a #4a
#2a#1a
#3a
Fig. 7 (a) Initial stress wave propagation in shelter; (b) horizontal displacement at the insideof the left wall when subjected to a blast load from the left.
Since the load condition changes fast in relation to the wave velocity, it can be said that theboundary conditions of the front wall change with time. Initially, the wall does not “know”that it is connected to the rest of the structure. This is why, for instance, the back of the leftwall does not start to move until after 0.1 ms, which is the time it takes for the stress wave totravel through the 0.35 m thick shelter wall. The displacements are then the same in about0.2 ms, at which time points #1a and #5a start to differ. This also results in a behaviour thatdiffers from what may be expected, and the largest initial tensile stresses do not appear in themiddle of the wall but in a section close to the floor and roof slabs. Hence, the first cracksarise after 0.30 ms at a distance of about 0.4 m from the floor and roof slabs respectively(Fig. 8). It can be noted that points #2a, #3a and #4a have the same displacement until 0.5 msand that point #3a at a time of 1.0 ms still hardly seems to be affected by the supportconditions. Consequently, bending cracks will not dominate the crack pattern in the middle ofthe wall until after about 1.5 ms.
The maximum strain rate obtained in the blast load analysis was about 1.2 s-1 for uncrackedconcrete and about 15 s-1 in the reinforcement. The latter value was higher because thereinforcement obtains its maximum values when a localisation occurs in a cracked concreteelement and, as previously mentioned, this strain rate will therefore be mesh-dependent.Hence, if the strain rate effect had been taken into account for the reinforcement, its dynamic
III-12
t = 0.40 ms t = 0.60 ms t = 0.80 ms t = 1.00 ms t = 1.50 ms
Fig. 8 Initial crack propagation in left wall. The upper part shows where the tensile strengthhas been exceeded and the lower part (magnified 100 times) where the crackslocalise. Dark areas indicate where the principal strain has exceeded the ultimatecrack strain εu.
yield strength would also have become mesh-dependent. Using a strain rate of 1.2 s-1 the DIFshould according to the CEB-FIP Model Code, CEB (1993), be about 1.6 for concrete intension. The increase in reinforcement yield strength should at this strain rate, according toCEB Bulletin d’Information No 187, CEB (1988), be about 1.1. To take these effects intoaccount in a very approximate way, another analysis where the concrete tensile strength andreinforcement yield strength were increased to ft = 1.6⋅2.36 = 3.8 MPa andfsy = 1.1⋅550 = 605 MPa, respectively. Nevertheless, the structural response in the criticalinitial stage was still more or less the same, the effects observed being only positive in eithercase, and the results presented here should therefore still be valid.
During the first 0.2 s the left wall in the shelter obtains large horizontal displacements(Fig. 9a). During the same time, the vertical displacement-time relations in Fig. 9b show that
III-13
all but point #9 in the shelter also lift from the ground. After about 0.4 s the sliding along theground stops; thus the shelter receives a permanent movement to the right of about 50 mm.
To better understand the behaviour of the shelter during the first second, the horizontaldisplacements, relative to point #1, and some corresponding deformation plots are shown inFigs. 10a and 11, respectively. Hereby, it is easier to see how the shelter sways back and forthduring the initial loading. It can be noted that the crack patterns obtained at these stages aresimilar to what would have been caused by an external static load acting on the front wall inthe same direction as the shelter sways. Thus, the initial time-dependent change in boundaryconditions, mentioned above, now has a negligible effect.
-40
-20
0
20
40
60
80
100
0.0 0.1 0.2 0.3 0.4 0.5 0.6 0.7 0.8 0.9 1.0Time [s]
Horizontal displacement [mm]
#5#4#3#2#1
#5#4#3#2#1
-40
-20
0
20
40
60
80
100#1#6#7#8#9
0.0 0.1 0.2 0.3 0.4 0.5 0.6 0.7 0.8 0.9 1.0Time [s]
Vertical displacement [mm]
#6 #7 #8
#1 #9
(a) (b)Fig. 9 (a) Horizontal, and (b) vertical displacement in the blast load analysis.
-40
-20
0
20
40
60
80
100
#5#4#3#2#1
0.0 0.1 0.2 0.3 0.4 0.5 0.6 0.7 0.8 0.9 1.0Time [s]
Relative horizontal displacement [mm]
#5#4#3#2#1
-5
0
5
10
15
20
25#5#4#3#2#1
0.0 0.1 0.2 0.3 0.4 0.5 0.6 0.7 0.8 0.9 1.0Time [s]
Relative horizontal displacement [mm]
#5#4#3#2#1
(a) (b)Fig. 10 Relative horizontal displacement in blast load analysis when: (a) related to point #1;
(b) related to points #1 and #5 according to Eq. (7).
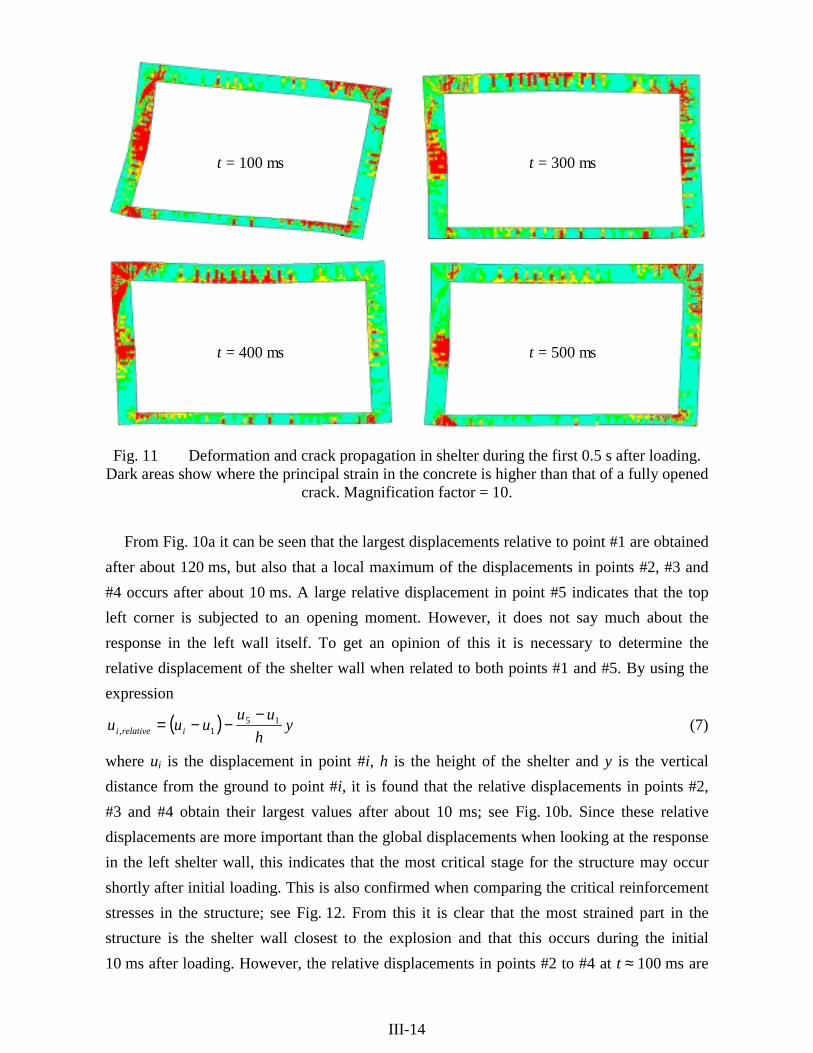
III-14
t = 100 ms t = 300 ms
t = 400 ms t = 500 ms
Fig. 11 Deformation and crack propagation in shelter during the first 0.5 s after loading.Dark areas show where the principal strain in the concrete is higher than that of a fully opened
crack. Magnification factor = 10.
From Fig. 10a it can be seen that the largest displacements relative to point #1 are obtainedafter about 120 ms, but also that a local maximum of the displacements in points #2, #3 and#4 occurs after about 10 ms. A large relative displacement in point #5 indicates that the topleft corner is subjected to an opening moment. However, it does not say much about theresponse in the left wall itself. To get an opinion of this it is necessary to determine therelative displacement of the shelter wall when related to both points #1 and #5. By using theexpression
( ) yh
uuuuu irelativei15
1,−
−−= (7)
where ui is the displacement in point #i, h is the height of the shelter and y is the verticaldistance from the ground to point #i, it is found that the relative displacements in points #2,#3 and #4 obtain their largest values after about 10 ms; see Fig. 10b. Since these relativedisplacements are more important than the global displacements when looking at the responsein the left shelter wall, this indicates that the most critical stage for the structure may occurshortly after initial loading. This is also confirmed when comparing the critical reinforcementstresses in the structure; see Fig. 12. From this it is clear that the most strained part in thestructure is the shelter wall closest to the explosion and that this occurs during the initial10 ms after loading. However, the relative displacements in points #2 to #4 at t ≈ 100 ms are
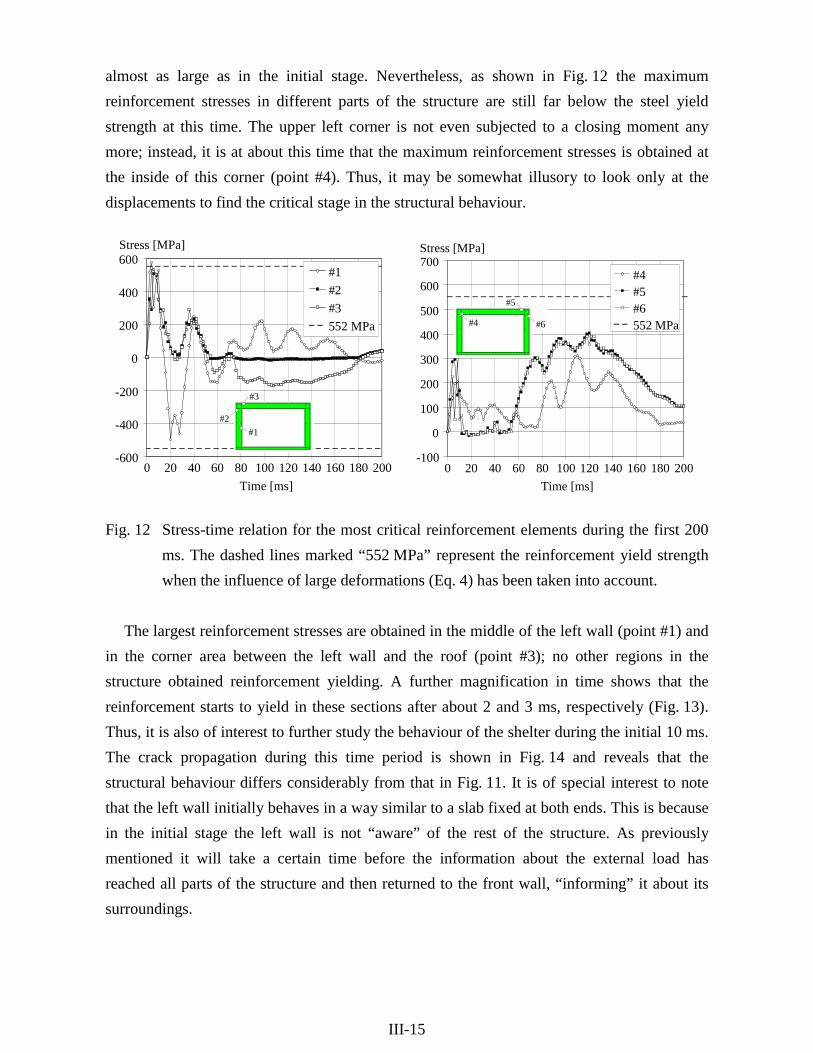
III-15
almost as large as in the initial stage. Nevertheless, as shown in Fig. 12 the maximumreinforcement stresses in different parts of the structure are still far below the steel yieldstrength at this time. The upper left corner is not even subjected to a closing moment anymore; instead, it is at about this time that the maximum reinforcement stresses is obtained atthe inside of this corner (point #4). Thus, it may be somewhat illusory to look only at thedisplacements to find the critical stage in the structural behaviour.
-600
-400
-200
0
200
400
600
0 20 40 60 80 100 120 140 160 180 200Time [ms]
Stress [MPa]
#1#2#3552 MPa
#2
#3
#1
-100
0
100
200
300
400
500
600
700
0 20 40 60 80 100 120 140 160 180 200Time [ms]
Stress [MPa]
#4#5#6552 MPa#6
#5
#4
Fig. 12 Stress-time relation for the most critical reinforcement elements during the first 200ms. The dashed lines marked “552 MPa” represent the reinforcement yield strengthwhen the influence of large deformations (Eq. 4) has been taken into account.
The largest reinforcement stresses are obtained in the middle of the left wall (point #1) andin the corner area between the left wall and the roof (point #3); no other regions in thestructure obtained reinforcement yielding. A further magnification in time shows that thereinforcement starts to yield in these sections after about 2 and 3 ms, respectively (Fig. 13).Thus, it is also of interest to further study the behaviour of the shelter during the initial 10 ms.The crack propagation during this time period is shown in Fig. 14 and reveals that thestructural behaviour differs considerably from that in Fig. 11. It is of special interest to notethat the left wall initially behaves in a way similar to a slab fixed at both ends. This is becausein the initial stage the left wall is not “aware” of the rest of the structure. As previouslymentioned it will take a certain time before the information about the external load hasreached all parts of the structure and then returned to the front wall, “informing” it about itssurroundings.
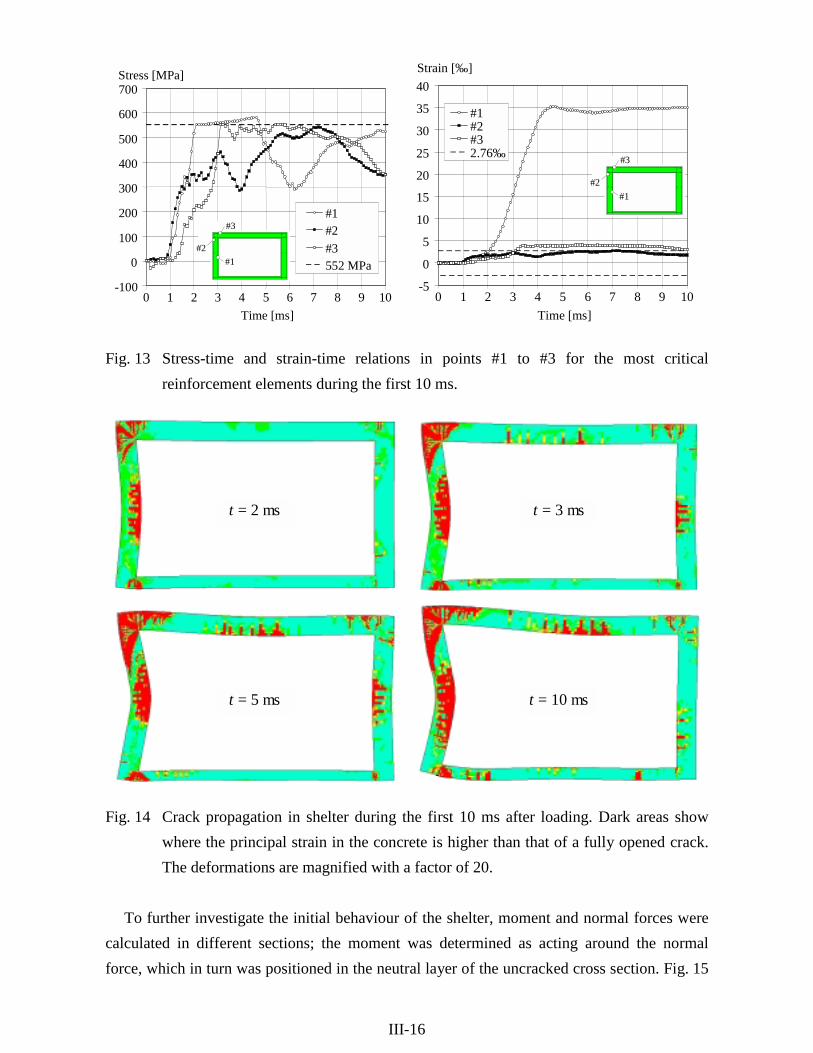
III-16
-100
0
100
200
300
400
500
600
700
0 1 2 3 4 5 6 7 8 9 10Time [ms]
Stress [MPa]
#1#2#3552 MPa
#2
#3
#1
-5
0
5
10
15
20
25
30
35
40
0 1 2 3 4 5 6 7 8 9 10Time [ms]
Strain [‰]
#1#2#32.76‰
#2
#3
#1
Fig. 13 Stress-time and strain-time relations in points #1 to #3 for the most criticalreinforcement elements during the first 10 ms.
t = 10 ms
t = 3 mst = 2 ms
t = 5 ms
Fig. 14 Crack propagation in shelter during the first 10 ms after loading. Dark areas showwhere the principal strain in the concrete is higher than that of a fully opened crack.The deformations are magnified with a factor of 20.
To further investigate the initial behaviour of the shelter, moment and normal forces werecalculated in different sections; the moment was determined as acting around the normalforce, which in turn was positioned in the neutral layer of the uncracked cross section. Fig. 15

III-17
shows the resulting moment and normal force distributions during the first 10 ms for two suchsections in the shelter. Hereby it can be seen that the maximum sectional forces in these twosections are obtained after about 1 to 2 ms. However, when comparing this to the time whenthe maximum reinforcement stresses are obtained it is clear that the times do not necessarilycoincide. The reason is that the large normal force in compression has a very positive effecton the section’s capacity. This is especially apparent when comparing the maximum momentsobtained in the analysis with the estimated moment capacities when assuming pure bending.These were determined as prescribed in Eurocode 2, CEN (1991), to be 82 kNm and 98 kNmfor the mid-wall and roof corner, respectively, values that can be compared to the maximummoments of 214 kNm and 195 kNm obtained in the analysis.
-50
0
50
100
150
200
250
-2000
-1600
-1200
-800
-400
0
400Normal force [kN]
0 1 2 3 4 5 6 7 8 9 10Time [ms]
Moment [kNm]
“Momentcapacity”MomentNormal force
-200
-150
-100
-50
0
50
0 1 2 3 4 5 6 7 8 9 10Time [ms]
Moment [kNm]
-2000
-1500
-1000
-500
0
500Normal force [kN]
(a) (b)Fig. 15 Sectional forces in (a) midsection in left wall, and (b) roof slab close to left corner,
during the first 10 ms after loading.
It is not surprising that the moment capacity increases when the compressive normal forceassists the reinforcement to keep the section together. Neither is it strange that such acompressive force appears in the roof section, since a compressive stress wave travels throughthe roof slab; compare Fig. 7a. However, the peculiarity is that such large compressive forcesalso appear in the wall. In Fig. 16a it can be seen that the compressive force varies betweenabout 0 and 350 kN during the first 0.6 ms. This force is caused by the restrained elongationobtained due to a combination of a stress wave travelling forth and back in the wall (seeFig. 7a) and the Poisson’s ratio. But, at 0.7 ms the compressive force increases rapidly andreaches its maximum of 1364 kN after 1.4 ms, and becoming 1092 kN after 1.9 ms when themaximum moment is obtained. This sudden increase is due to the cracking in the wall(Fig. 8). When the wall cracks it elongates and, if this elongation is restrained, large
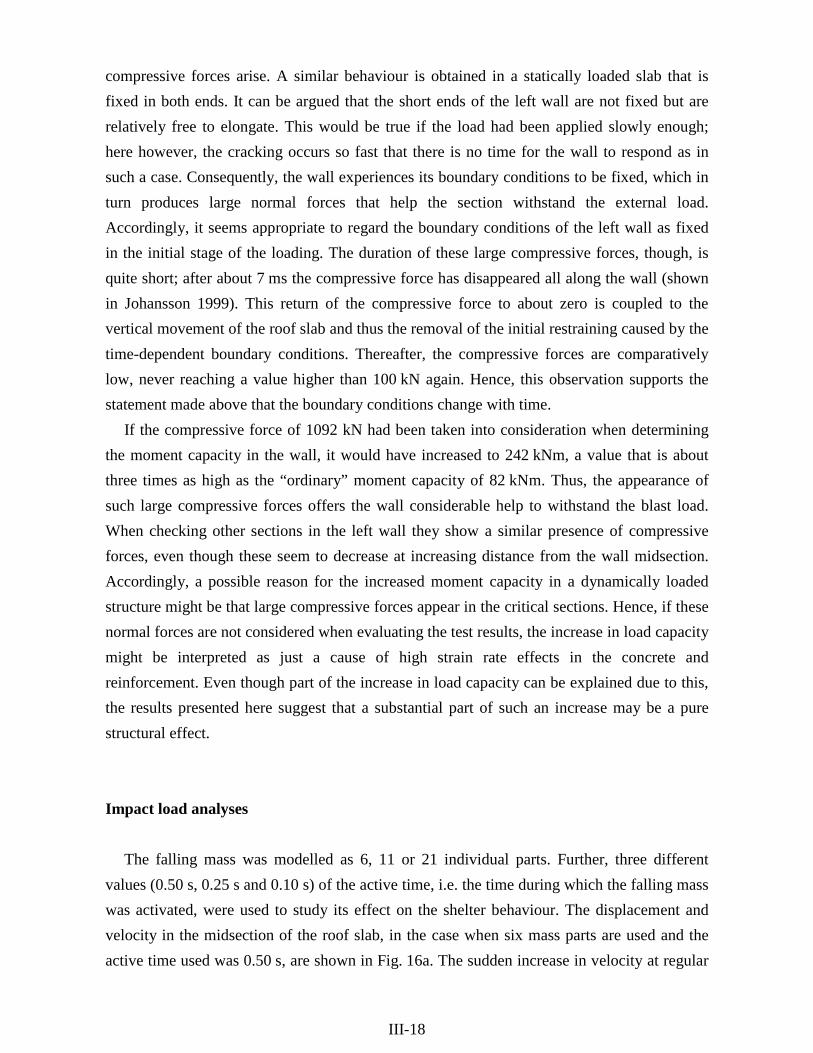
III-18
compressive forces arise. A similar behaviour is obtained in a statically loaded slab that isfixed in both ends. It can be argued that the short ends of the left wall are not fixed but arerelatively free to elongate. This would be true if the load had been applied slowly enough;here however, the cracking occurs so fast that there is no time for the wall to respond as insuch a case. Consequently, the wall experiences its boundary conditions to be fixed, which inturn produces large normal forces that help the section withstand the external load.Accordingly, it seems appropriate to regard the boundary conditions of the left wall as fixedin the initial stage of the loading. The duration of these large compressive forces, though, isquite short; after about 7 ms the compressive force has disappeared all along the wall (shownin Johansson 1999). This return of the compressive force to about zero is coupled to thevertical movement of the roof slab and thus the removal of the initial restraining caused by thetime-dependent boundary conditions. Thereafter, the compressive forces are comparativelylow, never reaching a value higher than 100 kN again. Hence, this observation supports thestatement made above that the boundary conditions change with time.
If the compressive force of 1092 kN had been taken into consideration when determiningthe moment capacity in the wall, it would have increased to 242 kNm, a value that is aboutthree times as high as the “ordinary” moment capacity of 82 kNm. Thus, the appearance ofsuch large compressive forces offers the wall considerable help to withstand the blast load.When checking other sections in the left wall they show a similar presence of compressiveforces, even though these seem to decrease at increasing distance from the wall midsection.Accordingly, a possible reason for the increased moment capacity in a dynamically loadedstructure might be that large compressive forces appear in the critical sections. Hence, if thesenormal forces are not considered when evaluating the test results, the increase in load capacitymight be interpreted as just a cause of high strain rate effects in the concrete andreinforcement. Even though part of the increase in load capacity can be explained due to this,the results presented here suggest that a substantial part of such an increase may be a purestructural effect.
Impact load analyses
The falling mass was modelled as 6, 11 or 21 individual parts. Further, three differentvalues (0.50 s, 0.25 s and 0.10 s) of the active time, i.e. the time during which the falling masswas activated, were used to study its effect on the shelter behaviour. The displacement andvelocity in the midsection of the roof slab, in the case when six mass parts are used and theactive time used was 0.50 s, are shown in Fig. 16a. The sudden increase in velocity at regular
III-19
time intervals of about 100 ms corresponds to the impact obtained when a falling mass partreaches the shelter. The last falling part affects the shelter after about 540 ms and after this theslab velocity approaches zero. Hence, the displacement observed after 700 ms of about180 mm corresponds to the final displacement of the roof slab. The crack patterns obtained inthe shelter during the impact of the falling masses are shown in Fig. 16b and it can be seenthat both the roof slab and the upper parts of the walls are cracked to a large extent. Thereinforcement yielded at several places both in the slab midsection and on either side in bothcorners (εs ≈ 70‰) and was even torn off in the wall about 100 mm below the right corner.
0
50
100
150
200
250
300
350
0 100 200 300 400 500 600 700 800
Time [ms]
Displacement [mm]
-2
-1
0
1
2
3
4
5Velocity [m/s]
displacementvelocity
t = 390 ms
t = 90 ms
(a) (b)
Fig. 16 (a) Displacement and velocity in midsection of shelter roof slab, and (b) crackpattern in shelter, when the falling mass is modelled by using 6 parts activated during0.5 s.
Normally, the deformation of the shelter should increase with decreasing active time.However, this was not the case in the analyses carried out here when using 6 mass parts.Instead, the displacement in the roof midsection was more or less halved when the active timewas set to 0.25 s. The reason for this, though, was that the frequency of the falling mass partsin this case did not correspond as well to the eigenfrequency of the shelter roof and thealready activated mass, as it did when the active time was 0.50 s. Thus, when a falling partreached an already activated mass below, this was moving in the direction opposite to thefalling part, and hence much of the kinetic energy was consumed in the plastic impact

III-20
between the two parts. If the mass fell within a period of 0.10 s, though, the shelter could notwithstand the impact but failed in several locations.
It was found that the maximum displacement obtained in the shelter depended greatly onhow many load parts were used to simulate the falling debris. Thus, the decrease in mass foreach of the parts was not compensated by their increased falling frequency. Accordingly, eventhough the essential behaviour was similar it is evident that the displacement becomesconsiderably smaller when using more but lighter falling mass parts. Hence, the strain in thereinforcement also became substantially lower, reaching a maximum value of about 35‰when using 11 falling mass parts. Nevertheless, the analyses using 11 and 21 parts to simulatethe collapsing mass confirmed the idea that a decrease in the active time also results in anincrease in the total displacement of the shelter (Fig. 17).
0
50
100
150
200
250
0 100 200 300 400 500 600 700 800Time [ms]
Displacement [mm]
0.50 s - 6 parts0.25 s - 6 parts0.50 s - 11 parts0.25 s - 11 parts0.50 s - 21 parts0.25 s - 21 parts
Fig. 17 Comparison of shelter roof displacement when the active time and the number offalling mass parts were varied.
Comparison with static loading
This section makes a brief comparison of the static behaviour of the shelter to that obtainedwhen subjected to the transient loads examined above. These analyses are not “truly” staticsince ABAQUS/Explicit was used. However, as shown in for instance Johansson (1998) it ispossible to simulate a statically loaded structure in an explicit programme as long as it is

III-21
made sure that the material models used are strain rate independent and the load velocity usedis so low that inertia effects can be neglected. The static load cases used are shown in Fig. 1and the load velocity chosen was an external pressure of 50 kN/m2s. Due to the largedifference between the transient and static load cases, though, it is not meaningful to compareload-displacement relations between them. Nevertheless, it is still of interest to compare thecritical crack patterns and differences or similarities in the general behaviour.
When applying the static load shown in Fig. 1a it was concluded that the load capacity ofthe shelter was much higher than designed for. This is partly due to the use of mean values inthe analysis (the reinforcement amount was determined using design values) but mostlybecause of the positive effect caused by the high normal forces, obtained in the structure forthis load case. At a load twice as high as the static design load, the reinforcement had justreached yielding in the roof midsection but the reinforcement was still to yield in the corners.Nevertheless, this load level was considered adequate to compare the crack patterns within thecorner with that obtained in the blast load analysis. Fig. 18a shows the crack pattern in theupper left corner region for two different load levels, and it can be seen that they are rathersimilar to those obtained in the blast load analysis at 1 ms and 3 ms, respectively; compareFig. 14. The major difference is perhaps that the inclined shear crack seems to be morepronounced in the blast load analysis. On the other hand, the responses within the cornerregion are approximately the same. It is also worth recalling that the maximum reinforcementstresses in the corner region obtained in the blast load analysis were located in the roof slaboutside the corner, hence suggesting that the corner will not be very critical in such a loadcase.
q = 100 kN/m2q = 50 kN/m2
q = 165 kN/m2
(a) (b)Fig. 18 Crack pattern in (a) corner region when the shelter is subjected to the static weapon
load case used in the design (Fig. 1a), and (b) shelter at failure when subjected to astatic pressure from above (Fig.1b).

III-22
Fig. 18b shows the shelter crack pattern at failure when it is subjected to a static load asshown in Fig. 1b. This may be compared to that shown in Fig. 16b, and despite the fact thatthe cracking seems to be more intense when subjected to the impact load, it can be concludedthat the general crack behaviour is still approximately the same. It is also interesting to notethat the critical sections at the corner are not located on the same sides of the corner in thestatic and dynamic load analyses. In the former, the reinforcement is torn off in the roof slababout 50 mm from the corner, while in the latter they appear in the wall approximately100 mm below the corner. Above all, though, in neither case is cracking within the cornercritical; this implies that a reinforcement corner detailing sufficient to use in a static load caseis also adequate in a shelter subjected to impact load.
CONCLUSIONS
A civil defence shelter subjected to a blast load from an explosion or falling mass from acollapsing building has been studied using the non-linear finite element programmeABAQUS/Explicit. It was found that the global response of a structure subjected to a blastload in the initial stage may be very different from that of a static load, an important reasonbeing that the boundary conditions initially can be said to vary with time. The most criticalstage for the shelter studied here was during the initial 10 ms. It is during this period thatyielding of the reinforcement occurs in the most strained sections: the midsection of the frontwall and the section between corner and roof slab. The corner itself, though, does not seem tobe very critical.
An impact load of falling debris from a collapsing building was simulated and it was foundthat the results depend greatly much on how much time it takes for the total mass to reach thestructure, but more importantly on what mass each independent part has that hits the structure.The impact of few but heavy masses is more dangerous than that obtained by the sameamount of mass distributed more evenly during the same time period. Further, the FE analysesstrongly imply that no critical cracks will form within the corner region, and hence it seemsreasonable to believe that the response within a corner will be similar to that obtained in astatically loaded structure. Accordingly, even though the structural behaviour may becompletely different in static and transient loaded structures, the results presented hereinindicate that the local behaviour still may be quite alike. This also suggests that theconclusions made in Johansson (1996, 2000a, 2000b) and Johansson and Karlsson (1997),that it is appropriate to use spliced reinforcement loops within the corner, should be valid fora transient loaded structure as well.

III-23
ACKNOWLEDGEMENT
The research presented in this paper was financed by the Swedish Rescue ServicesAgency. The author would like to thank the head of the Division of Concrete Structures,Professor Kent Gylltoft, for his support and advice. Thanks also to Björn Ekengren at theSwedish Rescue Services Agency and Dr. Mario Plos at Reinertsen Engineering for theirmuch appreciated support in the project.
APPENDIX I REFERENCES
Baker, W. E. (1973). Explosions in air. University of Texas Press, Austin, USA.Bischoff, P.H., and Perry, S.H. (1991). “Compressive behaviour of concrete at high strain
rates”. Materials and Structures, 24, 425-450.CEB (1988). CEB Bulletin d’Information No 187, Lausanne, Switzerland.CEB (1993). CEB-FIP Model Code 1990, Design Code. Thomas Telford, Lausanne,
Switzerland.CEN (1991). Eurocode 2: Design of concrete structures, Part 1: General rules and rules for
buildings. European Committee for Standardisation.ConWep (1992): ConWep – Collection of Conventional Weapons Effects Calculations based
on TM 5-855-1, Fundamentals of Protective Design for Conventional Weapons, U.S.Army Engineer Waterways Experiment Station, Vicksburg, MS.
de Borst R. (1995). “Analyses of reinforced concrete in a historical perspective”. NordicSymposium on Modern Design of Concrete Structures, Aalborg University, Denmark, 261-299.
Gylltoft, K. (1983). “Fracture mechanics models for fatigue in concrete Structures.” Divisionof Structural Engineering, Luleå University of Technology, Ph.D. Thesis, 1983:25D,Luleå, Sweden.
Hallgren, P., and Granström, S. (1977). “Ras mot skyddsrumstak – beräkningsmodell (Impactof falling masses on shelter roof – calculation method.)” Tyréns, Stockholm, Sweden. (InSwedish)
HKS (1998): ABAQUS/Explicit Version 5.7. Hibbit, Karlsson and Sorensen Inc. Pawtucket,RI.
III-24
Johansson, J. P. M., and Karlsson, S. (1997). “Nytt armeringsutförande i betongramhörnutsatta för positivt moment (New reinforcement detailing in concrete frame cornerssubjected to positive moment).” Division of Concrete Structures, Chalmers University ofTechnology, Report 97:5, Göteborg, Sweden. (in Swedish)
Johansson, M. (1996). “New reinforcement detailing in concrete frame corners of civildefence shelters: non-linear finite element analyses and experiments.” Division ofConcrete Structures, Chalmers University of Technology, Licentiate Thesis, Publication96:1, Göteborg, Sweden.
Johansson M. (1998): “Betongens töjningshastighetsberoende och explicit lösnings-metodik(Strain rate effects in concrete and explicit solution methods).” Division of ConcreteStructures, Chalmers University of Technology, Report 98:2, Göteborg, Sweden. (InSwedish)
Johansson M. (1999). “Non-linear finite element analyses of civil defence shelters subjectedto explosion load or impact load.” Division of Concrete Structures, Chalmers University ofTechnology, Report 99:8, Göteborg, Sweden.
Johansson M. (2000a): “Nonlinear finite-element analyses of concrete frame corners.” ASCEJournal on Structural Engineering, 126(2), 190-199.
Johansson M. (2000b). “Structural behaviour of concrete frame corners in civil defenceshelters: non-linear finite element analyses and experiments.” Division of ConcreteStructures, Chalmers University of Technology, Ph.D. Thesis, Publication 00:2, Göteborg,Sweden.
Malvar L. J., and Ross C. A. (1998). “Review of strain rate effects for concrete in tension.”ACI Materials Journal, 95(6), 735-739.
Malvar L. J. (1998). “Review of static and dynamic properties of steel reinforcing bars.” ACIMaterial Journal, 95(5), 609-616.
Plos, M. (1995). “Application of fracture mechanics to concrete bridges - finite elementanalyses and experiments.” Division of Concrete Structures, Chalmers University ofTechnology, Ph.D. Thesis, Publication 95:3, Göteborg, Sweden.
Swedish Shelter Regulations (1998). Skyddsrumsregler SR – Produktion och vidmakthållande(Shelter Regulations – production and maintenance.) Statens Räddningsverk, PublicationB54-141/98, Karlstad, Sweden. (In Swedish)
III-25
APPENDIX II NOTATIONS
The following symbols are used in this paper:
As = reinforcement area;c = wave speed velocity;dφ = maximum aggregate size;Ec = Young’s modulus for concrete;fcd = concrete design compressive strength;fsu = ultimate strength of reinforcement;fsy = yield strength of reinforcement;fsyd = design yield strength of reinforcement;ft = concrete tensile strength;Gc = shear modulus for uncracked concrete;Gcrack = shear modulus for cracked concrete;GF = fracture energy;Es = Young’s modulus of reinforcement;E = Young’s modulus;Edebris = Young’s modulus of falling mass material;fdebris = strength of falling mass material;h = height of shelter;l = crack extension;m = mass;p = pressure;qimpact = equivalent static impact load;qweapon = equivalent static weapon load;t = time;u = displacement;v = velocity;wu = crack opening;y = vertical position in shelter;β = shear retention factor;εcrack = crack strain;εln,s = logarithmic strain in reinforcement;εs = reinforcement strain;εsh = strain at reinforcement hardening;

III-26
εsu = strain at ultimate strength of reinforcement;εu = ultimate strain;εβu = ultimate strain for shear retention;σc = concrete stress;σs = reinforcement stress;σs,true = true reinforcement stress;ν = Poisson’s ratio; andρ = density.
Doctoral Theses and Licentiate Theses, Division of Concrete Structures,Chalmers University of Technology, 1990-2000
90:1 Stig Öberg: Post Tensioned Shear Reinforcement in Rectangular RC Beams.Publication 90:1. Göteborg, April, 1990. 603 pp. (No 1021). Doctoral Thesis.
90:2 Johan Hedin: Långtidsegenskaper hos samverkanskonstruktioner av stål och betong(Long Time Behaviour of Composite Steel Concrete Structures). Publication 90:2.Göteborg, August, 1990. 53 pp. (No 1079). Licentiate Thesis.
92:1 Björn Engström: Ductility of Tie Connections in Precast Structures. Publication 92:1.Göteborg, October, 1992. 368 pp. (Nos 936, 999, 1023, 1052). Doctoral Thesis.
93:1 Mario Plos: Shear Behaviour in Concrete Bridges - Full Scale Shear Test. FractureMechanics Analyses and Evaluation of Code Model. Publication 93:1. Göteborg,April, 1993. 70 pp. (Nos 1088, 1084). Licentiate Thesis.
93:2 Marianne Grauers: Composite Columns of Hollow Steel Sections Filled with HighStrength Concrete. Publication 93:2. Göteborg, June, 1993. 140 pp. (No 1077).Doctoral Thesis.
93:4 Li An: Load Bearing Capacity and Behaviour of Composite Slabs with Profiled SteelSheet. Publication 93:4. Göteborg, September, 1993. 134 pp. (No 1075). DoctoralThesis.
93:5 Magnus Åkesson: Fracture Mechanics Analysis of the Transmission in Zone inPrestressed Hollow Core Slabs. Publication 93:5. Göteborg, November, 1993. 64 pp.(No 1112). Licentiate Thesis.
95:1 Christina Claeson: Behavior of Reinforced High Strength Concrete Columns.Publication 95:1. Göteborg, June, 1995. 54 pp. (No 1105). Licentiate Thesis.
95:2 Karin Lundgren: Slender Precast Systems with Load-Bearing Facades. Publication95:2. Göteborg, November, 1995. 60 pp. (No 1098). Licentiate Thesis.

95:3 Mario Plos: Application of Fracture Mechanics to Concrete Bridges. Finite ElementAnalysis and Experiments. Publication 95:3. Göteborg, November, 1995. 127 pp.(Nos 1067, 1084, 1088, 1106). Doctoral Thesis.
96:1 Morgan Johansson: New Reinforcement Detailing in Concrete Frame Corners of CivilShelters. Non-linear Finite Element Analyses and Experiments. Publication 96:1.Göteborg, November, 1996. 77 pp. (No 1106). Licentiate Thesis.
96:2 Magnus Åkesson: Implementation and Application of Fracture Mechanics Models forConcrete Structures. Publication 96:2. Göteborg, November, 1996. 159 pp. (No 1112).Doctoral Thesis.
97:1 Jonas Magnusson: Bond and Anchorage of Deformed Bars in High-Strength Concrete.Publication 97:1. Göteborg, November, 1997. 234 pp. (No 1113). Licentiate Thesis.
98:1 Christina Claeson: Structural Behavior of Reinforced High-Strength ConcreteColumns. Publication 98:1. Göteborg 1998. 92 pp + I-IV, 75 pp. (No 1105.)Doctoral Thesis.
99:1 Karin Lundgren: Three-Dimensional Modelling of Bond in Reinforced Concrete.Theoretical Model, Experiments and Applications. Publication 99:1. Göteborg,November, 1999. 129 pp. (No 37). Doctoral Thesis.
00:1 Jonas Magnusson: Bond and Anchorage of Ribbed Bars in High-Strength Concrete.Publication 00:1. Göteborg, February, 2000. 300 pp. (No 1113). Doctoral Thesis.