structural changes, fdi, and economic growth: evidence
TRANSCRIPT
Structural changes, FDI, and economic growth: evidence from the Baltic statesManuchehr Irandoust*
1 BackgroundThe transition process from a centrally planned to free-market economy has substan-tially changed the state of the economic environment of the Baltic countries over the last 20 years, and inflows of foreign direct investment (FDI) have played a significant role in this process. The overall pattern of the three countries with respect to attracting FDI has been rather different, with Estonia getting a much larger share than its neighbors and Lithuania being relatively passive. One of the reasons for this divergent performance was the political determination of Estonia to pursue fast economic liberalization and create attractive conditions for foreign investors.
In the neoclassic growth models, long-run growth is an outcome of technological pro-gress and labor force growth, which both are assumed to be exogenous. FDI would only have short-run effect on output growth. But the adoption of endogenous growth theory has encouraged research into channels through which FDI can be expected to promote growth in the long run (Grossman and Helpman 1991; Barro and Sala-i-Martin 1995). The view of FDI is therefore suggesting that multinational companies (MNCs) have
Abstract
Despite the fact that previous studies have extensively investigated the foreign direct investment (FDI)-growth nexus, those studies have not considered the role of terms of trade as a proxy for international competitiveness and structural changes. This paper investigates the causal nexus between FDI, growth, and terms of trade volatility (TOTV) in Estonia, Latvia, and Lithuania by constructing a vector autoregression model. On the basis of the Granger non-causality procedure developed by Toda and Yamamoto (J Econom 66:225–250, 1995) and Yamada and Toda (J Econom 86:55–95, 1998), the results show that the causality is bidirectional between FDI and growth in Estonia and unidirectional (running from FDI to growth) in Latvia and Lithuania. The results also confirm causal linkages between FDI and TOTV in the sample countries. The policy implication of these results is that, by promoting growth and structural reforms, the recipient countries can encourage FDI inflows and, this in turn, can affect growth. In addition, multinationals’ activities and TOTV show the presence of a feedback between these two variables.
Keywords: Foreign direct investment, Causality, Baltic countries, Economic growth, Terms of trade volatility, Structural changes
JEL Classification: F21, O16
Open Access
© 2016 Irandoust. This article is distributed under the terms of the Creative Commons Attribution 4.0 International License (http://creativecommons.org/licenses/by/4.0/), which permits unrestricted use, distribution, and reproduction in any medium, provided you give appropriate credit to the original author(s) and the source, provide a link to the Creative Commons license, and indicate if changes were made.
RESEARCH
Irandoust Economic Structures (2016) 5:14 DOI 10.1186/s40008-016-0045-8
*Correspondence: [email protected]; [email protected] School of Business, Engineering, and Science, Halmstad University, P.O. Box 823, 30118 Halmstad, Sweden
Page 2 of 9Irandoust Economic Structures (2016) 5:14
important complementarities with local industry and stimulate development and wel-fare in the host economy.
The impact of FDI on growth is expected to run through two ways. On the one hand, through capital accumulation in the recipient economy by encouraging the incorpora-tion of new inputs and foreign technologies in the production function of the recipient economy (Dunning 1993; Blomström et al. 1996; Borensztein et al. 1998; Nair-Reichert and Weinhold 2001; and Lensink and Morrissey 2006). Thus, a catch-up process in the level of technology in part explains growth rates in emerging countries. On the other hand, through the acquisition of human capital and knowledge transfer, FDI is expected to augment the level of knowledge in the recipient economy through labor training and skill acquisition (de Mello 1999).
Endogenous growth models take also into account institutional and country-specific factors which can induce permanent increase in the rate of output growth by making the economic landscape more appealing to foreign investors such as the recipient econ-omy’s trade regime, legislation, political stability, control of corruption, the availability of good-quality and advanced infrastructure, balance of payment constraints, and the size of the domestic market (Dunning 1993; Caves 1996; de Mello 1999).
Studies on Central and Eastern European countries mention the importance of struc-tural reforms in attracting FDI to this region (Campos and Kinoshita 2003). Structural reforms such as liberalization and privatization not only send a positive signal to foreign investors but they may also improve the business environment for investing companies. Fiscal incentives to attract capital, e.g., tax exemptions, can also contribute to creat-ing favorable conditions for investors. Thus, theoretically, FDI (mainly by its spillover effects) and economic growth (mainly by its resource and location advantages) are caus-ally related.
There are several ways to explain the bidirectional link between FDI and terms of trade volatility (TOTV). On the one hand, from a microeconomics point of view, MNCs might use their monopsony power and their ability to access cheap goods from other countries, which would give a host country a competitive advantage. Since this would decrease import prices, terms of trade would increase which gives rise to TOTV. In other words, MNCs might have favorable supply channels for input goods, potentially circumventing the problem in many emerging countries that arises when investment surges also cause input prices to increase (Collier 2010; Wacker 2011; Wacker et al. 2013). It is also well known that MNCs pay higher wages than domestic firms (e.g., Lipsey 2002) and to the extent they are reflected in the final good’s (export) price, this leads to more favorable terms of trade for the FDI host country. Since MNCs usually also produce more sophis-ticated goods than domestic producers and demand more sophisticated inputs, their presence may create upgrading effects in the host economy which leads to an increase in TOTV.
On the other hand, from a macroeconomic point of view, FDI will lead to higher pur-chasing power for the host country and if the marginal propensity to spend in the host country is in favor of imported versus domestic goods, the relative demand for domes-tic goods will decrease, resulting in a decrease in terms of trade and leading to TOTV under the condition that the recipient’s demand to be large enough to influence world market. Probably more important than the demand effect of FDI is its supply response;
Page 3 of 9Irandoust Economic Structures (2016) 5:14
assuming that FDI does not simply replace domestic production, the relative supply of the emerging country’s export goods will increase if the FDI is engaged in vertical activi-ties and will decrease if FDI is horizontal in nature. This is because in the latter case the MNC will produce the industrial country’s export goods, thereby decreasing the relative quantity of the emerging country’s export goods. If we assume that the global supply of MNCs is relevant in size, the relative price of the emerging country’s export goods, and consequently the country’s terms of trade, will decrease in the case of vertical FDI but increase in the case of horizontal FDI. These circumstances, however, will raise TOTV.
It has also been suggested that there is a long-lasting persistent impact of FDI on a developing country’s TOT. This stems from the ownership advantage exercised by mul-tinationals that causes the positive effect on terms of trade. A MNC can enforce higher prices due to market power which especially matters for terms of trade when FDI comes in the form of export-oriented FDI (Ekholm et al. 2007; Blonigen et al. 2007; Baltagi et al. 2008). The FDI-TOT nexus seems to be stronger for countries with a higher trade/GDP ratio (Wacker 2011). A vertical FDI between industrialized and developing countries (where MNCs can exploit location advantages and factor price differentials) leads to an international trade flow within the multinational production network of the investor. The transfer pricing for this trade flow is then subject to the profit maximization prob-lem of the MNC. If MNCs shift profits to the host economy, then within-firm ‘import’ prices will be lower there and ‘exports’ to the parent will occur at higher prices, resulting in more favorable TOT for the host country. Lower profit taxes in developing countries than in industrialized countries can explain such a behavior.
Finally, an improvement in host country’s terms of trade might attract FDI for two reasons: (1) Relatively declined imported goods prices in a given host country render foreign firms to import capital goods relatively cheap, thus motivating the foreign invest-ment, (2) in cases where FDI is invested for re-export to markets at home or in third countries, relatively high exported prices of host country will increase the investors’ wealth. If FDI is invested for the sale in the host market, improvement in terms of trade may not enhance investment inflows. These factors might increase TOTV. TOTV could also be used as a proxy for structural changes since it measures competitiveness in inter-national trade.
Previous studies produce mixed and contradictory results on the effect of FDI on eco-nomic growth and terms of trade. Among the studies that have concluded that FDI does not cause economic growth are those of Haddad and Harrison (1993), Grilli and Milesi-Ferretti (1995) and Javorcik (2004). Others share the widespread view that FDI generates economic growth, especially Blomström et al. (1996), De Gregorio (1992), Mody and Wang (1997), Luiz and de Mello (1999), Nair-Reichert and Weinhold (2001), Lensink and Morrissey (2006), Li et al. (2007), Wacker (2011), and Wacker et al. (2013).1
Furthermore, previous studies that have investigated the causality between FDI and growth is based on either the generalized method of moments (GMM) or the method developed by the Engle and Granger and the Johansens cointegration techniques. How-ever, it has been shown that these methods have several disadvantages. In the case of the
1 Using a panel model and GMM method for 111 countries over the period 1980–2008, Wacker (2011) concludes that FDI and MNCs have favorable effects on terms of trade.
Page 4 of 9Irandoust Economic Structures (2016) 5:14
cointegration, most serious disadvantages are the appearance of pretest biased and two cointegration vectors. In the case of the GMM method, the main drawback stems from its two-step strategy and detecting and handling weak instruments which might lead to estimation bias. It is now well known that, in the causality tests, the F-test statistics is not valid if variables are integrated. In addition, previous studies have been focused on Latin American or Asian countries, which are known as high FDI inflow regions and have experienced high economic growth.
This paper seeks to overcome these problems by using a multivariate VAR model fol-lowed by the Toda and Yamamoto (1995) and Yamada and Toda (1998) method which is expected to improve the standard F-statistics in the causality test procedure. The pur-pose of this paper is to examine the causal nexus of FDI and growth in Estonia, Lat-via, and Lithuania for the period 1993–2014 using the above-mentioned procedure. The chosen countries in this study are small open economies with rather unregulated mar-kets and free factor mobility. The justification for choosing this time period stems from the availability of data. This is the first attempt to use the Granger non-causality proce-dure in the FDI-led TOTV hypothesis.
The paper is organized as follows: Sect. 2 presents some stylized facts, Sect. 3 describes data and methodology, Sect. 4 presents the empirical results, and conclusion is offered in Sect. 5.
2 Some stylized factsFDI inflows to the Baltic countries were attracted by different factors during the decade of economic transition (Grigonytė 2010). On the one hand, FDI was mainly driven by the avail-ability of relatively low-cost resources as the privatization process created business oppor-tunities for foreign investors in the manufacturing sector. A qualified and relatively cheap labor force made the Baltic states attractive in the labor-intensive industries such as food, wood, and textile products. On the other hand, an underdeveloped services sector opened up scope for horizontal FDI. Particularly, the privatization of public utilities (e.g., telecom-munications) and liberalization of the banking sector attracted significant FDI inflows. At the same time, the Baltic states’ convenient geographical location, located between the EU, Russia and the Commonwealth of Independent States (CIS) countries, as well as EU mem-bership attracted efficiency-seeking FDI. Successful market reforms and a relatively stable macroeconomic environment were the main reasons for attracting FDI to the Baltics.
A comparison of FDI among Central Eastern European countries (CEEC) over the last 15 years shows significant differences. Estonia performed very well and was ranked third within the CEEC group, while Lithuania scored much lower. On average, FDI inflows during the period 1993–2014 were 7.24 % of GDP in Estonia, 3.87 % in Latvia, and 2.91 % in Lithuania. Estonia has outperformed the other two countries since 1997, when it overtook Latvia, and especially since EU accession. This was largely due to the estab-lishment of Nordic banks in Estonia.
Although FDI did not change much the structure of the manufacturing sector in terms of value added in the Baltics, it significantly contributed to the development of both tradable and non-tradable services (Grigonytė 2010). Given the convenient transit position of the Baltics, FDI inflows targeted the service sector, with a considerable share going to trade, transport, and storage activities. A sector attracting substantially FDI was
Page 5 of 9Irandoust Economic Structures (2016) 5:14
financial intermediation and banking, which opened up new business opportunities for the Nordic banks. In 2005, the Swedish Swedbank took over the Estonian Hansabank, which had several subsidiaries in Latvia and Lithuania.
Analyzing the various components of FDI for the three Baltic countries over the last decades, it shows that FDI inflows in Latvia and Lithuania have been dominated by equity capital (mostly in the form of acquisitions and/green field investment), while Estonia has received on average a much higher share of reinvested earnings probably due to the Estonian corporate tax system which was reformed in 2000. The tax rate on rein-vested earnings reduced to zero, whereas the tax on corporate income was set to 21 % in order to support the accumulation of domestically generated capital (European Com-mission 2009). The successful structural reforms and an improved business environment are important factors that made the Baltics attractive for FDI.
Generally speaking, all Baltic countries are quite successful with respect to structural reforms, and Estonia not only has moved faster than its neighbors with the timing and the implementation of reforms but also carried out more reforms in the areas of enter-prise and competition policy than Latvia and Lithuania. The two latter types of reform would reduce the abuse of market power and improve effective corporate control exer-cised through domestic financial institutions and markets, thereby supporting market-driven restructuring. However, the level of reforms across the three countries tends to converge in the fields of large-scale privatization, banking reforms, and infrastructure.
3 Data and methodologyThe data used in this study are growth rate of real GDP per capita, the rate of change of FDI inflows measured in US dollars, and TOTV. The data are annual and cover the period 1993–2014 due to the availability of data. The unanticipated component of the income effects of a terms of trade change can be written as 12 [(EX+ IM)/GDP](dp− ω), where EX is exports, IM is imports, p is natural logarithm of the price of exports (or unit value export), and ω is the trend growth rate in the terms of trade.2 The standard devia-tion of the first log differences in the terms of trade provides us with the appropriate measure of volatility: 12 [(EX+ IM)/GDP]× St.dev.(dp). The time-varying standard devi-ation of export prices is estimated by using an integrated generalized autoregressive het-eroskedasticity (IGARCH) model. Data are taken from the UNCTAD and the World Bank World Development Indicators.
Zapata and Rambaldi (1997) have shown that, in a regression context, for determining whether some parameters of the model are jointly zero, the traditional F test is not valid when the variables are integrated or cointegrated and the test statistics does not have a standard distribution. This implies that the usual tests for exact linear restrictions on the parameters (e.g., the Wald test) do not have their usual asymptotic distributions if the data are integrated or cointegrated.
To deal with this issue and to avoid the pretesting distortions associated with prior tests of non-stationarity and cointegration, the procedure proposed by Toda and Yama-moto (1995) and Yamada and Toda (1998) is used here to ensure that the usual test statistics for Granger causality have standard asymptotic distributions. They utilize a
2 Since data for export price or unit value export were available from 1995, CPI was used for 1993–1995.
Page 6 of 9Irandoust Economic Structures (2016) 5:14
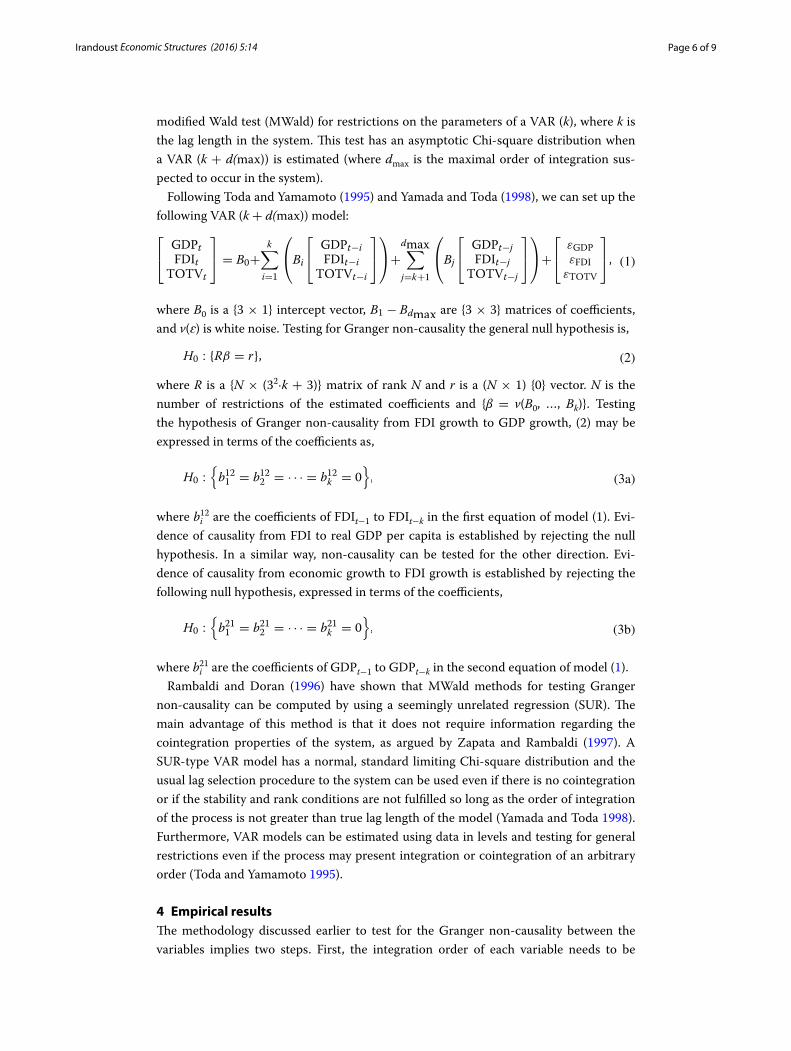
modified Wald test (MWald) for restrictions on the parameters of a VAR (k), where k is the lag length in the system. This test has an asymptotic Chi-square distribution when a VAR (k + d(max)) is estimated (where dmax is the maximal order of integration sus-pected to occur in the system).
Following Toda and Yamamoto (1995) and Yamada and Toda (1998), we can set up the following VAR (k + d(max)) model:
where B0 is a {3 × 1} intercept vector, B1 − Bdmax are {3 × 3} matrices of coefficients, and v(ɛ) is white noise. Testing for Granger non-causality the general null hypothesis is,
where R is a {N × (32·k + 3)} matrix of rank N and r is a (N × 1) {0} vector. N is the number of restrictions of the estimated coefficients and {β = v(B0, …, Bk)}. Testing the hypothesis of Granger non-causality from FDI growth to GDP growth, (2) may be expressed in terms of the coefficients as,
where bi12 are the coefficients of FDIt−1 to FDIt−k in the first equation of model (1). Evi-
dence of causality from FDI to real GDP per capita is established by rejecting the null hypothesis. In a similar way, non-causality can be tested for the other direction. Evi-dence of causality from economic growth to FDI growth is established by rejecting the following null hypothesis, expressed in terms of the coefficients,
where bi21 are the coefficients of GDPt−1 to GDPt−k in the second equation of model (1).
Rambaldi and Doran (1996) have shown that MWald methods for testing Granger non-causality can be computed by using a seemingly unrelated regression (SUR). The main advantage of this method is that it does not require information regarding the cointegration properties of the system, as argued by Zapata and Rambaldi (1997). A SUR-type VAR model has a normal, standard limiting Chi-square distribution and the usual lag selection procedure to the system can be used even if there is no cointegration or if the stability and rank conditions are not fulfilled so long as the order of integration of the process is not greater than true lag length of the model (Yamada and Toda 1998). Furthermore, VAR models can be estimated using data in levels and testing for general restrictions even if the process may present integration or cointegration of an arbitrary order (Toda and Yamamoto 1995).
4 Empirical resultsThe methodology discussed earlier to test for the Granger non-causality between the variables implies two steps. First, the integration order of each variable needs to be
(1)
GDPtFDIt
TOTVt
= B0+
k�
i=1
Bi
GDPt−i
FDIt−i
TOTVt−i
+
dmax�
j=k+1
Bj
GDPt−j
FDIt−j
TOTVt−j
+
εGDPεFDIεTOTV
,
(2)H0 : {Rβ = r},
(3a)H0 :
{
b121 = b122 = · · · = b12k = 0}
,
(3b)H0 :
{
b211 = b212 = · · · = b21k = 0}
,
Page 7 of 9Irandoust Economic Structures (2016) 5:14
determined. The KPSS test shows that the variables are integrated of order one for all countries in the sample. The results, not reported here, are available from the author on request. The second step is to test for the Granger non-causality using the Toda and Yamamoto procedure. The order of dmax is chosen to be one since the variables contain only one unit root at maximum. The VAR(k + d(max)) model can be tested now for the Granger non-causality by using MWald test statistic which has a standard asymptotic distribution.
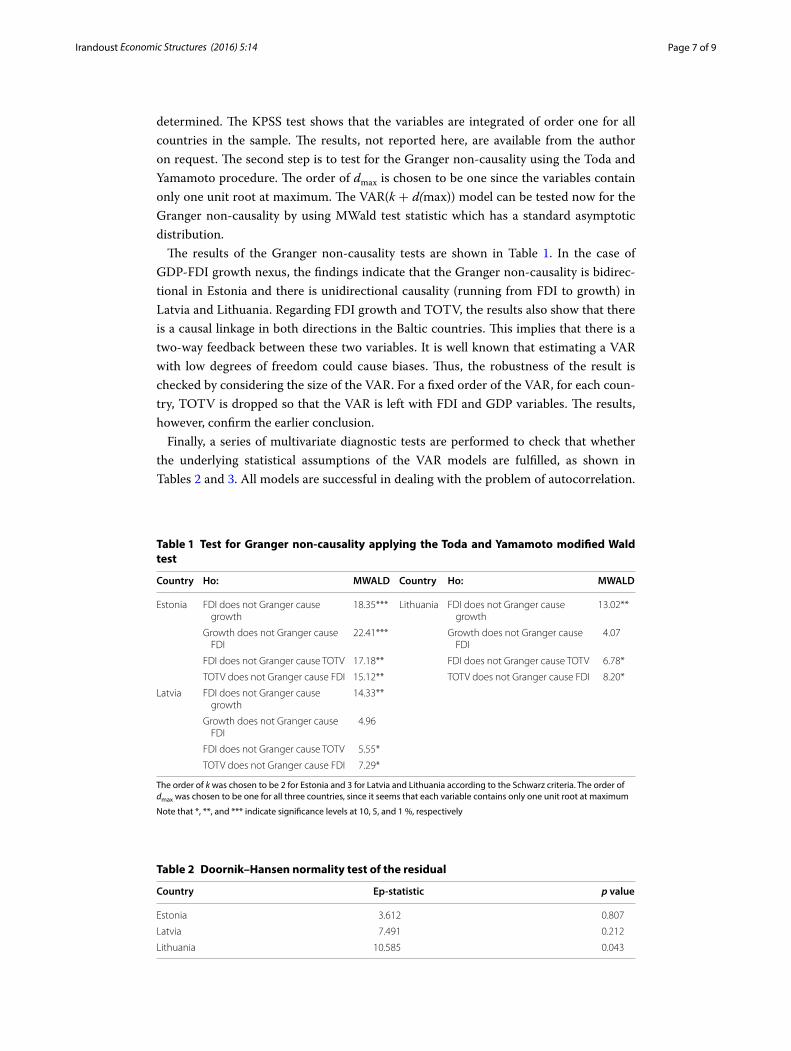
The results of the Granger non-causality tests are shown in Table 1. In the case of GDP-FDI growth nexus, the findings indicate that the Granger non-causality is bidirec-tional in Estonia and there is unidirectional causality (running from FDI to growth) in Latvia and Lithuania. Regarding FDI growth and TOTV, the results also show that there is a causal linkage in both directions in the Baltic countries. This implies that there is a two-way feedback between these two variables. It is well known that estimating a VAR with low degrees of freedom could cause biases. Thus, the robustness of the result is checked by considering the size of the VAR. For a fixed order of the VAR, for each coun-try, TOTV is dropped so that the VAR is left with FDI and GDP variables. The results, however, confirm the earlier conclusion.
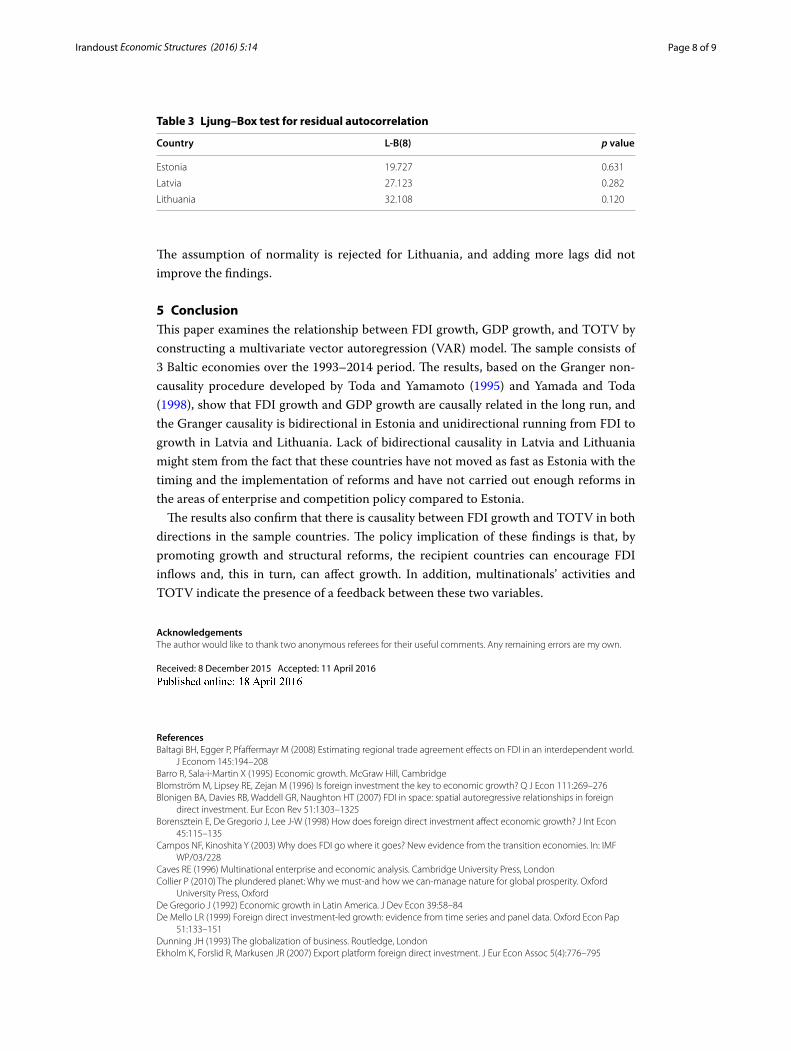
Finally, a series of multivariate diagnostic tests are performed to check that whether the underlying statistical assumptions of the VAR models are fulfilled, as shown in Tables 2 and 3. All models are successful in dealing with the problem of autocorrelation.
Table 1 Test for Granger non-causality applying the Toda and Yamamoto modified Wald test
The order of k was chosen to be 2 for Estonia and 3 for Latvia and Lithuania according to the Schwarz criteria. The order of dmax was chosen to be one for all three countries, since it seems that each variable contains only one unit root at maximum
Note that *, **, and *** indicate significance levels at 10, 5, and 1 %, respectively
Country Ho: MWALD Country Ho: MWALD
Estonia FDI does not Granger cause growth
18.35*** Lithuania FDI does not Granger cause growth
13.02**
Growth does not Granger cause FDI
22.41*** Growth does not Granger cause FDI
4.07
FDI does not Granger cause TOTV 17.18** FDI does not Granger cause TOTV 6.78*
TOTV does not Granger cause FDI 15.12** TOTV does not Granger cause FDI 8.20*
Latvia FDI does not Granger cause growth
14.33**
Growth does not Granger cause FDI
4.96
FDI does not Granger cause TOTV 5.55*
TOTV does not Granger cause FDI 7.29*
Table 2 Doornik–Hansen normality test of the residual
Country Ep-statistic p value
Estonia 3.612 0.807
Latvia 7.491 0.212
Lithuania 10.585 0.043
Page 8 of 9Irandoust Economic Structures (2016) 5:14
The assumption of normality is rejected for Lithuania, and adding more lags did not improve the findings.
5 ConclusionThis paper examines the relationship between FDI growth, GDP growth, and TOTV by constructing a multivariate vector autoregression (VAR) model. The sample consists of 3 Baltic economies over the 1993–2014 period. The results, based on the Granger non-causality procedure developed by Toda and Yamamoto (1995) and Yamada and Toda (1998), show that FDI growth and GDP growth are causally related in the long run, and the Granger causality is bidirectional in Estonia and unidirectional running from FDI to growth in Latvia and Lithuania. Lack of bidirectional causality in Latvia and Lithuania might stem from the fact that these countries have not moved as fast as Estonia with the timing and the implementation of reforms and have not carried out enough reforms in the areas of enterprise and competition policy compared to Estonia.
The results also confirm that there is causality between FDI growth and TOTV in both directions in the sample countries. The policy implication of these findings is that, by promoting growth and structural reforms, the recipient countries can encourage FDI inflows and, this in turn, can affect growth. In addition, multinationals’ activities and TOTV indicate the presence of a feedback between these two variables.
AcknowledgementsThe author would like to thank two anonymous referees for their useful comments. Any remaining errors are my own.
Received: 8 December 2015 Accepted: 11 April 2016
ReferencesBaltagi BH, Egger P, Pfaffermayr M (2008) Estimating regional trade agreement effects on FDI in an interdependent world.
J Econom 145:194–208Barro R, Sala-i-Martin X (1995) Economic growth. McGraw Hill, CambridgeBlomström M, Lipsey RE, Zejan M (1996) Is foreign investment the key to economic growth? Q J Econ 111:269–276Blonigen BA, Davies RB, Waddell GR, Naughton HT (2007) FDI in space: spatial autoregressive relationships in foreign
direct investment. Eur Econ Rev 51:1303–1325Borensztein E, De Gregorio J, Lee J-W (1998) How does foreign direct investment affect economic growth? J Int Econ
45:115–135Campos NF, Kinoshita Y (2003) Why does FDI go where it goes? New evidence from the transition economies. In: IMF
WP/03/228Caves RE (1996) Multinational enterprise and economic analysis. Cambridge University Press, LondonCollier P (2010) The plundered planet: Why we must-and how we can-manage nature for global prosperity. Oxford
University Press, OxfordDe Gregorio J (1992) Economic growth in Latin America. J Dev Econ 39:58–84De Mello LR (1999) Foreign direct investment-led growth: evidence from time series and panel data. Oxford Econ Pap
51:133–151Dunning JH (1993) The globalization of business. Routledge, LondonEkholm K, Forslid R, Markusen JR (2007) Export platform foreign direct investment. J Eur Econ Assoc 5(4):776–795
Table 3 Ljung–Box test for residual autocorrelation
Country L-B(8) p value
Estonia 19.727 0.631
Latvia 27.123 0.282
Lithuania 32.108 0.120
Page 9 of 9Irandoust Economic Structures (2016) 5:14
European Commission (2009) Taxation trends in the European Union, DG TAXUD. http://ec.europa.eu/taxation_customs/resources/documents/taxation/gen_info/economic_analysis/tax_structures/2009/2009_full_text_en.pdf
Grigonytė D (2010) FDI and structural reforms in the Baltic States economic analysis from the European Commission’s Directorate-General for Economic and Financial Affairs 7, no. 5
Grilli V, Milesi-Ferretti GM (1995) Economic effects and structural determinants of capital controls. Int Monet Fund Staff Pap 42(3):517–551
Grossman GM, Helpman E (1991) Innovation and growth in the global economy. MIT Press, CambridgeHaddad M, Harrison A (1993) Are there positive spillovers from direct foreign investment? Evidence form panel data for
Morocco. J Dev Econ 42:51–74Javorcik BS (2004) Does foreign direct investment increase the productivity of domestic firms? In search of spillovers
through backward linkages. Am Econ Rev 94(3):605–627Lensink R, Morrissey O (2006) Foreign direct investment: flows, volatility and the impact on growth. Rev Int Econ
14(3):478–493Li H, Huang P, Li J (2007) China’s FDI net inflow and deterioration of terms of trade: paradox and explanation. China World
Econ 15(1):87–95Lipsey RE (2002) Home and host country effects of FDI. In: NBER Working Paper. No. 9293. National Bureau of Economic
Research, CambridgeLuiz R, de Mello LR (1999) Foreign direct investment-led growth: evidence from time series and panel data. Oxford Econ
Rev 51:133–151Mody A, Wang F-Y (1997) Explaining industrial growth in coastal China: economic reforms…and what else? World Bank
Econ Rev 11(2):293–325Nair-Reichert U, Weinhold D (2001) Causality tests for cross-country panels: a new look at FDI and economic growth in
developing countries. Oxford Bull Econ Stat 63(2):153–171Rambaldi AN, Doran HE (1996) Testing for Granger non-causality in cointegrated systems made easy. In: Working Papers
in Econometrics and Applied Statistics, Department of Econometrics, University of New England, vol 88, pp 1–22Toda YH, Yamamoto T (1995) Statistical inference in vector autoregressions with possibly integrated processes. J Econom
66:225–250Wacker KM (2011) The impact of foreign direct investment on developing countries’ terms of trade. In: Working Paper No.
2011/06, UNU-WIDERWacker KM, Großkurth P, Lakemann T (2013) Terms of trade, foreign direct investment, and development: a case of Intra-
Asian “kicking away the ladder”? In: ADB Working Paper Series on Regional Economic Integration, no. 122Yamada H, Toda YH (1998) Inference in possibly integrated vector autoregressive models: some finite evidence. J Econom
86:55–95Zapata HO, Rambaldi AN (1997) Monte Carlo evidence on cointegration and causation. Oxford Bull Econ Stat
59(2):285–298