structural changes in tinnitus patients and their
TRANSCRIPT

Structural Changes in Tinnitus Patients
and Their Relationship to Hearing-Loss
Charlotte de Blecourt, s2188813
Behavioural and Cognitive Neuroscience, C-track
Major Project Report
10-08-2016
Supervisors: E.A. Koops, MSc, & prof. dr. P. Van Dijk
Department of Otorhinolaryngology; ENT Clinic; University Medical Center Groningen
Neuro Imaging Center Groningen

2
Abstract
Subjective tinnitus is the perception of sound without an external source. Tinnitus is highly
associated with hearing-loss, but theories that attempt to explain tinnitus rarely consider
hearing-loss as a cofounding variable. Leaver et al. (2011) propose that a gating mechanism is
unable to properly inhibit the unwanted tinnitus signal. The key areas of this theory, amygdala
and ventromedial prefrontal cortex, usually show less grey matter (GM) than controls.
Perhaps a lack of GM prevents the gating system to correctly inhibit the tinnitus signal.
Theories on tinnitus involve a mismatch in the functional reorganisation in several brain
areas, especially the auditory cortex (Jastreboff, 1990). Structural studies often assume that
the functional reorganisation is accompanied by structural reorganisation. Volumetric studies
on tinnitus often find differences in the auditory, limbic, and frontal areas between tinnitus
patients and controls.
This study compared anatomical MRI-scans of 23 tinnitus patients with 4 individuals
with hearing-loss and 6 healthy controls. Tinnitus and control subjects have on average more
grey matter in the left superior temporal cortex than hearing-impaired individuals. Region-of-
Interest analysis showed that controls had more grey matter in the left parahippocampal cortex
compared to tinnitus patients. Tinnitus patients had more grey matter than the hearing-loss
group in auditory, limbic, and frontal areas. The findings suggest that hearing-loss group had
the strongest decrease in GM volume in the limbic system. The tinnitus group is somewhere
between the hearing-loss group and the controls.
The findings suggest that the limbic system is involved in the tinnitus percept, but it
seems that the gating mechanism is not situated here. It might be that this gate is situated in
the frontal cortex, but the frontal findings seem to be related to tinnitus distress. Structural
reorganisation is possibly the strongest in hearing-impaired individuals, and only partially
happening in tinnitus patients, suggesting that reorganisation may not have happened
properly. It is emphasised that the sample group size and hearing-levels are not ideal, and
tinnitus distress should be taken into account in further studies.

3
Table of Contents
Introduction ................................................................................................................................ 4
Connection Hearing Loss and Tinnitus: Tonotopy and the Reorganisation Hypothesis ....... 4
Structural Differences between Normal-Hearing Individuals, Individuals with Hearing-
Loss, and Tinnitus Patients ..................................................................................................... 7
Expectations ........................................................................................................................... 9
Materials and Methods ............................................................................................................. 10
Participants ........................................................................................................................... 10
Data Acquisition ................................................................................................................... 11
Data Processing .................................................................................................................... 12
Statistical Analysis ............................................................................................................... 13
Whole-brain analysis. ....................................................................................................... 13
Region-of-interest (ROI) analysis. ................................................................................... 14
Results ...................................................................................................................................... 16
Correlation with age and sex. ............................................................................................... 16
Whole-brain Voxel-by-voxel Comparisons ......................................................................... 16
Region-of-Interest (ROI) Analysis ....................................................................................... 18
Discussion ................................................................................................................................ 20
Inefficient Gating System is not Situated in the Limbic Areas ............................................ 20
The ‘Reorganisation Gone Wrong’ Hypothesis ................................................................... 22
Technical considerations ...................................................................................................... 25
Conclusions and Further Directions ..................................................................................... 26
References ................................................................................................................................ 28
Appendix I ................................................................................................................................ 36
Afterword ................................................................................................................................. 38

4
Introduction
Tinnitus is the sensation of sound without an external source. When speaking about tinnitus,
we typically mean subjective tinnitus, which can only be perceived by the sufferer. Usually,
subjective tinnitus is accompanied by peripheral hearing loss (Eggermont & Roberts, 2004;
Hoffman & Reed, 2004; Nicolas-Puel et al., 2006), although tinnitus with mild or even no
hearing loss has been reported as well (Levine, 1999; Stouffer & Tyler, 1990). As the chance
to acquire hearing loss increases with age, it may not come as a surprise that the prevalence of
tinnitus also increases with age (Eggermont, 2012; Lockwood, Salvi, & Burkard, 2002). It
remains unclear, however, whether tinnitus is a stand-alone pathology as a result of the
hearing-loss or has other causes. One of reasons that makes finding the aetiology of tinnitus
difficult is this connection between hearing-loss and tinnitus. As the likelihood to develop
tinnitus, deafness, or both increases with age, it is difficult to dismantle their relationship.
Connection Hearing Loss and Tinnitus: Tonotopy and the Reorganisation Hypothesis
Early ideas on the cause of tinnitus involve exclusively the inner ear: the damaged nerve
endings of the inner hair cells would deploy continuous stimulation in absence of a stimulus.
This model is somewhat outdated (Mühlau et al., 2006). For example, nerve damage is
usually associated with numbness. Thus damage to the hair cells would result in deafness and
hearing-loss instead of tinnitus. Also, tinnitus remains present when the cochlea is destroyed
or removed (Zacharek, Kaltenbach, Mathog, & Zhang, 2002). More recent models involve
both the peripheral and central nervous system. Theories usually involve peripheral damage to
the cilia, reorganisation of central auditory pathways, and changes in the parts of the limbic
system that perform evaluation of the emotional content of sensory experiences (Eggermont,
2012; Jastreboff, 1990; Langers & de Kleine, 2016; Leaver et al., 2011; Mühlau et al., 2006).
The idea of damage in the peripheral nervous system that triggers a mechanism in the brain is
also seen in literature on phantom pain; tinnitus is sometimes compared to that (Flor,
Birbaumer, & Turk, 1990; Muhlnickel, Elbert, Taub, & Flor, 1998; Rauschecker, 1999).
In the inner ear, the cochlea follows a tonotopic organisation. This means that the hair
cells at the base of the cochlea are tuned to high frequency sounds, and hair cells that are situated
more towards the apex are sensitive to lower frequency sounds. This tonotopic organisation is
preserved in the auditory cortex (Brodmann area 41/42) (Pantev et al., 1995; Romani,
Williamson, & Kaufman, 1975). Neurons at one end of the auditory cortex respond best to low
frequencies; neurons at the other end respond best to high frequencies. As explained earlier,
most theories on tinnitus involve a form of reorganisation of the auditory pathway and tonotopic

5
organisation. Several functional studies found changes related to tinnitus at the level of the
auditory cortex (Arnold, Bartenstein, Oestreicher, Römer, & Schwaiger, 1996; Giraud et al.,
1999; Lockwood et al., 1998; Mirz et al., 1999; Muhlnickel et al., 1998; Rauschecker, 1999),
the thalamus (Lanting, De Kleine, & Van Dijk, 2009), and the inferior colliculus (Melcher,
Sigalovsky, Guinan, & Levine, 2000).
A popular idea is that tinnitus is the result of ‘neuroplasticity gone wrong’ (Eggermont,
2012). In hearing-impaired individuals, the auditory input is diminished. This leads to less
strengthening of connections between neurons in the auditory pathway. In turn, this could lead
to changes in the tonotopic map. According to Hebbian theory (Hebb, 2005), synaptic
connections are built based on the frequency of interactions between neurons. In tinnitus
patients, the mechanism that strengthens or weakens connections is not working properly, due
to a lack of inhibition of irrelevant activity. This irrelevant activity is processed and perceived
as the tinnitus signal. This would mean that neurons in de auditory cortex that were initially
sensitive to, for example, high frequency tones, also start to react to a lower frequency
(Eggermont, 2007). Or these neurons react to random spontaneous activity (Schaette &
Kempter, 2006), which also leads to the perception of tinnitus (Chrostowski, Yang, Wilson,
Bruce, & Becker, 2011; Dominguez, Becker, Bruce, & Read, 2006). This mechanism is not
limited to the auditory cortex, but various areas in the auditory system. Moreover, one study
found that signs of tinnitus disappeared when the tonotopic representation was restored, which
suggests reorganization is responsible for the tinnitus percept (Engineer et al., 2011).
Nevertheless, other studies have not found functional differences in tonotopic maps of tinnitus
patients without hearing-loss (Langers, de Kleine, & van Dijk, 2012).
Leaver and colleagues (2011) formulated a hypothesis that connects functional and
structural changes in tinnitus patients. They propose a model of tinnitus that involves limbic
and auditory interactions in the brain (Figure 1). Their model includes areas that are usually
found in both functional and structural studies, such as the auditory cortex, the ventromedial
prefrontal cortex (vmPFC), the nucleus accumbens (NAc), and medial geniculate nucleus
(MGN, thalamus). In healthy individuals, the vmPFC and NAc control the auditory input that
will be processed. A few studies found that these areas have less grey matter in tinnitus patients,
and argue that at least one of these areas is unable to inhibit the tinnitus signal (Leaver et al.,
2011; Leaver et al., 2012; Mühlau et al., 2006; Rauschecker, Leaver, & Mühlau, 2010). Leaver
and colleagues argue that structural changes in the auditory cortex are a result of the inefficient
control of auditory signal in lower level areas, because peripheral damage in the somatosensory
system results in cortical map changes but causes even more reorganization at the thalamic level

6
(Ergenzinger, Glasier, Hahm, & Pons, 1998; Rauschecker, 1998). They associate structural
findings in the auditory cortex with the characteristics of the perceived tinnitus signal, but other
studies oppose this (Langers et al., 2012). Interestingly, a VBM and EEG comparison study by
Vanneste, Van de Heyning, and De Ridder (2015) found no correlations between functional
and anatomical changes in tinnitus patients. They attribute these findings to hearing-loss instead
of tinnitus. However, they did not compare tinnitus patients to normal-hearing controls. This
poses a problem, because the areas that are usually found in studies on tinnitus, such as the (left)
auditory cortex and the right temporal lobe, have also been found in studies on hearing-
impairment (Eckert, Cute, Vaden Jr, Kuchinsky, & Dubno, 2012; Lin et al., 2014; Vanneste et
al., 2015).
Figure 1: Schematic of interactions in tinnitus. In healthy
individuals, the limbic system may identify a sensory signal as
irrelevant (e.g., transient tinnitus) and inhibit the unwanted
signal at the medial geniculate nucleus (MGN) via the
ventromedial prefrontal cortex (vmPFC) to the auditory
thalamic reticular nucleus (TRN, red pathway). Thus, the
spread of the unwanted signal is reduced in both circuits. In
chronic tinnitus, inefficient vmPFC output prevents inhibition
of the tinnitus signal, resulting in continued activity and
constant perceptual presence of the tinnitus signal. Cortical
structures are noted in gray, thalamus is noted in blue, basal
ganglia in green, and amygdala in lavender. Abbreviations:
medial dorsal nucleus (MDN), ventral pallidum (VP),
amygdala (amyg), auditory cortex (AC). Retrieved from Leaver
et al. (2011).

7
Structural Differences between Normal-Hearing Individuals, Individuals with Hearing-
Loss, and Tinnitus Patients
Reviews of the literature on functional and structural changes in the brain that are associated
with tinnitus have been created by Eggermont (2012) and Langers & De Kleine (2016). The
usual method to analyse grey matter volume is called voxel-based morphometry (VBM). An
overview of studies that used VBM to investigate structural changes in tinnitus patients can be
found in Table 1. Only studies with controls are included.
The temporal lobe, and in particular the auditory cortex, is an area of interest in
tinnitus research. Schneider and others (2009) and Aldhafeeri and others (2012) found an
association between tinnitus and structural changes in the auditory cortex. They found smaller
grey matter volume in tinnitus patients compared to controls. In patients with unilateral
tinnitus, the changes were observed on the ipsilateral side. Patients with bilateral tinnitus, on
the other hand, showed reduced mHG volumes in both hemispheres. Boyen, Langers, De
Kleine, and Van Dijk (2013) had contrary results: an increase in grey matter volume in the
primary auditory cortex. Other studies found no differences in cortical thickness in the
primary and secondary auditory cortex (Mühlau et al., 2006).
Furthermore, as the limbic system controls the auditory signal, these areas are often
also regarded in tinnitus studies. Mühlau and others (2006) found changes situated at the
thalamic level of the auditory system. The posterior thalamus including the medial geniculate
nucleus (MGN) of tinnitus patients showed an increase in grey-matter concentration. They
note that earlier studies on adult sensory plasticity found interactions between the cortex and
the thalamus (Ergenzinger et al., 1998; Rauschecker, 1998; Suga & Ma, 2003). The authors
found an additional decrease in grey matter in the subcallosal region including the nucleus
accumbens (NAc). The subcallosal area is associated with negative emotions (Blood, Zatorre,
Bermudez, & Evans, 1999) and aversive sounds (Zald & Pardo, 2002). Later studies could not
replicate these findings (Landgrebe et al., 2009; Melcher, Knudson, & Levine, 2013). Instead,
Landgrebe and others (2009) found a decrease in grey matter in the right inferior colliculus
(IC) and in the left hippocampus.
In the frontal region, grey matter reductions have been found in the prefrontal cortex,
in particular in the ventromedial prefrontal cortex (vmPFC) and in the dorsomedial prefrontal
cortex (dmPFC) (Aldhafeeri et al., 2012; Husain et al., 2011; Leaver et al., 2011; Leaver et
al., 2012; Melcher et al., 2013). Besides these regions, Melcher and colleagues also found

8
differences between tinnitus patients and controls in the ventral posterior cingulate cortex
(cPCC). Finally, Vanneste and colleagues (2015) found convincing structural changes in the
cerebellum.
Table 1 Grey matter findings in tinnitus using group contrasts. Underlined brain areas are findings using Region of Interest
analysis. Otherwise, findings are the result of voxel-by-voxel whole brain analyses.
Abbreviations: PFC = prefrontal cortex, IC = inferior colliculi, SFG = superior frontal gyrus, MFG = medial frontal gyrus,
AntC = anterior cingulate, STG = superior temporal gyrus, SMG = supramarginal gyrus), BA = Brodmann area, GM = grey
matter.
Authors Sample Finding
Mühlau et al. (2006) 28 patients versus 28 controls;
matched for age and gender
Subcallosal area (ventromedial PFC) ,
thalamus (MGN)
Schneider et al.
(2009)
61 patients versus 45 controls;
age, gender, and hearing as
covariates
Heschl’s gyrus
Landgrebe et al.
(2009)
28 patients versus 28 controls;
matched for age and gender
Right IC , left hippocampus
Leaver et al. (2011) 11 patients versus 11 controls;
hearing and age as covariates
Ventromedial PFC
Husain et al. (2011) 8 patients versus 7 controls
with hearing-loss versus 11
controls; matched for age and
gender
No tinnitus findings. Hearing loss: SFG , MFG
, right AntC , STG
Leaver et al. (2012) 23 patients versus 21 controls;
matched for age and gender
Ventromedial PFC , dorsomedial PFC
left SMG
Diesch et al. (2012) 63 patients versus 42 controls Corpus callosum in female in male patients
Aldhafeeri et al.
(2012)
14 patients versus 14 controls;
matched for age, gender, and
hearing
Right frontal cortex , cingulate gyrus , right
primary auditory cortex , left temporal cortex
Boyen et al. (2013) 31 patients versus 16 controls
with hearing-loss versus 24
controls; matched for gender
Left primary auditory cortex (BA 41) , right
auditory association cortex (BA 22) , inferior
temporal area (BA 20) , limbic cortex (BA 35
& 36) in tinnitus vs normal-hearing control,
frontal areas (BA 8, 9, & 11) in tinnitus vs.
normal-hearing control
Melcher et al. (2013) 24 tinnitus patients versus 24
controls, matched for age,
gender, and hearing level
PFC , probability of decreased GM with
increasing hearing-loss
It is no surprise that in functional and structural studies on tinnitus emotion-related
brain areas are found to be deviating from normal-hearing controls. Grey matter decreases in
the left hippocampus (Landgrebe et al., 2009) are associated with the pathophysiology of
depression (de Geus et al., 2007; Vasic, Walter, Höse, & Wolf, 2008) and insomnia (Riemann
et al., 2007). Both conditions are complaints among tinnitus patients (Crönlein, Langguth,
Geisler, & Hajak, 2007). Moreover, it has been suggested that grey matter volume reductions
in the auditory cortex and hippocampus are correlated to the amount of tinnitus distress

9
(Schecklmann et al., 2013; Vanneste et al., 2015), but others argue that the neural systems that
process tinnitus and distress are separated (Leaver et al., 2012). When investigating these
emotion-related areas in tinnitus patients, one should be aware of the apparent correlation
between tinnitus and negative emotions. Volumetric differences between tinnitus patients and
controls may not be a result of the tinnitus, but a consequence of tinnitus distress
(Schecklmann et al., 2013).
As chronic tinnitus is more likely to arise in the elderly (Baguley, 2002; Eggermont &
Roberts, 2004), and age is associated with (sub)cortical grey matter volume decrements
(Bartzokis et al., 2001; Good et al., 2002; Raz et al., 2005; Zimmerman et al., 2006), it is
important to control for age when investigating structural differences. Also, a fair amount of
preceding studies did not control for hearing-loss (Landgrebe et al., 2009; Leaver et al., 2011;
Melcher et al., 2013; Mühlau et al., 2006; Schneider et al., 2009). More recent studies did
compare individuals with hearing-loss, tinnitus, and normal hearing controls (Boyen et al.,
2013; Husain et al., 2011). There are researchers who argue that tinnitus-related findings are
in fact hearing-loss related findings (Vanneste et al., 2015).
Literature on anatomical differences between tinnitus patients, patients with hearing-
loss, and normal hearing individuals is relatively sparse and inconsistent. This study aims to
contribute to the literature on structural differences in tinnitus patients, individuals with
hearing loss, and normal hearing individuals. Differences in grey matter volume may reveal
vulnerability factors for tinnitus or indicate neuroplasticity.
Expectations
Studies usually find functional differences between normal-hearing individuals and tinnitus
patients in the auditory cortex (Eggermont, 2012; Langers & de Kleine, 2016), but structural
differences are often also found outside of these areas. Studies on structural differences are
inconsistent, but changes in cortical thickness are mainly found in three areas: the auditory
cortex, the limbic system, and frontal regions. More specifically, the areas with the highest
likelihood to show decreases between tinnitus patients and controls are the ventral medial
prefrontal cortex, the nucleus accumbens, the cingulate cortex, the cerebellum, the left
hippocampus, and the primary auditory area. Boyen and colleagues (2013) found mostly
increases in these areas in tinnitus patients. It is possible that structural changes are found in
both individuals with hearing loss and with tinnitus (Boyen et al., 2013; Husain et al., 2011;
Melcher et al., 2013; Vanneste et al., 2015). Hearing-loss-related decreases in GM are
expected in the in frontal gyri, the anterior cingulate, the superior temporal gyrus, and the
10
prefrontal cortex. An increase can be expected in the limbic cortex. It is important to consider
that the relation between tinnitus and the brain could be asymmetric (Melcher et al., 2000;
Mühlau et al., 2006; Schneider et al., 2009).
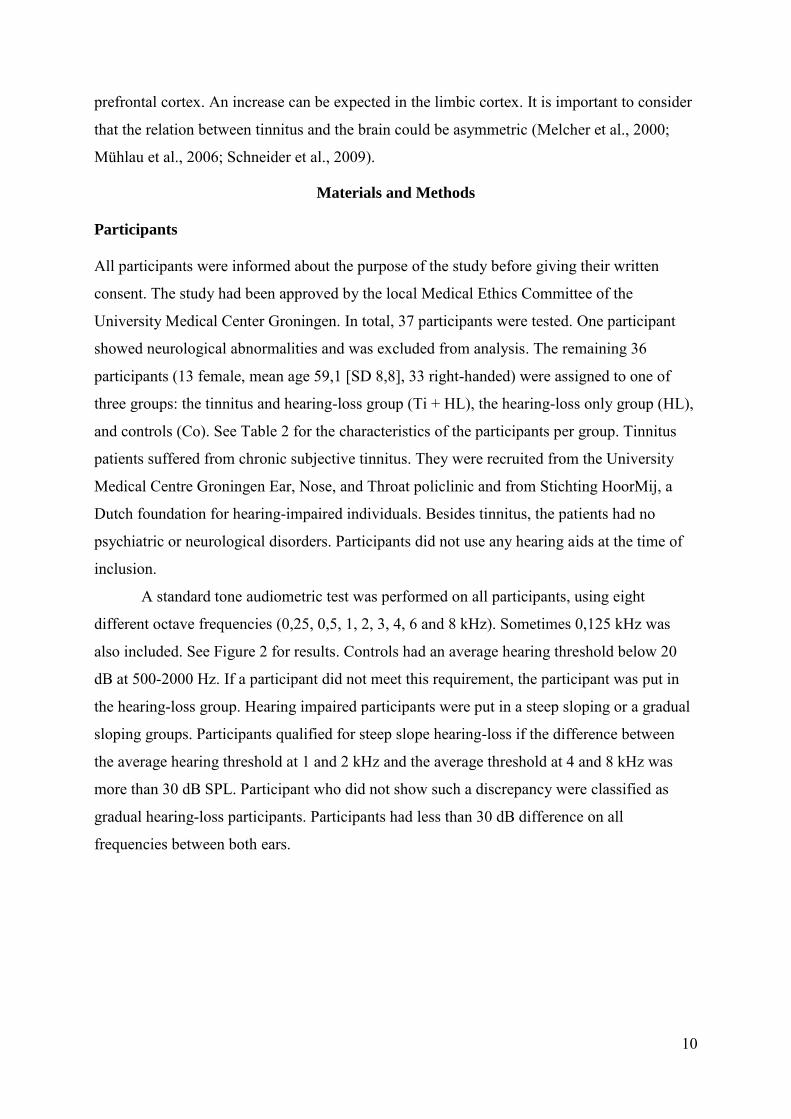
Materials and Methods
Participants
All participants were informed about the purpose of the study before giving their written
consent. The study had been approved by the local Medical Ethics Committee of the
University Medical Center Groningen. In total, 37 participants were tested. One participant
showed neurological abnormalities and was excluded from analysis. The remaining 36
participants (13 female, mean age 59,1 [SD 8,8], 33 right-handed) were assigned to one of
three groups: the tinnitus and hearing-loss group (Ti + HL), the hearing-loss only group (HL),
and controls (Co). See Table 2 for the characteristics of the participants per group. Tinnitus
patients suffered from chronic subjective tinnitus. They were recruited from the University
Medical Centre Groningen Ear, Nose, and Throat policlinic and from Stichting HoorMij, a
Dutch foundation for hearing-impaired individuals. Besides tinnitus, the patients had no
psychiatric or neurological disorders. Participants did not use any hearing aids at the time of
inclusion.
A standard tone audiometric test was performed on all participants, using eight
different octave frequencies (0,25, 0,5, 1, 2, 3, 4, 6 and 8 kHz). Sometimes 0,125 kHz was
also included. See Figure 2 for results. Controls had an average hearing threshold below 20
dB at 500-2000 Hz. If a participant did not meet this requirement, the participant was put in
the hearing-loss group. Hearing impaired participants were put in a steep sloping or a gradual
sloping groups. Participants qualified for steep slope hearing-loss if the difference between
the average hearing threshold at 1 and 2 kHz and the average threshold at 4 and 8 kHz was
more than 30 dB SPL. Participant who did not show such a discrepancy were classified as
gradual hearing-loss participants. Participants had less than 30 dB difference on all
frequencies between both ears.

11
Table 2: Subjects’ characteristics
T + HL (n = 26) HL (n = 4) Control (n = 6)
Age
Mean (SD) 59,7 (7,9) 63,5 (3,9) 53,8 (13,0)
Range 41 - 71 58 – 67 28 – 63
Sex (female) 8 2 3
Handedness (right) 24 4 5
Average overall hearing
threshold in dB SPL
Left ear (SD) 37,6 (33) 16,6 (7,8) 10,7 (7,5)
Right ear (SD) 35,8 (26,3) 20,4 (10,1) 13,3 (13,1)
Figure 2: Mean audiograms for the tinnitus + hearing-loss group (black), hearing-loss group (red), and control group (blue)
Data Acquisition
MRI-scans have been performed using a Philips 3T scanner of the Neuroimaging Center
(NiC) of the University Medical Center Groningen in Groningen which was equipped with a
SENSE transmit/receive head coil. Multiple scans were executed, such as DTI, resting-state,
fMRI (while performing a simple task), and an anatomical scan. The anatomical scan was a 3-
dimensional high-resolution T1-weighted echo scan (160 slices; acquisition duration 614 s;
repetition time (TR) 10,4 ms; echo time (TE) 0 ms; field of view 256 x 160 x 224 mm; matrix
256 x 229). Voxels were resliced to 1,5 x 1,5 x 1,5 mm, which is the result of a consideration
of multiple factors. The relative small sample groups, together with chance of finding much

12
reorganisation on the thalamic level on the one hand, and less reorganisation on the cortical
level on the other, are the reason that this voxel size was chosen (Ergenzinger et al., 1998;
Rauschecker, 1998). This size is not unusual in VBM studies on tinnitus (Langers, 2014).
Participants wore headphones during the scan. The scans were screened by a radiologist.
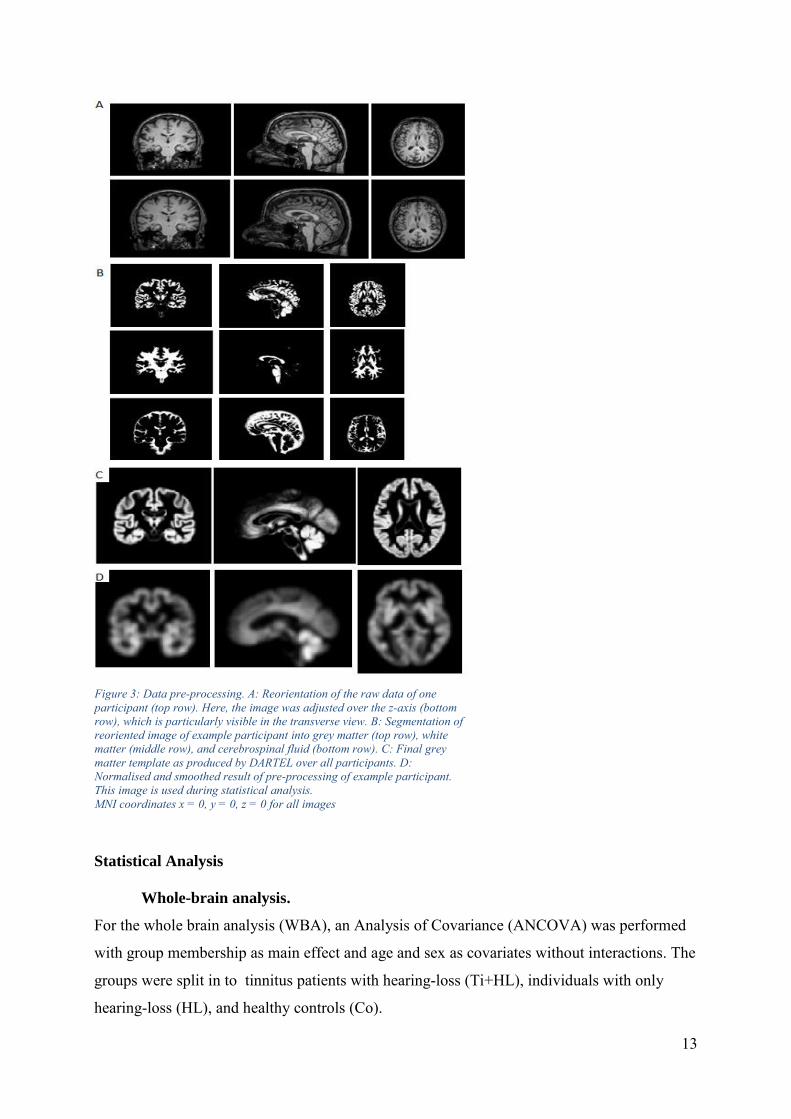
Data Processing
Voxel-based morphometry (VBM) (Ashburner & Friston, 2000; Ashburner, 2015, March 12;
Wright et al., 1995) was performed using SPM12 software package (Statistical Parametric
Mapping; Wellcome Department of Cognitive Neurology, London, UK) running in MATLAB
2016a (MATLAB 2016a, The MathWorks, Inc., Natick, Massachusetts, United States). See
Figure 3 for an overview of the pre-processing. Images were first manually aligned using the
‘Display’ option in SPM if they were skewed (Figure 3A). Images were segmented into grey
matter, white matter, and cerebrospinal fluid using the default tissue probability templates
from SPM12 (Figure 3B). The resulting images are GM probability maps which comprise
voxels with values between 0 and 1 reflecting the likelihood of grey matter at a particular
voxel (Melcher et al., 2013). The DARTEL (Diffeomorphic Anatomical Registration Through
Exponentiated Lie Algebra, Ashburner, 2007) toolbox was used to create grey matter
templates of the obtained grey matter images (Figure 3C). The images were spatially
normalised into the Montreal Neurological Institute (MNI) stereotaxic space (Figure 3D).
This is the data that will be used in the statistical analysis. The size of the reorganised areas
can differ (Ergenzinger et al., 1998; Rauschecker, 1998). It is entirely possible to find both
relatively large and small structural changes. Thus, 8 mm Gaussian FWHM smoothing was
applied as a middle ground. Moreover, this setting has also been used in other VBM studies
on tinnitus (Boyen et al., 2013; Husain et al., 2011; Landgrebe et al., 2009; Melcher et al.,
2013; Mühlau et al., 2006; Schecklmann et al., 2013; Vanneste et al., 2015). Modulation was
applied, to correct for deformation as a result of stretching and compressing the obtained
images to the MNI standard during normalization. Modulation involves scaling by the amount
of contraction, so that the total amount of grey matter in the modulated GM remains the same
as it would be in the original images (Structural Brain Mapping Group, n.d.). This means that
only the amount of grey matter will be taken into consideration during statistical analysis.
This method usually leads to more findings than using unmodulated images when
investigating volumetric differences in GM (see for example Boyen et al., 2013).
13
Statistical Analysis
Whole-brain analysis.
For the whole brain analysis (WBA), an Analysis of Covariance (ANCOVA) was performed
with group membership as main effect and age and sex as covariates without interactions. The
groups were split in to tinnitus patients with hearing-loss (Ti+HL), individuals with only
hearing-loss (HL), and healthy controls (Co).
Figure 3: Data pre-processing. A: Reorientation of the raw data of one
participant (top row). Here, the image was adjusted over the z-axis (bottom
row), which is particularly visible in the transverse view. B: Segmentation of
reoriented image of example participant into grey matter (top row), white
matter (middle row), and cerebrospinal fluid (bottom row). C: Final grey
matter template as produced by DARTEL over all participants. D:
Normalised and smoothed result of pre-processing of example participant.
This image is used during statistical analysis.
MNI coordinates x = 0, y = 0, z = 0 for all images
14
During statistical analysis, images were corrected for total grey matter volume using
proportional scaling. The voxels were thresholded at 0,20 (out of 100) probability of tissue
classification prior to statistical analyses. A voxel contains a probability value indicating the
chance that a voxel is grey matter or not. When this probability is less than 0,20, the voxel is
excluded from the analysis. This procedure prevents spurious findings (Ashburner, 2015,
March 12). Total brain volume (grey + white matter) was used to calculate the global values
in order to estimate the global effects, during whole brain voxel-by-voxel analysis.
As a form of data exploration, confidence thresholds were set to p > 0,001, without
any other form of correction. Later, these results would be used for region of interest analysis.
When the exploration was finished, the whole brain analysis was performed using a Family-
Wise Error (FWE) correction (confidence threshold p < 0,05) to adjust for multiple
comparisons at both voxel- and cluster level. T-contrasts were used to compare the average
GM of two groups with the GM of the remaining group. This is a way to discover similarities
between imbalanced experimental groups. Next, two sample t-tests were performed using the
ANCOVA main effects as an inclusive mask in order to evaluate GM differences separately
between the three subject groups. Again, age and gender were entered as covariates. A
confidence threshold of p < 0.05 FWE corrected was applied as well.
Region-of-interest (ROI) analysis.
For the ROI analysis, the modulated data was examined for various subdivisions of the brain.
The choice of regions of analysis were based on a combination of previous literature (see
Table 1) and outcomes of the uncorrected results of the whole-brain analysis (see Table 3).
The ROIs based on the data exploration were made by entering the peak voxel of a cluster of
more than 50 voxels in the IBASPM 116 collection of WFU_pickatlas (Maldjian, Laurienti,
Burdette, & Kraft, 2003). So-called ‘masks’ were created by picking the resulting area.
Settings were 3D and dilation 1. The mask was then applied to the contrast that previously
showed significant differences in GM volume. In addition to ROIs based on the data
exploration, more ROIs were created based on literature. These ROIs were the primary
auditory cortex / superior temporal cortex (BA 41 & 42), Heschl’s gyrus, the thalamus, the
ventromedial prefrontal cortex (BA 10, 11, 12, 14, 25, & 32), the hippocampus, anterior
cingulate, supramarginal gyrus (BA 40), limbic cortex (BA 35 & 36, also called perirhinal
cortex), frontal areas (BA 8, 9, & 11), and the corpus callosum. Hemispheres were considered
separately, except for the corpus callosum. See Appendix I for all ROIs created for the
analysis.

15
T-contrasts were used to compare the average GM of two groups with the GM of the
remaining group. Two sample t-tests were performed using the ANCOVA main effects as an
inclusive mask. Age and gender were entered as covariates. Then, the mask was added. A
confidence threshold of p < 0.05 FWE corrected was applied to all contrasts to correct for
multiple comparisons.

16
Results
Correlation with age and sex.
In order to find correlations with variables, a multiple regression was performed. This analysis
showed that age slightly correlates with the amount of grey matter at the frontal cortex (T =
3,94; p < 0,001 no correction; peak voxel MNI coordinates ±18, 32, 60), but this did not hold
when family wise error was applied. Nevertheless, other studies have found that age is
strongly associated with the amount of GM (Bartzokis et al., 2001; Good et al., 2002; Raz et
al., 2005; Sullivan, Marsh, Mathalon, Lim, & Pfefferbaum, 1995; Zimmerman et al., 2006).
Gender had a stronger association with amount of grey matter in many areas when no
correction was applied. When FWE was applied, one voxel survived in the temporal area (T =
5,93; p < 0,001 FWE < 0,05; peak voxel MNI coordinates ±38, -5, -18). Age and gender were
used as covariates in further analyses.
Whole-brain Voxel-by-voxel Comparisons
Initially, an exploratory analysis using p>0,001 uncorrected showed differences in grey matter
in many brain areas. See Table 3 for clusters with more than 50 voxels. No significant clusters
of more than 50 voxels were found when contrasting HL + Co > Ti and HL > Ti. Only the Ti
+ Co > HL contrast showed significant differences in the amount of grey matter when a
confidence threshold of p < 0.05 FWE was applied to correct for multiple comparisons. The
averaged tinnitus and control subjects had more grey matter than patients with hearing-loss in
the left superior temporal cortex, in an area that is also called the primary auditory cortex (BA
42, see Figure 4) (T = 6,02, peak voxel p = 0,025 FWE-corrected, k = 4, cluster p = 0,032,
peak voxel MNI coordinates -62 -14 9).

17
Table 3: Voxel-by-voxel comparisons of GM amount obtained from the modulated images. A threshold of p < 0,001
uncorrected was applied as well as an extend threshold (k) of 50 adhering voxels. Brodmann area numbers are specified
besides the general name if this was provided by wfu_Pickatlas.
Contrast Area (Brodmann area) Cluster
size (k)
p-
value
cluster
uncor.
T-value
peak
voxel
p-value
peak
voxel
uncor.
Peak voxel (MNI
coordinates)
Ti > HL +
Co
Middle cingulum left 270 0,065 5,05 < 0,001 -6 -12 36
Superior temporal pole left 444 0,022 4,69 < 0,001 -45 -5 -20
Superior temporal pole
right
365 0,035 4,65 < 0,001 47 3 -18
Lingual cortex left 80 0,296 4,47 < 0,001 -20 -45 -11
Superior frontal cortex left 92 0,263 4,33 < 0,001 -15 -15 54
HL > Ti +
Co
Cerebellum left 114 0,214 3,59 < 0,001 -47 -68 -24
Cerebellum left 64 0,351 3,22 0,001 -32 -81 -27
Co > Ti +
HL
Superior frontal cortex left 82 0,290 5,14 < 0,001 -21 15 45
Lingual cortex left (18) 189 0,116 4,86 < 0,001 -8 -74 -5
Parahippocampal cortex
left
54 0,392 4,68 < 0,001 -17 0 -35
Heschl’s gyrus left (22) 140 0,171 4,60 < 0,001 -56 -11 8
Middle frontal gyrus left
(10)
90 0,268 4,57 < 0,001 -24 45 27
Middle temporal cortex
right
64 0,351 3,98 < 0,001 53 -62 9
Ti + Co >
HL
Superior temporal cortex
(42) left
412 0,027 6,02 < 0,001 -62 -14 9
Middle frontal cortex 440 0,023 5,27 < 0,001 -21 45 26
Lingual gyrus left (18) 635 0,008 5,60 < 0,001 -8 -74 -5
Inferior temporal cortex left 94 0,258 5,13 < 0,001 -50 -38 -26
Middle temporal cortex left 555 0,012 4,74 < 0,001 -44 0 -23
Heschl’s gyrus right (13) 224 0,089 4,59 < 0,001 41 -20 3
Gyrus rectus right 58 0,0375 4,59 < 0,001 6 42 -23
Lingual cortex right 141 0,170 4,42 < 0,001 12 -68 -5
Lingual cortex left (19) 55 0,388 4,32 < 0,001 -18 -47 -11
Superior frontal cortex
right (10)
98 0,249 4,29 < 0,001 26 53 8
Cerebellum left 55 0,388 4,22 < 0,001 -32 3 -35
Superior temporal cortex
right
86 0,279 4,11 < 0,001 54 -36 9
Insula right 81 0,293 3,78 < 0,001 39 -14 15
Ti + HL >
Co
Cerebellum left 50 0,411 3,71 < 0,001 -32 -84 -29
TI > Co Superior temporal pole
right
79 0,254 4,17 < 0,001 39 14 -21
Co > Ti Parahippocampal cortex
left
87 0,232 5,17 < 0,001 -17 0 -35
Ti > HL Superior temporal gyrus
(42) left
232 0,058 5,22 < 0,001 -63 -14 9
Middle frontal cortex left 399 0,017 4,83 < 0,001 -21 47 27
Superior temporal cortex
left
615 0,004 4,79 < 0,001 -47 3 -12
Gyrus rectus right 65 0,294 4,56 < 0,001 6 42 -21
Heschl’s gyrus right (13) 172 0,096 4,39 < 0,001 39 -21 5
Lingual cortex left (19) 58 0,322 4,38 < 0,001 -18 -47 -11
Middle orbital frontal
cortex right
53 0,344 3,67 0,001 8 45 -9

18
HL > Co Cerebellum left 56 0,018 12,88 < 0,001 -44 -69 -29
Co > HL Lingual cortex left 143 0,001 25,97 < 0,001 -8 -77 -5
Middle frontal gyrus left 56 0,018 16,72 < 0,001 -2 44 21
Figure 4: Ti + Co > HL contrast. The red arrow indicates the peak voxel. FWE threshold of p< 0,05 was applied.
Coordinates of peak voxel: -62 -14 9. T = 6,02 p = 0,025.
Region-of-Interest (ROI) Analysis
Several contrasts showed GM differences when a FWE-correction was applied (See Table 4).
No differences in grey matter volume were found when using the contrasts HL > Ti + Co, Ti
+ HL > Co, Co + HL > Ti, Ti > Co, HL > Ti, HL > Co, an Co > HL. Contrary to the whole-
brain analysis, the ROI-analysis showed differences between separate groups. Controls had
more grey matter in the left parahippocampal cortex compared to tinnitus patients with
hearing-loss (see Figure 5) (T=5,17, peak voxel p = 0,005, k = 40, cluster p = 0,015, peak
voxel MNI coordinates -17 0 -35). Furthermore, tinnitus patients had more grey matter than
individuals with hearing-loss in the temporal area (both Heschl’s gyri, left superior temporal
gyrus), frontal areas (left middle frontal cortex, right gyrus rectus), and the limbic cortex (BA
36).

19
Table 4: ROI comparisons of GM amount obtained from the modulated images. A threshold of p < 0,05 FWE-corrected was
applied. Brodmann areas numbers are specified besides the general name if this was reported by wfu_Pickatlas.
Contrast Area (Brodmann area) Cluster
size (k)
p-
value
cluster
FWE-
cor.
T-
value
peak
voxel
p-value
peak
voxel
FWE-cor.
Peak voxel
(MNI
coordinates)
Ti > HL +
Co
Middle cingulum left 76 0,009 5,05 0,007 -6 -12 39
Superior temporal pole left 73 0,010 4,69 0,012 -45 -5 20
Superior temporal pole right 100 0,007 4,65 0,014 47 3 -18
Middle cingulum left 76 0,009 5,05 0,007 -6 -12 36
Lingual cortex left 8 0,034 4,47 0,028 -20 -45 -11
Co > Ti +
HL
Superior frontal cortex left 8 0,032 5,14 0,012 -21 15 45
Lingual cortex left (18) 38 0,016 4,86 0,012 -8 -74 -5
Parahippocampal cortex left 13 0,031 4,68 0,011 -17 0 -35
Heschl’s gyrus left (22) 109 0,010 4,60 0,005 -56 -11 8
Superior frontal gyrus left 8 0,032 5,14 0,012 -21 15 45
Middle frontal gyrus left (10) 3 0,040 4,57 0,043 -24 45 27
Ti + Co >
HL
Superior temporal cortex
(42) left
100 0,006 6,02 0,001 -62 -14 9
Middle frontal cortex 106 0,004 5,27 0,003 -21 45 26
Lingual gyrus left (18) 177 0,002 5,60 0,002 -8 -74 -5
Lingual gyrus left (19) 3 0,041 4,32 0,039 -18 -47 -11
Inferior temporal cortex left 17 0,024 5,13 0,009 -50 -38 -26
Middle temporal cortex left
(20)
2 0,042 4,53 0,034 -51 -6 -24
Middle temporal cortex left 15 0,025 4,74 0,029 -44 0 -23
Heschl’s gyrus right (13) 89 0,012 4,59 0,006 41 -20 3
Rectus right 28 0,024 4,59 0,010 6 42 -23
Lingual cortex right 6 0,036 4,42 0,035 14 -68 -5
Lingual cortex left (19) 3 0,041 4,32 0,039 -18 -47 -11
Lingual cortex left (18) 177 0,002 5,60 0,002 -8 -74 -5
Cerebellum left 2 0,042 4,99 0,014 -50 -39 -27
Insula right 32 0,019 4,59 0,020 41 -20 3
Co > Ti Parahippocampal cortex left 40 0,015 5,17 0,005 -17 0 -35
Ti > HL Superior temporal gyrus (42)
left
55 0,012 5,22 0,004 -63 -14 9
Middle frontal cortex left 1 0,044 4,83 0,040 -21 47 27
Gyrus rectus right 19 0,025 4,56 0,016 6 42 -21
Heschl’s gyrus right (13) 44 0,017 4,39 0,016 39 -21 5
Heschl’s gyrus right (6) 7 0,036 3,87 0,039 53 -6 5
Limbic cortex left (BA 36) 11 0,031 4,63 0,012 -50 -39 -27
Limbic cortex left (BA 36) 4 0,039 4,14 0,034 -20 -45 -11

20
Figure 5: Co > Ti contrast with the left parahippocampal cortex as region of interest. The red arrow points to the peak voxel.
FWE threshold of p< 0,05 was applied. Coordinates of peak voxel: -17 0 -35 T= 5,17 p = 0,005.
Discussion
This study attempted to make a distinction between the amount of grey matter that is
associated with tinnitus, hearing-loss, and normal hearing. Only FWE-corrected findings will
be discussed, as these are more reliable than uncorrected findings.
Differences were expected between tinnitus patients and the control groups in the
ventral medial prefrontal cortex, the nucleus accumbens, the cingulate cortex, the cerebellum,
the left hippocampus, and the primary auditory area. Hearing-loss related decreases were
expected in the frontal gyri, the anterior cingulate, the superior temporal gyrus, and the
prefrontal cortex. An increase was expected in the limbic cortex. A whole-brain analysis
showed that, when averaged, the tinnitus and control subjects had more grey matter than
hearing-impaired individuals in the superior temporal cortex (Figure 4), which is an area
where differences were expected based on previous literature. On the other hand, the averaged
hearing-loss and control subjects do not have more GM than tinnitus subjects. ROI analysis
showed that control subjects have more grey matter in the left parahippocampal cortex than
tinnitus subjects (Figure 5). Tinnitus subjects had more grey matter than the hearing-loss
group in the temporal, frontal, and limbic cortex.
Inefficient Gating System is not Situated in the Limbic Areas
Leaver and colleagues (2011) and Rauschecker and colleagues (2010) propose a
malfunctioning gating system as the cause of the tinnitus signal. They support their hypothesis
by pointing out areas showing an increase in functional activity while simultaneously
displaying a decrease in grey matter volume. This gating area is properly inhibiting the
tinnitus signal in healthy individuals with hearing-loss, but lacks the grey matter needed to
inhibit the tinnitus signal in patients. The key areas are in the thalamus (MGN), the nucleus
accumbens, or in the ventromedial prefrontal cortex. Irrelevant input from these areas ends up

21
in the auditory cortex, where long-term reorganization sets in to establish chronic tinnitus
through Hebbian mechanisms. Leaver and colleagues founded their theory on older studies
that did not include hearing-loss as a variable, while tinnitus is strongly linked to hearing-loss.
This complicates finding the locus (or loci) of the disinhibition by a malfunctioning gate(s).
This may explain why findings are so diverse (Table 1). Melcher et al. (2013), Husain et al.
(2011), Vanneste et al. (2015), and Boyen et al. (2013) have all found differences that were
solely associated to hearing-loss in the frontal and limbic areas of the brain, such as the frontal
gyri, the superior temporal gyrus, the anterior cingulate, and the hypothalamus.
If the tinnitus signal is indeed a result of poor filtering in these gating areas, as Leaver
and colleagues are posing, both control groups should have more grey matter in the thalamus
and less grey matter in the frontal areas and limbic areas, compared to the tinnitus group. This
study found no differences between groups in the thalamus, nucleus accumbens, or the
ventromedial prefrontal cortex. This could mean that a malfunctioning gating system is not
situated here, or that functional change may not lead to structural change (Vanneste et al.,
2015). However, other frontal and limbic differences in GM volume have been identified. The
finding that the left parahippocampal cortex is thinner in tinnitus subjects compared to
normal-hearing controls has not been found in earlier studies, although Landgrebe and
colleagues (2009) found a decrease in GM in the adhering hippocampus. They suggest that
the hippocampus is directly related to the tinnitus pathophysiology. This cannot be concluded
from the present study, as the HL > Ti contrast did not show any results. Boyen and
colleagues (2013) found an increase in GM in the hearing-loss group compared to the tinnitus
group in a cluster that stretches the parahippocampal gyrus and limbic cortex (BA 35 & 36).
The present study, however, found a decrease in GM amount in the hearing-loss group
compared to the tinnitus group in the limbic cortex. The data suggest that normal hearing
controls have the most GM in the limbic system, then the tinnitus patients, and then the
individuals with hearing-loss. This ‘Co > Ti > HL’ finding supports the hypotheses that the
limbic system is at least involved in the pathophysiology of tinnitus, but cannot confirm a
gating mechanism (Jastreboff, 1990). The findings do not suggest that a lack of grey matter in
the limbic system is causing the tinnitus percept (Landgrebe et al., 2009; Leaver et al., 2011;
Mühlau et al., 2006; Rauschecker et al., 2010), because the tinnitus group had no systematic
decrease of GM in a particular limbic area compared to both control groups. The hypothesis
that the (pre-)frontal cortex is involved as a gate, remains a possibility. Note that few voxels
in the middle frontal cortex and rectus gyrus remained after FWE-correction, which makes the
finding not very trustworthy.
22
The ‘Reorganisation Gone Wrong’ Hypothesis
The reorganisation of the cortex in the auditory system is a returning subject in tinnitus
research. Evidence for functional reorganisation of the auditory cortex as a result of tinnitus is
identified by some and not by others (for reviews see Eggermont, 2012; and Langers and De
Kleine, 2016). Langers and De Kleine (2016) point to methodologic differences causing this
disparity. Functional reorganisation is often found in the auditory system, the limbic system,
the frontal lobe, and the cerebellum. Auditory-input is reduced in hearing-impaired
individuals. As the auditory system is no longer activated as it used to be, neurons in the
pathway may lower their activation threshold, and pick up irrelevant activation (Chrostowski
et al., 2011; Dominguez et al., 2006). This is where the reorganisation goes wrong: irrelevant
input is processed as sound. Leaver and colleagues (2011) assume that this irrelevant
activation is sent to the auditory cortex as a result of disinhibition in the frontal and limbic
areas. In the literature, it is often assumed that functional reorganisation is accompanied by
structural reorganisation. The current literature do not explain how functional changes in
tinnitus patients lead to structural changes. Structural findings have also been found in areas
where functional findings have been observed (Table 1; Langers & De Kleine, 2016;
Eggermont, 2012), but this is not always the case (Vanneste et al., 2015).
Again, many studies did not acknowledge hearing-impairment as a cofounding
variable. This is concerning, because changes related to tinnitus could also be related to
hearing-loss. For example, GM differences in the auditory cortex and the right temporal lobe
have also been found in studies on hearing-impairment (Eckert et al., 2012; Lin et al., 2014;
Vanneste et al., 2015). This study attempted to separate hearing-loss effects from tinnitus
effects. In tinnitus patients, brain areas might still be used to process ‘sound’, even if it is not
physically present. In hearing-impaired individuals, these areas might be used for something
else. If functional reorganisation is indeed accompanied by structural organisation, hearing-
impaired individuals should show differences in GM volume compared to tinnitus patients
and controls. A decrease in grey matter volume would be expected in hearing-impaired
individuals, as the auditory cortex is not used as much. Because our tinnitus group also
suffered from hearing-loss, it can be assumed that parts of their auditory system may also be
repurposed for something else. Tinnitus precepts greatly differ, suggesting that there are
differences in the way the functional reorganisation might develop. Structural changes may
therefore be not as severe as in individuals who are only hearing-impaired, but they might still

23
happen. This could be a reason why functional and structural findings differ much: they are
diverse and may be rather small. Another option is that the tinnitus-percept is directly causing
reorganisation in the auditory system (Jastreboff, 1990). After all, the patient group suffers
from continuous tinnitus affecting their quality of life, while being hearing-impaired at the
same time. This is in contrast to normal-hearing and hearing-impaired individuals, who do not
experience one strong sound.
It was found that individuals with hearing-loss have less grey matter than the averaged
tinnitus and control group in the left auditory cortex (WBA) and that individuals with tinnitus
and hearing-loss have more grey matter in the left superior temporal gyrus and right Heschl’s
gyrus (ROI-analysis). These observations are in line with the first hypothesis: the hearing-loss
group is different from the other groups. This suggests that the functional reorganisation due
to hearing-loss in the auditory cortex was accompanied by structural changes. The tinnitus
group and control group do not significantly differ from each other. Perhaps neurons in the
auditory cortex of tinnitus patients remain more active after diminished input and might be
indeed producing or processing the tinnitus percept.
Furthermore, individuals with tinnitus and hearing-loss have more grey matter in the
limbic cortex and the gyrus rectus (ROI-analysis) than individual with only hearing-loss. We
have already concluded that the hearing-loss group shows the strongest decrease in GM
volume in the limbic system, then the tinnitus-group, and then the control group. It could be
that structural reorganisation in the limbic systems was again most pronounced in the hearing-
loss group. Compared to the controls, some reorganisation might have occured in the tinnitus
group: enough to be found in a ROI-analysis, but not enough the be found when the whole
brain is considered. The finding that the tinnitus group has more GM than the hearing-loss
group in the gyrus rectus is difficult to place in context of the literature. Hearing-loss related
decreases in GM in the prefrontal cortex have been observed (Husain et al., 2011; Melcher et
al., 2013), as well as decreases in GM in hearing-impaired individuals (regardless of having
tinnitus) compared to controls (Boyen et al., 2013). Hearing-related differences in the gyrus
rectus have not yet been reported in the literature, but increases in GM volume in the gyrus
rectus have been associated with depression (Ballmaier et al., 2004; Elderkin‐Thompson,
Hellemann, Pham, & Kumar, 2009), which is not uncommon in tinnitus patients (de Geus et
al., 2007; Vasic et al., 2008).
Interestingly, no GM differences were found between the control group and the
hearing-loss group. This is strange, because these differences have been found in earlier
studies. This would provide further support for the idea that structural reorganisation is the
24
strongest in individuals with hearing-loss. Perhaps in this study the unequal group sizes are
the cause of this. The literature often implies that differences are small, which signifies a need
for large sample groups. The present study only had four participants with hearing-loss and
six controls.
25
Technical considerations
There are a few important remarks to be made about the study. First, the participant
group was severely imbalanced. Group sizes usually start at about 10 participants in each
group (see Table 1). Small groups might result in spurious findings (type I errors) or results
without enough statistical power (type II errors). Several researchers have stated that
individual differences in the auditory cortex are possibly too fine or too variable for VBM to
discover any volumetric differences (Mühlau et al., 2006; Schneider et al., 2009; Vanneste et
al., 2015), but Melcher et al. (2013) reject this. They acknowledge the possibility that the
sample of tinnitus patients used for their study and the studies by Mühlau et al. (2006) and
Landgrebe et al. (2009) could be too different to find reliable grey matter decrements. This
problem is also very possible for this study, because the sample groups were small.
Furthermore, although the mean age of the Ti + HL and the HL groups are not very different,
the range over which this has been calculated is larger in the tinnitus group. The control group
is relatively younger. Age-based GM differences have been found in the frontal and temporal
lobules (Bartzokis et al., 2001; Sullivan et al., 1995). This could be the reason why the Ti +
Co > HL contrast showed differences in GM volume, but analysis of the separate groups did
not. The mean age of Ti and Co combined is about five years younger than the mean age of
the HL group. However, the standard deviations overlap, so it remains the question whether
the difference in volume is due to age or to reorganisation. The correlational analysis showed
that gender is also an important factor, which is consistent with earlier findings (Good et al.,
2002). The study by Good and others (2002) found significant volumetric sex differences in
areas such as the central and temporal sulcus, the cingulate and Heschl’s gyrus, frontal areas
(more in females), the temporal lobe, the limbic cortex, and the cerebellum (more in males).
These are areas that have also been found in this study. Thus, although adding age and sex as
a covariate already helps to distinguish tinnitus effects from other cofounding factors, this
analysis should be repeated when participant groups are more balanced in age and gender.
It is somewhat peculiar that on one hand the decrease in GM is situated in the left
superior temporal cortex, and on the other hand in the right Heschl’s gyrus. These areas are
almost identical. This difference could be a result of the classification system used by
wfu_Pickatlas.
The Family-Wise Error (FWE) correction provided by SPM to correct for multiple
comparisons is based on a Bonferroni-correction (Bonferroni, 1936; Dunn, 1961). In a

26
Bonferroni-procedure, the p-value threshold α (in this case 0,05) is divided by the number of
tests that are done on a data set. This corrects for false positives (type I errors). The correction
tends to be too strict when applied to a large dataset, such as a whole-brain analysis that
examines all voxels, because the resulting threshold after correction is very small. The
corrected whole-brain analysis produced only a small cluster in the Ti + Co > HL contrast.
This contrast may yield a larger cluster when a more appropriate correction is applied. Other
clusters may survive too. An alternative is to control for the False Discovery Rate (FDR)
instead, but this option is not provided by SPM. This problem is less present in the ROI-
analyses cluster, as ROIs are smaller subsets of the data.
Conclusions and Further Directions
This study attempted to add to the literature of tinnitus-related grey matter changes and tried
to disentangle the relationship between tinnitus and hearing-loss. Structural changes in the
temporal lobe seem to be associated with hearing-loss, and might be a result of structural
reorganisation due to diminished auditory input. The tinnitus group is not different from the
control group, suggesting that the tinnitus percept may be processed as normal auditory input
(Chrostowski et al., 2011; Dominguez et al., 2006; Jastreboff, 1990). Furthermore, findings in
the limbic system suggest that normal-hearing individuals have the most grey matter here,
then tinnitus patients, and then hearing-impaired individuals. This suggest that structural
reorganisation is the strongest in hearing-impaired individuals, but also a present in tinnitus
patients. No evidence was found for a malfunctioning gating system in the limbic system
(Landgrebe et al., 2009; Mühlau et al., 2006), but the limbic system is probably involved in
the pathophysiology of tinnitus. The frontal findings are difficult to interpret. The (pre)frontal
area could be the malfunctioning part of gating mechanism (Leaver et al., 2011; Rauschecker
et al., 2010) or, more likely, be a reflection of the negative emotions accompanying tinnitus
(Ballmaier et al., 2004; de Geus et al., 2007; Elderkin‐Thompson et al., 2009; Vasic et al.,
2008).
As mentioned in the introduction, it is ambiguous whether findings in the
hippocampus, auditory cortex, and now also the frontal cortex, can be attributed to the tinnitus
signal or to tinnitus distress (Boyen et al., 2013; Landgrebe et al., 2009; Schecklmann et al.,
2013; Vanneste et al., 2015). It is known that tinnitus patients have higher stress-levels that
the healthy population (Crönlein et al., 2007). Emotion-related areas are mainly situated in the
limbic system, where this study has found differences between tinnitus patients and controls.
Note that Schecklmann and colleagues (2013) regard tinnitus duration equal to tinnitus

27
distress, and mention the frontal, temporal, and parietal areas, cingulate cortex, insula, (para-
)hippocampal areas, and the amygdala as areas associated with tinnitus distress. This may
suggest that the findings in this study are stress-related. However, the studies that support this
claim do not make a clear distinction between tinnitus signal and tinnitus distress when
presenting their findings. The present study has not done so either. An analysis within the
tinnitus-group may shed a light on this. Additionally, (f)MRI-studies on tinnitus should
include tinnitus distress as a variable in the future, in particular when studying the limbic
system. This might even be possible for this study in a later stage. Participants filled out the
Tinnitus Handicap Inventory (THI) (Newman, Jacobson, & Spitzer, 1996), the Tinnitus
Questionnaire (TQ) (Goebel & Hiller, 1994; Meeus, Blaivie, & Van de Heyning, 2007), and
the Tinnitus Reaction Questionnaire (TRQ) (Wilson, Henry, Bowen, & Haralambous, 1991).
The scores can be analysed and related to the findings of this study. Also, in addition to an
anatomical scan, an fMRI-scan was made during the scanning session. During this scan,
participants were asked to indicate the valence of several images from the International
Affective Picture System (IAPS) (Lang, Bradley, & Cuthbert, 1999) as either positive,
negative, or neutral. Although this is a coarse measurement of general emotional state, the
idea that tinnitus and negative emotions are connected could be further strengthened by
investigating the outcome of this task. For example, tinnitus patients could rate images of
neutral objects as negative a bit more often.
This study assumes that functional changes are accompanied by structural changes,
although other studies have found otherwise (Vanneste et al., 2015). A combination of
structural and functional imaging of tinnitus-patients may clarify this matter. Another option
is to investigate brain networks related to tinnitus to investigate functional and structural
changes together (De Ridder et al., 2014; Eggermont, 2012; Leaver et al., 2011). This makes
it possible to literally connect structural and functional findings in the frontal, temporal, and
limbic areas, while also detangling the relationship between tinnitus and hearing-loss in the
brain.

28
References
References
Aldhafeeri, F. M., Mackenzie, I., Kay, T., Alghamdi, J., & Sluming, V. (2012). Regional
brain responses to pleasant and unpleasant IAPS pictures: Different networks.
Neuroscience Letters, 512(2), 94-98.
Arnold, W., Bartenstein, P., Oestreicher, E., Römer, W., & Schwaiger, M. (1996). Focal
metabolic activation in the predominant left auditory cortex in patients suffering from
tinnitus: A PET study with [18F] deoxyglucose. Orl, 58(4), 195-199.
Ashburner, J. (2007). A fast diffeomorphic image registration algorithm. NeuroImage, 38(1),
95-113.
Ashburner, J. (2015, March 12). VBM tutorial
Ashburner, J., & Friston, K. J. (2000). Voxel-based morphometry—the methods.
NeuroImage, 11(6), 805-821.
Baguley, D. M. (2002). Mechanisms of tinnitus. British Medical Bulletin, 63, 195-212.
Ballmaier, M., Toga, A. W., Blanton, R. E., Sowell, E. R., Lavretsky, H., Peterson, J., . . .
Kumar, A. (2004). Anterior cingulate, gyrus rectus, and orbitofrontal abnormalities in
elderly depressed patients: An MRI-based parcellation of the prefrontal cortex. American
Journal of Psychiatry, 161(1), 99-108.
Bartzokis, G., Beckson, M., Lu, P. H., Nuechterlein, K. H., Edwards, N., & Mintz, J. (2001).
Age-related changes in frontal and temporal lobe volumes in men: A magnetic resonance
imaging study. Archives of General Psychiatry, 58(5), 461-465.
Blood, A. J., Zatorre, R. J., Bermudez, P., & Evans, A. C. (1999). Emotional responses to
pleasant and unpleasant music correlate with activity in paralimbic brain regions. Nature
Neuroscience, 2(4), 382-387.
Bonferroni, C. E. (1936). Teoria statistica delle classi e calcolo delle probabilita Libreria
internazionale Seeber.
29
Boyen, K., Langers, D. R., de Kleine, E., & van Dijk, P. (2013). Gray matter in the brain:
Differences associated with tinnitus and hearing loss. Hearing Research, 295, 67-78.
Chrostowski, M., Yang, L., Wilson, H. R., Bruce, I. C., & Becker, S. (2011). Can homeostatic
plasticity in deafferented primary auditory cortex lead to travelling waves of excitation?
Journal of Computational Neuroscience, 30(2), 279-299.
Crönlein, T., Langguth, B., Geisler, P., & Hajak, G. (2007). Tinnitus and insomnia. Progress
in Brain Research, 166, 227-233.
de Geus, E. J., van’t Ent, D., Wolfensberger, S. P., Heutink, P., Hoogendijk, W. J., Boomsma,
D. I., & Veltman, D. J. (2007). Intrapair differences in hippocampal volume in
monozygotic twins discordant for the risk for anxiety and depression. Biological
Psychiatry, 61(9), 1062-1071.
De Ridder, D., Vanneste, S., Weisz, N., Londero, A., Schlee, W., Elgoyhen, A. B., &
Langguth, B. (2014). An integrative model of auditory phantom perception: Tinnitus as a
unified percept of interacting separable subnetworks. Neuroscience & Biobehavioral
Reviews, 44, 16-32.
Dominguez, M., Becker, S., Bruce, I., & Read, H. (2006). A spiking neuron model of cortical
correlates of sensorineural hearing loss: Spontaneous firing, synchrony, and tinnitus.
Neural Computation, 18(12), 2942-2958.
Dunn, O. J. (1961). Multiple comparisons among means. Journal of the American Statistical
Association, 56(293), 52-64.
Eckert, M. A., Cute, S. L., Vaden Jr, K. I., Kuchinsky, S. E., & Dubno, J. R. (2012). Auditory
cortex signs of age-related hearing loss. Journal of the Association for Research in
Otolaryngology, 13(5), 703-713.
Eggermont, J. J. (2007). Correlated neural activity as the driving force for functional changes
in auditory cortex. Hearing Research, 229(1), 69-80.
Eggermont, J. J. (2012). The neuroscience of tinnitus OUP Oxford.
30
Eggermont, J. J., & Roberts, L. E. (2004). The neuroscience of tinnitus. Trends in
Neurosciences, 27(11), 676-682.
Elderkin‐Thompson, V., Hellemann, G., Pham, D., & Kumar, A. (2009). Prefrontal brain
morphology and executive function in healthy and depressed elderly. International
Journal of Geriatric Psychiatry, 24(5), 459-468.
Engineer, N. D., Riley, J. R., Seale, J. D., Vrana, W. A., Shetake, J. A., Sudanagunta, S. P., . .
. Kilgard, M. P. (2011). Reversing pathological neural activity using targeted plasticity.
Nature, 470(7332), 101-104.
Ergenzinger, E., Glasier, M., Hahm, J., & Pons, T. (1998). Cortically induced thalamic
plasticity in the primate somatosensory system. Nature Neuroscience, 1(3), 226-229.
Flor, H., Birbaumer, N., & Turk, D. C. (1990). The psychobiology of chronic pain. Advances
in Behaviour Research and Therapy, 12(2), 47-84.
Giraud, A. L., Chery-Croze, S., Fischer, G., Fischer, C., Vighetto, A., Gregoire, M., . . .
Collet, L. (1999). A selective imaging of tinnitus. Neuroreport, 10(1), 1-5.
Goebel, G., & Hiller, W. (1994). The tinnitus questionnaire. A standard instrument for
grading the degree of tinnitus. results of a multicenter study with the tinnitus
questionnaire. [Tinnitus-Fragebogen (TF). Standardinstrument zur Graduierung des
Tinnitusschweregrades. Ergebnisse einer Multicenterstudie mit dem Tinnitus-Fragebogen
(TF)] Hno, 42(3), 166-172.
Good, C. D., Johnsrude, I. S., Ashburner, J., Henson, R. N., Fristen, K., & Frackowiak, R. S.
(2002). A voxel-based morphometric study of ageing in 465 normal adult human brains.
Biomedical Imaging, 2002. 5th IEEE EMBS International Summer School On, 16 pp.
Hebb, D. O. (2005). The organization of behavior: A neuropsychological theory Psychology
Press.
Hoffman, H. J., & Reed, G. W. (2004). Epidemiology of tinnitus. Tinnitus: Theory and
Management, , 16-41.

31
Husain, F. T., Medina, R. E., Davis, C. W., Szymko-Bennett, Y., Simonyan, K., Pajor, N. M.,
& Horwitz, B. (2011). Neuroanatomical changes due to hearing loss and chronic tinnitus:
A combined VBM and DTI study. Brain Research, 1369, 74-88.
Jastreboff, P. J. (1990). Phantom auditory perception (tinnitus): Mechanisms of generation
and perception. Neuroscience Research, 8(4), 221-254.
Landgrebe, M., Langguth, B., Rosengarth, K., Braun, S., Koch, A., Kleinjung, T., . . . Hajak,
G. (2009). Structural brain changes in tinnitus: Grey matter decrease in auditory and non-
auditory brain areas. NeuroImage, 46(1), 213-218.
Lang, P. J., Bradley, M. M., & Cuthbert, B. N. (1999). International affective picture system
(IAPS): Technical manual and affective ratings. Gainesville, FL: The Center for
Research in Psychophysiology, University of Florida,
Langers, D. R., de Kleine, E., & van Dijk, P. (2012). Tinnitus does not require macroscopic
tonotopic map reorganization. Front.Syst.Neurosci, 6(2)
Langers, D. R. M. (2014). Assessment of tonotopically organised subdivisions in human
auditory cortex using volumetric and surface‐based cortical alignments. Human Brain
Mapping, 35(4), 1544-1561.
Langers, D. R. M., & de Kleine, E. (2016). Tinnitus neurophysiology according to structural
and functional magnetic resonance imaging. In A. T. Cacace, E. de Kleine, A. G. Holt &
P. van Dijk (Eds.), Scientific foundations of audiology: Perspectives from physics,
biology, modeling, and medicine. (pp. 351-369). San Diego, CA: : Plural Publishing, Inc.
Lanting, C., De Kleine, E., & Van Dijk, P. (2009). Neural activity underlying tinnitus
generation: Results from PET and fMRI. Hearing Research, 255(1), 1-13.
Leaver, A. M., Renier, L., Chevillet, M. A., Morgan, S., Kim, H. J., & Rauschecker, J. P.
(2011). Dysregulation of limbic and auditory networks in tinnitus. Neuron, 69(1), 33-43.
Leaver, A. M., Seydell-Greenwald, A., Turesky, T. K., Morgan, S., Kim, H. J., &
Rauschecker, J. P. (2012). Cortico-limbic morphology separates tinnitus from tinnitus
distress. Frontiers in Systems Neuroscience, 6, 21. doi:10.3389/fnsys.2012.00021 [doi]

32
Levine, R. A. (1999). Somatic (craniocervical) tinnitus and the dorsal cochlear nucleus
hypothesis. American Journal of Otolaryngology, 20(6), 351-362.
Lin, F., Ferrucci, L., An, Y., Goh, J., Doshi, J., Metter, E., . . . Resnick, S. M. (2014).
Association of hearing impairment with brain volume changes in older adults.
NeuroImage, 90, 84-92.
Lockwood, A. H., Salvi, R. J., & Burkard, R. F. (2002). Tinnitus. New England Journal of
Medicine, 347(12), 904-910.
Lockwood, A. H., Salvi, R. J., Coad, M. L., Towsley, M. L., Wack, D. S., & Murphy, B. W.
(1998). The functional neuroanatomy of tinnitus: Evidence for limbic system links and
neural plasticity. Neurology, 50(1), 114-120.
Maldjian, J. A., Laurienti, P. J., Burdette, J. B., & Kraft, R. A. (2003). Automated method for
neuroanatomic and cytoarchitectonic atlas-based interrogation of fMRI data sets.
NeuroImage, 19, 1233-1239.
Meeus, O., Blaivie, C., & Van de Heyning, P. (2007). Validation of the dutch and the french
version of the tinnitus questionnaire. B-Ent, 3 Suppl 7, 11-17.
Melcher, J. R., Knudson, I. M., & Levine, R. A. (2013). Subcallosal brain structure:
Correlation with hearing threshold at supra-clinical frequencies (> 8 kHz), but not with
tinnitus. Hearing Research, 295, 79-86.
Melcher, J. R., Sigalovsky, I. S., Guinan, J. J.,Jr, & Levine, R. A. (2000). Lateralized tinnitus
studied with functional magnetic resonance imaging: Abnormal inferior colliculus
activation. Journal of Neurophysiology, 83(2), 1058-1072.
Mirz, F., Pedersen, C. B., Ishizu, K., Johannsen, P., Ovesen, T., StÖdkilde-JÖrgensen, H., &
Gjedde, A. (1999). Positron emission tomography of cortical centers of tinnitus. Hearing
Research, 134(1), 133-144.
Mühlau, M., Rauschecker, J., Oestreicher, E., Gaser, C., Röttinger, M., Wohlschläger, A., . . .
Sander, D. (2006). Structural brain changes in tinnitus. Cerebral Cortex, 16(9), 1283-
1288.

33
Muhlnickel, W., Elbert, T., Taub, E., & Flor, H. (1998). Reorganization of auditory cortex in
tinnitus. Proceedings of the National Academy of Sciences of the United States of
America, 95(17), 10340-10343.
Newman, C. W., Jacobson, G. P., & Spitzer, J. B. (1996). Development of the tinnitus
handicap inventory. Archives of Otolaryngology–Head & Neck Surgery, 122(2), 143-148.
Nicolas-Puel, C., Akbaraly, T., Lloyd, R., Berr, C., Uziel, A., Rebillard, G., & Puel, J. (2006).
Characteristics of tinnitus in a population of 555 patients: Specificities of tinnitus
induced by noise trauma. International Tinnitus Journal, 12(1), 64.
Pantev, C., Bertrand, O., Eulitz, C., Verkindt, C., Hampson, S., Schuierer, G., & Elbert, T.
(1995). Specific tonotopic organizations of different areas of the human auditory cortex
revealed by simultaneous magnetic and electric recordings. Electroencephalography and
Clinical Neurophysiology, 94(1), 26-40.
Rauschecker, J. P. (1998). Cortical control of the thalamus: Top-down processing and
plasticity. Nature Neuroscience, 1(3), 179-180.
Rauschecker, J. P. (1999). Auditory cortical plasticity: A comparison with other sensory
systems. Trends in Neurosciences, 22(2), 74-80.
Rauschecker, J. P., Leaver, A. M., & Mühlau, M. (2010). Tuning out the noise: Limbic-
auditory interactions in tinnitus. Neuron, 66(6), 819-826.
Raz, N., Lindenberger, U., Rodrigue, K. M., Kennedy, K. M., Head, D., Williamson, A., . . .
Acker, J. D. (2005). Regional brain changes in aging healthy adults: General trends,
individual differences and modifiers. Cerebral Cortex (New York, N.Y.: 1991), 15(11),
1676-1689. doi:bhi044 [pii]
Riemann, D., Voderholzer, U., Spiegelhalder, K., Hornyak, M., Buysse, D. J., Nissen, C., . . .
Feige, B. (2007). Chronic insomnia and MRI-measured hippocampal volumes: A pilot
study. Sleep-New York then Westchester-, 30(8), 955.
Romani, G. L., Williamson, S. J., & Kaufman, L. (1975). Tonotopic organization of the
human auditory cortex. Psychiatry, 132, 650.

34
Schaette, R., & Kempter, R. (2006). Development of tinnitus‐related neuronal hyperactivity
through homeostatic plasticity after hearing loss: A computational model. European
Journal of Neuroscience, 23(11), 3124-3138.
Schecklmann, M., Lehner, A., Poeppl, T. B., Kreuzer, P. M., Rupprecht, R., Rackl, J., . . .
Langguth, B. (2013). Auditory cortex is implicated in tinnitus distress: A voxel-based
morphometry study. Brain Structure and Function, 218(4), 1061-1070.
Schneider, P., Andermann, M., Wengenroth, M., Goebel, R., Flor, H., Rupp, A., & Diesch, E.
(2009). Reduced volume of heschl's gyrus in tinnitus. NeuroImage, 45(3), 927-939.
Stouffer, J., & Tyler, R. S. (1990). Characterization of tinnitus by tinnitus patients. Journal of
Speech and Hearing Disorders, 55(3), 439-453.
Structural Brain Mapping Group.Modulation. Retrieved from http://www.neuro.uni-
jena.de/vbm/segmentation/modulation/
Suga, N., & Ma, X. (2003). Multiparametric corticofugal modulation and plasticity in the
auditory system. Nature Reviews Neuroscience, 4(10), 783-794.
Sullivan, E. V., Marsh, L., Mathalon, D. H., Lim, K. O., & Pfefferbaum, A. (1995). Age-
related decline in MRI volumes of temporal lobe gray matter but not hippocampus.
Neurobiology of Aging, 16(4), 591-606.
Vanneste, S., Van De Heyning, P., & De Ridder, D. (2015). Tinnitus: A large VBM-EEG
correlational study. PloS One, 10(3), e0115122.
Vasic, N., Walter, H., Höse, A., & Wolf, R. C. (2008). Gray matter reduction associated with
psychopathology and cognitive dysfunction in unipolar depression: A voxel-based
morphometry study. Journal of Affective Disorders, 109(1), 107-116.
Wilson, P. H., Henry, J., Bowen, M., & Haralambous, G. (1991). Tinnitus reaction
QuestionnairePsychometric properties of a measure of distress associated with tinnitus.
Journal of Speech, Language, and Hearing Research, 34(1), 197-201.

35
Wright, I., McGuire, P., Poline, J., Travere, J., Murray, R., Frith, C., . . . Friston, K. (1995). A
voxel-based method for the statistical analysis of gray and white matter density applied to
schizophrenia. NeuroImage, 2(4), 244-252.
Zacharek, M. A., Kaltenbach, J. A., Mathog, T. A., & Zhang, J. (2002). Effects of cochlear
ablation on noise induced hyperactivity in the hamster dorsal cochlear nucleus:
Implications for the origin of noise induced tinnitus. Hearing Research, 172(1), 137-144.
Zald, D. H., & Pardo, J. V. (2002). The neural correlates of aversive auditory stimulation.
NeuroImage, 16(3), 746-753.
Zimmerman, M. E., Brickman, A. M., Paul, R. H., Grieve, S. M., Tate, D. F., Gunstad, J., . . .
Clark, C. R. (2006). The relationship between frontal gray matter volume and cognition
varies across the healthy adult lifespan. The American Journal of Geriatric Psychiatry,
14(10), 823-833.

36
Appendix I
List of all Regions of Interest that were considered. Names were defined by WFU_Pickatlas
IBASPM 116 in SPM. Hemispheres were analysed separately, expect the corpus callosum.
BA = Brodmann area, L = left, R = right
Name Hemisphere
Anterior Cingulate L & R
BA 8 + 9 +11 L & R
BA 10 + 11 + 12 + 14 + 25 + 32 L & R
BA 18 L
BA 35 L
Ba 35 + 36 L & R
BA 36 L
BA 41 L & R
BA 41 + 42 L & R
Cerebellum (crus) L & R
Corpus callosum -
Heschl’s gyrus L & R
Hippocampus L & R
Inferior temporal cortex L
Insula R
Lingual cortex L & R
Middle temporal cortex L & R
Middle cingulum cortex L
Middle frontal cortex L
Middle orbitofrontal cortex R
Parahippocampal cortex L
Rectus cortex R
Superior temporal cortex L
Superior frontal cortex L & R
37
Superior temporal pole L & R
Supramarginal gyrus L & R
Thalamus L & R

38
Afterword
I would like to thank my supervisors Elouise Koops, MSc, and prof. dr. Pim van Dijk for their
help with this project. I have had new experiences and learned about exciting topics and
techniques that were previously unknown to me. Furthermore, I want to thank the
NeuroImaging Center for help with the data acquisition and analysis. I’d like to thank the
scan-operators in particular for protecting the welfare of the participants. I would also like to
thank the research section of the Department of Otorhinolaryngology at the University
Medical Center Groningen for their support.