structural damage to the corticospinal tract correlates ... · imaging and tractography based on...
TRANSCRIPT

www.elsevier.com/locate/ynimg
NeuroImage 39 (2008) 1370–1382Structural damage to the corticospinal tract correlates with bilateralsensorimotor cortex reorganization in stroke patients
Judith D. Schaechter,⁎ Katherine L. Perdue, and Ruopeng Wang
MGH/MIT/HMS Athinoula A. Martinos Center for Biomedical Imaging, Charlestown, MADepartment of Radiology, Harvard Medical School, Boston, MA, USA
Received 29 June 2007; revised 26 September 2007; accepted 28 September 2007Available online 16 October 2007
Damage to the corticospinal tract (CST) in stroke patients has beenassociated with functional reorganization in the ipsilesional andcontralesional sensorimotor cortices. However, it is unknown whethera quantitative relationship exists between the extent of structuraldamage to the CST and functional reorganization in stroke patients.The purpose of the current study was to examine the relationshipbetween structural CST damage and motor task-related corticalactivity in chronic hemiparetic stroke patients. In 10 chronichemiparetic stroke patients with heterogeneous lesions, CST damagewas quantified using conventional structural magnetic resonanceimaging and tractography based on diffusion tensor imaging. Corticalactivity was measured using functional magnetic resonance imagingduring repetitive flexion/extension movements of the digits. We foundthat the two measures of CST damage were strongly correlated.Moreover, greater CST damage was significantly and linearlycorrelated with increased activation during affected hand movementin the hand area of the contralesional primary sensorimotor cortex(M1/S1) and in the ipsilesional M1/S1 ventral to the hand area. To ourknowledge, this is the first demonstration of a quantitative relationshipbetween the extent of structural damage to the CST and functionalreorganization in stroke patients. This relationship was observed instroke patients with heterogeneous lesions, suggesting that CSTdamage is a factor relevant to the variation in functional reorganizationin the clinical population.© 2007 Elsevier Inc. All rights reserved.
Damage to the primary motor cortex (M1) and/or its efferentsthat travel along the corticospinal tract (CST) impairs motorperformance of the digits (Hepp-Reymond and Wiesendanger,1972; Wenzelburger et al., 2005). Recovery of motor skill afterfocal damage to the M1 or CST has been shown to be paralleled byfunctional reorganization in intact sensorimotor cortices of theipsilesional and contralesional hemispheres (Frost et al., 2003;
* Corresponding author. MGH/MIT/HMS Athinoula A. Martinos Centerfor Biomedical Imaging, 13th Street, Building 149, Room 2301, Charles-town, MA 02129, USA. Fax: +1 617 726 7422.
E-mail address: [email protected] (J.D. Schaechter).Available online on ScienceDirect (www.sciencedirect.com).
1053-8119/$ - see front matter © 2007 Elsevier Inc. All rights reserved.doi:10.1016/j.neuroimage.2007.09.071
Gerloff et al., 2006; Jaillard et al., 2005; Lotze et al., 2006;Loubinoux et al., 2003; Nudo and Milliken, 1996; Tombari et al.,2004; Weiller et al., 1993). Animal studies have shown that theextent of focal damage to the M1 results in a proportionate level offunctional reorganization in remote cortices (Biernaskie et al.,2005; Dancause et al., 2006; Frost et al., 2003). A few animal andpatient studies have explicitly demonstrated that functionalreorganization in remote sensorimotor cortices after focal damageto the M1 or CST is involved in compensating for the lesion-induced deficits in motor behavior (Biernaskie et al., 2005;Fridman et al., 2004; Frost et al., 2003; Lotze et al., 2006).
The lesion in hemiparetic stroke patients, however, is typicallynot limited to the M1 or CST. Rather, the location and size of thelesion among patients are generally quite heterogeneous. Parallel-ing this lesion heterogeneity, patterns of functional reorganizationamong hemiparetic stroke patients tend to vary greatly. One factorshown to influence the pattern of functional reorganization inhemiparetic stroke patients is whether the M1 was spared ordamaged; a stroke involving damage to the M1 has been associatedwith greater enhancement of motor task-related functional activityin the contralesional M1 (Feydy et al., 2002; Stinear et al., 2007).In hemiparetic stroke patients with heterogenous subcorticallesions, the degree of loss in the functional integrity of thecorticospinal system, measured using transcranial magneticstimulation (TMS) that tests the composite excitability of severalelements of the descending motor system (e.g., cortical circuitry,corticospinal tract, spinal circuitry), has been shown to becorrelated with increased motor task-related activity in severalsensorimotor cortices of the ipsilesional and contralesional hemi-spheres (Ward et al., 2006). Together, these findings suggest thatamidst the variability in lesion location and size among hemipareticstroke patients, the extent of functional reorganization in ipsile-sional and contralesional hemispheres relates to damage of keycomponents of the descending motor system (i.e., M1 and CST).To our knowledge, however, no study has examined whether thereexists a quantitative relationship between the extent of structuraldamage to the CST and motor task-related functional reorganiza-tion in hemiparetic stroke patients. Therefore, the purpose of thecurrent study was to examine the relationship between the extent of

1371J.D. Schaechter et al. / NeuroImage 39 (2008) 1370–1382
structural damage to the CST and motor task-induced corticalactivity in chronic hemiparetic stroke patients with variable lesionsize and location.
To accomplish our goal, structural magnetic resonance imaging(MRI) and functional MRI (fMRI) were conducted in a cohort ofchronic hemiparetic stroke patients with heterogeneous lesions.The extent of structural damage of the CST was quantified usingtwo approaches. One approach used morphometry of the cerebralpeduncles based on conventional structural magnetic resonanceimages. The ipsilesional cerebral peduncle of hemiparetic strokepatients atrophies over time due to Wallerian degeneration of theCST, and this atrophy can be detected with structural imaging(Feydy et al., 2002; Kuhn et al., 1989; Stovring and Fernando,1983; Warabi et al., 1987, 1990).
The second approach for quantifying the extent of structuraldamage of the CST employed diffusion tensor imaging (DTI), anMRI technology that measures the random diffusion of watermolecules (Basser et al., 1994; Pierpaoli et al., 1996). The diffusionmeasurements can be used to calculate the fractional anisotropy(FA) metric that reflects the degree of directional preference inwater diffusion (Basser, 1995). DTI studies in hemiparetic strokepatients have reported early (Thomalla et al., 2004), progressive(Moller et al., 2007; Thomalla et al., 2005), and chronic (Pierpaoliet al., 2001; Werring et al., 2000) loss of FA along the ipsilesionalCST reflective of Wallerian degeneration. Tractography applied toDTI data can be used to reconstruct major cerebral white mattertracts by successively following the path of the preferred directionof water diffusion when FA is higher than a selected threshold(Basser et al., 2000; Conturo et al., 1999; Jones et al., 1999b; Moriet al., 1999). Tractography was used recently to reveal a reducednumber of reconstructed ipsilesional CST fibers in patients withcongenital hemiparesis (Thomas et al., 2005). We reasoned that inchronic hemiparetic stroke patients, there would be a reducednumber of reconstructed ipsilesional CST fibers proportionate tothe extent of structural damage to the ipsilesional CST caused byprimary axonal damage or Wallerian degeneration. Therefore, inthe current study, the number of reconstructed fibers of theipsilesional CSTwas measured to quantify structural damage of theCST in the chronic stroke patients.
We examined the relationship between the morphometry- andtractography-based approaches employed to measure structural
Table 1Patient characteristics
Patient Premorbidhanddominance
Stroke-affectedhand
Age(year)
Gender Time post-stroke(year)
AM
1 R L 52 M 0.5 32 R R 47 M 3.9 03 R R 41 F 5.9 04 R R 69 M 1.6 45 R L 76 F 2 16 R R 62 F 1.2 37 R L 48 F 1.7 08 L R 60 M 5.8 09 R R 61 M 2.2 010 R L 69 M 1.2 1Summary 9R/1L 6R/4L 59±11 4F/6M 2.6±1.9
M, male; F, female; R, right; L, left; UL, upper limb; IC, internal capsule; PLIC, posstrength measures (scale 0–5; 0=no power, 5=normal) for muscles of the affectedscores are given in parentheses if available. Summary values are mean±SD.
damage of the ipsilesional CST, and correlated each against motortask-related cortical activation measured using fMRI. Characteriz-ing a quantitative relationship between structural damage of theCST and functional activation in stroke patients would be expectedto advance our understanding of the factors driving functionalreorganization after stroke.
Materials and methods
Subjects
Ten patients with chronic stroke, former in-patients atGreater Boston area hospitals, were enrolled (Table 1). Thesepatients fulfilled the following entry criteria: (1) first-everischemic stroke incurred N6 months earlier; (2) acute unilateralloss of hand strength to ≤4 on the Medical Research Council(MRC) scale (0–5, 5=normal) (Medical Research Council,1976) based on physician notes entered into the medical recordof the initial hospitalization within ~24 h after stroke; (3) noprior or subsequent symptomatic stroke; (4) able to competentlyperform the motor task applied during fMRI with the affectedand unaffected hands; (5) language and cognitive statussufficient to allow full cooperation with study procedures.Notably, the stroke location and size among the patients wereheterogeneous (Table 1, Fig. 1). All patients had received andcompleted physical rehabilitation after their stroke. Premorbidhand dominance was evaluated by having the patients completethe Edinburgh Inventory (Oldfield, 1971) based on recall. Somedata acquired from these patients have been used for otheranalyses, the results of which have been recently described(Schaechter and Perdue, 2007).
For the purpose of characterizing the morphometric andtractography approaches for measuring structural integrity of theCST, we also enrolled 10 normal healthy subjects with no historyof stroke and a normal neurological examination. Hand dominancewas determined by the Edinburgh Inventory (Oldfield, 1971). Thenormal subjects were well matched to the stroke patients for age(normals: 60±10 years; patients: 59±11 years; mean±standarddeviation (SD)), handedness (normals and patients: 9 right handdominant, 1 left hand dominant), and gender (normals: 3 females;patients: 4 females).
cute UL (hand)RC score
Lesion
Location Volume (cm3)
R CR, BG, temporal lobe 15.2(0) L CR, BG, IC, inferior frontal lobe 77.3–3 (0) L medial temporal lobe, PLIC 0.9
L CR, BG, temporal lobe 61.2(0) R CR, temporal lobe 3.4–4+(3+) L CR 0.7(0) R frontal and parietal lobe white matter 10.1–3 (0) L CR, BG 4.2(0) L frontal lobe, parietal lobe 33.8–3 (1) R BG 0.7
terior limb of IC; BG, basal ganglia; CR, corona radiata. UL MRC scores areupper limb acutely after stroke, as reported in the medical record; hand MRC

Fig. 1. T2-weighted image (parallel to intercommissural plane) from each patient at the level where the infarct (red circle) most involved or most closelyapproximated the path of the CST. Patient numbers correspond with those in Table 1.
1372 J.D. Schaechter et al. / NeuroImage 39 (2008) 1370–1382
All subjects provided written informed consent in accordancewith the Human Subjects Committee of the Partners InstitutionalReview Board.
Behavioral testing
Motor function of the affected and unaffected hands of thestroke patients was assessed using two tests. Maximum speed ofindex finger tapping was measured in 2×10-s trials (Shimoyamaet al., 1990). Fine manual dexterity was measured using the PurduePegboard test in 3×30-s trials (Desrosiers et al., 1995; Tiffin andAsher, 1948). As independent finger movement, finger movementspeed, and fine manual dexterity are motor functions impaired bydamage to the CST (Wiesendanger, 1984), these tests relate tostructural integrity of the CST. Test scores were averaged overtrials. Average test scores for the affected hand were normalized bydividing by the average test scores of the unaffected hand,multiplied by 100, and reported in percent.
Motor task during fMRI
The motor task performed by the patients during fMRI wasunilateral flexion/extension of the five digits in unison, with thedigits moving through their full range-of-motion at 0.25 Hz (1 cycleper 4 s). Movement epochs (22.5 s×5) alternated with rest epochs(22.5 s×6) in which the hand fully relaxed. Separate functional runswere conducted during performance of each hand of the patients,with the hand performing first randomized across patients.Conditions were cued by visual stimuli generated by a MacintoshG3 iBook running MacStim software (v2.6), back-projected onto atranslucent screen, and viewed via a tilted mirror. Movement stimuliwere schematic representations of a hand that alternated every 2 sbetween digit flexion and extension, and were colored green for the22.5-s epoch, except for the last 2.5 s when the schematic changed tored to cue preparation to stop moving. Stimuli cueing rest were
shaped as an asterisk, sized similar to the movement stimuli, andalternated between being colored blue and red at the same frequencyas the movement stimuli (every 2 s). Before scanning, patients weretrained until they could comfortably perform the motor task witheither hand.
Monitoring motor task performance during fMRI
Motor task performance was recorded on-line from the patientsusing a custom-built device that has been described previously indetail (Schaechter et al., 2006). The device utilizes micro-electro-mechanical system (MEMS) gyroscopes to measure angularvelocity of each of the ten digits. The angular velocity data wereused to compute the mean duration, frequency, amplitude, speed,acceleration, and jerk of the five digits of the moving hand, as wellas mirror movements of the hand contralateral to the task-performing hand, as described previously (Schaechter et al., 2006;Schaechter and Perdue, 2007).
Image acquisition
Magnetic resonance images were acquired using a 3T SiemensTrio magnetic resonance scanner and a transmitter/receiver Brukercircular polarization head coil. With the subject lying supine on thescanner bed, a custom-formed bite bar was used to limit headmotion. For patients participating in fMRI, the elbows wereslightly flexed so that both pronated forearms rested on the lowertrunk and thighs. Splints were used to support the wrists at about20° extension. Straps and cushions were used to stabilize the trunkand arms.
Blood oxygenation level-dependent (BOLD) images wereacquired from the patients using a T2*-weighted gradient-echo,echo planar imaging sequence (repetition time (TR)=1500 ms;echo time (TE)=30 ms; flip angle (α)=90°; field-of-view (FOV)=200 mm×200 mm; matrix size=64×64; slice thickness=5 mm;

1373J.D. Schaechter et al. / NeuroImage 39 (2008) 1370–1382
interslice gap=1 mm; number of slices=23; acquisitions/slice=165) equipped with automatic alignment of the slices parallel to theintercommissural plane (van der Kouwe et al., 2005) andprospective acquisition correction of head motion (Thesen et al.,2000). BOLD image collection was preceded by four dummy scansto allow for equilibration of the MRI signal.
Structural volumes were collected from all subjects using aT1-weighted MPRAGE sequence (TR=7 ms; TE=3 ms; α=7°;FOV=256×256 mm; matrix size=192×256; effective slicethickness=1.33 mm). These images were used for cortical sur-face reconstruction, anatomical localization of functional activity,and morphometry of the cerebral peduncles.
T2-weighted turbo spin-echo images (TR=5300 s; TE=103 ms;α=180°; FOV=210×210 mm; matrix size=256×256) were ob-tained from the patients for determination of lesion location andvolume, using the same slice specifications as for the BOLD images.
Diffusion tensor images were collected from all subjects using asingle-shot, twice-refocused spin echo (Reese et al., 2003) sequence(TR=10.7 s; TE=91 ms; α=90°; FOV=256×256 mm; matrixsize=128×128; slice thickness=2 mm; interslice gap=0 mm;number of acquisitions=70, 60 non-collinear directions with b-value 700 s/mm2, 10 with b-value 0 s/mm2; voxel size=2×2×2 mm; number of slices=75) with automatic alignment ofthe slices parallel to the intercommissural plane (van der Kouweet al., 2005). These images were used for tractography of the CST.
Image analysis
TractographyThe DTI task card software (v1.70) run on a Siemens Medical
Solutions Numaris 4 satellite console (www.nmr.mgh.harvard.edu/~rpwang/siemens/dti_taskcard) was used for analysis of the DTIdata. Visual inspection of the diffusion-weighted images acquiredfrom each of the stroke patients and normal subjects revealed noartifacts and stable head position. The mean post-averaged signal-to-noise ratio of the diffusion-weighted images across the subjectswas 20. The diffusion tensor, associated eigensystem, and FAmetric were calculated at each voxel using a linear least squareregression method.
The CST in each hemisphere was reconstructed using a fiberassignment by continuous tracking (FACT) algorithm (Basseret al., 2000; Conturo et al., 1999; Jones et al., 1999b; Mori et al.,1999) using two regions-of-interest (ROIs), the precentral gyrusand the posterior limb of the internal capsule (PLIC). Great carewas taken to standardize placement and size of the ROIs bilaterally.The size of the left relative to the right precentral gyrus ROI acrossthe subjects was 0.98; this ratio for the PLIC ROIs was 1.00. Theprecentral gryus ROI was drawn on the single axial slice of theimage with no diffusion weighting (b-value 0 s/mm2) in which theprecentral and central sulci of the hand knob region (Yousry et al.,1997) were most noticeable (14–20 mm inferior from the vertex ofthe brain). The remaining borders of the precentral gyrus ROI werethe interhemispheric fissure medially and the surface of the brainlaterally. Based on extensive pilot testing of CST tractography forwithin-subject reproducibility (see below), we opted to draw thePLIC ROI on four consecutive axial slices, with the most inferioraxial slice displaying: (i) marked hyperintensity in this whitematter region on the FA map, and (ii) anterior and posterior hornsof the lateral ventricle as well as the third ventricle in the imagewith no diffusion weighting. The PLIC ROI was delimitedmedially by the thalamus; laterally by the globus pallidus;
anteriorly by the genu of the internal capsule; and posteriorly atthe level of the posterior thalamus. For images from patients inwhich the stroke involved the PLIC or distorted the PLIC regiondue to brain atrophy (Patients #1, 2, 3, 5 and 8), the ipsilesionalPLIC ROI was (i) drawn on each of the same four consecutiveaxial slices as the PLIC ROI in the opposite hemisphere, (ii)positioned in the hyperintense region of the FA map thatapproximately mirrored the position of the PLIC ROI in theopposite hemisphere, and (iii) sized to approximate that of thePLIC ROI in the opposite hemisphere.
Fiber tracts were reconstructed using the precentral gyrus ROIand each of the ipsilateral PLIC ROIs in two stages. First, voxels ofthe precentral gyrus ROI served as seeds and the PLIC ROI servedas the target. Then, voxels of the PLIC ROI served as seeds and theprecentral gyrus ROI served as the target. Tracking followed thedirection of fastest diffusion in 0.5 mm step lengths, and wasterminated if FA was less than 0.15 or the tract angle betweensuccessive steps was greater than 20°. These parameters are similarto those used by others who applied the FACT algorithm for CSTreconstruction (Holodny et al., 2005; Moller et al., 2007; Sageet al., 2007; Thomas et al., 2005). All fibers reconstructed betweenthe two ROIs were considered to be the CST. The reconstructedCST fibers were found to pass through the posterior portion of thePLIC, consistent with tract tracing studies in monkeys that showedthis region to contain fibers descending from the arm region of theM1 (Fries et al., 1993; Morecraft et al., 2002). Prior tractographystudies in humans have also observed reconstructed CST fibersdescending from the precentral gyrus to course through thisposterior region of the PLIC (Holodny et al., 2005; Newton et al.,2006). In most patients (#1, 2, 3, 4, 5, 6, and 8), the reconstructedCST fibers were observed to abut the region of the infarct,visualized as a hyperintense region in images with the no diffusionweighting (see Supplementary Material). In the remaining patients,the reconstructed CST fibers were observed to course through(Patient #7) or were remote from (Patients #9 and 10) thehyperintense region.
The number of reconstructed CST fibers between the precentralgyrus ROI and each PLIC ROI was counted. While the number ofreconstructed fibers relative to the real number of axons within atract is not known (Johansen-Berg and Behrens, 2006), countingthe number of reconstructed fibers has been used previously toestimate structural integrity of major white matter pathways(Thomas et al., 2005). Extensive pilot testing was conducted toevaluate the effect on the number of reconstructed CST fibers as afunction of which axial slice the PLIC and precentral gyrus ROIswere drawn. We did find some within-subject variability(approximately 20%) in CST fiber count depending on whichslice the PLIC ROI was drawn. The variability in CST fiber countassociated with shifting the PLIC ROI superiorly/inferiorly wasdue to voxels along the medial and lateral borders of the PLICcontaining differential fractions of gray matter. This partial volumeeffect yields an estimate of the diffusion tensor and eigensystemthat does not reflect the true diffusion properties of the biologictissue, resulting in inaccuracies in tract reconstruction to and fromthese voxels. To minimize the impact of these inaccuracies onestimating CST damage, we opted to average ipsilaterally thenumber of reconstructed CST fibers connecting the precentralgyrus ROI to each of the four PLIC ROIs. In contrast, we foundonly minor differences (b5%) in CST fiber count when the slice onwhich the precentral gyrus ROI was drawn was shifted superiorlyor inferiorly (2–4 mm). This lack of effect of precentral gyrus ROI

1374 J.D. Schaechter et al. / NeuroImage 39 (2008) 1370–1382
slice selection held true even for the one patient (#9) whose strokeinvolved the superior aspect of the precentral gyrus. The infarct inthis patient involved tissue lateral to the hand knob region, and wasthus lateral to the white matter region where reconstructed CSTfibers typically coursed.
The average number of reconstructed CST fibers counted in onehemisphere was normalized to that of the other hemisphere. Forpatients, this normalization was conducted by dividing the averageipsilesional CST fiber count by the average contralesional CSTfiber count. For normal subjects, the average left hemisphere CSTfiber count was divided by the average right hemisphere CST fibercount. These ratios were multiplied by 100 to convert to percent,with higher percent values reflecting greater structural integrity ofthe ipsilesional CST. Percent values were used in subsequentanalyses.
MorphometryAn experienced neuroradiologist, who was blind to the
tractography-based measurements of CST integrity, used Alicesoftware (Hayden Image Processing Solutions, Denver, CO) tomeasure the cross-sectional area of the left and right cerebralpeduncles based on the T1-MPRAGE images acquired from eachsubject. As the structural images were acquired using an automatedslice positioning procedure (van der Kouwe et al., 2005), the sliceswere symmetric left to right. For each set of images, the singleaxial slice in which the lateral notch most prominently divided thetegmentum from the crus cerebri was selected. A line was drawnfrom the notch perpendicular to the long axis of the crus cerebri.As the substantia nigra was not clearly distinguished from thecerebral peduncle in the T1-weighted images, the line was drawnthrough the substantia nigra. The cross-sectional area of thecerebral peduncle was measured bilaterally. Images from somepatients (#2, 3, 5, and 8) showed T1 signal hypointensity in theipsilesional cerebral peduncle. This hypointense region wasincluded in the cross-sectional area measurement. The ipsilesionalpeduncle area from the patients was divided by the contralesionalpeduncle area. For normal subjects, the left peduncle area wasdivided by the right peduncle area. These ratios were multiplied by100 to convert to percent, with higher percent values reflectinggreater structural integrity of the ipsilesional CST. Percent valueswere used in subsequent analyses.
Lesion volumeAn experienced neuroradiologist manually outlined the signal
abnormality slice by slice in T2-weighted images acquired from thepatients using Alice software, and computed the total volume oflesioned tissue.
fMRIWe wished to compare cortical activation during affected versus
unaffected hand movement in patients on a voxel-by-voxel basis.To accomplish this comparison, images were processed so that theleft hemisphere was always contralateral to the moving hand, andthe right hemisphere was always ipsilateral to the moving hand.Accordingly, BOLD and MPRAGE images were processed in theirnative orientation as well as after being flipped across themidsagittal plane.
Freesurfer software (http://surfer.nmr.mgh.harvard.edu) wasused to compute a model of the cortical surface based on theMPRAGE images using procedures described in detail previously(Dale et al., 1999; Fischl et al., 1999a). Each cortical surface model
was spatially normalized to a spherical surface template using anautomated procedure that optimally aligns major cortical gyri andsulci (Fischl et al., 1999b), then transformed, using SUMAsoftware (http://afni.nimh.nih.gov/afni/suma), to a standard corticalsurface composed of nodes forming a triangular mesh.
Preprocessing and statistical analysis of functional images wereperformed using AFNI software (http://afni.nimh.nih.gov/afni).The functional volumes from each patient were preprocessed bycorrecting retrospectively for motion, normalizing signal intensity,and co-registering with the structural volume. The BOLD dataalong the normal vector through the gray/white matter border–pialsurface was mapped to the standard cortical surface. The surface-mapped BOLD data were spatially smoothed using a two-dimensional Gaussian filter (Chung et al., 2003) with a full-widthat half maximum of 6 mm.
Statistical analysis of the functional data was conducted using ageneral linear model fit at each node of the cortical surface, withdata acquired during affected and unaffected hand movement fitseparately. The model included a stimulus input function defined asa boxcar convolved with a canonical hemodynamic response,baseline and linear drift terms, and motion-correction parameters asnuisance regressors. The resultant beta coefficient maps that reflectBOLD signal change during motor task performance relative to restwere entered into two-tailed one-sample t-tests to evaluate group-average activation during affected and unaffected hand movement,and into two-tailed paired t-tests to evaluate within-groupdifferences in activation during affected versus unaffected handmovement.
Linear regression analyses were conducted to examine thepossible relationship between cortical activation during affectedhand movement in the patients and each of 10 structural andbehavioral measures. Each of 10 analyses fit a simple linearregression model at each cortical surface node to determine thecorrelation across the patients between activation (beta coefficient;BOLD signal change, in percent) and (i) structural integrity of theipsilesional CST measured by tractography (in percent); (ii)structural integrity of the ipsilesional CST measured by morpho-metry (in percent); (iii) lesion volume (in cm3); (iv) affected handmotor function measured by index finger tapping speed (inpercent); (v) affected hand motor function measured by the PurduePegboard test (in percent); and (vi–x) each kinematic parameter(amplitude, speed, acceleration, jerk, mirroring) of task perfor-mance measured during fMRI. Two additional regression analyseswere conducted at each cortical surface node to examine thecorrelation between activation during unaffected hand movementin the patients and structural integrity of the ipsilesional CSTmeasured by tractography and morphometry.
Group-level statistical maps were corrected for multiplecomparisons by controlling for false positives using a combinationof individual node-level probability and minimum cluster size(Forman et al., 1995), values determined from Monte Carlosimulations (10,000 iterations) performed on synthesized whiteGaussian noise data. One-sample t-test maps were corrected to acluster-wise significance level of 0.01 by setting the individualnode probability to 0.01 and minimum cluster size to 234 mm2.The paired t-test map and regression maps were corrected to acluster-wise significance level of 0.05 by setting the individualnode probability to 0.05 and minimum cluster size to 323 mm2.Regression maps in which the individual node probability was setat 0.10 and minimum cluster size to 405 mm2 were considered toexhibit a cluster-wise nonsignificant trend at a level of 0.10.

Table 3Motor performance of patients during fMRI
Movement parameter Hand
Affected Unaffected
Duration (s) 22.5±0.7 22.4±0.6Frequency (Hz) 0.25±0.00 0.25±0.00Amplitude (% max range-of-motion) 78.2±9.1 81.1±5.2Speed (degrees/s) 75.5±16.2 84.5±27.2Acceleration/102 (degrees/s2) 15.2±5.4 18.3±8.2Jerk/103 (countsN5×104 degrees/s3) 18.8±11.5 16.1±7.3
1375J.D. Schaechter et al. / NeuroImage 39 (2008) 1370–1382
In cortical regions exhibiting a correlation between structuralintegrity of the CST and activation during affected hand movement(see Results), we determined the cortical node exhibiting the mostsignificant correlation, and plotted CST integrity (based ontractography and morphometry, in percent) against BOLD signalchange (in percent) at this node for each patient.
Statistical analysis
Results are expressed as the mean±SD. StatView (version 4.5)was used for statistical procedures. Differences in behavioralscores and kinematic parameters of fMRI task performanceassociated with the affected hand versus the unaffected hand ofthe patients were evaluated using two-tailed paired t-tests.Differences in CST integrity associated with the patients versusnormal subjects were evaluated using two-tailed unpaired t-tests.Pearson’s correlation coefficient was used to evaluate the relation-ship between the two metrics of CST integrity, as well as eachmetric of CST integrity versus each behavioral measure of affectedhand motor function. The significance of a correlation wasdetermined using a z-test following Fisher’s r to z transformation.Alpha was set to 0.05 for all tests.
Results
Behavioral testing
Behavioral testing revealed that the chronic stroke patientsexhibited a range of motor function of the affected hand (~30 to100% function relative to the unaffected hand; Table 2). On agroup basis, the affected hand exhibited significant residual motorimpairments evidenced by reduced index finger tapping speed(affected hand: 2.6±1.0 taps/s, unaffected hand: 3.7±1.0 taps/s;Pb0.05, paired t-test) and fine manual dexterity measured by thePurdue Pegboard test (affected hand: 9.6±3.3 pegs, unaffectedhand: 12.9±1.6 pegs; Pb0.05, paired t-test).
Motor task performance during fMRI
Analysis of the finger motion sensor data acquired during fMRIrevealed no significant differences in the kinematics of the motortask performed by the affected hand compared to the unaffectedhand of the patients (each PN0.05, paired t-test; Table 3).
Table 2Motor function of the affected hand of patients
Patient Behavioral test
IT (%) PP (%)
1 79.8 82.32 34.1 39.43 107.1 97.74 91.3 112.45 58.2 52.86 59.3 88.07 98.8 92.58 85.3 50.89 93.3 100.010 39.2 48.5Mean±SD 74.6±25.4 76.4±26.0
IT= index finger tapping speed; PP=Purdue Pegboard test.
Furthermore, there was no significant difference in mirror move-ments of the “resting” hand when the motor task was performed bythe affected hand (0.12±0.80%) compared to the unaffected hand(0.16±0.42%).
Structural integrity of the CST
Figs. 2A and B shows an example of measurements of thestructural integrity of the CST in a stroke patient (#5) using thetractography and morphometry approaches. Tractography revealedsignificantly less symmetry in the number of reconstructed CSTfibers in the two hemispheres of the patients compared to thenormal subjects (patients: 55±23%; normals: 101±12%; Pb0.0001, unpaired t-test). Similarly, morphometry revealed sig-nificantly less symmetry in the cross-sectional area of the cerebralpeduncles in the patients relative to normals (patients: 78±14%;normals: 96±9%; Pb0.005, unpaired t-test). In the patients,structural integrity of the ipsilesional CST measured using the twoapproaches was strongly and significantly correlated (r=0.83;Pb0.005; Fig. 2C).
Functional activation
Group-level analysis of the fMRI data acquired from thepatients revealed that affected hand movement elicited markedactivation in the hand area of the sensorimotor cortex (i.e., M1,primary somatosensory cortex (S1), premotor cortex) (Yousryet al., 1997) in the contralateral (ipsilesional) hemisphere (cluster-level corrected Pb0.01, one-sample t-test; Fig. 3A). Activation inthe contralateral hemisphere was also observed in the posteriorparietal cortex, supplementary motor area, and cingulate cortex.Affected hand movement elicited activation in several regions ofthe ipsilateral (contralesional) hemisphere as well, in the hand areaof the M1 and premotor cortex, posterior parietal cortex, frontaloperculum, parietal operculum, supplementary motor area, andcingulate cortex. Movement of the unaffected hand of the patientselicited a similar pattern of activation as described for the affectedhand, yet with additional clusters of significant activation in thecontralateral parietal operculum and frontal operculum, and lackingsignificant activation in the ipsilateral M1, frontal operculum, andposterior parietal cortex (Fig. 3B). Within-group comparisonrevealed significant increases in activation during affected handmovement relative to unaffected hand movement in two regions ofthe ipsilateral (contralesional) hemisphere (cluster-level correctedPb0.05, paired t-test; Fig. 3C). One region was in the hand area ofthe sensorimotor cortex, involving the posterior bank of theprecentral gyrus (corresponding to area 4, Geyer et al., 1996);crown and anterior bank of the precentral gyrus (corresponding toarea 6, Geyer et al., 1996, 2000); central sulcus (corresponding to

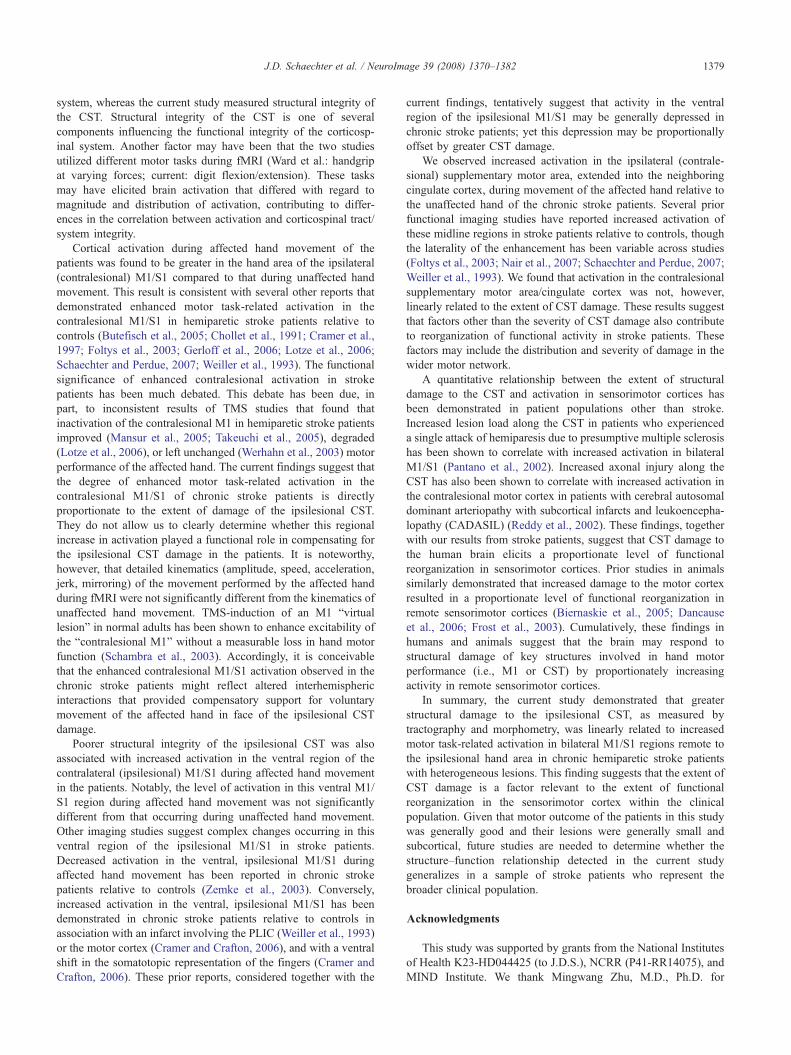
Fig. 2. Quantification of ipsilesional CST damage using tractography and morphometry in chronic stroke patients. (A) Number of reconstructed CST fibers basedon DTI-tractography in a patient (#5) with a right (R) hemisphere stroke. (B) Cross-sectional area of the cerebral peduncles visualized in T1-weighed imagesfrom the same patient as in panel A. (C) Significant correlation across the stroke patients between ipsilesional CST damage measured using tractography andmorphometry (r=0.83, Pb0.005).
1376 J.D. Schaechter et al. / NeuroImage 39 (2008) 1370–1382
area 3a, Geyer et al., 1999); and anterior bank of the postcentralgyrus (corresponding to area 3b, Geyer et al., 1999). The secondregion was in the supplementary motor area extending into thecingulate cortex.
Correlations
We examined the linear relationship between structuralintegrity of the ipsilesional CST and functional activationduring affected hand movement in the patients. Structuralintegrity of the ipsilesional CST, measured by tractography, wasfound to be significantly (cluster-level corrected Pb0.05) andnegatively correlated with functional activation in two corticalregions (Fig. 4). One region was in the hand area of thecontralesional M1/S1. More specifically, this region was locatedin the posterior bank of the precentral gyrus (putative area 4);central sulcus (putative area 3a); anterior bank of the postcentralgyrus (putative area 3b); crown of the postcentral gyrus(corresponding to area 1, Geyer et al., 1999); and posteriorbank of the postcentral gyrus (corresponding to area 2, Grefkeset al., 2001). The second region was in the ipsilesional M1/S1
Fig. 3. Functional MRI results of motor task-related cortical activation in chronic slevel corrected Pb0.01, one-sample t-tests) during affected hand movement (A) aAlso shown is the statistical map of within-subject differences in activation (clusterthe group-average, inflated cortical surface of the contralateral hemisphere (CH)hemisphere; bottom row shows the medial surfaces of the hemisphere. Dark gray reGreen arrowheads point to central sulcus.
(putative areas 4, 3a, 3b, 1, and 2) ventral to the hand area.Examination of this relationship using the morphometricmeasure of ipsilesional CST integrity similarly revealed asignificant (cluster-level corrected Pb0.05) negative correlationin the hand area of the contralesional M1/S1, though only anonsignificant trend (cluster-level corrected Pb0.10) in theipsilesional M1/S1 ventral to the hand area. The two M1/S1regions exhibiting a correlation between activation and thetractography-based measurement of CST integrity overlappedwith the two regions exhibiting a correlation between activationand the morphometry-based measurement of ipsilesional CSTintegrity. There was no cortical area exhibiting a significantpositive correlation between structural integrity of the ipsile-sional CST, measured using either tractography or morphometry,and activation during affected hand movement. There was alsono cortical area exhibiting a significant correlation betweenactivation during unaffected hand movement and ipsilesionalCST integrity measured using either approach. These resultssuggest that poorer structural integrity of the ipsilesional CST(i.e., greater structural damage of the CST) in the chronic strokepatients was associated with proportionate increases in motor
troke patients. Shown are group-average statistical activation maps (cluster-nd unaffected hand movement (B). Color bar reflects node-level P-values.-level corrected Pb0.05, paired t-test) (C). Maps are overlaid on a model ofand ipsilateral hemisphere (IH). Top row shows the lateral surfaces of thegions are the fundus of a sulcus; light gray regions are the crowns of a gyrus.

Fig. 4. Correlation between structural integrity of the ipsilesional CST and cortical activation in chronic stroke patients during affected hand movement. Leftcolumn shows cortical regions in the contralesional (top row) and ipsilesional (bottom row) hemispheres exhibiting this correlation, when CST integrity wasmeasured using tractography or morphometry, and the region of overlap. These regions are displayed on the group-average, inflated cortical surface and, ininsets, on the folded surface in the region of the central sulcus. Note that the contralesional region is located in the hand area of the M1/S1, whereas theipsilesional region is located ventral to the hand area of the M1/S1. Clusters are significant at a corrected level of Pb0.05, with the exception of the ipsilesionalM1/S1 cluster identified using morphometry that showed a correlation at a corrected level of Pb0.10. The middle and right columns are plots of theserelationships at the cortical node of maximum correlation within each cluster when CST integrity was measured using tractography or morphometry.
1377J.D. Schaechter et al. / NeuroImage 39 (2008) 1370–1382
task-related activation in two M1/S1 regions remote to the handarea of the ipsilesional sensorimotor cortex.
We examined whether the ventral region of the ipsilesional M1/S1 in which we observed a correlation between activation andstructural damage of the CST involved the infarct in any patient. Wefound that the infarct in one patient (#9) overlapped with theprecentral gyrus portion of the ventral, ipsilesional M1/S1 region.Eliminating this overlapping region from the regression analysis thatused the tractography-based measurement of CST integrity stillyielded a cluster that was significant at a corrected cluster-wisecorrected level of 0.05. Similarly, eliminating this overlappingregion from the regression analysis that used the morphometry-based measurement of CST integrity still yielded a cluster thatexhibited a nonsignificant trend at a cluster-wise corrected level ofPb0.10.
We examined the linear relationship between cortical activationduring affected hand movement and several structural andbehavioral measures. We found no cortical area exhibiting asignificant correlation between activation during affected handmovement and (i) lesion volume; (ii) affected hand motor functionmeasured by index finger tapping speed or the Purdue Pegboardtest; or (iii) any kinematic parameter (amplitude, speed, accelera-tion, jerk, mirroring) measured by the finger motion sensors duringfMRI.
We tested the linear relationship between affected hand motorfunction and ipsilesional CST integrity. We found modest correla-tions, though not reaching statistical significance, between affectedhand motor function measured by the Purdue Pegboard test andipsilesional CST integrity based on tractography (r=0.59, P=0.07)and morphometry (r=0.55, P=0.10). Poorer correlations werefound between affected hand motor function measured by indexfinger tapping speed and either approach for estimating ipsilesionalCST integrity (tractography: r=0.50, P=0.15; morphometry:r=0.30, P=0.40).
Discussion
The current study examined the relationship between the extentof structural damage to the CST, the major pathway in the braincontrolling hand motor performance, and functional activation inchronic hemiparetic stroke patients with heterogeneous lesions. Wefound that reduced structural integrity (i.e., greater structuraldamage) of the ipsilesional CST correlated with increasedactivation during affected hand movement in the hand area ofthe contralesional M1/S1 and in the ipsilesional M1/S1 ventral tothe hand area. Previous studies in hemiparetic stroke patientsshowed that focal damage to the PLIC, hence presumably the CST,was associated with increased activation in the hand area of the

1378 J.D. Schaechter et al. / NeuroImage 39 (2008) 1370–1382
contralesional M1/S1 (Lotze et al., 2006; Loubinoux et al., 2003;Tombari et al., 2004) and ventral, ipsilesional M1/S1 (Weilleret al., 1993) relative to that in controls. The current study providesthe first demonstration, to our knowledge, of a quantitativerelationship between the extent of structural damage to the CSTand cortical activation in stroke patients with variable lesion sizeand location.
Measurement of CST damage
The extent of structural damage to the CST was quantified invivo in the chronic stroke patients using two independentapproaches based on MRI—morphometry and tractography. Ourmorphometry approach measured the cross-sectional area of thecerebral peduncles in the chronic stroke patients. Sequentialchanges in signal intensity in the ipsilesional cerebral peduncle,likely reflecting axonal and myelin degradation, have beenpreviously observed over the first months to years after hemipareticstroke using conventional structural imaging (Inoue et al., 1990;Kuhn et al., 1989; Orita et al., 1994). Cerebral peduncle atrophy isa relatively late manifestation of Wallerian degeneration of the CSTtypically observed within the first years after stroke (Inoue et al.,1990; Kuhn et al., 1989; Stovring and Fernando, 1983), though hasbeen reported to occur by 6 to 8 months after stroke. Thus, ourfinding of atrophy of the ipsilesional cerebral peduncle in thestroke patients who incurred a stroke at least 6 months earlier isconsistent with Wallerian degeneration of the ipsilesional CST.
Our tractography approach for measuring the extent ofstructural damage to the CST detected a reduced number ofreconstructed ipsilesional CST fibers in the chronic stroke patients.This result parallels the recent finding made by Thomas et al.(2005) who reported a reduced number of reconstructed CST fibersipsilesionally in children with hemiparetic cerebral palsy. Severalmechanisms may have contributed to our observed decrease inreconstructed ipsilesional CST fibers. In chronic stroke patients,there is loss of diffusion anisotropy in white matter directlydamaged by the infarct due to axonal degeneration and gliosis, andat remote white matter sites affected by Wallerian degeneration(Jones et al., 1999a; Wieshmann et al., 1999; Yang et al., 1999).Severe loss of FA in CST axons could have reduced the number ofreconstructed ipsilesional CST fibers by causing prematuretermination of tracking from seed to target. Less severe loss ofFA in CST axons may have permitted tracking, though a changein the preferred direction of diffusion may have caused thereconstructed path to deviate from the real CST. Such deviantpaths may have failed to hit the target ROI, contributing to thereduced number of reconstructed CST fibers. It is also possiblethat compression of intact CST fibers, due to stroke-related tissueloss and ventricular expansion, could have contributed to thereduced number of reconstructed CST fibers. The relative impactthese mechanisms had on reducing the number of reconstructedipsilesional CST fibers in the chronic stroke patients is notknown.
The tractography- and morphometry-based measures of struc-tural damage to the CST in the chronic stroke patients were highlycorrelated (r=0.83), indicating relatively high concurrent validity.The correlations relating CST damage to functional activation, andCST damage to hand motor function measures, were higher withuse of tractography compared to morphometry. This result suggeststhat tractography may provide a more accurate estimate ofipsilesional CST damage than morphometry, though further study
involving a larger cohort of chronic stroke patients is required.Also noteworthy are the higher correlations between CST damage(measured by tractography or morphometry) and the PurduePegboard test compared to index finger tapping speed, consistentwith the strong reliance of fine manual dexterity on the CST(Wiesendanger, 1984).
Both approaches for quantifying CST damage relied on time-dependent degenerative processes occurring after stroke. The timeinterval between the stroke and study enrollment varied among thepatients in the current study (0.5–5.9 years). This variability mayhave affected our morphometry- and tractography-based measure-ments of CST damage since degenerative processes may haveevolved to different points among the patients. However, theobserved high correlation between the two measures suggests thatthe relative magnitude of degenerative changes among the patientswas more robust than potential error introduced by differences instroke chronicity.
It is possible that our morphometry-based measurement of CSTdamage involved some error due to the fact that the cerebralpeduncle contains not only the CST but also other corticofugaltracts (e.g., frontopontine fibers) (Carpenter, 1976), and themeasured area included the substantia nigra. In our patients withheterogenous lesions, Wallerian degeneration of corticofugal axonsother than those of the CST may have contributed to atrophy of theipsilesional peduncle.
A possible source of error in our tractography-based measure-ment of CST damage may have stemmed from the knownlimitation in estimating the orientation of fibers at each voxel usinga single tensor model. There are voxels along the longitudinallyoriented CST that also contain other major tracts with a differentorientation (e.g., superior longitudinal fasciculus oriented in theanterior–posterior direction). In these voxels containing crossingfibers, diffusion anisotropy will be reduced, resulting in some ofthe CST not being detected by tractography based on single tensormodeling. The specific location of the stroke in the patients relativeto the CST fibers not detected by tractography may havecontributed to an error in estimating CST damage. Such a potentialerror might be minimized in future studies by applying multi-orientation diffusion modeling (Behrens et al., 2007) or model-freeimaging (Wedeen et al., 2005).
Ipsilesional CST damage and functional activation
We found that poorer structural integrity of the ipsilesionalCST was correlated with increased activation in bilateral M1/S1 inthe chronic stroke patients. A recent study by Ward et al. (2006)examined the correlation between functional integrity of thecorticospinal system, measured using TMS, and brain activation inchronic subcortical stroke patients. Consistent with our results,they found significant negative correlations in the hand region ofthe contralesional area 4a of the M1 and area 1 of the S1, as wellas in a ventral region of the ipsilesional area 4p of the M1.However, whereas Ward and colleagues found correlations inthese discrete areas of the M1 and S1, we detected significantcorrelations in broader regions of the M1 (involving putative area4p as well as putative area 4a), and the S1 (involving putativeareas 3a, 3b, and 2 as well as area 1). Furthermore, Ward andcolleagues found significant correlations in several secondarysensorimotor cortices of the ipsilesional and contralesional hemi-spheres. One possible reason for these different results is that theWard study measured functional integrity of the corticospinal
1379J.D. Schaechter et al. / NeuroImage 39 (2008) 1370–1382
system, whereas the current study measured structural integrity ofthe CST. Structural integrity of the CST is one of severalcomponents influencing the functional integrity of the corticosp-inal system. Another factor may have been that the two studiesutilized different motor tasks during fMRI (Ward et al.: handgripat varying forces; current: digit flexion/extension). These tasksmay have elicited brain activation that differed with regard tomagnitude and distribution of activation, contributing to differ-ences in the correlation between activation and corticospinal tract/system integrity.
Cortical activation during affected hand movement of thepatients was found to be greater in the hand area of the ipsilateral(contralesional) M1/S1 compared to that during unaffected handmovement. This result is consistent with several other reports thatdemonstrated enhanced motor task-related activation in thecontralesional M1/S1 in hemiparetic stroke patients relative tocontrols (Butefisch et al., 2005; Chollet et al., 1991; Cramer et al.,1997; Foltys et al., 2003; Gerloff et al., 2006; Lotze et al., 2006;Schaechter and Perdue, 2007; Weiller et al., 1993). The functionalsignificance of enhanced contralesional activation in strokepatients has been much debated. This debate has been due, inpart, to inconsistent results of TMS studies that found thatinactivation of the contralesional M1 in hemiparetic stroke patientsimproved (Mansur et al., 2005; Takeuchi et al., 2005), degraded(Lotze et al., 2006), or left unchanged (Werhahn et al., 2003) motorperformance of the affected hand. The current findings suggest thatthe degree of enhanced motor task-related activation in thecontralesional M1/S1 of chronic stroke patients is directlyproportionate to the extent of damage of the ipsilesional CST.They do not allow us to clearly determine whether this regionalincrease in activation played a functional role in compensating forthe ipsilesional CST damage in the patients. It is noteworthy,however, that detailed kinematics (amplitude, speed, acceleration,jerk, mirroring) of the movement performed by the affected handduring fMRI were not significantly different from the kinematics ofunaffected hand movement. TMS-induction of an M1 “virtuallesion” in normal adults has been shown to enhance excitability ofthe “contralesional M1” without a measurable loss in hand motorfunction (Schambra et al., 2003). Accordingly, it is conceivablethat the enhanced contralesional M1/S1 activation observed in thechronic stroke patients might reflect altered interhemisphericinteractions that provided compensatory support for voluntarymovement of the affected hand in face of the ipsilesional CSTdamage.
Poorer structural integrity of the ipsilesional CST was alsoassociated with increased activation in the ventral region of thecontralateral (ipsilesional) M1/S1 during affected hand movementin the patients. Notably, the level of activation in this ventral M1/S1 region during affected hand movement was not significantlydifferent from that occurring during unaffected hand movement.Other imaging studies suggest complex changes occurring in thisventral region of the ipsilesional M1/S1 in stroke patients.Decreased activation in the ventral, ipsilesional M1/S1 duringaffected hand movement has been reported in chronic strokepatients relative to controls (Zemke et al., 2003). Conversely,increased activation in the ventral, ipsilesional M1/S1 has beendemonstrated in chronic stroke patients relative to controls inassociation with an infarct involving the PLIC (Weiller et al., 1993)or the motor cortex (Cramer and Crafton, 2006), and with a ventralshift in the somatotopic representation of the fingers (Cramer andCrafton, 2006). These prior reports, considered together with the
current findings, tentatively suggest that activity in the ventralregion of the ipsilesional M1/S1 may be generally depressed inchronic stroke patients; yet this depression may be proportionallyoffset by greater CST damage.
We observed increased activation in the ipsilateral (contrale-sional) supplementary motor area, extended into the neighboringcingulate cortex, during movement of the affected hand relative tothe unaffected hand of the chronic stroke patients. Several priorfunctional imaging studies have reported increased activation ofthese midline regions in stroke patients relative to controls, thoughthe laterality of the enhancement has been variable across studies(Foltys et al., 2003; Nair et al., 2007; Schaechter and Perdue, 2007;Weiller et al., 1993). We found that activation in the contralesionalsupplementary motor area/cingulate cortex was not, however,linearly related to the extent of CST damage. These results suggestthat factors other than the severity of CST damage also contributeto reorganization of functional activity in stroke patients. Thesefactors may include the distribution and severity of damage in thewider motor network.
A quantitative relationship between the extent of structuraldamage to the CST and activation in sensorimotor cortices hasbeen demonstrated in patient populations other than stroke.Increased lesion load along the CST in patients who experienceda single attack of hemiparesis due to presumptive multiple sclerosishas been shown to correlate with increased activation in bilateralM1/S1 (Pantano et al., 2002). Increased axonal injury along theCST has also been shown to correlate with increased activation inthe contralesional motor cortex in patients with cerebral autosomaldominant arteriopathy with subcortical infarcts and leukoencepha-lopathy (CADASIL) (Reddy et al., 2002). These findings, togetherwith our results from stroke patients, suggest that CST damage tothe human brain elicits a proportionate level of functionalreorganization in sensorimotor cortices. Prior studies in animalssimilarly demonstrated that increased damage to the motor cortexresulted in a proportionate level of functional reorganization inremote sensorimotor cortices (Biernaskie et al., 2005; Dancauseet al., 2006; Frost et al., 2003). Cumulatively, these findings inhumans and animals suggest that the brain may respond tostructural damage of key structures involved in hand motorperformance (i.e., M1 or CST) by proportionately increasingactivity in remote sensorimotor cortices.
In summary, the current study demonstrated that greaterstructural damage to the ipsilesional CST, as measured bytractography and morphometry, was linearly related to increasedmotor task-related activation in bilateral M1/S1 regions remote tothe ipsilesional hand area in chronic hemiparetic stroke patientswith heterogeneous lesions. This finding suggests that the extent ofCST damage is a factor relevant to the extent of functionalreorganization in the sensorimotor cortex within the clinicalpopulation. Given that motor outcome of the patients in this studywas generally good and their lesions were generally small andsubcortical, future studies are needed to determine whether thestructure–function relationship detected in the current studygeneralizes in a sample of stroke patients who represent thebroader clinical population.
Acknowledgments
This study was supported by grants from the National Institutesof Health K23-HD044425 (to J.D.S.), NCRR (P41-RR14075), andMIND Institute. We thank Mingwang Zhu, M.D., Ph.D. for

1380 J.D. Schaechter et al. / NeuroImage 39 (2008) 1370–1382
calculating lesion volumes and cerebral peduncle sizes; BrendanConnell for assisting in MRI data acquisition; and Mark Vangel,Ph.D. and Thomas Benner, Ph.D. for helpful discussions.
Appendix A. Supplementary data
Supplementary data associated with this article can be found, inthe online version, at doi:10.1016/j.neuroimage.2007.09.071.
References
Basser, P.J., 1995. Inferring microstructural features and the physiologicalstate of tissues from diffusion-weighted images. NMR Biomed. 8,333–344.
Basser, P.J., Mattiello, J., LeBihan, D., 1994. Estimation of the effective self-diffusion tensor from the NMR spin echo. J. Magn. Reson., B 103,247–254.
Basser, P.J., Pajevic, S., Pierpaoli, C., Duda, J., Aldroubi, A., 2000. In vivofiber tractography using DT-MRI data. Magn. Reson.Med. 44, 625–632.
Behrens, T.E., Berg, H.J., Jbabdi, S., Rushworth, M.F., Woolrich, M.W.,2007. Probabilistic diffusion tractography with multiple fibre orienta-tions: what can we gain? NeuroImage 34, 144–155.
Biernaskie, J., Szymanska, A., Windle, V., Corbett, D., 2005. Bi-hemispheric contribution to functional motor recovery of the affectedforelimb following focal ischemic brain injury in rats. Eur. J. Neurosci.21, 989–999.
Butefisch, C.M., Kleiser, R., Korber, B., Muller, K., Wittsack, H.J.,Homberg, V., Seitz, R.J., 2005. Recruitment of contralesional motorcortex in stroke patients with recovery of hand function. Neurology 64,1067–1069.
Carpenter, M.B., 1976. Human Neuroanatomy. Williams and Wilkins Co,Baltimore.
Chollet, F., DiPiero, V., Wise, R.J.S., Brooks, D.J., Dolan, R.J., Frackowiak,R.S.J., 1991. The functional anatomy of motor recovery after stroke inhumans: a study with positron emission tomography. Ann. Neurol. 29,63–71.
Chung, M.K., Worsley, K.J., Robbins, S., Paus, T., Taylor, J., Giedd, J.N.,Rapoport, J.L., Evans, A.C., 2003. Deformation-based surface morpho-metry applied to gray matter deformation. NeuroImage 18, 198–213.
Conturo, T.E., Lori, N.F., Cull, T.S., Akbudak, E., Snyder, A.Z., Shimony,J.S., McKinstry, R.C., Burton, H., Raichle, M.E., 1999. Trackingneuronal fiber pathways in the living human brain. Proc. Natl. Acad.Sci. U. S. A. 96, 10422–10427.
Cramer, S.C., Crafton, K.R., 2006. Somatotopy and movement representa-tion sites following cortical stroke. Exp. Brain Res. 168, 25–32.
Cramer, S.C., Nelles, G., Benson, R.R., Kaplan, J.D., Parker, R.A., Kwong,K.K., Kennedy, D.N., Finklestein, S.P., Rosen, B.R., 1997. A functionalMRI study of subjects recovered from hemiparetic stroke. Stroke 28,2518–2527.
Dale, A., Fischl, B., Sereno, M., 1999. Cortical surface-based analysis: I.Segmentation and surface reconstruction. NeuroImage 9, 179–194.
Dancause, N., Barbay, S., Frost, S.B., Zoubina, E.V., Plautz, E.J., Mahnken,J.D., Nudo, R.J., 2006. Effects of small ischemic lesions in the primarymotor cortex on neurophysiological organization in ventral premotorcortex. J. Neurophysiol. 96, 3506–3511.
Desrosiers, J., Hebert, R., Bravo, G., Dutil, E., 1995. The Purdue Pegboardtest: normative data for people aged 60 and over. Disabil. Rehabil. 17,217–224.
Feydy, A., Carlier, R., Roby-Brami, A., Bussel, B., Cazalis, F., Pierol, L.,Burnod, Y., Maier, M.A., 2002. Longitudinal study of motor recoveryafter stroke: recruitment and focusing of brain activation. Stroke 33,1610–1617.
Fischl, B., Sereno, M.I., Dale, A.M., 1999a. Cortical surface-based analysis:II. Inflation, flattening, and a surface-based coordinate system. Neuro-Image 9, 195–207.
Fischl, B., Sereno, M.I., Tootell, R.B.H., Dale, A.M., 1999b. High-resolution intersubject averaging and a coordinate system for the corticalsurface. Hum. Brain Mapp. 8, 272–284.
Foltys, H., Krings, T., Meister, I.G., Sparing, R., Boroojerdi, B., Thron, A.,Topper, R., 2003. Motor representation in patients rapidly recoveringafter stroke: a functional magnetic resonance imaging and transcranialmagnetic stimulation study. Clin. Neurophysiol. 114, 2404–2415.
Forman, S.D., Cohen, J.D., Fitzgerald, M., Eddy, W.F., Mintum, M.A., Noll,D.C., 1995. Improved assessment of significant activation in functionalmagnetic resonance imaging (fMRI): use of a cluster-size threshold.Magn. Reson. Med. 33, 636–647.
Fridman, E.A., Hanakawa, T., Chung, M., Hummel, F., Leiguarda, R.C.,Cohen, L.G., 2004. Reorganization of the human ipsilesional premotorcortex after stroke. Brain 127, 747–758.
Fries, W., Danek, A., Scheidtmann, K., Hamburger, C., 1993. Motorrecovery following capsular stroke: role of descending pathways frommultiple motor areas. Brain 116, 369–382.
Frost, S.B., Barbay, S., Friel, K.M., Plautz, E.J., Nudo, R.J., 2003.Reorganization of remote cortical regions after ischemic brain injury: apotential substrate for stroke recovery. J. Neurophysiol. 89, 3205–3214.
Gerloff, C., Bushara, K., Sailer, A., Wassermann, E.M., Chen, R., Matsuoka,T., Waldvogel, D., Wittenberg, G.F., Ishii, K., Cohen, L.G., Hallett, M.,2006. Multimodal imaging of brain reorganization in motor areas of thecontralesional hemisphere of well recovered patients after capsularstroke. Brain 129, 791–808.
Geyer, S., Ledberg, A., Schleicher, A., Kinomura, S., Schormann, T.,Burgel, U., Klingberg, T., Larsson, J., Zilles, K., Roland, P.E., 1996. Twodifferent areas within the primary motor cortex of man. Nature 382,805–807.
Geyer, S., Schleicher, A., Zilles, K., 1999. Areas 3a, 3b, and 1 of humanprimary somatosensory cortex: 1. Microstructural organization andinterindividual variability. NeuroImage 10, 63–83.
Geyer, S., Matelli, M., Luppino, G., Zilles, K., 2000. Functionalneuroanatomy of the primate isocortical motor system. Anat. Embryol.(Berl) 202, 443–474.
Grefkes, C., Geyer, S., Schormann, T., Roland, P., Zilles, K., 2001. Humansomatosensory area 2: observer-independent cytoarchitectonic mapping,interindividual variability, and population map. NeuroImage 14,617–631.
Hepp-Reymond, M.C., Wiesendanger, M., 1972. Unilateral pyramidotomyin monkeys: effect on force and speed of a conditioned precision grip.Brain Res. 36, 117–131.
Holodny, A.I., Gor, D.M., Watts, R., Gutin, P.H., Ulug, A.M., 2005.Diffusion-tensor MR tractography of somatotopic organization ofcorticospinal tracts in the internal capsule: initial anatomic results incontradistinction to prior reports. Radiology 234, 649–653.
Inoue, Y., Matsumura, Y., Fukuda, T., Nemoto, Y., Shirahata, N., Suzuki, T.,Shakudo, M., Yawata, S., Tanaka, S., Takemoto, K., et al., 1990. MRimaging of Wallerian degeneration in the brainstem: temporal relation-ships. AJNR Am. J. Neuroradiol. 11, 897–902.
Jaillard, A., Martin, C.D., Garambois, K., Lebas, J.F., Hommel, M., 2005.Vicarious function within the human primary motor cortex? Alongitudinal fMRI stroke study. Brain 128, 1122–1138.
Johansen-Berg, H., Behrens, T.E., 2006. Just pretty pictures? What diffusiontractography can add in clinical neuroscience. Curr. Opin. Neurol. 19,379–385.
Jones, D.K., Lythgoe, D., Horsfield, M.A., Simmons, A., Williams, S.C.,Markus, H.S., 1999a. Characterization of white matter damage inischemic leukoaraiosis with diffusion tensor MRI. Stroke 30,393–397.
Jones, D.K., Simmons, A., Williams, S.C., Horsfield, M.A., 1999b. Non-invasive assessment of axonal fiber connectivity in the human brain viadiffusion tensor MRI. Magn. Reson. Med. 42, 37–41.
Kuhn, M.J., Mikulis, D.J., Ayoub, D.M., Kosofsky, B.E., Davis, K.R.,Taveras, J.M., 1989. Wallerian degeneration after cerebral infarction:evaluation with sequential MR imaging. Radiology 172, 179–182.
Lotze, M., Markert, J., Sauseng, P., Hoppe, J., Plewnia, C., Gerloff, C., 2006.

1381J.D. Schaechter et al. / NeuroImage 39 (2008) 1370–1382
The role of multiple contralesional motor areas for complex handmovements after internal capsular lesion. J. Neurosci. 26, 6096–6102.
Loubinoux, I., Carel, C., Pariente, J., Dechaumont, S., Albucher, J.F.,Marque, P., Manelfe, C., Chollet, F., 2003. Correlation between cerebralreorganization and motor recovery after subcortical infarcts. Neuro-Image 20, 2166–2180.
Mansur, C.G., Fregni, F., Boggio, P.S., Riberto, M., Gallucci-Neto, J.,Santos, C.M., Wagner, T., Rigonatti, S.P., Marcolin, M.A., Pascual-Leone, A., 2005. A sham stimulation-controlled trial of rTMS of theunaffected hemisphere in stroke patients. Neurology 64, 1802–1804.
Medical Research Council (Great Britain), 1976. Aids to the Examination ofthe Peripheral Nervous System. H.M. Stationery Office, London.
Moller, M., Frandsen, J., Andersen, G., Gjedde, A., Vestergaard-Poulsen, P.,Ostergaard, L., 2007. Dynamic changes of corticospinal tracts afterstroke detected by fibertracking. J. Neurol. Neurosurg. Psychiatry 78,587–592.
Morecraft, R.J., Herrick, J.L., Stilwell-Morecraft, K.S., Louie, J.L.,Schroeder, C.M., Ottenbacher, J.G., Schoolfield, M.W., 2002. Localiza-tion of arm representation in the corona radiata and internal capsule inthe non-human primate. Brain 125, 176–198.
Mori, S., Crain, B.J., Chacko, V.P., van Zijl, P.C., 1999. Three-dimensionaltracking of axonal projections in the brain by magnetic resonanceimaging. Ann. Neurol. 45, 265–269.
Nair, D.G., Hutchinson, S., Fregni, F., Alexander, M., Pascual-Leone, A.,Schlaug, G., 2007. Imaging correlates of motor recovery from cerebralinfarction and their physiological significance in well-recoveredpatients. NeuroImage 34, 253–263.
Newton, J.M., Ward, N.S., Parker, G.J., Deichmann, R., Alexander, D.C.,Friston, K.J., Frackowiak, R.S., 2006. Non-invasive mapping ofcorticofugal fibres from multiple motor areas-relevance to strokerecovery. Brain 129, 1844–1858.
Nudo, R.J., Milliken, G., 1996. Reorganization of movement representationsin primary motor cortex following focal ischemic infarcts in adultsquirrel monkeys. J. Neurophysiol. 75, 2144–2149.
Oldfield, R.C., 1971. The assessment and analysis of handedness: theEdinburgh Inventory. Neuropsychologia 9, 97–113.
Orita, T., Tsurutani, T., Izumihara, A., Kajiwara, K., 1994. Early, evolvingWallerian degeneration of the pyramidal tract in cerebrovasculardiseases: MR study. J. Comput. Assist. Tomogr. 18, 943–946.
Pantano, P., Mainero, C., Iannetti, G.D., Caramia, F., Di Legge, S., Piattella,M.C., Pozzilli, C., Bozzao, L., Lenzi, G.L., 2002. Contribution ofcorticospinal tract damage to cortical motor reorganization after a singleclinical attack of multiple sclerosis. NeuroImage 17, 1837–1843.
Pierpaoli, C., Jezzard, P., Basser, P.J., Barnett, A., Di Chiro, G., 1996.Diffusion tensor MR imaging of the human brain. Radiology 201,637–648.
Pierpaoli, C., Barnett, A., Pajevic, S., Chen, R., Penix, L., Virta, A., Basser,P., 2001. Water diffusion changes in Wallerian degeneration and theirdependence on white matter architecture. NeuroImage 13, 1174–1185.
Reddy, H., De Stefano, N., Mortilla, M., Federico, A., Matthews, P.M.,2002. Functional reorganization of motor cortex increases with greateraxonal injury from CADASIL. Stroke 33, 502–508.
Reese, T.G., Heid, O., Weisskoff, R.M., Wedeen, V.J., 2003. Reduction ofeddy-current-induced distortion in diffusion MRI using a twice-refocused spin echo. Magn. Reson. Med. 49, 177–182.
Sage, C.A., Peeters, R.R., Gorner, A., Robberecht, W., Sunaert, S., 2007.Quantitative diffusion tensor imaging in amyotrophic lateral sclerosis.NeuroImage 34, 486–499.
Schaechter, J.D., Perdue, K.L., 2007. Enhanced cortical activation in thecontralesional hemisphere of chronic stroke patients in response to motorskill challenge. Cereb. Cortex (AdvanceAccess published June 29, 2007).
Schambra, H.M., Sawaki, L., Cohen, L.G., 2003. Modulation of excitabilityof human motor cortex (M1) by 1 Hz transcranial magnetic stimulationof the contralateral M1. Clin. Neurophysiol. 114, 130–133.
Schaechter, J.D., Stokes, C., Connell, B.D., Perdue, K., Bonmassar, G.,2006. Finger motion sensors for fMRI motor studies. Neuroimage 31,1549–1559.
Shimoyama, I., Ninchoji, T., Uemura, K., 1990. The finger-tapping test. Aquantitative analysis. Arch. Neurol. 47, 681–684.
Stinear, C.M., Barber, P.A., Smale, P.R., Coxon, J.P., Fleming, M.K.,Byblow, W.D., 2007. Functional potential in chronic stroke patientsdepends on corticospinal tract integrity. Brain 130, 170–180.
Stovring, J., Fernando, L.T., 1983. Wallerian degeneration of thecorticospinal tract region of the brain stem: demonstration by computedtomography. Radiology 149, 717–720.
Takeuchi, N., Chuma, T., Matsuo, Y., Watanabe, I., Ikoma, K., 2005.Repetitive transcranial magnetic stimulation of contralesional primarymotor cortex improves hand function after stroke. Stroke 36,2681–2686.
Thesen, A., Heid, O., Mueller, E., Schad, L.R., 2000. Prospectiveacquisition correction for head motion with image-based tracking forreal-time fMRI. Magn. Reson. Med. 44, 457–465.
Thomalla, G., Glauche, V., Koch, M.A., Beaulieu, C., Weiller, C., Rother, J.,2004. Diffusion tensor imaging detects early Wallerian degeneration ofthe pyramidal tract after ischemic stroke. NeuroImage 22, 1767–1774.
Thomalla, G., Glauche, V., Weiller, C., Rother, J., 2005. Time course ofwallerian degeneration after ischaemic stroke revealed by diffusiontensor imaging. J. Neurol. Neurosurg. Psychiatry 76, 266–268.
Thomas, B., Eyssen, M., Peeters, R., Molenaers, G., Van Hecke, P., DeCock, P., Sunaert, S., 2005. Quantitative diffusion tensor imaging incerebral palsy due to periventricular white matter injury. Brain 128,2562–2577.
Tiffin, J., Asher, E.J., 1948. The Purdue Pegboard: norms and studies ofreliability and validity. J. Appl. Psychol. 32, 234–247.
Tombari, D., Loubinoux, I., Pariente, J., Gerdelat, A., Albucher, J.F., Tardy,J., Cassol, E., Chollet, F., 2004. A longitudinal fMRI study: inrecovering and then in clinically stable sub-cortical stroke patients.NeuroImage 23, 827–839.
van der Kouwe, A.J., Benner, T., Fischl, B., Schmitt, F., Salat, D.H., Harder,M., Sorensen, A.G., Dale, A.M., 2005. On-line automatic slicepositioning for brain MR imaging. NeuroImage 27, 222–230.
Warabi, T., Miyasaka, K., Inoue, K., Nakamura, N., 1987. Computedtomographic studies of the basis pedunculi in chronic hemiplegicpatients: topographic correlation between cerebral lesion and midbrainshrinkage. Neuroradiology 29, 409–415.
Warabi, T., Inoue, K., Noda, H., Murakami, S., 1990. Recovery ofvoluntary movement in hemiplegic patients. Correlation with degen-erative shrinkage of the cerebral peduncles in CT images. Brain 113,177–189.
Ward, N.S., Newton, J.M., Swayne, O.B., Lee, L., Thompson, A.J.,Greenwood, R.J., Rothwell, J.C., Frackowiak, R.S., 2006. Motor systemactivation after subcortical stroke depends on corticospinal systemintegrity. Brain 129, 809–819.
Wedeen, V.J., Hagmann, P., Tseng, W.Y., Reese, T.G., Weisskoff, R.M.,2005. Mapping complex tissue architecture with diffusion spectrummagnetic resonance imaging. Magn. Reson. Med. 54, 1377–1386.
Weiller, C., Ramsay, S.C., Wise, R.J.S., Friston, K.J., Frackowiak,R.S.J., 1993. Individual patterns of functional reorganization in thehuman cerebral cortex after capsular infarction. Ann. Neurol. 33,181–189.
Wenzelburger, R., Kopper, F., Frenzel, A., Stolze, H., Klebe, S., Brossmann,A., Kuhtz-Buschbeck, J., Golge, M., Illert, M., Deuschl, G., 2005. Handcoordination following capsular stroke. Brain 128, 64–74.
Werhahn, K.J., Conforto, A.B., Kadom, N., Hallett, M., Cohen, L.G., 2003.Contribution of the ipsilateral motor cortex to recovery after chronicstroke. Ann. Neurol. 54, 464–472.
Werring, D.J., Toosy, A.T., Clark, C.A., Parker, G.J., Barker, G.J., Miller,D.H., Thompson, A.J., 2000. Diffusion tensor imaging can detect andquantify corticospinal tract degeneration after stroke. J. Neurol.Neurosurg. Psychiatry 69, 269–272.
Wiesendanger, M., 1984. Pyramidal tract function and the clinical“pyramidal syndrome”. Hum. Neurobiol. 2, 227–234.
Wieshmann, U.C., Clark, C.A., Symms, M.R., Franconi, F., Barker, G.J.,Shorvon, S.D., 1999. Anisotropy of water diffusion in corona radiata and

1382 J.D. Schaechter et al. / NeuroImage 39 (2008) 1370–1382
cerebral peduncle in patients with hemiparesis. NeuroImage 10,225–230.
Yang, Q., Tress, B.M., Barber, P.A., Desmond, P.M., Darby, D.G., Gerraty,R.P., Li, T., Davis, S.M., 1999. Serial study of apparent diffusioncoefficient and anisotropy in patients with acute stroke. Stroke 30,2382–2390.
Yousry, T.A., Schmid, U.D., Alkadhi, H., Schmidt, D., Peraud, A., Buettner,A., Winkler, P., 1997. Localization of the motor hand area to a knob onthe precentral gyrus. A new landmark. Brain 120, 141–157.
Zemke, A.C., Heagerty, P.J., Lee, C., Cramer, S.C., 2003. Motor cortexorganization after stroke is related to side of stroke and level of recovery.Stroke 34, e23–e28.