structural design and stability of a 6,000 ton capacity ... gangadharan... · structural design and...
TRANSCRIPT

Structural Design and Stability of a 6,000 ton Capacity Floating Dock as per DNV-GL Rules
Kodathoor Gangadharan Midhun
Master Thesis
presented in partial fulfillment of the requirements for the double degree:
“Advanced Master in Naval Architecture” conferred by University of Liege "Master of Sciences in Applied Mechanics, specialization in Hydrodynamics,
Energetics and Propulsion” conferred by Ecole Centrale de Nantes
developed at West Pomeranian University of Technology, Szczecin in the framework of the
“EMSHIP” Erasmus Mundus Master Course
in “Integrated Advanced Ship Design”
Ref. 159652-1-2009-1-BE-ERA MUNDUS-EMMC
Supervisor: Dr. Zbigniew Sekulski, West Pomeranian University of Technology, Szczecin
Internship tutor: Mr. Szymon Chwalisz, Nelton Sp. z o.o., Szczecin
Reviewer: Dr. Thomas Lindemann, University of Rostock, Germany
West Pomeranian University of Technology, Szczecin February 2018

Kodathoor Gangadharan Midhun
2 Master Thesis Developed at West Pomeranian University of Technology, Szczecin

Structural Design and Stability of a 6,000 ton Capacity Floating Dock as per DNV-GL Rules
“EMSHIP” Erasmus Mundus Master Course, period of study Sept 2016 – Feb 2018 3
DECLARATION OF AUTHORSHIP
I, Kodathoor Gangadharan Midhun declare that this thesis and the work presented in it are my own and has been generated by me as the result of my own original research. Structural Design and Stability of a 6,000 ton Capacity Floating Dock as per DNV-GL Rules I confirm that: 1. This work was done wholly or mainly while in candidature for a research degree at this
University; 2. Where any part of this thesis has previously been submitted for a degree or any other
qualification at this University or any other institution, this has been clearly stated; 3. Where I have consulted the published work of others, this is always clearly attributed; 4. Where I have quoted from the work of others, the source is always given. With the exception
of such quotations, this thesis is entirely my own work; 5. I have acknowledged all main sources of help; 6. Where the thesis is based on work done by myself jointly with others, I have made clear
exactly what was done by others and what I have contributed myself; 7. Either none of this work has been published before submission, or parts of this work have
been published as: [please list references below]:
8. I cede copyright of the thesis in favour of the West Pomeranian University of Technology, Szczecin, Poland
Signed: Date:
Kodathoor Gangadharan Midhun
4 Master Thesis Developed at West Pomeranian University of Technology, Szczecin
Structural Design and Stability of a 6,000 ton Capacity Floating Dock as per DNV-GL Rules
“EMSHIP” Erasmus Mundus Master Course, period of study Sept 2016 – Feb 2018 5
TABLE OF CONTENTS
1 INTRODUCTION .......................................................................................................... 17
1.1 General ................................................................................................................... 17
1.2 Project Inputs ......................................................................................................... 18
1.3 Objectives .............................................................................................................. 19
1.4 Outline of the Work ............................................................................................... 20
1.5 Case Study ............................................................................................................. 20
1.6 Literature Review ................................................................................................... 21
1.7 Calculation and Design Tools ................................................................................ 24
2 SCANTLINGS DESIGN ................................................................................................ 25
2.1 General ................................................................................................................... 25
2.2 Geometry ................................................................................................................ 25
2.3 Pontoon Structure ................................................................................................... 28
2.3.1 Plating ..................................................................................................... 28
2.3.2 Bottom Plating ........................................................................................ 28
2.3.3 Deck Plating ............................................................................................ 28
2.3.4 Side Plating ............................................................................................. 29
2.3.5 Bulkhead Plating (longitudinal) .............................................................. 29
2.3.6 Bottom Girder ......................................................................................... 30
2.3.7 Bottom Frame .......................................................................................... 30
2.3.8 Bottom Stiffeners ..................................................................................... 31
2.3.9 Deck Girder ............................................................................................. 31
2.3.10 Deck Frame ............................................................................................. 31
2.3.11 Deck Stiffeners ........................................................................................ 32
2.3.12 Side Frame .............................................................................................. 32
2.3.13 Side Stiffeners .......................................................................................... 33
2.3.14 Bulkhead Stiffeners (longitudinal) .......................................................... 34
2.4 Dock Wing Structure ............................................................................................. 34
2.4.1 Plating ..................................................................................................... 34
2.4.2 Upper Deck Plating ................................................................................. 34
2.4.3 Safety Deck Plating ................................................................................. 35
2.4.4 Tween Deck Plating ................................................................................ 35
2.4.5 Intermediate Deck Plating ...................................................................... 36

Kodathoor Gangadharan Midhun
6 Master Thesis Developed at West Pomeranian University of Technology, Szczecin
2.4.6 Side Wall Plating ..................................................................................... 36
2.4.7 Bulkhead Plating (transverse) ................................................................. 38
2.4.8 Bottom Frame .......................................................................................... 38
2.4.9 Upper Deck Frame .................................................................................. 39
2.4.10 Upper Deck Stiffeners ............................................................................. 39
2.4.11 Safety Deck Frame .................................................................................. 40
2.4.12 Safety Deck Stiffeners .............................................................................. 40
2.4.13 Tween Deck Frame ................................................................................. 40
2.4.14 Tween Deck Stiffeners ............................................................................. 41
2.4.15 Inter Deck Frame .................................................................................... 41
2.4.16 Inter Deck Stiffeners ................................................................................ 42
2.4.17 Side Wall Frame ...................................................................................... 42
2.4.18 Side Stiffeners .......................................................................................... 43
2.4.19 Bulkhead Stiffeners (transverse) ............................................................. 44
2.5 2D Section Drawings ............................................................................................. 45
2.6 Slenderness Check ................................................................................................. 48
2.6.1 Net thickness of Plate Panels .................................................................. 48
2.6.2 Net thickness of Stiffeners ....................................................................... 49
2.6.3 Net thickness of Primary Supporting Members ...................................... 51
2.6.4 Net thickness of Pillars ............................................................................ 52
2.7 Summary ................................................................................................................ 53
3 WEIGHTS AND CoG ESTIMATION ........................................................................... 54
3.1 General ................................................................................................................... 54
3.2 Summary ................................................................................................................ 56
4 GLOBAL STRENGTH ANALYSIS .............................................................................. 57
4.1 General ................................................................................................................... 57
4.2 Loads and Load Distribution ................................................................................. 59
4.3 Sagging and Hogging Ship Load ........................................................................... 59
4.4 Finite Element Model ............................................................................................ 61
4.5 Boundary Conditions and Connections ................................................................. 63
4.6 Finite Element Analysis ......................................................................................... 64
4.6.1 Working Draft Condition ........................................................................ 64
4.6.2 Maximum Submerged Condition ............................................................. 70
4.6.3 Docking and Undocking Condition ......................................................... 72

Structural Design and Stability of a 6,000 ton Capacity Floating Dock as per DNV-GL Rules
“EMSHIP” Erasmus Mundus Master Course, period of study Sept 2016 – Feb 2018 7
4.7 Summary ................................................................................................................ 77
5 BUCKLING CHECK ..................................................................................................... 80
5.1 General ................................................................................................................... 80
5.2 Buckling of Pillars ................................................................................................. 81
6 CONNECTION DESIGN ............................................................................................... 83
6.1 General ................................................................................................................... 83
6.2 Bolt Loads Calculation .......................................................................................... 83
6.3 Connecting Elements Calculation .......................................................................... 85
6.3.1 Design for Tension .................................................................................. 85
6.3.2 Design for Shear ..................................................................................... 86
6.4 Bolting Arrangement ............................................................................................. 87
7 INTACT STABILITY CHECK ...................................................................................... 89
7.1 General ................................................................................................................... 89
7.2 Case of Floating dock ............................................................................................ 90
7.3 Stability Analysis Tool .......................................................................................... 92
7.4 Coordinate System ................................................................................................. 93
7.5 Hydrostatic Parameters .......................................................................................... 93
7.6 Tank Capacities ...................................................................................................... 94
7.7 Stability Analysis ................................................................................................... 96
7.7.1 Case I: Lightship Condition .................................................................... 96
7.7.2 Case II: Fully Submerged Condition ...................................................... 97
7.7.3 Case III: Docking Condition (water level just below the dock blocks) ... 99
7.7.4 Case IV: Working Condition ................................................................. 100
7.7.5 Case IV: Undocking Condition ............................................................. 101
7.8 Limiting vessel VCG ........................................................................................... 103
7.9 Summary .............................................................................................................. 103
8 FEASIBILITY STUDY FOR SUBMARINES CONSTRUCTION ............................ 105
8.1 Lifting Capacity in Strength ................................................................................. 105
8.2 Space Requirements ............................................................................................. 106
8.3 Lifting Capacity in Stability ................................................................................. 107
9 CONCLUSION ............................................................................................................. 108
10 REFERENCES ............................................................................................................. 111

Kodathoor Gangadharan Midhun
8 Master Thesis Developed at West Pomeranian University of Technology, Szczecin
LIST OF TABLES
Table 1: Main Particulars ......................................................................................................... 19
Table 2: Items list from the drawings ....................................................................................... 47
Table 3: Slenderness check for plates ...................................................................................... 49
Table 4: Slenderness check for stiffeners ................................................................................. 50
Table 5: Slenderness check for primary supporting members ................................................. 51
Table 6: Slenderness check for pillars ...................................................................................... 52
Table 7: Summary of weights .................................................................................................. 56
Table 8: FEM data .................................................................................................................... 61
Table 9: Material properties ..................................................................................................... 61
Table 10: Stress results- Longitudinal bending and shear- Sagging ship ................................ 65
Table 11: Stress Results- Longitudinal bending and shear- Hogging ship .............................. 65
Table 12: Stress results- Transverse bending and shear- Sagging ship .................................... 65
Table 13: Stress results- Transverse bending and shear- Hogging ship ................................... 66
Table 14: Revised longitudinal bending stress results ............................................................. 66
Table 15: Revised transverse bending stress results ................................................................ 66
Table 16: Stress results- Longitudinal bending and shear ........................................................ 71
Table 17: Stress results- Transverse bending and shear ........................................................... 71
Table 18: Stress results- Longitudinal bending and shear- Sagging ship ................................ 73
Table 19: Stress results- Longitudinal bending and shear- Hogging ship ................................ 73
Table 20: Stress results- Transverse bending and shear- Sagging ship .................................... 74
Table 21: Stress results- Transverse bending and shear- Hogging ship ................................... 74
Table 22: Buckling acceptance criteria .................................................................................... 80
Table 23: Gross section properties ........................................................................................... 81
Table 24: Net section properties ............................................................................................... 82
Table 25: Axial stress result ..................................................................................................... 82
Table 26: Connecting plate parameters in tension ................................................................... 85
Table 27: Tensile yielding ........................................................................................................ 85
Table 28: Tensile rupture ......................................................................................................... 85
Table 29: Connecting plate parameters in shear ...................................................................... 86
Table 30: Shear yielding .......................................................................................................... 86
Table 31: Shear rupture ............................................................................................................ 86
Table 32: Mean values from typical ship data ......................................................................... 91

Structural Design and Stability of a 6,000 ton Capacity Floating Dock as per DNV-GL Rules
“EMSHIP” Erasmus Mundus Master Course, period of study Sept 2016 – Feb 2018 9
Table 33: Wind force and parameters ...................................................................................... 92
Table 34: Hydrostatic particulars for maximum working draft ............................................... 93
Table 35: Tank capacities ......................................................................................................... 95
Table 36: Summary of results (Lightship condition) ............................................................... 96
Table 37: Summary of results (Fully submerged condition) .................................................... 98
Table 38: Summary of results (Docking condition) ................................................................. 99
Table 39: Summary of results (Working Condition) ............................................................. 100
Table 40: Summary of results (Undocking condition) ........................................................... 102
Table 41: Basic data for study ................................................................................................ 105

Kodathoor Gangadharan Midhun
10 Master Thesis Developed at West Pomeranian University of Technology, Szczecin
LIST OF FIGURES
Figure 1: Floating dry dock components .................................................................................. 17
Figure 2: A generic sketch of the floating dock profile view ................................................... 26
Figure 3: 3D Geometry ............................................................................................................ 26
Figure 4: Profile view ............................................................................................................... 26
Figure 5: End view ................................................................................................................... 27
Figure 6: Typical pontoon structure arrangement .................................................................... 27
Figure 7: Typical dock wing structure arrangement ................................................................ 27
Figure 8: Mid-section view between frames (CL-Port) ........................................................... 45
Figure 9: Typical pontoon section ............................................................................................ 46
Figure 10: Mid-section view in way of frames (CL-Starboard) ............................................... 46
Figure 11: Stiffener Scantling Parameters ............................................................................... 50
Figure 12: Coordinate system .................................................................................................. 55
Figure 13: Percentage distribution of weights .......................................................................... 56
Figure 14: Lightship condition ................................................................................................. 57
Figure 15: Fully submerged condition ..................................................................................... 58
Figure 16: Docking/ undocking condition ............................................................................... 58
Figure 17: Working condition .................................................................................................. 58
Figure 18: Weight distribution of standard sagging ship ......................................................... 60
Figure 19: Weight distribution of standard hogging ship ........................................................ 60
Figure 20: Rectangular coordinate system ............................................................................... 62
Figure 21: Global finite element model perspective view ....................................................... 62
Figure 22: Global finite element model side view ................................................................... 62
Figure 23: Global finite element model end view (enlarged) .................................................. 63
Figure 24: A wire frame view of the model with boundary constraints .................................. 64
Figure 25: Max. Von Mises stress plot- Sagging ship ............................................................. 67
Figure 26: Von Mises Stress excluding high yield strength members ..................................... 67
Figure 27: Max. Von Mises stress plot- Hogging ship ............................................................ 68
Figure 28: Von Mises Stress plot excluding high yield strength members .............................. 69
Figure 29: Vertical deflection along the length in sagging and hogging working condition ... 69
Figure 30: Vertical deflection along the breadth in sagging and hogging working condition . 70
Figure 31: Max. Von Mises stress plot .................................................................................... 72

Structural Design and Stability of a 6,000 ton Capacity Floating Dock as per DNV-GL Rules
“EMSHIP” Erasmus Mundus Master Course, period of study Sept 2016 – Feb 2018 11
Figure 32: Max Von Mises stress plot- Sagging ship .............................................................. 75
Figure 33: Von Mises Stress plot excluding high yield strength members .............................. 75
Figure 34: Max. Von Mises stress plot- Hogging ship ............................................................ 76
Figure 35: Von Mises Stress excluding high yield strength members ..................................... 76
Figure 36: Vertical deflection along the length in sagging and hogging docking condition ... 77
Figure 37: Vertical deflection along the breadth in sagging and hogging docking condition . 77
Figure 38: Stress Concentration ............................................................................................... 78
Figure 39: Typical I-section pillar ............................................................................................ 81
Figure 40: Typical bolting ........................................................................................................ 84
Figure 41: Bolting Option 1 ..................................................................................................... 87
Figure 42: Bolting Option 2 ..................................................................................................... 87
Figure 43: Bolting Option 3 ..................................................................................................... 88
Figure 44: Upright dock ........................................................................................................... 89
Figure 45: Heeling dock ........................................................................................................... 90
Figure 46: Coordinate system for stability analsysis ............................................................... 93
Figure 47: Tank plan- pontoon ................................................................................................. 94
Figure 48: Tank plan- view of port side ................................................................................... 95
Figure 49: Tank plan- view of stbd side ................................................................................... 95
Figure 50: Intact stability curves (Lightship condition) ........................................................... 97
Figure 51: Profile view showing the Lightship waterlevel ...................................................... 97
Figure 52: Profile view showing the fully submerged water level .......................................... 98
Figure 53: Intact stability curves (Fully submerged condition) ............................................... 98
Figure 54: Profile view showing the docking water level just below the dock blocks ............ 99
Figure 55: Intact stability curves (Docking condition) .......................................................... 100
Figure 56: Profile view showing the working condition draft level ...................................... 101
Figure 57: Intact stability curves (Working condition) .......................................................... 101
Figure 58: Profile view showing the water level at undocking condition with water level just
below docking blocks ............................................................................................................. 102
Figure 59: Intact stability curves (Undocking condition) ...................................................... 102
Figure 60: Limiting VCG curve ............................................................................................. 103
Figure 61: Scorpene Class Submarine in dock (top view- representative model) ................. 106
Figure 62: Submarines docked side-by-side (view from front- representative model) .......... 107
Kodathoor Gangadharan Midhun
12 Master Thesis Developed at West Pomeranian University of Technology, Szczecin
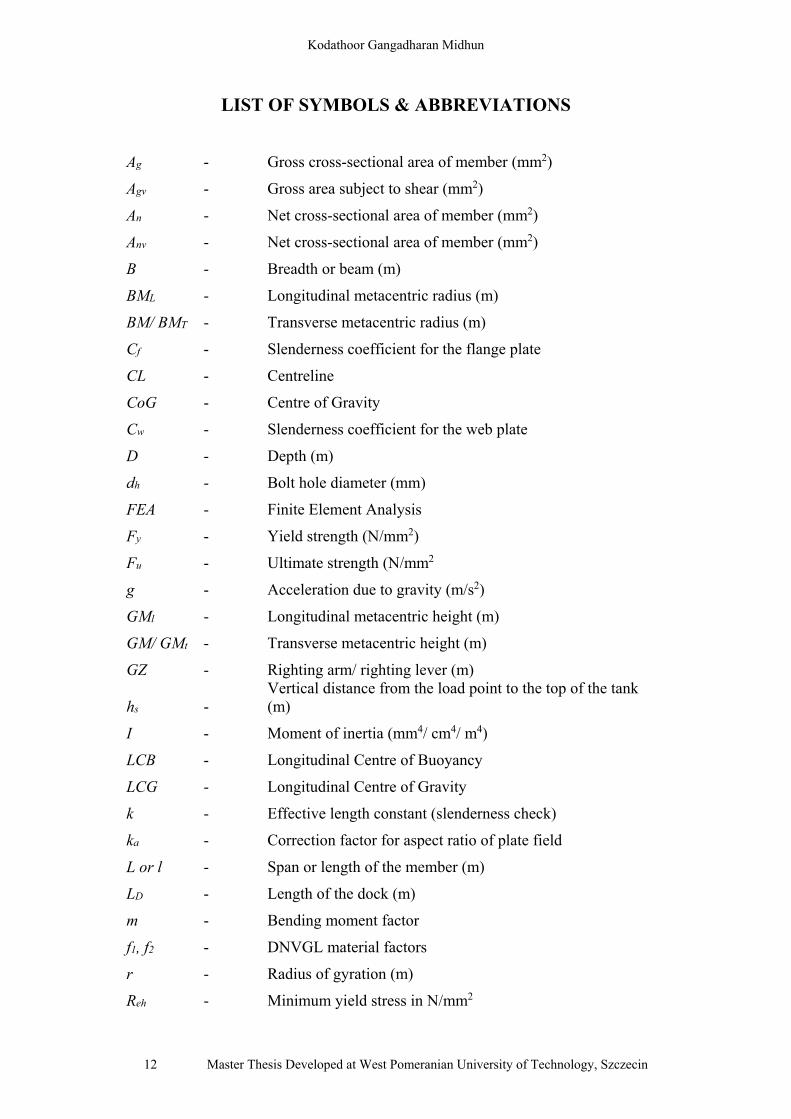
LIST OF SYMBOLS & ABBREVIATIONS
Ag - Gross cross-sectional area of member (mm2)
Agv - Gross area subject to shear (mm2)
An - Net cross-sectional area of member (mm2)
Anv - Net cross-sectional area of member (mm2)
B - Breadth or beam (m)
BML - Longitudinal metacentric radius (m)
BM/ BMT - Transverse metacentric radius (m)
Cf - Slenderness coefficient for the flange plate
CL - Centreline
CoG - Centre of Gravity
Cw - Slenderness coefficient for the web plate
D - Depth (m)
dh - Bolt hole diameter (mm)
FEA - Finite Element Analysis
Fy - Yield strength (N/mm2)
Fu - Ultimate strength (N/mm2
g - Acceleration due to gravity (m/s2)
GMl - Longitudinal metacentric height (m)
GM/ GMt - Transverse metacentric height (m)
GZ - Righting arm/ righting lever (m)
hs - Vertical distance from the load point to the top of the tank (m)
I - Moment of inertia (mm4/ cm4/ m4)
LCB - Longitudinal Centre of Buoyancy
LCG - Longitudinal Centre of Gravity
k - Effective length constant (slenderness check)
ka - Correction factor for aspect ratio of plate field
L or l - Span or length of the member (m)
LD - Length of the dock (m)
m - Bending moment factor
f1, f2 - DNVGL material factors
r - Radius of gyration (m)
Reh - Minimum yield stress in N/mm2

Structural Design and Stability of a 6,000 ton Capacity Floating Dock as per DNV-GL Rules
“EMSHIP” Erasmus Mundus Master Course, period of study Sept 2016 – Feb 2018 13
s - Spacing (mm)
sw - Spacing of web stiffeners (mm)
T - Draught (m)
t - Thickness (mm)
TCG - Transverse Centre of Gravity
tgross - Gross thickness (mm)
tk - Corrosion allowance (mm)
tnet - Net thickness (mm)
tp - Thickness of plate (mm)
tw - Thickness of web (mm)
tf - Thickness of flange (mm)
VCG - Vertical Centre of Gravity
Z - Section modulus (cm3)
σ - Stress (N/mm2)
σav - Average axial compressive stress (N/mm2)
σcr - Minimum critical buckling stress (N/mm2)
Δ - Displacement (t)

Kodathoor Gangadharan Midhun
14 Master Thesis Developed at West Pomeranian University of Technology, Szczecin
TERMS AND DEFINITIONS
i. The light displacement of the dock is its complete weight including all machinery,
lifting appliances, equipment, full supply of consumables for operation of the dock
(fuel oil, fresh water etc.), compensating ballast water (if necessary) and rest-water.
ii. The rest-water is remaining ballast water which the pumps cannot discharge.
iii. The compensating ballast water is ballast water for reduction of stresses and
deflections in the dock structures and for adjustment of the trim and heel of the dock.
iv. The pontoon bottom is the bottom of the pontoon structure.
v. The pontoon deck is the deck of the pontoon structure supporting the docking blocks.
vi. The safety deck is a watertight deck in the wing walls, located at such distance below
the upper deck as to provide a satisfactory freeboard to upper deck when all
compartments below the safety deck are flooded, but with no load on the docking
blocks.

Structural Design and Stability of a 6,000 ton Capacity Floating Dock as per DNV-GL Rules
“EMSHIP” Erasmus Mundus Master Course, period of study Sept 2016 – Feb 2018 15
ABSTRACT
This thesis work is focusing on the design and analysis of a Floating Dry Dock complying with
DNV-GL Rules with emphasis on the structural design and stability. The mentioned work was
carried out during the internship in Nelton Sp. z o.o. located in Szczecin from July 3 till
November 8 in the year 2017.
Floating Dry Docks are being widely used for the construction of ships, docking of ships for
inspection and repairs and also for ship launching. One of the major advantage of floating dry
docks from the graving docks is mobility. And a floating dry dock doesn’t require any yard
space. Floating dry docks are built to different lifting capacities, and there are different types
of designs available as well based on the requirements. With the requirement for a pontoon type
floating dry dock with 5 modules of pontoons and 2 dock wings which can be dismantled, the
design is carried out for the same with an appropriate connection between the pontoons and the
wing tanks.
Just like any other structure, the safety is of prime concern and hence various classification
societies developed rules for the design of floating dry docks with regard to the structural
design, stability, machinery, other safety and protection systems and survey requirements.
Current work is based on the rules developed by DNV-GL.
With a stability check based on approximated weights available, the work carried out involves
the global structural design, with adequate connections between different modules. With
structural design in place, more or less actual weights of the structure is calculated and then the
stability check is done based on that. Based on a feasibility check, the capacity and dimensions
of this floating dry dock is found suitable for the construction of all the types of submarines
which are currently under consideration by the Polish Navy.
Keywords: floating dry‐docks/ floating docks, design, docking, structure, load, stability, ballast

Kodathoor Gangadharan Midhun
16 Master Thesis Developed at West Pomeranian University of Technology, Szczecin

Structural Design and Stability of a 6,000 ton Capacity Floating Dock as per DNV-GL Rules
“EMSHIP” Erasmus Mundus Master Course, period of study Sept 2016 – Feb 2018 17
1 INTRODUCTION
1.1 General
A dry‐dock is a narrow basin or a vessel which can be flooded to make a marine craft resting
on the docking blocks on it to float and vice versa, i.e., water can be drained off by some
mechanism to make the structure rest on the docking blocks. These can be used for the
construction and repair of ships by docking and then by floating. This thesis work involves the
structural design and stability of a floating dry‐dock. Floating dry‐dock as the name suggests,
itself is floating. Since it is a floating structure, it works on controlled buoyancy to lift any
structure out of water for any kind of repair works or inspections. It needs to be stable floating,
carrying the intended load during the docking operations and should also have the strength to
withstand the intended loads.
Floating dry‐docks are generally U‐shaped or channel like structures, with less complex
geometry. The common structure is pontoon type consisting of water tight chambers, the
pontoon and wing walls. The draft of the floating dock is adjusted by controlling the water
ballast during the docking operations.
Figure 1: Floating dry dock components
Source: Dock Master Training Manual, Heger Dry Dock Inc.

Kodathoor Gangadharan Midhun
18 Master Thesis Developed at West Pomeranian University of Technology, Szczecin
There are different types of floating dry‐docks based on the structural assembly mainly the unit
dock which has continuous wing walls and pontoon, the composite dock which has sectional
pontoon but the wing walls are continuous and the sectional dock which is made up of different
longitudinal sections and without longitudinal structural continuity.
The structure can be made of materials like steel, concrete, timber, etc. different classification
societies have developed rules regarding the design of floating dry docks. The floating docks
are not designed for harsh environments. These are normally designed to be operated close to
the harbour and mobility is also possible. These can be used for salvage operations also. As the
main purpose of these structures is not related to transport, these are normally not provided with
any propulsion units, neither the structural hull is designed in a way to enhance smoother
movement. But these can be towed to the required locations and is one of the advantages of the
floating docks. As the structure is floating these experience motions due to the wind and
currents. So proper mooring arrangement is required for the dock. The hull, machinery,
electrical installations, etc. are covered by class certification but the mooring system has to be
considered separately.
The dock construction should consider water‐tight compartments. Most of these tanks will be
used for water ballast. Ballasting is needed to get immersion of the dock to ensure free
movement of the vessel to be docked on to the docking space. The compartment and spaces are
designed based on the requirements of intact and damage stability, and also considering an
economical pumping system to easily attain the trim and list desired.
1.2 Project Inputs
The basic inputs to the design include the type and geometry, main dimensions, and capacity
of the dock. The main dimensions have been fixed based on a concept stability analysis
performed by Nelton. A number of typical offshore vessel types have been analysed for the
dimensions and capacities and the dock dimensions have been fixed based on the feasibility of
docking those vessels. The dock dimensions like the internal width and the length are decided
purely based on the maximum dimensions of the vessels intended to be docked with enough
space for access around. But the width of dock wings and the depth of pontoon was decided
based on the stability requirements of the dock. The height of the dock wing is influenced by

Structural Design and Stability of a 6,000 ton Capacity Floating Dock as per DNV-GL Rules
“EMSHIP” Erasmus Mundus Master Course, period of study Sept 2016 – Feb 2018 19
the draft of the vessel to be docked. A concept GA developed was also provided which helps
understand the geometry and the various space arrangements. The basic inputs to the structural
design are listed below. The given data and GA has been used to develop the structural design.
Table 1: Main Particulars
Design Floating Dock
Type Sectional Pontoon Type
Material Steel
Capacity 6,000 tons
Length Overall 92.4 m
Width Overall 30 m
Width Inside 23 m
Depth Overall 15 m
Depth of Pontoon 4.5 m
Minimum Draught 1.69 m
Maximum Loaded Draught 13.5 m
Class DNV-GL
1.3 Objectives
The main objective of the work is to design and analyse the floating dry dock structure and to
check the stability criteria. The overall work break down is listed below:
i. Design the structural scantlings based on DNV-GL Rule requirements,
ii. Estimation of the weights and CoG,
iii. Global/ local strength analysis of the structure in docking,
iv. Design the connection concepts between the continuous wing tanks and sectional
pontoons,
v. Check for stability,
vi. Feasibility study considering the proposed submarine projects for the Polish Navy.

Kodathoor Gangadharan Midhun
20 Master Thesis Developed at West Pomeranian University of Technology, Szczecin
1.4 Outline of the Work
This thesis work for the design of a floating dry-dock is based on the inputs provided by design
company Nelton Sp. z.o.o., Szczecin. A concept GA was provided by Nelton along with the
preliminary stability checks based on which this work is developed. With the available inputs
on the main dimensions, the scantlings are calculated based on the DNV-GL requirements and
based on the assumed spacing and span of members.
For structural sections, the required section moduli are calculated and the sections are chosen
higher than the minimum required calculated from the class requirements. With the calculated
scantlings and sticking to the GA, the structure is modelled to perform the various Finite
Element Analysis. DNV-GL guidelines has been referred to and followed in the modelling and
FEA. The results from the FEA are verified with the general conditions given in DNV-GL rules.
The reactions at the connections between the pontoons and the wing walls are obtained from
the FEA which is further used to design the connection details. Based on the FEA, the scantlings
are finalised, and a weight report is prepared, capturing the steel weight and other major weights
with enough contingency level. The hull and tanks are modelled in maxsurf and a stability check
for the various required conditions of draft are then performed. To have a better representation
of the resulting design, a 3D model is then developed in Rhino3D.
1.5 Case Study
The structure consists of 5 sections of pontoons of maximum external dimensions 30m x 18m
x 4.5m each. The assembly of the dry dock is as such, the 30m length of pontoon will be the
breadth of the dry dock assembly. The pontoons are arranged with 600mm spacing between
each and the pontoon decks will be connected to the dock wings through suitable bolting
arangement and there is no direct strength connection between the pontoons. Hence the pontoon
girders will be taking part in the transverse strength of the dry dock. As is the case, the global
transverse bending will be much critical for each pontoon and the global longitudinal bending
will be influenced by the dock wing structure.
This drydock is meant for operation in the harbor for the dry docking of ships for inspection,
repairs or even new building of ships. In fact the design assumes the docks port of operation is

Structural Design and Stability of a 6,000 ton Capacity Floating Dock as per DNV-GL Rules
“EMSHIP” Erasmus Mundus Master Course, period of study Sept 2016 – Feb 2018 21
sheletered against waves. As such any dynamic pressure resulting from wave actions has not
been considered in the design. A very basic design is performed considering only normal
operating conditions.
Strength and stability are equally important for the smooth operation of a dry dock. Rather than
the integrity of the structure, special care has to be taken always while performing the docking
and undocking operations and needs to have personnel with good expertise to perform such
operations. Considering the very basic case, the most critical loadings that act on the structure
other than the selfweight would be the hydrostatic pressure, the load from the tank fluids and
the maximum capacity docking load. While the former are distributed loads over the exposed
structural area, the latter can be considered linearly distributed along the length of the dock and
the loading is along a critical location which enhances the bending, that is along the centerline
or centre of the beam of the dry dock. There occurs the longitudinal bending and transverse
bending as well, which would create strain in the structure and results in stresses. In order to
reduce the stresses. The deflection has to be reduced and for that either the structure has to be
strengthened or arrangements have to be modified or capacity is to be reduced which is not the
desired solution. The stress and deflection are related and there is the maximum deflection
associated with the allowable or design stresses. So in the docking operation, the deflections
are monitored to ensure that the limit is not reached. This is the basic ideology behind the
structural design of the floating dry dock.
1.6 Literature Review
In order to carry out the work a lot of references were sourced which are closely related to the
work to be done. Several of those include the operational aspects, testing aspects, and also
design aspects.
Volney E. Cook (1957, [1]) has presented a paper which summarizes the history and
development of the floating drydocks in terms of design, construction, operation and
maintenance. In his paper, he gives an overview of the earlier methods used in drydocking of
vessels with all the advantages and disadvantages and the reason why there was an increase in
the need for floating dry-docks. His paper is more on to the operational aspects, and it is very
important to know the exact operational requirements before the designing of such structures.

Kodathoor Gangadharan Midhun
22 Master Thesis Developed at West Pomeranian University of Technology, Szczecin
This paper is found to be very useful and informative and one of the earliest of such publications
related to the floating dry-docks.
Arsham Amirikian (1957, [2]) in his paper presents useful data and guidelines on the design of
floating dry-docks. A first look in to the conventional approach and then a detailed discussion
is given on the most advanced concepts of analysis of that time. Arrangements and framing
details are provided for steel-framed structure and as well as concrete and timber structures.
And this paper could be a useful reference considering the design aspects for the design of the
floating dock.
Helmut J. Warnke (1973, [3]) in his paper describes the way in which the installation of a new
33,000 ton floating dock enabled Jacksonville Shipyards, Inc., of Jacksonville, Florida greatly
to enlarge their service and repair capacity. In this paper he explains the considerations which
were taken in to account to decide the type of floating dock like the expenditure, ease of
construction, towage from the construction yard to the intended location, etc. the details on the
load testing of the dock is described and the details of the design and various installations on
that floating dock are also detailed. The tests and trials performed are also included. These are
important information to be kept in mind while designing.
Paul Stuart Crandall (1974, [4]) in his paper has focused on large floating docks for large ships.
Due to the vast changes in the worldwide Shipping and introduction of a number of large cargo
vessels during those times, he talks about the importance of having new ways of building,
launching and accommodating new ships. He talks about the overall advantages of having
floating docks for large vessels. The various aspects he has discussed in his paper are helpful
in coming up with an efficient design.
B. Rapo (1981, [5]) in his paper presents a short review of the various types of drydocking
facilities. He discusses the different docking circumstances and also the causes of damages
during docking. The criteria to be fulfilled to prevent these damages are also summarized. His
paper focuses on block loadings and the ship strength and dock type considerations. The
importance of stability during docking is also discussed.
Brandon M. Taravella (2003, [6]) in his paper presents the method for accurately predicting the
block reactions in case of dry docking. He discusses the method presented by Paul S. Crandall

Structural Design and Stability of a 6,000 ton Capacity Floating Dock as per DNV-GL Rules
“EMSHIP” Erasmus Mundus Master Course, period of study Sept 2016 – Feb 2018 23
(called as Crandall’s trapezoidal method), calculates the results for an existing dry-docked
vessel. This result is compared with the computational methods like FEM by Euler beam theory
and Timoshenko beam theory. He also takes actual measurements. From his comparisons of the
various results obtained, he concludes that FEM by Timoshenko method is superior in
predicting the block reactions, but the FEM by Euler beam theory can also be applied with a
correction factor for the blocks at the aft and forward overhangs of the vessel. It is important
have a better idea of the various block reactions at various points, so that the structure can be
designed considering the maximum probable loads at each of those locations.
Tyler Morra (2011, [7]) in his Master thesis, explains in detail, the evolutionary development
of floating dry-docks. His research covers the primitive floating dry-docks and the
technological developments and the needs that brought about those developments. His studies
is based on the earliest available articles on floating docks. He does an analysis of the floating
dock facility from the earliest known type to the latest ones. The various issues and the reason
for the advancements are also studied.
Heger Drydock Inc. (2015, [8]) in the document issued on the vessels transfer concepts
describes the various methods which can be used for the transfer of vessel from on and off the
dock and the shore. Various provisions will have to be provided for different methods and the
type of method used also depends on the total load to be handled. This information would be
useful in recommending the ideal method and also do a strength analysis considering the same
concept.
Valery V. Korotaev, Anton V. Pantiushin, Mariya G. Serikova, Andrei G. Anisimov (2016, [9])
in their article details different deflection measuring systems on floating dry-docks. They have
developed a camera-based system and is explained in this paper. They give some insight in to
the various deflections occurring on the floating dry-docks. More specifically it is the new
method developed for measuring, which they have explained in this paper. Though this is not
design related paper, the information is useful considering the importance of deflection control
in floating dry-docks.

Kodathoor Gangadharan Midhun
24 Master Thesis Developed at West Pomeranian University of Technology, Szczecin
1.7 Calculation and Design Tools
Various calculation and design tools are used in this thesis work. Spreadsheet calculations are
developed for the scantlings design, built-up sections check, weight calculation, etc. A trial
version of FEMAP with NX NASTRAN solver is used for the FEA, RHINO3D is used for the
modelling and MAXSURF is used for the stability calculations.

Structural Design and Stability of a 6,000 ton Capacity Floating Dock as per DNV-GL Rules
“EMSHIP” Erasmus Mundus Master Course, period of study Sept 2016 – Feb 2018 25
2 SCANTLINGS DESIGN
2.1 General
The scantlings design is based on DNV-GL Rules for Floating Dry-docks. The minimum
required scantlings are estimated here. The calculations are based on the various formulae
developed by DNV-GL. The structure is made up of stiffened plates with frames and girders
providing the transverse and longitudinal strength respectively. The scantling calculation in
general for the case of subject floating dry dock can be divided in to the pontoon structure
scantlings and the dock wing structure scantlings. The pontoons are longitudinally framed
which in the assembly be transversely framed structure. The dock wings are longitudinally
framed and in the assembly too it act as longitudinally framed.
The type of structure: Pontoon type with 5 pontoons connected to 2 wing structures
which can be dismantled,
Material of construction: The hull structure is to be made of mild steel of minimum yield
strength 235MPa. The materials used has to comply with Pt.2 Ch.2 of the DNV-GL
Rules for Classification of Ships, Main dimensions: The main dimensions of the structure including the minimum and
maximum drafts as mentioned in section 1.2,
Frame spacing and span of members: Frame spacing is assumed as 600mm and the span
of different members assumed as well,
Using the above basic details, various other parameters are assumed or calculated using the
formulae given in the rules.
2.2 Geometry
The scantling calculation is based on the geometry of the structure represented in the figures 2
to 7. Figure 2 shows the various deck levels, figure 3 is a 3D geometry of the dock as per the
GA provided. Specific details needed in the scantling calculation are mentioned in figures 4, 5,
6 and 7.

Kodathoor Gangadharan Midhun
26 Master Thesis Developed at West Pomeranian University of Technology, Szczecin
Figure 2: A generic sketch of the floating dock profile view
Figure 3: 3D Geometry
Figure 4: Profile view

Structural Design and Stability of a 6,000 ton Capacity Floating Dock as per DNV-GL Rules
“EMSHIP” Erasmus Mundus Master Course, period of study Sept 2016 – Feb 2018 27
Figure 5: End view
Figure 6: Typical pontoon structure arrangement
Figure 7: Typical dock wing structure arrangement
The geometry of a typical pontoon and a typical dock wing structure are given in figure 6 and
7. The longitudinal strength for the dock is imparted through the continuous dock wings. Each
sectional pontoon of length 30m and width 18m are arranged as such the length of the pontoon
makes the width of the dock. The longitudinal girders of the pontoons impart transverse strength
to the dock. In the scantlings design, pontoon girders refer to the longitudinal girder of the
pontoon which is transversely arranged in the dock assembly and the web frames vice versa.
Kodathoor Gangadharan Midhun
28 Master Thesis Developed at West Pomeranian University of Technology, Szczecin
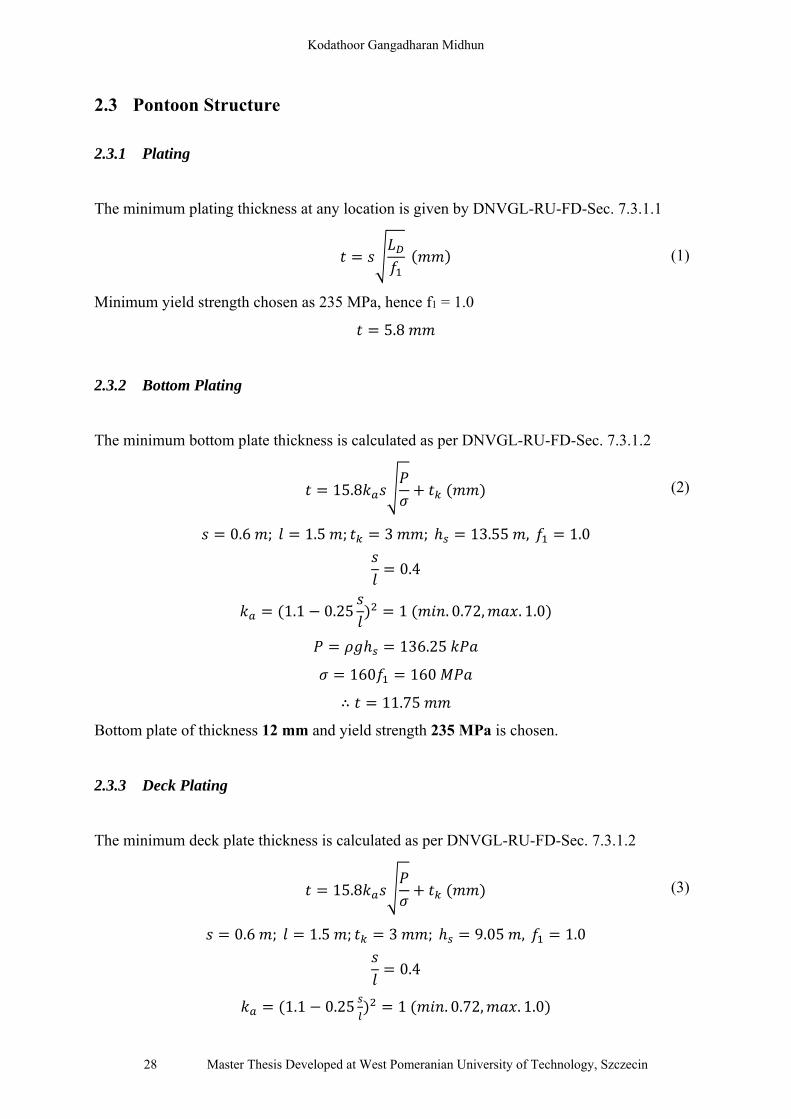
2.3 Pontoon Structure
2.3.1 Plating
The minimum plating thickness at any location is given by DNVGL-RU-FD-Sec. 7.3.1.1
(1)
Minimum yield strength chosen as 235 MPa, hence f1 = 1.0
5.8
2.3.2 Bottom Plating
The minimum bottom plate thickness is calculated as per DNVGL-RU-FD-Sec. 7.3.1.2
15.8 (2)
0.6 ; 1.5 ; 3 ; 13.55 , 1.0
0.4
1.1 0.25 1 . 0.72, . 1.0
136.25
160 160
∴ 11.75
Bottom plate of thickness 12 mm and yield strength 235 MPa is chosen.
2.3.3 Deck Plating
The minimum deck plate thickness is calculated as per DNVGL-RU-FD-Sec. 7.3.1.2
15.8 (3)
0.6 ; 1.5 ; 3 ; 9.05 , 1.0
0.4
1.1 0.25 1 . 0.72, . 1.0

Structural Design and Stability of a 6,000 ton Capacity Floating Dock as per DNV-GL Rules
“EMSHIP” Erasmus Mundus Master Course, period of study Sept 2016 – Feb 2018 29
91
160 160
∴ 10.15
Deck plate of thickness 12 mm and yield strength 235 MPa is chosen.
2.3.4 Side Plating
The minimum side plate thickness is calculated as per DNVGL-RU-FD-Sec. 7.3.1.2
15.8 (4)
0.6 ; 1.8 . ; 3 ; 11.3 , 1.0
0.33
1.1 0.25 1 . 0.72, . 1.0
113.63
160 160
∴ 10.99
Side plate of thickness 12 mm and yield strength 235 MPa is chosen.
2.3.5 Bulkhead Plating (longitudinal)
The minimum bulkhead plate thickness is calculated as per DNVGL-RU-FD-Sec. 7.5.2.1
15.8 (5)
0.6 ; 1.8 . ; 3 ; 2.25 , 1.0
0.0.33
1.1 0.25 1 . 0.72, . 1.0
10 2.5 47.5
120 120 .
∴ 8.96
So pontoon bulkhead plate of thickness 10 mm and yield strength 235 MPa is chosen.

Kodathoor Gangadharan Midhun
30 Master Thesis Developed at West Pomeranian University of Technology, Szczecin
2.3.6 Bottom Girder
The minimum section modulus of the bottom girder is calculated as per DNVGL-RU-FD-Sec.
7.3.2.1
1000 (6)
1.8 ; 4.0 . ; 3 ; 3 ; 13.55 ; 1.39;
10
1 0.05 1.3
136.25
160 222.4
∴ 2294
A T- section of the following dimensions and yield strength 355 MPa with combined section
modulus of 2364 cm3 is chosen.
380 ; 12
250 ; 20
2.3.7 Bottom Frame
The minimum section modulus of the bottom frame is calculated as per DNVGL-RU-FD-Sec.
7.3.2.1
1000 (7)
1.5 ; 1.8 . ; 3 ; 3 ; 13.55 ; 1.39;
10
1 0.05 1.3
136.25
160 222.4
∴ 387
A T- section of the following dimensions and yield strength 355 MPa with combined section
modulus of 658 cm3 is chosen.
240 ; 12
100 ; 16

Structural Design and Stability of a 6,000 ton Capacity Floating Dock as per DNV-GL Rules
“EMSHIP” Erasmus Mundus Master Course, period of study Sept 2016 – Feb 2018 31
2.3.8 Bottom Stiffeners
The minimum section modulus of the bottom stiffener is calculated as per DNVGL-RU-FD-
Sec. 7.3.2.1
1000 (8)
0.6 ; 1.5 . ; 3 ; 13.55 ; 1.0; 10
1 0.06 1.18
136.25
160 160
∴ 136
A bulb- section of 160x11.5 mm and yield strength 235 MPa with combined section modulus
of 146 cm3 is chosen.
2.3.9 Deck Girder
The minimum section modulus of the deck girder is calculated as per DNVGL-RU-FD-Sec.
7.3.2.1
1000 (9)
1.8 ; 4.0 . ; 3 ; 3 ; 9.05 ; 1.39; 10
1 0.05 1.3
91.00
160 222.4
∴ 1532
A T- section of the following dimensions and yield strength 355 MPa with combined section
modulus of 2147 cm3 is chosen.
350 ; 12
250 ; 20
2.3.10 Deck Frame
The minimum section modulus of the deck frame is calculated as per DNVGL-RU-FD-Sec.
7.3.2.1

Kodathoor Gangadharan Midhun
32 Master Thesis Developed at West Pomeranian University of Technology, Szczecin
1000 (10)
1.5 ; 1.8 . ; 3 ; 3 ; 9.05 ; 1.39; 10
1 0.05 1.3
91.00
160 222.4
∴ 259
A T- section of the following dimensions and yield strength 355 MPa with combined section
modulus of 531 cm3 is chosen.
220 ; 12
100 ; 16
2.3.11 Deck Stiffeners
The minimum section modulus of the deck stiffener is calculated as per DNVGL-RU-FD-Sec.
7.3.2.1
1000 (11)
0.6 ; 1.5 . ; 3 ; 9.05 ; 1.0; 10
1 0.06 1.18
91.00
160 160
∴ 91
A bulb- section of 140x10 mm and yield strength 235 MPa with combined section modulus of
99 cm3 is chosen.
2.3.12 Side Frame
The minimum section modulus of the side frame is calculated as per DNVGL-RU-FD-Sec.
7.3.2.1
1000 (12)
Dock port and starboard sides:
1.8 ; 3.7 . ; 3 ; 3 ; 11.3 ; 1.39; 10

Structural Design and Stability of a 6,000 ton Capacity Floating Dock as per DNV-GL Rules
“EMSHIP” Erasmus Mundus Master Course, period of study Sept 2016 – Feb 2018 33
1 0.05 1.3
113.63
160 222.4
∴ 1637
Other sides:
1.5 ; 4.0 . ; 3 ; 3 ; 11.3 ; 1.39; 10
1 0.05 1.3
113.63
160 222.4
∴ 1594
A T- section of the following dimensions and yield strength 355 MPa with combined section
modulus of 1863 cm3 is chosen.
360 ; 12
250 ; 16
2.3.13 Side Stiffeners
The minimum section modulus of the side stiffener is calculated as per DNVGL-RU-FD-Sec.
7.3.2.1
1000 (13)
Dock port and starboard sides:
0.6 ; 1.8 . ; 3 ; 11.3 ; 1.0; 10
1 0.06 1.18
113.63
160 160
∴ 163
Other sides:
0.6 ; 1.5 . ; 3 ; 11.3 ; 1.0; 10
1 0.06 1.18
113.63
160 160
∴ 113

Kodathoor Gangadharan Midhun
34 Master Thesis Developed at West Pomeranian University of Technology, Szczecin
A bulb- section of 180x10 mm and yield strength 235 MPa with combined section modulus of
178 cm3 is chosen for the dock port and starboard sides.
A bulb- section of 160x9 mm and yield strength 235 MPa with combined section modulus of
127 cm3 is chosen for the other sides.
2.3.14 Bulkhead Stiffeners (longitudinal)
The minimum section modulus of the bulkhead stiffener is calculated as per DNVGL-RU-FD-
Sec. 7.3.2.1
1000 (14)
0.6 ; 1.8 . ; 3 ; 2.25 ; 1.0; 12
1 0.06 1.18
10 2.5 47.5
160 160
∴ 57
A bulb- section of 120x8 mm and yield strength 235 MPa with combined section modulus of
62 cm3 is chosen.
2.4 Dock Wing Structure
2.4.1 Plating
The minimum plating thickness at any location is given as per DNVGL-RU-FD-Sec. 7.4.1.2
(15)
Minimum yield strength chosen as 235 MPa, hence f1 = 1.0
5.8
2.4.2 Upper Deck Plating
The minimum upper deck plate thickness is calculated as per DNVGL-RU-FD-Sec. 7.4.2.2
Structural Design and Stability of a 6,000 ton Capacity Floating Dock as per DNV-GL Rules
“EMSHIP” Erasmus Mundus Master Course, period of study Sept 2016 – Feb 2018 35
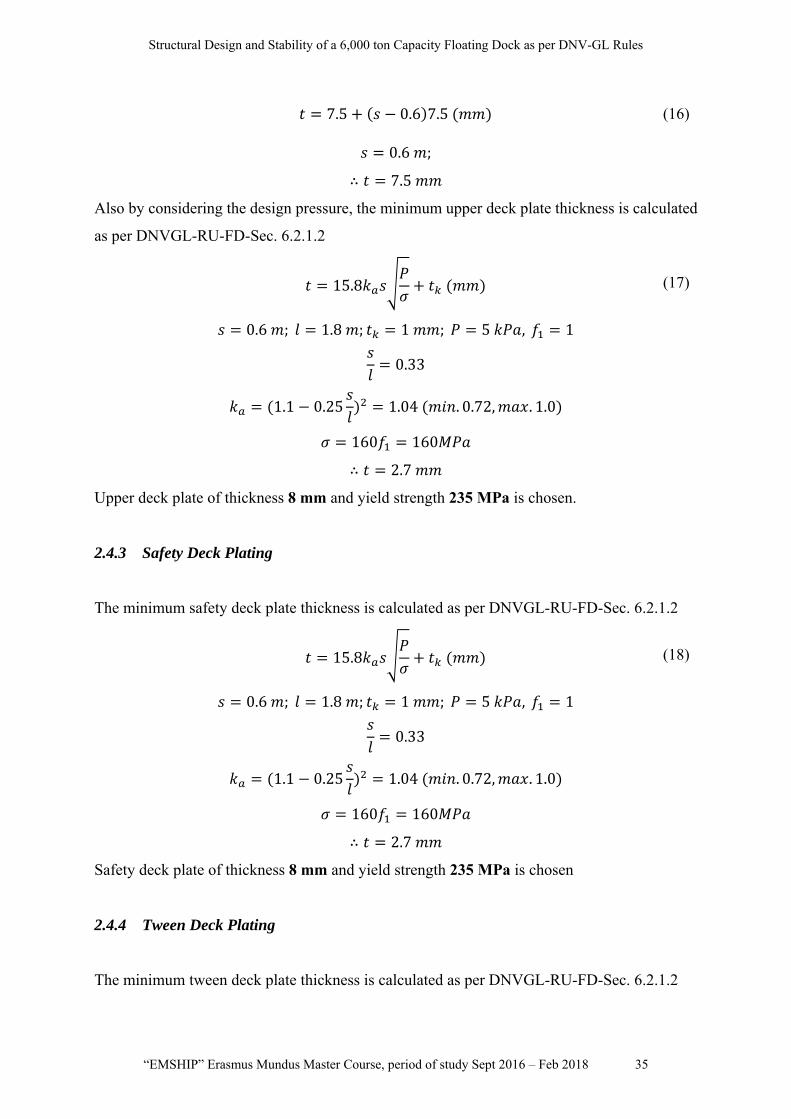
7.5 0.6 7.5 (16)
0.6 ;
∴ 7.5
Also by considering the design pressure, the minimum upper deck plate thickness is calculated
as per DNVGL-RU-FD-Sec. 6.2.1.2
15.8 (17)
0.6 ; 1.8 ; 1 ; 5 , 1
0.33
1.1 0.25 1.04 . 0.72, . 1.0
160 160
∴ 2.7
Upper deck plate of thickness 8 mm and yield strength 235 MPa is chosen.
2.4.3 Safety Deck Plating
The minimum safety deck plate thickness is calculated as per DNVGL-RU-FD-Sec. 6.2.1.2
15.8 (18)
0.6 ; 1.8 ; 1 ; 5 , 1
0.33
1.1 0.25 1.04 . 0.72, . 1.0
160 160
∴ 2.7
Safety deck plate of thickness 8 mm and yield strength 235 MPa is chosen
2.4.4 Tween Deck Plating
The minimum tween deck plate thickness is calculated as per DNVGL-RU-FD-Sec. 6.2.1.2

Kodathoor Gangadharan Midhun
36 Master Thesis Developed at West Pomeranian University of Technology, Szczecin
15.8 (19)
0.6 ; 1.8 ; 2 ; 5.55 , 1
0.33
1.1 0.25 1.04 . 0.72, . 1.0
56
160 160
∴ 7.6
Tween deck plate of thickness 8 mm and yield strength 235MPa is chosen
2.4.5 Intermediate Deck Plating
The minimum intermediate deck plate thickness is calculated as per DNVGL-RU-FD-Sec.
6.2.1.2
15.8 (20)
0.6 ; 1.8 ; 1 ; 5.0 , 1
0.33
1.1 0.25 1.04 . 0.72, . 1.0
160 160
∴ 2.7
Intermediate deck plate of thickness 8 mm and yield strength 235 MPa is chosen.
2.4.6 Side Wall Plating
The minimum side plate thickness is calculated as per DNVGL-RU-FD-Sec. 7.4.1.1
15.8 (21)
0.6 ; 1
0.33

Structural Design and Stability of a 6,000 ton Capacity Floating Dock as per DNV-GL Rules
“EMSHIP” Erasmus Mundus Master Course, period of study Sept 2016 – Feb 2018 37
Below safety deck level_longitudinal wall:
1.8 ; 3 ; 6
0.33
1.1 0.25 1.04 . 0.72, . 1.0
60.33
120 120
∴ 9.7
Below safety deck level_transverse wall:
3.5 ; 3 ; 6
0.17
1.1 0.25 1.12 . 0.72, . 1.0
60.33
160 160
∴ 8.8
Side wall plate of thickness 10 mm and yield strength 235 MPa is chosen below safety deck
level.
Above safety deck level_longitudinal wall:
1.8 ; 2 ; 1.5
0.33
1.1 0.25 1.04 . 0.72, . 1.0
15.10
120 120
∴ 5.4
Above safety deck level_transverse wall:
3.5 ; 2 ; 1.5
0.17
1.1 0.25 1.12 . 0.72, . 1.0
15.10

Kodathoor Gangadharan Midhun
38 Master Thesis Developed at West Pomeranian University of Technology, Szczecin
160 160
∴ 4.5
Side wall plate of thickness 8 mm and yield strength 235 MPa is chosen above safety deck
level.
2.4.7 Bulkhead Plating (transverse)
The minimum bulkhead plate thickness is calculated as per DNVGL-RU-FD-Sec. 7.5.2.1
15.8 (22)
0.6 ; 2.9 . ; 2 ; 3 , 1.0
0.21
1.1 0.25 1 . 0.72, . 1.0
10 2.5 55
160 160 .
∴ 7.6
So wing bulkhead plates of thicknesses 8 mm and 6 mm and yield strength 235 MPa are chosen
below safety deck level and abve safety deck level respectively
2.4.8 Bottom Frame
The minimum section modulus of the bottom frame is calculated as per DNVGL-RU-FD-Sec.
6.2.2.2
1000 (23)
1.8 ; 3.5 . ; 3 ; 3 ; 5.7 ; 1.39; 10
1 0.05 1.3
57.32
160 222.4
∴ 739
An I- section of the following dimensions and yield strength 355 MPa with section modulus of
756 cm3 is chosen.

Structural Design and Stability of a 6,000 ton Capacity Floating Dock as per DNV-GL Rules
“EMSHIP” Erasmus Mundus Master Course, period of study Sept 2016 – Feb 2018 39
294 ; 8
200 ; 12
2.4.9 Upper Deck Frame
The minimum section modulus of the deck frame is calculated as per DNVGL-RU-FD-Sec.
6.2.2.2
1000 (24)
1.8 ; 3.5 . ; 1 ; 1 ; 5 ; 1.0; 12
1 0.05 1.1
160 160
∴ 45.5
A T- section of the following dimensions and yield strength 235 MPa with combined section
modulus of 404 cm3 is chosen.
250 ; 8
100 ; 10
2.4.10 Upper Deck Stiffeners
The minimum section modulus of the deck stiffener is calculated as per DNVGL-RU-FD-Sec.
6.2.2.2. Actual required strength has to be assessed based on longitudinal strength requirement.
1000 (25)
0.6; 1.8 . ; 1 ; 5 ; 1.0; 10
1 0.06 1.06
160 160
∴ 7
A bulb- section of 120x6 mm and yield strength 235 MPa with combined section modulus of
52 cm3 is chosen.

Kodathoor Gangadharan Midhun
40 Master Thesis Developed at West Pomeranian University of Technology, Szczecin
2.4.11 Safety Deck Frame
The minimum section modulus of the deck frame is calculated as per DNVGL-RU-FD-Sec.
6.2.2.2
1000 (26)
1.8 ; 3.5 . ; 2 ; 2 ; 5 ; 1.0; 12
1 0.05 1.2
160 222.4
∴ 69.5
A T- section of the following dimensions and yield strength 235 MPa with combined section
modulus of 655 cm3 is chosen.
300 ; 8
150 ; 10
2.4.12 Safety Deck Stiffeners
The minimum section modulus of the deck stiffener is calculated as per DNVGL-RU-FD-Sec.
6.2.2.2. Actual required strength has to be assessed based on longitudinal strength requirement.
1000 (27)
0.6 ; 1.8 . ; 2 ; 5 ; 1.0; 10
1 0.06 1.12
160 160
∴ 7
A bulb- section of 120x6 mm and yield strength 235 MPa with combined section modulus of
50cm3 is chosen.
2.4.13 Tween Deck Frame
The minimum section modulus of the deck frame is calculated as per DNVGL-RU-FD-Sec.
6.2.2.2
1000 (28)

Structural Design and Stability of a 6,000 ton Capacity Floating Dock as per DNV-GL Rules
“EMSHIP” Erasmus Mundus Master Course, period of study Sept 2016 – Feb 2018 41
1.8 ; 3.5 . ; 3 ; 3 ; 3 ; 1.0; 12
1 0.05 1.3
30.17
160 160
∴ 450.4
A T- section of the following dimensions and yield strength 235 MPa with combined section
modulus of 666 cm3 is chosen.
300 ; 8
150 ; 10
2.4.14 Tween Deck Stiffeners
The minimum section modulus of the deck stiffener is calculated as per DNVGL-RU-FD-Sec.
6.2.2.2
1000 (29)
0.6 ; 1.8 . ; 3 ; 3 ; 1.0; 10
1 0.06 1.18
30.17
160 160
∴ 44
A bulb- section of 120x6 mm and yield strength 235 MPa with combined section modulus of
52 cm3 is chosen.
2.4.15 Inter Deck Frame
The minimum section modulus of the deck frame is calculated as per DNVGL-RU-FD-Sec.
6.2.2.2
1000 (30)
1.8 ; 3.5 . ; 1 ; 1 ; 5 ; 1.0; 12
1 0.05 1.1
160 222.4

Kodathoor Gangadharan Midhun
42 Master Thesis Developed at West Pomeranian University of Technology, Szczecin
∴ 63.9
A T- section of the following dimensions and yield strength 235 MPa with combined section
modulus of 655 cm3 is chosen.
300 ; 8
150 ; 10
2.4.16 Inter Deck Stiffeners
The minimum section modulus of the deck stiffener is calculated as per DNVGL-RU-FD-Sec.
6.2.2.2
1000 (31)
0.6 ; 1.8 . ; 1 ; 5 ; 1.0; 10
1 0.06 1.06
160 160
∴ 7
A bulb- section of 120x6 mm and yield strength 235 MPa with combined section modulus of
50 cm3 is chosen.
2.4.17 Side Wall Frame
The minimum section modulus of the side wall frame is calculated as per DNVGL-RU-FD-
Sec. 7.4.1.4
1000 (32)
1.8 ; 1.39; 10
160 222.4
Below safety deck level:
5.0 . ; 2 ; 2 ; 6
1 0.05 1.2
60.33
∴ 1465
A T- section of the following dimensions and yield strength 355 MPa with combined section
modulus of 1522 cm3 is chosen.

Structural Design and Stability of a 6,000 ton Capacity Floating Dock as per DNV-GL Rules
“EMSHIP” Erasmus Mundus Master Course, period of study Sept 2016 – Feb 2018 43
500 ; 10
100 ; 16
Above safety deck level:
4.0 . ; 1 ; 1 ; 1.5
1 0.05 1.1
15.08
∴ 215
A T- section of the following dimensions and yield strength 355 MPa with combined section
modulus of 238 cm3 is chosen.
150 ; 8
100 ; 12
2.4.18 Side Stiffeners
The minimum section modulus of the side wall frame is calculated as per DNVGL-RU-FD-
Sec. 7.4.1.3
1000 (33)
0.6 ; 1.0; 12
160 160
Below safety deck level_longitudinal wall:
1.8 . ; 2 ; 2 ; 6
1 0.05 1.2
60.33
∴ 74
A bulb- section of 140x8 mm and yield strength 235 MPa with combined section modulus of
86 cm3 is chosen.
Below safety deck level_transverse wall:
3.5 . ; 2 ; 2 ; 6
1 0.05 1.2
60.33
Kodathoor Gangadharan Midhun
44 Master Thesis Developed at West Pomeranian University of Technology, Szczecin
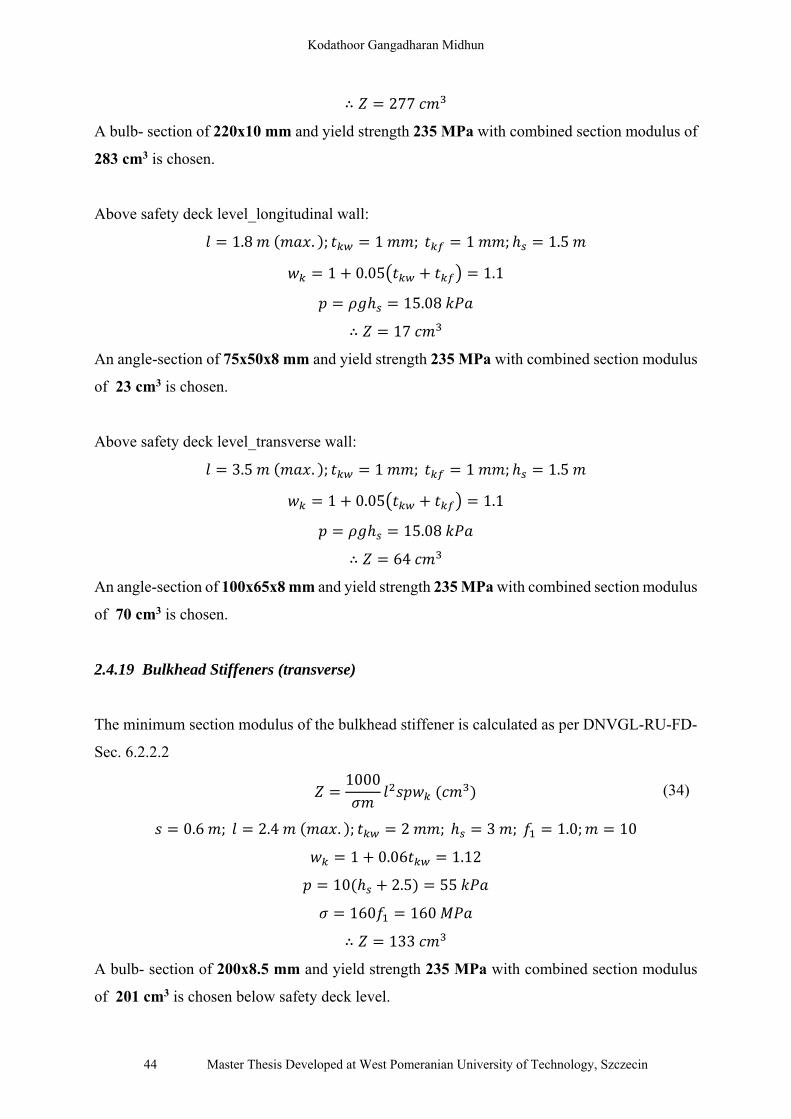
∴ 277
A bulb- section of 220x10 mm and yield strength 235 MPa with combined section modulus of
283 cm3 is chosen.
Above safety deck level_longitudinal wall:
1.8 . ; 1 ; 1 ; 1.5
1 0.05 1.1
15.08
∴ 17
An angle-section of 75x50x8 mm and yield strength 235 MPa with combined section modulus
of 23 cm3 is chosen.
Above safety deck level_transverse wall:
3.5 . ; 1 ; 1 ; 1.5
1 0.05 1.1
15.08
∴ 64
An angle-section of 100x65x8 mm and yield strength 235 MPa with combined section modulus
of 70 cm3 is chosen.
2.4.19 Bulkhead Stiffeners (transverse)
The minimum section modulus of the bulkhead stiffener is calculated as per DNVGL-RU-FD-
Sec. 6.2.2.2
1000 (34)
0.6 ; 2.4 . ; 2 ; 3 ; 1.0; 10
1 0.06 1.12
10 2.5 55
160 160
∴ 133
A bulb- section of 200x8.5 mm and yield strength 235 MPa with combined section modulus
of 201 cm3 is chosen below safety deck level.
Structural Design and Stability of a 6,000 ton Capacity Floating Dock as per DNV-GL Rules
“EMSHIP” Erasmus Mundus Master Course, period of study Sept 2016 – Feb 2018 45
An angle-section of 100x65x8 mm and yield strength 235 MPa with combined section modulus
of 70 cm3 is chosen above safety deck level.
2.5 2D Section Drawings
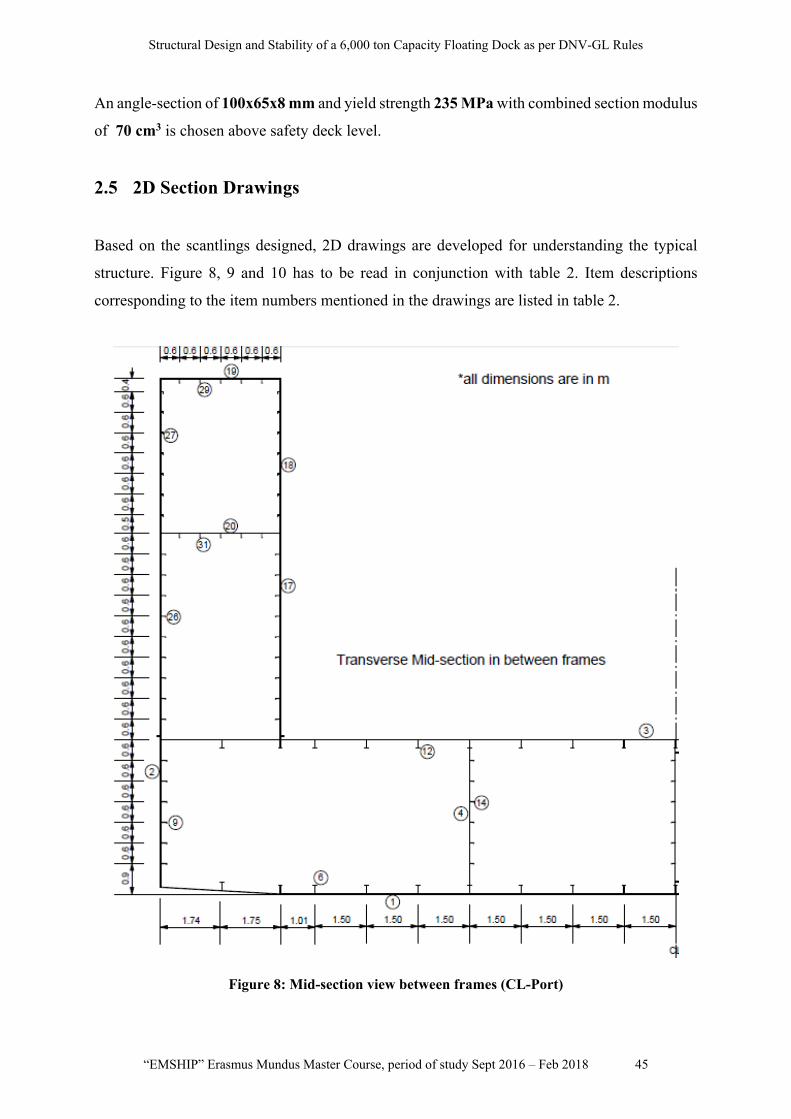
Based on the scantlings designed, 2D drawings are developed for understanding the typical
structure. Figure 8, 9 and 10 has to be read in conjunction with table 2. Item descriptions
corresponding to the item numbers mentioned in the drawings are listed in table 2.
Figure 8: Mid-section view between frames (CL-Port)

Kodathoor Gangadharan Midhun
46 Master Thesis Developed at West Pomeranian University of Technology, Szczecin
Figure 9: Typical pontoon section
Figure 10: Mid-section view in way of frames (CL-Starboard)

Structural Design and Stability of a 6,000 ton Capacity Floating Dock as per DNV-GL Rules
“EMSHIP” Erasmus Mundus Master Course, period of study Sept 2016 – Feb 2018 47
Table 2: Items list from the drawings
Item no. Item description Scantlings in mm
Pontoon
1 Bottom plate 12 thick
2 Side Plate 12 thick
3 Deck plate 12 thick
4 Longitudinal bulkhead 10 thick
5 Bottom Girder T section: W380x12 F250x20
6 Bottom Frame T section: W240x12 F100x16
7 Bottom stiffeners BP 160x11.5
8 Side frame T section: W360x12 F250x16
9 Side stiffeners BP 180x10
10 Side stiffeners BP 160x9
11 Deck girder T section: W350x12 F250x20
12 Deck frame T section: W220x12 F100x16
13 Deck stiffeners BP 140x10
14 Bulkhead stiffeners BP 120x8
15 Pillars UC 250x250x71.8 kg/m
16 Pillar brackets UC 250x250x71.8 kg/m
Dockwing
17 Side plate (below safety deck) 10 thick
18 Side plate (above safety deck) 8 thick
19 Upper deck plate 8 thick
20 Safety deck plate 8 thick
21 Transverse bulkhead (below safety deck) 8 thick
22 Transverse bulkhead (above safety deck) 6 thick
23 Bottom frame UB 300x200x55.8 kg/m
24 Side frame (below safety deck) T section: W500x10 F100x16
25 Side frame (above safety deck) T section: W150x8 F100x12
26 Side stiffeners (below safety deck) BP 140x8
27 Side stiffeners (above safety deck) LP 75x50x8
28 Upper deck frame T section: W250x8 F100x10
29 Upper deck stiffeners BP 120x6
30 Safety deck frame T section: W300x8 F150x10

Kodathoor Gangadharan Midhun
48 Master Thesis Developed at West Pomeranian University of Technology, Szczecin
31 Safety deck stiffeners BP 120x6
32 Bulkhead stiffeners (below safety deck) BP 200x8.5
33 Bulkhead stiffeners (above safety deck) LP 100x65x8
34 Upper bracket UB 150x100x20.7 kg/m
2.6 Slenderness Check
The dock is subjected to hogging and sagging bending and at various stages, the structural
members are subjected to variable loads which could be tensile or compressive. Slenderness of
a structural member is directly related to the length or free span of the member and limiting the
free span could avoid potential buckling and also constructional deformations. Hence the
slenderness check ensures the member will yield locally before it could buckle. A member
under compression is critical to buckling than a member in tension.
The general formula for slenderness ratio is,
(35)
The subject design requires a slenderness check to be done on the structural members to decide
if a local stiffening is required to limit the slenderness ratio. The guidelines as per Part 3 Chapter
8 of the DNV-GL Rules for Classification of Ships is followed.
In doing the slenderness check, a minimum of the yield stresses is considered and only the net
scantlings are considered in order to have higher factor of safety.
2.6.1 Net thickness of Plate Panels
The net thickness requirement of the plate panels in mm as per DNVGL-RU-SHIP Part 3
Chapter 8 Section 2.2 is below,
(36)
1 8

Structural Design and Stability of a 6,000 ton Capacity Floating Dock as per DNV-GL Rules
“EMSHIP” Erasmus Mundus Master Course, period of study Sept 2016 – Feb 2018 49
In general for all plates forming the outer shell,
600
100
125
Table 3 shows the net thickness and thickness required as per slenderness check for the
various plate panels used in the design.
Table 3: Slenderness check for plates
Location tgross tk tnet b
C tp
(mm) (mm) (mm) (mm) (mm)
Pontoon
Bottom 12 3 9 600 100 6
Side 12 3 9 600 100 6
Deck 12 3 9 600 100 6
Bulkhead 10 3 7 600 125 4.8
Dock Wing
Side (below safety deck level) 10 3 7 600 100 6
Side (Above safety deck level) 8 2 6 600 125 4.8
Upper deck 8 1 7 600 125 4.8
Safety deck 8 1 7 600 125 4.8
Tween deck 8 2 6 600 125 4.8
Intermediate deck 8 1 7 600 125 4.8
Bulkhead (below safety deck level) 8 2 6 600 125 4.8
Bulkhead (above safety deck level) 6 1 5 600 125 4.8
Table 3 shows that the thicknesses considered are more than the minimum required as to
provide enough stiffness.
2.6.2 Net thickness of Stiffeners
The minimum thickness requirement as per DNVGL-RU-SHIP Part 3 Chapter 8 Section 3.1.1
are as follows,

Kodathoor Gangadharan Midhun
50 Master Thesis Developed at West Pomeranian University of Technology, Szczecin
,235
(37)
,235
(38)
Figure 11: Stiffener Scantling Parameters
Source: DNVGL-RU-SHIP Part 3 Chapter 8 Figure 1
Reh for stiffeners is taken as 235 N/mm2.
Table 4: Slenderness check for stiffeners
Location tgross tk tnet hw or bf-out
Cw or Cf tw or tf
(mm) (mm) (mm) (mm) (mm) (mm)
Pontoon
Bottom (bulb bar) Web 11.5 3 8.5 160 45 4
Flange - - - - - -
Side (bulb bar) Web 9 3 6 160 45 4
Flange - - - - - -
Deck (bulb bar) Web 10 3 7 140 45 3
Flange - - - - - -
Bulkhead (bulb bar) Web 11.5 3 8.5 160 45 4
Flange - - - - - -
Bottom (bulb bar) Web 8 3 5 120 45 3
Flange - - - - - -
Dock Wing
Upper deck (bulb bar) Web 6 1 5 120 45 3
Flange - - - - - -
Safety deck (bulb bar) Web 6 2 4 120 45 3

Structural Design and Stability of a 6,000 ton Capacity Floating Dock as per DNV-GL Rules
“EMSHIP” Erasmus Mundus Master Course, period of study Sept 2016 – Feb 2018 51
Flange - - - - - -
Tween deck (bulb bar)Web 6 3 3 120 45 3
Flange - - - - - -
Intermediate deck (bulb bar)
Web 6 1 5 120 45 3
Flange - - - - - -
Side (below safety deck level) (bulb bar)
Web 8 2 6 140 45 3
Flange - - - - - -
Side (above safety deck level) (angle bar)
Web 8 1 7 67 75 1
Flange 8 1 7 42 12 4
Referring to the slenderness check results as per table 4, the net scantlings chosen for
stiffeners in the design are adequate.
2.6.3 Net thickness of Primary Supporting Members
The net thicknesses of web plate and flange plate shall satisify the following conditions as per
DNVGL-RU-SHIP Part 3 Chapter 8 Section 4.1.1,
,235
(39)
,235
(40)
Table 5: Slenderness check for primary supporting members
Location tgross tk tnet sw or bf-out Cw or Cf tw or tf
(mm) (mm) (mm) (mm) (mm) (mm)
Pontoon
Bottom girder Web 12 3 9 750 100 9
Flange 20 3 17 117 12 12
Bottom frame Web 12 3 9 600 100 7
Flange 16 3 13 44 12 5
Deck girder Web 12 3 9 750 100 9
Flange 20 3 17 119 12 12
Deck frame Web 12 3 9 600 100 7

Kodathoor Gangadharan Midhun
52 Master Thesis Developed at West Pomeranian University of Technology, Szczecin
Flange 16 3 13 44 12 5
Side frame Web 12 3 9 600 100 7
Flange 16 3 13 119 12 12
Dock Wing
Upper deck frame Web 8 1 7 600 100 7
Flange 10 1 9 46 12 5
Safety deck frame Web 8 2 6 400 100 5
Flange 10 2 8 46 12 5
Tween deck frame Web 8 3 5 400 100 5
Flange 10 3 7 46 12 5
Intermediate deck frame
Web 8 1 7 600 100 7
Flange 10 1 9 46 12 5
Side frame (below safety deck level)
Web 10 2 8 600 100 7
Flange 16 2 14 45 12 5
Side frame (above safety deck level)
Web 8 1 7 600 100 7
Flange 12 1 11 46 12 5
Slenderness check results for the primary supporting members as per table 5 shows that the
scantlings chosen are adequate if the webs are properly stiffened at intervals, Sw.
2.6.4 Net thickness of Pillars
The minimum thickness requirement as DNVGL-RU-SHIP Part 3 Chapter 8 Section 6.1 are as
follows,
,235
(41)
,235
(42)
Table 6: Slenderness check for pillars
Location tgross tk tnet hw or bf-out Cw or Cf tw or tf
(mm) (mm) (mm) (mm) (mm) (mm)
Pontoon
Pillar (I-section) Web 9 3 6 222 75 3

Structural Design and Stability of a 6,000 ton Capacity Floating Dock as per DNV-GL Rules
“EMSHIP” Erasmus Mundus Master Course, period of study Sept 2016 – Feb 2018 53
Flange 14 3 11 120 12 10
The pillar sections chosen are sufficient considering the slenderness requirements.
2.7 Summary
The scantling design has been done based on the worst condition of design pressure which is
for the maximum submersion draft. Normal grade steel of yield strength 235 MPa is chosen for
all members except the pontoon girders, frames and pillars. This is to reduce the material
scantlings and to ensure higher strength with lesser scantlings. Longitudinal framing is adopted
in the pontoons as the pontoon structure needs more strength in the longitudinal direction (along
the transverse of the dock). Longitudinal framing is adopted in dock wings to resist the
longitudinal bending of the dock. The scantling design done is based on the local hydrostatic
pressures and the structure has to be analysed globally for the strength to withstand the global
loads. This is done by FEA. All the scantlings designed is including the corrosion allowance
requirements as per DNVGL-RU-FD-Table 3.
The slenderness check carried out for the scantlings prove that the scantlings chosen are equal
to or higher than the minimum required to satisfy the slenderness criteria. For the T section
girders and frames used, web stiffeners have to be provided at intervals as mentioned in table 5
(column Sw for webs) to satisfy the slenderness criteria.
Kodathoor Gangadharan Midhun
54 Master Thesis Developed at West Pomeranian University of Technology, Szczecin
3 WEIGHTS AND CoG ESTIMATION
3.1 General
An accurate weight calculation is essential to have an optimized design. An estimation of the
various weights and their corresponding Centre of Gravity is done as per the available data.
Based on the scantlings and arrangement of the various structural members, the steel weight is
estimated. Since this is a preliminary stage of design, the weight could be expected to be higher
from the estimated value by about 10% (a nominal value based on experience). This is to
account for the stiffening or strengthening required in the structure, and the weight of welding
and also some tertiary structural members which were not considered.
From the concept GA available, approximate weights of major architectural items are estimated
with a marginal contingency of 20%. Major architectural weights considered include the weight
of insulation, panels, bulkheads, wet units, doors. B15 fire rating is the requirement as per the
DNVGL Rules. Most of the other architectural items shown in the drawings (refer Appendix
A) are included in the weight estimation. The additional items which are not considered is
assumed to cover with in the 20% contingency. The weight of such items constitute less than
10% of the total weight. Although there could be some local stiffening required to support these
loads in specific areas, there is no heavy concentrated loading expected. So the impact of such
weights is not much on the global strength.
The major electrical and HVAC weights are considered as lump sum quantities and considered
distributed over the area of the accommodation. The distributed weight is estimated based on
the weight in similar kind of accommodations. Again these won’t constitute the weights which
could be deciding factor in the strength of the structure. The assumed weights are again added
with a safety margin of 20%.
The equipment and outfit loads including the docking blocks, cranes, swing bridges, generator
and ballast pumps as a minimum are considered and applied as point loads considering the most
critical cases. These constitute heavy concentrated loads and based on the load transfer from
the equipment to the base, the foundation has to be designed and stiffened. In the absence of
proper data, the detailed design of foundation in such case has not been performed. Any

Structural Design and Stability of a 6,000 ton Capacity Floating Dock as per DNV-GL Rules
“EMSHIP” Erasmus Mundus Master Course, period of study Sept 2016 – Feb 2018 55
additional loads from the stiffening structural members and items which are not accounted are
expected to be covered in the additional 10% of load considered in the steel weight.
Contributing further to the loading is the weight from the fresh water and fuel oil tanks, the
maximum filled capacity is considered in the lightweight calculation or initial weight of the
structure. There is rest water expected to be present at the bottom of the pontoon ballast tanks
as the pumps can’t drain the tank completely. As per recommendations, this can be 2 to 3 feet
high. So marginal value of 600mm (i.e; 2 feet) high rest water is considered in the pontoon
tanks bottom at lightship conditions.
The CoG of various items based on their locations in the GA are calculated and the overall CoG
is estimated. The most critical of the CoG would be the VCG as more or less the arrangement
has the longitudinal and transverse CoG at the center. But VCG could be important from the
stability perspective. So from the known weights and locations, wherever contingency is
applied, a 20% increase in VCG is applied for the added weight as a standard engineering
practice. This is because the higher VCG could decrease the stability and the design should be
done for the worst case.
For the weights and CoG calculation, the origin of the coordinate system is fixed at the aft
bottom corner of the starboard side. All measures to the fore part is positive. All measures to
the port side is positive and upward from the base line is positive.
Figure 12: Coordinate system
A summary of the estimated weights of the empty structure is given in Table 7. A detailed
weight report is attached as Appendix B.

Kodathoor Gangadharan Midhun
56 Master Thesis Developed at West Pomeranian University of Technology, Szczecin
Table 7: Summary of weights
Figure 13: Percentage distribution of weights
From table 7, the VCG of the empty structure is obtained as 5.13 m and the LCG and TCG are
very close to the centre. More than 80% of the weight is contributed by steel.
3.2 Summary
All the weights considered in this section except the steel weight are based on the datasheets
sourced for various major equipment and few assumptions based on some similar items in the
absence of actual design. The contingencies considered are based on standard engineering
practice and not a documented one and is assumed to include items which were not considered
and also for additional supports and other unexpected increases in weights.
X Y Z M-x M-y M-z
(tons) (m) (m) (m) (t.m) (t.m) (t.m)
1 Structural Steel 10% 2207 46.34 15.00 4.36 102258 33100 9620
2 Architectural and misc 20% 165 45.68 15.40 10.13 7524 2536 1668
3 Outfitting and equipment 20% 323 48.45 14.33 7.86 15667 4634 2541
2695 46.55 14.94 5.13 125449 40271 13829
Total Weight X Y Z M-x M-y M-z
(tons) (m) (m) (m) (t.m) (t.m) (t.m)
Sl. No.
CoG Moments
CoG Moments
Item Description ContingencyTotal Weight

Structural Design and Stability of a 6,000 ton Capacity Floating Dock as per DNV-GL Rules
“EMSHIP” Erasmus Mundus Master Course, period of study Sept 2016 – Feb 2018 57
4 GLOBAL STRENGTH ANALYSIS
4.1 General
The major operational loads that act on a floating dry dock include the docking load, ballast
water pressure inside the tanks and the external sea water pressure acting on the immersed part
of the hull. The dock strength has to be analysed for longitudinal as well as transverse bending.
The various such critical loading cases are considered in the strength analsysis of the dock. The
minimum of the cases as required by DNV-GL is checked here. A linear static FEA is carried
out using FEMAP structural modelling and analysis software with NX Nastran solver. The FEA
modelling is done based on the gross scantlings estimated.
The various ship loading cases include:
i. Sagging ship
ii. Hogging ship
The vaious docking stages include:
i. Lightship condition where only the selfweight, weight of consumables and rest water/
compensating ballast water acts, and externally the hydrostatic pressure.
Figure 14: Lightship condition
ii. Fully submerged condition where the dock is immersed to the maximum draft by
ballasting.
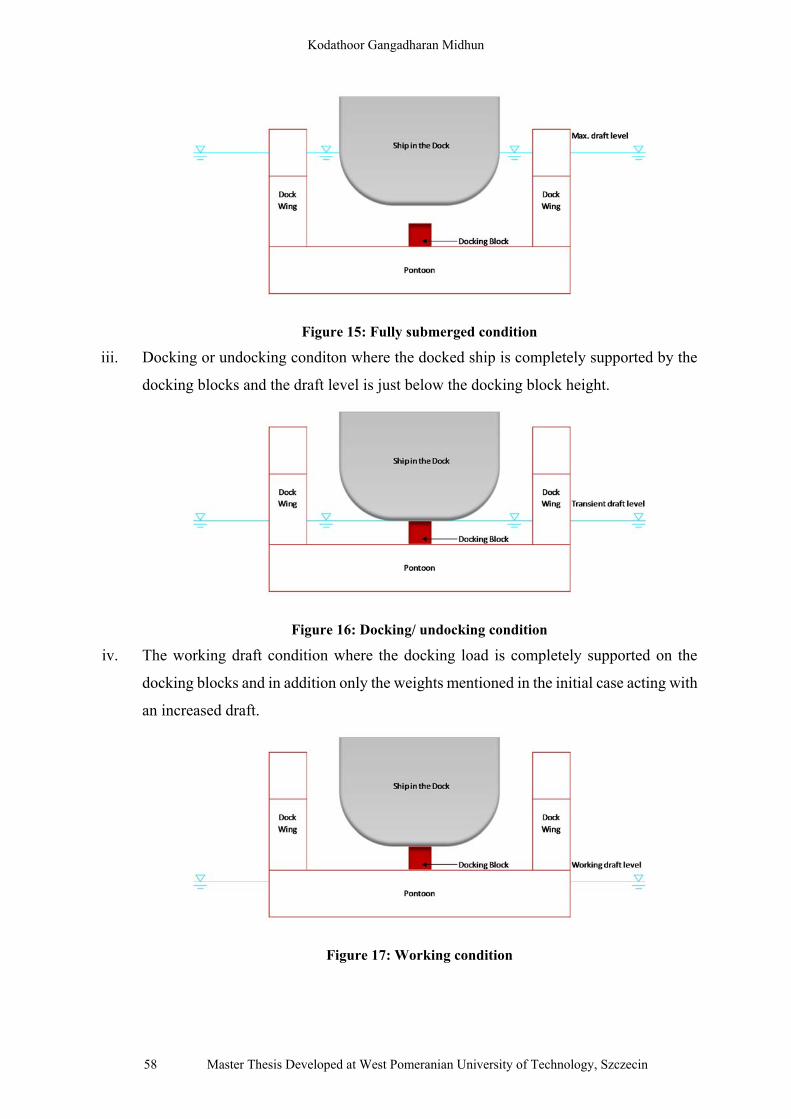
Kodathoor Gangadharan Midhun
58 Master Thesis Developed at West Pomeranian University of Technology, Szczecin
Figure 15: Fully submerged condition
iii. Docking or undocking conditon where the docked ship is completely supported by the
docking blocks and the draft level is just below the docking block height.
Figure 16: Docking/ undocking condition
iv. The working draft condition where the docking load is completely supported on the
docking blocks and in addition only the weights mentioned in the initial case acting with
an increased draft.
Figure 17: Working condition
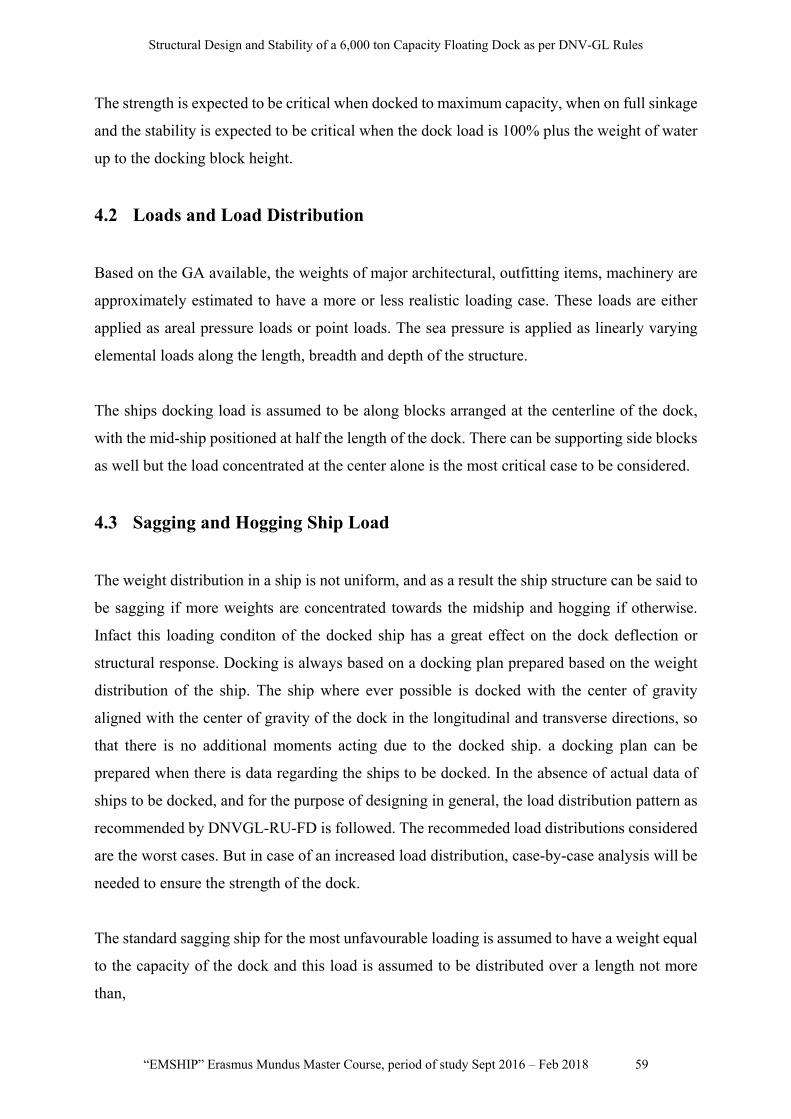
Structural Design and Stability of a 6,000 ton Capacity Floating Dock as per DNV-GL Rules
“EMSHIP” Erasmus Mundus Master Course, period of study Sept 2016 – Feb 2018 59
The strength is expected to be critical when docked to maximum capacity, when on full sinkage
and the stability is expected to be critical when the dock load is 100% plus the weight of water
up to the docking block height.
4.2 Loads and Load Distribution
Based on the GA available, the weights of major architectural, outfitting items, machinery are
approximately estimated to have a more or less realistic loading case. These loads are either
applied as areal pressure loads or point loads. The sea pressure is applied as linearly varying
elemental loads along the length, breadth and depth of the structure.
The ships docking load is assumed to be along blocks arranged at the centerline of the dock,
with the mid-ship positioned at half the length of the dock. There can be supporting side blocks
as well but the load concentrated at the center alone is the most critical case to be considered.
4.3 Sagging and Hogging Ship Load
The weight distribution in a ship is not uniform, and as a result the ship structure can be said to
be sagging if more weights are concentrated towards the midship and hogging if otherwise.
Infact this loading conditon of the docked ship has a great effect on the dock deflection or
structural response. Docking is always based on a docking plan prepared based on the weight
distribution of the ship. The ship where ever possible is docked with the center of gravity
aligned with the center of gravity of the dock in the longitudinal and transverse directions, so
that there is no additional moments acting due to the docked ship. a docking plan can be
prepared when there is data regarding the ships to be docked. In the absence of actual data of
ships to be docked, and for the purpose of designing in general, the load distribution pattern as
recommended by DNVGL-RU-FD is followed. The recommeded load distributions considered
are the worst cases. But in case of an increased load distribution, case-by-case analysis will be
needed to ensure the strength of the dock.
The standard sagging ship for the most unfavourable loading is assumed to have a weight equal
to the capacity of the dock and this load is assumed to be distributed over a length not more
than,

Kodathoor Gangadharan Midhun
60 Master Thesis Developed at West Pomeranian University of Technology, Szczecin
0.8 The weight distribution curve in this case is assumed to be symmetrical and is in the form of a
rectangle with a parabola on top, such that the area of the rectangle is twice the area of the
parabola.
Figure 18: Weight distribution of standard sagging ship
Source: DNVGL-RU-FD Figure 1
The standard hogging ship for the most unfavourable loading is assumed to have a weight
equal to the capacity of the dock and this load is assumed to be distributed over a length not
less than,
1.2 The weight distribution curve in this case is assumed to be symmetrical and is in the form of a
rectangle along the length and two small rectangles at the ends on top of it, such that the area
of the larger rectangle is twice the sum of the areas of the smaller ones.
Figure 19: Weight distribution of standard hogging ship
Source: DNVGL-RU-FD Figure 2
13
23 1
34
23 1
34
16
16
13
13

Structural Design and Stability of a 6,000 ton Capacity Floating Dock as per DNV-GL Rules
“EMSHIP” Erasmus Mundus Master Course, period of study Sept 2016 – Feb 2018 61
4.4 Finite Element Model
A finite element model is developed for the global strength analysis of the structure as per the
guidelines in DNV-GL-CG-0127. All major structural members which contribute to the
longitudinal and transverse strength are modelled. These include the hull plates, bulkhead
plates, girders, frames and stiffeners. The gross thickness of members are considered in this
case as per the guideleines of DNVGL-CG-0127. All the plates, girder and frame webs are
modelled with 4-noded quadrilateral meshes wherever possible and otherwise 3-noded
triangular meshes are applied. The flanges of girders and frames and the stiffeners are modelled
as beam elements. An ideal mesh size of 300 mm x 300 mm is followed wherever possible. The
aspect ratio of the elements is kept closer to 1 wherever possbile and less than 3 the maximum.
All the major structural cut-outs, for example, for the doors, windows, hatches etc are
considered in the model. A summary of the FE model is given in the table below.
Table 8: FEM data
No. of nodes 234899
No. of elements 358705
Plate elements Plates, girder and frame webs
Beam elements Girder and frame flanges, stiffeners, pillars, brackets
Spring elements Bolted connections
The material properties were chosen based on the recommendations in DNVGL-CG-0127.
Table 9 lists the properties of the material considered in the analysis.
Table 9: Material properties
Material
Young's Modulus Poisson Ratio Shear Modulus Density
kN/m2 kN/m2 t/m3
Steel 2.06 x 10⁸ 0.3 0.792 x 10⁸ 7.8
Coordinate system:
A rectangular coordinate system is adopted for the global model with the origin (0, 0, 0) located
at the one corner such that, the length of the dock is along the positive x-axis (aft to foreward),
the breadth of the dock is along the positive y-axis (starboard to port) and the height of the dock
is along the positive z-axis from the baseline. The results ae sometimes represented in a

Kodathoor Gangadharan Midhun
62 Master Thesis Developed at West Pomeranian University of Technology, Szczecin
generated coordinate system with the origin located at the base and the longitudinal and
transverse center of the dock.
Figure 20: Rectangular coordinate system
Figure 21: Global finite element model perspective view
Figure 22: Global finite element model side view

Structural Design and Stability of a 6,000 ton Capacity Floating Dock as per DNV-GL Rules
“EMSHIP” Erasmus Mundus Master Course, period of study Sept 2016 – Feb 2018 63
Figure 23: Global finite element model end view (enlarged)
4.5 Boundary Conditions and Connections
The dock as a floating body is not rigidly fixed in any direction. The stability and motion
restraint is achieved through the balancing hydrostatic forces acting on the hull. All the nodes
in FEMAP model is free to translate and rotate and has six degrees of freedom. So it is needed
to restrain the xyz translations at first hand and then restrain the rotations about x, y and z axes
of the global model to achieve a state of equilibrium.
To achieve near realistic conditions, one point each at the aft end wall and the foreward end
wall are completely restrained against translational motions. As the ends are not restrained
against the rotation, another point is fixed in the y-direction so that stability is attained against
rotation. The same restraints are applied at the aft end and foreward end as the structure is
discontinuous along the pontoon structure. A single point cosntraint can cause stress
concentration at those nodes due to structural imbalances, which is not happening in actual case.
So to overcome that a rigid node respresenting the nodes along the end surface are modelled
and the boundary condtiions are applied to these nodes. The result is that it acts as single point
supports, but the resulting forces will be shared equally on to the member nodes. Figure 24
shows the restraint locations and restraint directions considered in the analysis.

Kodathoor Gangadharan Midhun
64 Master Thesis Developed at West Pomeranian University of Technology, Szczecin
Figure 24: A wire frame view of the model with boundary constraints
Since the dock wings and sectional pontoons are seperate structures which are assembled
through bolting, a proper connection has to be considered in the analsyis which could replicate
the bolting connections. As the bolts are designed for tension and shear, and less moments, a
connection which doesnt transfer moments but only translational forces are considered. This is
enabled through spring supports of sufficient stiffness constants close to that of the bolts.
Springs of stiffness constant 106 N/mm are assumed and provided in the x, y and z directions.
A minimum rotational stiffnes of 10 N/mm is applied to achieve stability of the model.
4.6 Finite Element Analysis
4.6.1 Working Draft Condition
Based on the weight of the dock and the weights acting on the dock, the draft will be self-
adjusted to give the required uplift or balancing force. The external hydrostatic pressure acting
depend on this draft. The working draft of the dock is estimated between 1.69 m and 4.2 m in
a preliminary stability check purely based on assumed weight. With the estimated weights and
full lifting capacity, the required draft obtained is 3.9 m and this is assumed to be the working
draft, where as the maximum working draft can be up to 4.2m. the various loads that act in this
condition are:
i. The lightweight including the full load of consumables and rest water of 2 feet high at
the bottom of the pontoon.
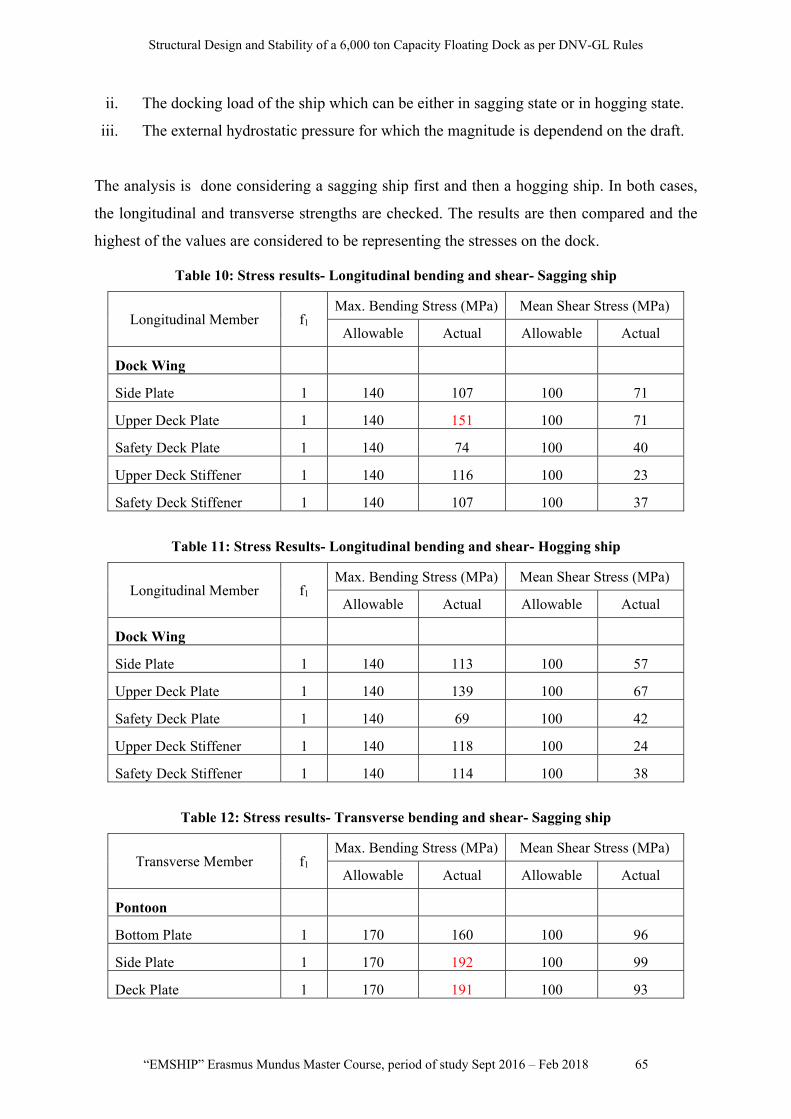
Structural Design and Stability of a 6,000 ton Capacity Floating Dock as per DNV-GL Rules
“EMSHIP” Erasmus Mundus Master Course, period of study Sept 2016 – Feb 2018 65
ii. The docking load of the ship which can be either in sagging state or in hogging state.
iii. The external hydrostatic pressure for which the magnitude is dependend on the draft.
The analysis is done considering a sagging ship first and then a hogging ship. In both cases,
the longitudinal and transverse strengths are checked. The results are then compared and the
highest of the values are considered to be representing the stresses on the dock.
Table 10: Stress results- Longitudinal bending and shear- Sagging ship
Longitudinal Member f1 Max. Bending Stress (MPa) Mean Shear Stress (MPa)
Allowable Actual Allowable Actual
Dock Wing
Side Plate 1 140 107 100 71
Upper Deck Plate 1 140 151 100 71
Safety Deck Plate 1 140 74 100 40
Upper Deck Stiffener 1 140 116 100 23
Safety Deck Stiffener 1 140 107 100 37
Table 11: Stress Results- Longitudinal bending and shear- Hogging ship
Longitudinal Member f1 Max. Bending Stress (MPa) Mean Shear Stress (MPa)
Allowable Actual Allowable Actual
Dock Wing
Side Plate 1 140 113 100 57
Upper Deck Plate 1 140 139 100 67
Safety Deck Plate 1 140 69 100 42
Upper Deck Stiffener 1 140 118 100 24
Safety Deck Stiffener 1 140 114 100 38
Table 12: Stress results- Transverse bending and shear- Sagging ship
Transverse Member f1 Max. Bending Stress (MPa) Mean Shear Stress (MPa)
Allowable Actual Allowable Actual
Pontoon
Bottom Plate 1 170 160 100 96
Side Plate 1 170 192 100 99
Deck Plate 1 170 191 100 93
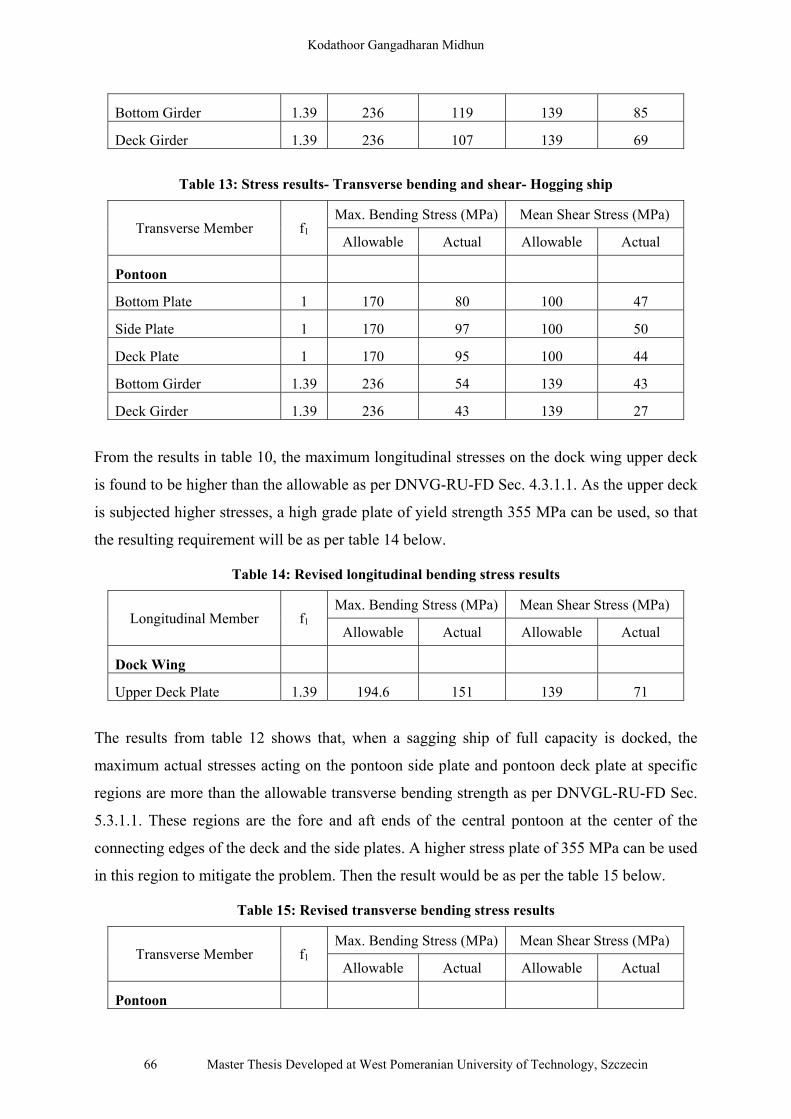
Kodathoor Gangadharan Midhun
66 Master Thesis Developed at West Pomeranian University of Technology, Szczecin
Bottom Girder 1.39 236 119 139 85
Deck Girder 1.39 236 107 139 69
Table 13: Stress results- Transverse bending and shear- Hogging ship
Transverse Member f1 Max. Bending Stress (MPa) Mean Shear Stress (MPa)
Allowable Actual Allowable Actual
Pontoon
Bottom Plate 1 170 80 100 47
Side Plate 1 170 97 100 50
Deck Plate 1 170 95 100 44
Bottom Girder 1.39 236 54 139 43
Deck Girder 1.39 236 43 139 27
From the results in table 10, the maximum longitudinal stresses on the dock wing upper deck
is found to be higher than the allowable as per DNVG-RU-FD Sec. 4.3.1.1. As the upper deck
is subjected higher stresses, a high grade plate of yield strength 355 MPa can be used, so that
the resulting requirement will be as per table 14 below.
Table 14: Revised longitudinal bending stress results
The results from table 12 shows that, when a sagging ship of full capacity is docked, the
maximum actual stresses acting on the pontoon side plate and pontoon deck plate at specific
regions are more than the allowable transverse bending strength as per DNVGL-RU-FD Sec.
5.3.1.1. These regions are the fore and aft ends of the central pontoon at the center of the
connecting edges of the deck and the side plates. A higher stress plate of 355 MPa can be used
in this region to mitigate the problem. Then the result would be as per the table 15 below.
Table 15: Revised transverse bending stress results
Transverse Member f1 Max. Bending Stress (MPa) Mean Shear Stress (MPa)
Allowable Actual Allowable Actual
Pontoon
Longitudinal Member f1 Max. Bending Stress (MPa) Mean Shear Stress (MPa)
Allowable Actual Allowable Actual
Dock Wing
Upper Deck Plate 1.39 194.6 151 139 71

Structural Design and Stability of a 6,000 ton Capacity Floating Dock as per DNV-GL Rules
“EMSHIP” Erasmus Mundus Master Course, period of study Sept 2016 – Feb 2018 67
Side Plate 1.39 194.6 192 139 99
Deck Plate 1.39 194.6 191 139 93
Figure 25 shows the location of maximum Von Mises Stress plot in case of a sagging ship of
full capacity docked.
Figure 25: Max. Von Mises stress plot- Sagging ship
From figure 25, the maximum stresses element is seen on the flange of the pontoon deck girder,
where the bracket from the central pillar is connected. The maximum value obtained is 271.3
MPa and the allowable value as per DNVGL-RU-FD Sec. 5.3.1.1 is 278 MPa. So the peak
stress is found to be with-in the limits of combined stress. From the stress contour, it is clear
that the peak stresses are much localised and all other elements can be seen in very reasonable
range of stresses. So the structure as a whole is very much safe in carrying the stipulated loads
in this condition. A closer view on the high stressed regions on the low yield strength members
initially considered is shown in figure 26 below.
Figure 26: Von Mises Stress excluding high yield strength members

Kodathoor Gangadharan Midhun
68 Master Thesis Developed at West Pomeranian University of Technology, Szczecin
The first plot of figure 26 shows the section of the pontoons with in the adjacent frames on
either sides of the centreline and the second plot shows the remaining section. The limit for the
stresses for low yield members used is 200 MPa. Von Mises stresses above 200 MPa is obtained
on the central pontoon bulkhead and the pontoon deck, side and bottom edges at the region. But
all these higher values are less than 278 MPa which is the limit in case of a plate of high yield
strength. So it is advisable to use high yield plates at those regions of expected high stresses.
So the central pontoon deck, side and bottom plates along the length, with in one frame on the
port and starboard sides and the central pontoon bulkhead are advisable to be replaced with
plates of yield strength 355 MPa.
Figure 27 below, shows the maximum Von Mises Stress plot in case of a hogging ship of full
capacity docked.
Figure 27: Max. Von Mises stress plot- Hogging ship
From figure 27, the maximum Von Mises stress plot shows the peak stress occurs at the pontoon
central bulkhead at aft end bottom. The maximum value obtained is 207.7 MPa. Allowable
value as per DNVGL-RU-FD Sec. 5.3.1.1 is 200 MPa. A high yield strength plate of 355 MPa
is recommended for this region so that the allowable stress is increased to 278 MPa. A closer
view on the high stressed regions on the low yield strength members initially considered is
shown in figure 28.

Structural Design and Stability of a 6,000 ton Capacity Floating Dock as per DNV-GL Rules
“EMSHIP” Erasmus Mundus Master Course, period of study Sept 2016 – Feb 2018 69
Figure 28: Von Mises Stress plot excluding high yield strength members
The first plot of figure 28 shows the section of the pontoons with in the adjacent frames on
either sides of the centreline and the second plot shows the remaining section. The limit for the
stresses for low yield members used is 200 MPa. Von Mises stresses above 200 MPa is obtained
on the central pontoon bulkhead. But all this higher value is much less than 278 MPa which is
the limit in case of a plate of high yield strength. So it is advisable to use high yield plates at
those regions of expected high stresses. So the central bulkhead at the aft and fore end pontoons
are advisable to be replaced with plates of yield strength 355 MPa.
The deflection plots for the dock along the longitudinal and the transverse are shown in the
figure 29 and 30 respectively. Both sagging and hogging cases are considered.
Figure 29: Vertical deflection along the length in sagging and hogging working condition
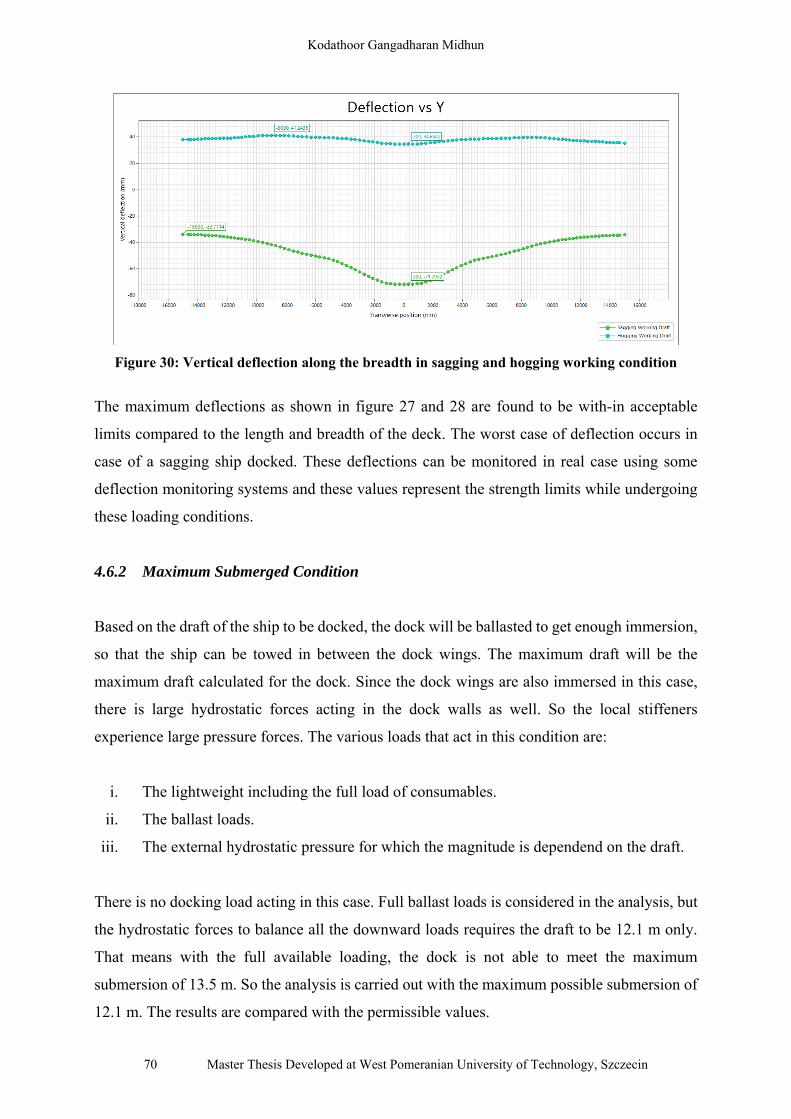
Kodathoor Gangadharan Midhun
70 Master Thesis Developed at West Pomeranian University of Technology, Szczecin
Figure 30: Vertical deflection along the breadth in sagging and hogging working condition
The maximum deflections as shown in figure 27 and 28 are found to be with-in acceptable
limits compared to the length and breadth of the deck. The worst case of deflection occurs in
case of a sagging ship docked. These deflections can be monitored in real case using some
deflection monitoring systems and these values represent the strength limits while undergoing
these loading conditions.
4.6.2 Maximum Submerged Condition
Based on the draft of the ship to be docked, the dock will be ballasted to get enough immersion,
so that the ship can be towed in between the dock wings. The maximum draft will be the
maximum draft calculated for the dock. Since the dock wings are also immersed in this case,
there is large hydrostatic forces acting in the dock walls as well. So the local stiffeners
experience large pressure forces. The various loads that act in this condition are:
i. The lightweight including the full load of consumables.
ii. The ballast loads.
iii. The external hydrostatic pressure for which the magnitude is dependend on the draft.
There is no docking load acting in this case. Full ballast loads is considered in the analysis, but
the hydrostatic forces to balance all the downward loads requires the draft to be 12.1 m only.
That means with the full available loading, the dock is not able to meet the maximum
submersion of 13.5 m. So the analysis is carried out with the maximum possible submersion of
12.1 m. The results are compared with the permissible values.
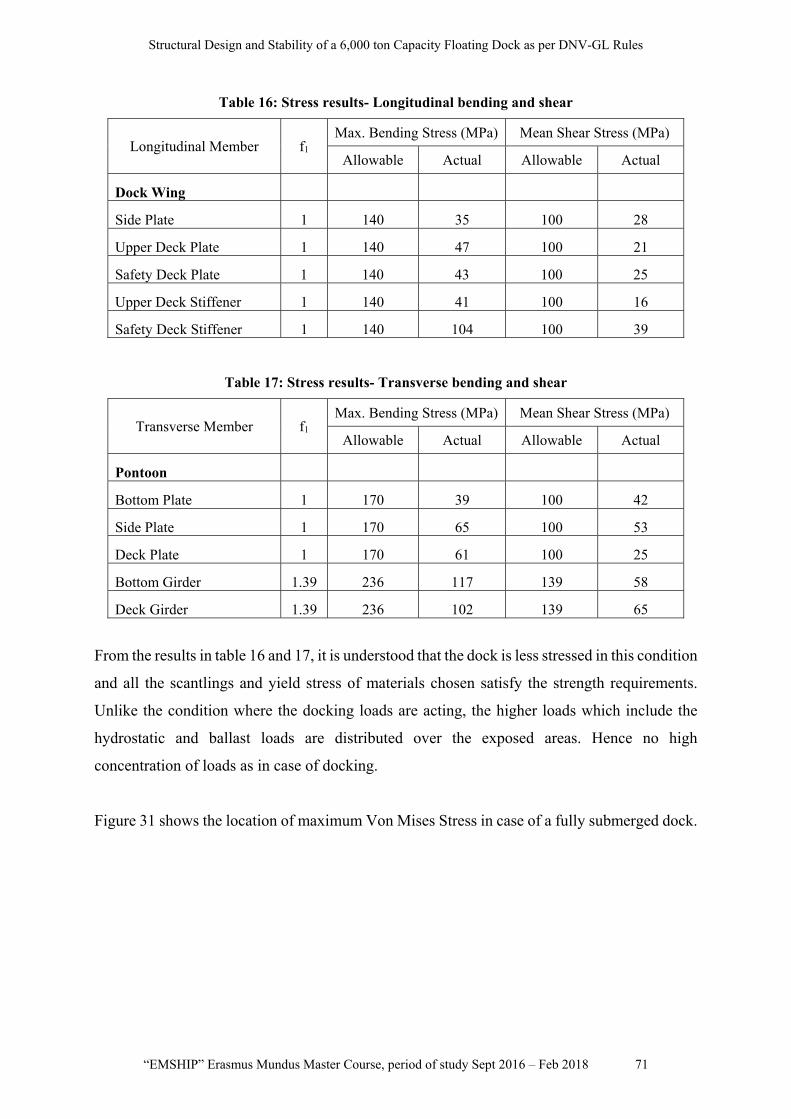
Structural Design and Stability of a 6,000 ton Capacity Floating Dock as per DNV-GL Rules
“EMSHIP” Erasmus Mundus Master Course, period of study Sept 2016 – Feb 2018 71
Table 16: Stress results- Longitudinal bending and shear
Longitudinal Member f1 Max. Bending Stress (MPa) Mean Shear Stress (MPa)
Allowable Actual Allowable Actual
Dock Wing
Side Plate 1 140 35 100 28
Upper Deck Plate 1 140 47 100 21
Safety Deck Plate 1 140 43 100 25
Upper Deck Stiffener 1 140 41 100 16
Safety Deck Stiffener 1 140 104 100 39
Table 17: Stress results- Transverse bending and shear
Transverse Member f1 Max. Bending Stress (MPa) Mean Shear Stress (MPa)
Allowable Actual Allowable Actual
Pontoon
Bottom Plate 1 170 39 100 42
Side Plate 1 170 65 100 53
Deck Plate 1 170 61 100 25
Bottom Girder 1.39 236 117 139 58
Deck Girder 1.39 236 102 139 65
From the results in table 16 and 17, it is understood that the dock is less stressed in this condition
and all the scantlings and yield stress of materials chosen satisfy the strength requirements.
Unlike the condition where the docking loads are acting, the higher loads which include the
hydrostatic and ballast loads are distributed over the exposed areas. Hence no high
concentration of loads as in case of docking.
Figure 31 shows the location of maximum Von Mises Stress in case of a fully submerged dock.

Kodathoor Gangadharan Midhun
72 Master Thesis Developed at West Pomeranian University of Technology, Szczecin
Figure 31: Max. Von Mises stress plot
From figure 31, the maximum Von Mises stress is seen on the dock wing bottom web at the
location in the figure. The maximum stress value is 166.7 MPa and the allowable value as per
DNVGL-RU-FD Sec. 5.3.1.1 is 200 MPa. So the peak stress is found to be with-in the limits of
combined stress. The peak stress here is much localised and no way affecting the global strength
of the structure. The stress contour shows the stresses on the majority of the elements comes in
a very lesser range.
The deflection obtained is very less and not critical in this case.
4.6.3 Docking and Undocking Condition
As the ship to be docked is towed in to position, between the dock wings of the fully submerged
dock, the lifting of the dock and docking of the vessel is achieved through de-ballasting of the
dock. As the dock emerges out of water, the vessel to be docked is positioned as such the keel
rests on the docking blocks arranged linearly along the length of the dock. Once there is contact
between the keel of the ship and the docking blocks, the weight of the vessel starts to be carried
on to the dock. The vessel in immersed state, the initial loading will be less as there is the
buoyancy forces acting due to the immersed hull of then vessel. When the draft of the dock is
decreased further, it passes through a state when the docked vessel hull is completely out of
water, which means the load of the vessel in full is acting on the dock. since the docking block
has a height of 1.2 m (assumed in this case), a draft level just below the dock block level would

Structural Design and Stability of a 6,000 ton Capacity Floating Dock as per DNV-GL Rules
“EMSHIP” Erasmus Mundus Master Course, period of study Sept 2016 – Feb 2018 73
be critical as there is the load of the docked vessel plus the hydrostatic pressure acting on the
deck. This case of loading would be critical for a dock and needs to be carefully analyzed. This
section analyses such a condition.
The various loads that act in this condition are:
i. The lightweight including the full load of consumables
ii. The docking load of the ship which can be either in sagging state or in hogging state.
iii. The external hydrostatic pressure for which the magnitude is dependend on the draft.
The analysis is done considering a sagging ship first and then a hogging ship. In both cases,
the longitudinal and transverse strength are checked. Ballast loads are considered which is
enough to balance the buoyancy forces created at the draft level of 5.7 m (just below the docking
blocks). The results are then compared and the highest of the values are considered to be
representing the strength of the dock.
Table 18: Stress results- Longitudinal bending and shear- Sagging ship
Longitudinal Member f1 Max. Bending Stress (MPa) Mean Shear Stress (MPa)
Allowable Actual Allowable Actual
Dock Wing
Side Plate 1 140 108 100 73
Upper Deck Plate 1 140 145 100 69
Safety Deck Plate 1 140 72 100 38
Upper Deck Stiffener 1 140 113 100 22
Safety Deck Stiffener 1 140 107 100 37
Table 19: Stress results- Longitudinal bending and shear- Hogging ship
Longitudinal Member f1 Max. Bending Stress (MPa) Mean Shear Stress (MPa)
Allowable Actual Allowable Actual
Dock Wing
Side Plate 1 140 122 100 57
Upper Deck Plate 1 140 147 100 70
Safety Deck Plate 1 140 75 100 43
Upper Deck Stiffener 1 140 125 100 25
Safety Deck Stiffener 1 140 114 100 38

Kodathoor Gangadharan Midhun
74 Master Thesis Developed at West Pomeranian University of Technology, Szczecin
Table 20: Stress results- Transverse bending and shear- Sagging ship
Transverse Member f1 Max. Bending Stress (MPa) Mean Shear Stress (MPa)
Allowable Actual Allowable Actual
Pontoon
Bottom Plate 1 170 164 100 101
Side Plate 1 170 203 100 105
Deck Plate 1 170 201 100 98
Bottom Girder 1.39 236 122 139 89
Deck Girder 1.39 236 113 139 78
Table 21: Stress results- Transverse bending and shear- Hogging ship
Transverse Member f1 Max. Bending Stress (MPa) Mean Shear Stress (MPa)
Allowable Actual Allowable Actual
Pontoon
Bottom Plate 1 170 86 100 51
Side Plate 1 170 105 100 53
Deck Plate 1 170 103 100 48
Bottom Girder 1.39 236 56 139 47
Deck Girder 1.39 236 47 139 36 From the results in table 18 and 19, the maximum longitudinal stresses on the dock wing upper
deck is found to be higher than the allowable as per DNVG-RU-FD Sec. 4.3.1.1. As the upper
deck is subjected higher stresses, a high grade plate of yield strength 355 MPa can be used as
explained in section 4.6.1.
The results from table 20 shows that, when a sagging ship of full capacity is docked, the
maximum actual stresses acting on the pontoon side plate, pontoon deck plate and pontoon
bottom plate at specific regions are more than the allowable transverse bending strength as per
DNVGL-RU-FD Sec. 5.3.1.1. These regions are the fore and aft ends of the central pontoon at
the center of the connecting edges of the deck and the side plates and the bottom and the side
plates. A higher stress plate of 355 MPa can be used in this region to mitigate the problem as
explained in section 4.6.1.
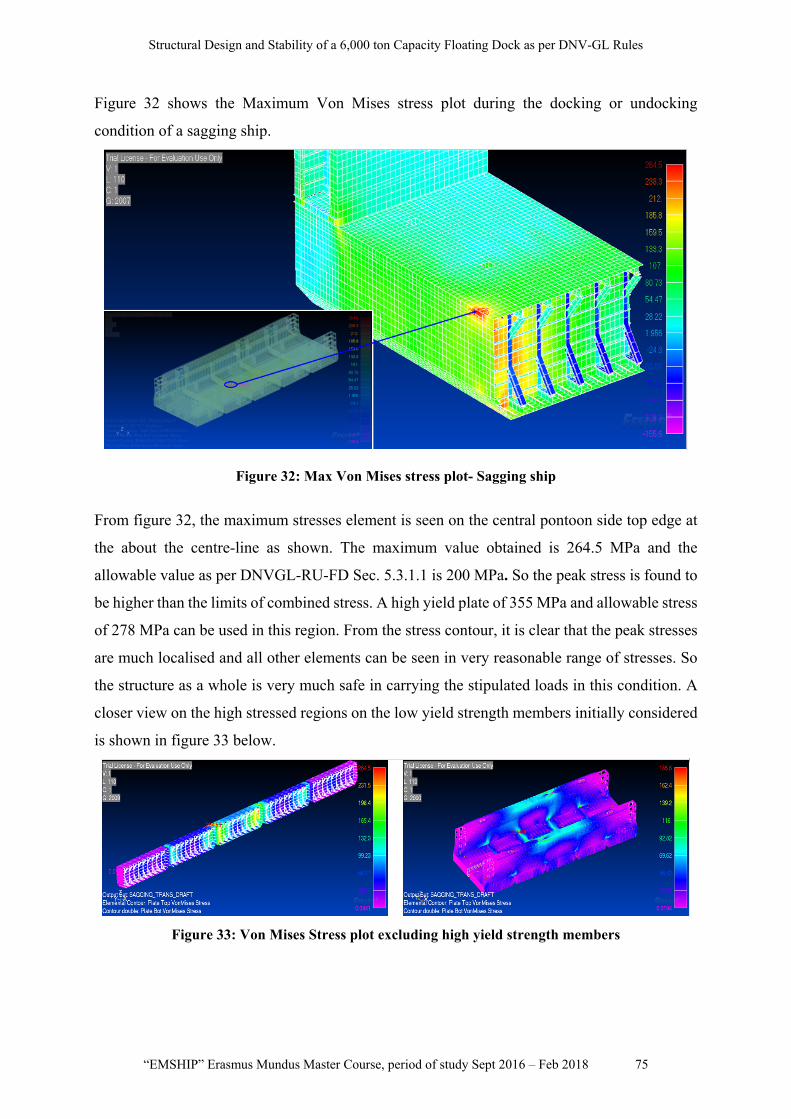
Structural Design and Stability of a 6,000 ton Capacity Floating Dock as per DNV-GL Rules
“EMSHIP” Erasmus Mundus Master Course, period of study Sept 2016 – Feb 2018 75
Figure 32 shows the Maximum Von Mises stress plot during the docking or undocking
condition of a sagging ship.
Figure 32: Max Von Mises stress plot- Sagging ship
From figure 32, the maximum stresses element is seen on the central pontoon side top edge at
the about the centre-line as shown. The maximum value obtained is 264.5 MPa and the
allowable value as per DNVGL-RU-FD Sec. 5.3.1.1 is 200 MPa. So the peak stress is found to
be higher than the limits of combined stress. A high yield plate of 355 MPa and allowable stress
of 278 MPa can be used in this region. From the stress contour, it is clear that the peak stresses
are much localised and all other elements can be seen in very reasonable range of stresses. So
the structure as a whole is very much safe in carrying the stipulated loads in this condition. A
closer view on the high stressed regions on the low yield strength members initially considered
is shown in figure 33 below.
Figure 33: Von Mises Stress plot excluding high yield strength members
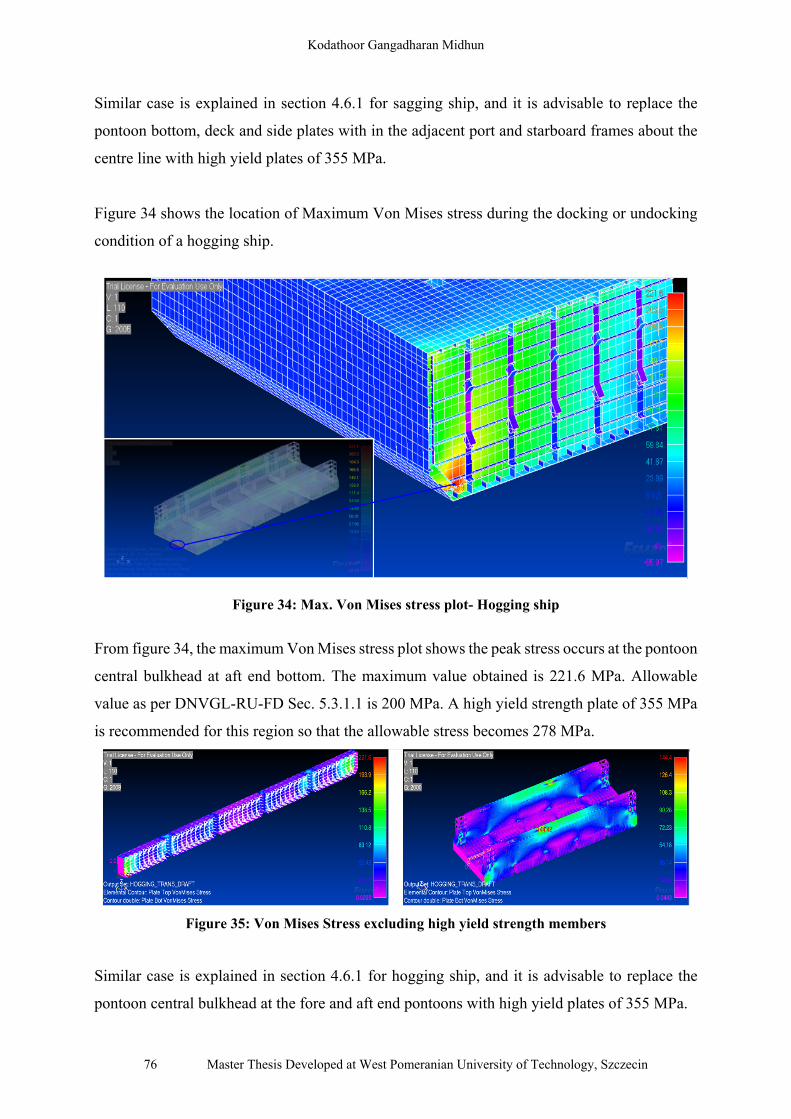
Kodathoor Gangadharan Midhun
76 Master Thesis Developed at West Pomeranian University of Technology, Szczecin
Similar case is explained in section 4.6.1 for sagging ship, and it is advisable to replace the
pontoon bottom, deck and side plates with in the adjacent port and starboard frames about the
centre line with high yield plates of 355 MPa.
Figure 34 shows the location of Maximum Von Mises stress during the docking or undocking
condition of a hogging ship.
Figure 34: Max. Von Mises stress plot- Hogging ship
From figure 34, the maximum Von Mises stress plot shows the peak stress occurs at the pontoon
central bulkhead at aft end bottom. The maximum value obtained is 221.6 MPa. Allowable
value as per DNVGL-RU-FD Sec. 5.3.1.1 is 200 MPa. A high yield strength plate of 355 MPa
is recommended for this region so that the allowable stress becomes 278 MPa.
Figure 35: Von Mises Stress excluding high yield strength members
Similar case is explained in section 4.6.1 for hogging ship, and it is advisable to replace the
pontoon central bulkhead at the fore and aft end pontoons with high yield plates of 355 MPa.

Structural Design and Stability of a 6,000 ton Capacity Floating Dock as per DNV-GL Rules
“EMSHIP” Erasmus Mundus Master Course, period of study Sept 2016 – Feb 2018 77
The deflection plots in the docking and undocking condition is shown in figure 36 and 37.
Figure 36: Vertical deflection along the length in sagging and hogging docking condition
Figure 37: Vertical deflection along the breadth in sagging and hogging docking condition
The maximum deflections as shown in figure 36 and 37 are found to be with-in acceptable
limits compared to the length and breadth of the deck. The deflections seem to be a little higher
than that in the working condition.
4.7 Summary
From the FEA performed for various loading conditions, a comparison of the stress results show
that the maximum stresses on the members is expected to occur in the case of a sagging ship on

Kodathoor Gangadharan Midhun
78 Master Thesis Developed at West Pomeranian University of Technology, Szczecin
dock. The stresses are a little higher in the stage when the water level is just below the docking
blocks with the full ship weight carried by the dock, that is, in the docking or undocking stage.
A closer study of the high stressed regions show that these high stresses are occurring on
elements at the corners or where there is point loads applied or stress concentration taking place.
And the neighboring elements has stress values lesser by about 30% or more. Figure 38 is the
plot of maximum Von Mises stresses on the deck plate. Marked in the picture are the 2 elements
which has high stress concentration. These areas need to be locally analyzed and these will not
be deciding the global structural strength. But in case of the subject design, the peak stresses
calculated are with-in the specified limits. So the structure can be deemed safe. But a detailed
analysis could help optimizing, by using lesser grades of steel which has an influence on the
cost.
Figure 38: Stress Concentration
The stresses experienced by the structure seems to be very less with enough factor of safety
except for those stress concentrated regions.
Based on the results from FEA, the following changes to the scantlings is made:
1. High yield plate of yield strength 355 MPa is used for the pontoon deck, side and bottom
between the first frame to the port and to the starboard.
2. High yield plate of yield strength 355 MPa is used for the pontoon central bulkhead.
3. High yield plate of yield strength 355 MPa is used for the dock wing upper deck plate.
The stress is related to the strain and the deflections, and as such deflection is also an important
parameter in assessing strength. The deflection of the dock are divided in to the dockwing
deflection and the pontoon deflection. All the deflection values obtained in different analyses

Structural Design and Stability of a 6,000 ton Capacity Floating Dock as per DNV-GL Rules
“EMSHIP” Erasmus Mundus Master Course, period of study Sept 2016 – Feb 2018 79
are found acceptable. The maximum deflection can be regarded as representing the maximum
stress value and the deflection has to be monitored while docking operations and proper
ballasting has to be done to control the deflection and thereby stresses.
The worst condition for the dock is found to be for docking a sagging ship of full capacity and
at a stage when the water level is just below the docking block level, with the full docking load
supported by the dock.

Kodathoor Gangadharan Midhun
80 Master Thesis Developed at West Pomeranian University of Technology, Szczecin
5 BUCKLING CHECK
5.1 General
Buckling is the sudden sideways deflection of a structural member. Buckling can occur due to
compressive or shear stresses. A member subjected to buckling fails to carry any more of
compressive or shear loads and is considered an ultimate failure. This failure can happen even
when the stresses developed within are well below the yield stresses. So in addition to bending
and shear stress checks an additional check on the buckling is necessary so that any probabilities
can be eliminated by suitably stiffening or increasing the sections.
In the subject design buckling has to be checked for the pontoon pillars which suffer high axial
forces. The stress values are taken from the FEA and the buckling is checked based on the
DNV-GL Rules for buckling.
The buckling acceptance criteria as defined by DNV-GL is,
(43)
Where,
value is given below.
Table 22: Buckling acceptance criteria
Source: DNVGL-RU-SHIP Part 3 Chapter 8 Table 3

Structural Design and Stability of a 6,000 ton Capacity Floating Dock as per DNV-GL Rules
“EMSHIP” Erasmus Mundus Master Course, period of study Sept 2016 – Feb 2018 81
The above table provides the allowable buckling utilisation factor for various structural parts
critical to buckling for different loading scenarios namely, static (S), dynamic (D), accidental
(A) and temperature loadings (T). The subject design doesn’t take in to consideration any
dynamic, temperature or accidental loading conditions. So the buckling check is based on the
acceptance criteria I (AC-I).
5.2 Buckling of Pillars
The pillars transferring the deck loads to the bottom structure used in the pontoons is subjected
to high axial loading especially in case of docking. The strength of pillars to resist any buckling
failure is of utmost importance.
The buckling utilization factor for axially compressed pillars is given by,
(44)
Figure 39 shows the gross section of the main load bearing pillars used in the pontoons. The
corrosion allowance is 3 mm each for web and flange. The net section properties is considered
in the buckling check.
Figure 39: Typical I-section pillar
Table 23: Gross section properties
Height Sectional Area Weaker moment of inertia
(m) (cm2) (cm4)
3.77 91.4 3648

Kodathoor Gangadharan Midhun
82 Master Thesis Developed at West Pomeranian University of Technology, Szczecin
Table 24: Net section properties
Height Sectional Area Weaker moment of inertia
(m) (cm2) (cm4)
3.77 68.7 2865
is taken equal to the elastic column buckling stress if its value is less than or equal to half
the minimum yield stress or else, it has to be calculated as per the formulation given in DNVGL-
CG-0128 section 3.4.1 and 3.4.2.
The calculated value is given below,
302 /
The maximum average axial stress obtained from the axial forces acting in various loading
cases in tabulated below,
Table 25: Axial stress result
Loading case Max. σav
(N/mm2)
Sagging Working Condtion 120
∴ 0.40
As per AC-I, for static loading case, 0.65
, hence the condition that the member yields before buckling is satisfied.
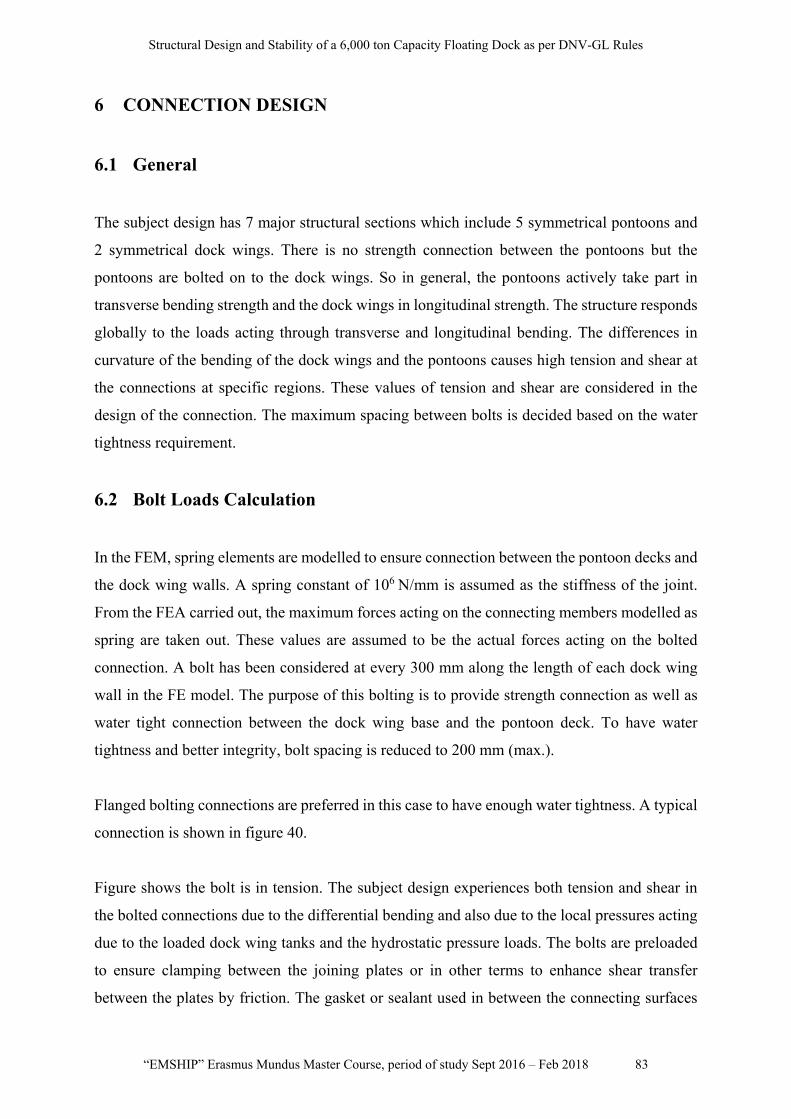
Structural Design and Stability of a 6,000 ton Capacity Floating Dock as per DNV-GL Rules
“EMSHIP” Erasmus Mundus Master Course, period of study Sept 2016 – Feb 2018 83
6 CONNECTION DESIGN
6.1 General
The subject design has 7 major structural sections which include 5 symmetrical pontoons and
2 symmetrical dock wings. There is no strength connection between the pontoons but the
pontoons are bolted on to the dock wings. So in general, the pontoons actively take part in
transverse bending strength and the dock wings in longitudinal strength. The structure responds
globally to the loads acting through transverse and longitudinal bending. The differences in
curvature of the bending of the dock wings and the pontoons causes high tension and shear at
the connections at specific regions. These values of tension and shear are considered in the
design of the connection. The maximum spacing between bolts is decided based on the water
tightness requirement.
6.2 Bolt Loads Calculation
In the FEM, spring elements are modelled to ensure connection between the pontoon decks and
the dock wing walls. A spring constant of 106 N/mm is assumed as the stiffness of the joint.
From the FEA carried out, the maximum forces acting on the connecting members modelled as
spring are taken out. These values are assumed to be the actual forces acting on the bolted
connection. A bolt has been considered at every 300 mm along the length of each dock wing
wall in the FE model. The purpose of this bolting is to provide strength connection as well as
water tight connection between the dock wing base and the pontoon deck. To have water
tightness and better integrity, bolt spacing is reduced to 200 mm (max.).
Flanged bolting connections are preferred in this case to have enough water tightness. A typical
connection is shown in figure 40.
Figure shows the bolt is in tension. The subject design experiences both tension and shear in
the bolted connections due to the differential bending and also due to the local pressures acting
due to the loaded dock wing tanks and the hydrostatic pressure loads. The bolts are preloaded
to ensure clamping between the joining plates or in other terms to enhance shear transfer
between the plates by friction. The gasket or sealant used in between the connecting surfaces

Kodathoor Gangadharan Midhun
84 Master Thesis Developed at West Pomeranian University of Technology, Szczecin
could reduce the stiffness of the connection joint. The thickness of the gasket has to be restricted
to as small as possible to have better contact stiffness of the joint. The preloading value depends
on the bolt size and bolt grade. As per AISC ASD Specification for Structural Steel Buildings,
the pretension/ preload shall be 0.7 times the minimum tensile capacity of the bolt.
Figure 40: Typical bolting
Bolt preload creates a compressive force between the contact surfaces and a tension on the bolt.
The idea behind this to reduce the external tension acting in the bolt especially in case of cyclic
loadings to prevent fatigue of the bolts. When an external tension force acts on the joint, the
applied tension is used to relieve the compression forces generated by the bolt preload and when
the compression forces are completely removed, there will be separation of the surfaces in
contact and hence the bolt gets more tensile load. That means up to 80% to 90% of the external
tension load passes through the joint and only the remaining through the bolt. Preload also
enhances slip resistance.
Bolt selection is done as per the guidelines of AISC ASD Specification for Structural Steel
Buildings.
Maximum bolt load obtained from FEA,
131
71
Galvanized carbon steel bolt M24 and grade 8.8 as per ISO 898-1 is chosen.
As per AISC ASD Section J3.6, for the chosen bolt,

Structural Design and Stability of a 6,000 ton Capacity Floating Dock as per DNV-GL Rules
“EMSHIP” Erasmus Mundus Master Course, period of study Sept 2016 – Feb 2018 85
146
105
M24 bolt chosen satisfies the allowable strength requirements.
6.3 Connecting Elements Calculation
The required plate thickness for the connection is based on the design check as per AISC ASD
Section J4-1.
The selected bolt is M24 bolt and the size of the hole required in 26 mm.
6.3.1 Design for Tension
Since the plate elements are subjected to tension, the strength of the elements in yielding and
rupture has to be checked and the lower value is considered as the design strength in tension.
Table 26 gives the parameters needed in the design for tension and table 27 and 28 shows the
design checks for shear yielding and shear rupture respectively.
Table 26: Connecting plate parameters in tension
Thickness Width Fy Fu db Ag An
(mm) (mm) (N/mm2) (N/mm2) (mm) (mm2) (mm2)
12 90 355 480 26 1080 744
Table 27: Tensile yielding
AISC ASD J4.1
Tensile yielding Safety factor Allowable strength
Rn = FyAg (N) Ω Rn/Ω (N)
383400 1.67 229581
Table 28: Tensile rupture
AISC ASD J4.2
Tensile rupture Safety factor Allowable strength
Rn = FuAn (N) Ω Rn/Ω (N)
357120 2.00 178560

Kodathoor Gangadharan Midhun
86 Master Thesis Developed at West Pomeranian University of Technology, Szczecin
So from the tables 27 and 28, the lowest allowable strength is considered as the strength of the
plates in tension which is 178 kN. Since this value is higher than the allowable bolt strength in
tension (146 kN), the considered thickness of plate in connection is acceptable.
6.3.2 Design for Shear
There will be shearing forces acting through the cross section of the connecting plates in the
horizontal directions. Friction between the connecting flanges can reduce the effect of shearing
forces. The forces considered in this section are without friction reduction.
Table 29 gives the parameters involved and table 30 and 31 shows the design checks for shear
yielding and shear rupture respectively.
Table 29: Connecting plate parameters in shear
Thickness Width Fy Fu db Agv Anv
(mm) (mm) (N/mm2) (N/mm2) (mm) (mm2) (mm2)
12 100 355 480 26 1200 864
Table 30: Shear yielding
AISC ASD J4.3
Shear yielding Safety factor Allowable strength
Rn = 0.6FyAgv (N) Ω Rn/Ω (N)
230040 1.5 153360
Table 31: Shear rupture
AISC ASD J4.4
Tensile rupture Safety factor Allowable strength
Rn = 0.6FuAnv (N) Ω Rn/Ω (N)
214272 2.00 107136
So from the tables 30 and 31, the lowest allowable strength is considered as the strength of the
plates in shear which is 107 kN. Since this value is higher than the allowable bolt strength in
shear (105 kN), the considered thickness of plate in connection is acceptable.

Structural Design and Stability of a 6,000 ton Capacity Floating Dock as per DNV-GL Rules
“EMSHIP” Erasmus Mundus Master Course, period of study Sept 2016 – Feb 2018 87
6.4 Bolting Arrangement
The bolting arrangement has to be carefully considered for the strength and water tight integrity
and the ease of installation as well. Three proposals for the connection arrangement are shown
in figures 41 to 43. The figures show section at the port side dock wing to pontoon connection
region with minimum of details for better clarity.
Figure 41: Bolting Option 1
Figure 42: Bolting Option 2

Kodathoor Gangadharan Midhun
88 Master Thesis Developed at West Pomeranian University of Technology, Szczecin
Figure 43: Bolting Option 3
Local stiffening will be required for the webs of connecting parts along the length. Bolt holes
of 26 mm diameter are provided on the flanges for the bolting with a spacing not more than 200
mm. Water-tight gasket is sandwiched between the connecting flanges to ensure water-
tightness. The dock wing to pontoon is bolted continuously along the length and also along the
width at the edges of the pontoon.
The arrangement shown in figure 41 (option 1) and 43 (option 3) could be better in terms of
water tight integrity. Connection plates are welded on the pontoon deck for both the options
and connecting plates are welded on dock wing for option 1 but for option 3, parallel flange
channels of 300 mm x 100 mm are welded to the dock wing base, which could give more
stiffness to the dock wing base. For option 3, bottom flanges of the PFC are used in bolting.
The arrangement shown in figure 42 has bolts plug welded on to a 16 mm plate which is welded
on to the deck to at the inner wall region. The mating plate on the dock wing is provided with
slots for the bolts. The position can be aligned and bolted together. These require comparatively
less steel for the connection plates as there is no web plate needed to be welded on to the
pontoon deck.
From the arrangements considered, option 3 is better in terms of water tightness, ease of
installation and strength.

Structural Design and Stability of a 6,000 ton Capacity Floating Dock as per DNV-GL Rules
“EMSHIP” Erasmus Mundus Master Course, period of study Sept 2016 – Feb 2018 89
7 INTACT STABILITY CHECK
7.1 General
Stability of a floating structure can be defined as the ability to get back to the upright position
which is favorable when the external forces or internal forces are changed, added or removed.
The various forces include the gravitational loads, the balancing buoyant forces, wind, waves,
free surface moments, etc.
The basic theory behind is that equilibrium is attained when the weight assumed to be acting
down through the center of gravity of the structure is balanced by an equivalent upward buoyant
force assumed to be acting through the center of buoyancy and the center of buoyancy is
vertically in line with the center of gravity. Figure 44 shows the basic position of various
stability parameters for an upright dock.
Figure 44: Upright dock
When the structure is heeled due to an imbalance in the forces, the underwater volume of the
dock changes and the apparent point where the vertical through the initial buoyancy and the
new buoyancy intersects is termed as metacenter and metacentric height or GM is a measure of
the initial stability of the structure (up to 15 degrees). The structure tends to get back to position
with a righting moment of ΔGZ where Δ is the displacement of the structure and GZ is the
righting arm calculated as GM.Sin θ where θ is the angle of heel.

Kodathoor Gangadharan Midhun
90 Master Thesis Developed at West Pomeranian University of Technology, Szczecin
Figure 45: Heeling dock
There can be positive, neutral or negative equilibrium based on the position of M. If it falls
above G, the structure is said to be in positive equilibrium or the righting moment tends to bring
back the ship to the upright position. If M falls below G, then the structure is in negative
equilibrium or then there is no righting moment but an additional heeling moment which tends
the ship to heel more. And another case is that of neutral equilibrium in which M falls on G, or
GM=0, GZ=0, there is no righting or additional heeling moment.
To have an initial stability GM must be positive. Too high GM gives a very high righting
moment, which makes the rolling period faster which is not a comfortable condition. A very
low GM, makes the rolling period slower which is also not a preferred case. Optimum cases are
defined by IMO criteria for intact stability.
The stability of a ship is related to the hydrostatic particulars, those parameters which depend
on the draft of the vessel.
7.2 Case of Floating dock
A basic study on the particulars of the vessels which can be docked on this dock was performed
when the preliminary or concept design was made.

Structural Design and Stability of a 6,000 ton Capacity Floating Dock as per DNV-GL Rules
“EMSHIP” Erasmus Mundus Master Course, period of study Sept 2016 – Feb 2018 91
From the types of vessel data compared, the mean values of the ships’ main particulars obtained
is listed in the table 32.
Table 32: Mean values from typical ship data
LOA LBP B T D Lightweight
(m) (m) (m) (m) (m) (t)
92.6 83.2 19.5 6.4 8.02 4798
The dock capacity is fixed. So the design has to have enough dimensions to contain the ships
which comes with in the range. So a study on the required dimensions was needed to fix the
main dimensions of the dock. The height and maximum draft of the dock depends on the draft
requirements of the vessels to be docked. The maximum draft of the ship data compared was
7.7 m and the average draft was 6.4 m. So to meet the purpose, the dock must be designed to
have a maximum draft such that it would be able to dock the vessel with the maximum draft.
The stability of a floating dock has to satisfy the stability criteria with its own weight and also
with the combined weights of the dock and the ship. Each case by case basis, the stability of
the vessel being docked has to be carefully considered for safe docking operations.
There are different stability cases on a minimum to be considered.
1. Fully submerged condition of the dock.
2. Submerged until the level of docking blocks.
3. Final working condition with the typical ships on the blocks.
The guidelines of DNVGL-RU-FD has been followed for the stability calculations. Weight of
the dock and the VCG are two important parameters needed for the stability calculation. As per
table 7, the calculated weights is 2695 tons and VCG is 5.13 m. So a rounded of value of 2700
tons weight and 6 m VCG are considered in the analysis. Higher VCG considered makes the
design conservative. In all cases fully loaded fresh water and fuel oil tanks are considered. Due
to the presence of partially filled tanks, the free surface correction has to be applied to the
calculations. Wind heeling moments is included based on the formula given as,
0.5Σ (45)

Kodathoor Gangadharan Midhun
92 Master Thesis Developed at West Pomeranian University of Technology, Szczecin
Table 33: Wind force and parameters
F Wind force in N 702436.8
Z height above the waterline of the centre of gravity of the exposed member in m 8.585
CH Height coefficient 0.97
ρ Air mass density in kg/m3 1.204
V Wind velocity in m/s 29.95
A Lateral exposed area (dock+ship) in m2 1335 A wind velocity of 29 m/s can be considered as a conservative case based on DNVGL-RU-
SHIP Part 3 Chapter 15 Section 4.2.1. But since a higher wind velocity was considered in the
preliminary analysis as per the data provided by Nelton, which is even more conservative, the
same is followed.
From the above data, the wind pressure to be applied on the exposed side is calculated as,
526
7.3 Stability Analysis Tool
The tool used for stability analysis is MAXSURF STABILITY MODULE. The modelling of
the surfaces is done in RHINO 3D and imported in to MAXSURF MODELLER further to the
MAXSURF STABILITY MODULE for further analysis.
MAXURF is a powerful tool for the naval architectural calculations of all types of marine
vessels. It has got different modules for hull modelling, stability, motions and resistance
prediction, structural modelling, structural analysis and export to vessel detailing.
MAXSURF Advanced can be used for both intact and damage stability checks and further
more. A plane water surface or user defined wave form can be considered for the calculations.
It has got a library of comprehensive stability criteria as defined by statutory and regulatory
bodies. There is this advantage for the users to define stability criteria as well.

Structural Design and Stability of a 6,000 ton Capacity Floating Dock as per DNV-GL Rules
“EMSHIP” Erasmus Mundus Master Course, period of study Sept 2016 – Feb 2018 93
7.4 Coordinate System
The origin of the coordinate system is placed at baseline intersecting the centerline and the mid-
section. X-coordinates in the fwd. direction from the mid-section of the dock is positive and the
x-coordinates to the aft direction is negative. Similarly, the y-coordinates towards the starboard
side from the centerline is positive and the y-coordinates towards the port side is negative. The
z-coordinates measured from the base line to the up is taken as positive.
Figure 46: Coordinate system for stability analsysis
7.5 Hydrostatic Parameters
The basic hydrostatic parameters calculated from MAXSURF for the dock in maximum
allowable working draft condition, which is 4.2 m, is given in the table 34:
Table 34: Hydrostatic particulars for maximum working draft
Displacement t 11348
Heel deg 0
Draft at FP m 4.2
Draft at AP m 4.2
Draft at LCF m 4.2
Trim (+ve by stern) m 0
WL Length m 92.4
Beam max extents on WL m 30
Wetted Area m^2 3604.004
Waterpl. Area m^2 2707.4
Prismatic coeff. (Cp) 0.956
Block coeff. (Cb) 0.951
Max Sect. area coeff. (Cm) 0.994
Waterpl. area coeff. (Cwp) 0.977
LCB from zero pt. (+ve fwd) m 0

Kodathoor Gangadharan Midhun
94 Master Thesis Developed at West Pomeranian University of Technology, Szczecin
LCF from zero pt. (+ve fwd) m 0
KB m 2.149
KG m 4.9
BMt m 18.341
BML m 175.621
GMt m 15.589
GML m 172.869
KMt m 20.489
KML m 177.769
Immersion (TPc) tonne/cm 27.751
MTc tonne.m 212.311
RM at 1deg = GMt.Disp.sin(1) tonne.m 3087.46
These particulars influence the stability of the dock in this loading case. GMt or transverse
metacentric height determines the initial stability condition of the dock. As the height of the
centre of gravity increases, the stability decreases. The hydrostatic particulars refers to all those
parameters which are dependent on the draft. So these values vary for different draft conditions.
7.6 Tank Capacities
From the concept tank plan available, few modifications have been made to include the tank
spaces for fuel oil, fresh water and sewage. Below figures give an idea about the various tank
spaces and their arrangements and based on which the stability and loading is dependent. The
drawings provided by Nelton is modified to include the additional tank spaces and is shown in
figures 47 to 49.
Figure 47: Tank plan- pontoon
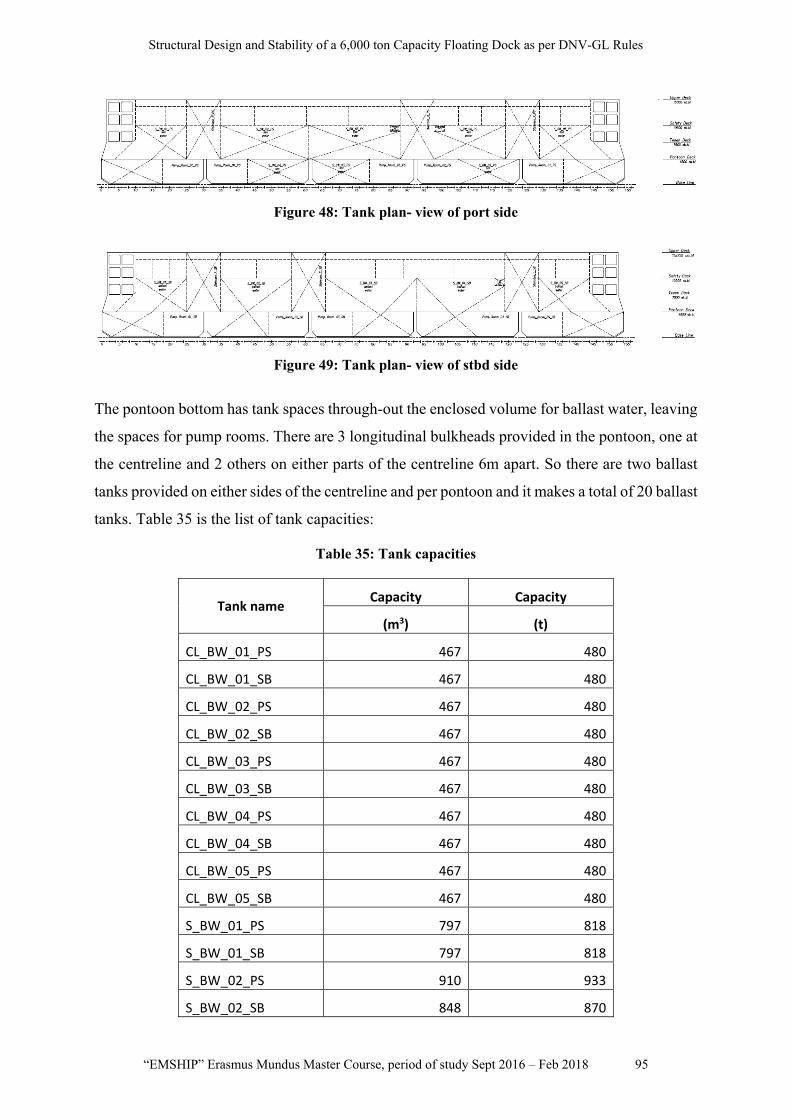
Structural Design and Stability of a 6,000 ton Capacity Floating Dock as per DNV-GL Rules
“EMSHIP” Erasmus Mundus Master Course, period of study Sept 2016 – Feb 2018 95
Figure 48: Tank plan- view of port side
Figure 49: Tank plan- view of stbd side
The pontoon bottom has tank spaces through-out the enclosed volume for ballast water, leaving
the spaces for pump rooms. There are 3 longitudinal bulkheads provided in the pontoon, one at
the centreline and 2 others on either parts of the centreline 6m apart. So there are two ballast
tanks provided on either sides of the centreline and per pontoon and it makes a total of 20 ballast
tanks. Table 35 is the list of tank capacities:
Table 35: Tank capacities
Tank name Capacity Capacity
(m3) (t)
CL_BW_01_PS 467 480
CL_BW_01_SB 467 480
CL_BW_02_PS 467 480
CL_BW_02_SB 467 480
CL_BW_03_PS 467 480
CL_BW_03_SB 467 480
CL_BW_04_PS 467 480
CL_BW_04_SB 467 480
CL_BW_05_PS 467 480
CL_BW_05_SB 467 480
S_BW_01_PS 797 818
S_BW_01_SB 797 818
S_BW_02_PS 910 933
S_BW_02_SB 848 870

Kodathoor Gangadharan Midhun
96 Master Thesis Developed at West Pomeranian University of Technology, Szczecin
S_BW_03_PS 915 939
S_BW_03_SB 921 945
S_BW_04_PS 841 863
S_BW_04_SB 901 924
S_BW_05_PS 797 818
S_BW_05_SB 797 818
Fuel oil 8 7
Fresh water 6 6
Sewage 6 ‐
Total capacities 13219 13548
7.7 Stability Analysis
7.7.1 Case I: Lightship Condition
The light draft condition of the vessel is based on the displacement obtained due to the self-
weight, rest water in the ballast tanks and the full load of consumables. The rest water assumed
is of 0.6 m height. All the ballast tanks are uniformly filled to 12% by volume each to match the
0.6 m rest water height. The stability analysis is run and the various results obtained is
summarized below.
Table 36: Summary of results (Lightship condition)
m
t
Reference Criteria Required Actual Result
General:
DNVGL-RU-FD Sec 1.3.11 Initial GMt after free surface correction >1 m 43.9 m pass
IMO MSC 267(85) Sec 2.2.2 Angle of max. GZ >25 deg 17.3 deg fail
DNVGL-RU-FD Sec 1.2.1 Minimum freeboard to the pontoon deck >0.3 m 2.9 m pass
DNVGL-RU-FD Sec 1.1.1 Minimum freeboard to the upper deck >1 m 13.4 m pass
Wind criteria:
IMO MSC 267(85) Sec 2.3.1.2 Angle of steady heel ≤16 deg 0.2 deg pass
IMO MSC 267(85) Sec 2.3.1.2 Angle of steady heel/ deck edge immersion angle ≤80% 1.89% pass
Draft amidships
Displacement
1.59
4039

Structural Design and Stability of a 6,000 ton Capacity Floating Dock as per DNV-GL Rules
“EMSHIP” Erasmus Mundus Master Course, period of study Sept 2016 – Feb 2018 97
Figure 50: Intact stability curves (Lightship condition)
Figure 51: Profile view showing the Lightship waterlevel
From the results of intact stability criteria at lightship condition, the dock fails the mandatory
criteria for the angle of heel for maximum GZ. In specific cases where it is not possible to meet
this requirement, other criteria could be provided by the approving authority. Otherwise in case
of this design, the compensating ballast water can be used or the rest water level in the tanks
can be increased to achieve the required buoyancy. Due to increase in buoyancy of the vessel
with the weight and centre of gravity unchanged, the metacentric height reduces and then higher
GZ can be achieved at higher angles only.
A basic check proves that when the ballast tanks are filled to 21% by volume (around 1m height)
by sea water, a maximum GZ of 7.4 m can be achieved at 25.5 degree angle of heel.
7.7.2 Case II: Fully Submerged Condition
Full submersion of a dock in docking operations is achieved by filling the ballast tanks to the
required level. If there is no reserve ballast capacity the ballast tanks have to be filled to the
-8
-4
0
4
8
12
-10 -5 0 5 10 15 20 25 30 35 40
Max GZ = 7.511 m at 17.3 deg.
1.3.11: Initial GMt GM at 0.0 deg = 43.987 m
1.3.5: Severe wind and rolling Wind Heeling (steady)1.3.5: Severe wind and rolling Wind Heeling (gust)
GZ = Heel to Starboard = -0.002 m 0.000 deg. Area (from zero heel) = 0.004523 m. deg. Heel to Starboard deg.
GZ
m
StabilityGZ1.3.11: Initial GMt GM at 0.0 deg = 43.987 m1.3.5: Severe wind and rolling Wind Heeling (steady)1.3.5: Severe wind and rolling Wind Heeling (gust)Max GZ = 7.511 m at 17.3 deg.
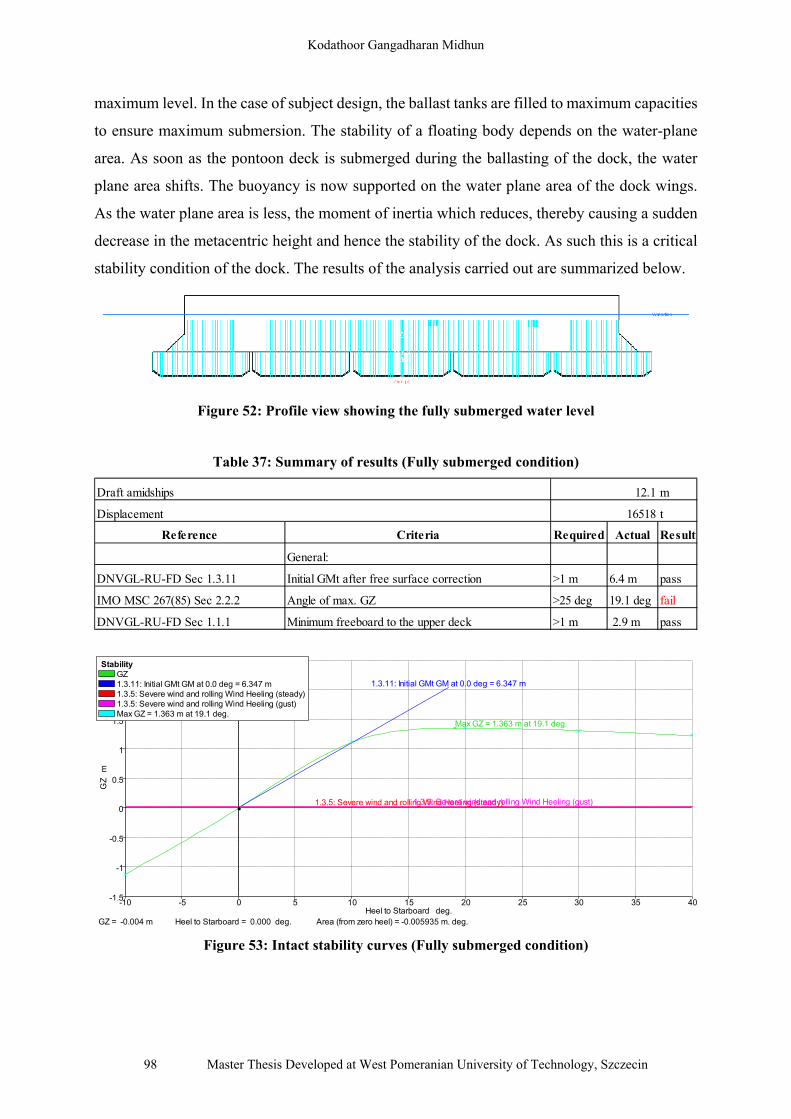
Kodathoor Gangadharan Midhun
98 Master Thesis Developed at West Pomeranian University of Technology, Szczecin
maximum level. In the case of subject design, the ballast tanks are filled to maximum capacities
to ensure maximum submersion. The stability of a floating body depends on the water-plane
area. As soon as the pontoon deck is submerged during the ballasting of the dock, the water
plane area shifts. The buoyancy is now supported on the water plane area of the dock wings.
As the water plane area is less, the moment of inertia which reduces, thereby causing a sudden
decrease in the metacentric height and hence the stability of the dock. As such this is a critical
stability condition of the dock. The results of the analysis carried out are summarized below.
Figure 52: Profile view showing the fully submerged water level
Table 37: Summary of results (Fully submerged condition)
Figure 53: Intact stability curves (Fully submerged condition)
m
t
Reference Criteria Required Actual Result
General:
DNVGL-RU-FD Sec 1.3.11 Initial GMt after free surface correction >1 m 6.4 m pass
IMO MSC 267(85) Sec 2.2.2 Angle of max. GZ >25 deg 19.1 deg fail
DNVGL-RU-FD Sec 1.1.1 Minimum freeboard to the upper deck >1 m 2.9 m pass
Draft amidships 12.1
Displacement 16518
-1.5
-1
-0.5
0
0.5
1
1.5
2
2.5
-10 -5 0 5 10 15 20 25 30 35 40
Max GZ = 1.363 m at 19.1 deg.
1.3.11: Initial GMt GM at 0.0 deg = 6.347 m
1.3.5: Severe wind and rolling Wind Heeling (steady)1.3.5: Severe wind and rolling Wind Heeling (gust)
GZ = Heel to Starboard = -0.004 m 0.000 deg. Area (from zero heel) = -0.005935 m. deg. Heel to Starboard deg.
GZ
m
StabilityGZ1.3.11: Initial GMt GM at 0.0 deg = 6.347 m1.3.5: Severe wind and rolling Wind Heeling (steady)1.3.5: Severe wind and rolling Wind Heeling (gust)Max GZ = 1.363 m at 19.1 deg.
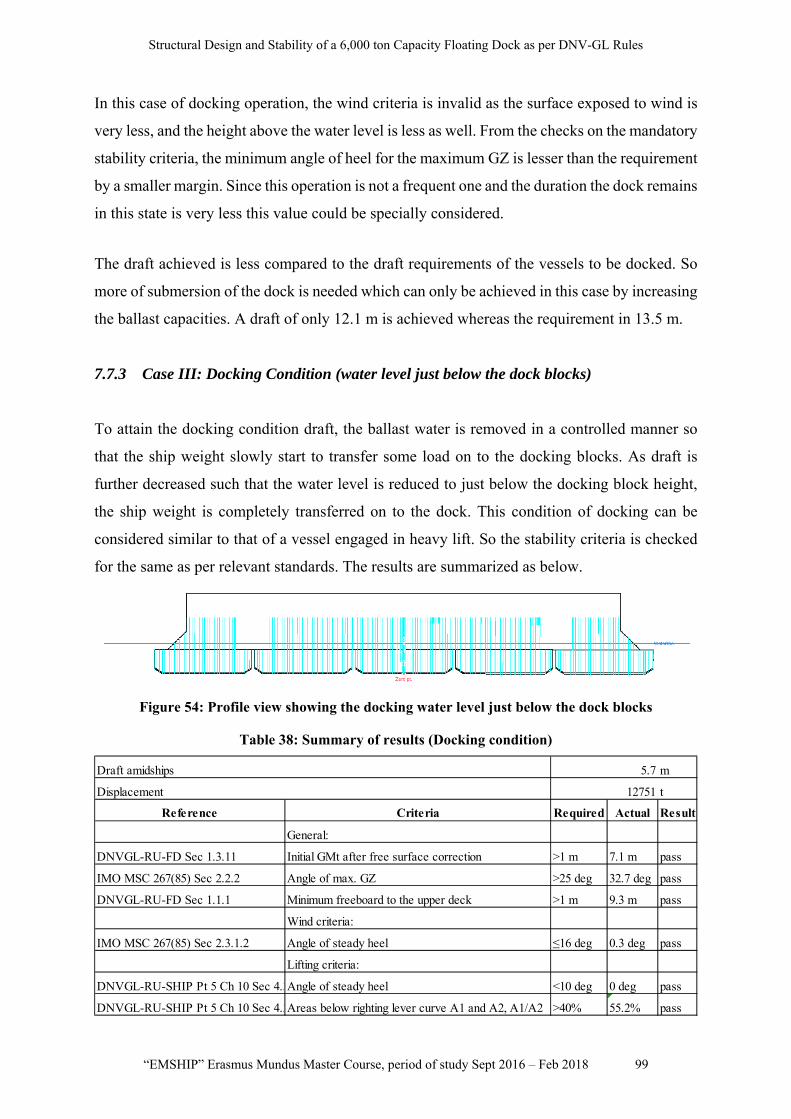
Structural Design and Stability of a 6,000 ton Capacity Floating Dock as per DNV-GL Rules
“EMSHIP” Erasmus Mundus Master Course, period of study Sept 2016 – Feb 2018 99
In this case of docking operation, the wind criteria is invalid as the surface exposed to wind is
very less, and the height above the water level is less as well. From the checks on the mandatory
stability criteria, the minimum angle of heel for the maximum GZ is lesser than the requirement
by a smaller margin. Since this operation is not a frequent one and the duration the dock remains
in this state is very less this value could be specially considered.
The draft achieved is less compared to the draft requirements of the vessels to be docked. So
more of submersion of the dock is needed which can only be achieved in this case by increasing
the ballast capacities. A draft of only 12.1 m is achieved whereas the requirement in 13.5 m.
7.7.3 Case III: Docking Condition (water level just below the dock blocks)
To attain the docking condition draft, the ballast water is removed in a controlled manner so
that the ship weight slowly start to transfer some load on to the docking blocks. As draft is
further decreased such that the water level is reduced to just below the docking block height,
the ship weight is completely transferred on to the dock. This condition of docking can be
considered similar to that of a vessel engaged in heavy lift. So the stability criteria is checked
for the same as per relevant standards. The results are summarized as below.
Figure 54: Profile view showing the docking water level just below the dock blocks
Table 38: Summary of results (Docking condition)
m
t
Reference Criteria Required Actual Result
General:
DNVGL-RU-FD Sec 1.3.11 Initial GMt after free surface correction >1 m 7.1 m pass
IMO MSC 267(85) Sec 2.2.2 Angle of max. GZ >25 deg 32.7 deg pass
DNVGL-RU-FD Sec 1.1.1 Minimum freeboard to the upper deck >1 m 9.3 m pass
Wind criteria:
IMO MSC 267(85) Sec 2.3.1.2 Angle of steady heel ≤16 deg 0.3 deg pass
Lifting criteria:
DNVGL-RU-SHIP Pt 5 Ch 10 Sec 4.3Angle of steady heel <10 deg 0 deg pass
DNVGL-RU-SHIP Pt 5 Ch 10 Sec 4.3Areas below righting lever curve A1 and A2, A1/A2 >40% 55.2% pass
Draft amidships 5.7
Displacement 12751

Kodathoor Gangadharan Midhun
100 Master Thesis Developed at West Pomeranian University of Technology, Szczecin
Figure 55: Intact stability curves (Docking condition)
At docking condition, all the mandatory and additional stability criteria are satisfied and the
dock is deemed safe for lifting a maximum capacity ship of 6,000 tons with a conservative VCG
of 8 m measured from the top of the docking blocks.
7.7.4 Case IV: Working Condition
After safe docking is ensured, further de-ballasting can reduce the draft to a value less than the
maximum allowable draft as per the freeboard requirement. In this analysis, the minimum draft
is considered which includes the influence of rest water in the tank bottom and the docked ship
weight. The results of the analysis are summarized below.
Table 39: Summary of results (Working Condition)
-2
-1
0
1
2
3
4
5
-10 -5 0 5 10 15 20 25 30 35 40
Max GZ = 4.726 m at 32.7 deg.
Vessels engaged in lifting
1.3.11: Initial GMt GM at 0.0 deg = 7.119 m
1.3.5: Severe wind and rolling Wind Heeling (steady)1.3.5: Severe wind and rolling Wind Heeling (gust)
GZ = Heel to Starboard = -0.000 m 0.000 deg. Area (from zero heel) = -0.0004253 m. deg. Heel to Starboard deg.
GZ
m
StabilityGZVessels engaged in lifting1.3.11: Initial GMt GM at 0.0 deg = 7.119 m1.3.5: Severe wind and rolling Wind Heeling (steady)1.3.5: Severe wind and rolling Wind Heeling (gust)Max GZ = 4.726 m at 32.7 deg.
m
t
Reference Criteria Required Actual Result
General:
DNVGL-RU-FD Sec 1.3.11 Initial GMt after free surface correction >1 m 11.4 m pass
IMO MSC 267(85) Sec 2.2.2 Angle of max. GZ >25 deg 28.2 deg pass
DNVGL-RU-FD Sec 1.2.1 Minimum freeboard to the pontoon deck >0.3 m 0.7 m pass
DNVGL-RU-FD Sec 1.1.1 Minimum freeboard to the upper deck >1 m 11.3 m pass
Wind criteria:
IMO MSC 267(85) Sec 2.3.1.2 Angle of steady heel ≤16 deg 0.4 deg pass
IMO MSC 267(85) Sec 2.3.1.2 Angle of steady heel/ deck edge immersion angle ≤80% 16% pass
Draft amidships 3.7
Displacement 10039

Structural Design and Stability of a 6,000 ton Capacity Floating Dock as per DNV-GL Rules
“EMSHIP” Erasmus Mundus Master Course, period of study Sept 2016 – Feb 2018 101
Figure 56: Profile view showing the working condition draft level
Figure 57: Intact stability curves (Working condition)
Above results prove that the dock is stable in working condition. The GMT has reduced from
the same draft condition earlier during the submersion operation, as there is the combined
weight and VCG of the ship and dock acting together because the ship is fully resting on the
dock. VCG in this case is raised by much.
7.7.5 Case IV: Undocking Condition
During undocking process, the ballast weights are increased so as to get sufficient immersion
of the dock. At the start of undocking, the water level will be just below the docking blocks.
The complete weight is supported on the dock and the water plane area is reduced explains the
criticality in the undocking process. A stability analysis of the same is performed and the results
are as below.

Kodathoor Gangadharan Midhun
102 Master Thesis Developed at West Pomeranian University of Technology, Szczecin
Figure 58: Profile view showing the water level at undocking condition with water level just below docking blocks
Table 40: Summary of results (Undocking condition)
Figure 59: Intact stability curves (Undocking condition)
We can see from the results that the initial GMt is just higher than the minimum required. And
compared with the various other conditions analysed, this value is much lesser. So the condition
of undocking of a ship can be considered the deciding condition of stability of the dock.
m
t
Reference Criteria Required Actual Result
General:
DNVGL-RU-FD Sec 1.3.11 Initial GMt after free surface correction >1 m 1.9 m pass
IMO MSC 267(85) Sec 2.2.2 Angle of max. GZ >25 deg 30 deg pass
DNVGL-RU-FD Sec 1.1.1 Minimum freeboard to the upper deck >1 m 9.3 m pass
Wind criteria:
IMO MSC 267(85) Sec 2.3.1.2 Angle of steady heel ≤16 deg 1.1 deg pass
Draft amidships 5.7
Displacement 12744

Structural Design and Stability of a 6,000 ton Capacity Floating Dock as per DNV-GL Rules
“EMSHIP” Erasmus Mundus Master Course, period of study Sept 2016 – Feb 2018 103
7.8 Limiting vessel VCG
For docking capacity assessment of a dock and to select the ships to be docked other than based
on their dimensional limits, an important factor which comes in is the position of VCG of the
vessel to be docked. Based on the critical stability condition, which is the undocking stage, an
analysis is done for a range of docking weights acceptable different VCGs’ of the vessel. Based
on the results obtained a graph has been plotted to easily understand the range of a combination
of the weight and VCG acceptable.
Figure 60: Limiting VCG curve
In the above plot, the maximum VCG acceptable for a range of weights from 4000 ton to 6000
ton is shown. The significance of this graph is that the category of vessels which comes below
limiting VCG curve can be safely docked. The curve slopes down linearly shows that as the
weight of the vessel increases, the acceptable VCG decreases. A careful consideration of this
data is important to decide on the actual capacity of the dock.
7.9 Summary
From the various intact stability checks carried out, the dock does not experience any serious
threats in terms of stability. The only issue prevailing is with respect to achieving the maximum
submersion to the desired level. As per the current results, the maximum submersion is less by
1.4 m. This limits the capability of the dock. This result has direct impact from the estimated

Kodathoor Gangadharan Midhun
104 Master Thesis Developed at West Pomeranian University of Technology, Szczecin
weight of the dock. If more weight on the structure is expected the submersion would increase.
With the estimation not expected to vary much, additional ballast capacity would be needed to
increase the loads for maximum submersion.
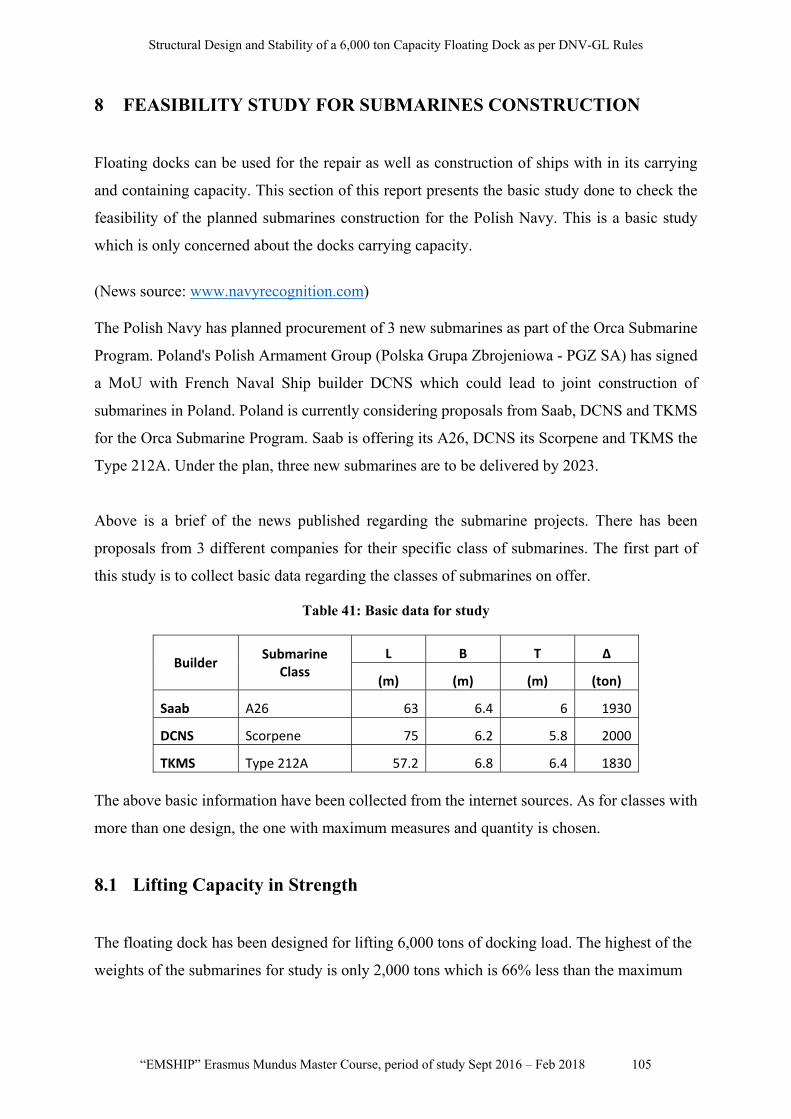
Structural Design and Stability of a 6,000 ton Capacity Floating Dock as per DNV-GL Rules
“EMSHIP” Erasmus Mundus Master Course, period of study Sept 2016 – Feb 2018 105
8 FEASIBILITY STUDY FOR SUBMARINES CONSTRUCTION
Floating docks can be used for the repair as well as construction of ships with in its carrying
and containing capacity. This section of this report presents the basic study done to check the
feasibility of the planned submarines construction for the Polish Navy. This is a basic study
which is only concerned about the docks carrying capacity.
(News source: www.navyrecognition.com) The Polish Navy has planned procurement of 3 new submarines as part of the Orca Submarine
Program. Poland's Polish Armament Group (Polska Grupa Zbrojeniowa - PGZ SA) has signed
a MoU with French Naval Ship builder DCNS which could lead to joint construction of
submarines in Poland. Poland is currently considering proposals from Saab, DCNS and TKMS
for the Orca Submarine Program. Saab is offering its A26, DCNS its Scorpene and TKMS the
Type 212A. Under the plan, three new submarines are to be delivered by 2023.
Above is a brief of the news published regarding the submarine projects. There has been
proposals from 3 different companies for their specific class of submarines. The first part of
this study is to collect basic data regarding the classes of submarines on offer.
Table 41: Basic data for study
Builder Submarine
Class L B T Δ
(m) (m) (m) (ton)
Saab A26 63 6.4 6 1930
DCNS Scorpene 75 6.2 5.8 2000
TKMS Type 212A 57.2 6.8 6.4 1830
The above basic information have been collected from the internet sources. As for classes with
more than one design, the one with maximum measures and quantity is chosen.
8.1 Lifting Capacity in Strength
The floating dock has been designed for lifting 6,000 tons of docking load. The highest of the
weights of the submarines for study is only 2,000 tons which is 66% less than the maximum

Kodathoor Gangadharan Midhun
106 Master Thesis Developed at West Pomeranian University of Technology, Szczecin
lifting capacity. So the dock will be able to carry the maximum load of the fully constructed
submarine.
When we do check on the linear load density, assuming the docking load is uniformly
distributed along the length of the submarine, the maximum load per length is obtained for the
Type 212A which is 32 tons/m. the dock strength check was done considering 81 tons/m load
(even conservative load). So the dock is safe for operation.
8.2 Space Requirements
The space requirement refers to the clearances possible with in the docking space. The length
of the dock is 92.4 m without considering the extended platforms. The maximum length of the
submarines in consideration being 75 m, there is no issue with length constraints. Figure 61
shows the longer submarine docked.
Figure 61: Scorpene Class Submarine in dock (top view- representative model)
The maximum internal width of the dock (between the dock wings) is 23 m. The maximum
beam of the submarines in consideration being 6.8 m, there will be a clearance of 8 m on either
sides to give enough working space. A case of two submarines docked side-by-side is also
possible. Figure 62 shows the submarines with lower beams docked side-by-side.
Another important parameter in docking and undocking operations is the draft of the vessel.
Though for construction, this has no influence, launching by undocking will need sufficient
submersion of the dock to have the submarine float freely.
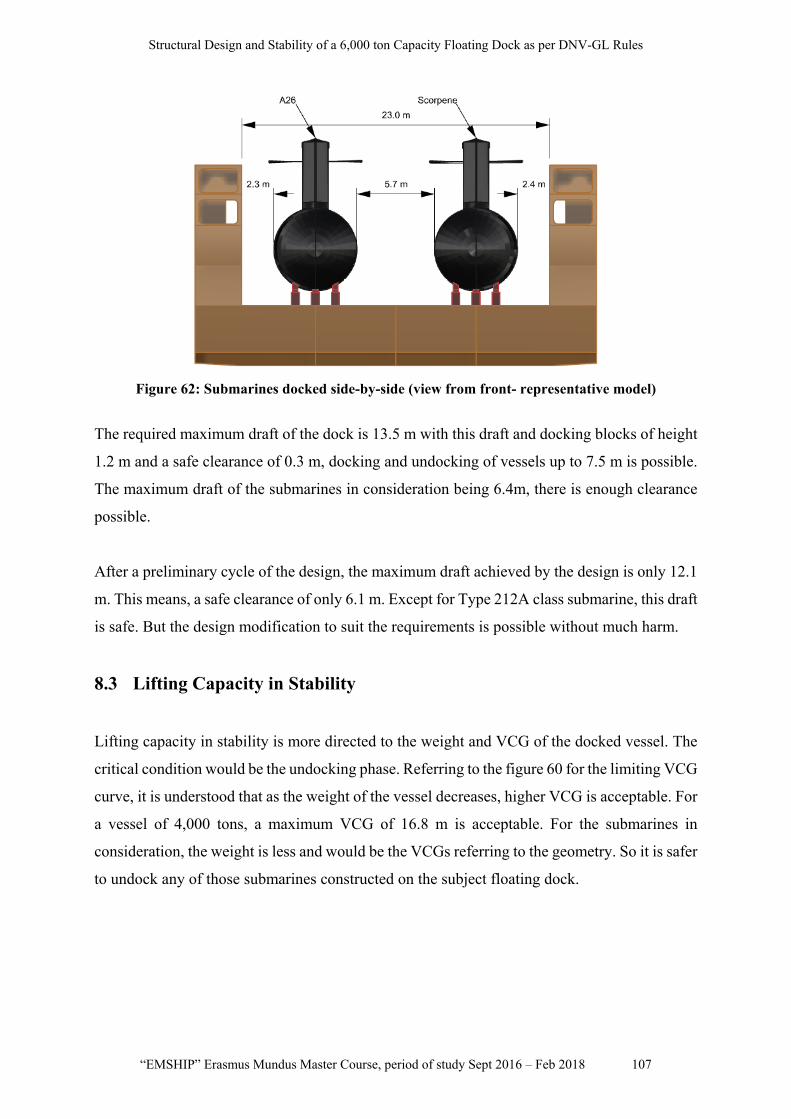
Structural Design and Stability of a 6,000 ton Capacity Floating Dock as per DNV-GL Rules
“EMSHIP” Erasmus Mundus Master Course, period of study Sept 2016 – Feb 2018 107
Figure 62: Submarines docked side-by-side (view from front- representative model)
The required maximum draft of the dock is 13.5 m with this draft and docking blocks of height
1.2 m and a safe clearance of 0.3 m, docking and undocking of vessels up to 7.5 m is possible.
The maximum draft of the submarines in consideration being 6.4m, there is enough clearance
possible.
After a preliminary cycle of the design, the maximum draft achieved by the design is only 12.1
m. This means, a safe clearance of only 6.1 m. Except for Type 212A class submarine, this draft
is safe. But the design modification to suit the requirements is possible without much harm.
8.3 Lifting Capacity in Stability
Lifting capacity in stability is more directed to the weight and VCG of the docked vessel. The
critical condition would be the undocking phase. Referring to the figure 60 for the limiting VCG
curve, it is understood that as the weight of the vessel decreases, higher VCG is acceptable. For
a vessel of 4,000 tons, a maximum VCG of 16.8 m is acceptable. For the submarines in
consideration, the weight is less and would be the VCGs referring to the geometry. So it is safer
to undock any of those submarines constructed on the subject floating dock.

Kodathoor Gangadharan Midhun
108 Master Thesis Developed at West Pomeranian University of Technology, Szczecin
9 CONCLUSION
The complete work intended to be part of this thesis has been carried out and are open for
discussions and further improvements. The work was developed based on the concept General
Arrangement provided by the internship company, Nelton. The stage by stage conclusions from
the work are briefed below:
The scantlings were chosen based on the local strength requirements as per DNVGL-RU-FD.
The material of construction as per the requirement was steel, but there was flexibility in
choosing the grade of steel to be used. As and where possible, normal grade steel is used for
the structural members. High grade steel was considered initially for only the pontoon girders,
frames and pillars. This was because the use of normal grade steel results in the requirement
for sections which have a section modulus higher by 39% and results in higher sections for
these members. From the economical point of view, the cost of higher grade of steel is little
higher than the normal grade steel. But otherwise we can save on the material weight. So the
decision is dependent on whether there is any weight limitation. In this scenario there is no
study done on the cost and weight comparisons, but the importance is given to the flexibility
that if normal grade steel is considered in the design, in case of non-availability of the same
grade, a higher grade can be chosen without the need for a re-analysis.
The arrangement of members, like the span and spacing are also to be decided by the designer.
In the case of this design, arrangement was decided as such to make use of the standard sections
or built-up sections which are easier to fabricate as possible. While choosing a section or
thickness of plate, the availability in the market has to be known by the designer. This design
has chosen all standard sections available in market.
Another important aspect is the ease for production, like the handling, cutting and welding
easiness and also accessibility for welding and inspection in assemblies.
Foreseeing all the above mentioned challenges makes avoid any changes or rework at later
stages of the design. To the best possible extend everything is taken in to consideration in this
design.

Structural Design and Stability of a 6,000 ton Capacity Floating Dock as per DNV-GL Rules
“EMSHIP” Erasmus Mundus Master Course, period of study Sept 2016 – Feb 2018 109
A slenderness check was also carried out as per DNVGL-RU-SHIP Part 3 Chapter 8, to ensure
the plates and sections have enough thickness to resist local buckling, or else local stiffening is
provided.
After the scantlings design, more or less it was possible to get the exact steel weight with less
contingency. But for the other weights including architectural, electrical, HVAC, piping,
outfitting etc. for which design is not done yet the only possibility of getting weights is to refer
to any similar designs and base on a rule of thumb to estimate the approximate weights expected
in our design. In this design, the weights other than steel weight was calculated based on the
items in the GA. The maximum of weights of items available or shown in the GA are captured
either referring to the data sheets of similar items or a rule of thumb based on experience is
followed. There can be variations expected in the final weight which could be an increase of
weight only. That contingency is considered in the design for any expected increases in weight
other than calculated. As a step to move further, these weights and CoG were calculated with
enough contingencies, which are assumed to be ok.
A finite element model was prepared and analysis was done for all the loading conditions
prescribed in DNVGL-RU-FD. The steel weight is automatically generated from the model and
this weight is compared to the weight calculated to know if there is any major discrepancies.
The weight were found to be closer. Other loads calculated earlier was then applied to the model
as point, line or element loads. It was noticed that enough submersion as required was not
possible with full ballast loads acting and a modification to the ballast spaces is needed to carry
more ballast and hence enough submersion. Based on the analyses performed, the structure was
found to be fit for purpose with minor modifications needed in the design. The major stresses
and deflection are caused in the pontoon structure near where the docked vessel weight acts.
The structure as a whole is capable of carrying more payload if the loading is not along the
center-line.
The connection design of the dock-wings to the pontoon deck was done based on the maximum
forces at the connections obtained from FEA analysis. The bolting is arranged with a watertight
gasket in between the connecting parts to ensure watertight integrity.
Intact stability checks were performed based on the requirements of relevant codes and
standards. The critical condition of stability is found to be the undocking stage with water level
Kodathoor Gangadharan Midhun
110 Master Thesis Developed at West Pomeranian University of Technology, Szczecin
just below the docking blocks level. With regard to the maximum submersion, it was found that
additional ballast capacity has to be provided to ensure maximum required submersion.
Approximately 800 m3 more of ballast is needed to attain the maximum required submersion.
The dock design was checked for its feasibility in constructing the submarines for the Polish
Navy’s Orca Submarine Program and found to be feasible except for the draft clearance for
Type 212A class submarine being less by a small margin. This correction of draft or submersion
of the dock is intended in the considered design. So it can be assumed that the subject dock is
able to perform the construction and launching of the submarines needed to be constructed.
This being a concept stage of design, modifications or design changes are expected to happen
and one more cycle of the process could give much refined results.

Structural Design and Stability of a 6,000 ton Capacity Floating Dock as per DNV-GL Rules
“EMSHIP” Erasmus Mundus Master Course, period of study Sept 2016 – Feb 2018 111
10 REFERENCES
[1] Volney E. Cook 1957 “General Discussion of Floating Drydocks’’ presented at the
Annual Meeting, New York, N. Y, of THE SOCIETY OF NAVAL ARCHITECTS AND
MARINE ENGINEERS.
[2] Arsham Amirikian 1957 “Analysis and Design of Floating Drydocks’’ presented at the
Annual Meeting, New York, N. Y, of THE SOCIETY OF NAVAL ARCHITECTS AND
MARINE ENGINEERS.
[3] Helmut J. Warnke 1973 “The Construction and Testing of a 33,000 Ton (M) Lift Floating
Dry Dock” presented at the meeting of the South‐east Section of THE SOCIETY OF NAVAL
ARCHITECTS AND MARINE ENGINEERS.
[4] Paul Stuart Crandall 1974 “Large Floating Dry Docks for Large Ships” presented at the
meeting of the New England Section of THE SOCIETY OF NAVAL ARCHITECTS AND
MARINE ENGINEERS.
[5] B. Rapo 1981 “Dry Docking of Loaded or Partially Loaded Ships” presented at the Pan‐
American Institute of Naval Engineering, International Congress.
[6] Brandon M. Taravella 2003 “Accuracy Assessment of Methods for Predicting Dry Dock
Block Reactions” published by MARINE TECHNOLOGY originally presented at the student
congress of THE SOCIETY OF NAVAL ARCHITECTS AND MARINE ENGINEERS
Annual Meeting in San Francisco, California.
[7] Tyler Morra 2011 “The Evolutionary Development of Floating Dry Docks” is a Master
Thesis presented to The Faculty of the Department of the History Program in Maritime
Studies, East Carolina University.
[8] Heger Drydock Inc. 2015 “Floating Dry Dock Vessel Transfer Concepts” is a document
issued and available from the website of Heger Drydock Inc.

Kodathoor Gangadharan Midhun
112 Master Thesis Developed at West Pomeranian University of Technology, Szczecin
[9] Valery V. Korotaev, Anton V. Pantiushin, Mariya G. Serikova, Andrei G. Anisimov 2016
“Deflection Measuring System for Floating Dry Docks” is a research paper published online
by Elsevier Ltd.
[10] Robert Heger 2014 “Large Floating Dry Docks in the United States” presented at DM
consulting dry dock conference 2014.
[11] Robert Heger 2008 “Calculating Block Load by the Moment Area Method” presented at
the Dry Dock Conference 2008.
[12] Robert Heger 2003 “Floating Dry Dock Accidents Involving Transverse Bending Failure
of the Pontoon”.
[13] Heger Drydock Inc. 2005 “Dockmaster Training Manual” is a document issued and
available from the website of Heger Drydock Inc.
[14] Geoffrey L. Kulak, John W. Fisher, John H. A. Struik 1987 “Guide to Design Criteria
for Bolted and Riveted Joints”, Second Edition
[15] H. Schneekluth, V Bertram 1998 “Ship Design for Efficiency and Economy”, Second
Edition
[16] DNVGL-RU-FD 2015 “Rules for Classification of Floating Docks”
[17] DNVGL-CG-0127 2015 “Class Guidelines for Finite Element Analysis”
[18] DNVGL-CG-0128 2015 “Class Guidelines for Buckling”
[19] DNVGL-RU-SHIP 2017 “Rules for Classification of Ships”
[20] ANSI/ AISC 360-16 2016 “Specification for Structural Steel Buildings”
[21] IMO MSC 267 (85) 2008“Adoption of the International Code on Intact Stability”

Structural Design and Stability of a 6,000 ton Capacity Floating Dock as per DNV-GL Rules
“EMSHIP” Erasmus Mundus Master Course, period of study Sept 2016 – Feb 2018 113
[22] IMO “Maritime Labour Convention 2006”
[23] ROCK SIDE EXPORT LIMITED “PROPERTIES OF GRADE 8.8 BOLT AND NUT
(ISO)” Available from:
http://rocksideltd.co.uk/PDFS/23-RADE%208.8%20BOLT%20&%20NUT%20(ISO).pdf
[24] DOORMET 2012 “Ship interior doors class B0/B15” Available from:
http://www.doormet.com.pl/images/B15.pdf
[25] PAROC 2015 “Marine and Offshore Products and Solutions” Available from:
http://www.paroc.com/tools-and-documents/brochures
[26] Marine and Offshore Supplies Inc. “Wall Panels Partitions and Linings” Available from:
http://www.marineoffshore.net/blast-and-fire-rated-doors/4563535953
[27] WARTSILA 2017“Solutions for Marine and Oil and Gas Markets” Available from:
https://cdn.wartsila.com/docs/default-source/marine-documents/segment/brochure-marine-
solutions-2017.pdf?sfvrsn=658adc45_32
[28] LBFoster Rail Products “Crane Rail Systems” Available from: http://www.lbfoster-
railproducts.com/rail_pdf_profiles/LBF_Rail-CraneRailSystems.pdf

Kodathoor Gangadharan Midhun
114 Master Thesis Developed at West Pomeranian University of Technology, Szczecin
Structural Design and Stability of a 6,000 ton Capacity Floating Dock as per DNV-GL Rules
“EMSHIP” Erasmus Mundus Master Course, period of study Sept 2016 – Feb 2018 115
ACKNOWLEDGEMENT
This thesis was developed in the frame of the European Master Course in “Integrated Advanced
Ship Design” named “EMSHIP” for “European Education in Advanced Ship Design”, Ref.:
159652-1-2009-1-BE-ERA MUNDUS-EMMC.
I am deeply indebted to Dr. Zbigniew Sekulski, my supervisor and professor for his valuable
guidance and assistance for the successful completion of my Master Thesis. I extend my sincere
gratitude to Mr. Szymon Chwalisz, Engineer, Quality Control and Calculations department,
Nelton Design Office, Sczcecin and every other member of Nelton for their continuous support
and help extended during the period of internship.
I take this opportunity to thank all the professors and my friends for all the help and guidance
and special thanks to my friends Mr. Kailas Cheriyan and Mr. Adarsh E K for imparting
necessary help and guidance at the most needed times.
I must express my very profound gratitude to my Parents for their love and invaluable support
throughout. Above all, I do strongly believe that God Almighty’s blessings are the prime
motivation for the successful completion of my project.
Kodathoor Gangadharan Midhun

Kodathoor Gangadharan Midhun
116 Master Thesis Developed at West Pomeranian University of Technology, Szczecin

Structural Design and Stability of a 6,000 ton Capacity Floating Dock as per DNV-GL Rules
“EMSHIP” Erasmus Mundus Master Course, period of study Sept 2016 – Feb 2018 117
APPENDIX A
CONCEPT GENERAL ARRANGEMENT DRAWING OF THE DOCK
(Provided by NELTON/ KABE)
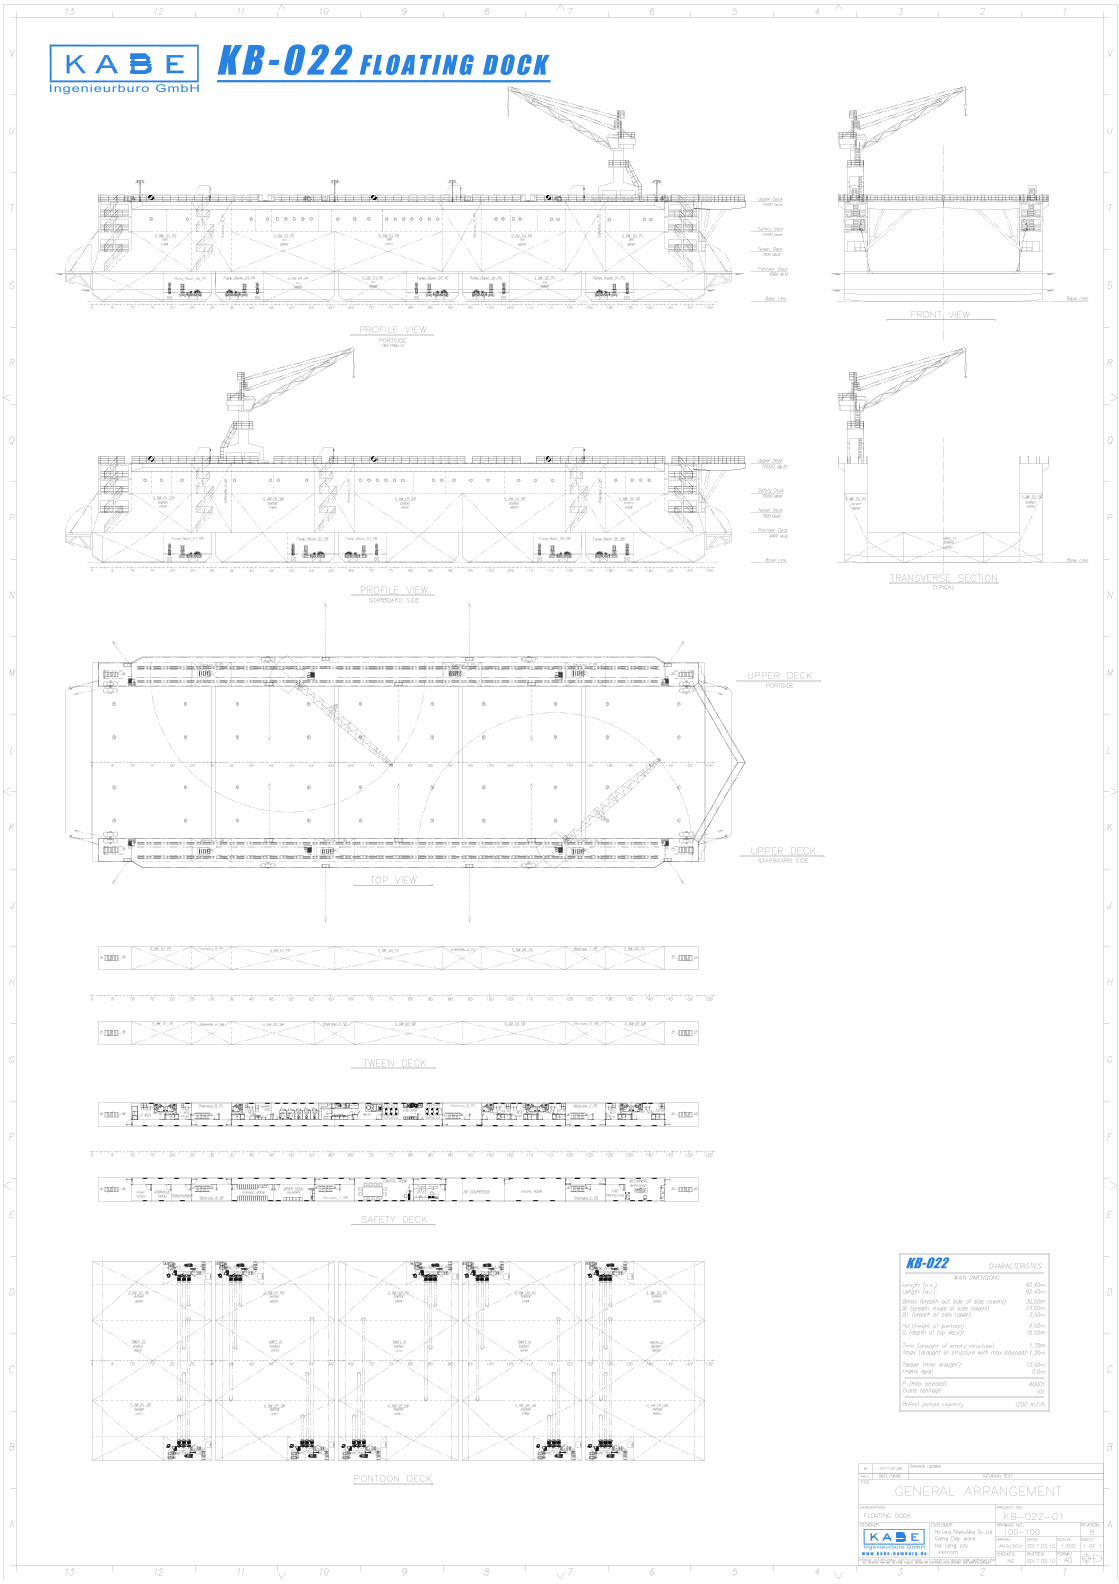
Structural Design and Stability of a 6,000 ton Capacity Floating Dock as per DNV-GL Rules
“EMSHIP” Erasmus Mundus Master Course, period of study Sept 2016 – Feb 2018 119
APPENDIX B
WEIGHTS AND CoG CALCULATION
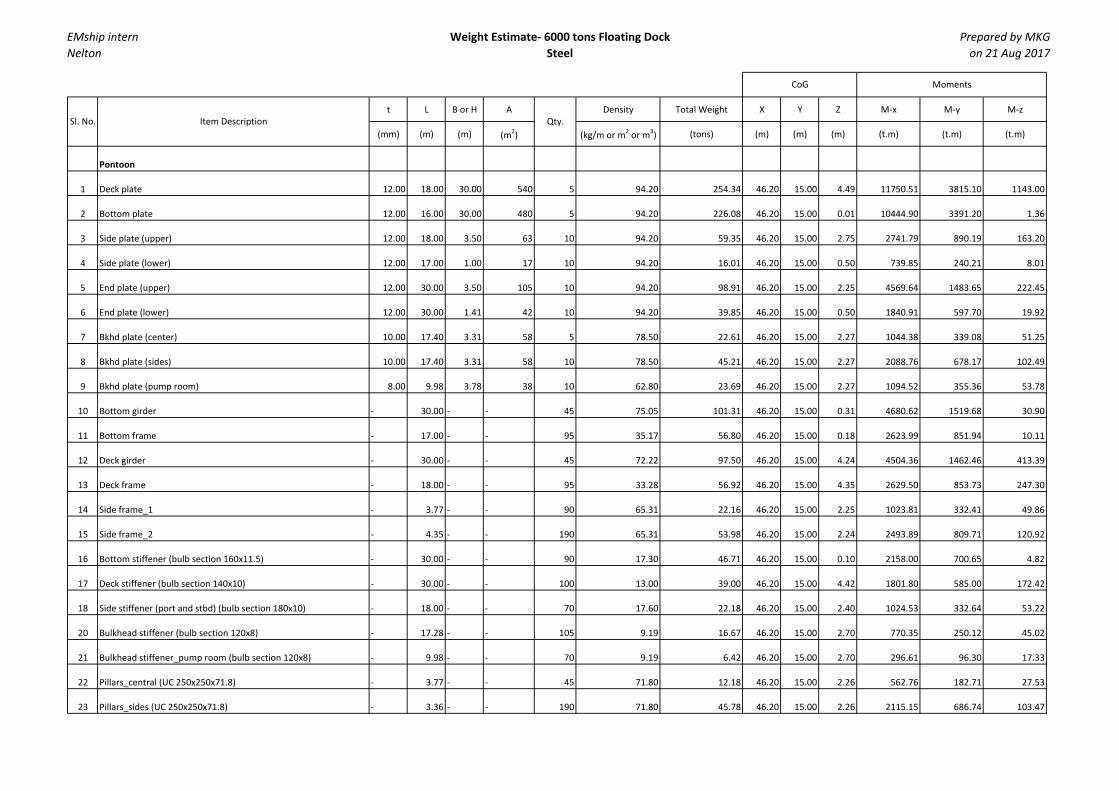
EMship internNelton
Weight Estimate‐ 6000 tons Floating Dock
Steel
Prepared by MKG on 21 Aug 2017
t L B or H A Density Total Weight X Y Z M‐x M‐y M‐z
(mm) (m) (m) (m2) (kg/m or m2 or m3) (tons) (m) (m) (m) (t.m) (t.m) (t.m)
Pontoon
1 Deck plate 12.00 18.00 30.00 540 5 94.20 254.34 46.20 15.00 4.49 11750.51 3815.10 1143.00
2 Bottom plate 12.00 16.00 30.00 480 5 94.20 226.08 46.20 15.00 0.01 10444.90 3391.20 1.36
3 Side plate (upper) 12.00 18.00 3.50 63 10 94.20 59.35 46.20 15.00 2.75 2741.79 890.19 163.20
4 Side plate (lower) 12.00 17.00 1.00 17 10 94.20 16.01 46.20 15.00 0.50 739.85 240.21 8.01
5 End plate (upper) 12.00 30.00 3.50 105 10 94.20 98.91 46.20 15.00 2.25 4569.64 1483.65 222.45
6 End plate (lower) 12.00 30.00 1.41 42 10 94.20 39.85 46.20 15.00 0.50 1840.91 597.70 19.92
7 Bkhd plate (center) 10.00 17.40 3.31 58 5 78.50 22.61 46.20 15.00 2.27 1044.38 339.08 51.25
8 Bkhd plate (sides) 10.00 17.40 3.31 58 10 78.50 45.21 46.20 15.00 2.27 2088.76 678.17 102.49
9 Bkhd plate (pump room) 8.00 9.98 3.78 38 10 62.80 23.69 46.20 15.00 2.27 1094.52 355.36 53.78
10 Bottom girder ‐ 30.00 ‐ ‐ 45 75.05 101.31 46.20 15.00 0.31 4680.62 1519.68 30.90
11 Bottom frame ‐ 17.00 ‐ ‐ 95 35.17 56.80 46.20 15.00 0.18 2623.99 851.94 10.11
12 Deck girder ‐ 30.00 ‐ ‐ 45 72.22 97.50 46.20 15.00 4.24 4504.36 1462.46 413.39
13 Deck frame ‐ 18.00 ‐ ‐ 95 33.28 56.92 46.20 15.00 4.35 2629.50 853.73 247.30
14 Side frame_1 ‐ 3.77 ‐ ‐ 90 65.31 22.16 46.20 15.00 2.25 1023.81 332.41 49.86
15 Side frame_2 ‐ 4.35 ‐ ‐ 190 65.31 53.98 46.20 15.00 2.24 2493.89 809.71 120.92
16 Bottom stiffener (bulb section 160x11.5) ‐ 30.00 ‐ ‐ 90 17.30 46.71 46.20 15.00 0.10 2158.00 700.65 4.82
17 Deck stiffener (bulb section 140x10) ‐ 30.00 ‐ ‐ 100 13.00 39.00 46.20 15.00 4.42 1801.80 585.00 172.42
18 Side stiffener (port and stbd) (bulb section 180x10) ‐ 18.00 ‐ ‐ 70 17.60 22.18 46.20 15.00 2.40 1024.53 332.64 53.22
20 Bulkhead stiffener (bulb section 120x8) ‐ 17.28 ‐ ‐ 105 9.19 16.67 46.20 15.00 2.70 770.35 250.12 45.02
21 Bulkhead stiffener_pump room (bulb section 120x8) ‐ 9.98 ‐ ‐ 70 9.19 6.42 46.20 15.00 2.70 296.61 96.30 17.33
22 Pillars_central (UC 250x250x71.8) ‐ 3.77 ‐ ‐ 45 71.80 12.18 46.20 15.00 2.26 562.76 182.71 27.53
23 Pillars_sides (UC 250x250x71.8) ‐ 3.36 ‐ ‐ 190 71.80 45.78 46.20 15.00 2.26 2115.15 686.74 103.47
CoG Moments
Sl. No. Item Description Qty.

EMship internNelton
Weight Estimate‐ 6000 tons Floating Dock
Steel
Prepared by MKG on 21 Aug 2017
t L B or H A Density Total Weight X Y Z M‐x M‐y M‐z
(mm) (m) (m) (m2) (kg/m or m2 or m3) (tons) (m) (m) (m) (t.m) (t.m) (t.m)
24 Pillar brackets (UC 250x250x71.8) ‐ 1.50 ‐ ‐ 470 71.80 50.62 46.20 15.00 2.26 2338.60 759.29 114.40
Dock Wing
25 Side plate (below safety deck) 10.00 92.40 6.00 527 4 78.50 165.38 46.20 15.00 7.50 7640.44 2480.66 1240.33
26 Side plate (above safety deck) 8.00 90.60 4.50 387 4 62.80 97.29 46.20 15.00 12.75 4494.96 1459.40 1240.49
27 End plate (extreme) 8.00 3.50 10.63 27 4 62.80 6.77 46.20 15.00 8.77 312.79 101.56 59.38
28 End plate (inner) 8.00 3.50 12.00 42 4 62.80 10.55 46.20 15.00 9.37 487.43 158.26 98.86
29 Upper deck plate 8.00 3.50 90.60 8 2 62.80 1.00 46.41 15.00 15.00 46.63 15.07 15.07
30 Safety deck plate 8.00 3.50 90.60 285 2 62.80 35.80 46.50 15.00 10.55 1664.51 536.94 377.65
31 Tween deck plate 8.00 3.50 4.50 11 4 62.80 2.73 52.80 15.00 7.55 143.91 40.88 20.58
32 Interdeck plate 8.00 3.50 5.10 11 4 62.80 2.86 46.20 15.00 12.80 131.95 42.84 36.56
33 Bulkhead plate (above safety deck level) 6.00 3.20 4.35 14 12 47.10 7.87 42.80 15.00 12.75 336.73 118.01 100.31
34 Bulkhead plate (below safety deck level) 8.00 2.50 5.40 14 14 62.80 11.87 55.80 15.00 7.50 662.30 178.04 89.02
35 Bottom frame ‐ 3.50 ‐ ‐ 102 55.80 19.92 46.20 15.00 4.77 920.33 298.81 95.08
36 Upper deck frame_1 ‐ 4.30 ‐ ‐ 92 23.55 9.32 45.96 15.00 13.25 428.18 139.75 123.46
37 Upper deck frame_2 ‐ 3.50 ‐ ‐ 12 23.55 0.99 45.96 15.00 13.25 45.46 14.84 13.11
39 Upper deck frame_4 ‐ 1.70 ‐ ‐ 4 23.55 0.16 46.20 15.00 13.25 7.40 2.40 2.12
40 Upper deck frame_5 ‐ 3.60 ‐ ‐ 20 23.55 1.70 45.96 15.00 13.25 77.93 25.43 22.47
41 Safety deck frame_1 ‐ 4.30 ‐ ‐ 92 18.84 7.45 45.96 15.00 10.42 342.54 111.80 77.66
42 Safety deck frame_2 ‐ 3.50 ‐ ‐ 12 18.84 0.79 45.96 15.00 10.42 36.37 11.87 8.25
43 Safety deck frame_3 ‐ 2.60 ‐ ‐ 6 18.84 0.29 45.96 15.00 10.42 13.51 4.41 3.06
44 Safety deck frame_4 ‐ 1.70 ‐ ‐ 4 18.84 0.13 46.20 15.00 10.42 5.92 1.92 1.33
45 Safety deck frame_5 ‐ 3.60 ‐ ‐ 20 18.84 1.36 45.96 15.00 10.42 62.34 20.35 14.13
CoG Moments
Sl. No. Item Description Qty.

EMship internNelton
Weight Estimate‐ 6000 tons Floating Dock
Steel
Prepared by MKG on 21 Aug 2017
t L B or H A Density Total Weight X Y Z M‐x M‐y M‐z
(mm) (m) (m) (m2) (kg/m or m2 or m3) (tons) (m) (m) (m) (t.m) (t.m) (t.m)
46 Tween deck frame_1 ‐ 3.50 ‐ ‐ 12 30.62 1.29 46.20 15.00 7.33 59.41 19.29 9.42
47 Tween deck frame_2 ‐ 1.70 ‐ ‐ 4 30.62 0.21 46.20 15.00 7.33 9.62 3.12 1.53
48 Tween deck frame_3 ‐ 1.80 ‐ ‐ 10 30.62 0.55 91.50 15.00 7.33 50.42 8.27 4.04
49 Tween deck frame_4 3.60 ‐ ‐ 8 30.62 0.88 91.50 15.00 7.33 80.68 13.23 6.46
50 Inter deck frame_1 ‐ 3.50 ‐ ‐ 12 30.62 1.29 91.50 15.00 12.53 117.65 19.29 16.11
51 Inter deck frame_2 ‐ 1.70 ‐ ‐ 4 30.62 0.21 91.50 15.00 12.53 19.05 3.12 2.61
52 Inter deck frame_3 ‐ 3.60 ‐ 8 30.62 0.88 91.50 15.00 12.53 80.68 13.23 11.05
53 Side frame upper ‐ 4.20 ‐ ‐ 212 18.84 16.78 46.20 15.00 12.66 775.01 251.63 212.31
54 Side frame lower ‐ 5.40 ‐ ‐ 212 51.81 59.31 46.20 15.00 7.55 2740.22 889.68 447.81
55 Brackets_upper top (UC 150x100x20.7) ‐ 0.75 ‐ ‐ 160 20.70 2.48 46.47 15.00 14.49 115.43 37.26 36.00
56 Upper deck stiffener (bulb section 120x6) ‐ 90.60 ‐ ‐ 9 7.31 5.70 46.63 15.00 14.97 265.59 85.43 85.26
57 Safety deck stiffener (bulb section 120x6) ‐ 90.60 ‐ ‐ 9 7.31 5.70 46.63 15.00 10.47 265.59 85.43 59.64
58 Tween deck stiffener (bulb section 120x6)_1 ‐ 4.50 ‐ ‐ 4 7.31 0.13 46.20 15.00 7.47 6.08 1.97 0.98
59 Tween deck stiffener (bulb section 120x6)_2 ‐ 0.90 ‐ ‐ 8 7.31 0.05 1.35 15.00 7.47 0.07 0.79 0.39
60 Inter deck stiffener (bulb section 120x6)_1 ‐ 5.10 ‐ ‐ 4 7.31 0.15 46.20 15.00 11.82 6.89 2.24 1.76
61 Inter deck stiffener (bulb section 120x6)_2 ‐ 0.90 ‐ ‐ 16 7.31 0.11 46.20 15.00 11.82 4.86 1.58 1.24
62 Inter deck stiffener (bulb section 120x6)_3 ‐ 0.60 ‐ ‐ 16 7.31 0.07 46.20 15.00 11.82 3.24 1.05 0.83
63 Side stiffener_lower_long (bulb section 140x8) ‐ 740.0 ‐ ‐ 2 10.80 15.98 46.22 15.00 7.50 738.83 239.76 119.88
64 Side stiffener_lower_trans (bulb section 220x10) ‐ 56.0 ‐ ‐ 2 20.10 2.25 46.22 15.00 7.50 104.05 33.77 16.88
65 Side stiffener_upper_long (L 75x50x8) ‐ 850.0 ‐ ‐ 2 7.39 12.56 46.20 15.00 12.75 580.41 188.45 160.18
66 Side stiffener_upper_trans (L 100x65x8) ‐ 63.0 ‐ ‐ 2 9.40 1.18 46.20 15.00 12.75 54.72 17.77 15.10
67 Bulkhead stiffener_above safety deck (L section 100x65x8) ‐ 147.00 ‐ ‐ 2 9.40 2.76 43.90 15.00 12.75 121.32 41.45 35.24
68 Bulkhead stiffener_below safety deck (bulb section 200x8.5) ‐ 221.00 ‐ ‐ 2 17.80 7.87 46.20 15.00 8.30 363.48 118.01 65.30
CoG Moments
Sl. No. Item Description Qty.

EMship internNelton
Weight Estimate‐ 6000 tons Floating Dock
Steel
Prepared by MKG on 21 Aug 2017
t L B or H A Density Total Weight X Y Z M‐x M‐y M‐z
(mm) (m) (m) (m2) (kg/m or m2 or m3) (tons) (m) (m) (m) (t.m) (t.m) (t.m)
Misc
69 Connection supports 12.00 220.00 0.75 165 2 94.20 31.09 46.20 15.00 4.60 1436.17 466.29 143.00
70 Stiffening at crane rail base 10.00 90.00 0.50 45 4 78.50 14.13 46.20 15.00 15.06 652.81 211.95 212.80
71 Extended platforms 10.00 23.00 4.00 92 2 12000.00 24.00 46.20 15.00 4.50 1108.80 360.00 108.00
2006.09 46.34 15.00 4.28 92961.96 30091.33 8588.87
Total Weight X Y Z M‐x M‐y M‐z
(tons) (m) (m) (m) (t.m) (t.m) (t.m)
Additional Weight Contingency = 10%
200.61 46.34 15.00 5.14 9296.20 3009.13 1030.66
Total Weight X Y Z M‐x M‐y M‐z
(tons) (m) (m) (m) (t.m) (t.m) (t.m)
*20% safety margin in VCG for additional weight considered
MomentsCoG
CoG Moments
CoG Moments
Sl. No. Item Description Qty.

EMship internNelton
Weight Estimate‐ 6000 tons Floating Dock
Architectural, Electrical, HVAC
Prepared by MKG on 21 Aug 2017
t L B A Density/ unit wt Total Weight X Y Z M‐x M‐y M‐z
(mm) (m) (m) (m2) (kg/m(m2/m3/no.)) (tons) (m) (m) (m) (t.m) (t.m) (t.m)
Insulation
1 Floor Insulation (PAROC Marine Floor Slab 140) 50.00 80.40 3.50 281 2 140.00 3.94 45.28 15.00 10.58 178.39 59.09 41.66
2 Wall insulation (Paroc Marine Slab 220)_long sides 15.00 80.40 4.50 362 4 220.00 4.78 45.28 15.00 12.80 216.25 71.64 61.13
3 Wall insulation (Paroc Marine Slab 220)_short sides 15.00 ‐ ‐ 16 4 220.00 0.21 46.20 15.00 13.02 9.76 3.17 2.75
4 Wall insulation (Paroc Marine Slab 220)_bulkheads 15.00 ‐ ‐ 16 12 220.00 0.63 45.28 15.00 12.80 28.69 9.50 8.11
5 Deck insulation (Paroc Marine Slab 80) 70.00 80.40 3.50 281 2 80.00 3.15 45.28 15.00 15.00 142.71 47.28 47.28
Linings and panels
6 Floating floor plate 3.00 80.40 3.50 281 2 23.55 13.25 45.28 15.00 10.60 600.14 198.81 140.49
7 Floor vinyl sheet 3.20 80.40 3.50 281 2 2.30 1.29 45.28 15.00 10.60 58.61 19.42 13.72
8 Wall lining (MOS)_long sides 25.00 80.40 2.20 177 4 18.00 12.74 45.28 15.00 11.70 576.66 191.03 149.04
9 Wall lining (MOS)_short sides 25.00 ‐ ‐ 16 4 18.00 1.15 46.20 15.00 11.92 53.22 17.28 13.73
10 Wall lining (MOS)_bulkheads 25.00 ‐ ‐ 16 12 18.00 3.46 45.28 15.00 11.70 156.49 51.84 40.44
11 Ceiling panels (MOS) 50.00 80.40 3.50 281 2 6.00 3.38 45.28 15.00 12.85 152.90 50.65 43.39
12 Partition (MOS)_longitudinal 50.00 80.40 2.20 177 2 22.60 7.99 46.20 15.00 11.70 369.37 119.92 93.54
13 Partition (MOS)_transverse_1 50.00 4.50 2.50 11 14 22.60 3.56 40.40 18.93 11.70 143.80 67.38 41.66
Other architectural items
14 B15 door 45.00 2.05 0.80 2 46 60.00 2.76 46.20 15.00 11.58 127.51 41.40 31.95
16 Common shower/ toilets (port side only) ‐ ‐ ‐ ‐ 5 200.00 1.00 31.20 28.20 10.65 31.20 28.20 10.65
17 Bunk beds (port side only) ‐ ‐ ‐ ‐ 8 250.00 2.00 50.59 27.98 11.80 101.17 55.95 23.60
18 MDF tables in acc. Cabins (port side only) 18.00 ‐ ‐ ‐ 8 35.00 0.28 50.59 29.20 11.00 14.17 8.18 3.08
19 MDF Dining tables (port side only) 18.00 ‐ ‐ ‐ 2 55.00 0.11 48.27 28.70 11.00 5.31 3.16 1.21
CoG Moments
Sl. No. Item Description Qty.

EMship internNelton
Weight Estimate‐ 6000 tons Floating Dock
Architectural, Electrical, HVAC
Prepared by MKG on 21 Aug 2017
t L B A Density/ unit wt Total Weight X Y Z M‐x M‐y M‐z
(mm) (m) (m) (m2) (kg/m(m2/m3/no.)) (tons) (m) (m) (m) (t.m) (t.m) (t.m)
20 Control room table 18.00 ‐ ‐ ‐ 1 80.00 0.08 41.40 1.43 11.00 3.31 0.11 0.88
21 Chair (normal) ‐ ‐ ‐ ‐ 23 8.00 0.18 46.20 15.00 11.00 8.50 2.76 2.02
22 Chair (control room) ‐ ‐ ‐ ‐ 12 16.00 0.19 41.40 1.43 11.00 7.95 0.27 2.11
23 Watertight hatch covers on pontoon deck ‐ ‐ ‐ ‐ 50 100.00 5.00 46.20 15.00 4.50 231.00 75.00 22.50
24 Watertight hatch covers on wing bulkheads ‐ ‐ ‐ ‐ 17 100.00 1.70 45.28 15.00 5.15 76.98 25.50 8.76
Misc
25 Electrical cabling and accessories and supports ‐ 277.20 ‐ ‐ 2 50.00 27.72 46.20 15.00 12.50 1280.66 415.80 346.50
26 HVAC ducting and accessories and support ‐ 80.40 ‐ ‐ 2 80.00 12.86 46.20 15.00 13.00 594.32 192.96 167.23
27 Paint (3 coat) ‐ ‐ ‐ 17898 1 0.20 3.58 46.20 15.00 4.44 165.38 53.69 15.89
28 Piping ‐ 90.00 ‐ ‐ 5 45.00 20.25 46.20 15.00 0.60 935.55 303.75 12.15
137.25 45.68 15.40 9.80 6269.98 2113.75 1345.47
Total Weight X Y Z M‐x M‐y M‐z
(tons) (m) (m) (m) (t.m) (t.m) (t.m)
Additional Weight Contingency = 20%
27.45 45.68 15.40 11.76 1254.00 422.75 322.91
Total Weight X Y Z M‐x M‐y M‐z
(tons) (m) (m) (m) (t.m) (t.m) (t.m)
*20% safety margin in VCG for additional weight considered
CoG Moments
CoG Moments
Sl. No. Item Description Qty.
MomentsCoG
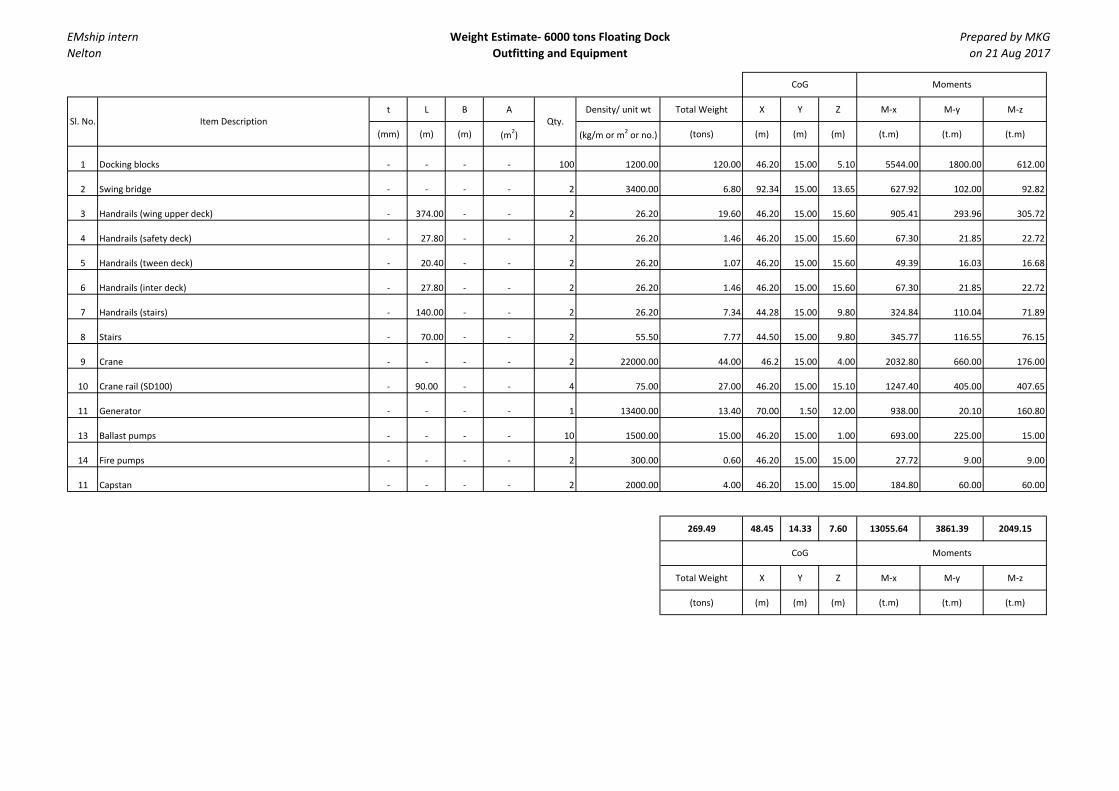
EMship internNelton
Weight Estimate‐ 6000 tons Floating Dock
Outfitting and Equipment
Prepared by MKG on 21 Aug 2017
t L B A Density/ unit wt Total Weight X Y Z M‐x M‐y M‐z
(mm) (m) (m) (m2) (kg/m or m2 or no.) (tons) (m) (m) (m) (t.m) (t.m) (t.m)
1 Docking blocks ‐ ‐ ‐ ‐ 100 1200.00 120.00 46.20 15.00 5.10 5544.00 1800.00 612.00
2 Swing bridge ‐ ‐ ‐ ‐ 2 3400.00 6.80 92.34 15.00 13.65 627.92 102.00 92.82
3 Handrails (wing upper deck) ‐ 374.00 ‐ ‐ 2 26.20 19.60 46.20 15.00 15.60 905.41 293.96 305.72
4 Handrails (safety deck) ‐ 27.80 ‐ ‐ 2 26.20 1.46 46.20 15.00 15.60 67.30 21.85 22.72
5 Handrails (tween deck) ‐ 20.40 ‐ ‐ 2 26.20 1.07 46.20 15.00 15.60 49.39 16.03 16.68
6 Handrails (inter deck) ‐ 27.80 ‐ ‐ 2 26.20 1.46 46.20 15.00 15.60 67.30 21.85 22.72
7 Handrails (stairs) ‐ 140.00 ‐ ‐ 2 26.20 7.34 44.28 15.00 9.80 324.84 110.04 71.89
8 Stairs ‐ 70.00 ‐ ‐ 2 55.50 7.77 44.50 15.00 9.80 345.77 116.55 76.15
9 Crane ‐ ‐ ‐ ‐ 2 22000.00 44.00 46.2 15.00 4.00 2032.80 660.00 176.00
10 Crane rail (SD100) ‐ 90.00 ‐ ‐ 4 75.00 27.00 46.20 15.00 15.10 1247.40 405.00 407.65
11 Generator ‐ ‐ ‐ ‐ 1 13400.00 13.40 70.00 1.50 12.00 938.00 20.10 160.80
13 Ballast pumps ‐ ‐ ‐ ‐ 10 1500.00 15.00 46.20 15.00 1.00 693.00 225.00 15.00
14 Fire pumps ‐ ‐ ‐ ‐ 2 300.00 0.60 46.20 15.00 15.00 27.72 9.00 9.00
11 Capstan ‐ ‐ ‐ ‐ 2 2000.00 4.00 46.20 15.00 15.00 184.80 60.00 60.00
269.49 48.45 14.33 7.60 13055.64 3861.39 2049.15
Total Weight X Y Z M‐x M‐y M‐z
(tons) (m) (m) (m) (t.m) (t.m) (t.m)
CoG Moments
Sl. No. Item Description Qty.
CoG Moments
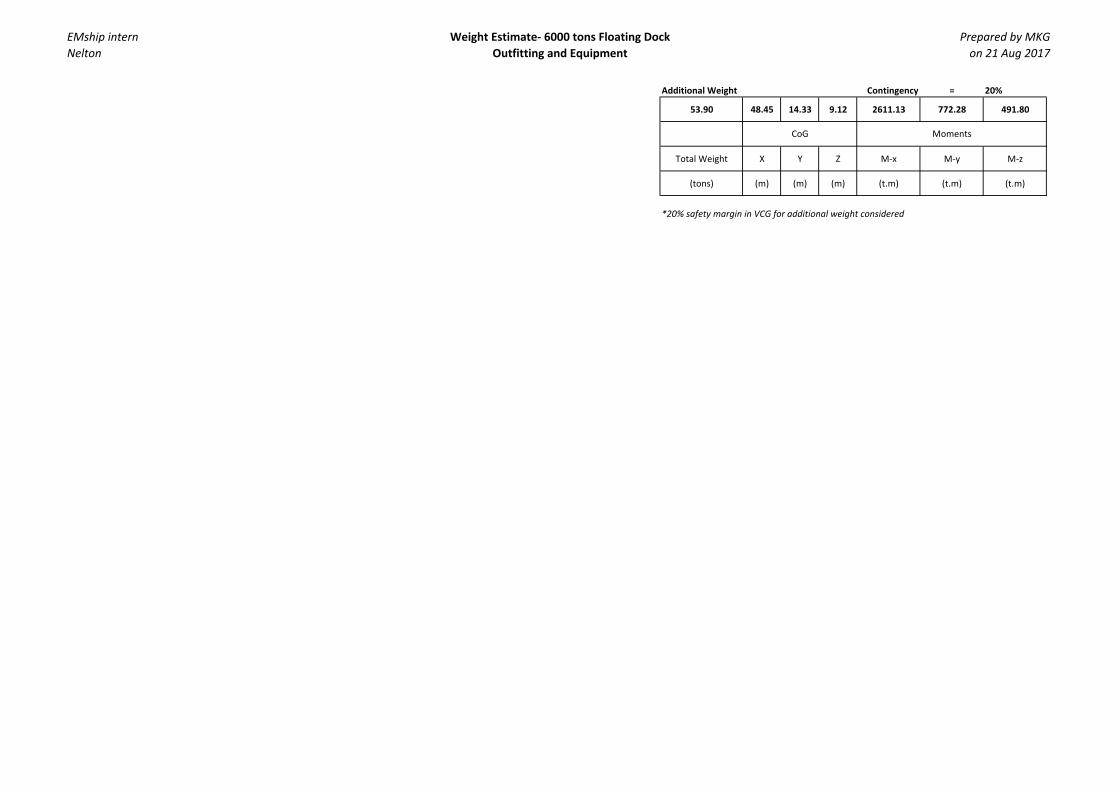
EMship internNelton
Weight Estimate‐ 6000 tons Floating Dock
Outfitting and Equipment
Prepared by MKG on 21 Aug 2017
Additional Weight Contingency = 20%
53.90 48.45 14.33 9.12 2611.13 772.28 491.80
Total Weight X Y Z M‐x M‐y M‐z
(tons) (m) (m) (m) (t.m) (t.m) (t.m)
*20% safety margin in VCG for additional weight considered
CoG Moments

EMship internNelton
Weight Estimate‐ 6000 tons Floating Dock
Consumables and Rest Water
Prepared by MKG on 21 Aug 2017
t L B A Density/ unit wt Total Weight X Y Z M‐x M‐y M‐z
(mm) (m) (m) (m2) (kg/m or m2 or no.) (tons) (m) (m) (m) (t.m) (t.m) (t.m)
1 Fuel oil 9 840.00 7.94 71.10 1.75 9.80 564.39 13.89 77.79
2 Fresh water 6 1000.00 6.30 55.80 28.25 7.55 351.54 177.98 47.57
3 Rest water at pontoon bottom 1310 1025.00 1342.75 46.20 15.00 0.30 62035.05 20141.25 402.83
1356.99 46.39 14.98 0.39 62950.98 20333.12 528.18
Total Weight X Y Z M‐x M‐y M‐z
(tons) (m) (m) (m) (t.m) (t.m) (t.m)
Additional Weight Contingency = 2%
27.14 46.39 14.98 0.47 1259.02 406.66 12.68
Total Weight X Y Z M‐x M‐y M‐z
(tons) (m) (m) (m) (t.m) (t.m) (t.m)
*20% safety margin in VCG for additional weight considered
CoG Moments
CoG Moments
CoG Moments
Sl. No. Item Description Qty.

EMship internNelton
Weight Estimate‐ 6000 tons Floating Dock
Summary
Prepared by MKG on 21 Aug 2017
X Y Z M‐x M‐y M‐z
(tons) (m) (m) (m) (t.m) (t.m) (t.m)
1 Structural Steel 10% 2207 46.34 15.00 4.36 102258 33100 9620
2 Architectural and misc 20% 165 45.68 15.40 10.13 7524 2536 1668
3 Outfitting and equipment 20% 323 48.45 14.33 7.86 15667 4634 2541
4 Consumables and rest water 2% 1384 46.39 14.98 0.39 64210 20740 541
4079 46.50 14.96 3.52 189659 61010 14370
Total Weight X Y Z M‐x M‐y M‐z
(tons) (m) (m) (m) (t.m) (t.m) (t.m)
0 0
Sl. No.
CoG Moments
CoG Moments
Item Description ContingencyTotal Weight
x
y
x
z

Kodathoor Gangadharan Midhun
130 Master Thesis Developed at West Pomeranian University of Technology, Szczecin
APPENDIX C
3D VISUALIZATION

Structural Design and Stability of a 6,000 ton Capacity Floating Dock as per DNV-GL Rules
“EMSHIP” Erasmus Mundus Master Course, period of study Sept 2016 – Feb 2018 131
Isometric View
Pontoon Isometric View from Bottom

Kodathoor Gangadharan Midhun
132 Master Thesis Developed at West Pomeranian University of Technology, Szczecin
Pontoon Structure Frame Work
View Inside Pontoon

Structural Design and Stability of a 6,000 ton Capacity Floating Dock as per DNV-GL Rules
“EMSHIP” Erasmus Mundus Master Course, period of study Sept 2016 – Feb 2018 133
View Inside Dock Wing
Dock Wing Steel Frame Work